1. Introduction
In the past decades many efforts have been made in the aerospace industry to control and reduce the noise level inside aircraft. In this sense, the selection of materials and design are critical issues regarding the mass, damping, and stiffness of the structure, which define the modal behavior and, hence, the noise. This issue involves different design tasks regarding active control and vibration absorbers [
1,
2], and also in the prediction by means of numerical models [
3].
Experimental testing provides a fundamental feedback to improve the design and numerical models. One of the most interesting tests in transport applications is experimental modal analysis for identification of modal parameters [
4]. This type of characterization is commonly performed using accelerometers. However, some sources of error are present in the measurements as a consequence of their invasive nature. Furthermore, a compromise is always required between the time and cost required for instrumentation and the resulting spatial resolution, especially in large structures.
Recent progress in contactless full-field techniques provides the opportunity to extract substantially more information from realistic experiments. The benefit of being a non-invasive technique ensures that the structural dynamic response remains free of possible perturbations introduced by mass and damping of transducers and cabling. One of the most remarkable emerging techniques is laser Doppler vibrometry (LDV). It is a pointwise interferometric technique that performs velocity measurements in the laser beam direction. It can provide full-field information by sequential or continuous scanning [
5,
6]. This is typically carried out by an automated mirror that modifies the direction of the laser beam towards different points. Anthropomorphic robot arms are also employed to perform sequential measurements of objects with three-dimensional geometry by modifying the position and the orientation of the laser [
7,
8,
9]. Digital image correlation is an optical technique for displacement and strain measurement [
10]. With a stereoscopic system of high-speed cameras (HS 3D-DIC), this technique is able to provide dynamic information with higher spatial resolution in the three spatial directions using a simpler setup. In the case of LDV, the economic cost is noteworthy whether measurements in the three spatial directions are required.
On the other hand, both accelerometers and LDV are provided with modern commercial software that deals with the signals and less time is required to post-process the captured information. Comparative information of HS 3D-DIC and LDV can be found in previous works [
11,
12,
13]. The characterization of full-field mode shapes and operational deflection shapes (ODS) is one of the most interesting features using HS 3D-DIC. Sinusoidal signals whose frequency corresponds to a resonance of the system is employed for this purpose [
11,
14,
15,
16,
17,
18,
19,
20,
21,
22,
23]. Besides, employing a broadband excitation instead of a fixed sine the full-field response of the specimen is registered, and frequency response functions (FRF) or other frequency domain transfer function are easily obtained. By analyzing the peaks that maximize the response it is possible to estimate the natural frequencies and the damping ratios [
12,
13,
24,
25,
26,
27,
28,
29,
30,
31]. Special interest presents those studies that employ image decomposition approaches [
17,
18,
22,
25,
32,
33] to reduce the full-field information to just a few shape descriptors [
34,
35,
36,
37]. In these works, it was demonstrated that HS 3D-DIC is valid for different materials, such as steel, aluminum, composites, and polymers. However, most of them analyzed simple elements, like beams or plate components, and in the case of real components, they were analyzed isolated from the final assembly.
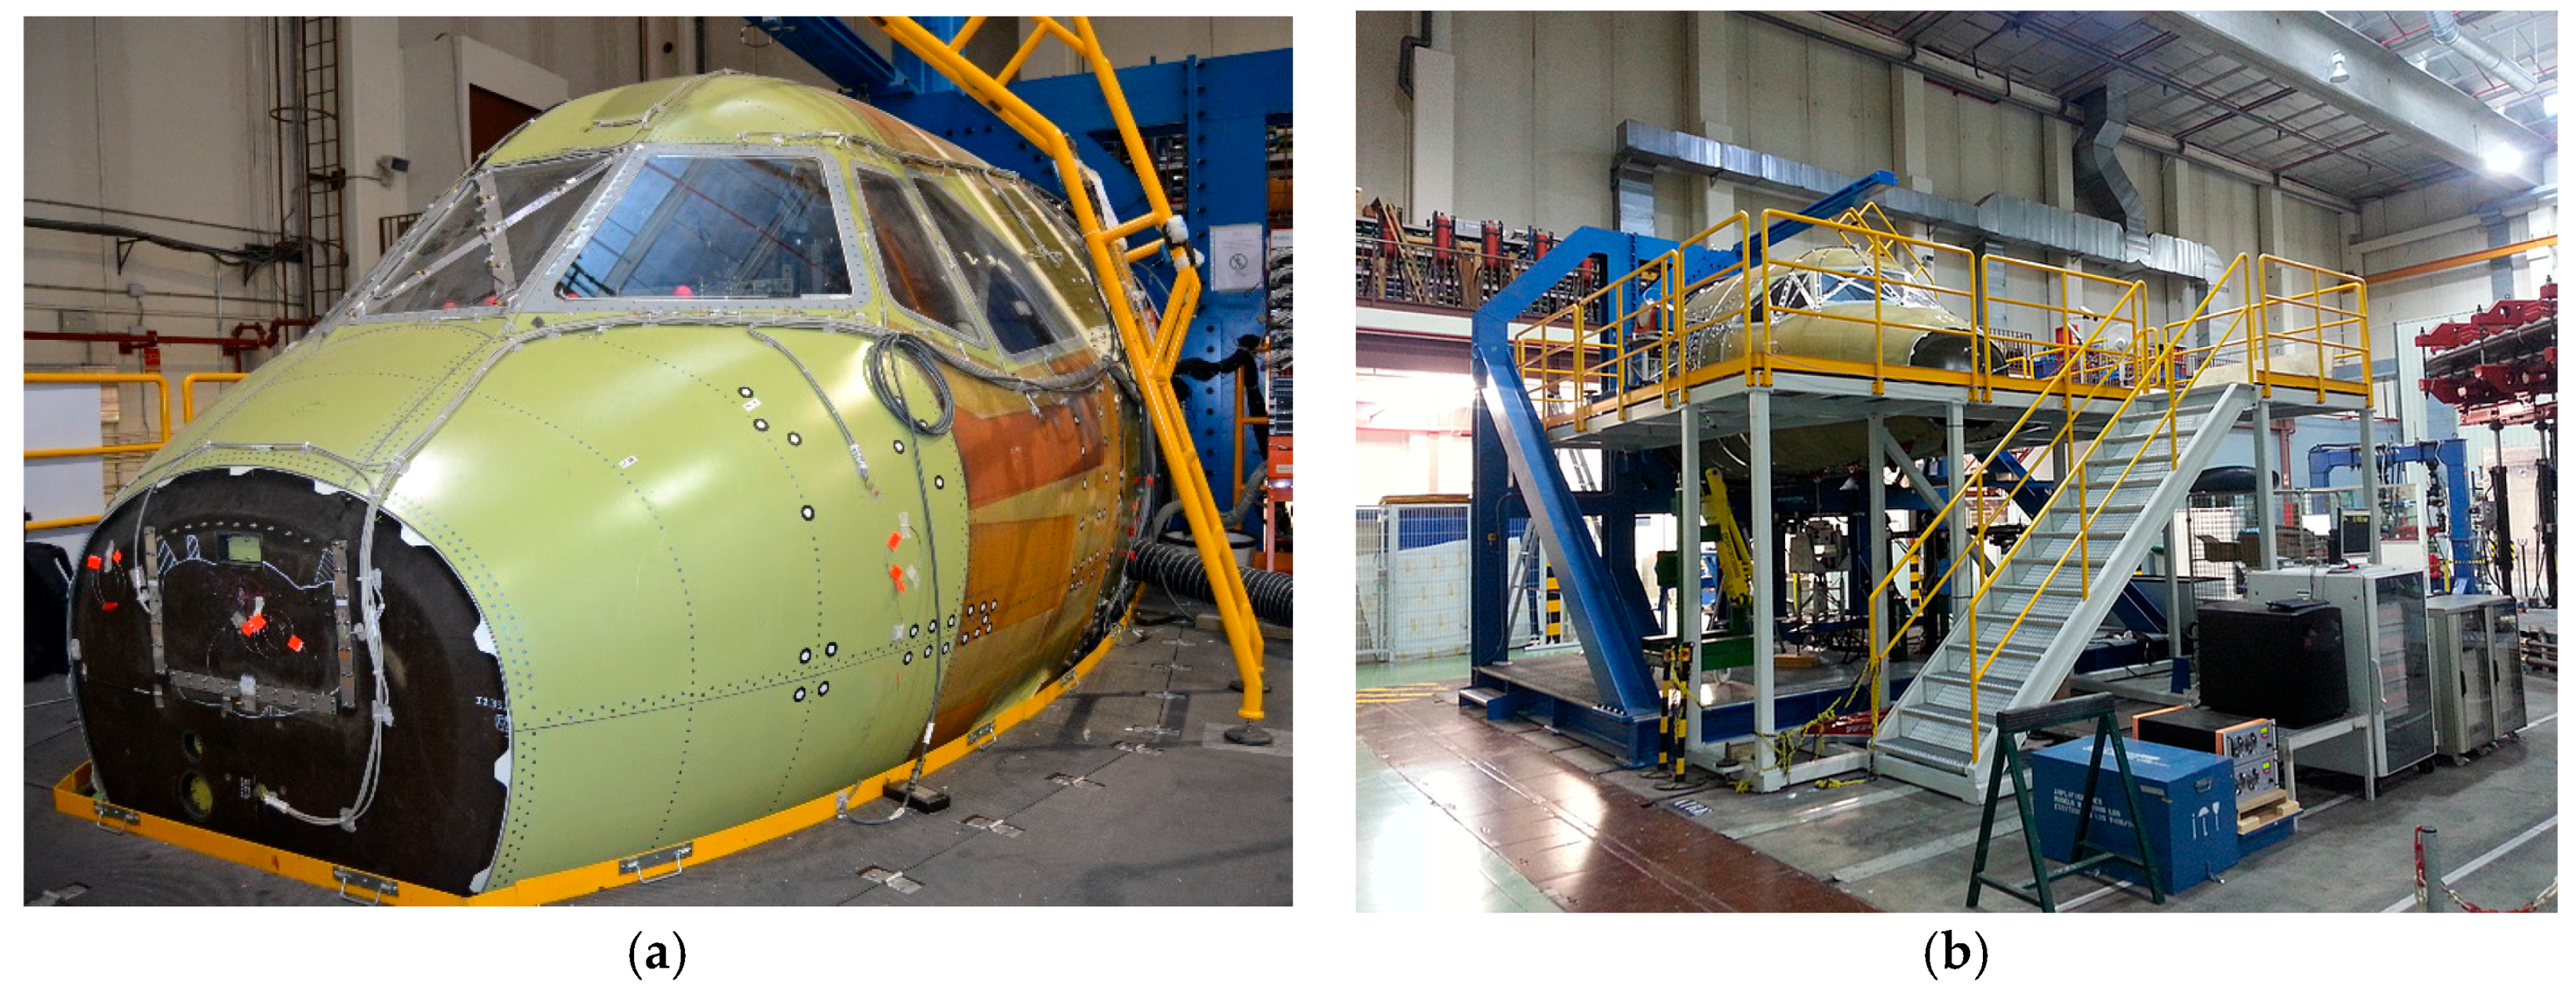
In the work reported in the current paper, the HS 3D-DIC technique has been employed for the dynamic characterization of part of a front fuselage full-scale demonstrator (
Figure 1) developed by Airbus Defence and Space in the frame of the Clean Sky/Green Regional Aircraft program, with partial funding by the European Union. For this purpose, measurements using HS 3D-DIC from the inside of the demonstrator have been conducted in the passenger window area, built using a multi-material component. This area of the cabin was considered relevant in the transmission of noise. The main purpose of these experiments was to characterize the specific vibration modes from measured displacements with major significance under a vibroacoustic perspective. In a previous work [
38], results from sine and random excitation tests were explored and compared. Sine tests were employed for full-field ODS determination, while a random excitation test was employed to obtain the transfer function between the excitation and the window response in a full-field approach. From the transfer functions, both natural frequencies and full-field ODSs were identified. In the present work, this evaluation is extended. HS 3D-DIC has been also employed to evaluate the influence of in-flight conditions by applying a differential pressure to the demonstrator. Changes in the modal parameters were identified and it was found evidences of the influence in modal behavior of the deformation suffered due to pressure. Shape descriptor decomposition has been employed to enhance the managing of the full-field data and perform an analysis of the differences in the behavior of the window in those different tests. Finally, a second window specimen has been tested to study possible differences. Using this methodology it was possible to identify the variation on the dynamic behavior introduced by design. The results demonstrate the capabilities of the technique, providing new insights into the vibration behavior of a complex aerospace structure.
2. Three-Dimensional Digital Image Correlation
Digital image correlation (DIC) is an optical technique used for measuring strain and displacements in mechanical elements [
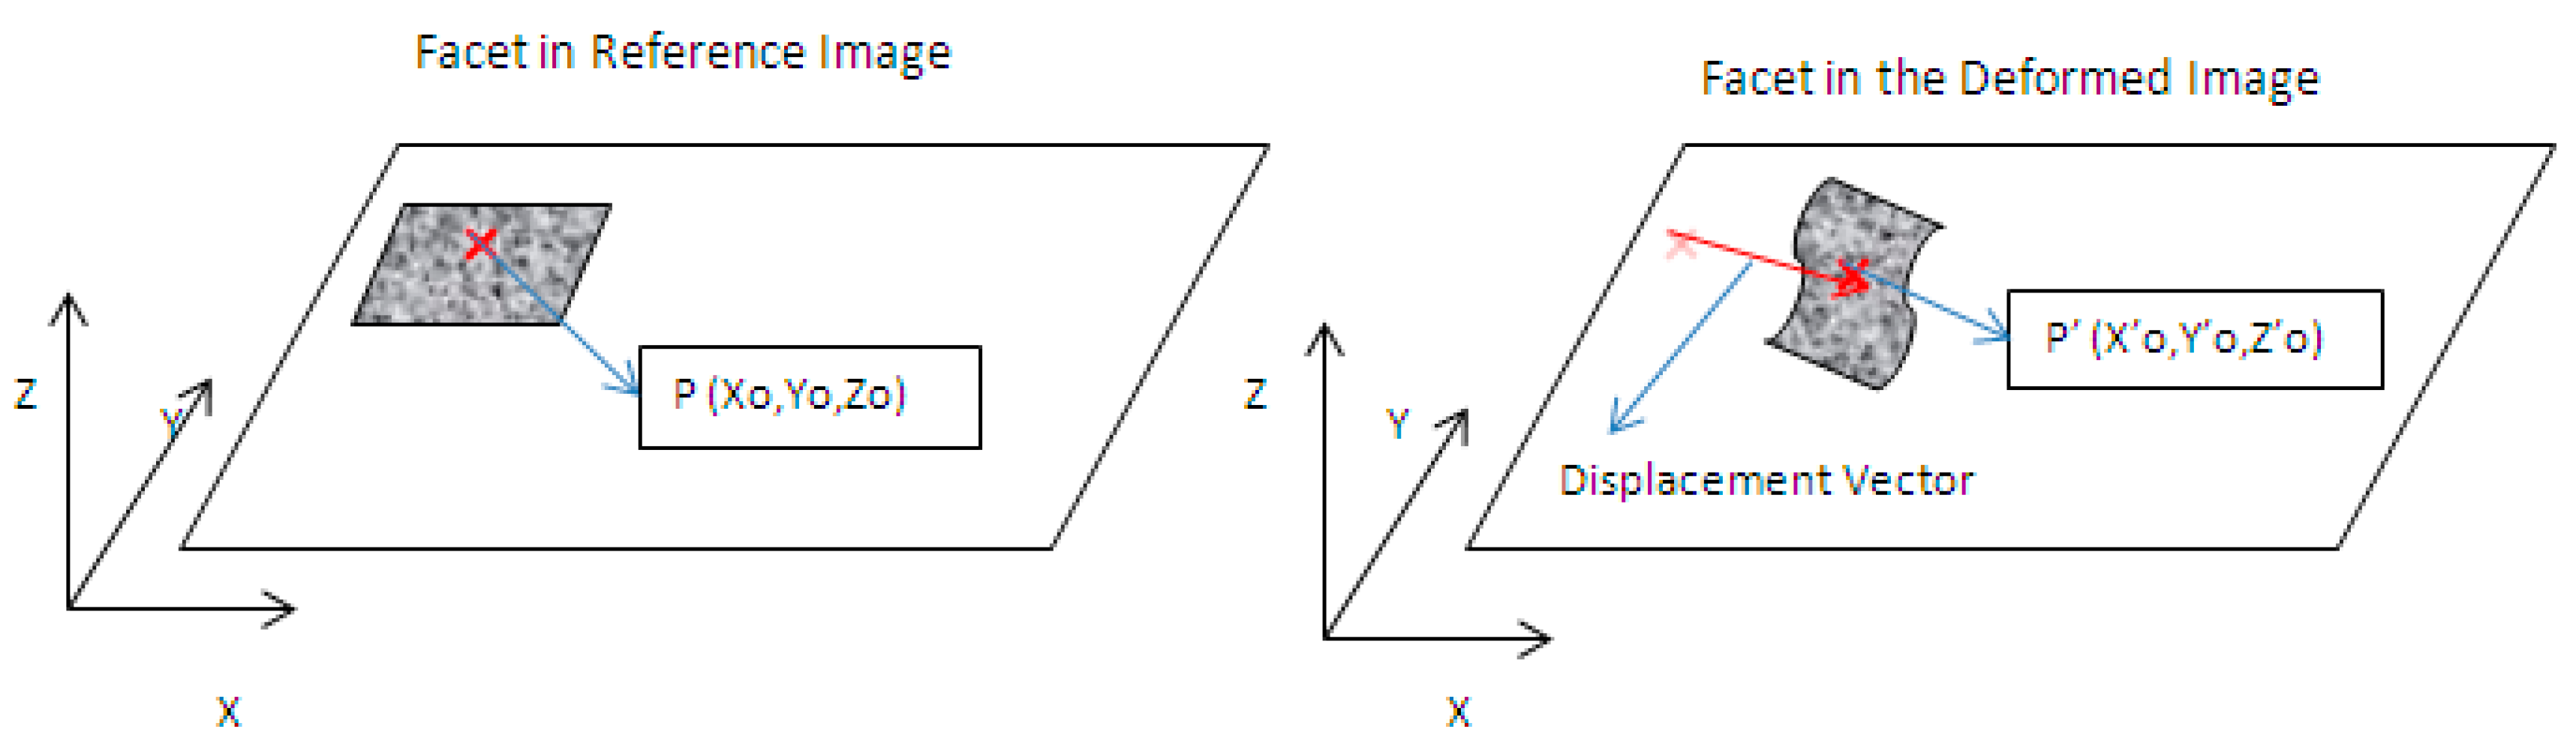
10]. In general terms, DIC correlates a sequence of digital images captured during the test and compares them with an image from an initial state, generally unloaded. The area of interest is virtually divided into squared regions known as facets. A facet is the smallest unit on which the algorithm performs tracking to infer the 3D displacements the specimen experienced and the associated strain field (
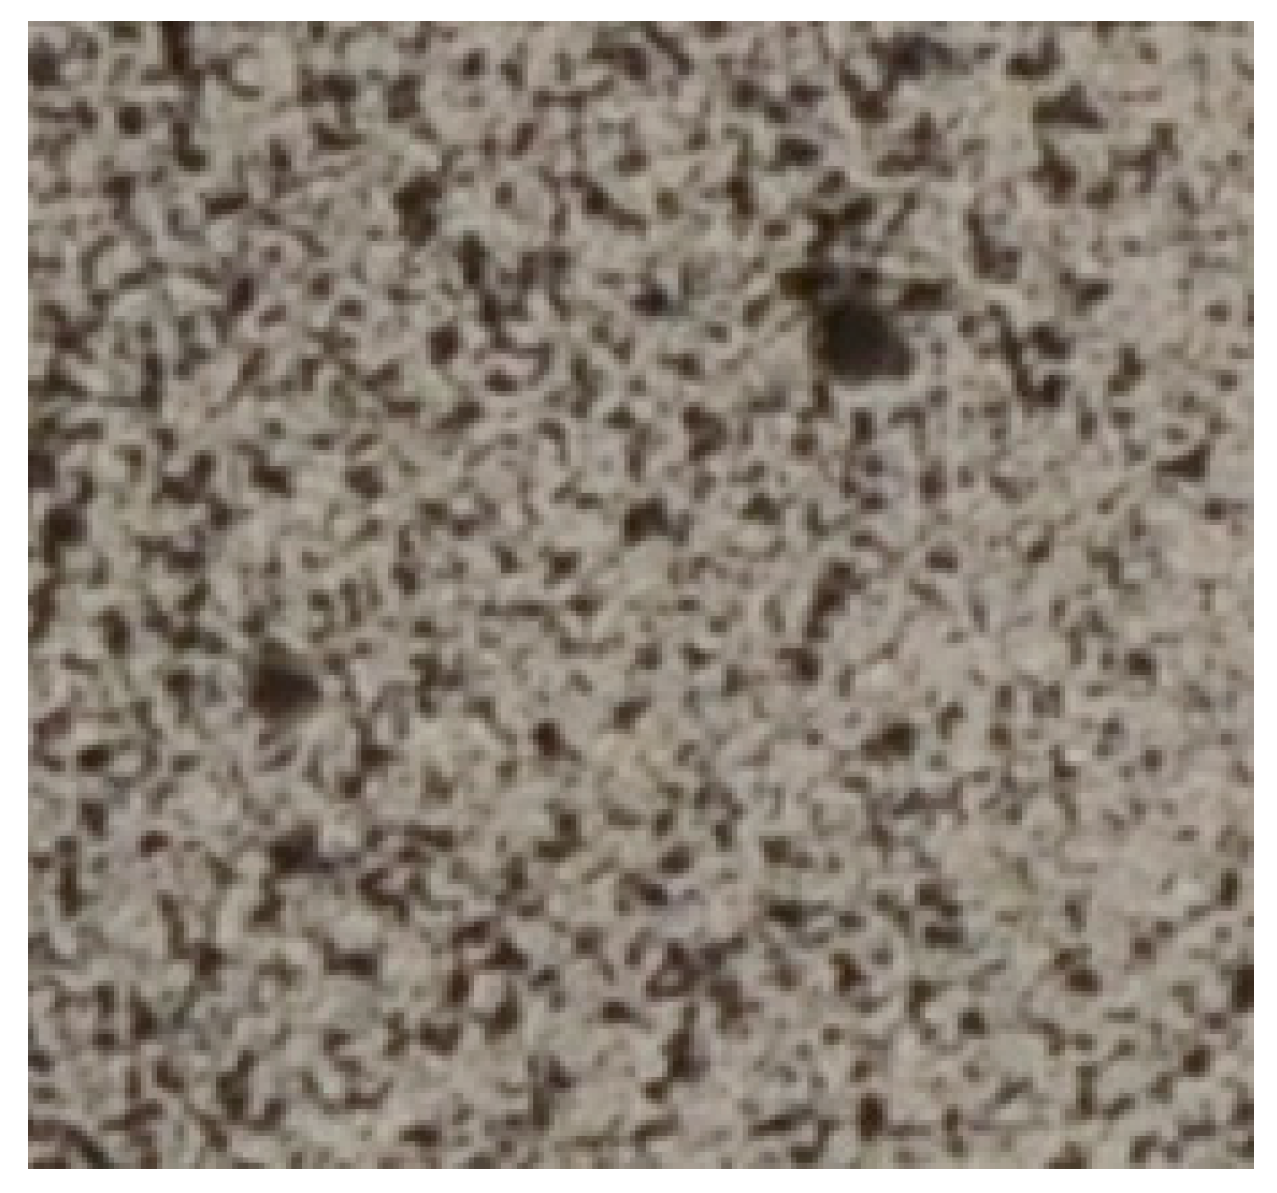
Figure 2). This process is performed by matching the light intensity in the facet area corresponding to the initial and final position of each facet. In order to perform the tracking, every facet must be unique and, hence, a random speckle pattern, as shown in
Figure 3, is needed in the area of interest.
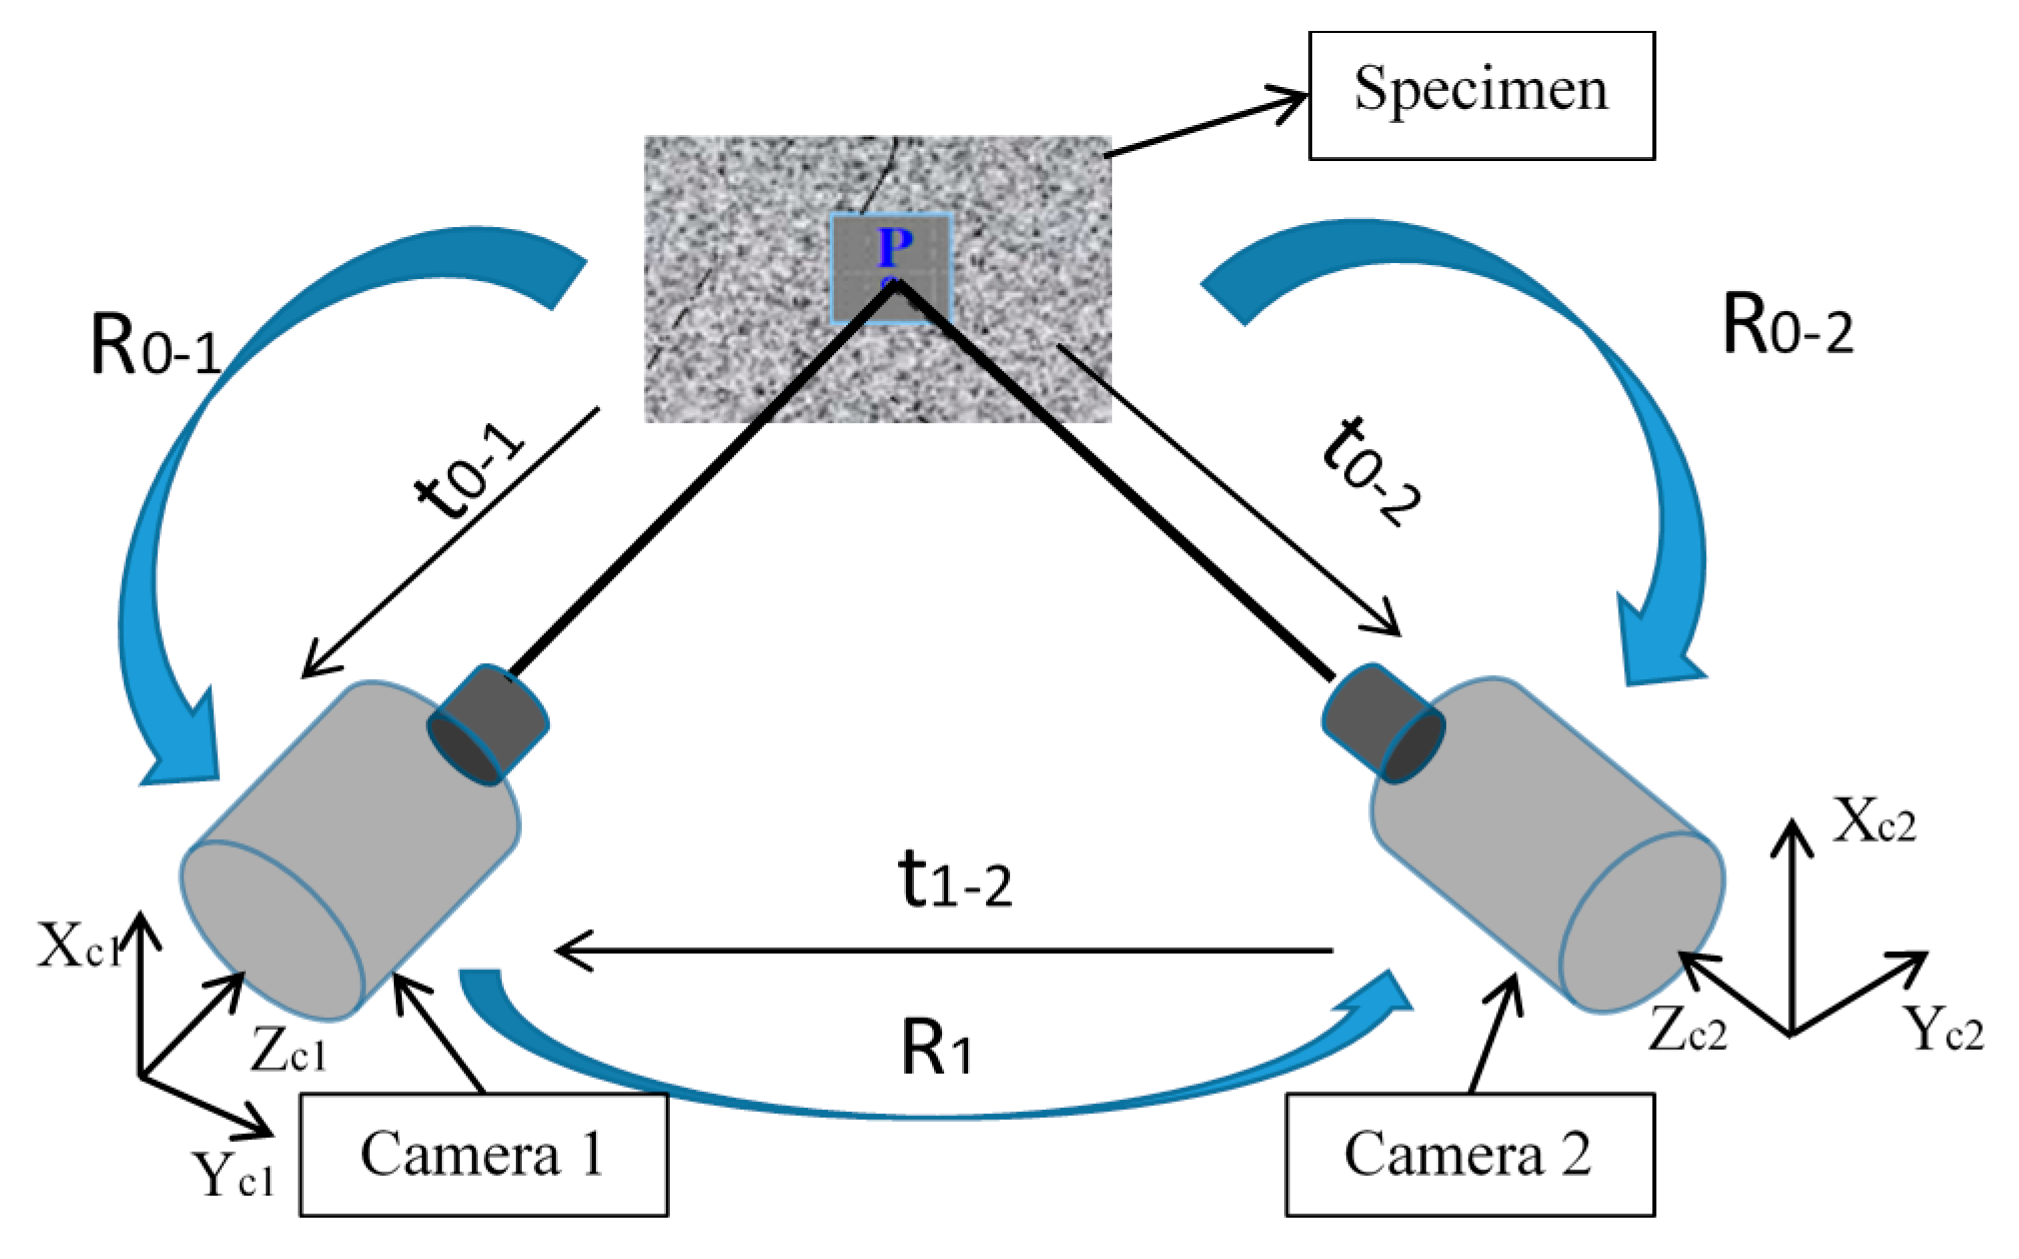
In 3D-DIC, stereoscopic images are required as well as system calibration based on triangulation of the data to obtain three-dimensional displacement measurements. In general terms, the implementation of the 3D-DIC technique requires the following steps:
Specimen and set-up preparation. The specimen must exhibit a random speckle distribution on its surface. Normally, it is coated with white paint and, subsequently, a random artificial speckle pattern is generated by spraying black paint over the white paint [
39].
Calibration of the stereoscopy system. The calibration of the cameras is performed by placing a calibration plate with a printed grid on it in the test space, where the specimen is located during the experiment. Thus, it is possible to establish a correspondence with the local coordinate system of each camera and calibration parameters (
Figure 4) [
10,
40,
41,
42].
Images capture. As was indicated above, a perfect synchronization of the cameras’ recording is necessary to correctly process the results. This is achieved by synchronizing the internal camera’s clock and simultaneous triggering.
Image processing. Images were processed to obtain the measured displacement and strain fields.
3. Materials and Method
Experiments were conducted using a full-scale composite cockpit demonstrator developed by Airbus DS in the frame of the Clean Sky Green Regional Aircraft program. Advanced materials and manufacturing technologies making extensive use of composites allowed a significant structural weight reduction. Multi-functional performance accounted for improved electric conductivity and lightning resistance, acoustic insulation, hail impact performance, and the use of embedded sensors for structural health monitoring.
This full-scale cockpit demonstrator was used for a comprehensive series of tests, including static and structural fatigue tests, impact damage tolerance, as well as vibroacoustic tests. It was in this context that the potential of HS 3D-DIC testing technology was evaluated for non-invasive structural dynamic testing, complementing conventional measurements using accelerometers. Measurements using HS 3D-DIC were performed in the window passenger area considering two different window specimens and the different types of tests hereafter described. Considering the number of tests and configurations, a summary is shown in
Table 1.
3.1. Tests on Specimen 1
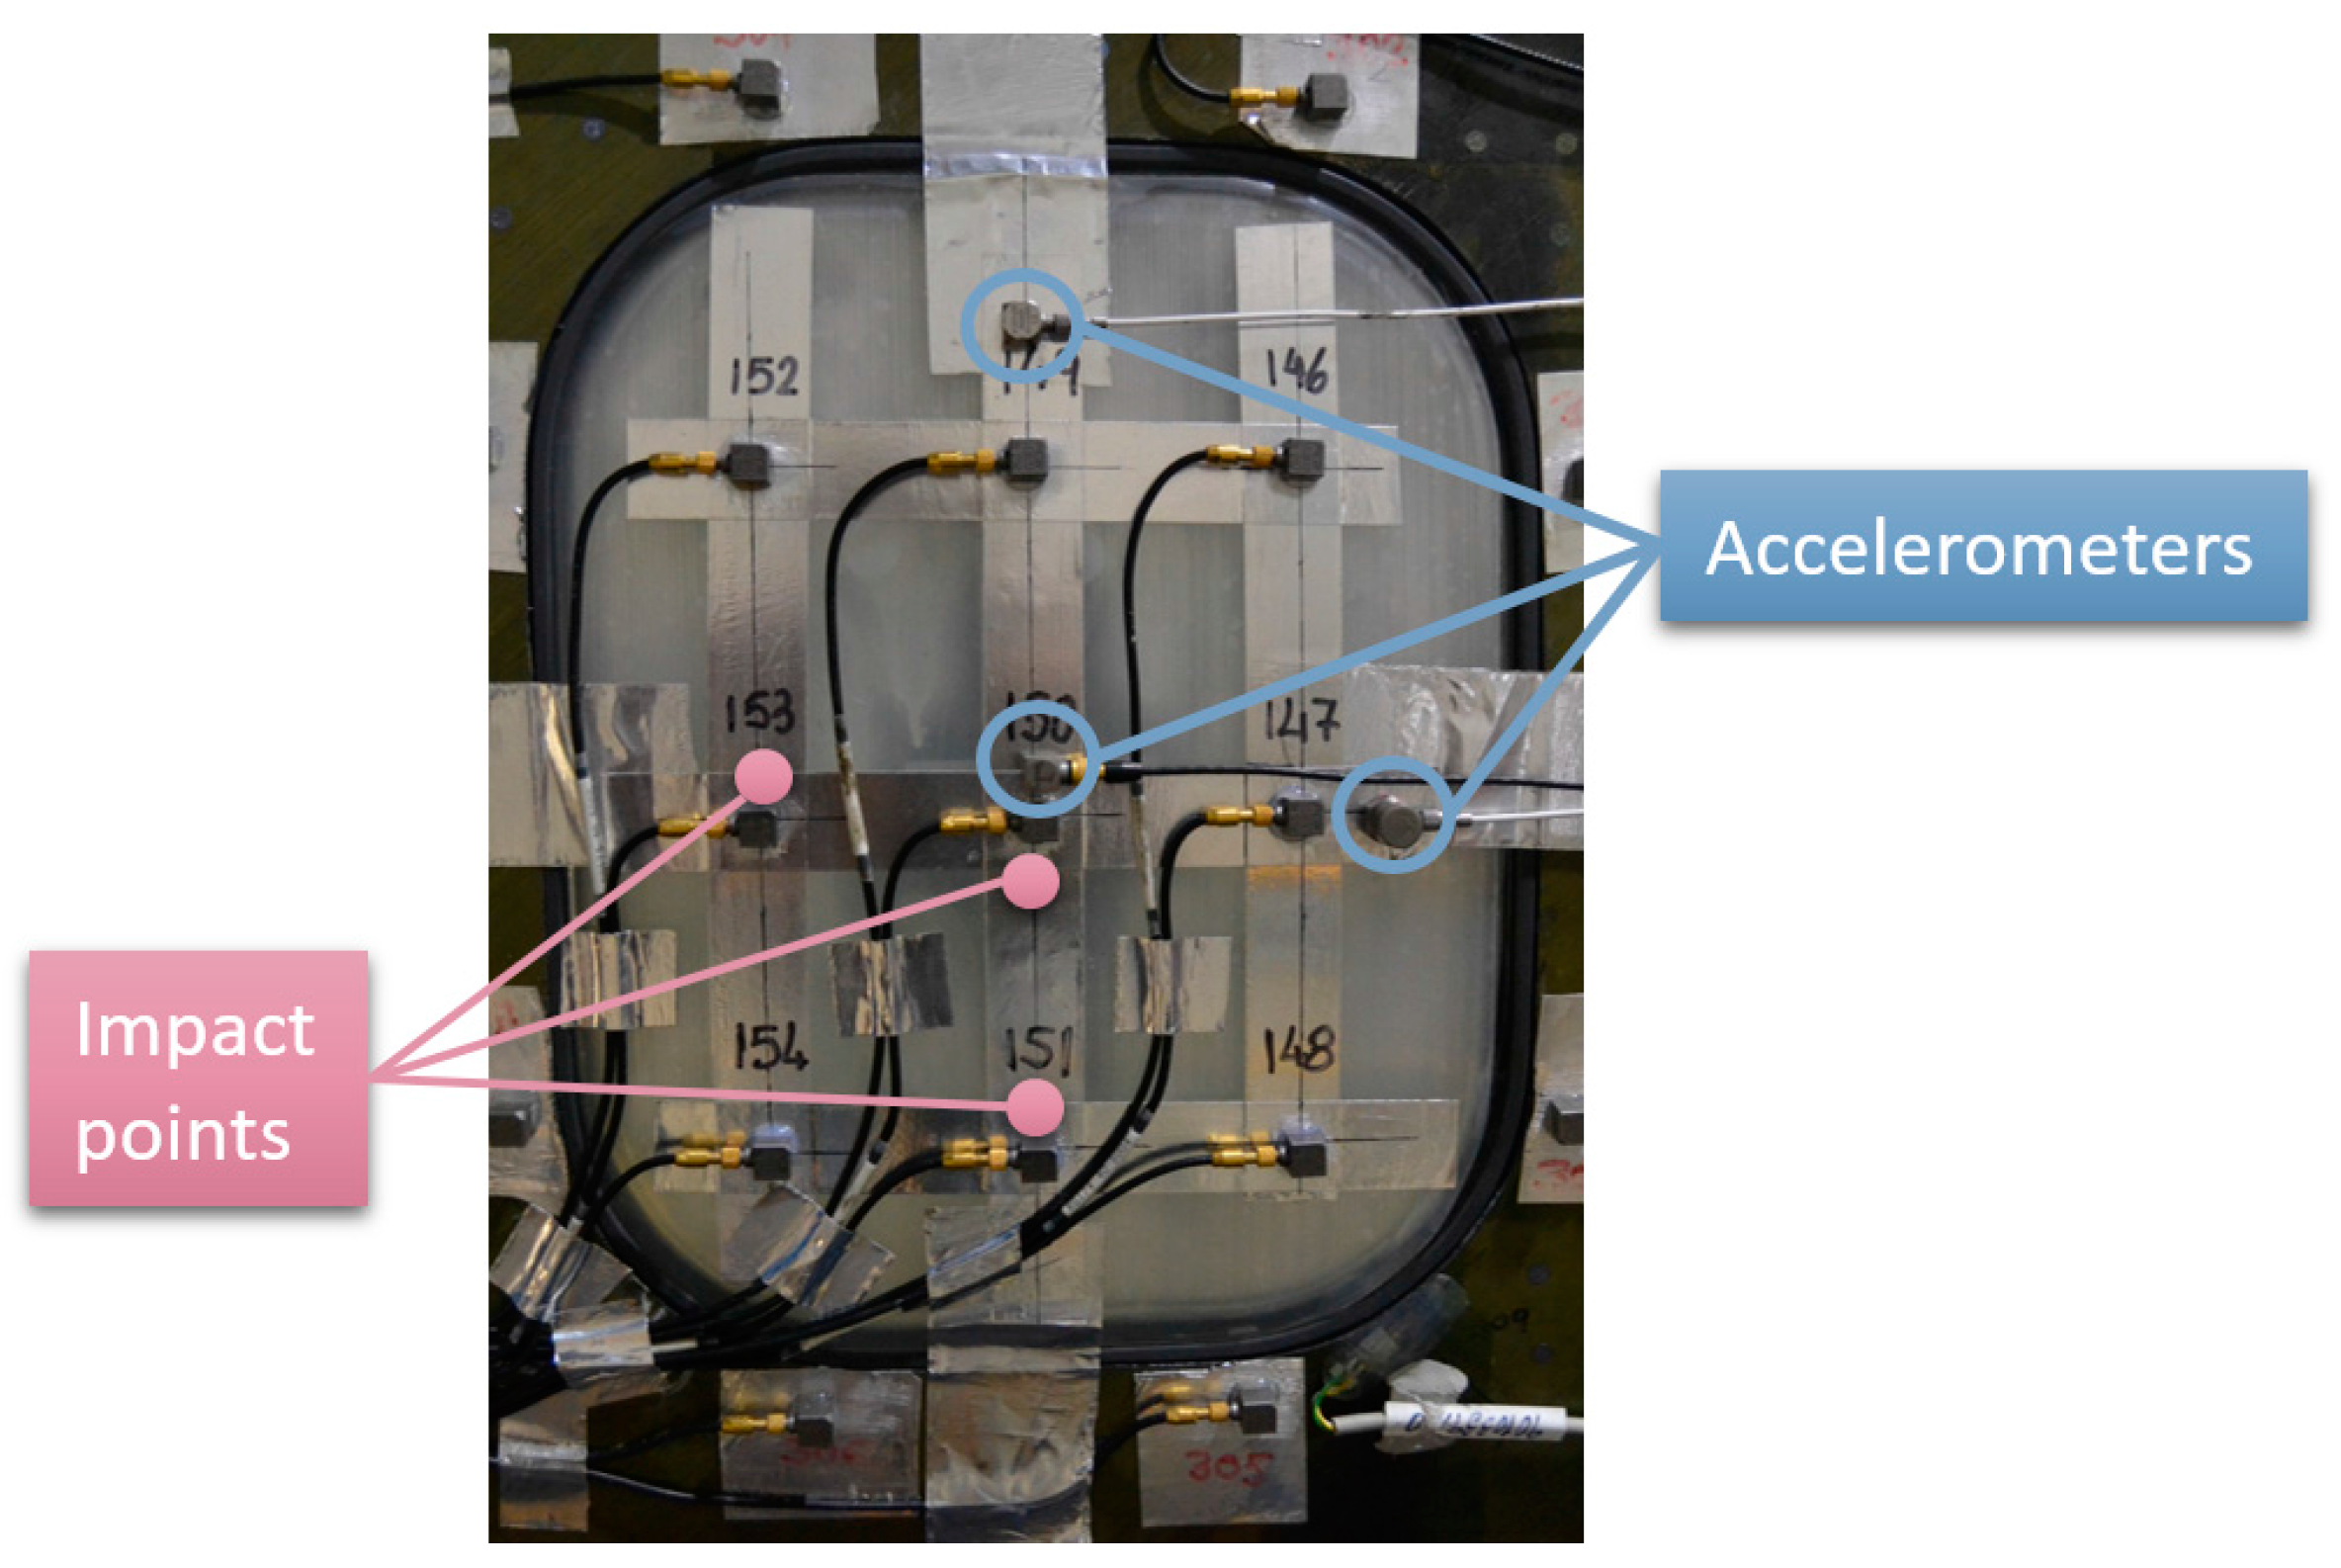
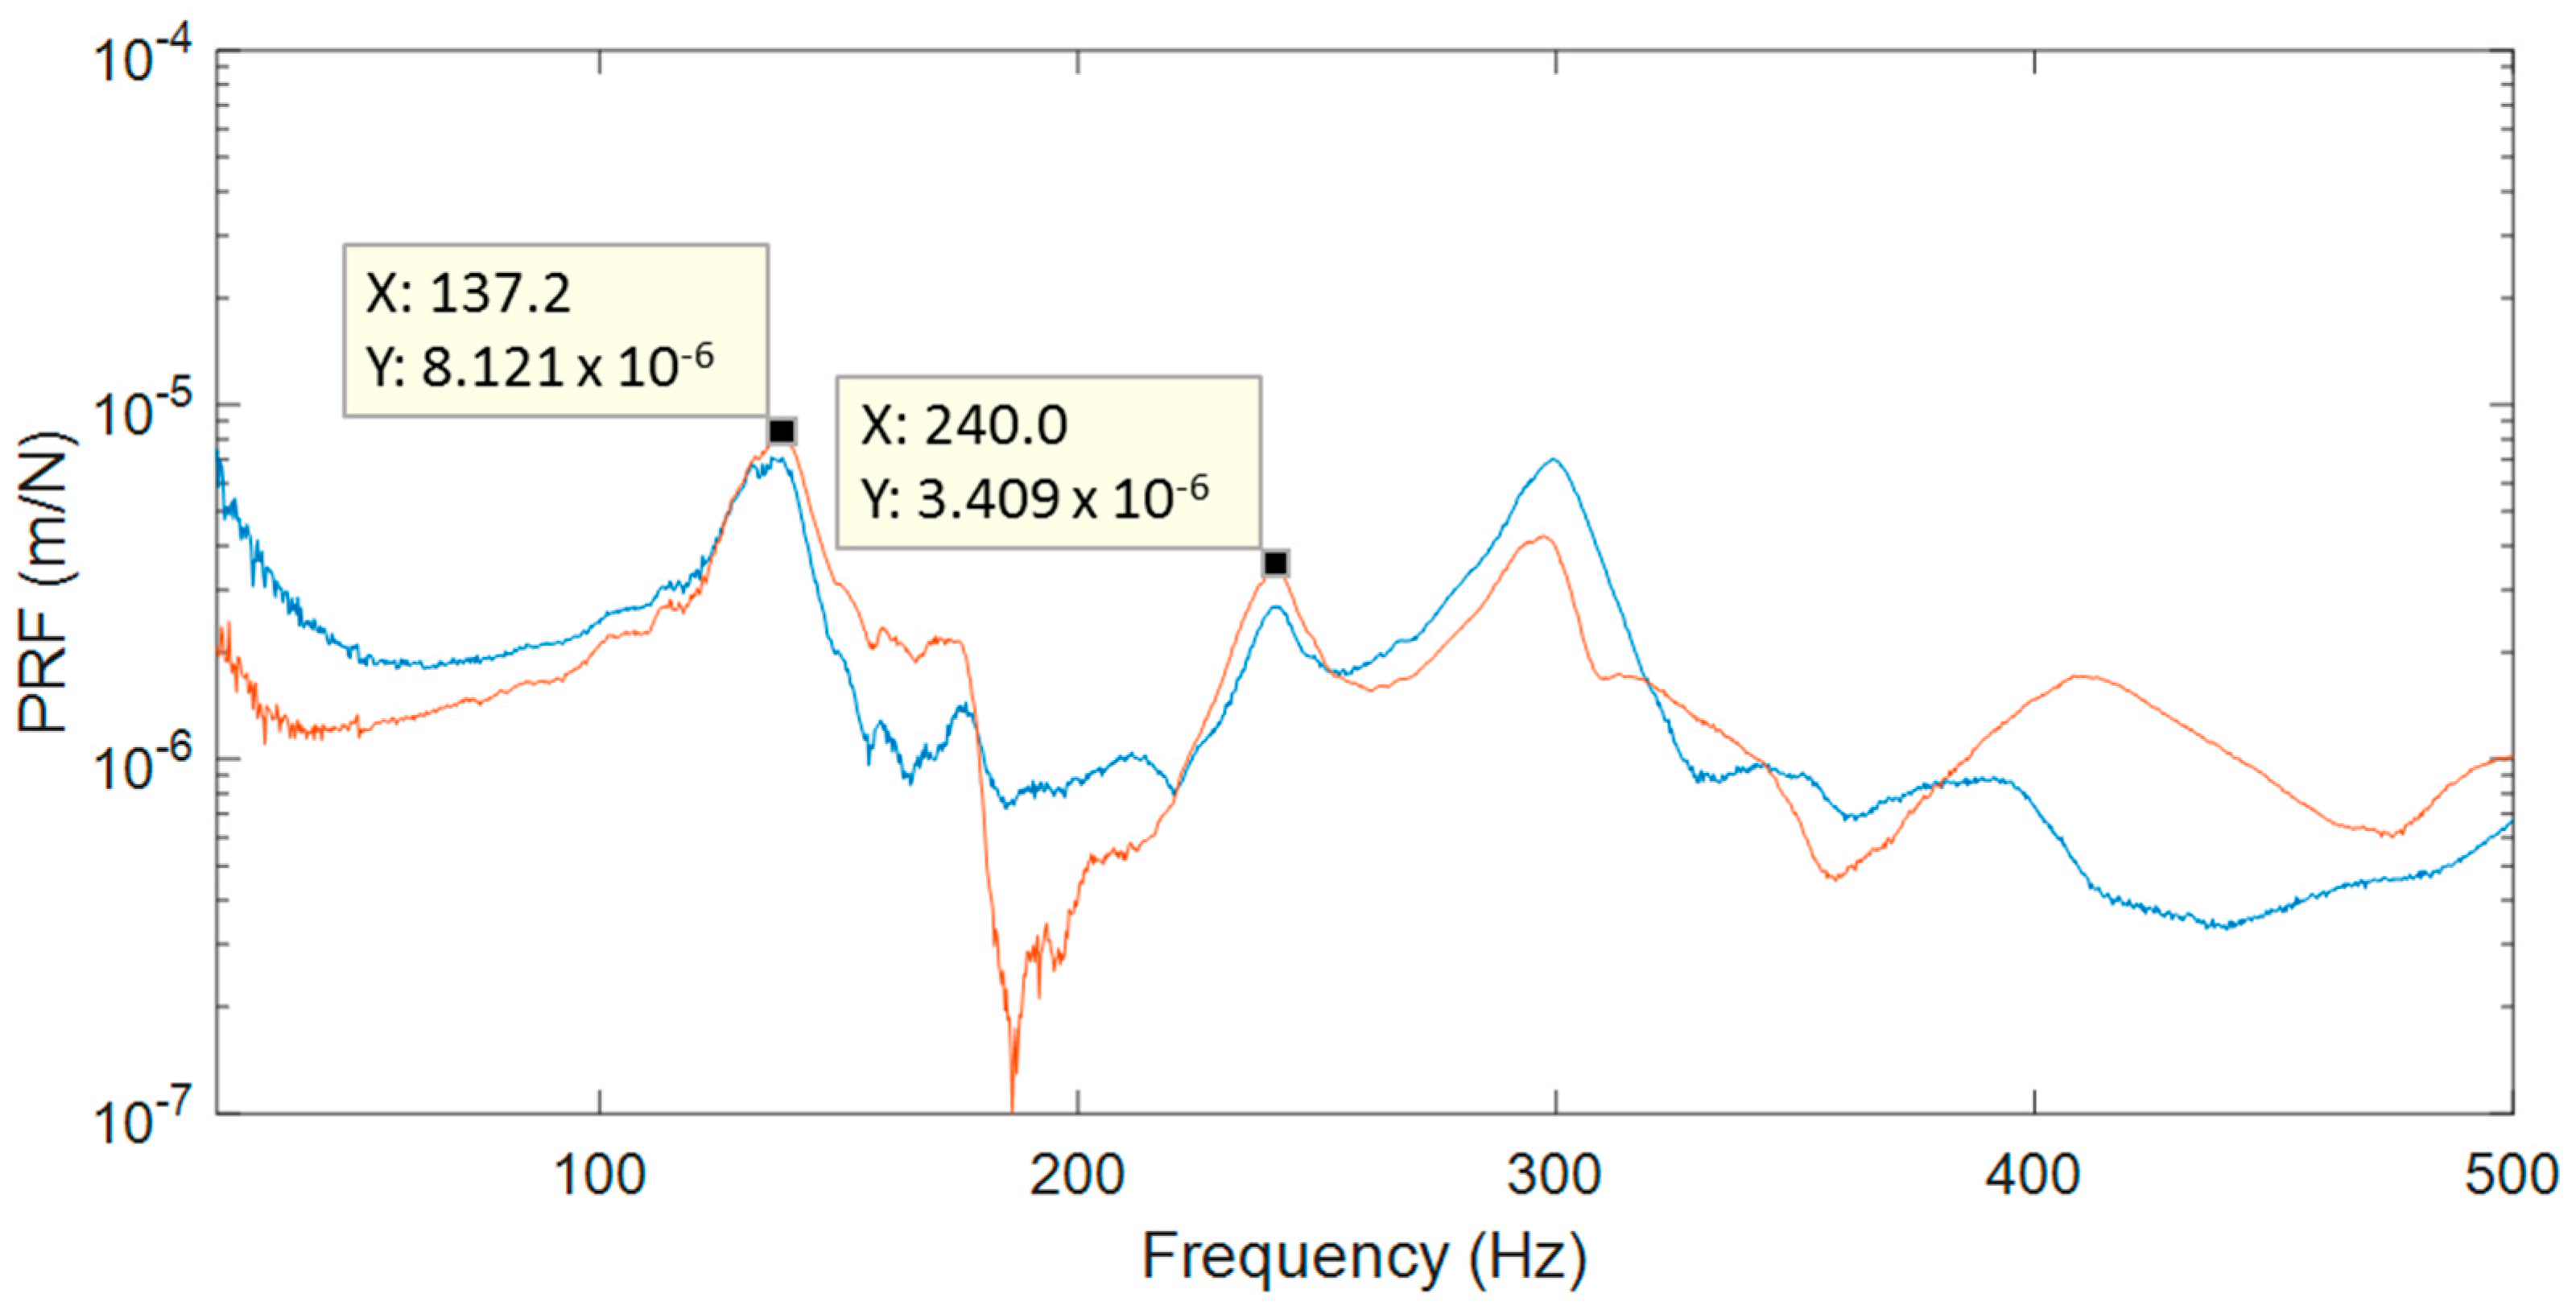
Specimen 1 was employed to evaluate different issues with this methodology. Particularly, sine and random excitation signals were explored under atmospheric pressure. In sine tests, the structure was excited at a single frequency corresponding to a resonance and the ODS was obtained using HS 3D-DIC. Previous to HS 3D-DIC tests, an impact hammer test was performed to obtain a quick natural frequencies identification for the sine tests. A multi-input multi-output analysis was performed considering three measuring points and three excitation points. The location of the points was defined to obtain a reasonable characterization of the passenger window area, as shown in
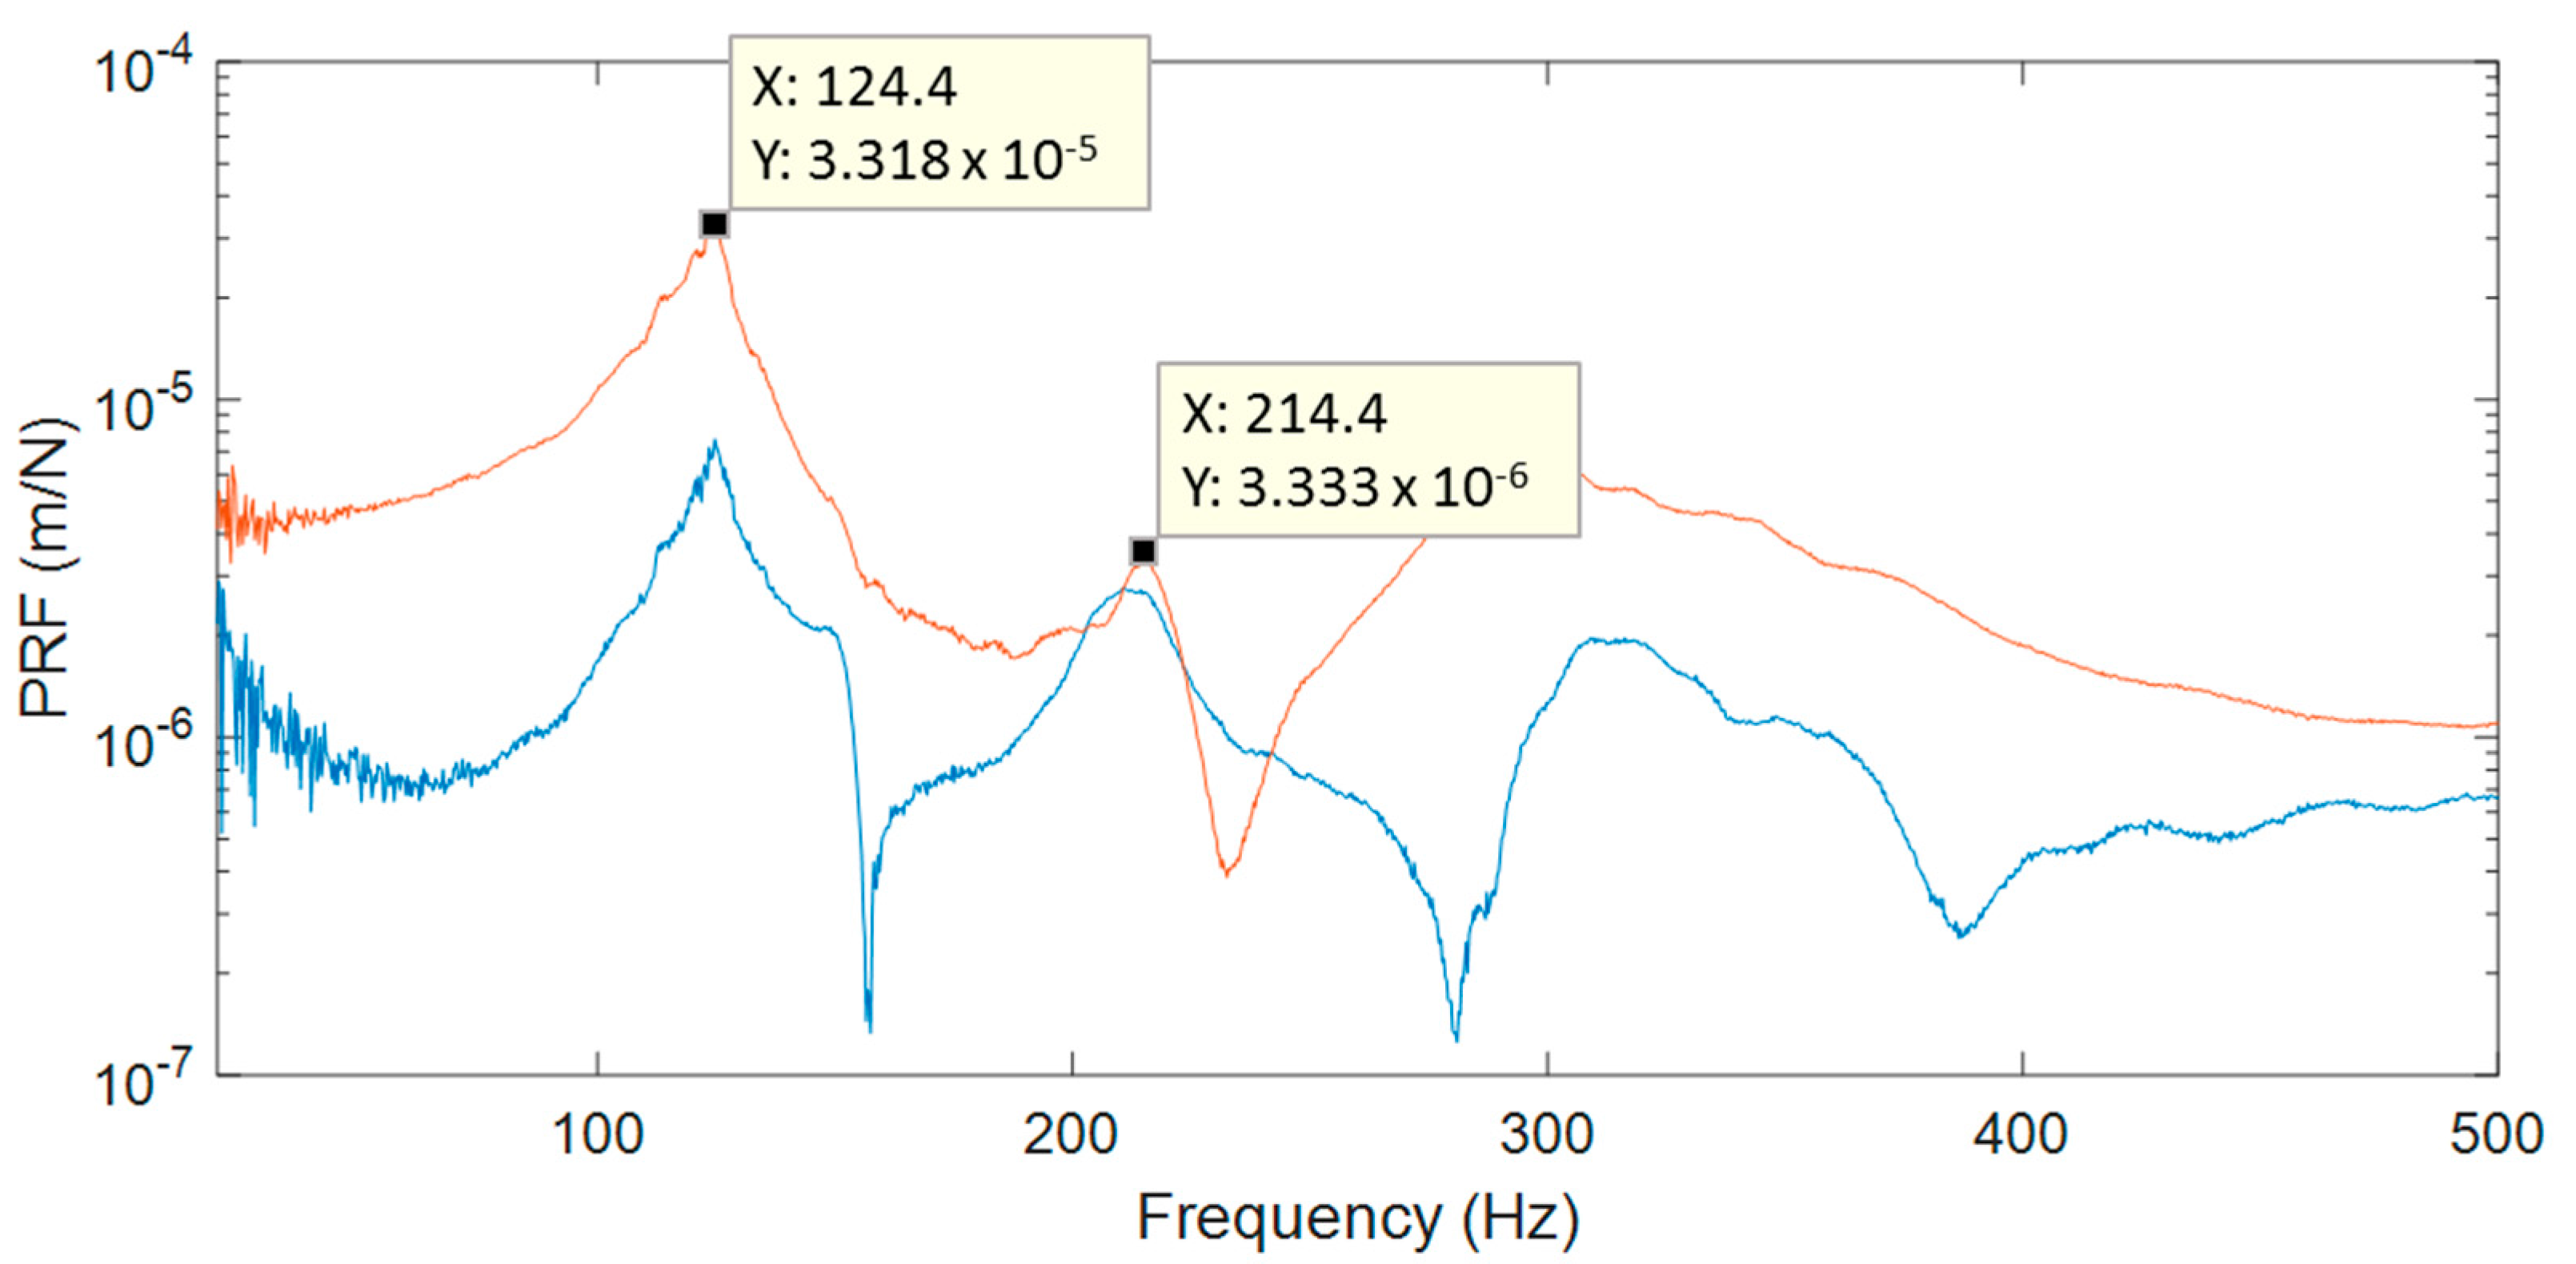
Figure 5. Non-highlighted accelerometers were intended for purposes unconnected with this study. Signals from the three accelerometers and the impact hammer were recorded by a Photon+ real-time analyzer (Bruel and Kjaer Sound & Vibration Measurement A/S, Nærum, Denmark). The FRFs were obtained by processing these signals considering a sampling frequency of 5120 Hz, 16,384 frequency lines, and 10 averaged windows. For the identification of the natural frequencies, the principal response functions (PRFs) were obtained through single-value decomposition of the FRFs matrix [
4]. In
Figure 6, two PRFs are shown and two significant frequencies are selected for sine tests. Afterwards, ODSs from the sine tests were compared with the same peak detected in the random test.
Additionally, the influence of in-flight conditions was evaluated by applying a differential pressure of 5.5 psi (34,473.8 Pa). Deformation due to pressure occurred in the whole demonstrator and, consequently, modifications of stiffness also occurred. Under these conditions, random excitation was applied in order to expose variations in the natural frequencies and ODSs.
3.2. Tests on Specimen 2
With a second specimen, it was possible to evaluate the influence of a local structural reinforcement on the modal behavior of the passenger window area under atmospheric environmental conditions. Its behavior was studied using sine excitation, obtaining natural frequencies from impact tests and ODSs using HS 3D-DIC. The performance of the impact tests and identification of frequencies was as described for the first specimen. As highlighted in
Figure 7, two significant modes were selected from PRFs at comparable frequencies to the first specimen.
3.3. Test for Full-Field Measurement Using HS 3D-DIC
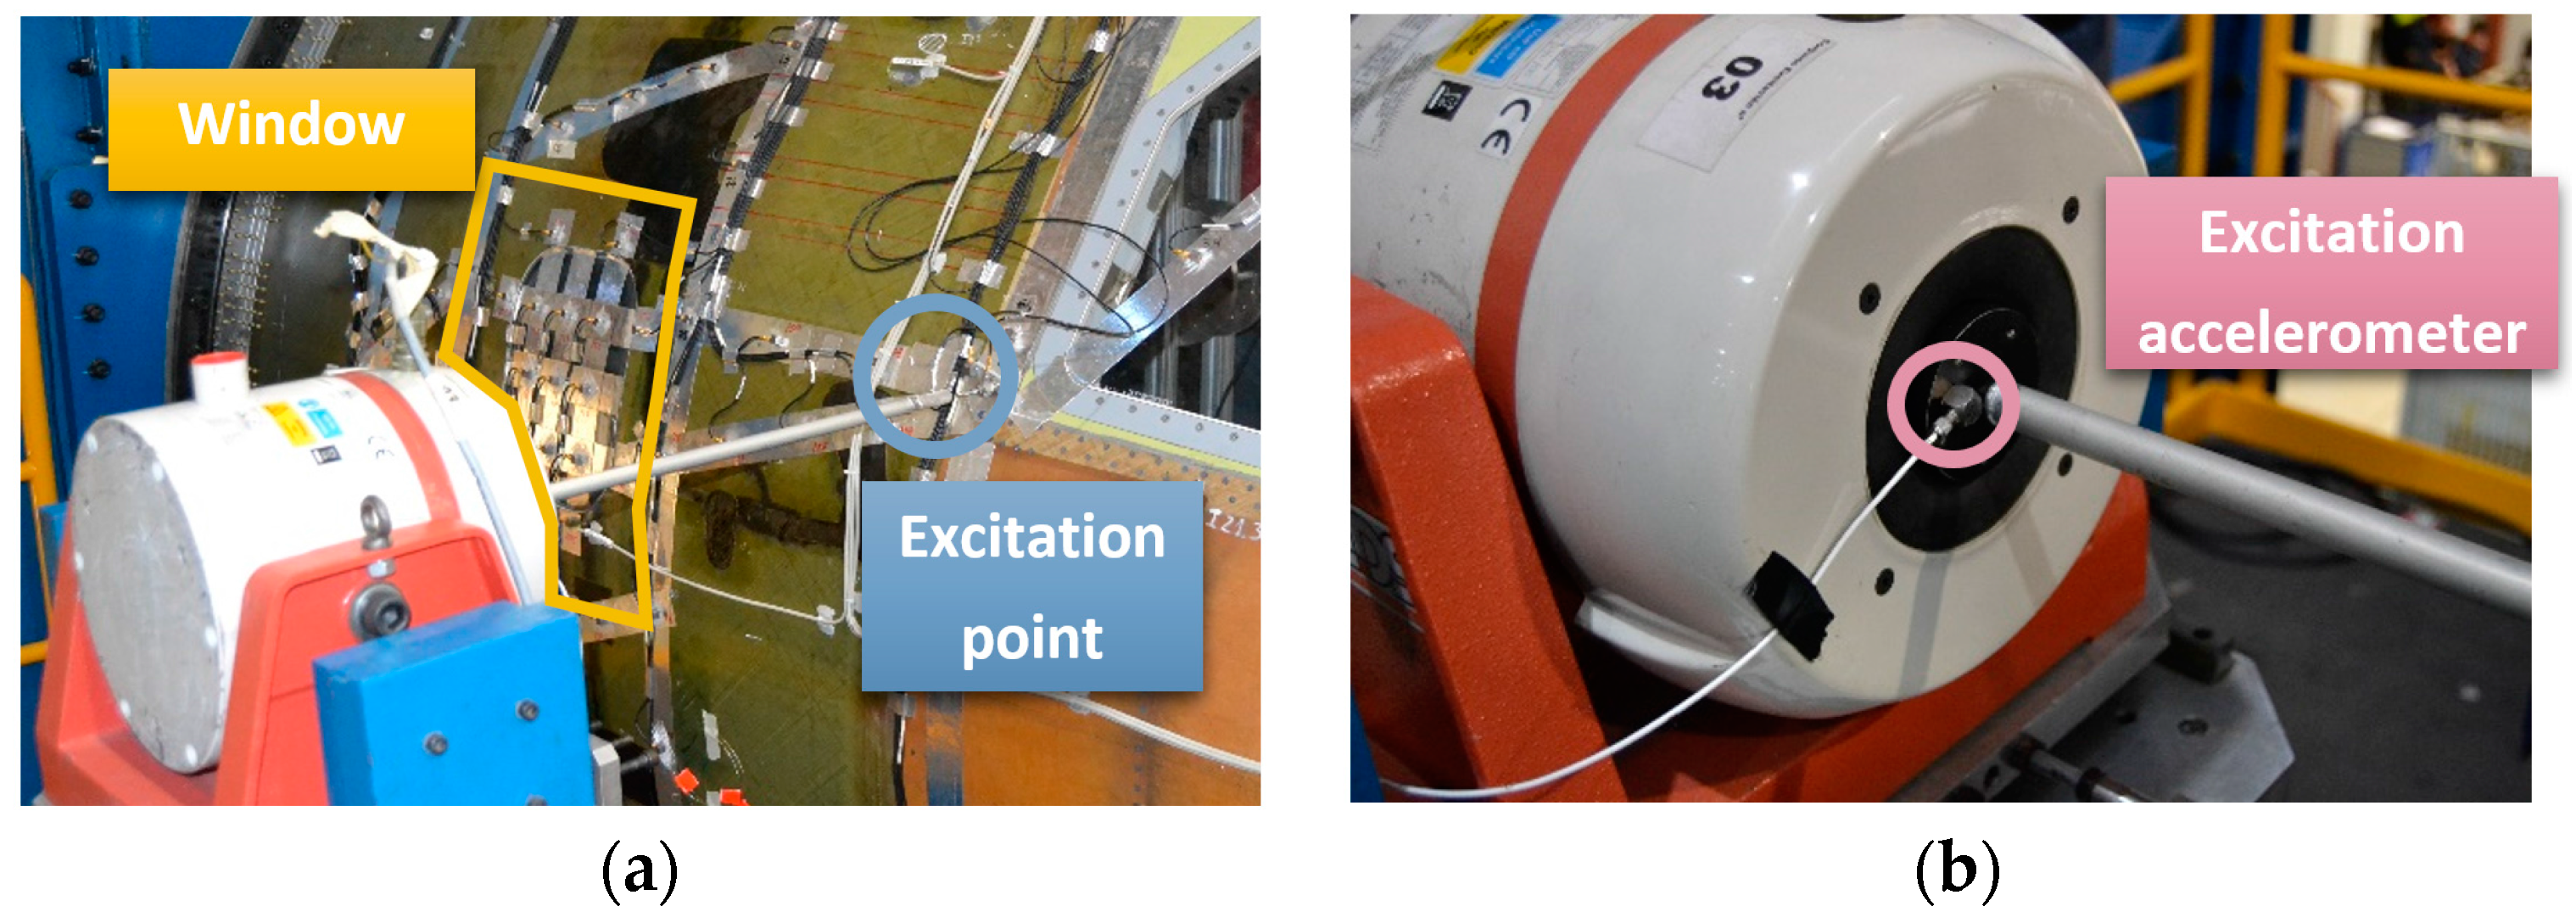
For sine and random excitation tests, an electrodynamic shaker model LDS V450 (311 N sine force peak, 214 N maximum random force RMS, and 5 Hz–7500 Hz frequency range) manufactured by Bruel and Kjaer Sound & Vibration Measurement A/S (Nærum, Denmark) excited the cockpit demonstrator laterally using a stinger, as shown in
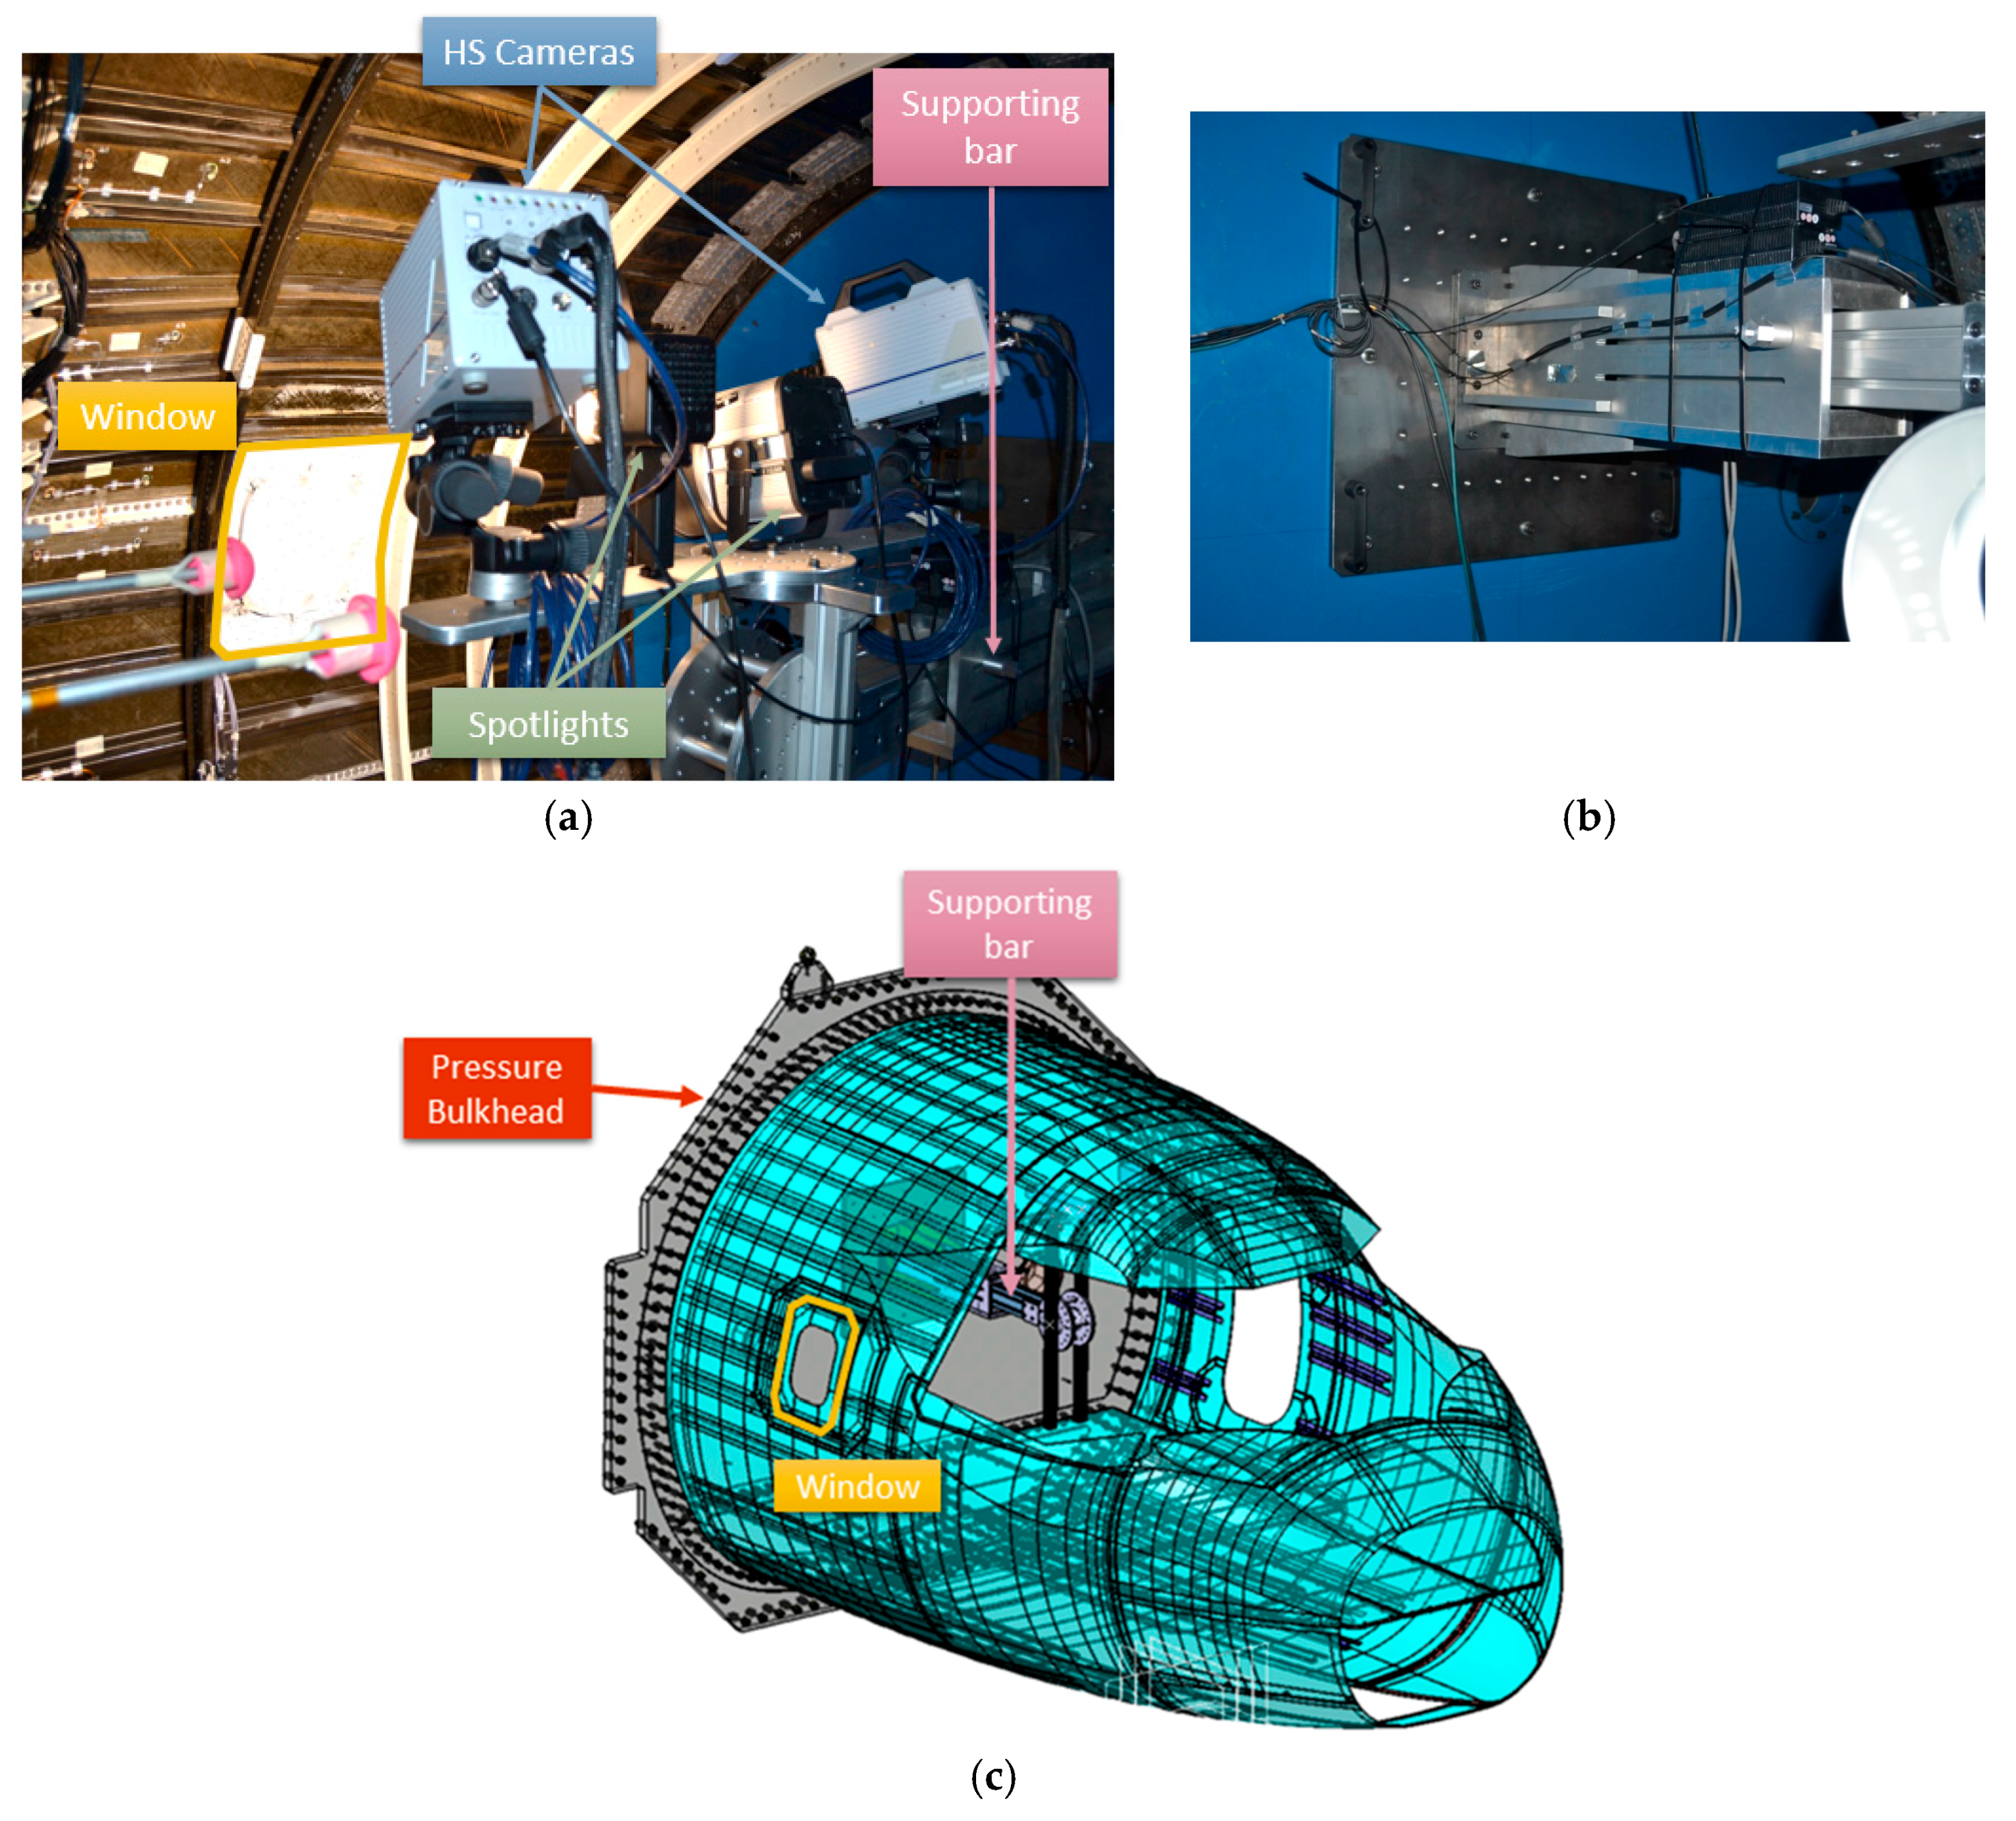
Figure 8a. HS 3D-DIC measurements were carried out on the window inner surface, i.e., inside the demonstrator. The set-up consisted in two, FASTCAM SA4 1024 × 1024 CMOS high speed cameras (Photron, Tokyo, Japan) with a maximum frame rate of 3600 fps at full resolution equipped with two AF Nikkor (Nikon Corporation, Tokyo, Japan) 50 mm f/1.4D lenses. Illumination is crucial, especially in high-speed image capturing. In order to achieve a uniform illumination without shadows or overexposed areas, the illumination system consisted of a Hedler DX 15 flood light (Cromalite S.L., Barcelona, Spain), and a Kaiser Videolight 6 (Kaiser Fototechnik GmbH & Co.KG, Buchen, Germany). As observed in
Figure 9, the whole system was fixed in a unique structure specially designed for the proposed set-up. The rigid supporting bar was designed to be fixed to the pressure bulkhead (
Figure 9b,c) in the structure that supports the whole demonstrator in order to avoid the mass effect of these elements on the demonstrator dynamic behavior, and to isolate the cameras from the excitation source. This support also provides four degrees of freedom to the optical system, making flexible and quick changes of configuration for measuring any part of the demonstrator possible.
As observed in
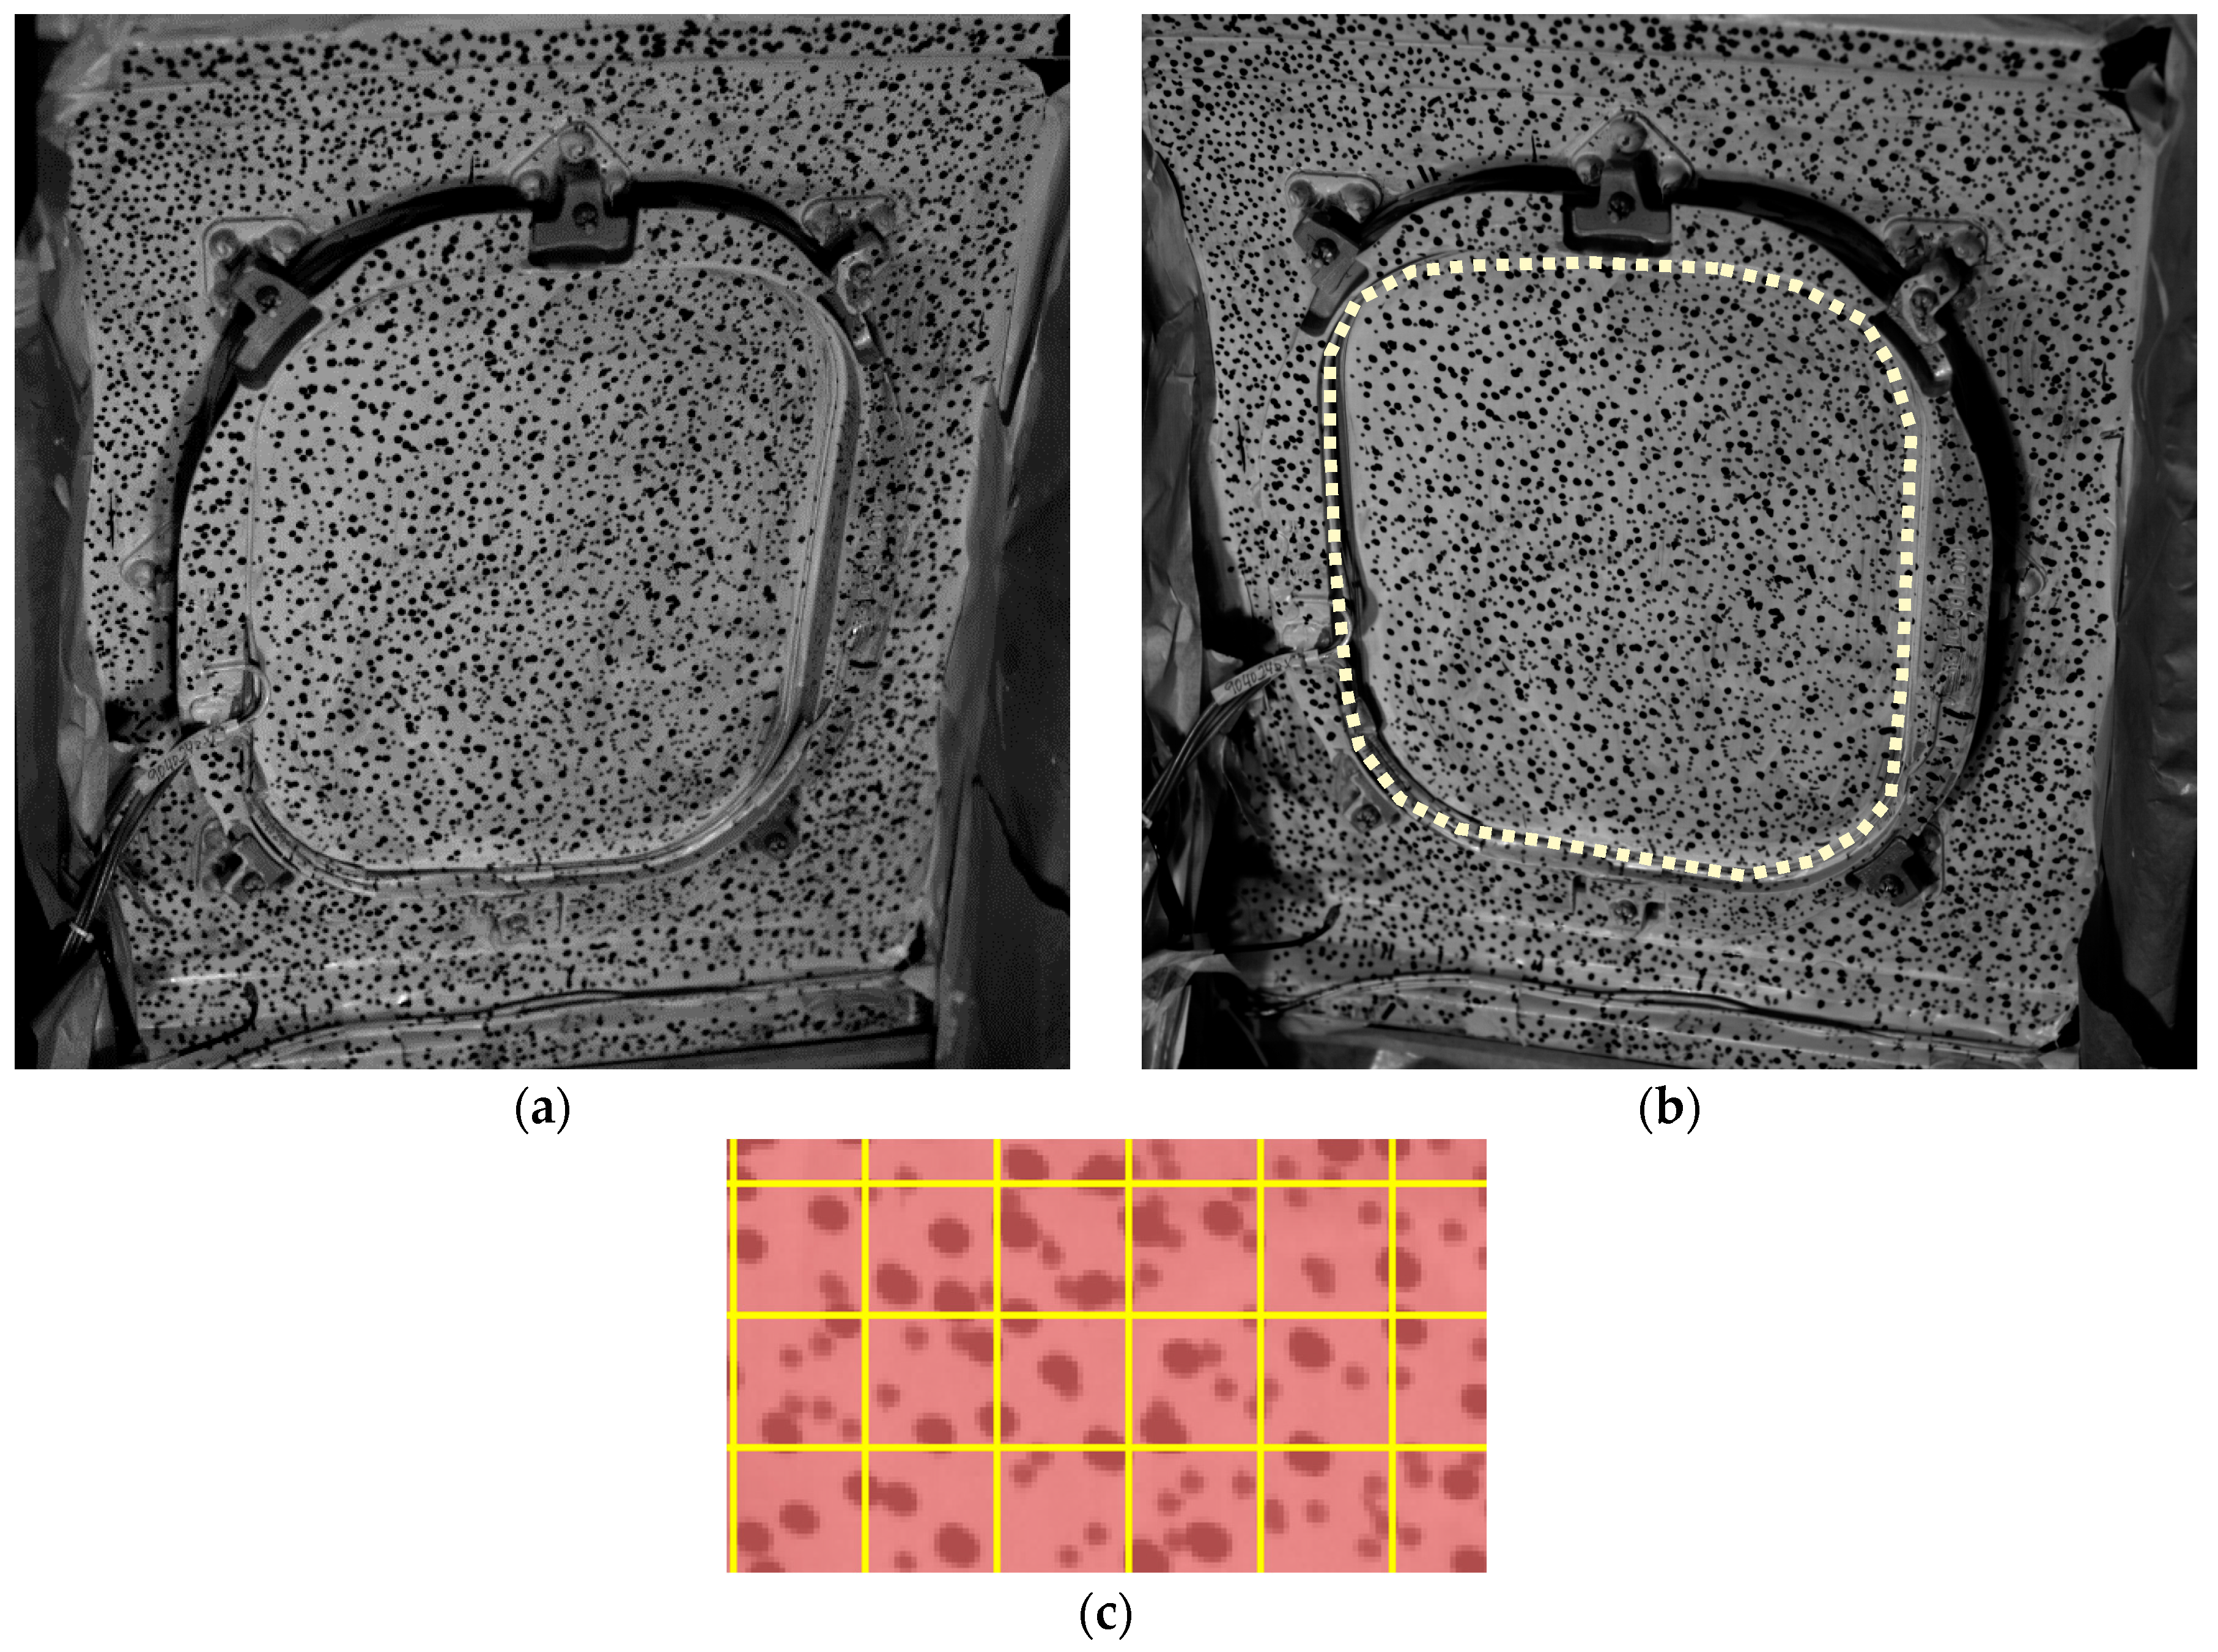
Figure 9a, the cameras were oriented to the window, which was randomly painted as shown in
Figure 10. A commercial software package was employed for implementation of the 3D-DIC technique, namely Vic-3D (Correlated Solutions Inc., Irmo, SC, USA). This piece of software was employed for image processing and to obtain the in-plane and out-of-plane displacements. For DIC analysis, 19 pixels facets with a five-pixel overlap were employed, resulting in ca. 35,000 measurement points. In
Figure 10c, some facets are shown as a grid to be visualized in comparison with the speckle size. In this study, out-of-plane displacements were employed since they define the bending deformation of the window. For the proposed configuration, the level of noise measured was 0.0079 mm. This value was determined as the RMS value of the displacements registered when processing two consecutive pairs of images during an unloaded state.
The main requirement to determine ODSs during fixed sine tests was a good definition of the vibration cycle [
43]. Thus, considering that the maximum frequency to characterize was 240 Hz, a camera frame rate of 2000 fps (frames per second) was employed, involving eight points per cycle.
During the tests where the demonstrator was excited using a random signal, it was possible to identify both natural frequencies and ODSs. This identification was performed from the full-field transfer functions between excitation and response. The excitation was monitored by an accelerometer on the shaker armature, shown in
Figure 8b. The transfer function estimation required a perfect synchronization between the captured images (i.e., response displacements during the vibration) and the excitation signal from the accelerometer, thus, a NI USB-6251 DAQ system (National Instrument Corporation, Austin, TX, USA) was employed to allow simultaneous data collection. The natural frequencies were identified as the frequency where the resonance peaks occurs, and ODSs were obtained by the full-field depicting the imaginary part of the peaks for every single point. A spectrum from 0–640 Hz was employed for random excitation tests and the camera’s frame rate was set to 2000 fps, satisfying the Nyquist criterion. The spectral analysis was performed considering a frequency resolution of 1 Hz, anti-leakage Hanning windows, and an overlap of 50%.
3.4. Image Decomposition Comparison
The amount of experimental results for the two different kinds of tests was considerable. However, a comparison between the tests performed with fixed sine excitation and random excitation was required to validate the results using the latter type of test. For this purpose, an image decomposition method was employed. This method essentially consists on compressing large amounts of two-dimensional data by reducing its dimensionality to a feature vector while preserving the information [
35].
This method has been widely employed for validation of analytical and theoretical models because it facilitates the comparison between 2D sets of data [
34,
35,
36,
37]. As commented, it consists of converting the information from different data maps (i.e., modal shape) obtained when the specimen is subjected to different conditions (or is analyzed employing different full-field techniques) into respective feature vectors composed by shape descriptors. This procedure is reversible, so, a 2D data field could be reconstructed from a feature vector. These feature vectors can be directly compared and are independent from original sized map or orientation [
37]. The more similar the vectors, the more similar the results. The adopted image decomposition method was based on Chebyshev polynomials T
k(i,j) to decompose displacement contours I(i,j) into a set of coefficients or shape descriptors, s
k, with the same units as the original sets of data.
The area of analysis using shapes descriptors were reduced to the transparent region, as highlighted in
Figure 10b, where the largest displacements occur.
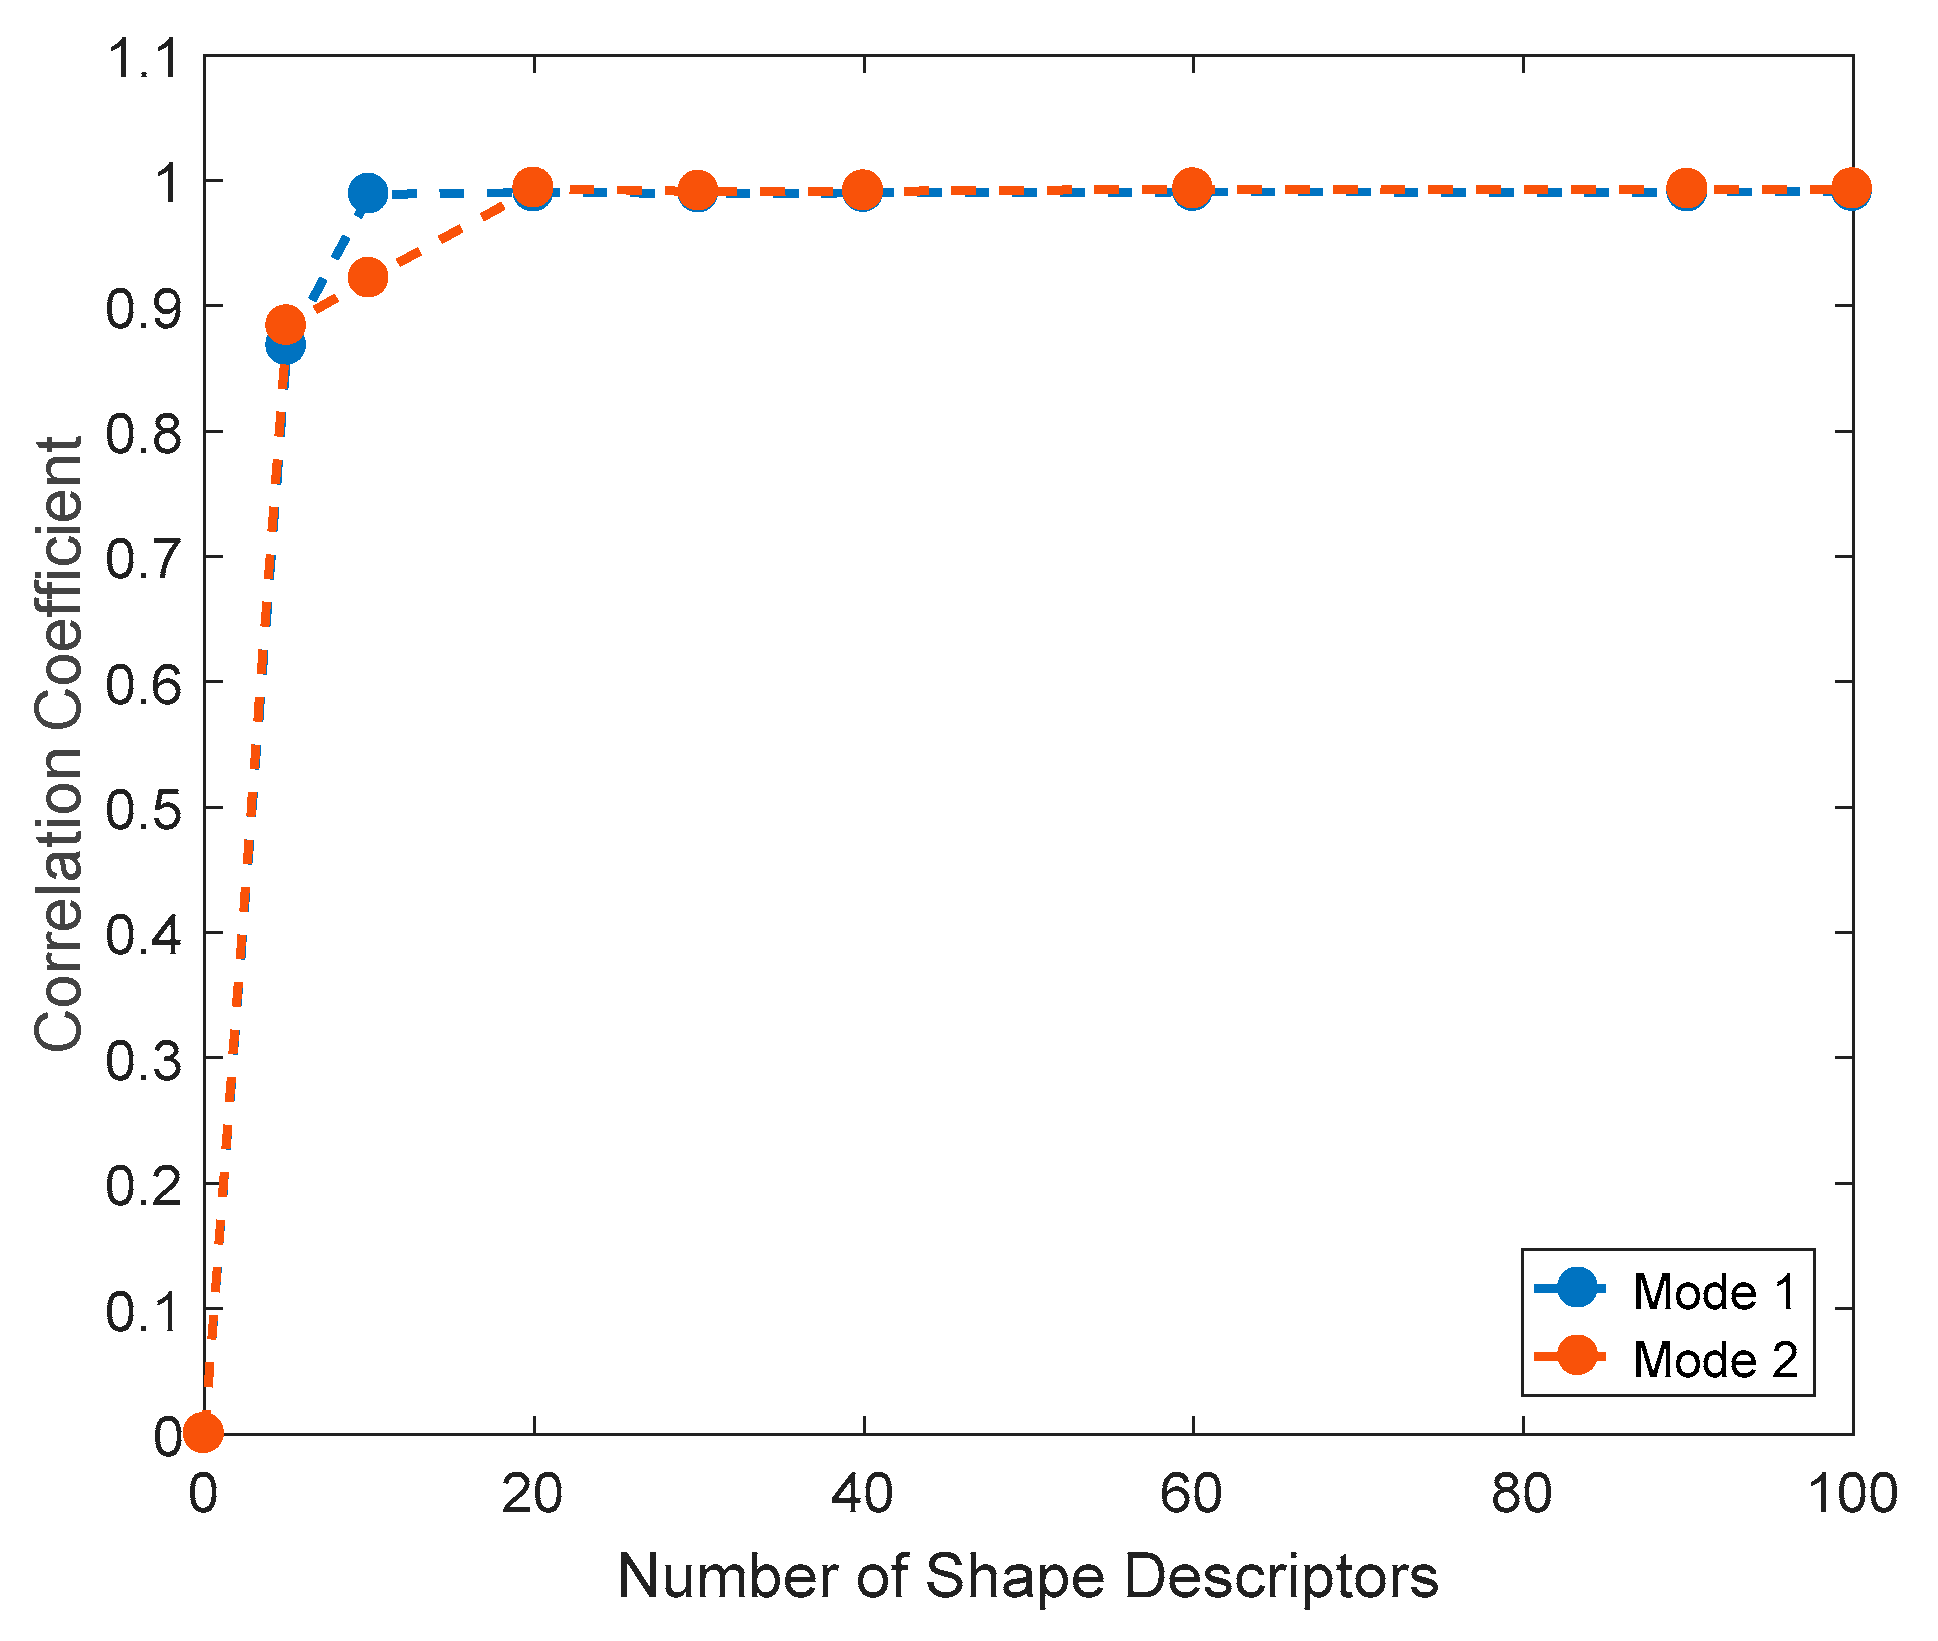
As mentioned, the feature vector should adequately preserve the information; specifically, the quality of the representation depends on the number of shape descriptors used for the image decomposition. This is evaluated by comparing the original data field to the one reconstructed employing a certain number of shape descriptors. In this case, the required number of shape descriptors was evaluated by analyzing the correlation coefficient between the original and the reconstructed image using different shape descriptors [
37]. In
Figure 11 the evolution of the correlation coefficient between original displacement maps and reconstructed map employing a certain number of shape descriptors is presented. Namely, blue and orange dots represent the correlation coefficient for Mode 1 and Mode 2 of specimen 1 from the sine tests, respectively. It is shown that the required number of shape descriptors to obtain a correlation coefficient above 90% is slightly different for each kind of displacement field compared. Similar results were obtained in the remaining tests. In this case, only 20 shape descriptors are sufficient to represent the displacement (ODSs) maps analyzed in this work.
4. Results and Discussion
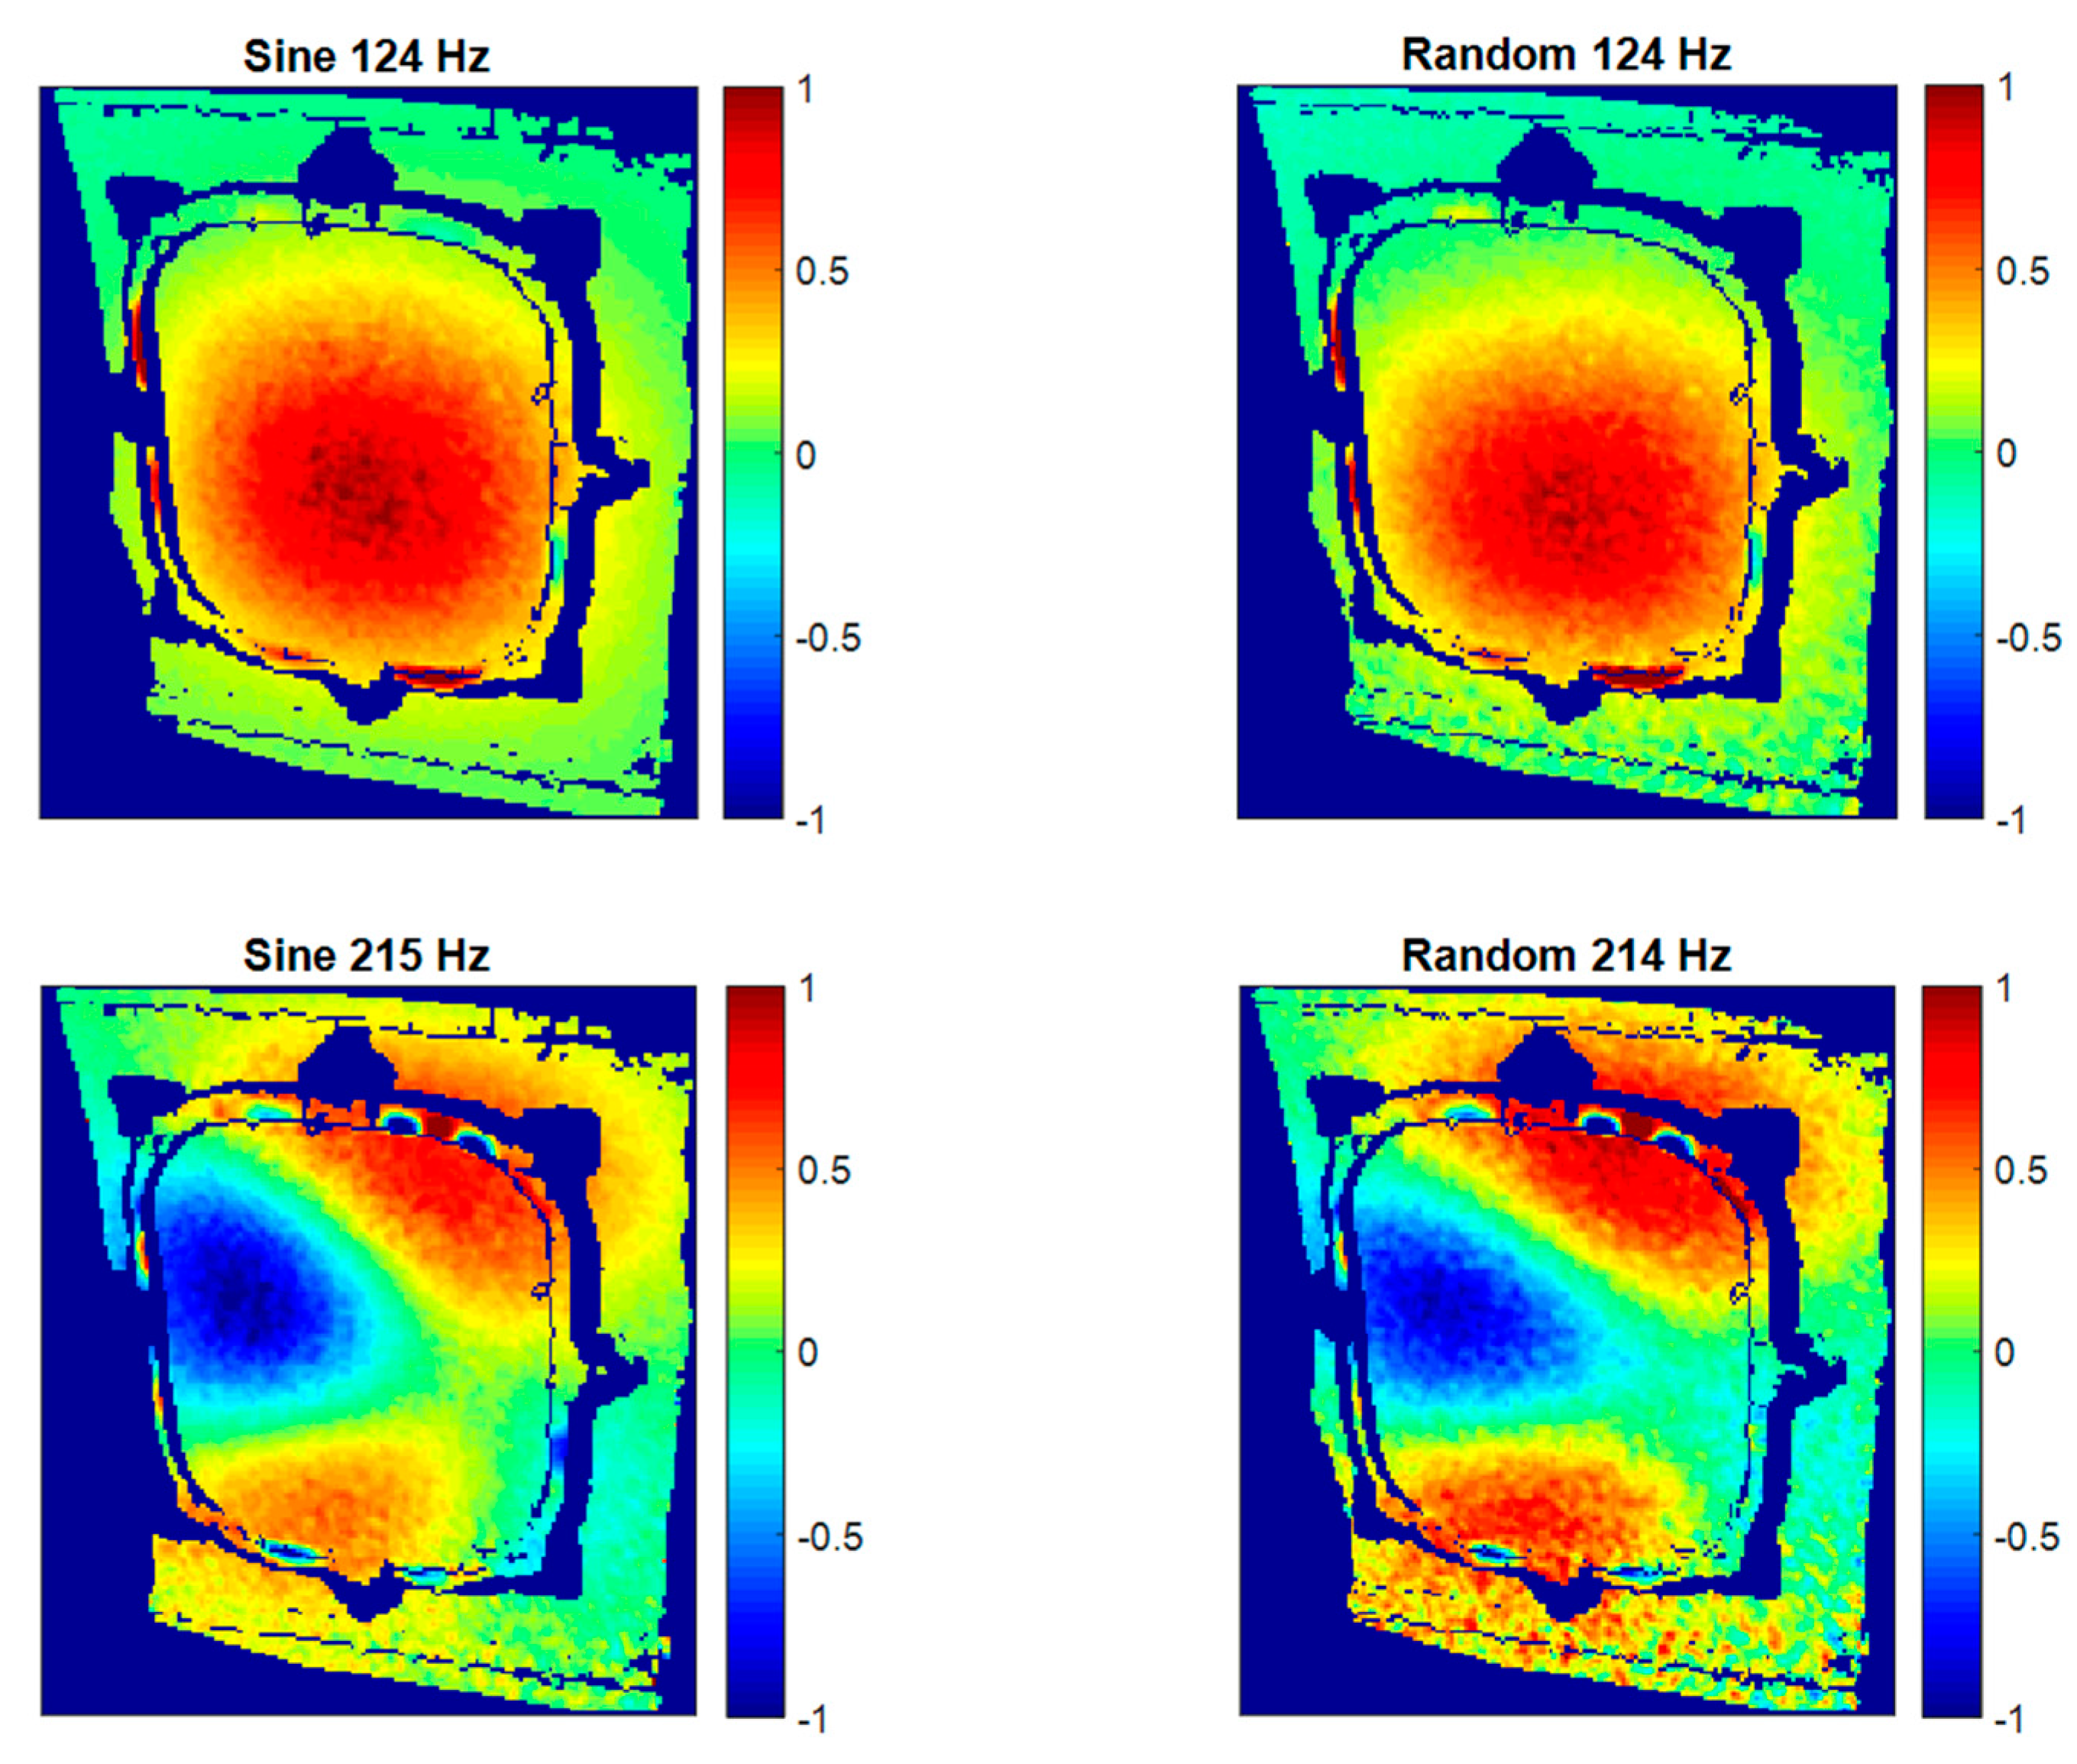
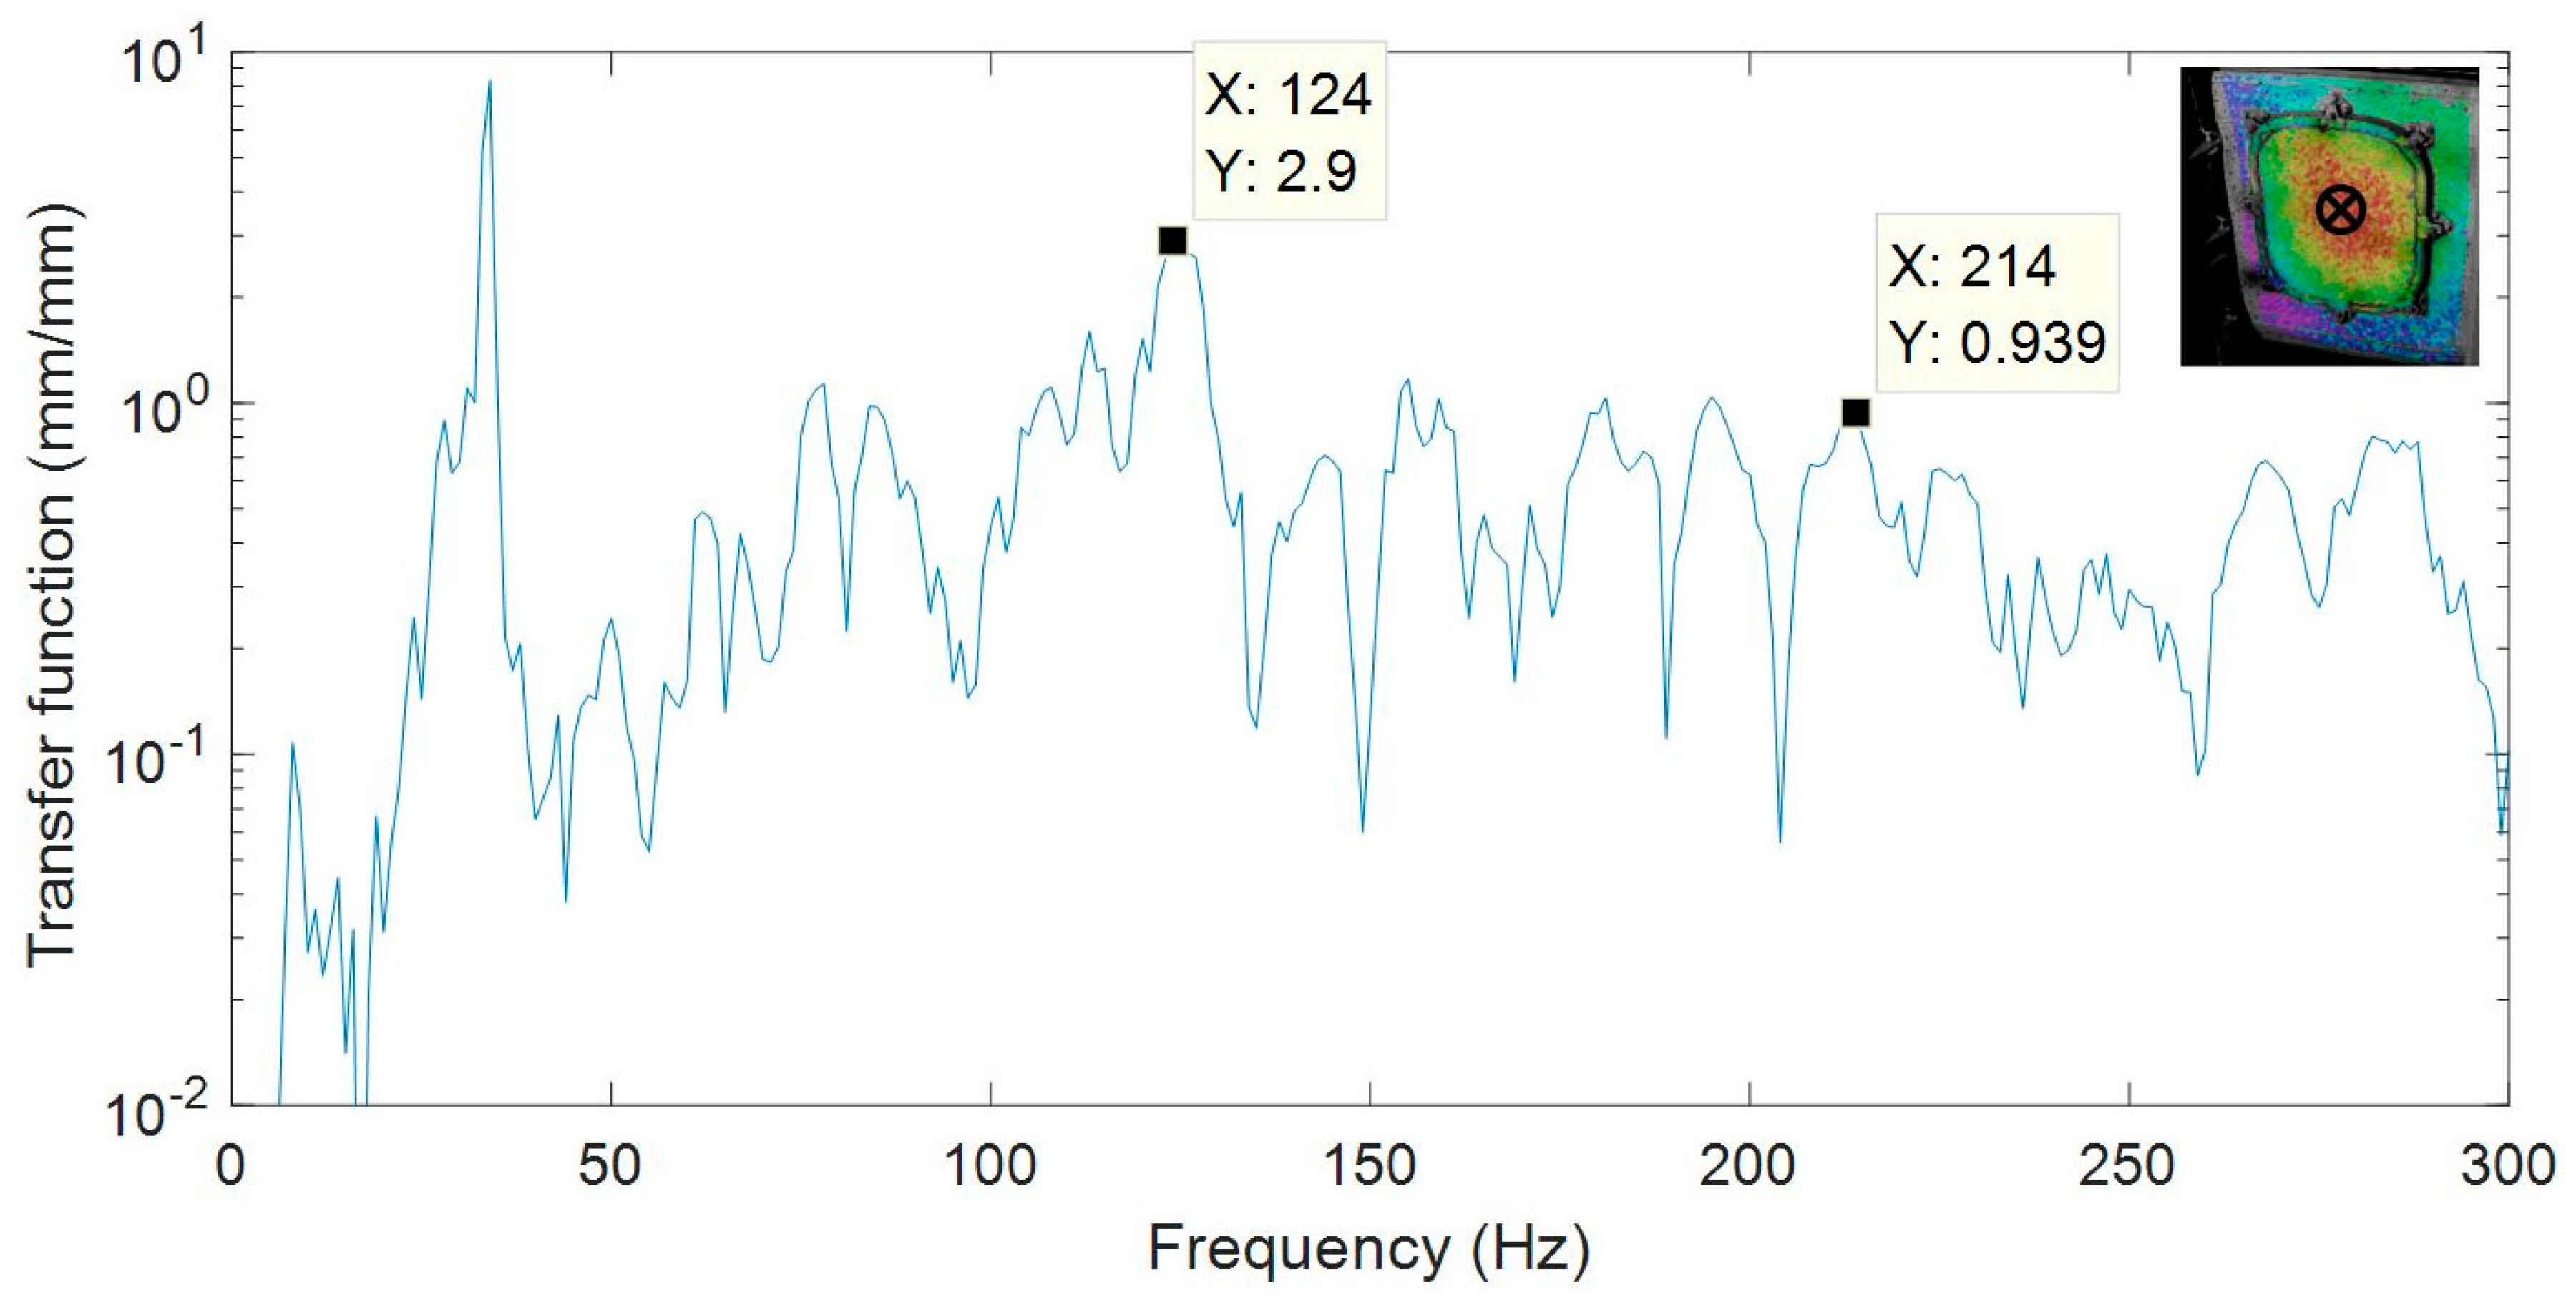
In this section, modal identification using HS 3D-DIC in the described configurations is presented. Results of specimen 1 under an atmospheric environment is considered as a reference to discuss the results from the different configurations. The first results concern the evaluation of the modal parameters extracted from sine and random tests. From random, transfer functions, analogous to FRFs from impact hammer testing, are obtained. In
Figure 12, the transfer function corresponding to a point in the center of the window is presented. This point was considered as representative of the main behavior of the whole window. A wide variety of modes are detected from the transfer function. Although excitation covered up to 640 Hz, for illustration purposes the transfer function is truncated at 300 Hz, considering that the most relevant modes for this study were below this limit. Two peaks are highlighted whose frequencies are close to those identified in the impact test. Consequently, these frequencies were considered to build ODSs. In the sine tests, ODSs were obtained directly from displacement measurements.
Figure 13 shows the out-of-plane ODSs for each mode and test. They were normalized to enhance the visual and numerical comparison of the shape descriptors.
Results in
Figure 13 show a good agreement between sine and random tests. Numerically, the correlation coefficient between shape descriptors was 0.9803 for the first mode and 0.9593 for the second mode. In the first mode the window experiences a single bending with maximum displacement at the middle. The second one is in a more complex shape, as is expected from a higher-order mode, showing alternative bending regions.
Sine tests provide accurate, clearer results considering ODSs since the excitation energy is concentrated in just one single frequency, generating higher displacements. An additionally important point of these tests is that only a small number of images are required to describe some sine cycles. This number depends on the resonance frequency. Hence, the execution and processing times considerably diminish if a reasonable number of modes are characterized. However, sine tests are not able to provide information of resonance frequencies. It is necessary to previously know the natural frequencies’ values. Impact hammer tests using an accelerometer are a method to obtain this information. Moreover, in the particular cases here evaluated, since impact hammer tests only detect the local window’s resonances, the global behavior cannot be identified. Conversely, a broad spectrum is excited in random tests and it is possible to characterize as many ODSs as frequency lines resulted from the frequency analysis. More detailed information can be extracted from the structure, but it is also more time-consuming and ODSs could be slightly noisier, as seen in
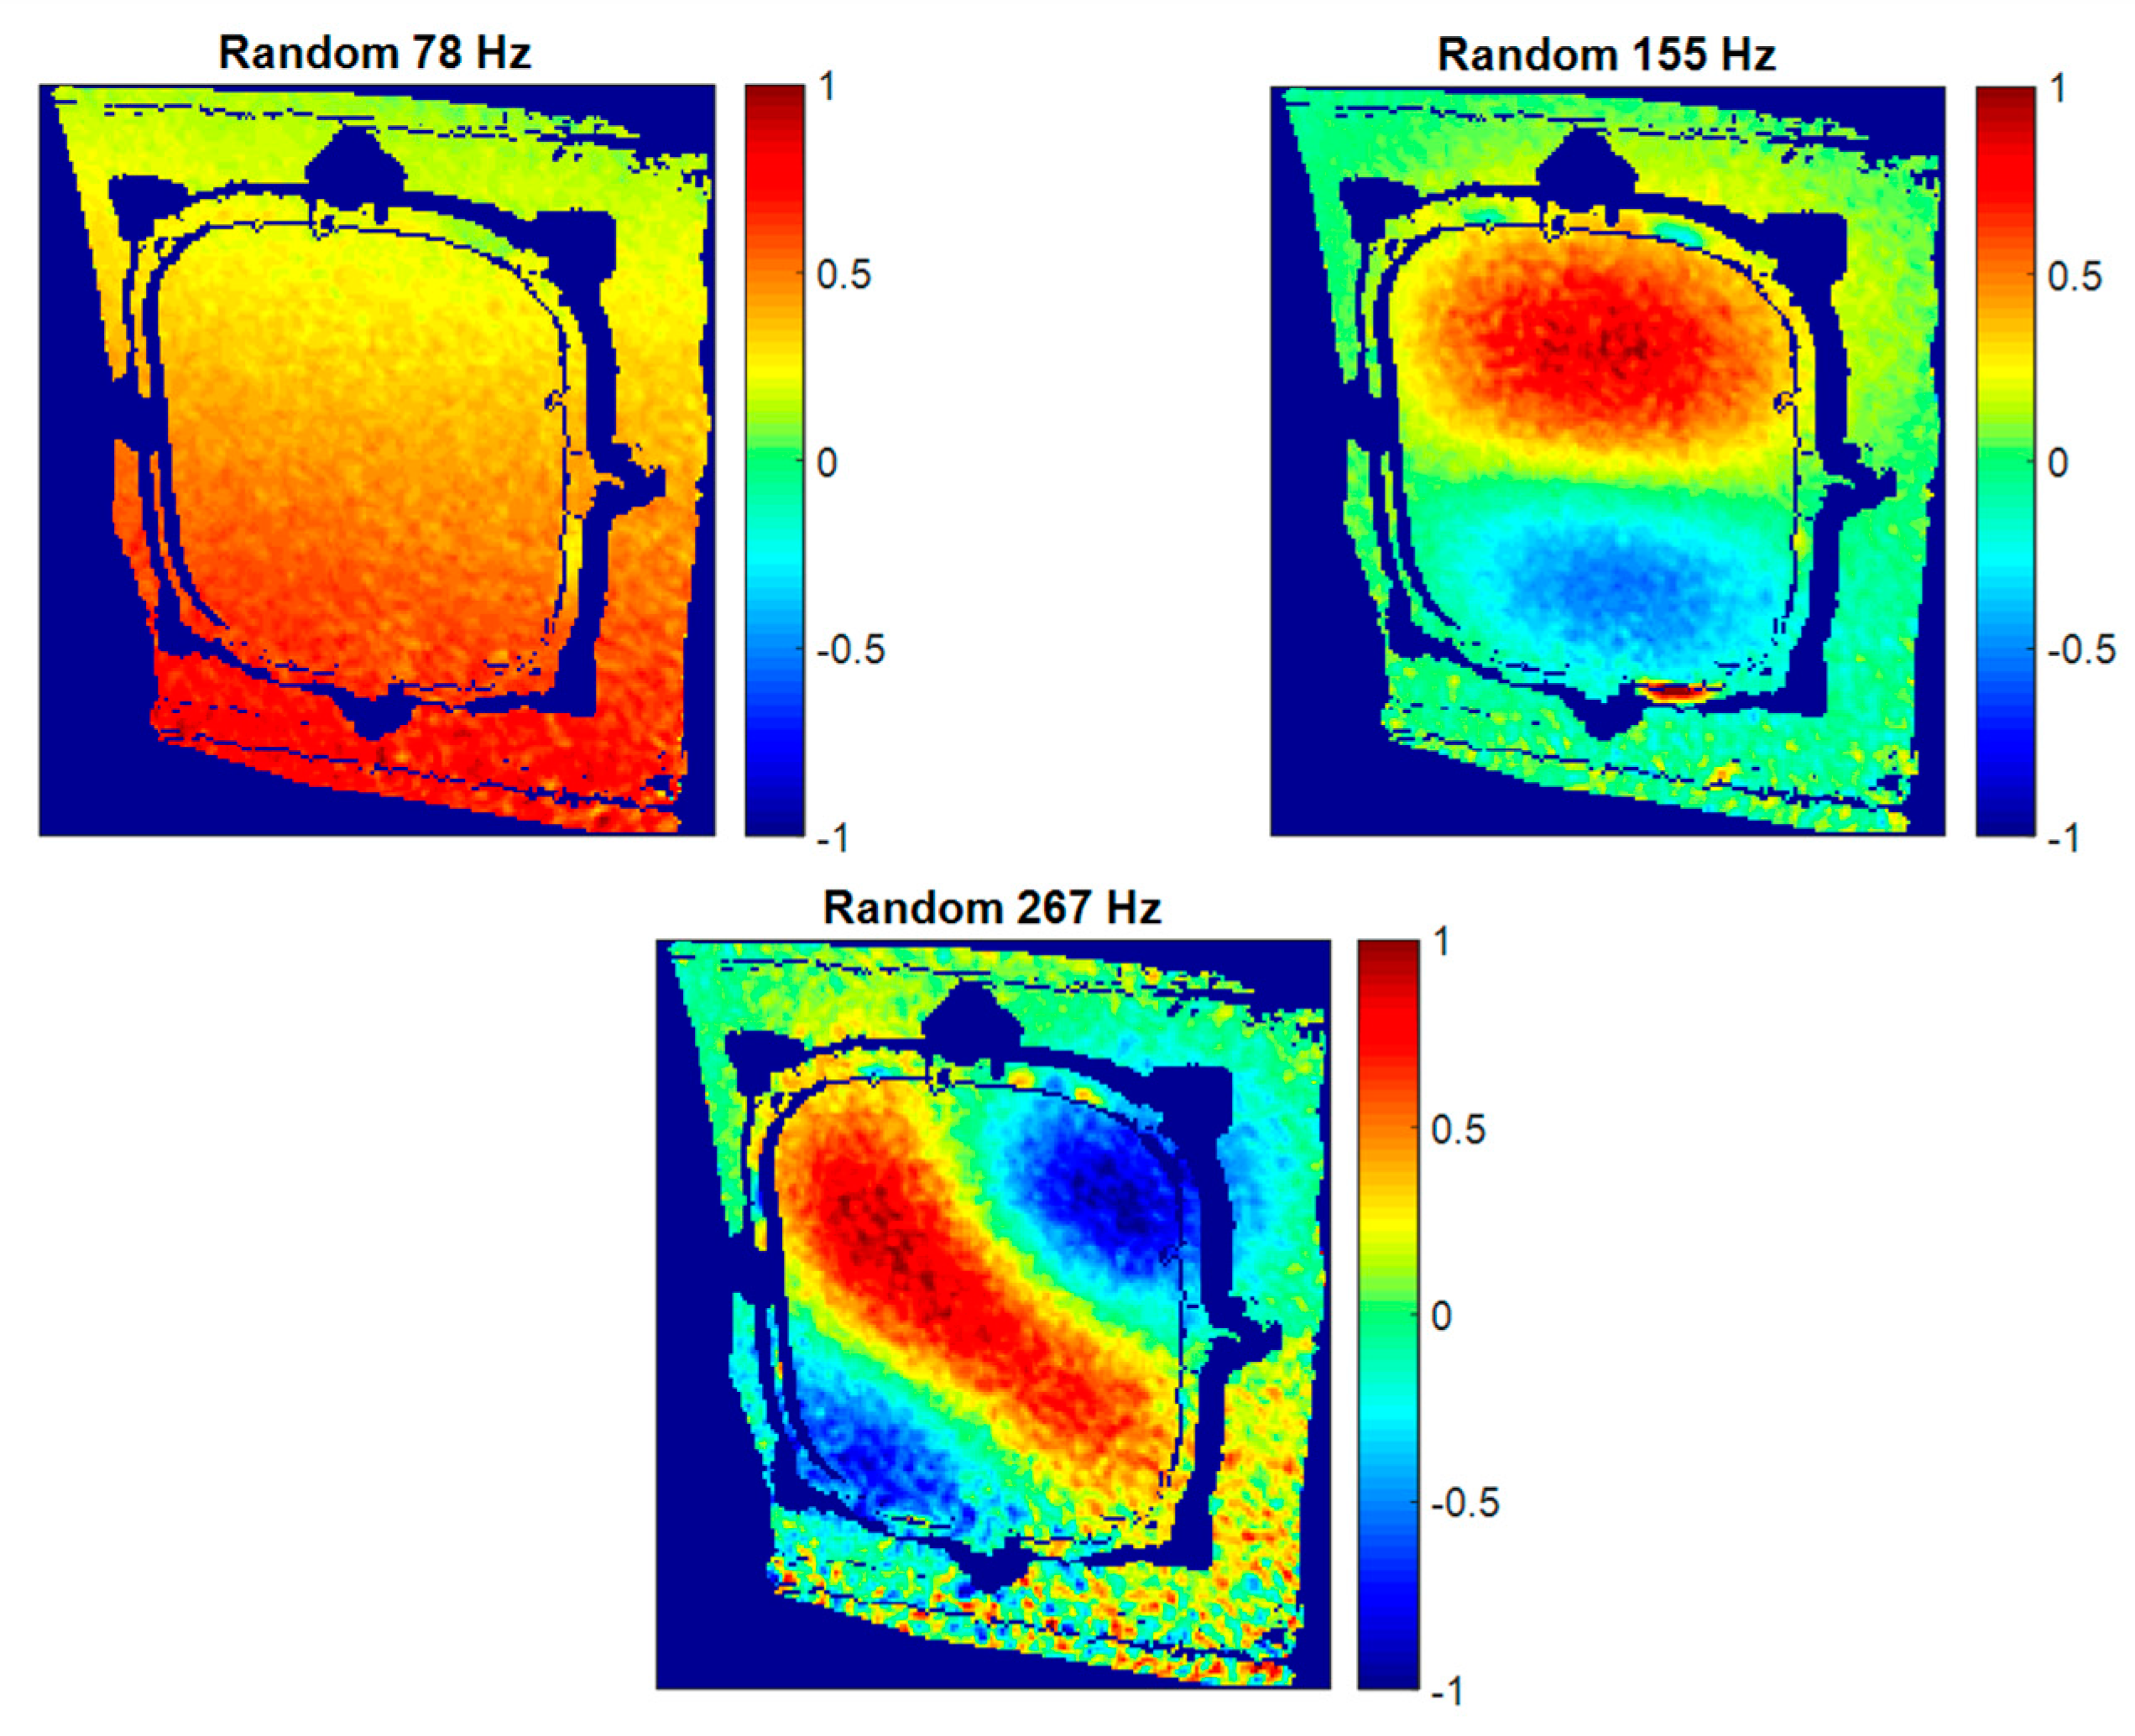
Figure 13. Some additional structural resonances detected using HS 3D-DIC and random shaker excitation are represented in
Figure 14. They were selected according to their interesting ODSs. The resonance at 78 Hz corresponds to a global fuselage mode. As can be observed, this global mode appears locally as a rigid body motion since the analyzed frame is a small sample, considering the demonstrator size. Thus, the curvature of the mode is not perceived here. The other two ODSs at 155 Hz and 267 Hz imply local behavior and correspond to bending modes of increasing order of the window. Considering the high geometrical complexity of the presented ODSs, a non-negligible number of sensors would be necessary to properly characterize these shapes instead of HS 3D-DIC. Even so, the characterization would be sparse.
4.1. Specimen 1 under Differential Pressure
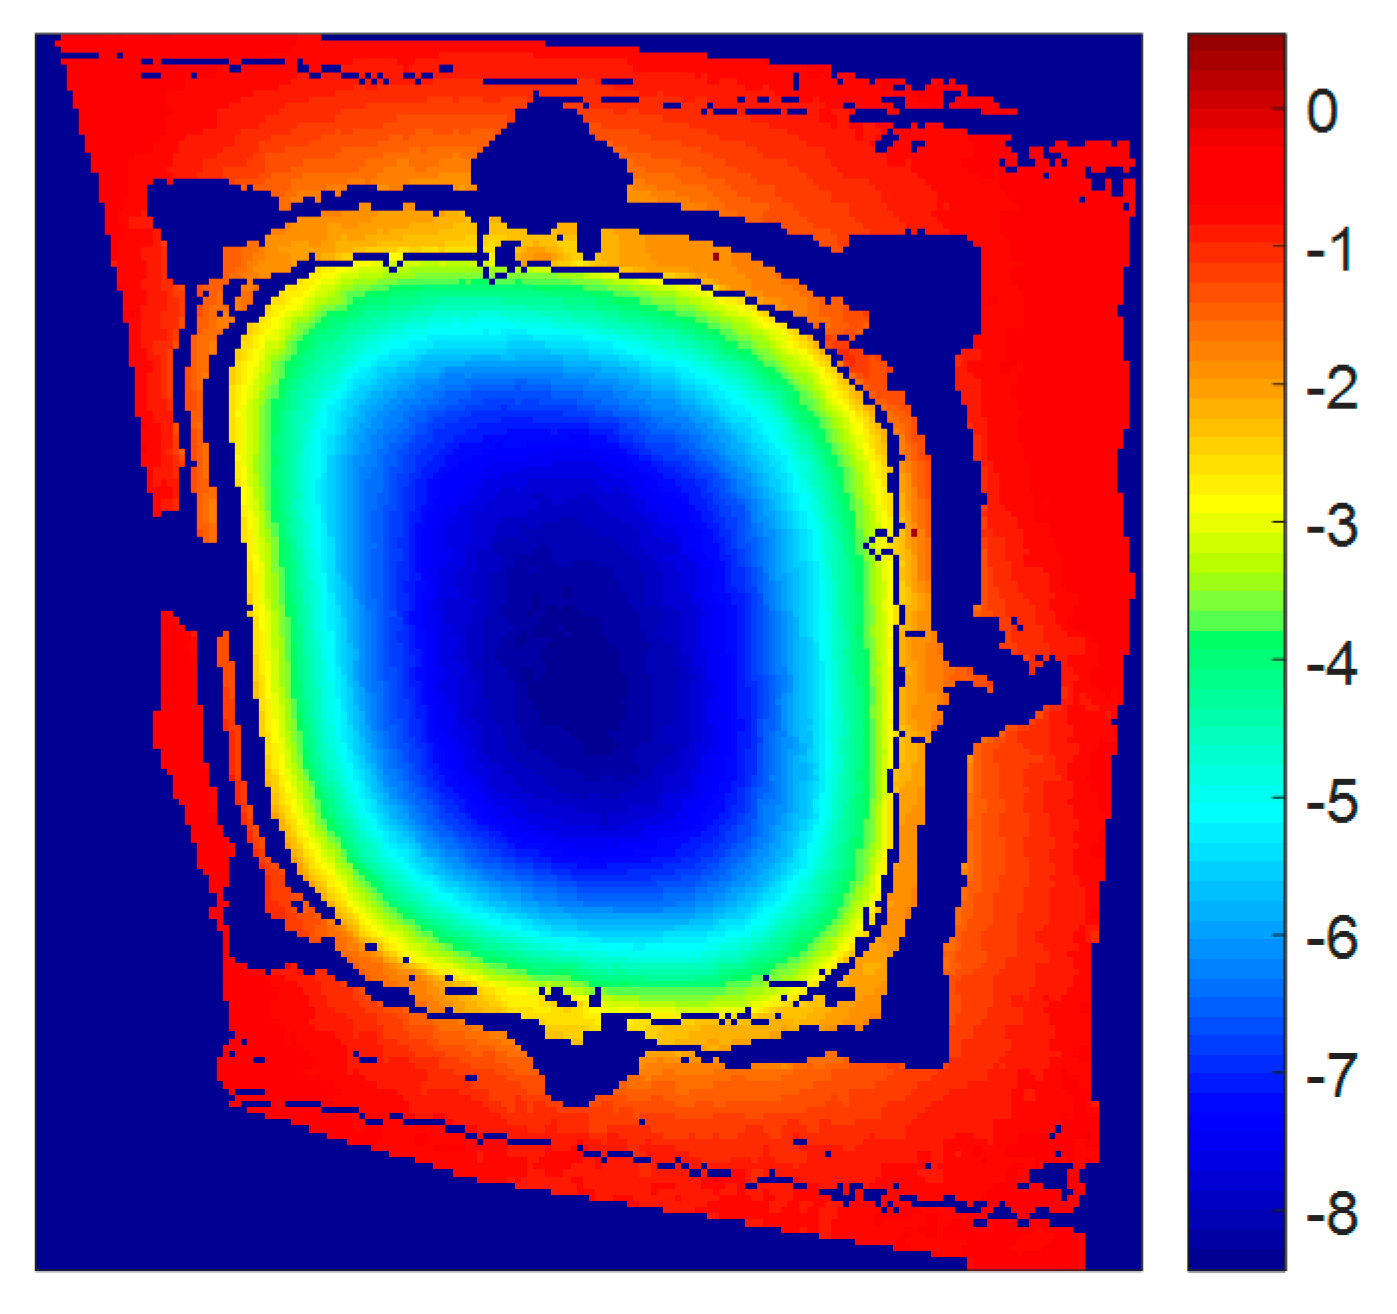
Differential pressure entails a homogenous force over the structure. In the passenger window area, the deformation due to differential pressure was measured by comparing the static state, shown in
Figure 15. Maximum deformation occurs at the center of the window where the stiffness is lower. Deformations of more than 8 mm outwards are experienced in that particular point. This deformation modifies the shape of the window, increasing the curvature and, thus, providing a stiffer configuration. The stiffness increment of the structure is confirmed in the resonant frequency shifting towards higher frequencies. For the local resonances identified during random tests,
Table 2 shows the frequencies corresponding to both states.
Shapes, shown in
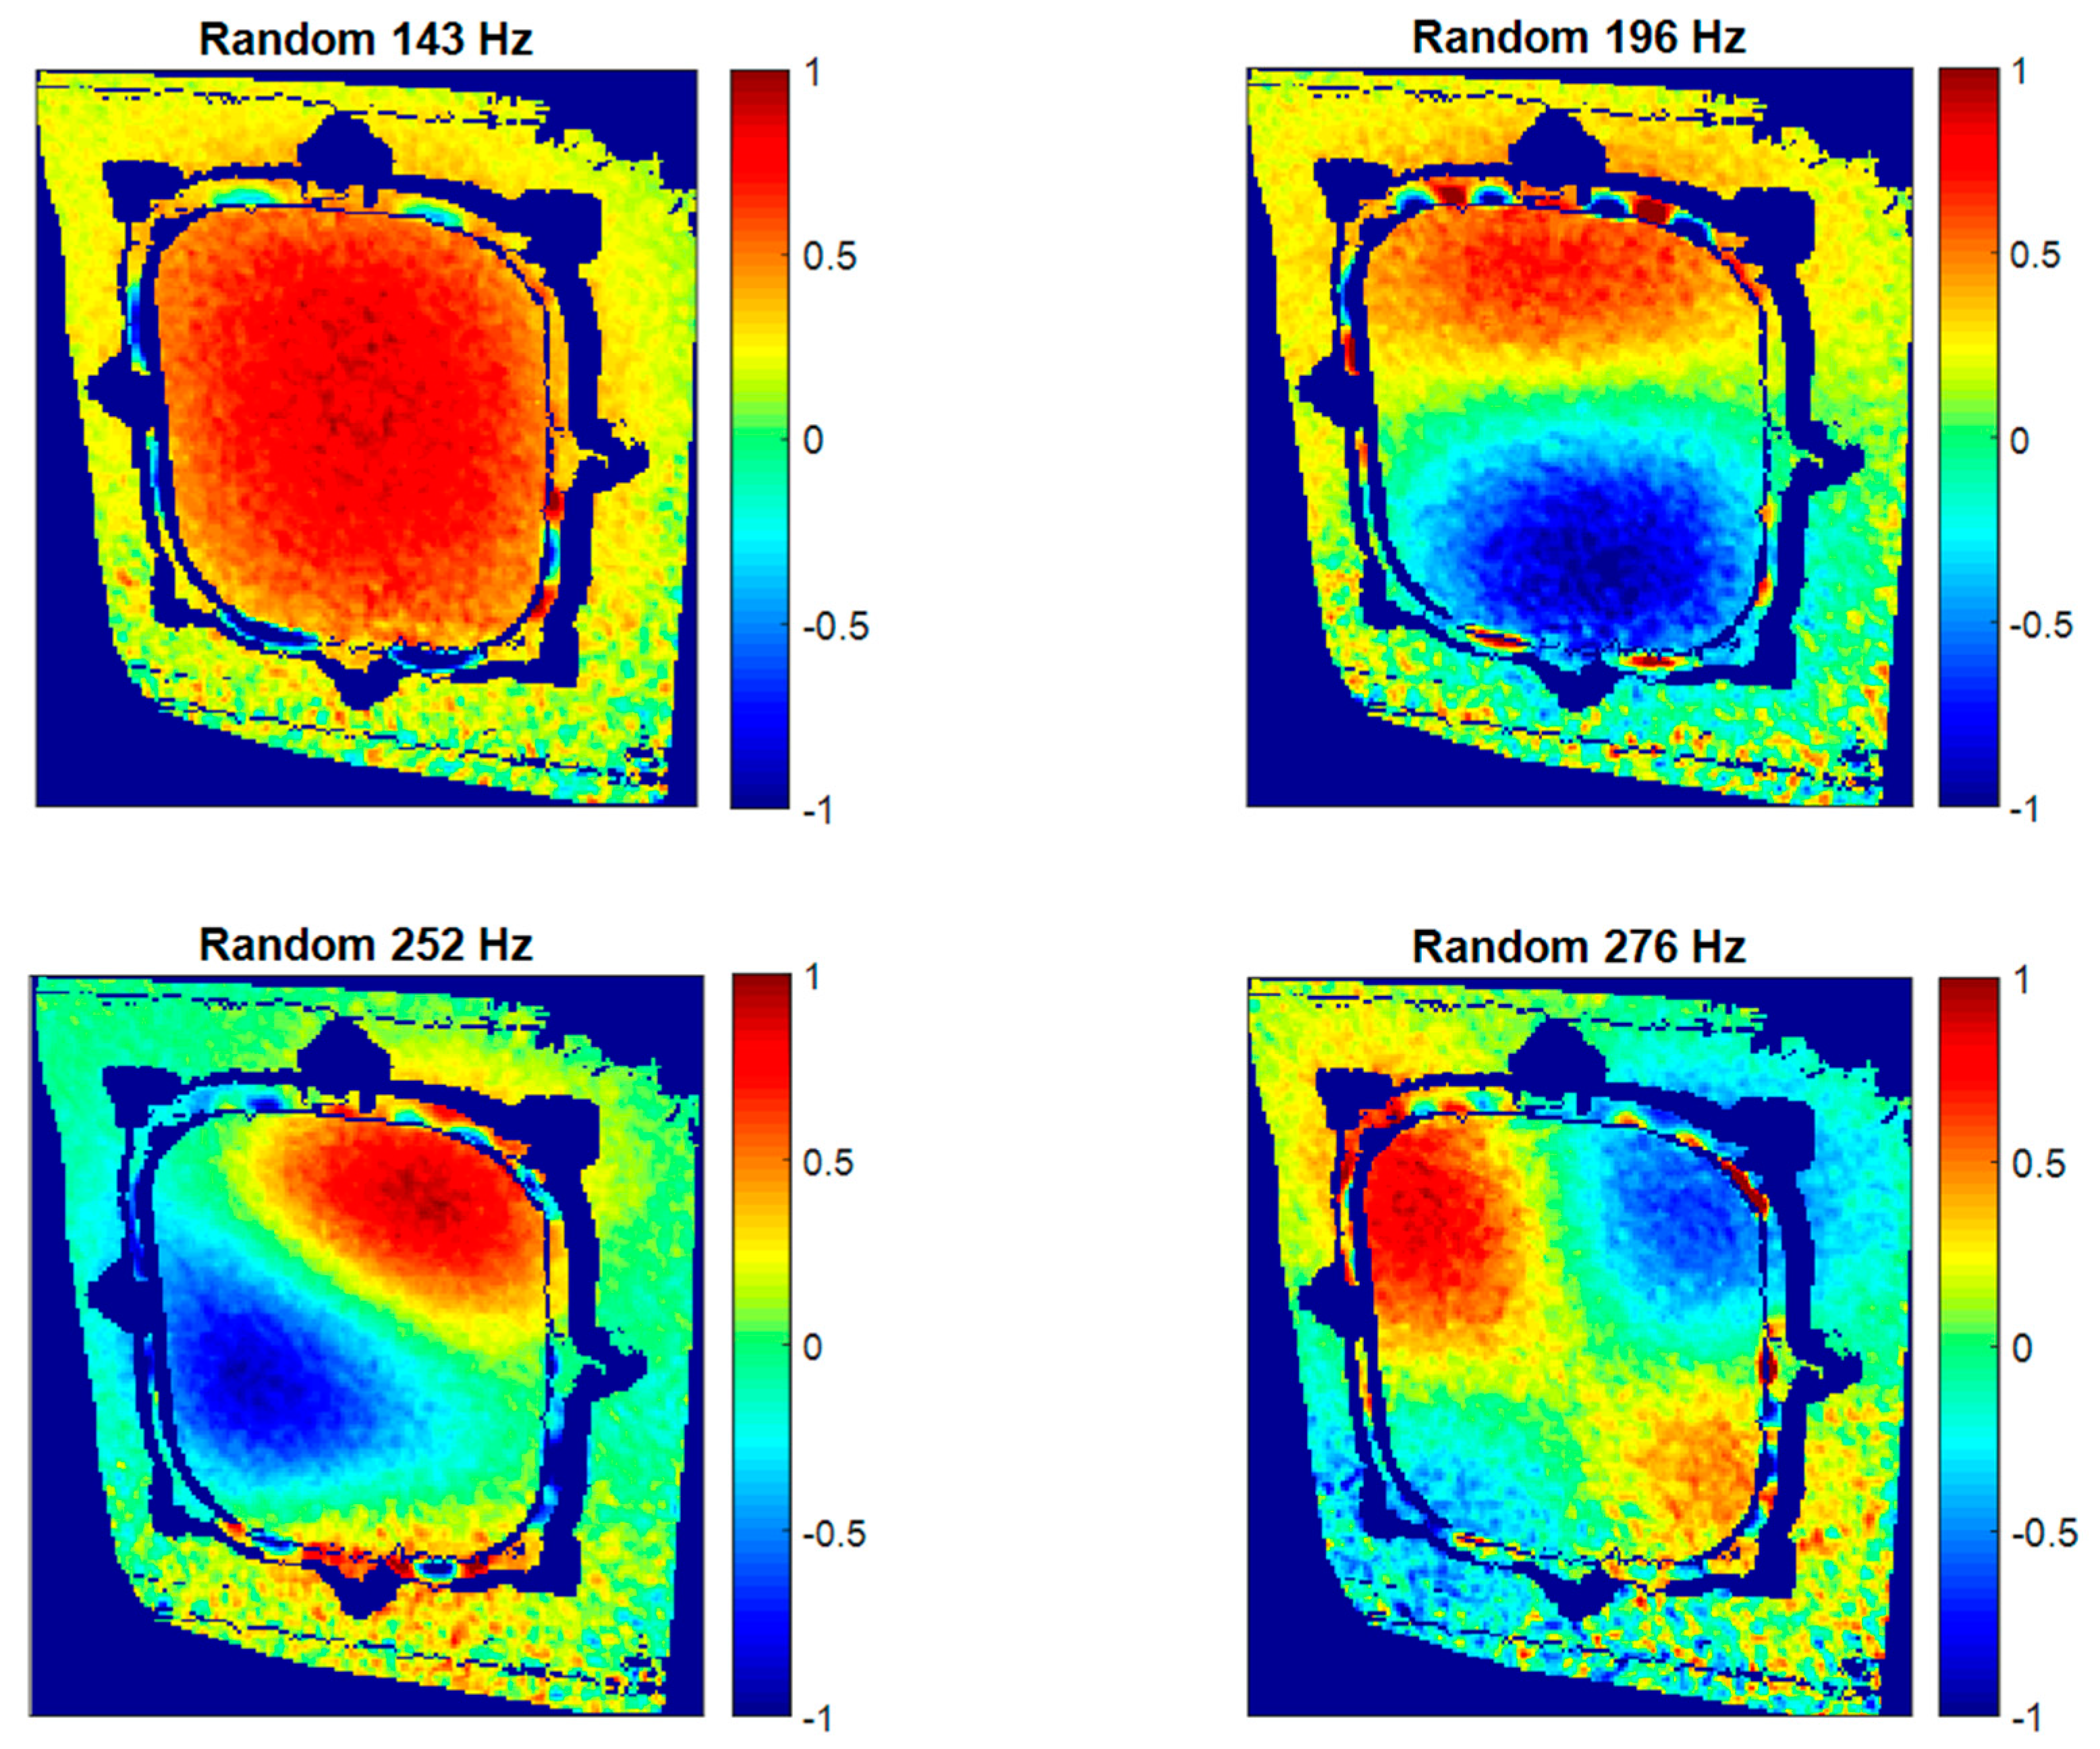
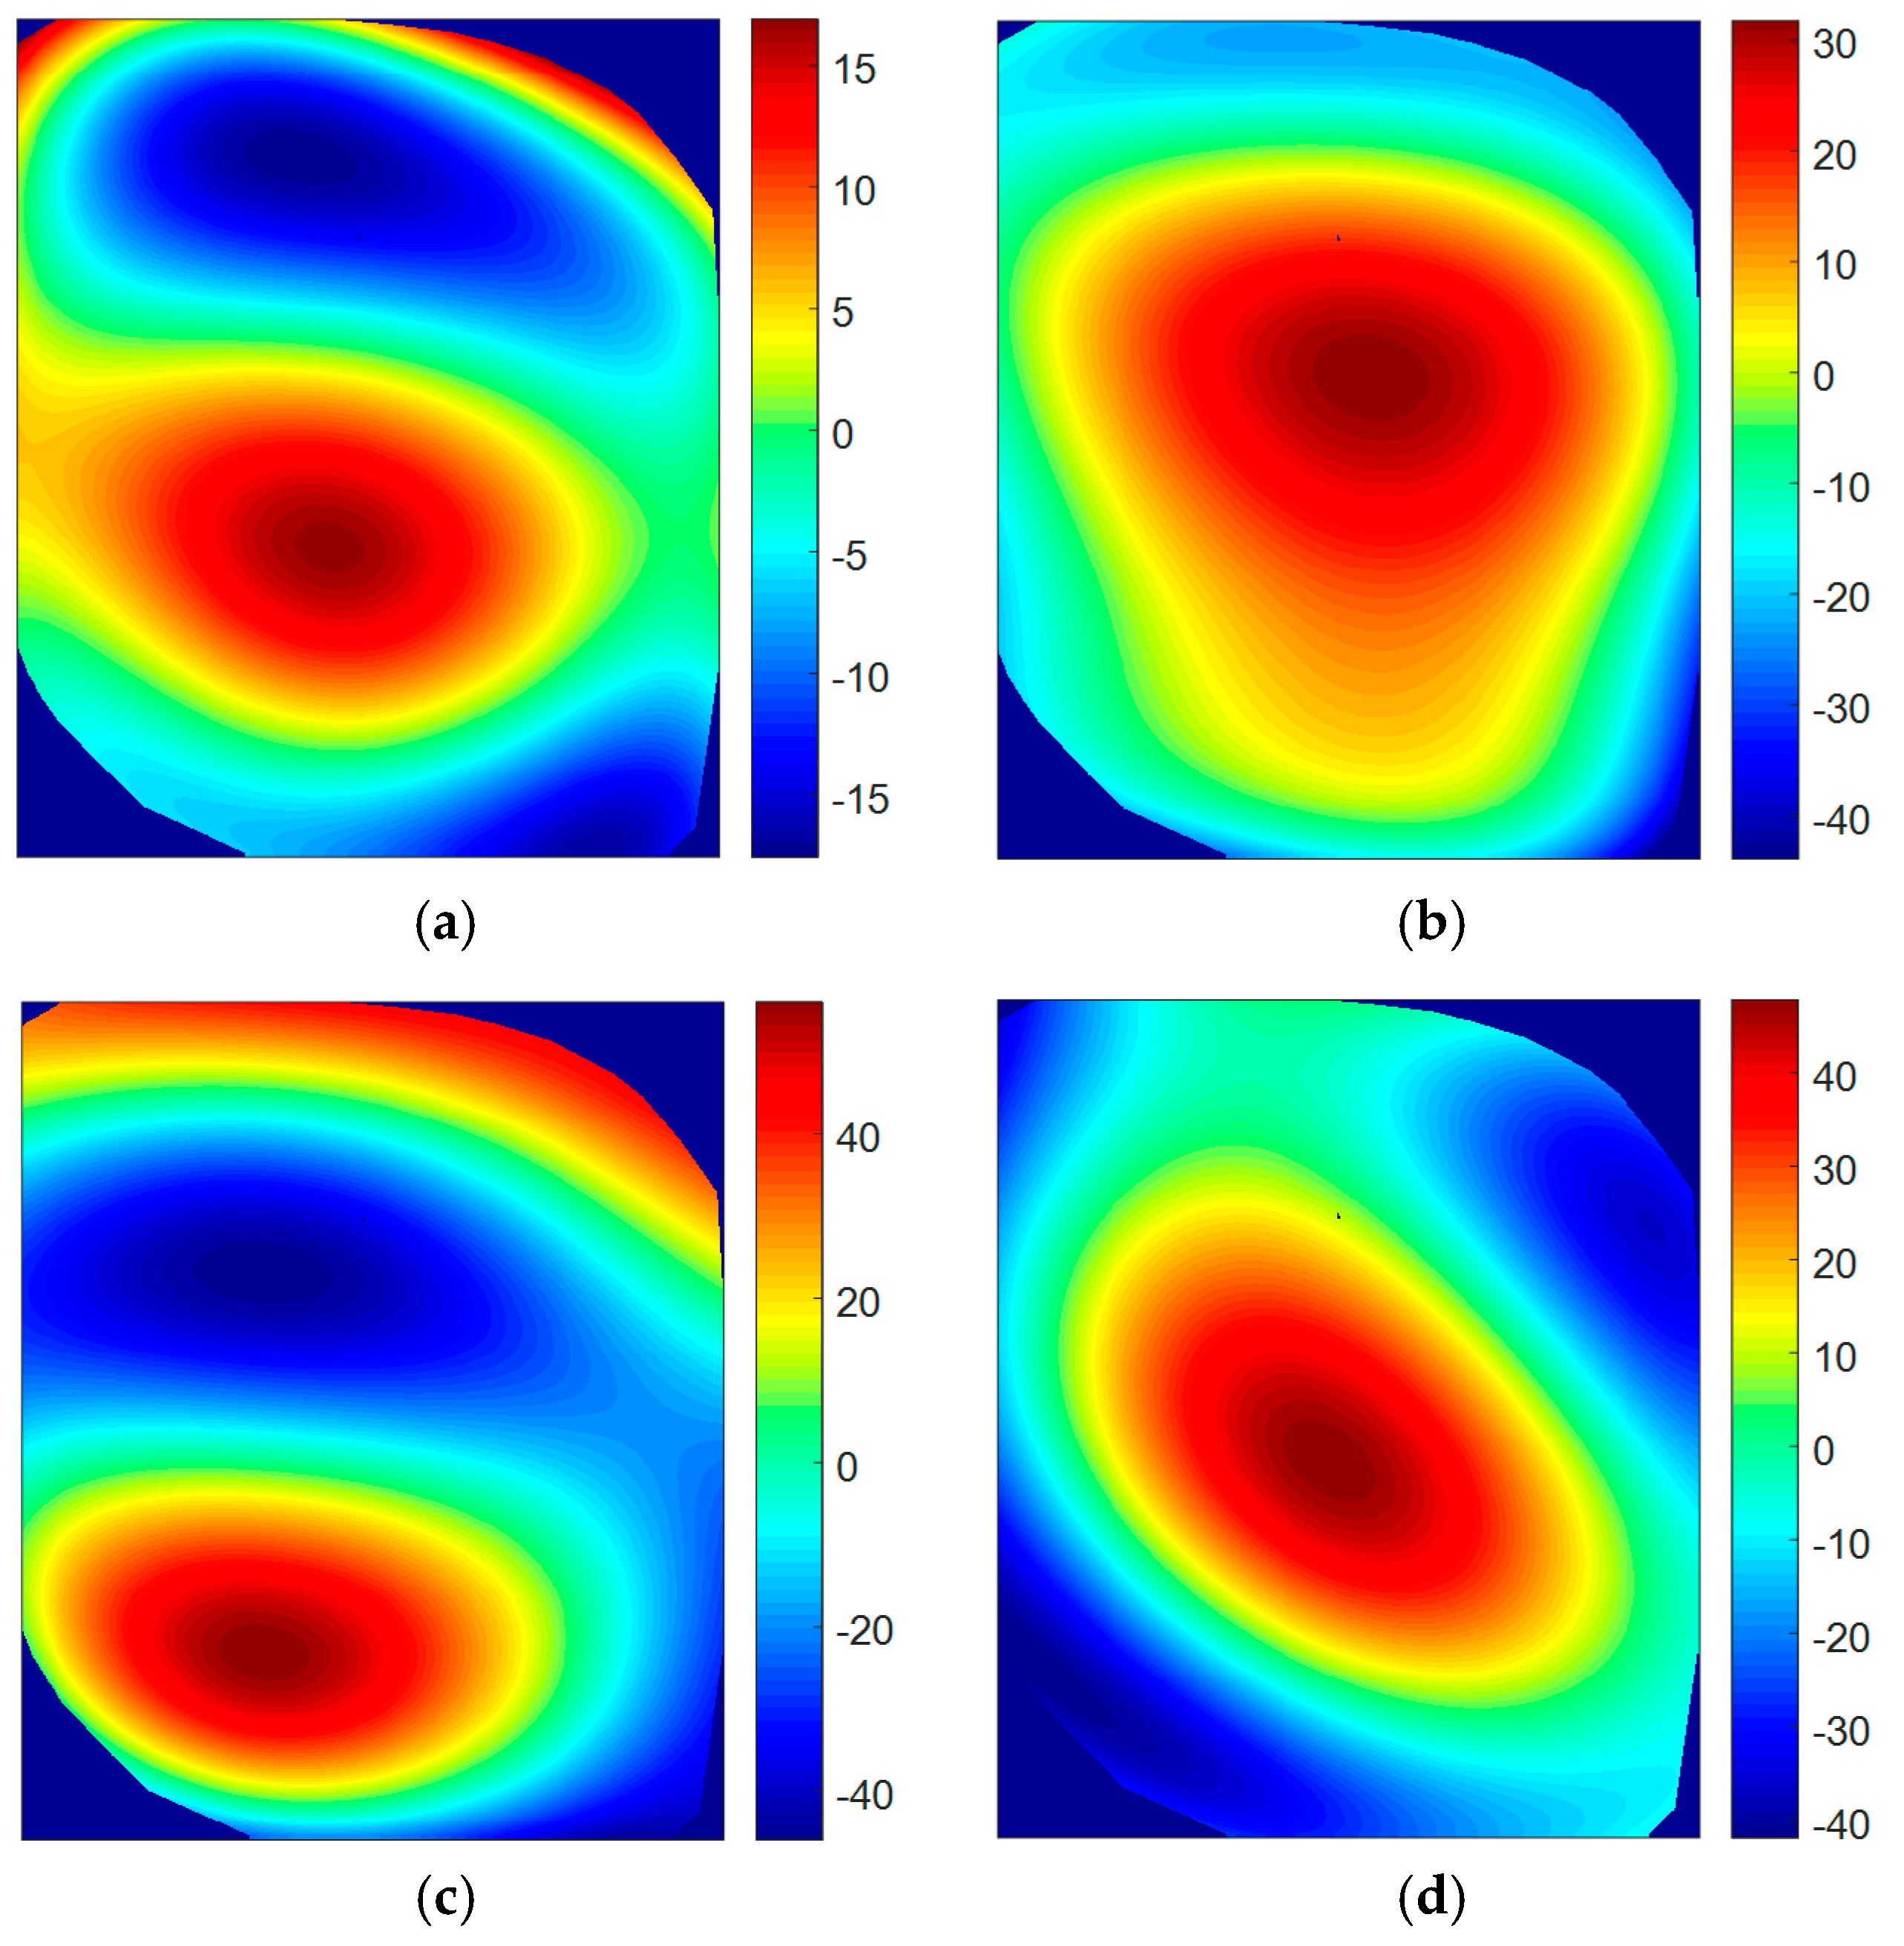
Figure 16, confirm the correspondence of the modes with respect to non-pressurized results, although slight differences are noticed. These differences are evaluated looking at the variations in the shape descriptors for every mode obtained by the image decomposition method. In this case, differences were visualized by reconstructing the corresponding difference vectors for Mode 1, 2, 3, and 4. These were obtained by subtracting the feature vectors that describe the non-pressurized and pressurized states. Results of these differences are presented as percentages in
Figure 17, considering the non-pressurized state as a reference. The first three shape descriptors were omitted since they represent rigid body translation and rotation [
22]. Hence, the focus was placed on the local deformation of the window. A common behavior is noticed in the ODSs. Maximum positive difference is located in the center of the window, where maximum static deformation due to pressure was found. This means that this region experienced more deformation with no differential pressure. Thus, the correlation between variations in ODSs and the pressure deformation is shown. This phenomenon is not detected in the third mode (
Figure 17c) as a consequence of the non-symmetry of the shape. Considering that the shape of the first resonance is similar to the deformation due to differential pressure, the lowest differences are found in this ODS.
4.2. Specimen 2
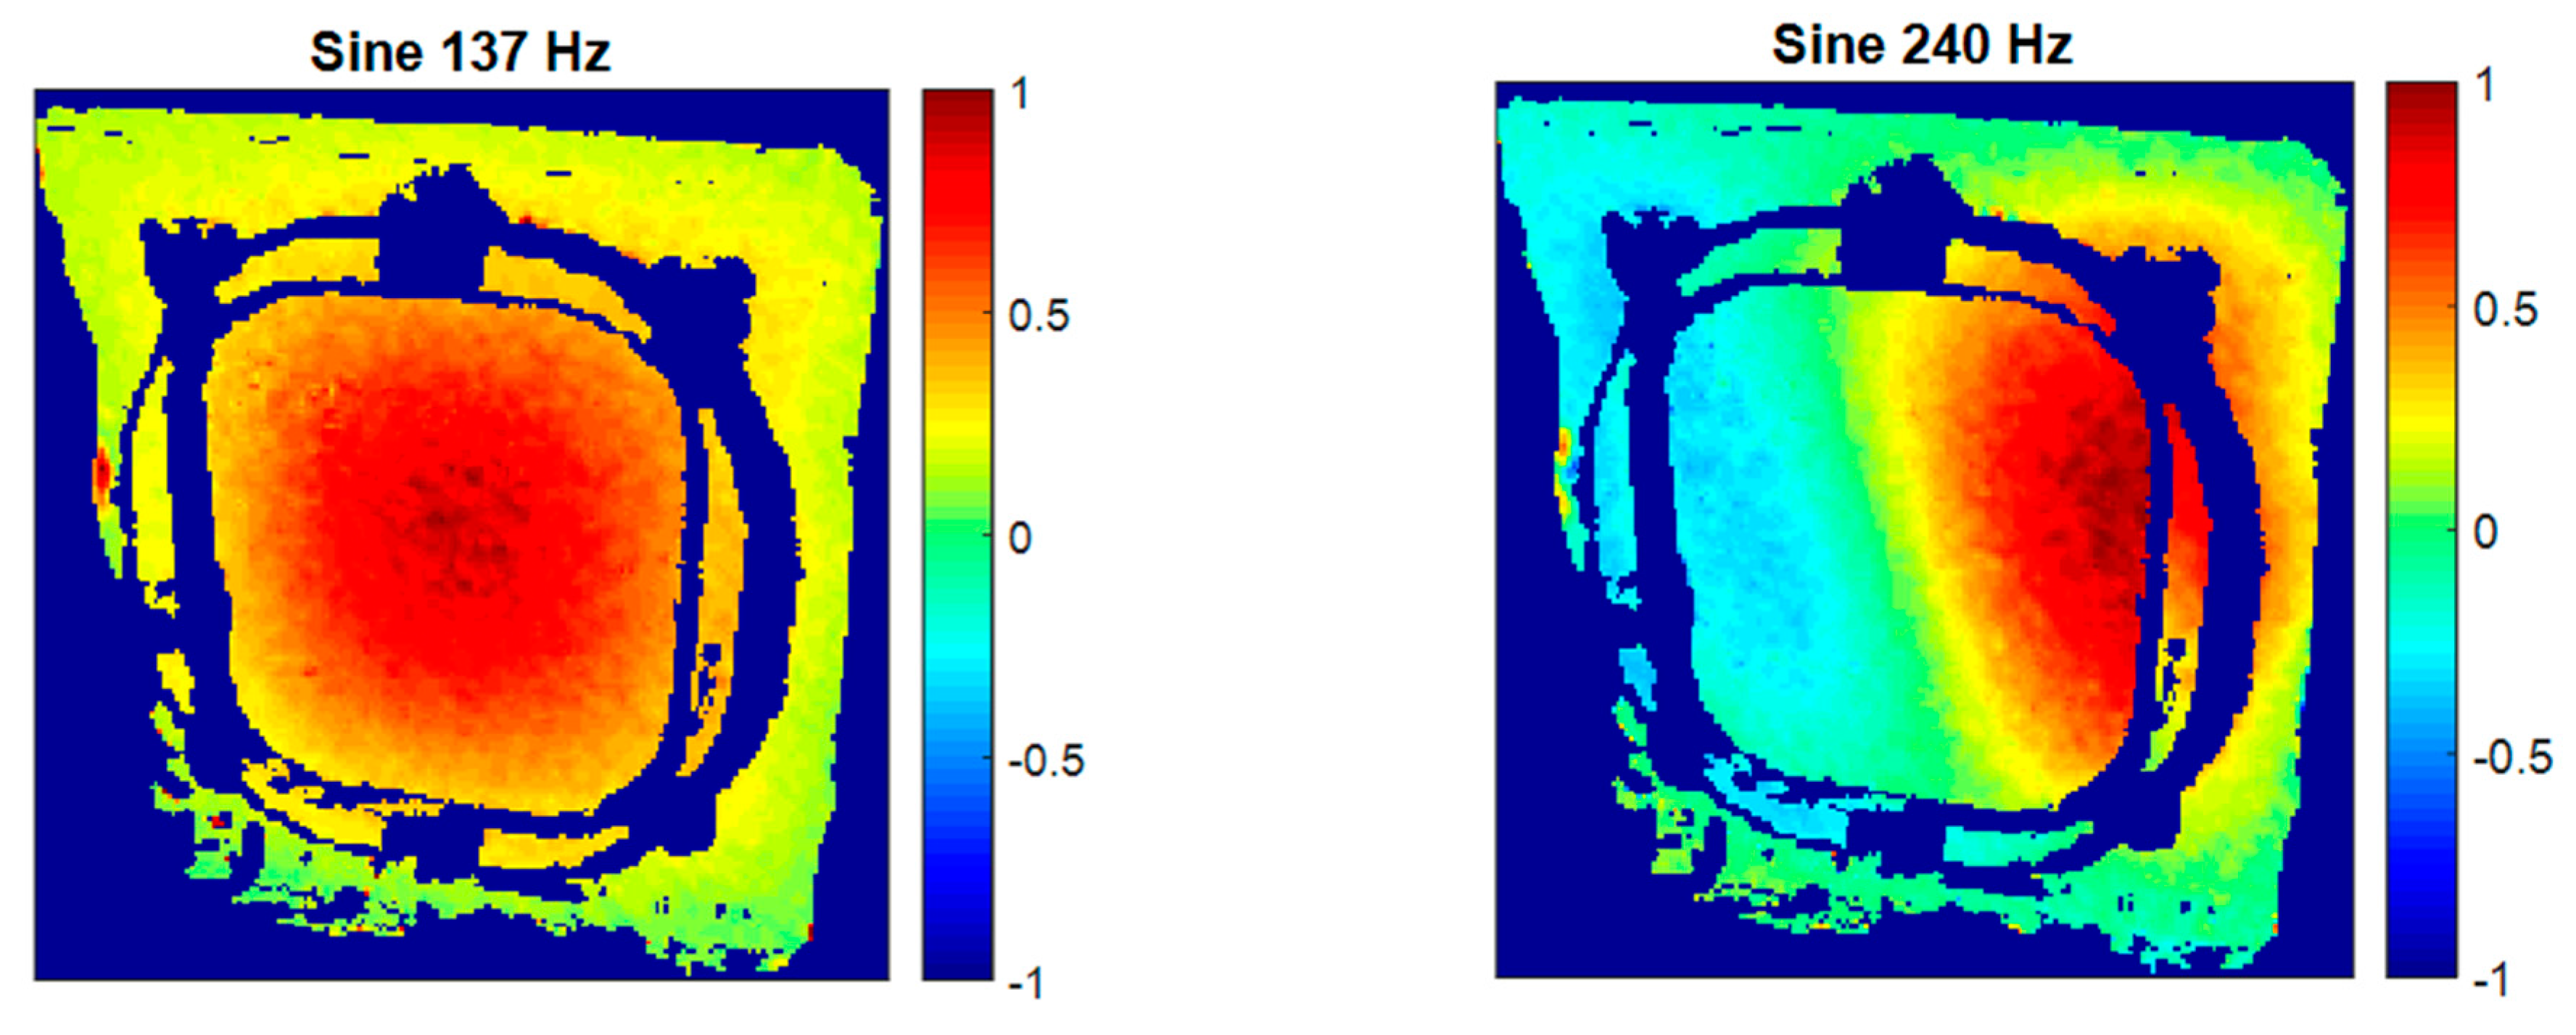
As a result of evaluating HS 3D-DIC measurements in the second specimen in a sine test at the previously-identified frequencies, two ODSs were characterized, shown in
Figure 18. As can be observed, the ODS at 137 Hz is equivalent to that in the first specimen at 124 Hz. However, the frequency is higher in this specimen as a consequence of an increment in the stiffness. The ODS at 240 Hz is exclusive of this specimen. As it can be seen, the window experiences positive displacements in the right side, and negative on the left, with zero displacement in the middle. This is, thus, a second-order mode. In comparison with the ODS measured at 214 Hz in specimen 1, this is a lower-order mode, but at a higher frequency. Consequently, resonances were shifted to higher frequencies with this specimen and stiffening is confirmed.
5. Conclusions
In the present paper a full-field methodology for modal identification of aircraft structures using HS 3D-DIC has been presented. Focus was placed on the local dynamic response of the passenger window area, namely, natural frequencies and full-field ODSs. Shape descriptor decomposition was employed to ease the managing and enhance the analysis of the full-field data.
Results presented in this document demonstrate the potential of HS 3D-DIC for different excitations, such as sine and random excitations. Sine excitation was less time-consuming when a low number of ODSs are required and provided less noisy results. However, previous knowledge of the natural frequencies is required. Conversely, random excitation allows the analysis of the behavior in a broad spectrum in a unique test. Full-field transfer functions from random tests allowed both the identification of resonances and the extraction of ODSs.
The effect of a local structural modification was evaluated at different cabin pressure conditions. Stiffening as a result of the pressure deformation was identified in the resonance shifting and in the variation of the ODSs. The analysis of this difference using shape descriptors decomposition showed a common trend related to the deformation due to differential pressure.
The methodology was also able to provide information about different specimens maintaining the optical set-up. Variations in the natural frequencies and in the mode shapes were detected. This information allows to experimentally evaluate the behavior attending to the design and materials with more detailed information than traditional sensor instrumentation.
This makes HS 3D-DIC interesting for contactless structural dynamic characterization of complex structures with no alteration of the behavior, and particularly for the purpose of comparison with numerical simulation. A window is mounted in a full-scale demonstrator, hence, all results correspond to the final behavior and the influence of the cabin deformation over the window behavior was reported.
Acknowledgments
Activities reported in this paper were developed in the frame of the European Community Seventh Framework Program, where Airbus Defence and Space S.A.U. was a partner of the Clean Sky Green Regional Aircraft Integrated Technology Demonstrator. The University of Jaén (Spain) participated under contract with Airbus Defence and Space S.A.U. in the field of testing technologies.
Author Contributions
Francisco A. Díaz organized the research and wrote the final version of the manuscript; Ángel Jesús Molina-Viedma, Luis Felipe-Sesé, and Elías López-Alba performed the tests, processed the data, and wrote the first version of the manuscript. Finally, Javier Rodríguez-Ahlquist and Manuel Iglesias-Vallejo made it possible to perform these tests on the real demonstrator rig and revised the final version of the manuscript. All authors approved the manuscript.
Conflicts of Interest
The authors declare no conflict of interest.
References
- Wright, R.I.; Kidner, M.R.F. Vibration Absorbers: A Review of Applications in Interior Noise Control of Propeller Aircraft. J. Vib. Control 2004, 10, 1221–1237. [Google Scholar] [CrossRef]
- Haase, T.; Unruh, O.; Algermissen, S.; Pohl, M. Active control of counter-rotating open rotor interior noise in a Dornier 728 experimental aircraft. J. Sound Vib. 2016, 376, 18–32. [Google Scholar] [CrossRef]
- Yan, Y.; Li, P.; Lin, H. Analysis and experimental validation of the middle-frequency vibro-acoustic coupling property for aircraft structural model based on the wave coupling hybrid FE-SEA method. J. Sound Vib. 2016, 371, 227–236. [Google Scholar] [CrossRef]
- Ewins, D.J. Modal Testing: Theory, Practice, and Application, 2nd ed.; Roberts, J.B., Ed.; Research Studies Press LTD: Baldock, UK, 2000; ISBN 978-0863802188. [Google Scholar]
- Stanbridge, A.B.; Ewins, D.J. Modal testing using a scanning laser doppler vibrometer. Mech. Syst. Signal Process. 1999, 13, 255–270. [Google Scholar] [CrossRef]
- Stanbridge, A.B.; Martarelli, M.; Ewins, D.J. Measuring area vibration mode shapes with a continuous-scan LDV. Meas. J. Int. Meas. Confed. 2004, 35, 181–189. [Google Scholar] [CrossRef]
- O’Malley, P.; Woods, T.; Judge, J.; Vignola, J. Five-axis scanning laser vibrometry for three-dimensional measurements of non-planar surfaces. Meas. Sci. Technol. 2009, 20, 115901. [Google Scholar] [CrossRef]
- Bertini, L.; Monelli, B.; Neri, P.; Santus, C.; Guglielmo, A. Robot Assisted Modal Analysis on a Stationary Bladed Wheel. In Dynamics, Vibration and Control; Energy; Fluids Engineering; Micro and Nano Manufacturing; ASME: Copenhagen, Denmark, 2014; Volume 2, p. V002T07A033. [Google Scholar]
- Bertini, L.; Neri, P.; Santus, C.; Guglielmo, A. Automated Experimental Modal Analysis of Bladed Wheels with an Anthropomorphic Robotic Station. Exp. Mech. 2017, 57, 273–285. [Google Scholar] [CrossRef]
- Schreier, H.; Orteu, J.-J.; Sutton, M.A. Image Correlation for Shape, Motion and Deformation Measurements; Springer: Boston, MA, USA, 2009; ISBN 978-0-387-78746-6. [Google Scholar]
- Helfrick, M.N.; Niezrecki, C.; Avitabile, P.; Schmidt, T. 3D digital image correlation methods for full-field vibration measurement. Mech. Syst. Signal Process. 2010, 25, 917–927. [Google Scholar] [CrossRef]
- Warren, C.; Niezrecki, C.; Avitabile, P.; Pingle, P. Comparison of FRF measurements and mode shapes determined using optically image based, laser, and accelerometer measurements. Mech. Syst. Signal Process. 2011, 25, 2191–2202. [Google Scholar] [CrossRef]
- Reu, P.L.; Rohe, D.P.; Jacobs, L.D. Comparison of DIC and LDV for practical vibration and modal measurements. Mech. Syst. Signal Process. 2017, 86, 2–16. [Google Scholar] [CrossRef]
- Ha, N.S.; Jin, T.; Goo, N.S. Modal analysis of an artificial wing mimicking an Allomyrina dichotoma beetle’s hind wing for flapping-wing micro air vehicles by noncontact measurement techniques. Opt. Lasers Eng. 2013, 51, 560–570. [Google Scholar] [CrossRef]
- Baqersad, J.; Carr, J.; Lundstrom, T.; Niezrecki, C.; Avitabile, P.; Slattery, M. Dynamic characteristics of a wind turbine blade using 3D digital image correlation. In Proceedings of SPIE; Kundu, T., Ed.; SPIE: Bellingham, WA, USA, 2012; Volume 8348, p. 83482I. [Google Scholar]
- Siebert, T.; Becker, T.; Spiltthof, K.; Neumann, I.; Krupka, R. High-speed digital image correlation: Error estimations and applications. Opt. Eng. 2007, 46, 51004. [Google Scholar] [CrossRef]
- Wang, W.; Mottershead, J.E.; Ihle, A.; Siebert, T.; Reinhard Schubach, H. Finite element model updating from full-field vibration measurement using digital image correlation. J. Sound Vib. 2011, 330, 1599–1620. [Google Scholar] [CrossRef]
- Felipe-Sesé, L.; Díaz, F.A. Damage methodology approach on a composite panel based on a combination of Fringe Projection and 2D Digital Image Correlation. Mech. Syst. Signal Process. 2018, 101, 467–479. [Google Scholar] [CrossRef]
- Siebert, T.; Wood, R.; Splitthof, K. High speed image correlation for vibration analysis. J. Phys. Conf. Ser. 2009, 181, 12064. [Google Scholar] [CrossRef]
- Ehrhardt, D.A.; Allen, M.S.; Yang, S.; Beberniss, T.J. Full-field linear and nonlinear measurements using Continuous-Scan Laser Doppler Vibrometry and high speed Three-Dimensional Digital Image Correlation. Mech. Syst. Signal Process. 2017, 86, 82–97. [Google Scholar] [CrossRef]
- Molina-Viedma, A.J.; Felipe-Sesé, L.; López-Alba, E.; Díaz, F. High frequency mode shapes characterisation using Digital Image Correlation and phase-based motion magnification. Mech. Syst. Signal Process. 2018, 102, 245–261. [Google Scholar] [CrossRef]
- Berke, R.B.; Sebastian, C.M.; Chona, R.; Patterson, E.A.; Lambros, J. High Temperature Vibratory Response of Hastelloy-X: Stereo-DIC Measurements and Image Decomposition Analysis. Exp. Mech. 2015, 56, 231–243. [Google Scholar] [CrossRef]
- Barone, S.; Neri, P.; Paoli, A.; Razionale, A. Digital Image Correlation Based on Projected Pattern for High Frequency Vibration Measurements. Procedia Manuf. 2017, 11, 1592–1599. [Google Scholar] [CrossRef]
- Trebuňa, F.; Hagara, M. Experimental modal analysis performed by high-speed digital image correlation system. Measurement 2014, 50, 78–85. [Google Scholar] [CrossRef]
- Wang, W.; Mottershead, J.E.; Siebert, T.; Pipino, A. Frequency response functions of shape features from full-field vibration measurements using digital image correlation. Mech. Syst. Signal Process. 2012, 28, 333–347. [Google Scholar] [CrossRef]
- Beberniss, T.J.; Ehrhardt, D.A. High-speed 3D digital image correlation vibration measurement: Recent advancements and noted limitations. Mech. Syst. Signal Process. 2017, 86, 35–48. [Google Scholar] [CrossRef]
- Molina-Viedma, Á.J.; López-Alba, E.; Felipe-Sesé, L.; Díaz, F.A. Full-field modal analysis during base motion excitation using high-speed 3D digital image correlation. Meas. Sci. Technol. 2017, 28, 105402. [Google Scholar] [CrossRef]
- Ha, N.S.; Vang, H.M.; Goo, N.S. Modal Analysis Using Digital Image Correlation Technique: An Application to Artificial Wing Mimicking Beetle’s Hind Wing. Exp. Mech. 2015, 989–998. [Google Scholar] [CrossRef]
- Rizo-Patron, S.; Sirohi, J. Operational Modal Analysis of a Helicopter Rotor Blade Using Digital Image Correlation. Exp. Mech. 2017, 57, 367–375. [Google Scholar] [CrossRef]
- Huňady, R.; Hagara, M. A new procedure of modal parameter estimation for high-speed digital image correlation. Mech. Syst. Signal Process. 2017, 93, 66–79. [Google Scholar] [CrossRef]
- Yu, L.; Pan, B. Single-camera high-speed stereo-digital image correlation for full-field vibration measurement. Mech. Syst. Signal Process. 2017, 94, 374–383. [Google Scholar] [CrossRef]
- Wang, W.; Mottershead, J.E.; Mares, C. Vibration mode shape recognition using image processing. J. Sound Vib. 2009, 326, 909–938. [Google Scholar] [CrossRef]
- Wang, W.; Mottershead, J.E.; Mares, C. Mode-shape recognition and finite element model updating using the Zernike moment descriptor. Mech. Syst. Signal Process. 2009, 23, 2088–2112. [Google Scholar] [CrossRef]
- Validation of Numerical Engineering Simulations: Standardisation Actions (VANESSA). European FP7 Project Grant Agreement No. NMP3-SA-2012-319116. Available online: http://www.engineeringvalidation.org/ (accessed on 1 November 2017).
- Lampeas, G.; Pasialis, V.; Lin, X.; Patterson, E.A. On the validation of solid mechanics models using optical measurements and data decomposition. Simul. Model. Pract. Theory 2015, 52, 92–107. [Google Scholar] [CrossRef]
- Wang, W.; Mottershead, J.E.; Sebastian, C.M.; Patterson, E.A. Shape features and finite element model updating from full-field strain data. Int. J. Solids Struct. 2011, 48, 1644–1657. [Google Scholar] [CrossRef]
- Sebastian, C.; Hack, E.; Patterson, E. An approach to the validation of computational solid mechanics models for strain analysis. J. Strain Anal. Eng. Des. 2013, 48, 36–47. [Google Scholar] [CrossRef]
- Molina-Viedma, A.; López-Alba, E.; Felipe-Sesé, L.; Díaz, F.; Rodríguez-Ahlquist, J.; Iglesias-Vallejo, M. A non-invasive methodology for modal characterisation of an aircraft cabin using high speed 3D digital image correlation. In Proceedings of the 24th International Congress on Sound and Vibration (ICSV 2017), London, UK, 23–27 July 2017. [Google Scholar]
- Lecompte, D.; Smits, A.; Bossuyt, S.; Sol, H.; Vantomme, J.; Van Hemelrijck, D.; Habraken, A.M. Quality assessment of speckle patterns for digital image correlation. Opt. Lasers Eng. 2006, 44, 1132–1145. [Google Scholar] [CrossRef]
- Sutton, M.A.; Yan, J.H.; Tiwari, V.; Schreier, H.W.; Orteu, J.J. The effect of out-of-plane motion on 2D and 3D digital image correlation measurements. Opt. Lasers Eng. 2008, 46, 746–757. [Google Scholar] [CrossRef]
- Chen, F.; Chen, X.; Xie, X.; Feng, X.; Yang, L. Full-field 3D measurement using multi-camera digital image correlation system. Opt. Lasers Eng. 2013, 51, 1044–1052. [Google Scholar] [CrossRef]
- Tang, Z.; Liang, J.; Xiao, Z.; Guo, C. Large deformation measurement scheme for 3D digital image correlation method. Opt. Lasers Eng. 2012, 50, 122–130. [Google Scholar] [CrossRef]
- Rao, K.R.; Kim, D.N.; Hwang, J.J. Fast Fourier Transform—Algorithms and Applications; Signals and Communication Technology; Springer: Dordrecht, The Netherlands, 2010; ISBN 978-1-4020-6628-3. [Google Scholar]
Figure 1.
Clean Sky/Green Regional Aircraft MT2 cockpit demonstrator (a) and test rig (b) developed by Airbus Defence and Space.
Figure 1.
Clean Sky/Green Regional Aircraft MT2 cockpit demonstrator (a) and test rig (b) developed by Airbus Defence and Space.
Figure 2.
Displacement of a facet from a reference image to a strained image using DIC.
Figure 2.
Displacement of a facet from a reference image to a strained image using DIC.
Figure 3.
An example of a random speckle pattern.
Figure 3.
An example of a random speckle pattern.
Figure 4.
Calibration parameters in stereoscopic DIC system.
Figure 4.
Calibration parameters in stereoscopic DIC system.
Figure 5.
Set-up for impact hammer tests on the passenger window of the GRA front fuselage demonstrator (exterior view).
Figure 5.
Set-up for impact hammer tests on the passenger window of the GRA front fuselage demonstrator (exterior view).
Figure 6.
Two principal response functions from impact hammer tests of specimen 1.
Figure 6.
Two principal response functions from impact hammer tests of specimen 1.
Figure 7.
Two principal response functions from impact hammer tests of specimen 2.
Figure 7.
Two principal response functions from impact hammer tests of specimen 2.
Figure 8.
Lateral shaker excitation.
Figure 8.
Lateral shaker excitation.
Figure 9.
(a) Optical system on the supporting bar; (b) supporting bar attachment to the bulkhead; and (c) model of the global cockpit demonstrator configuration.
Figure 9.
(a) Optical system on the supporting bar; (b) supporting bar attachment to the bulkhead; and (c) model of the global cockpit demonstrator configuration.
Figure 10.
Images of the window from the cameras point of view. (a) Left-hand camera; and (b) right-hand camera. Dotted lines represent the area analyzed using shape descriptor image decomposition; (c) sample of the facets grid.
Figure 10.
Images of the window from the cameras point of view. (a) Left-hand camera; and (b) right-hand camera. Dotted lines represent the area analyzed using shape descriptor image decomposition; (c) sample of the facets grid.
Figure 11.
Evolution of the correlation coefficient between original and reconstructed displacement contours of specimen 1 as a function of the shape descriptors employed.
Figure 11.
Evolution of the correlation coefficient between original and reconstructed displacement contours of specimen 1 as a function of the shape descriptors employed.
Figure 12.
Transfer function of a point from the center of the window using HS 3D-DIC.
Figure 12.
Transfer function of a point from the center of the window using HS 3D-DIC.
Figure 13.
Normalized operational deflection shapes in the out-of-plane direction obtained using HS 3D-DIC under different excitation configurations.
Figure 13.
Normalized operational deflection shapes in the out-of-plane direction obtained using HS 3D-DIC under different excitation configurations.
Figure 14.
Additional normalized ODSs in the out-of-plane direction detected using HS 3D-DIC and random excitation.
Figure 14.
Additional normalized ODSs in the out-of-plane direction detected using HS 3D-DIC and random excitation.
Figure 15.
Static out-of-plane deformation (mm) of the window frame under differential pressure.
Figure 15.
Static out-of-plane deformation (mm) of the window frame under differential pressure.
Figure 16.
Normalized ODSs in the out-of-plane direction obtained using HS 3D-DIC in a random excitation test under differential pressure.
Figure 16.
Normalized ODSs in the out-of-plane direction obtained using HS 3D-DIC in a random excitation test under differential pressure.
Figure 17.
Reconstruction of the percentage differences between shape descriptors representing both ODSs in non-pressurized and pressurized states. (a) Mode 1; (b) Mode 2; (c) Mode 3; and (d) Mode 4.
Figure 17.
Reconstruction of the percentage differences between shape descriptors representing both ODSs in non-pressurized and pressurized states. (a) Mode 1; (b) Mode 2; (c) Mode 3; and (d) Mode 4.
Figure 18.
Operational deflection shapes of the second window specimen obtained using HS 3D-DIC in a sine test.
Figure 18.
Operational deflection shapes of the second window specimen obtained using HS 3D-DIC in a sine test.
Table 1.
Summary of the test configurations.
Table 1.
Summary of the test configurations.
| Excitation | Sensor | Specimens | Environment | Results |
|---|
| Impact | Accelerometers | 1 and 2 | Ambient | Natural frequencies |
| Sine | HS 3D-DIC | 1 and 2 | Ambient | ODSs |
| Random | HS 3D-DIC | 1 | Ambient and differential pressure | Natural frequencies and ODSs |
Table 2.
Frequency shifting of the resonances identified in both pressurized states in specimen 1.
Table 2.
Frequency shifting of the resonances identified in both pressurized states in specimen 1.
| Mode Denomination | Non-Pressurized (Hz) | Differential Pressure (Hz) |
|---|
| 1 | 124 | 148 |
| 2 | 155 | 196 |
| 3 | 215 | 252 |
| 4 | 267 | 276 |
© 2018 by the authors. Licensee MDPI, Basel, Switzerland. This article is an open access article distributed under the terms and conditions of the Creative Commons Attribution (CC BY) license (http://creativecommons.org/licenses/by/4.0/).

 ,
, 


