Author Contributions
Conceptualization, Y.C. and W.W.; Methodology, W.W. and J.T.; Validation, Y.C., J.T. and G.M.; Formal Analysis, M.X., X.X. and S.W.; Investigation, W.W., J.T. and S.W.; Writing-Original Draft Preparation, W.W.; Writing-Review & Editing, Y.C., M.X. and X.X.; Project Administration, Y.C.; Funding Acquisition, Y.C.
Figure 1.
Samples of asphalt mixture and mortar: (a) Beam samples; and, (b) Cylindrical samples.
Figure 1.
Samples of asphalt mixture and mortar: (a) Beam samples; and, (b) Cylindrical samples.
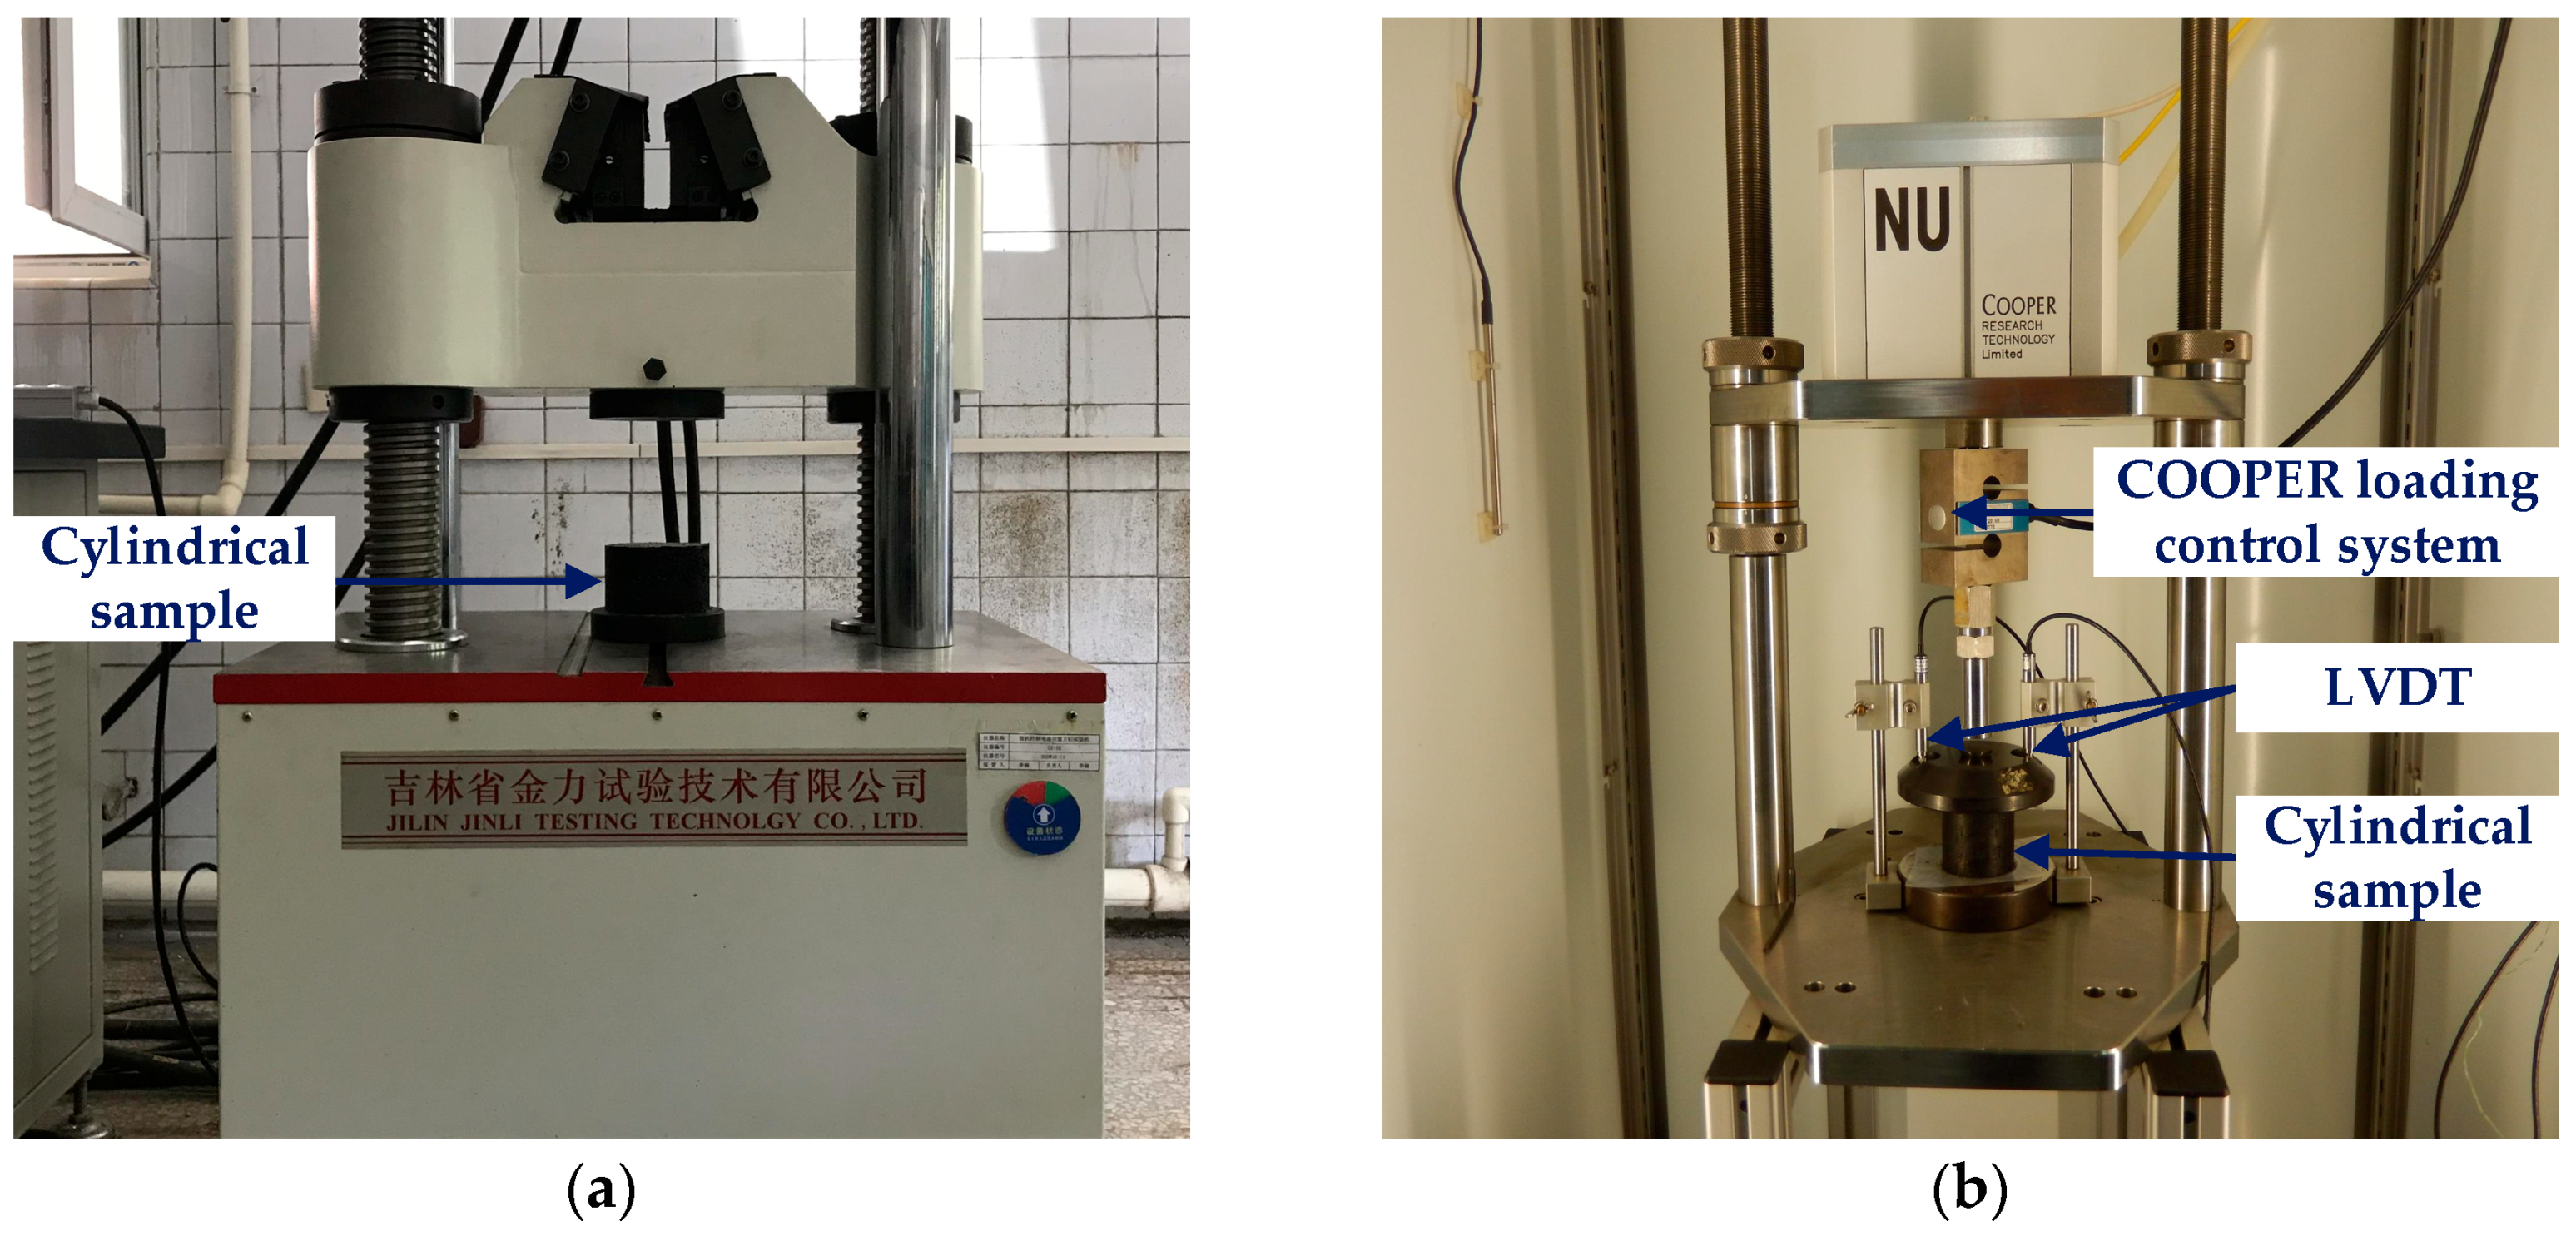
Figure 2.
High-temperature viscoelastic property tests: (a) Uniaxial compression failure test; and, (b) Uniaxial compression static creep test.
Figure 2.
High-temperature viscoelastic property tests: (a) Uniaxial compression failure test; and, (b) Uniaxial compression static creep test.
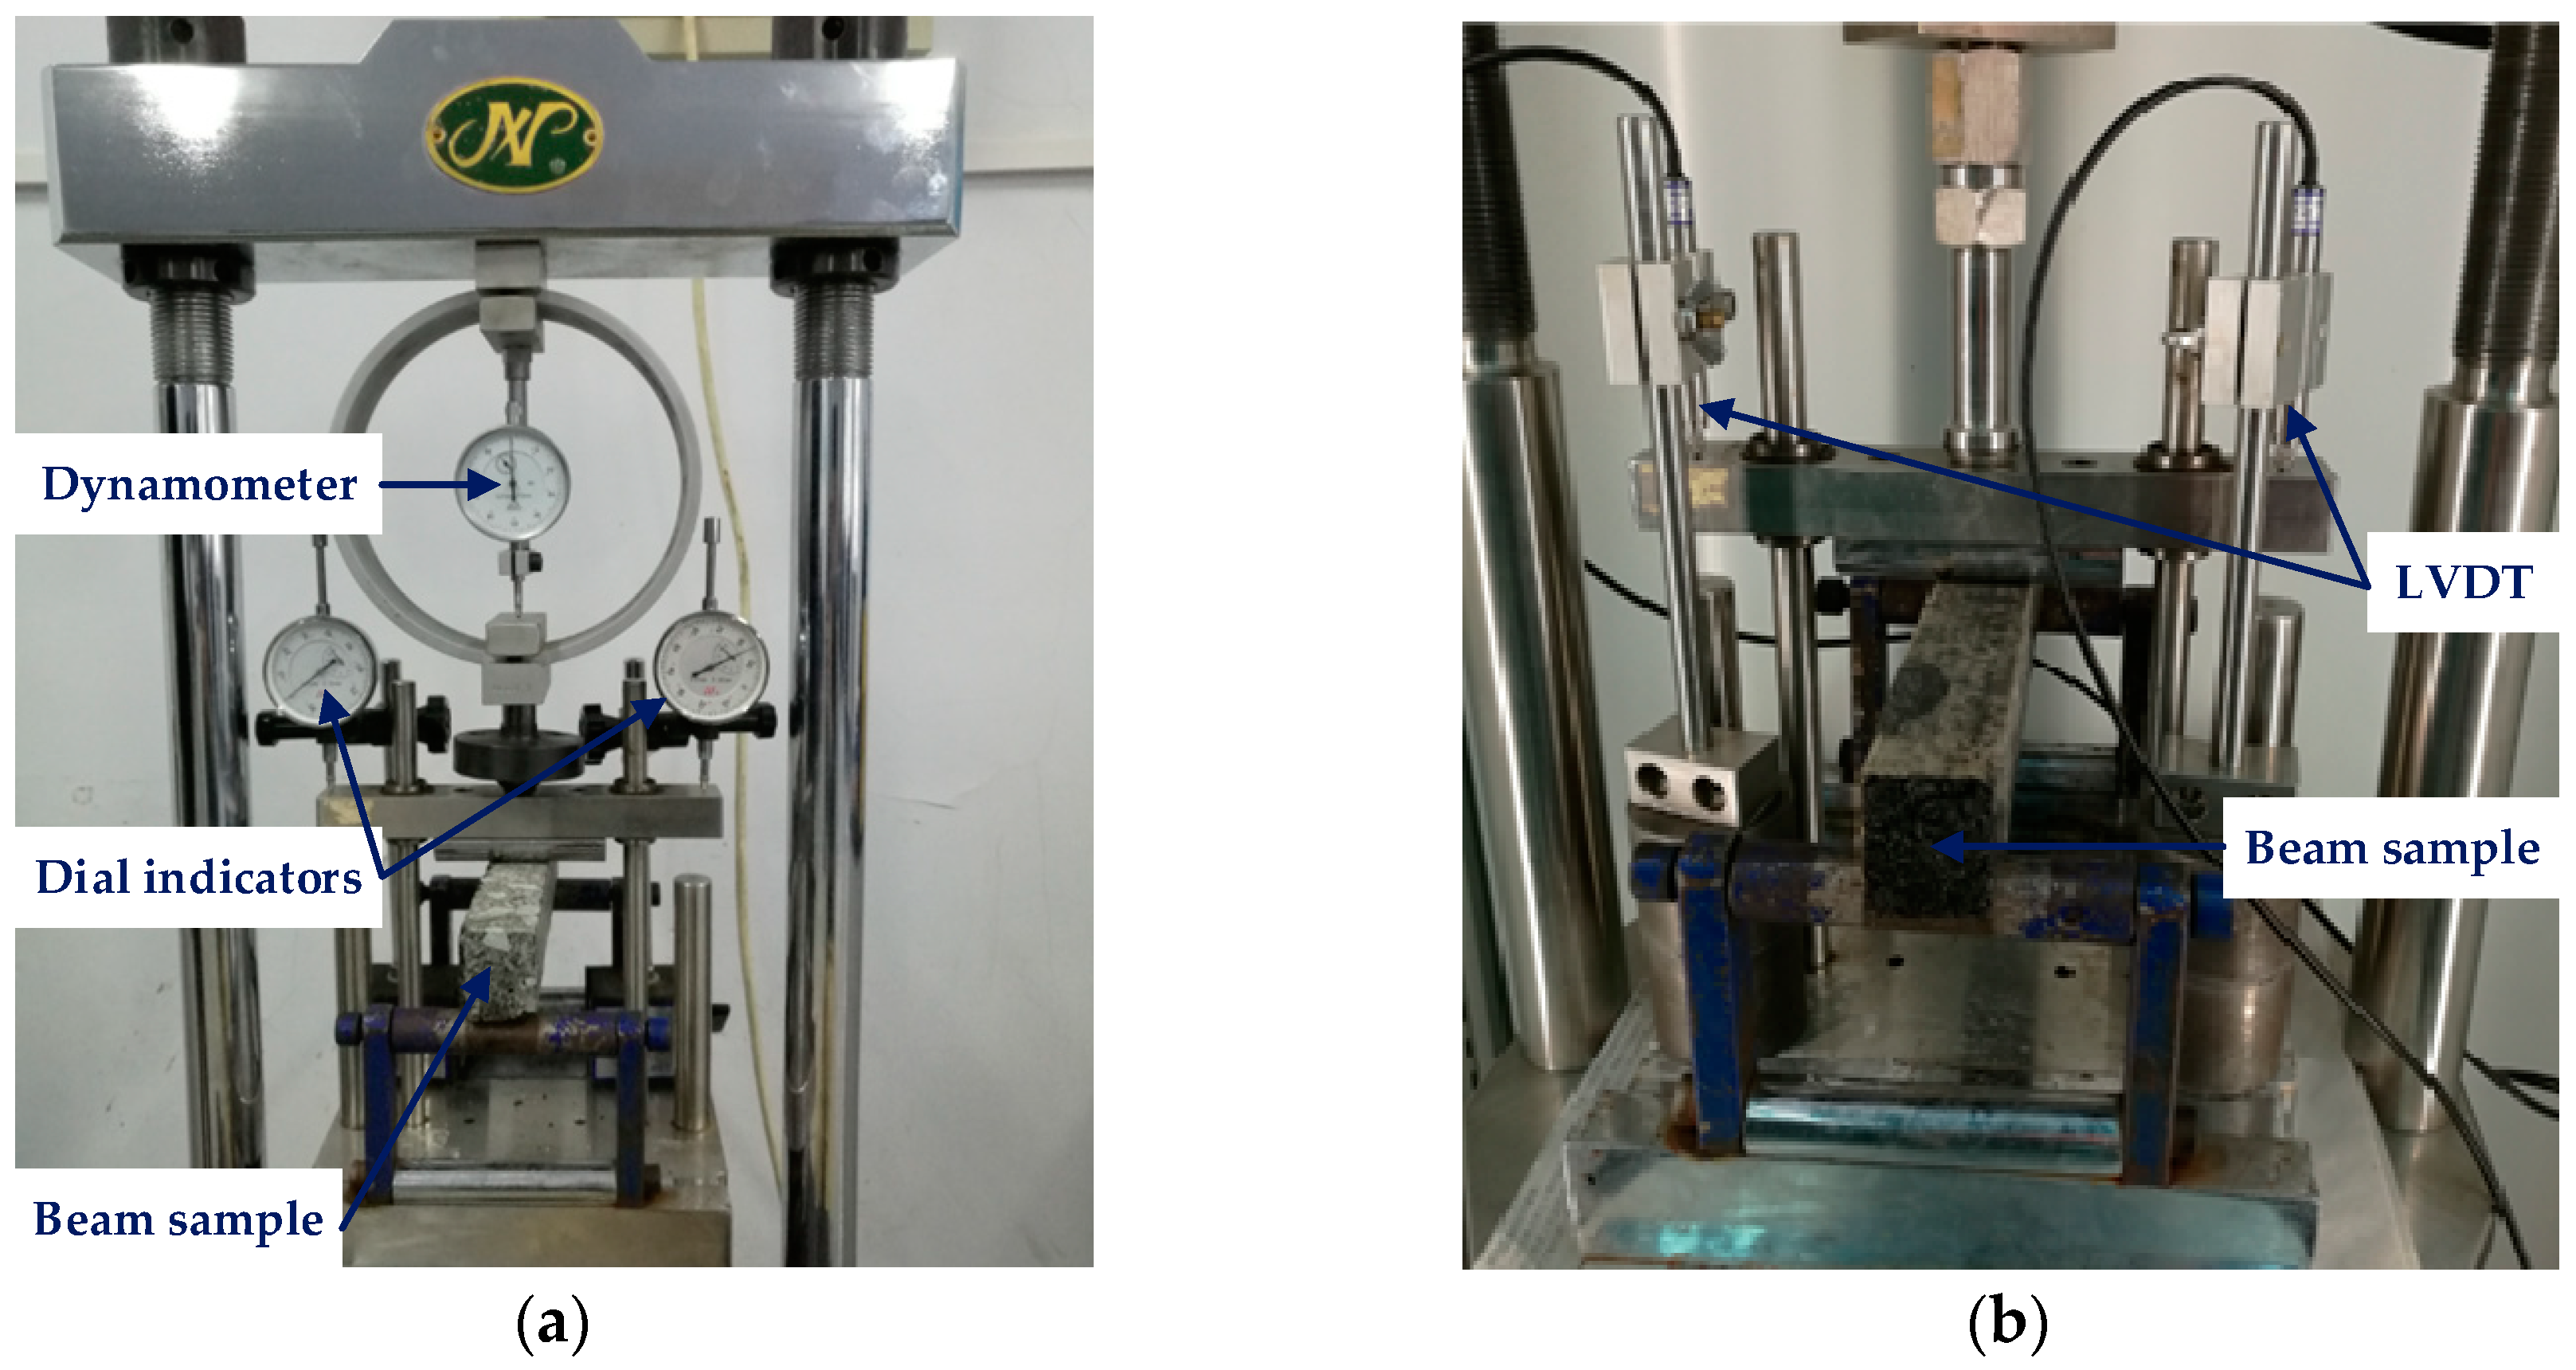
Figure 3.
Low-temperature viscoelastic property tests: (a) Beam bending failure test; and, (b) Beam bending creep test.
Figure 3.
Low-temperature viscoelastic property tests: (a) Beam bending failure test; and, (b) Beam bending creep test.
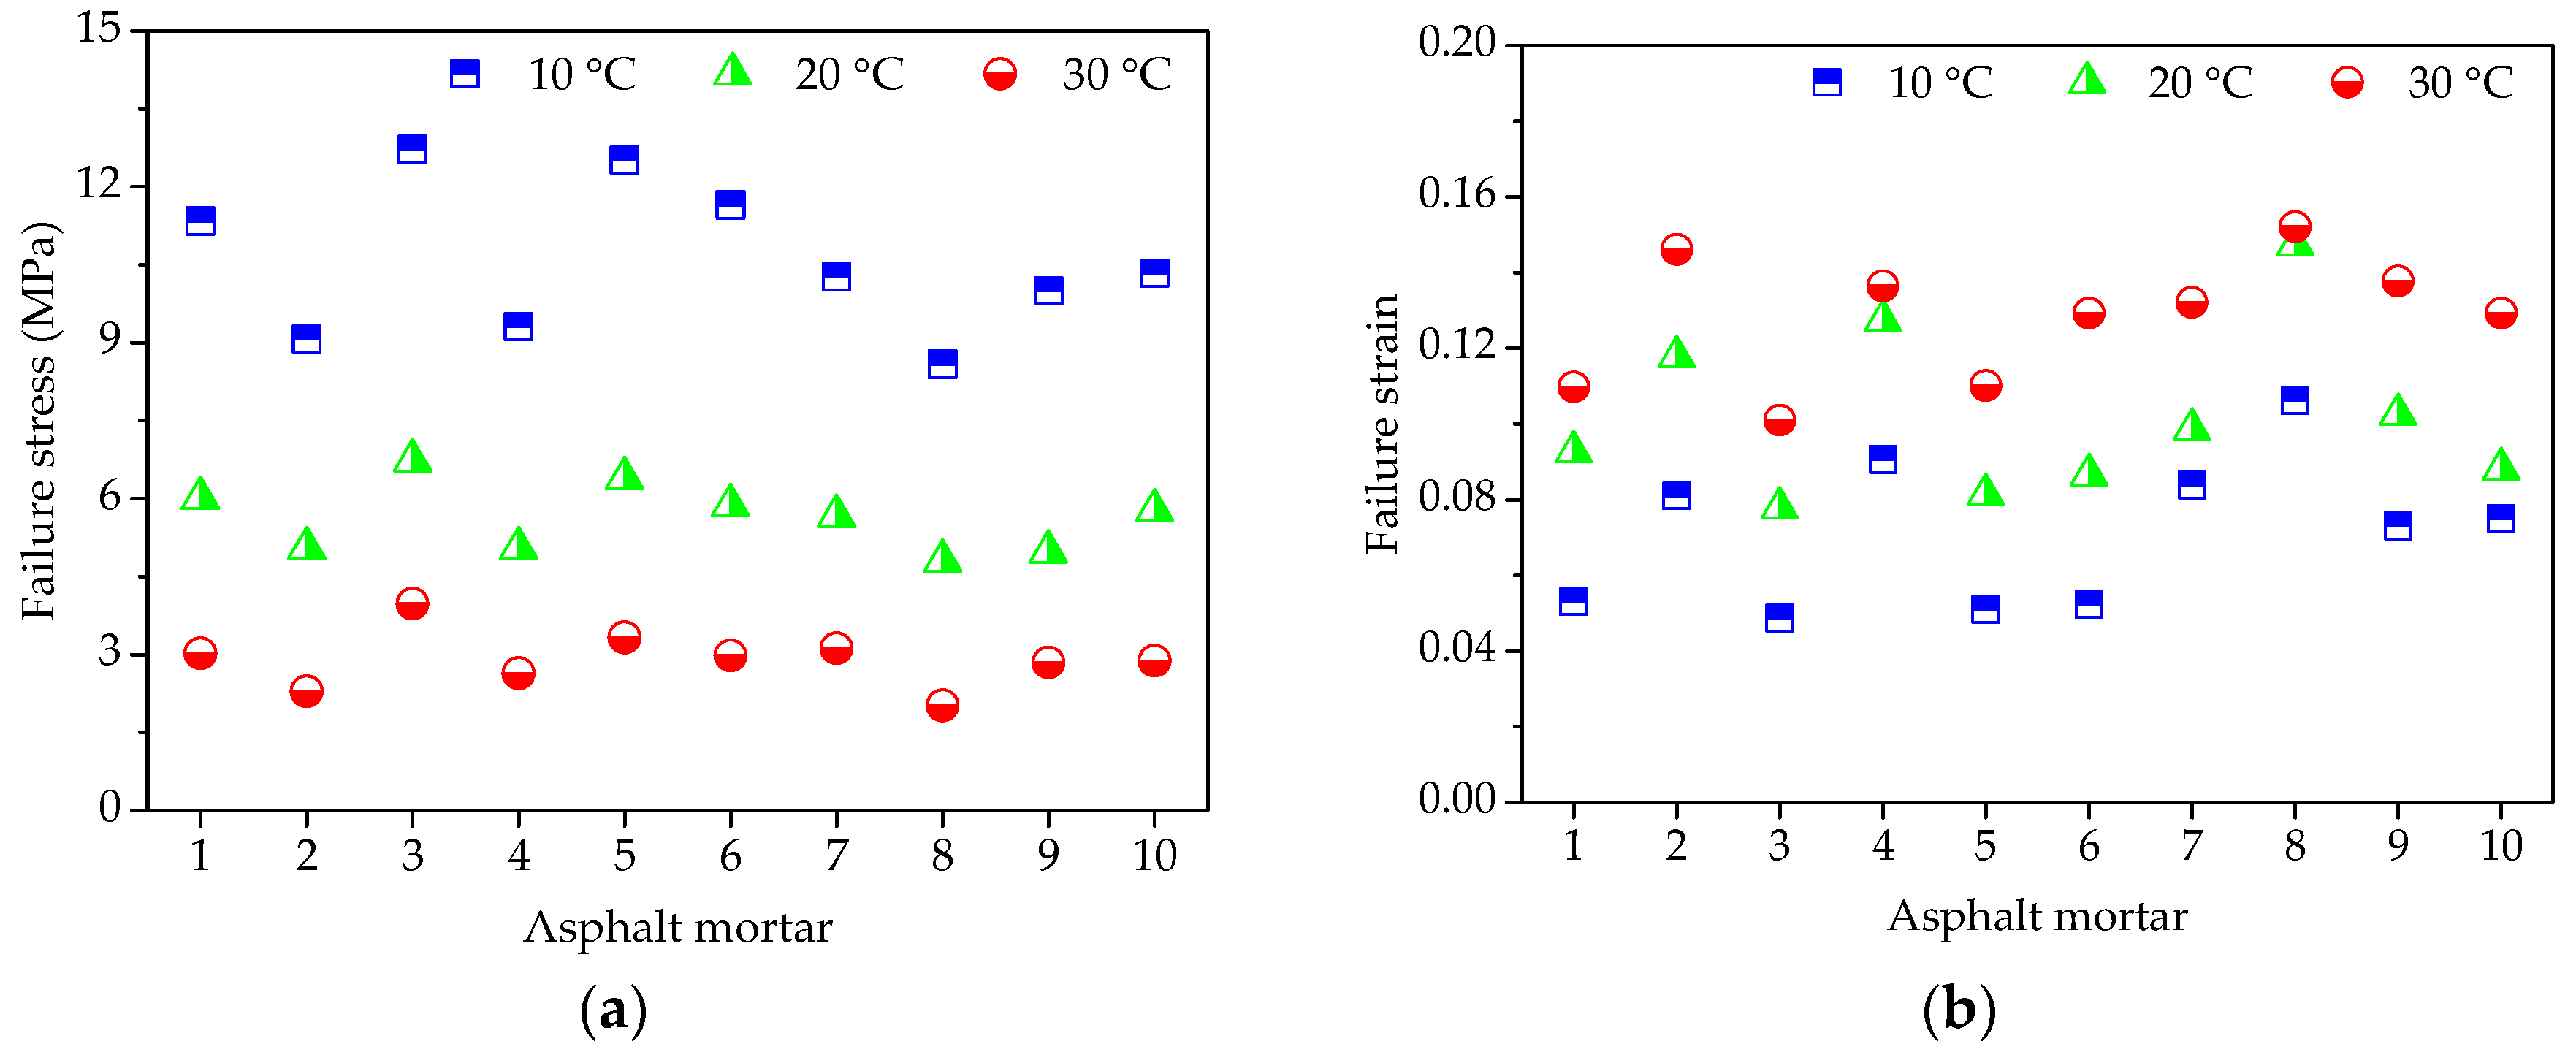
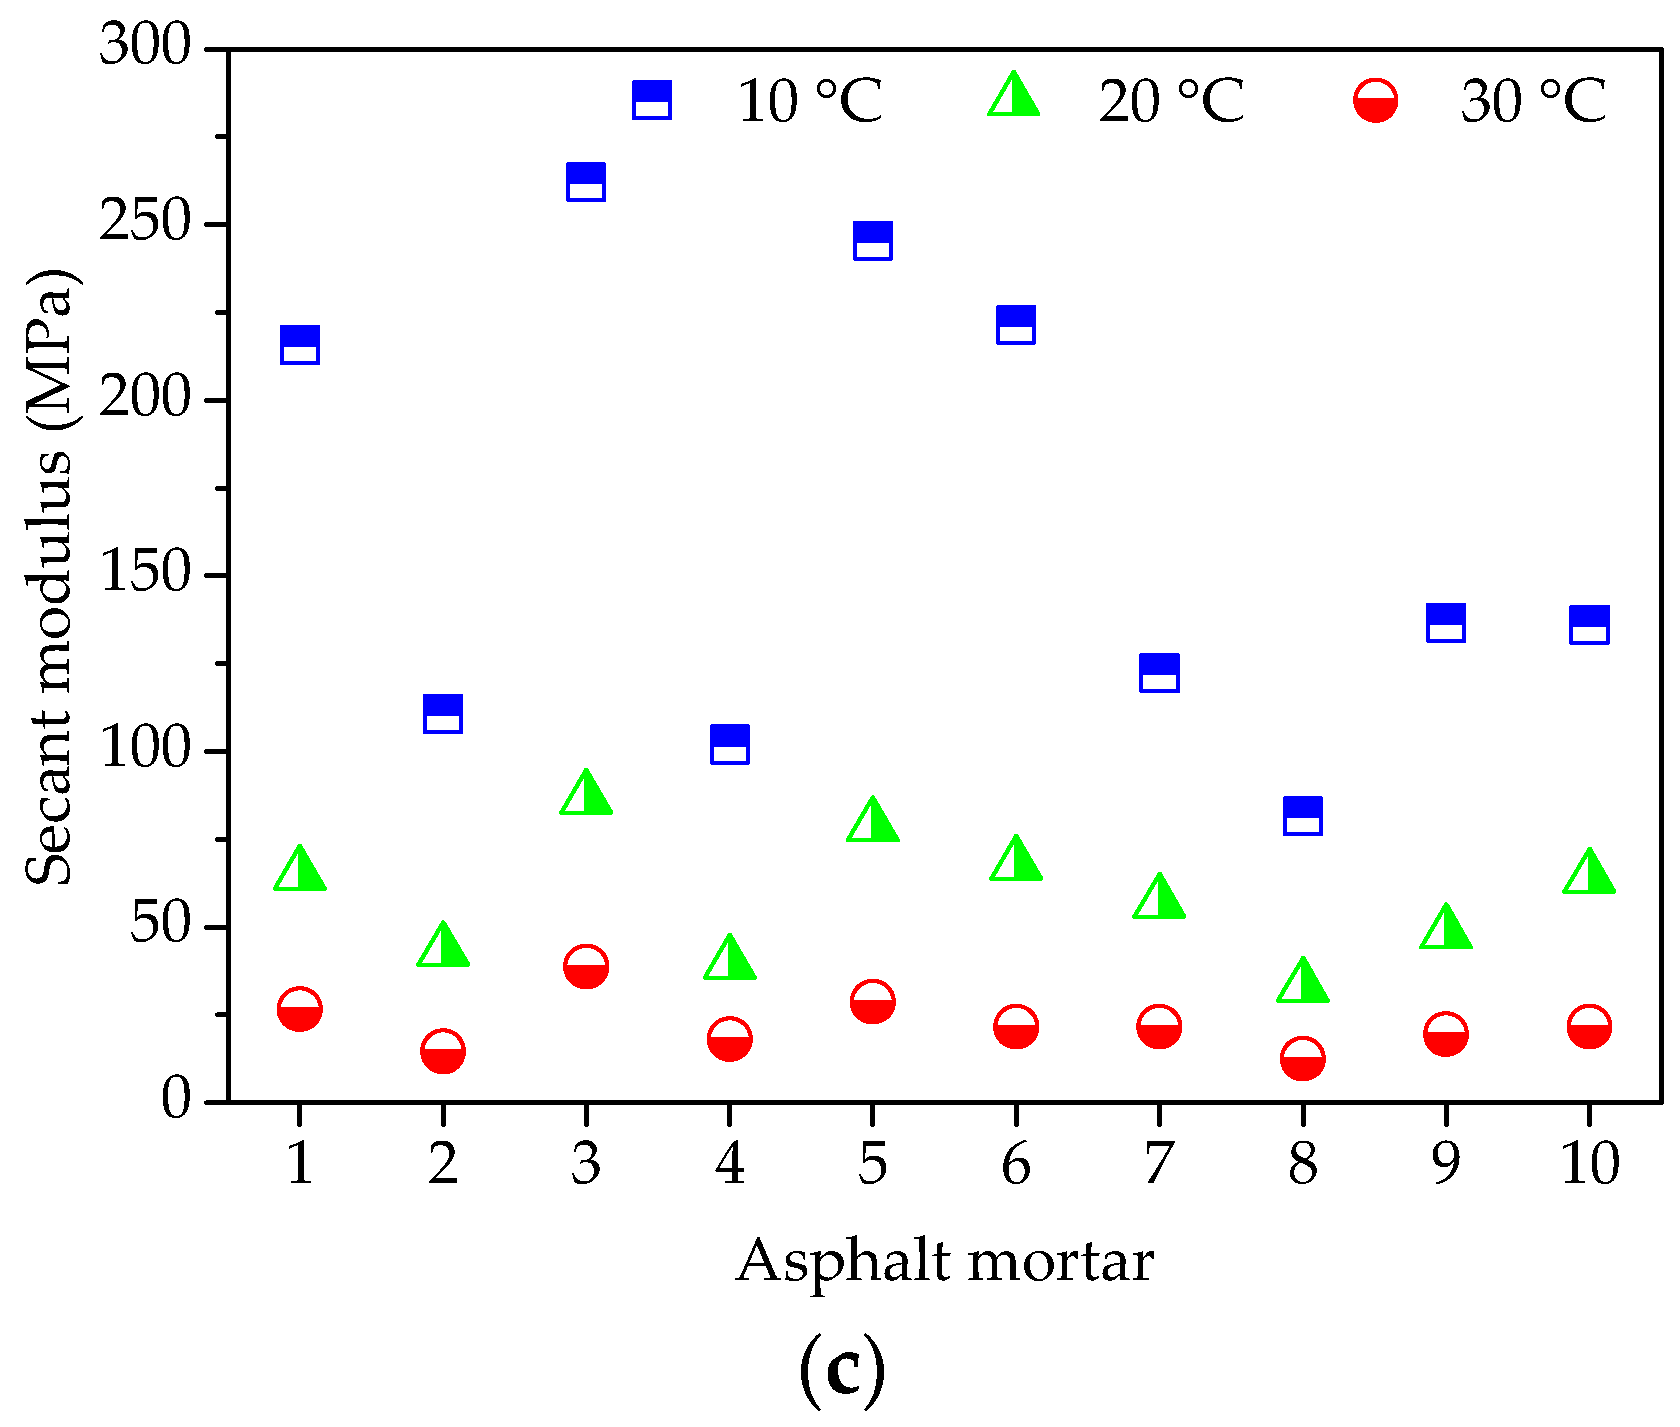
Figure 4.
Failure results of asphalt mortars: (a) Failure stress; (b) Failure strain; and, (c) Secant modulus.
Figure 4.
Failure results of asphalt mortars: (a) Failure stress; (b) Failure strain; and, (c) Secant modulus.
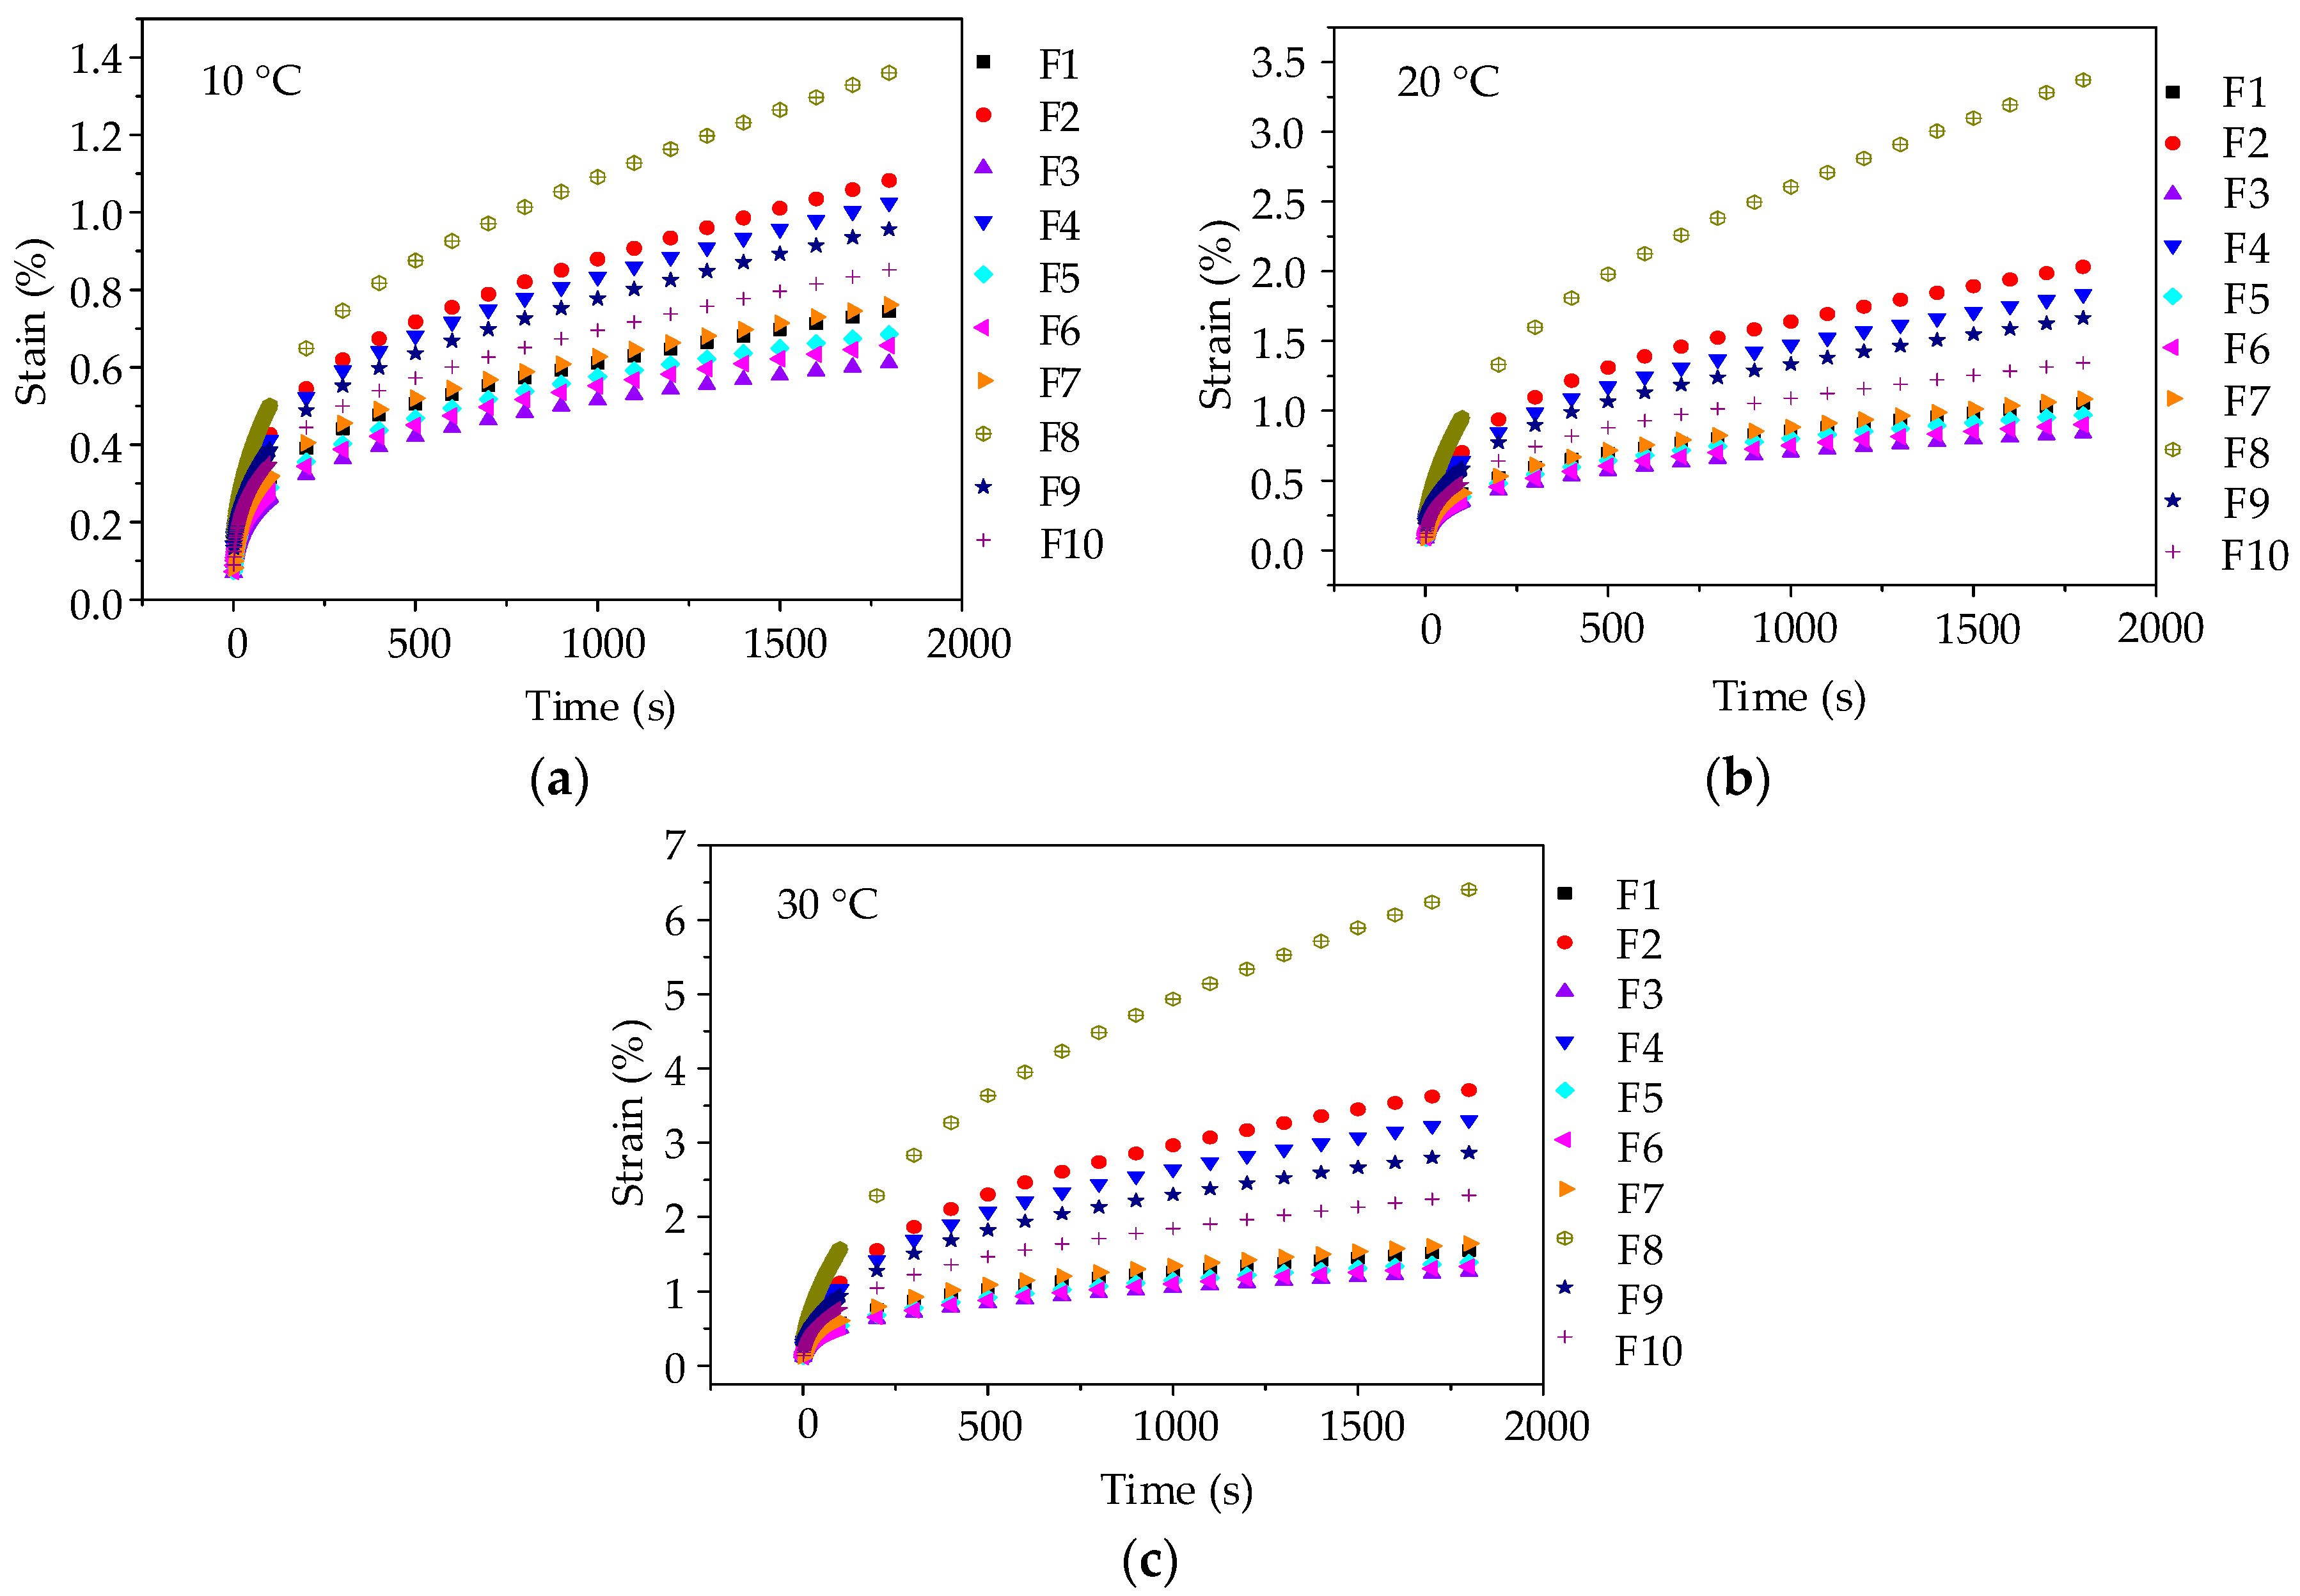
Figure 5.
Creep strain-time curves of asphalt mortars: (a) 10 °C; (b) 20 °C; and, (c) 30 °C.
Figure 5.
Creep strain-time curves of asphalt mortars: (a) 10 °C; (b) 20 °C; and, (c) 30 °C.
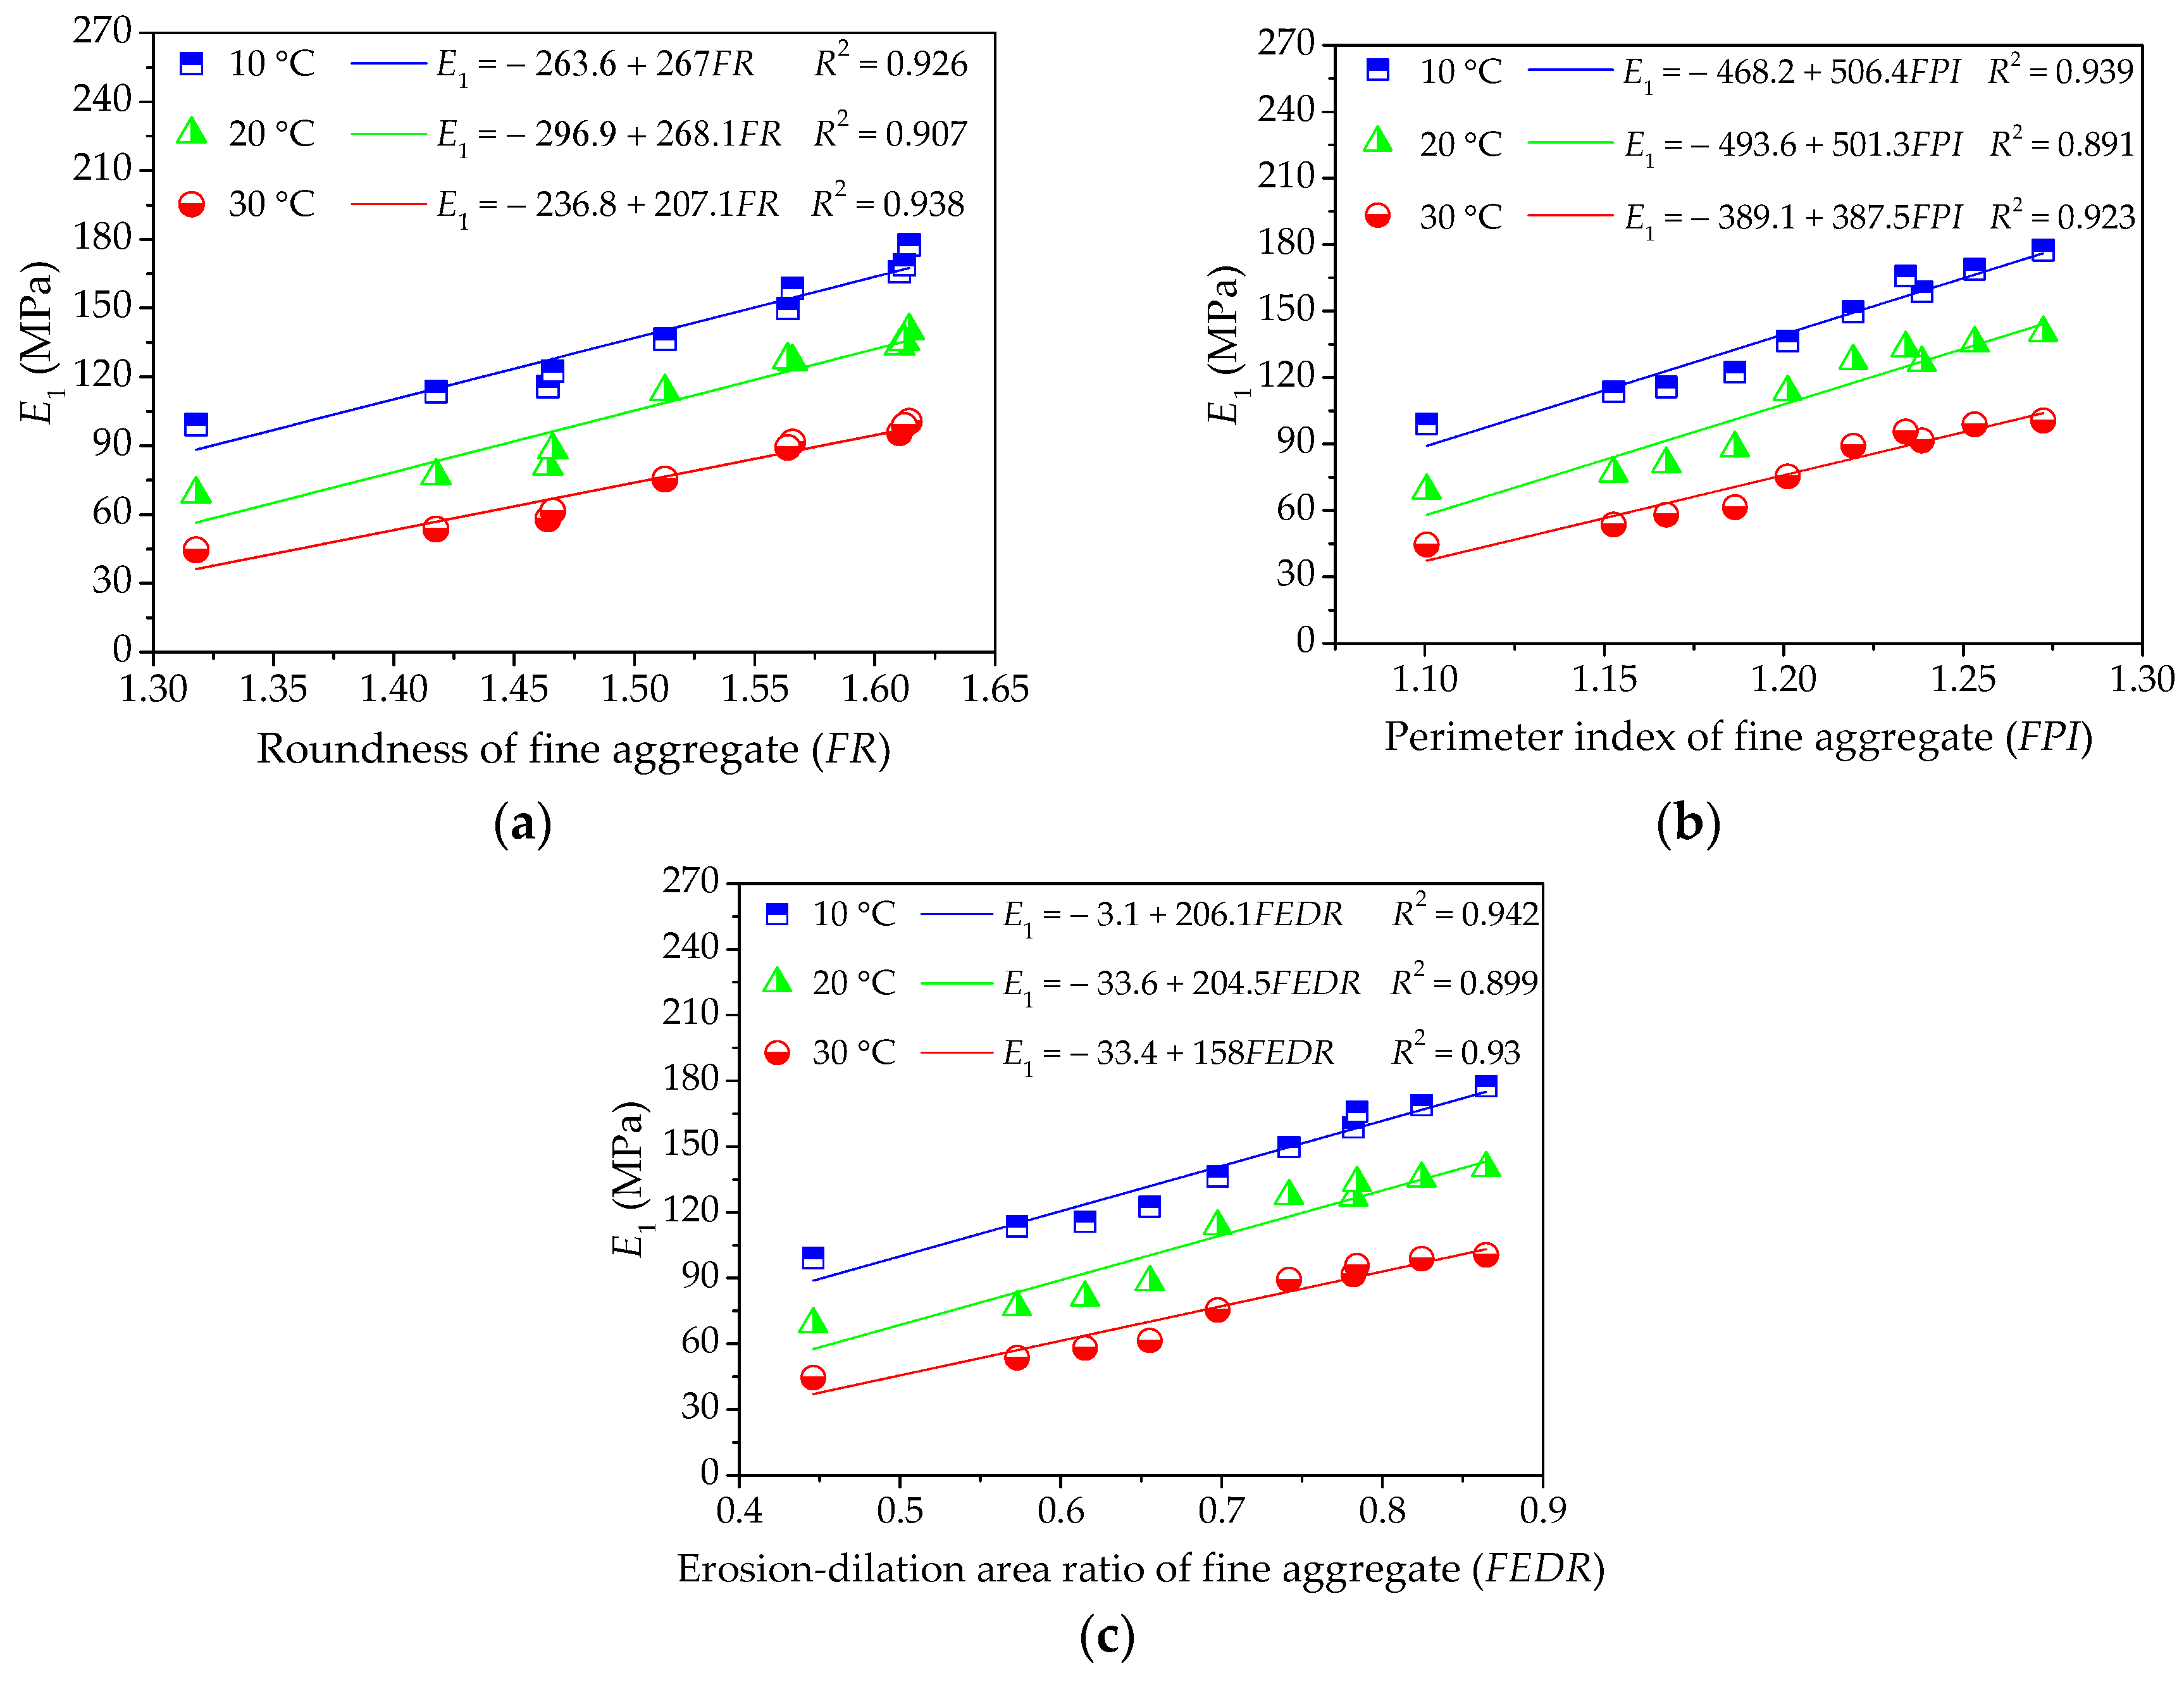
Figure 6.
Influences of fine aggregate morphological characteristics of on E1 of asphalt mortar: (a) Shape (FR); (b) Angularity (FPI); and, (c) Texture (FEDR).
Figure 6.
Influences of fine aggregate morphological characteristics of on E1 of asphalt mortar: (a) Shape (FR); (b) Angularity (FPI); and, (c) Texture (FEDR).
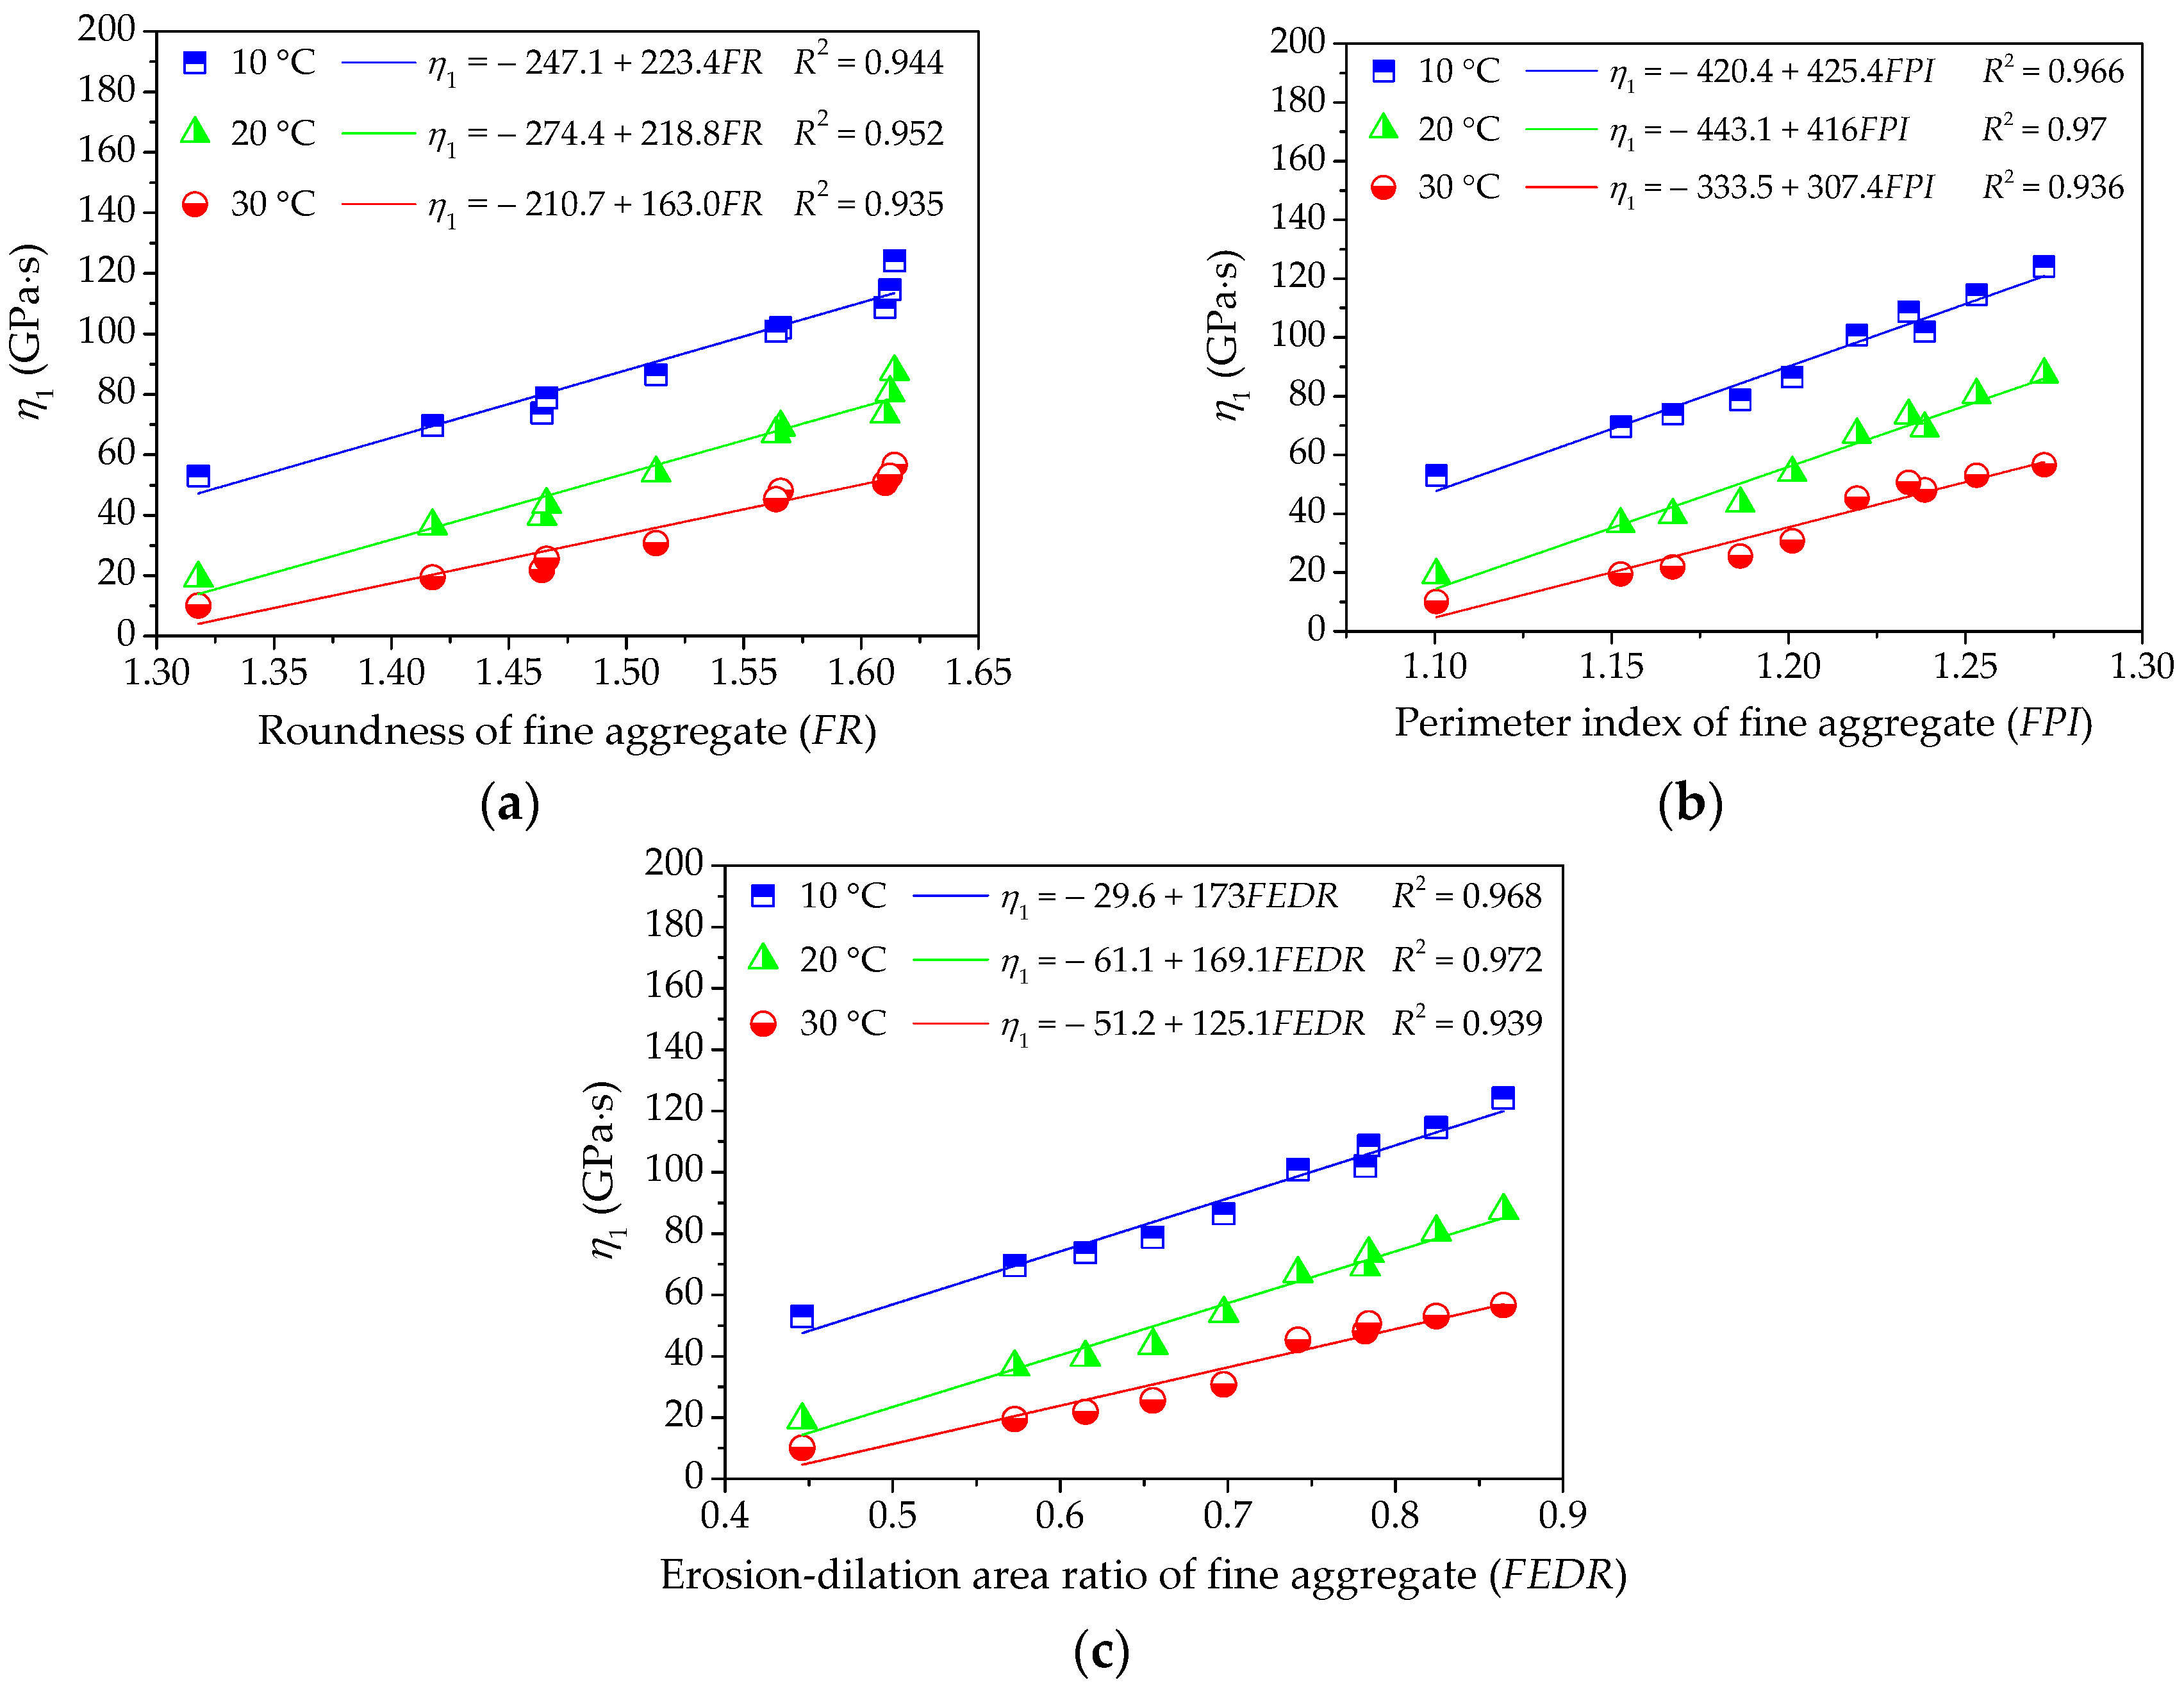
Figure 7.
Influences of fine aggregate morphological characteristics of on η1 of asphalt mortar: (a) Shape (FR); (b) Angularity (FPI); and, (c) Texture (FEDR).
Figure 7.
Influences of fine aggregate morphological characteristics of on η1 of asphalt mortar: (a) Shape (FR); (b) Angularity (FPI); and, (c) Texture (FEDR).
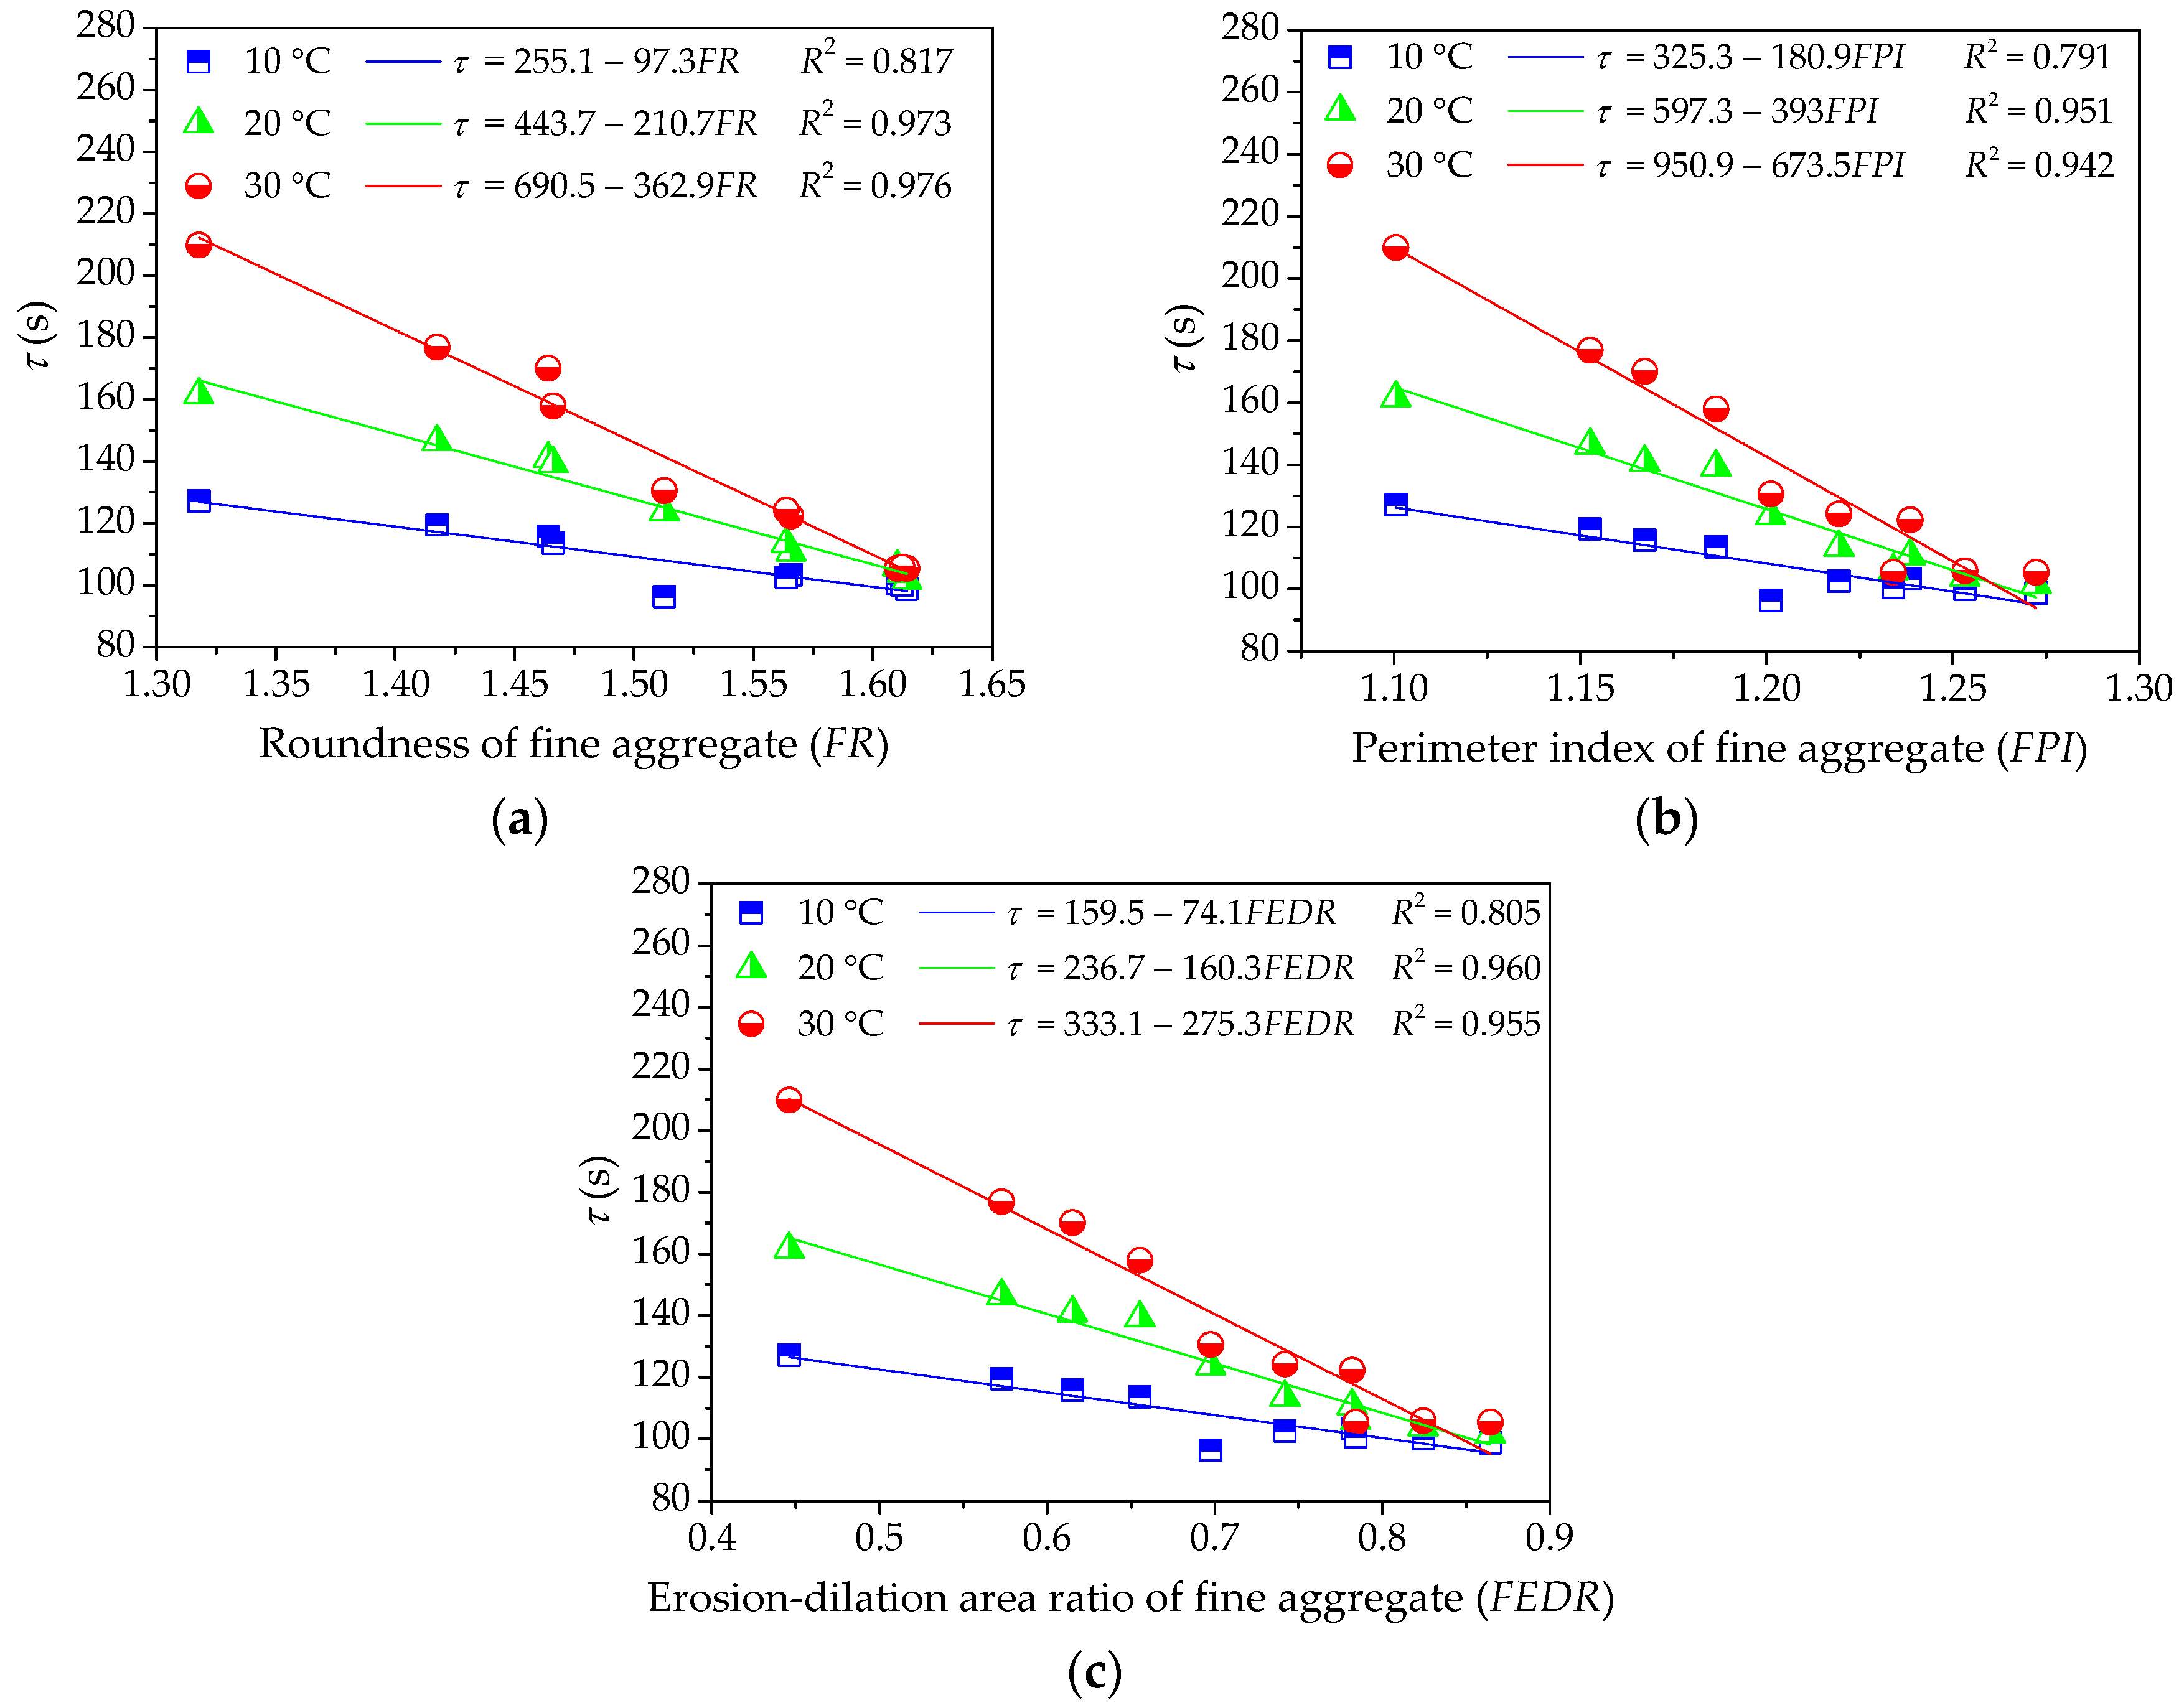
Figure 8.
Influences of fine aggregate morphological characteristics of on τ of asphalt mortar: (a) Shape (FR); (b) Angularity (FPI); and, (c) Texture (FEDR).
Figure 8.
Influences of fine aggregate morphological characteristics of on τ of asphalt mortar: (a) Shape (FR); (b) Angularity (FPI); and, (c) Texture (FEDR).
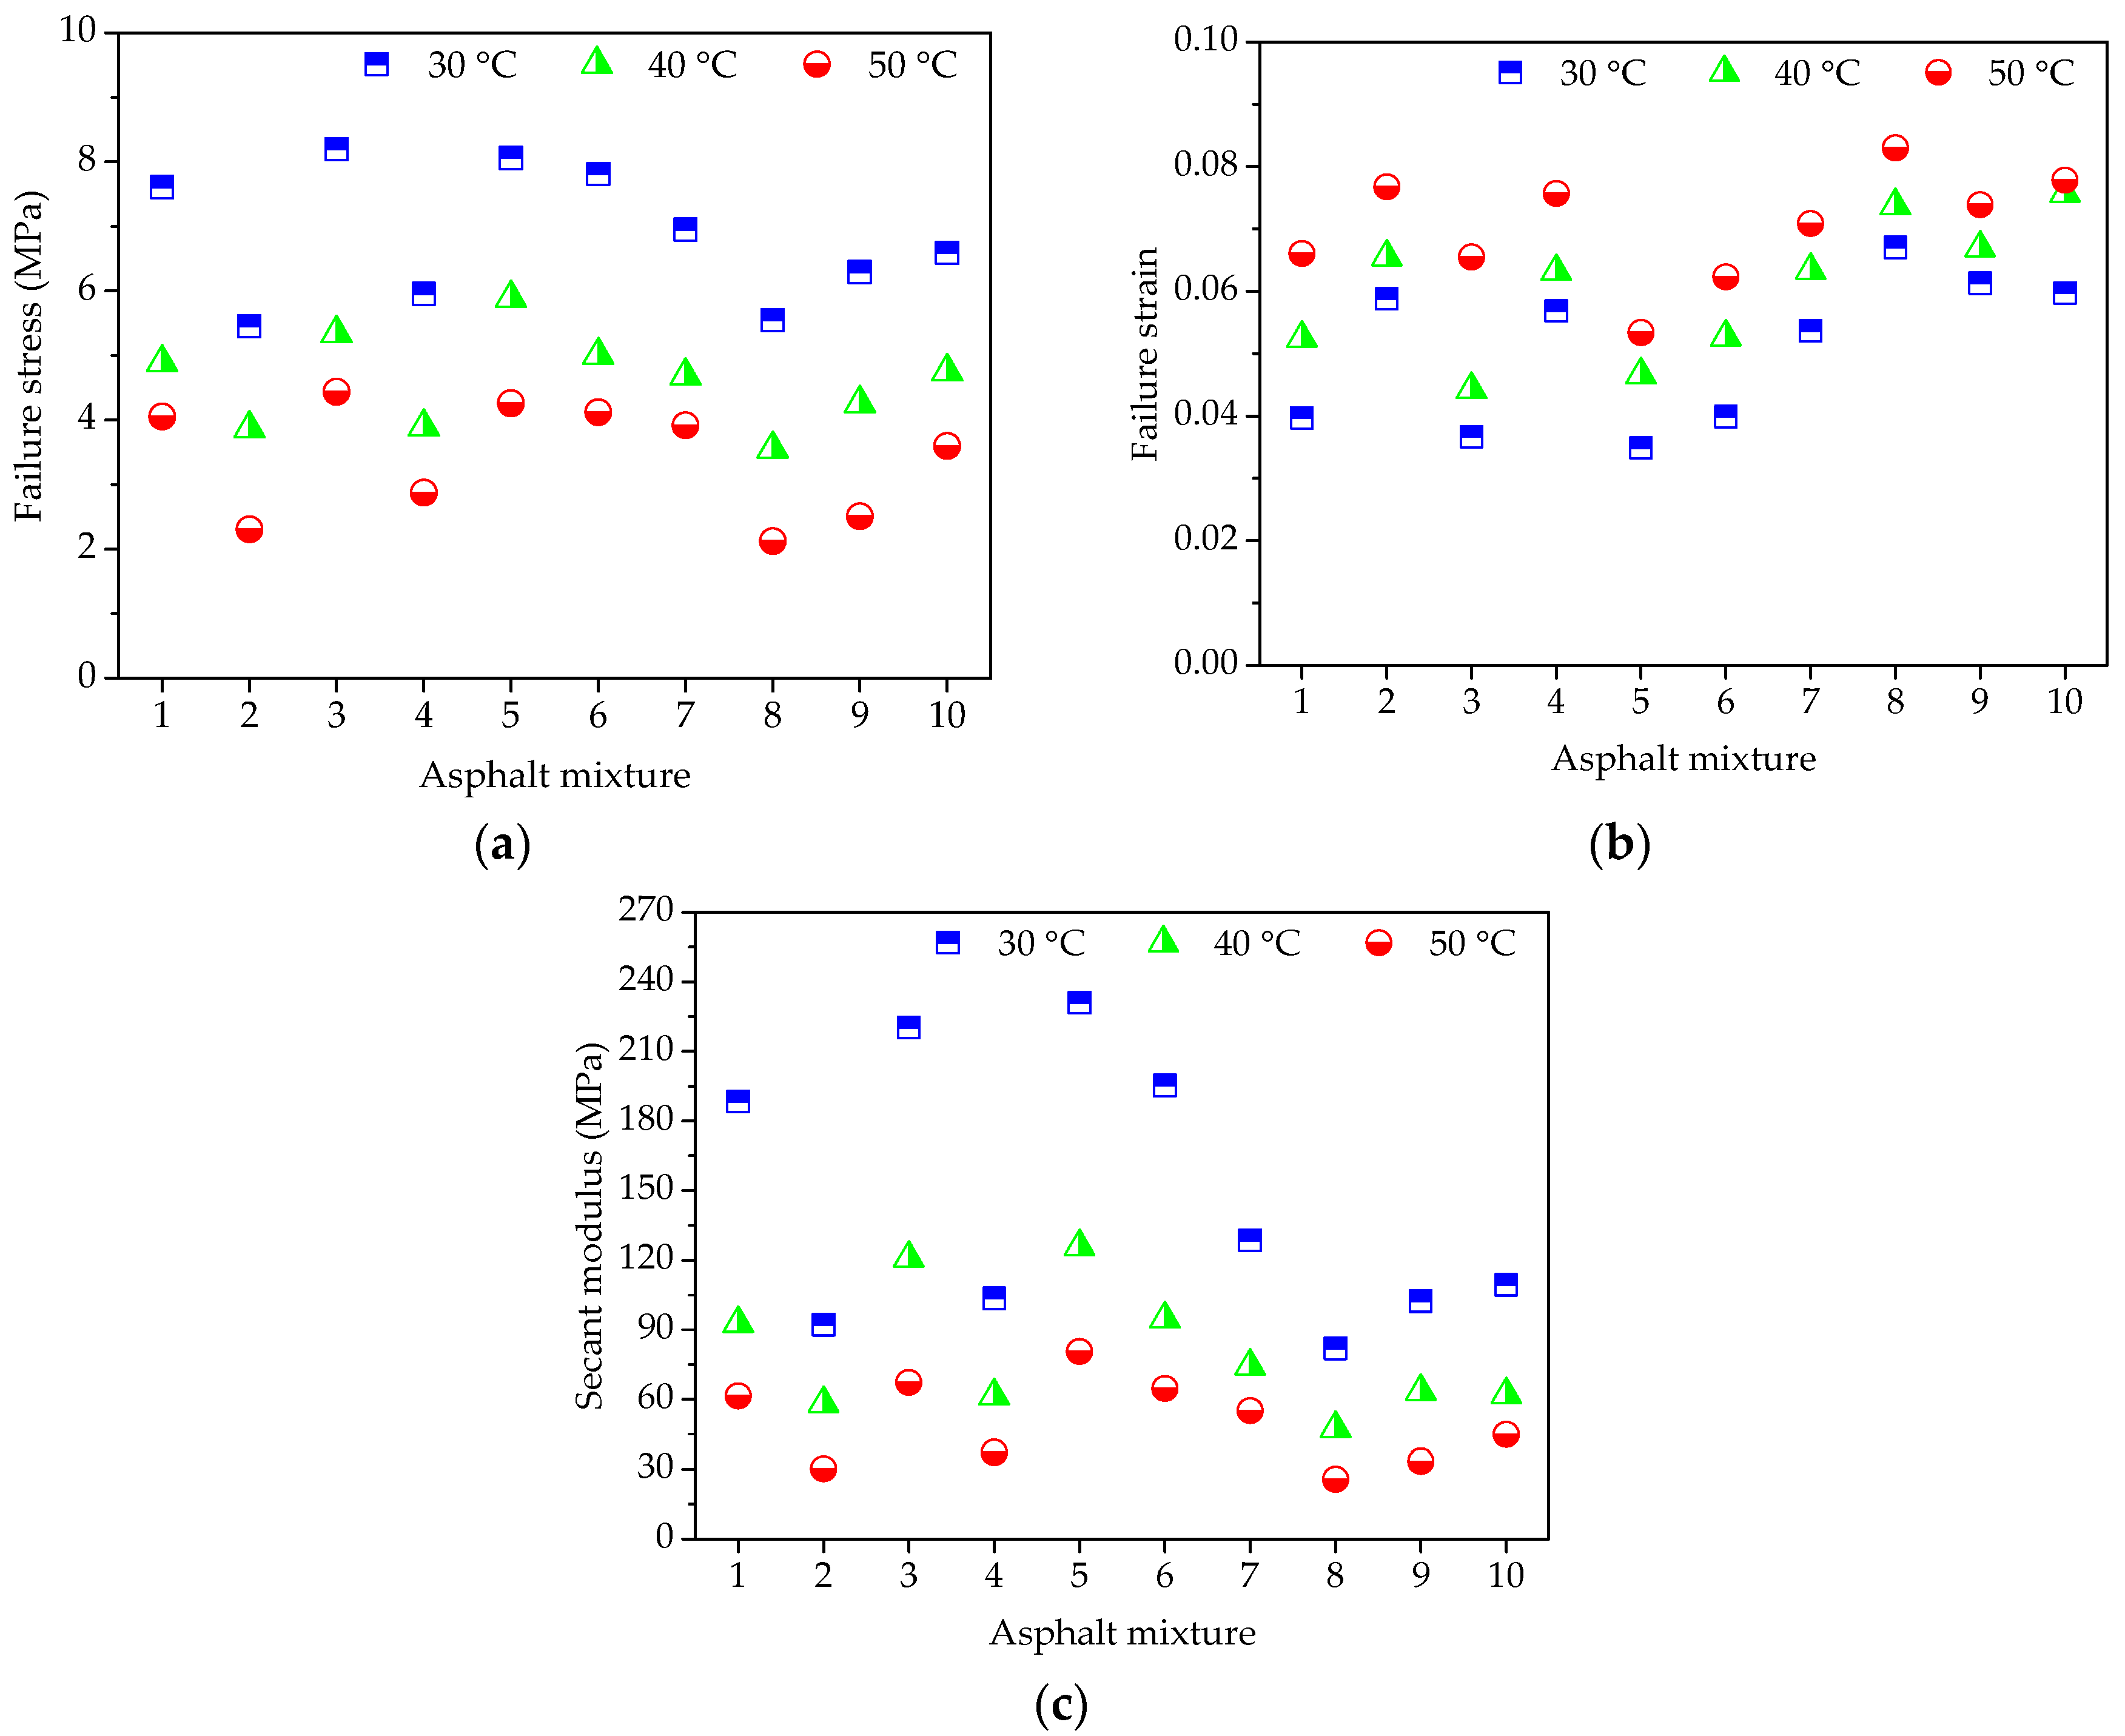
Figure 9.
Failure results of asphalt mixtures: (a) Failure stress; (b) Failure strain; and, (c) Secant modulus.
Figure 9.
Failure results of asphalt mixtures: (a) Failure stress; (b) Failure strain; and, (c) Secant modulus.
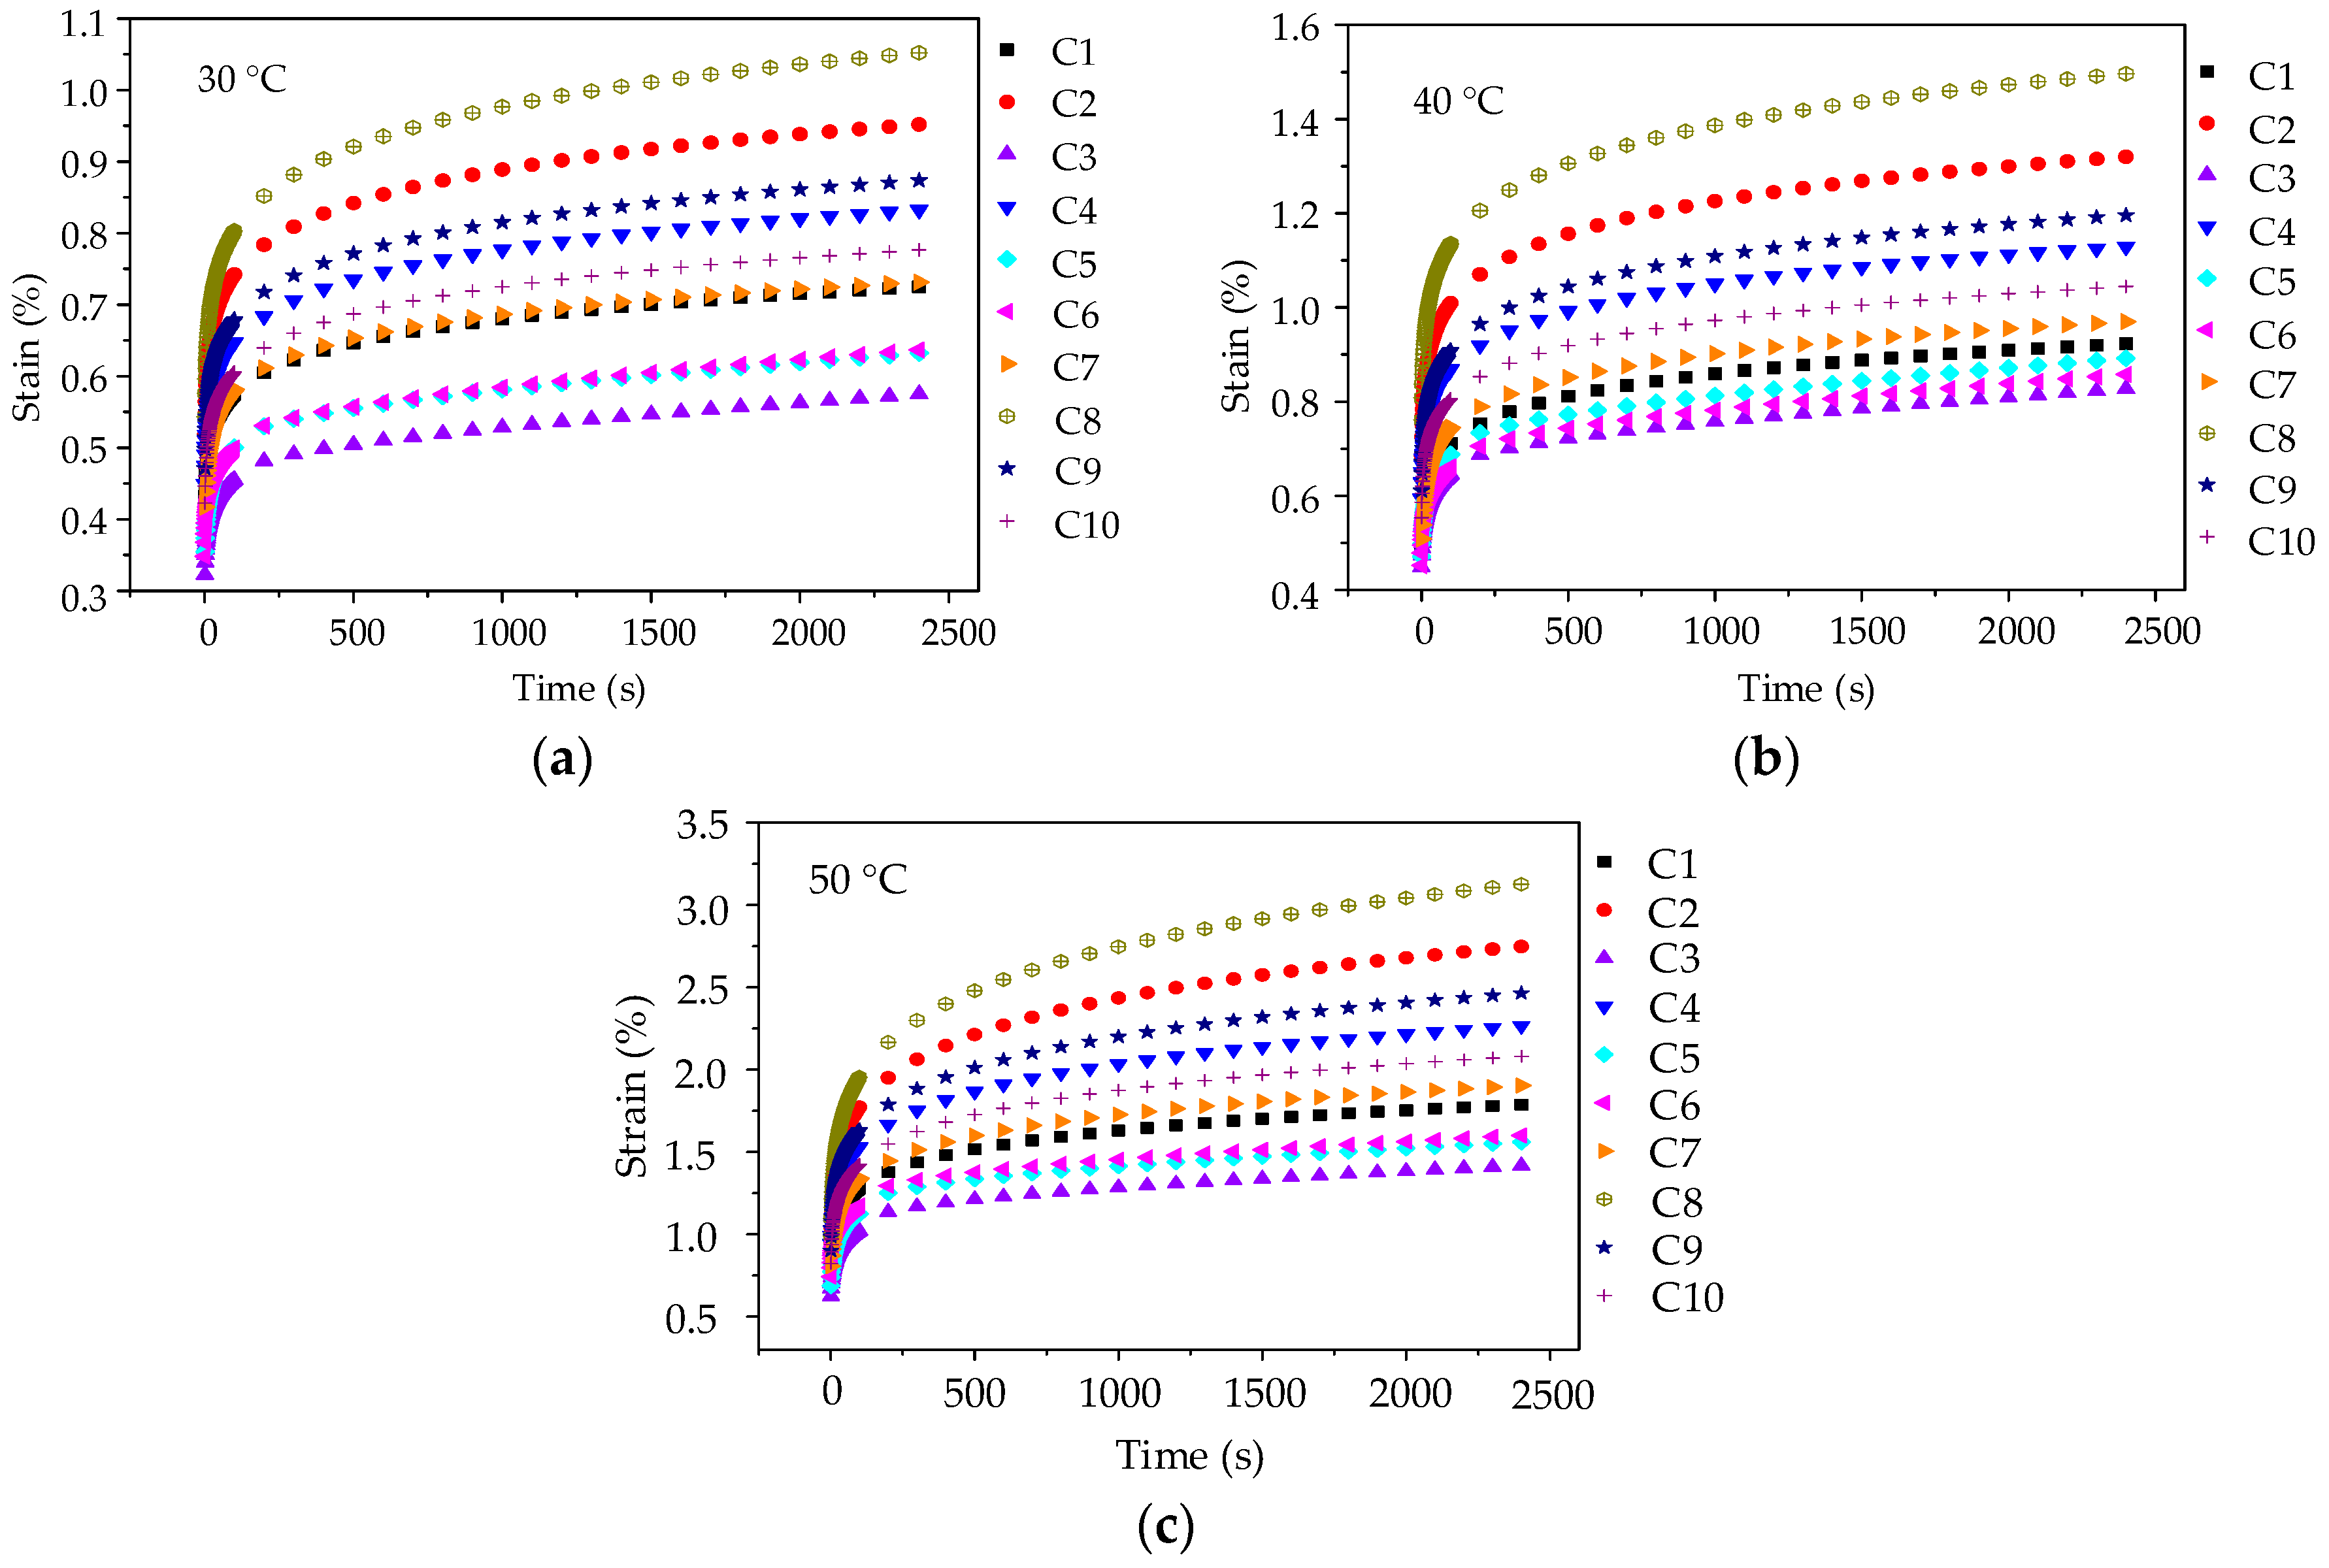
Figure 10.
Creep strain-time curves of asphalt mixtures: (a) 30 °C; (b) 40 °C; and, (c) 50 °C.
Figure 10.
Creep strain-time curves of asphalt mixtures: (a) 30 °C; (b) 40 °C; and, (c) 50 °C.
Figure 11.
Influences of coarse aggregate morphological characteristics of on E1 of asphalt mixture: (a) Shape (CR); (b) Angularity (CPI); and, (c) Texture (CEDR).
Figure 11.
Influences of coarse aggregate morphological characteristics of on E1 of asphalt mixture: (a) Shape (CR); (b) Angularity (CPI); and, (c) Texture (CEDR).
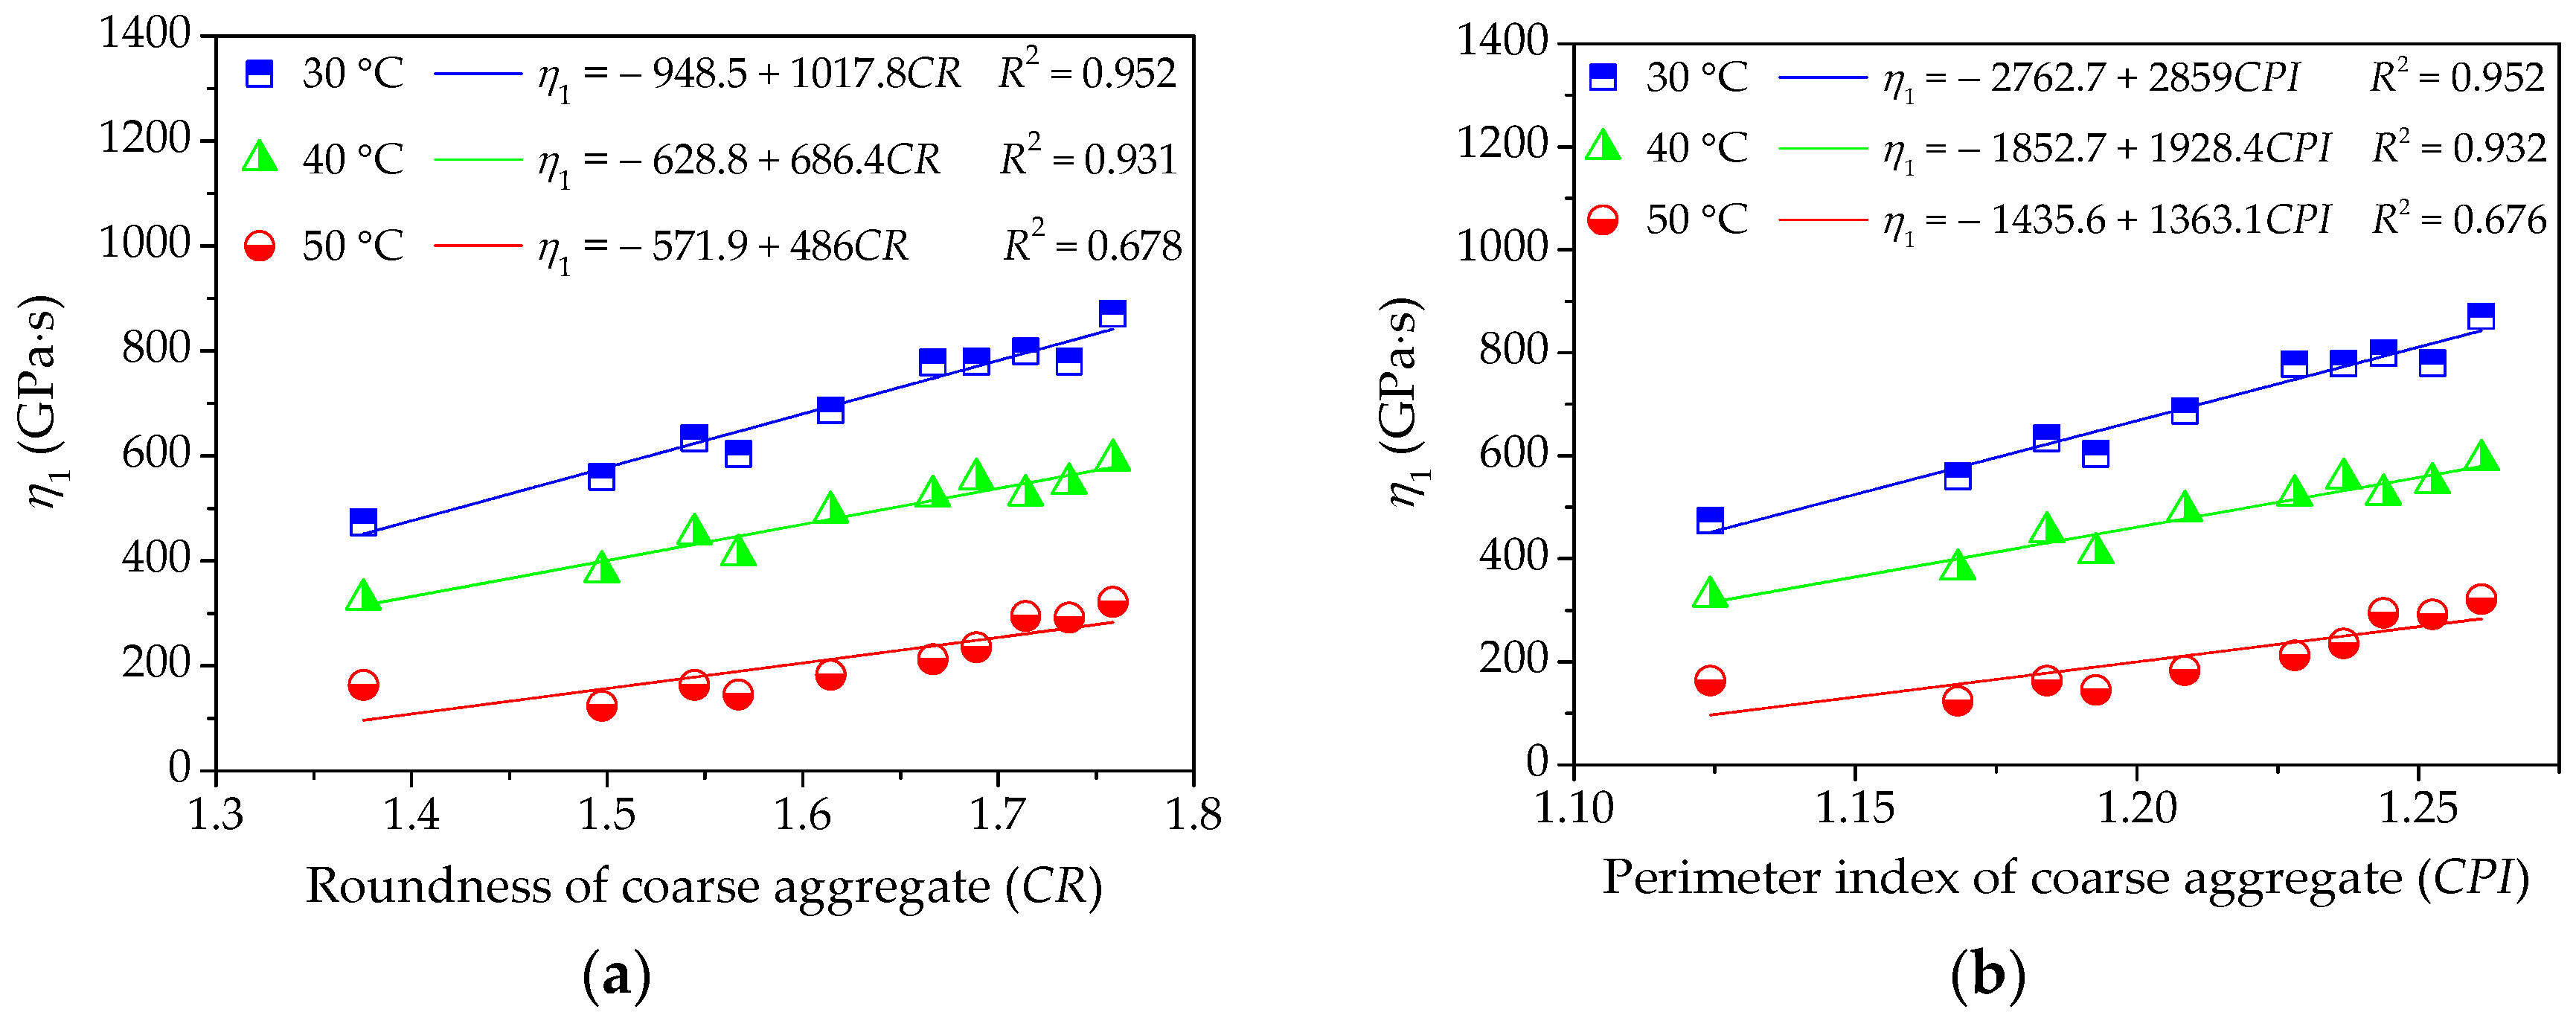
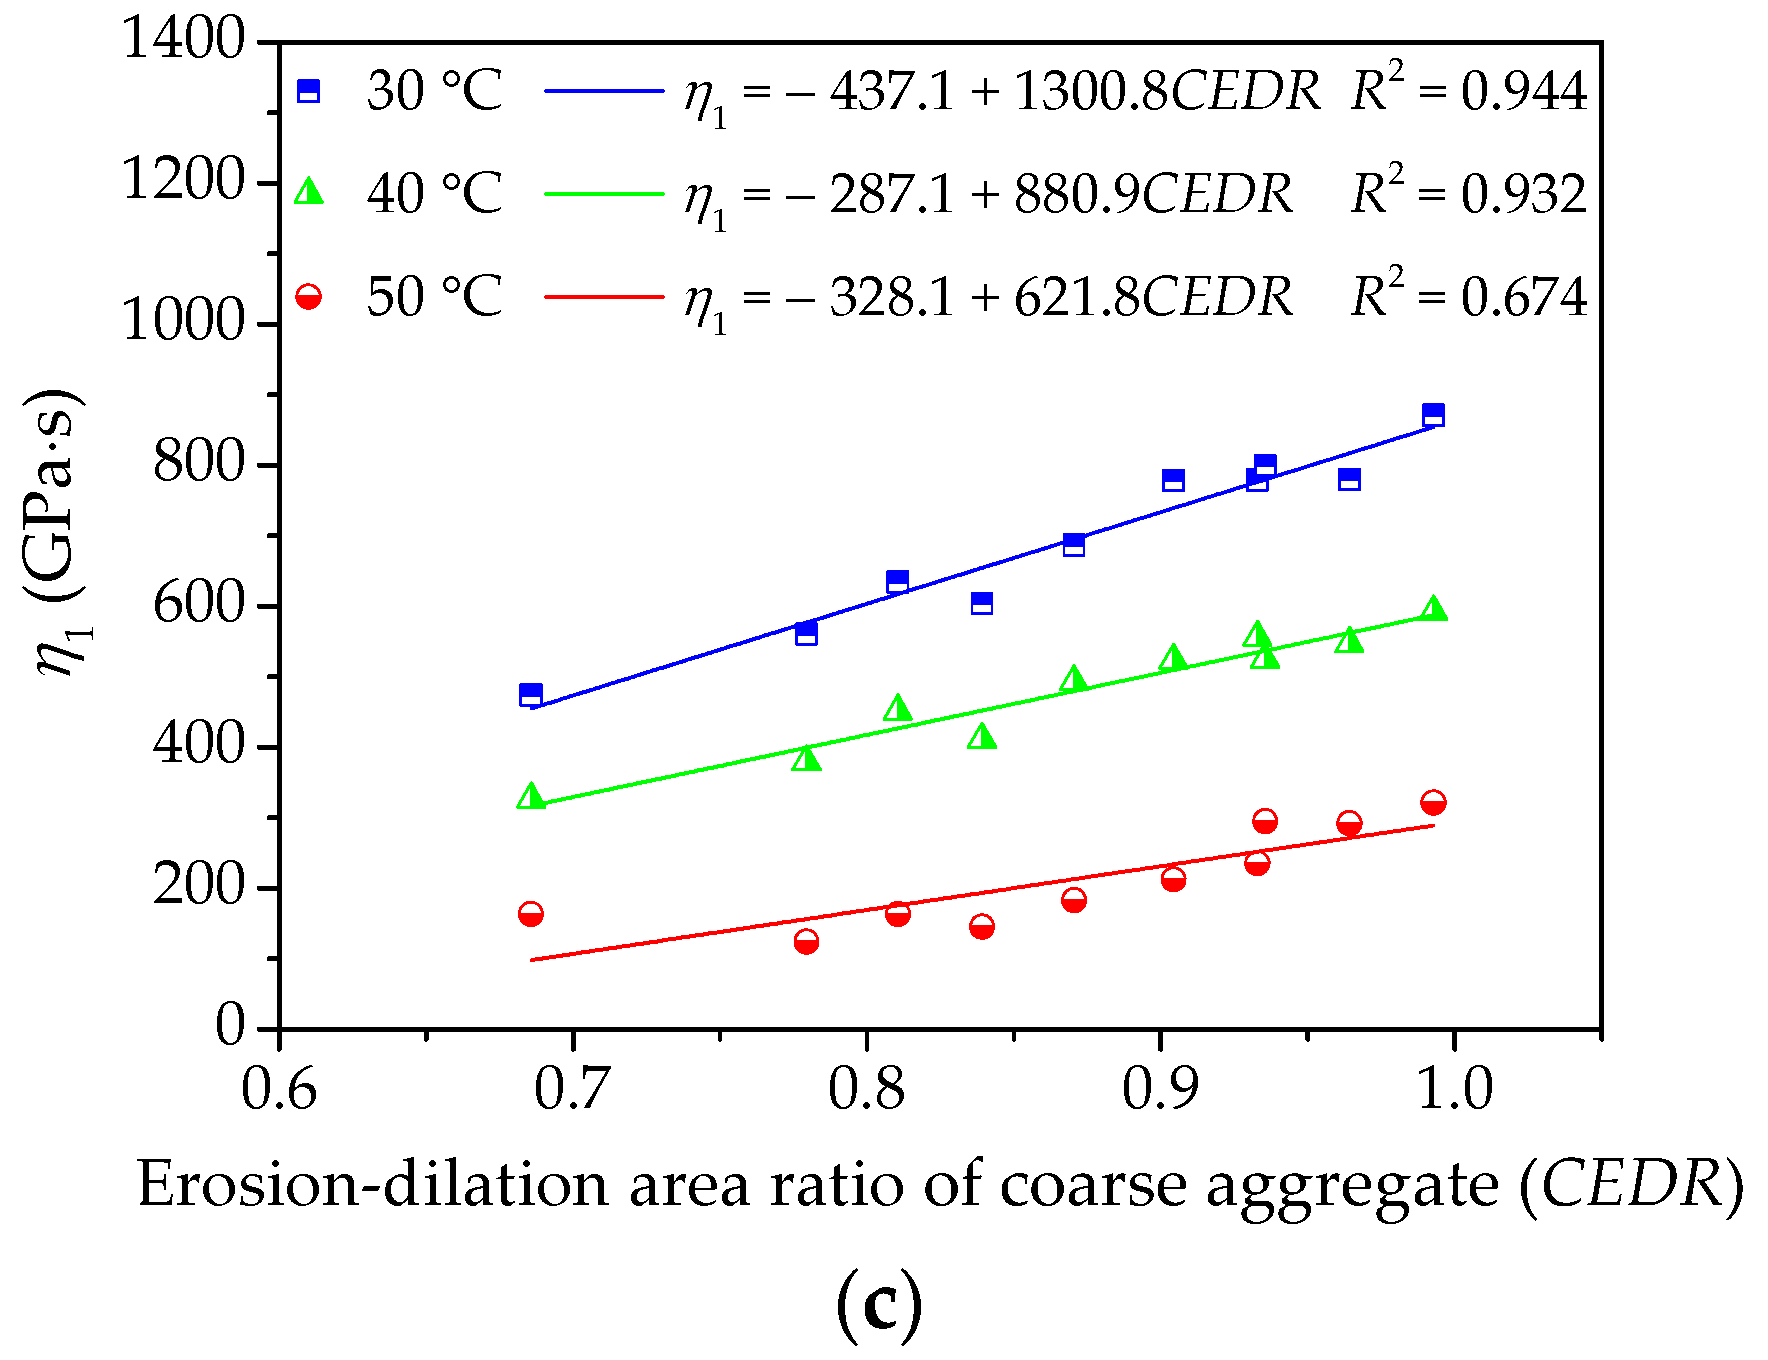
Figure 12.
Influences of coarse aggregate morphological characteristics of on η1 of asphalt mixture: (a) Shape (CR); (b) Angularity (CPI); and, (c) Texture (CEDR).
Figure 12.
Influences of coarse aggregate morphological characteristics of on η1 of asphalt mixture: (a) Shape (CR); (b) Angularity (CPI); and, (c) Texture (CEDR).
Figure 13.
Influences of coarse aggregate morphological characteristics of on τ of asphalt mixture: (a) Shape (CR); (b) Angularity (CPI); and, (c) Texture (CEDR).
Figure 13.
Influences of coarse aggregate morphological characteristics of on τ of asphalt mixture: (a) Shape (CR); (b) Angularity (CPI); and, (c) Texture (CEDR).
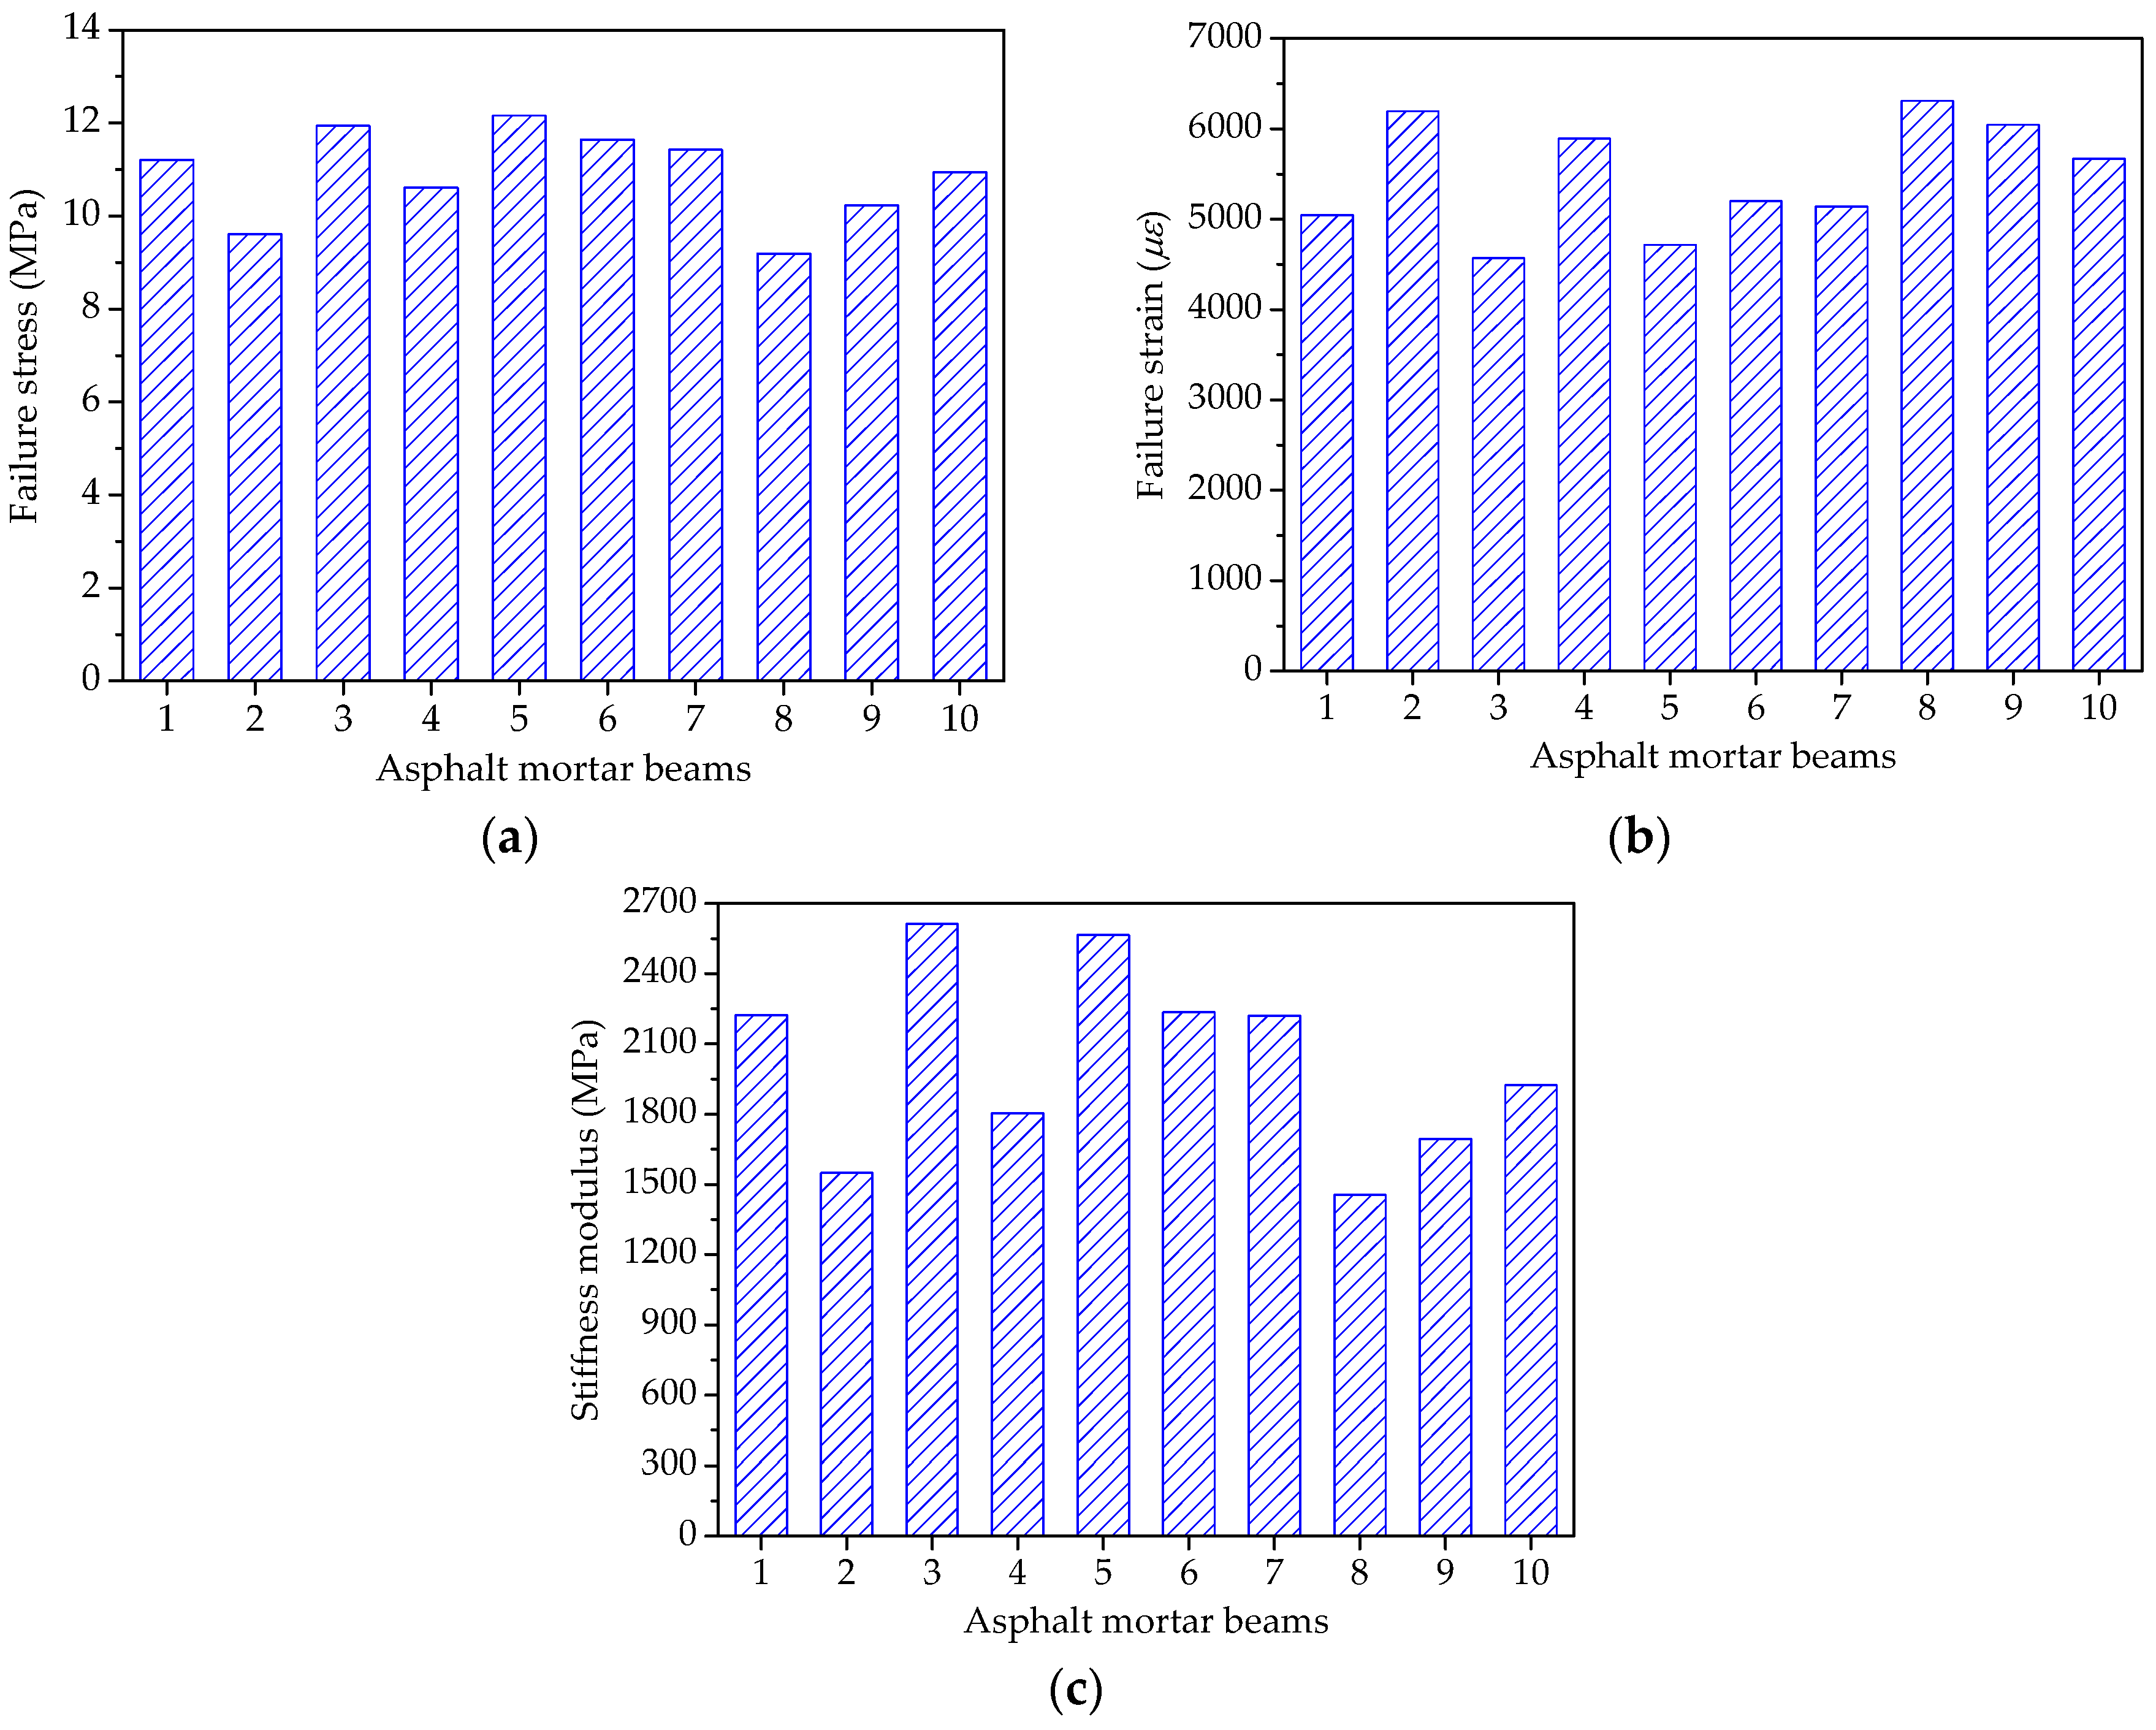
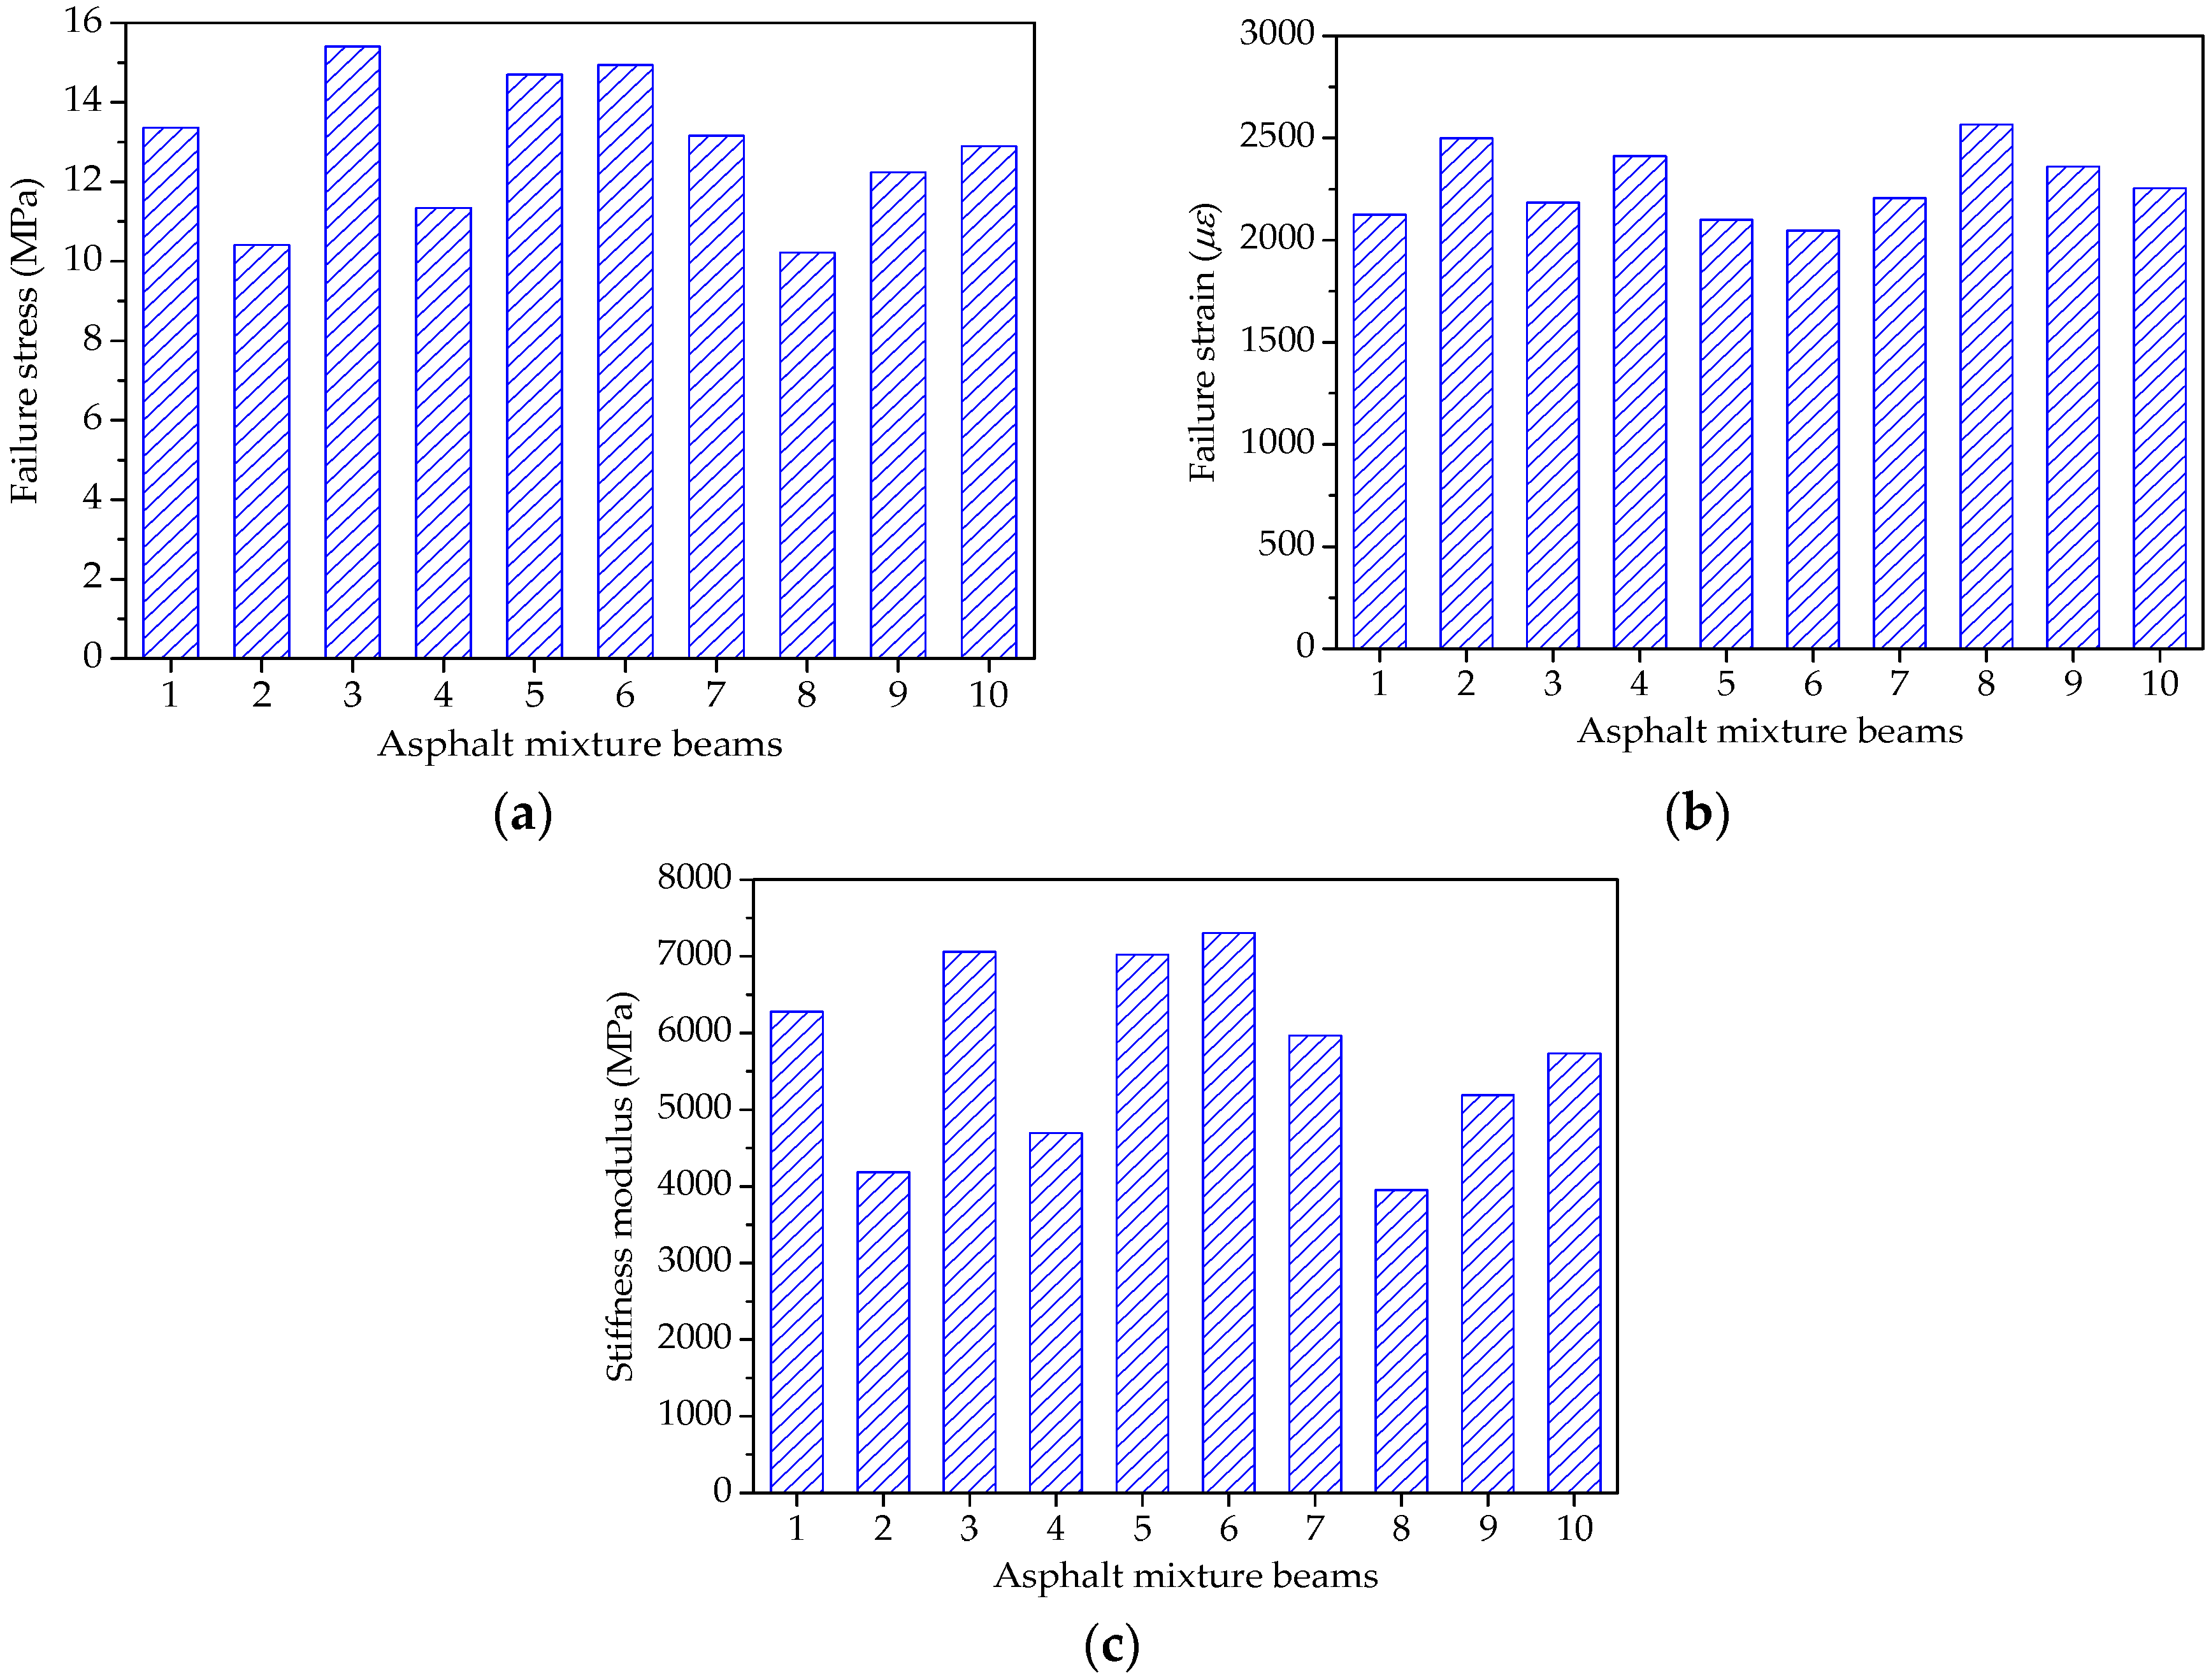
Figure 14.
Failure results of asphalt mortar beams: (a) Failure stress; (b) Failure strain; and, (c) Stiffness modulus.
Figure 14.
Failure results of asphalt mortar beams: (a) Failure stress; (b) Failure strain; and, (c) Stiffness modulus.
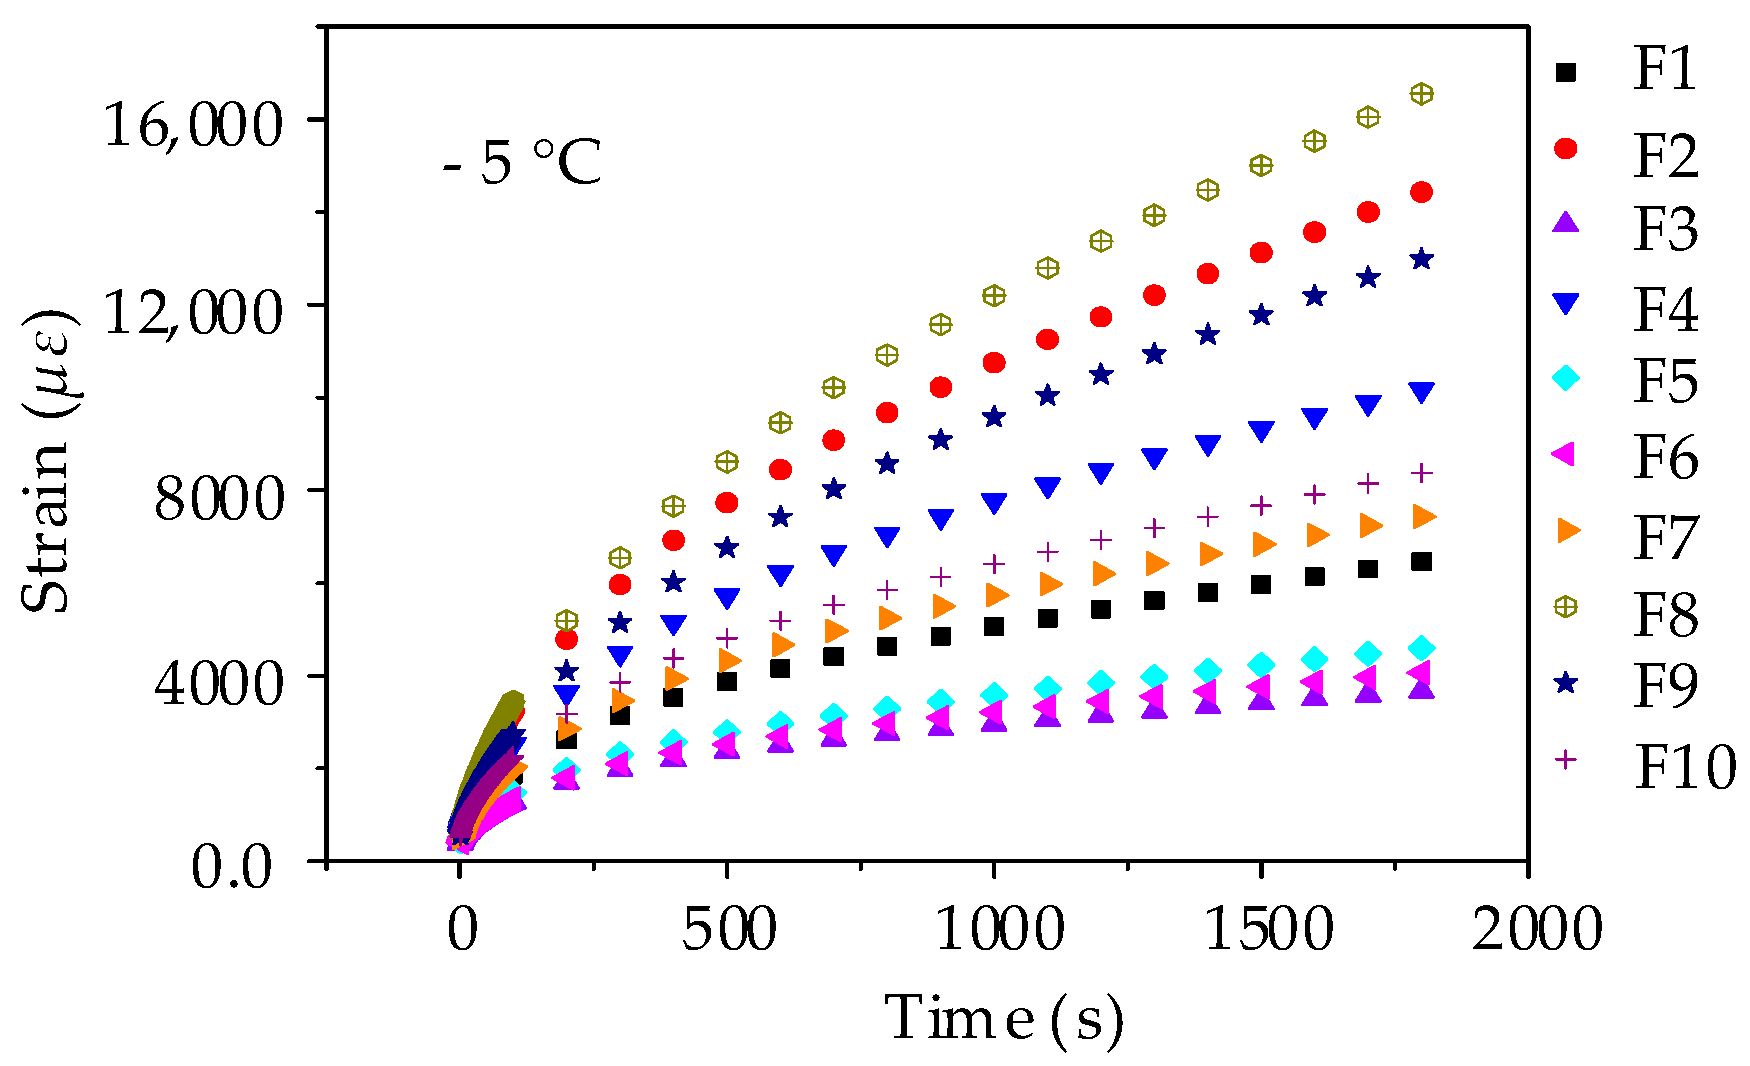
Figure 15.
Creep strain-time curves of asphalt mortar beams.
Figure 15.
Creep strain-time curves of asphalt mortar beams.
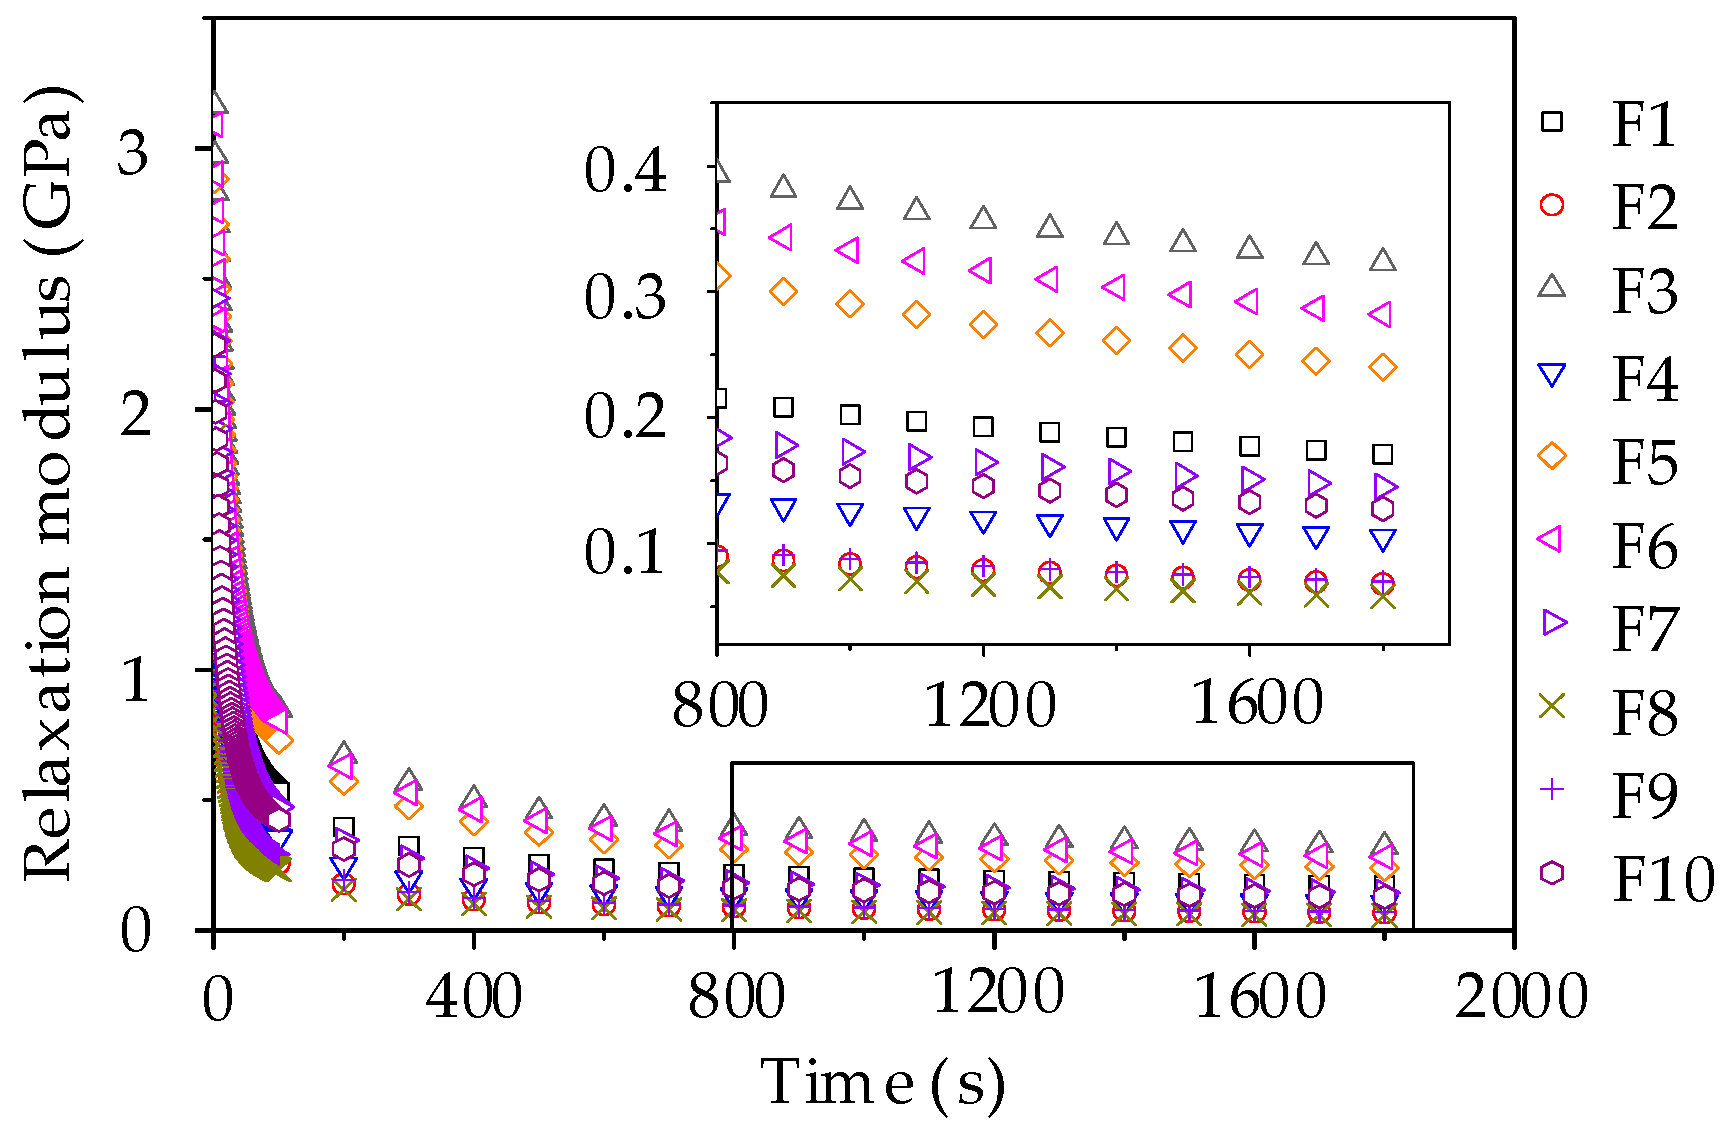
Figure 16.
Relaxation modulus curve of asphalt mortars.
Figure 16.
Relaxation modulus curve of asphalt mortars.
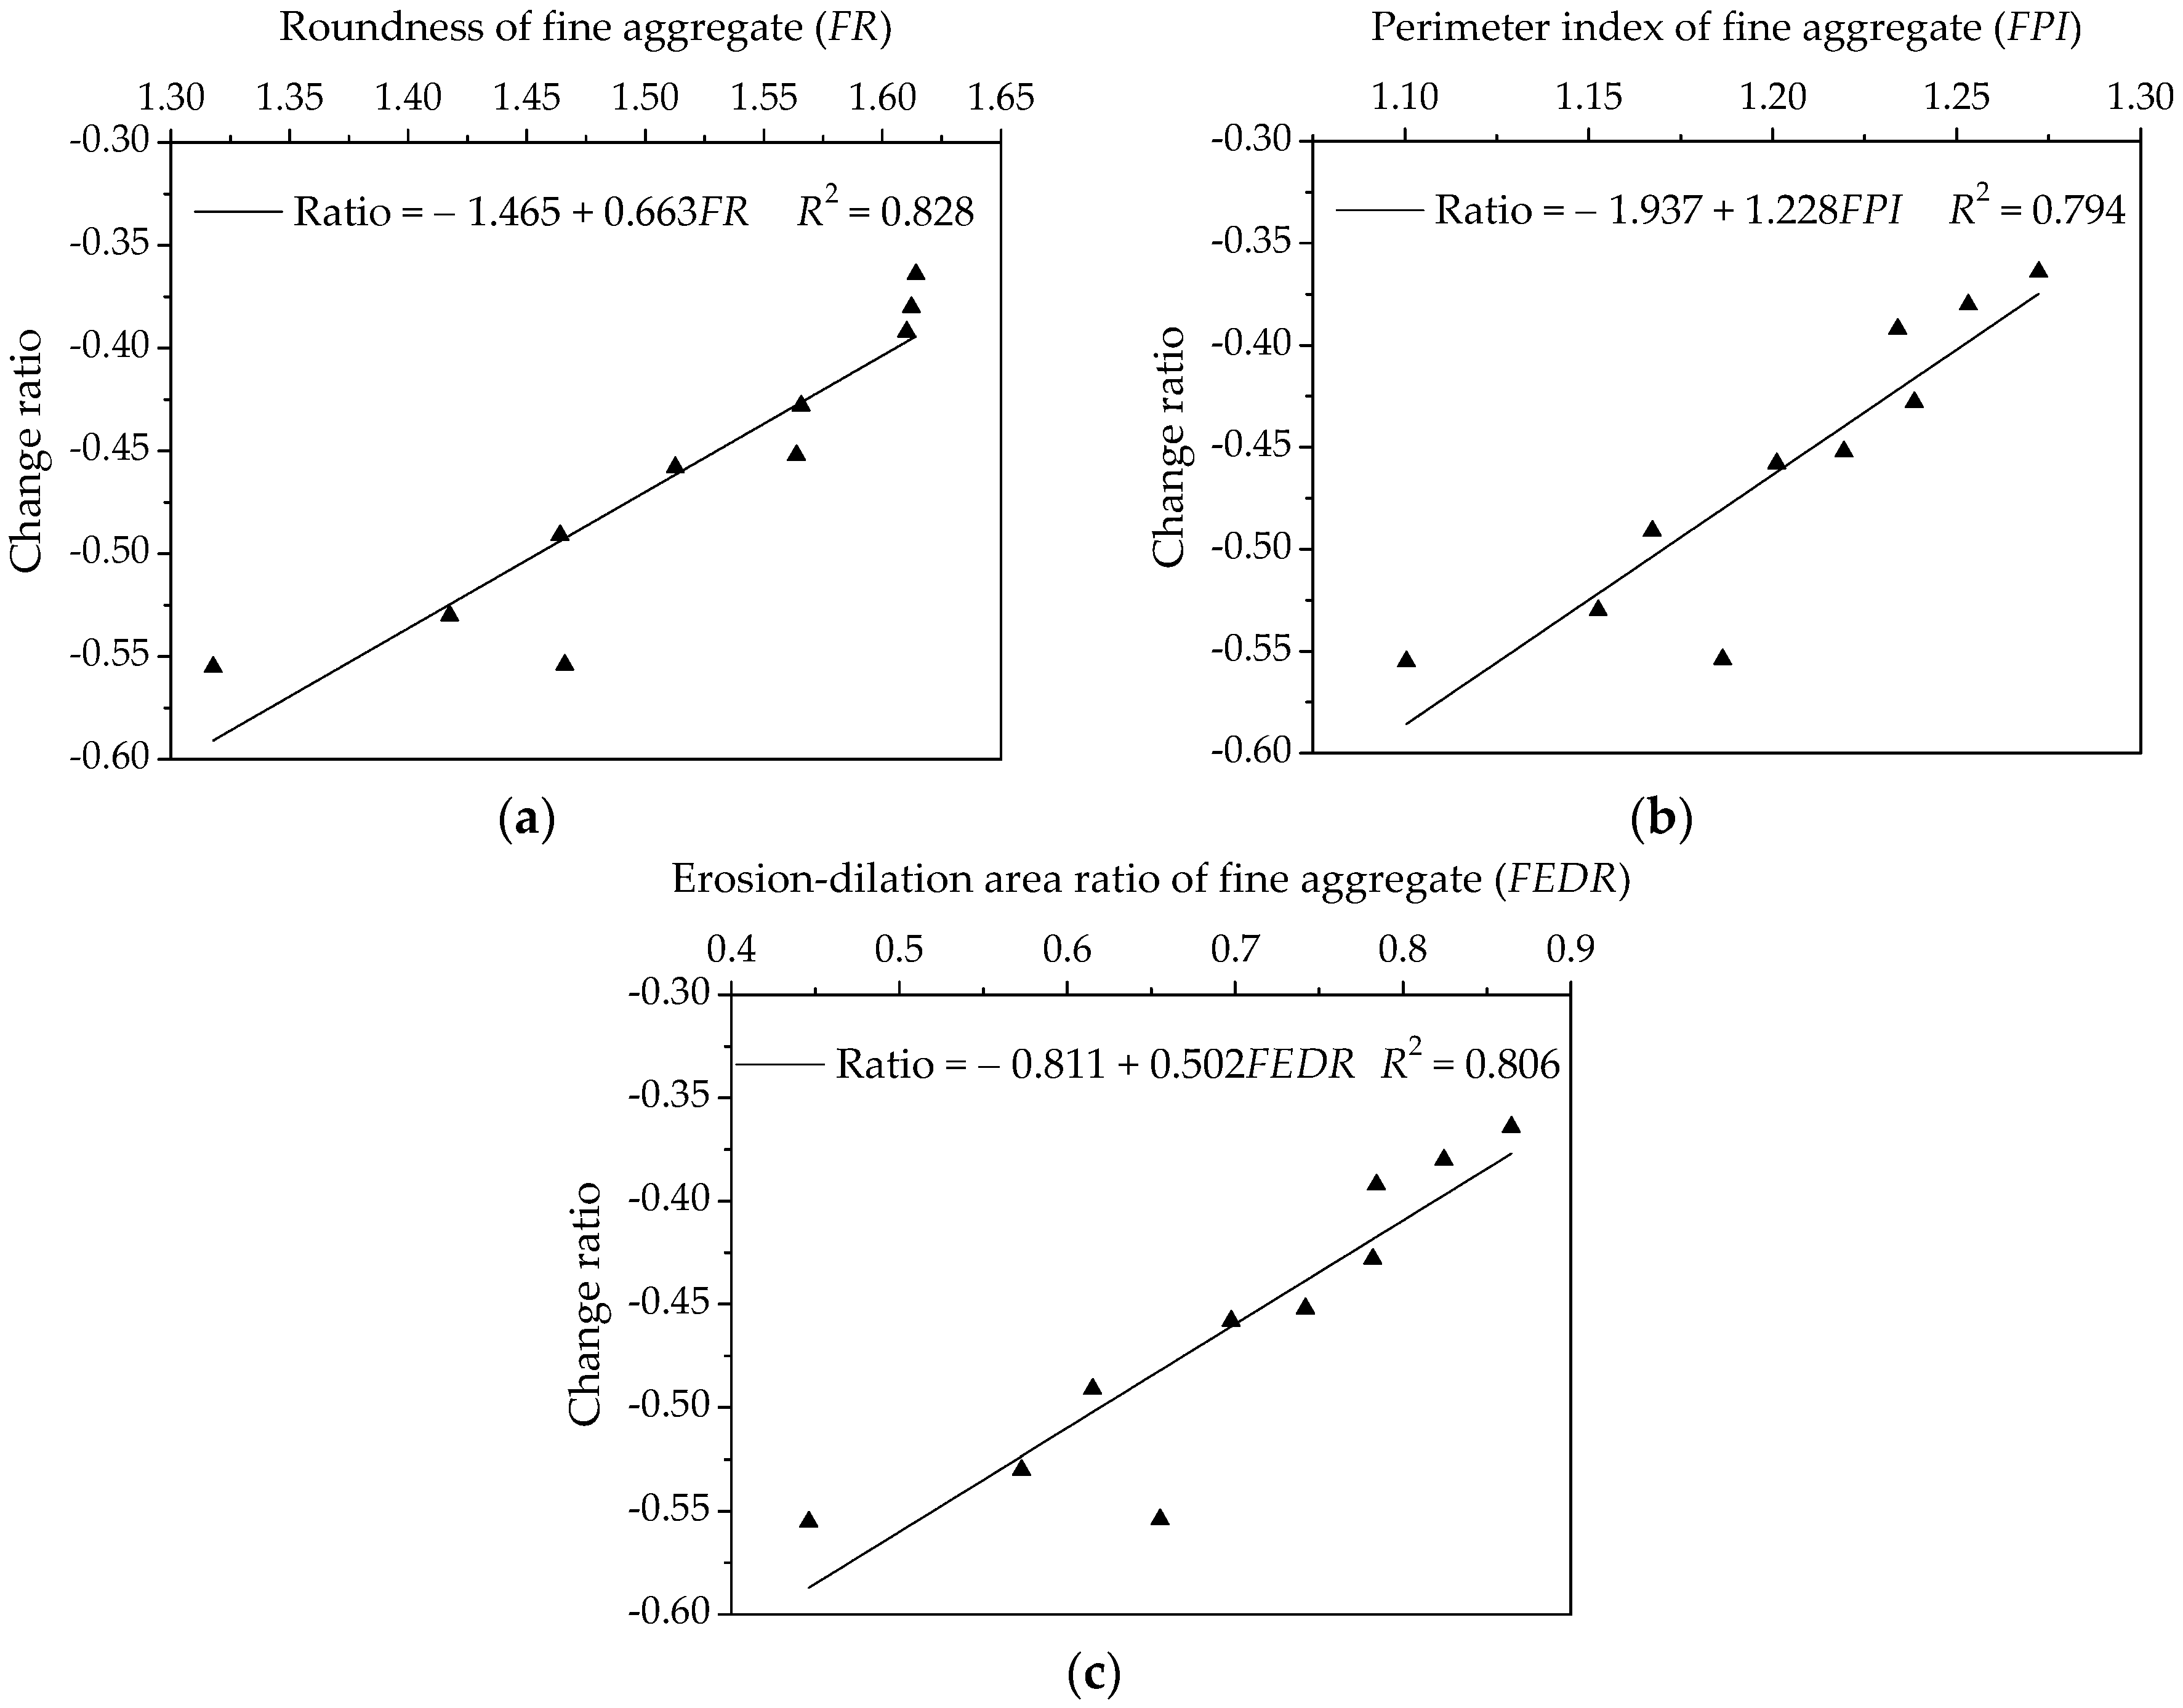
Figure 17.
Influences of fine aggregate morphological characteristics of on change rate of relaxation modulus for asphalt mortars: (a) Shape (FR); (b) Angularity (FPI); and, (c) Texture (FEDR).
Figure 17.
Influences of fine aggregate morphological characteristics of on change rate of relaxation modulus for asphalt mortars: (a) Shape (FR); (b) Angularity (FPI); and, (c) Texture (FEDR).
Figure 18.
Failure results of asphalt mixture beams: (a) Failure stress; (b) Failure strain; and, (c) Stiffness modulus.
Figure 18.
Failure results of asphalt mixture beams: (a) Failure stress; (b) Failure strain; and, (c) Stiffness modulus.
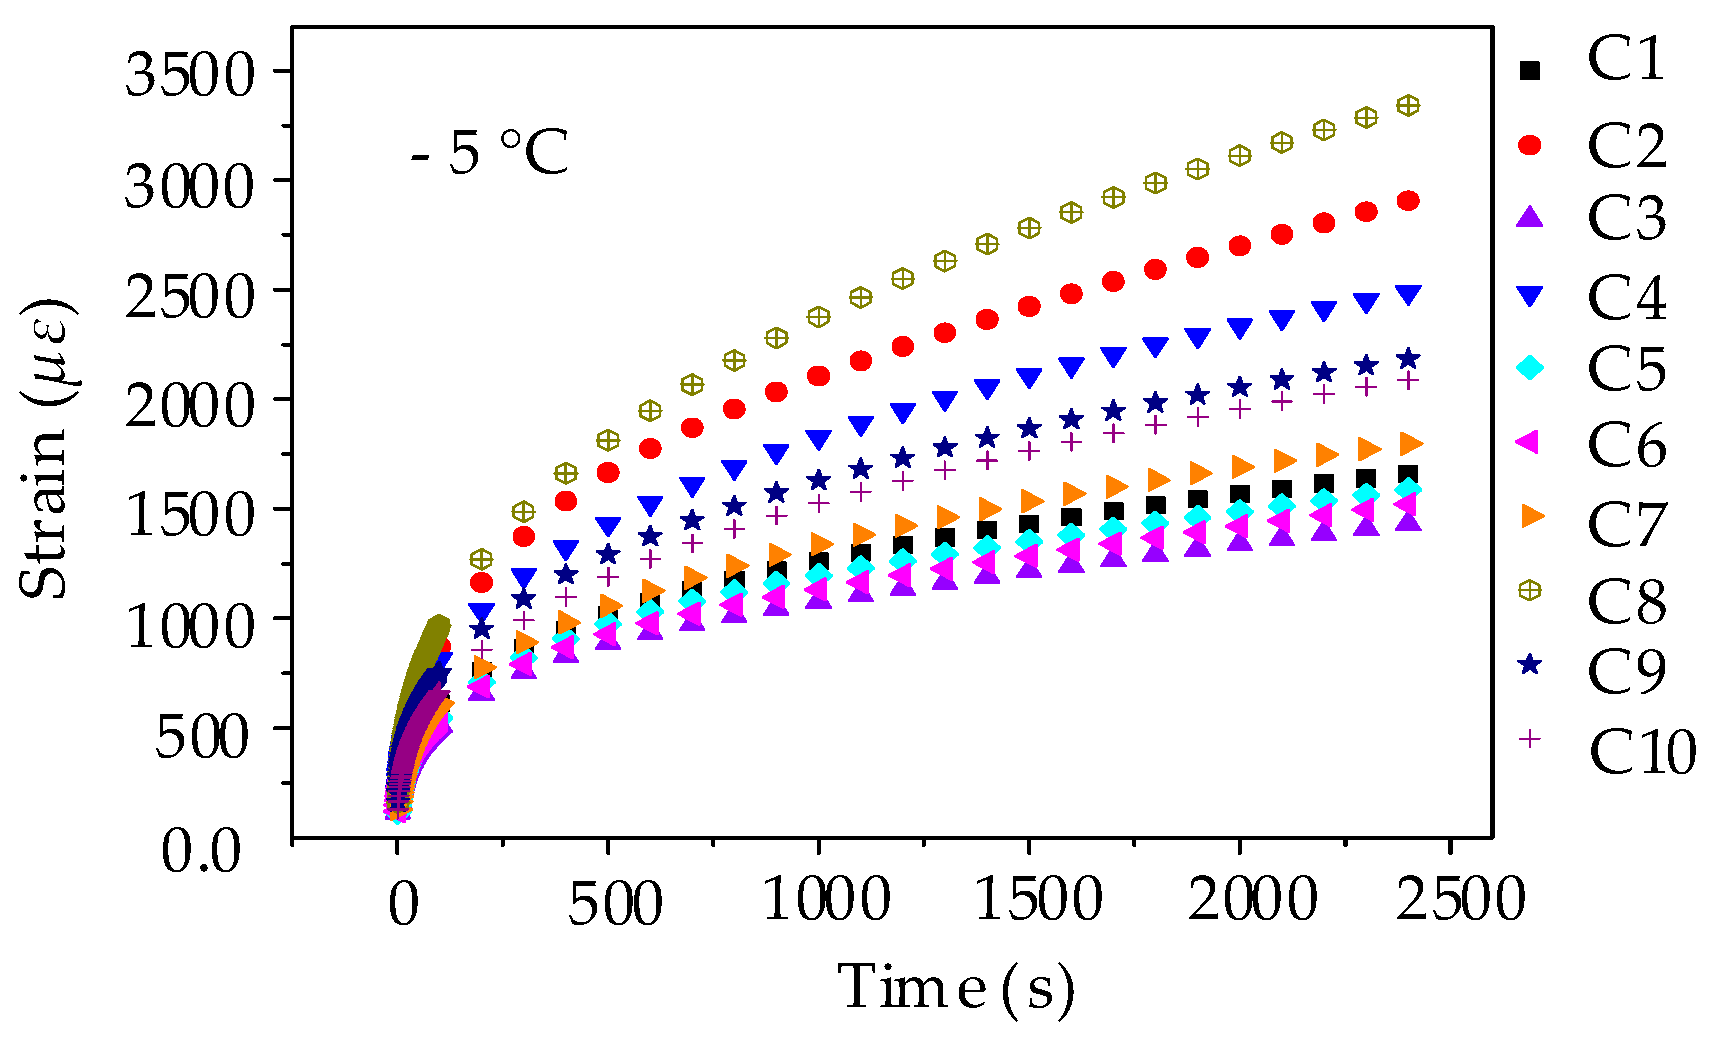
Figure 19.
Creep strain-time curves of asphalt mixture beams.
Figure 19.
Creep strain-time curves of asphalt mixture beams.
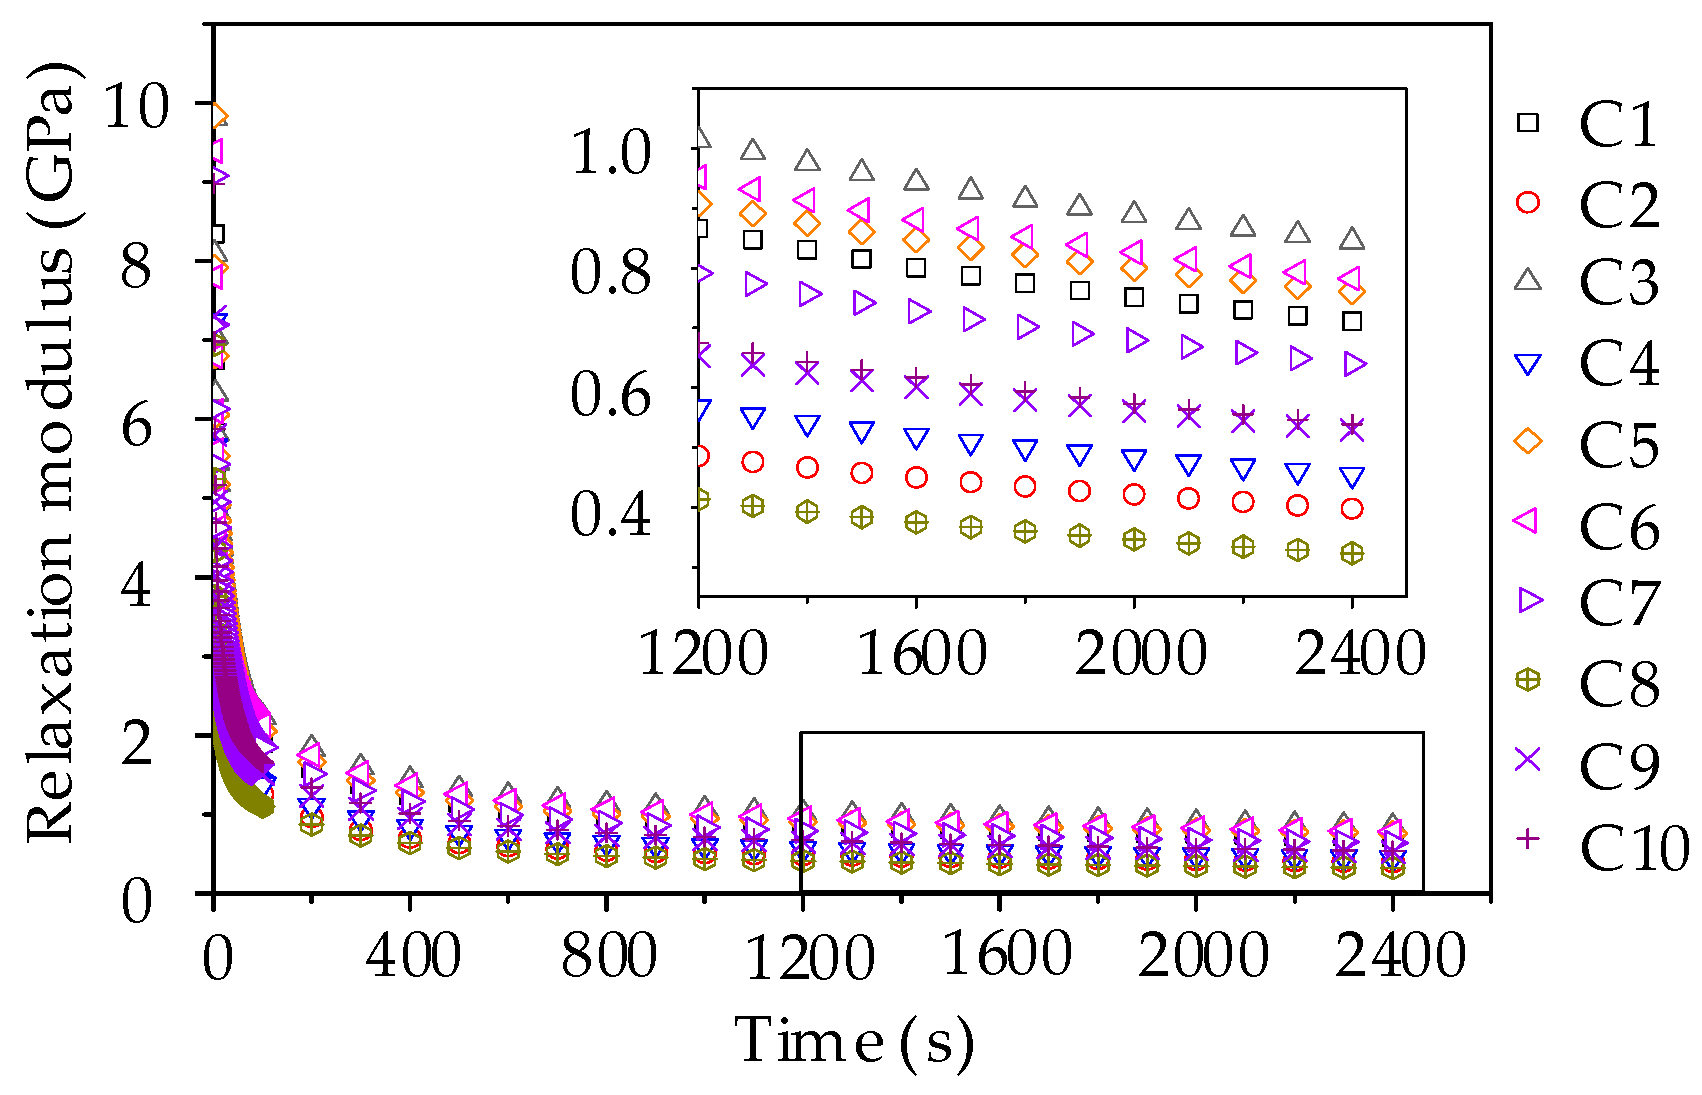
Figure 20.
Relaxation modulus curve of asphalt mixtures.
Figure 20.
Relaxation modulus curve of asphalt mixtures.
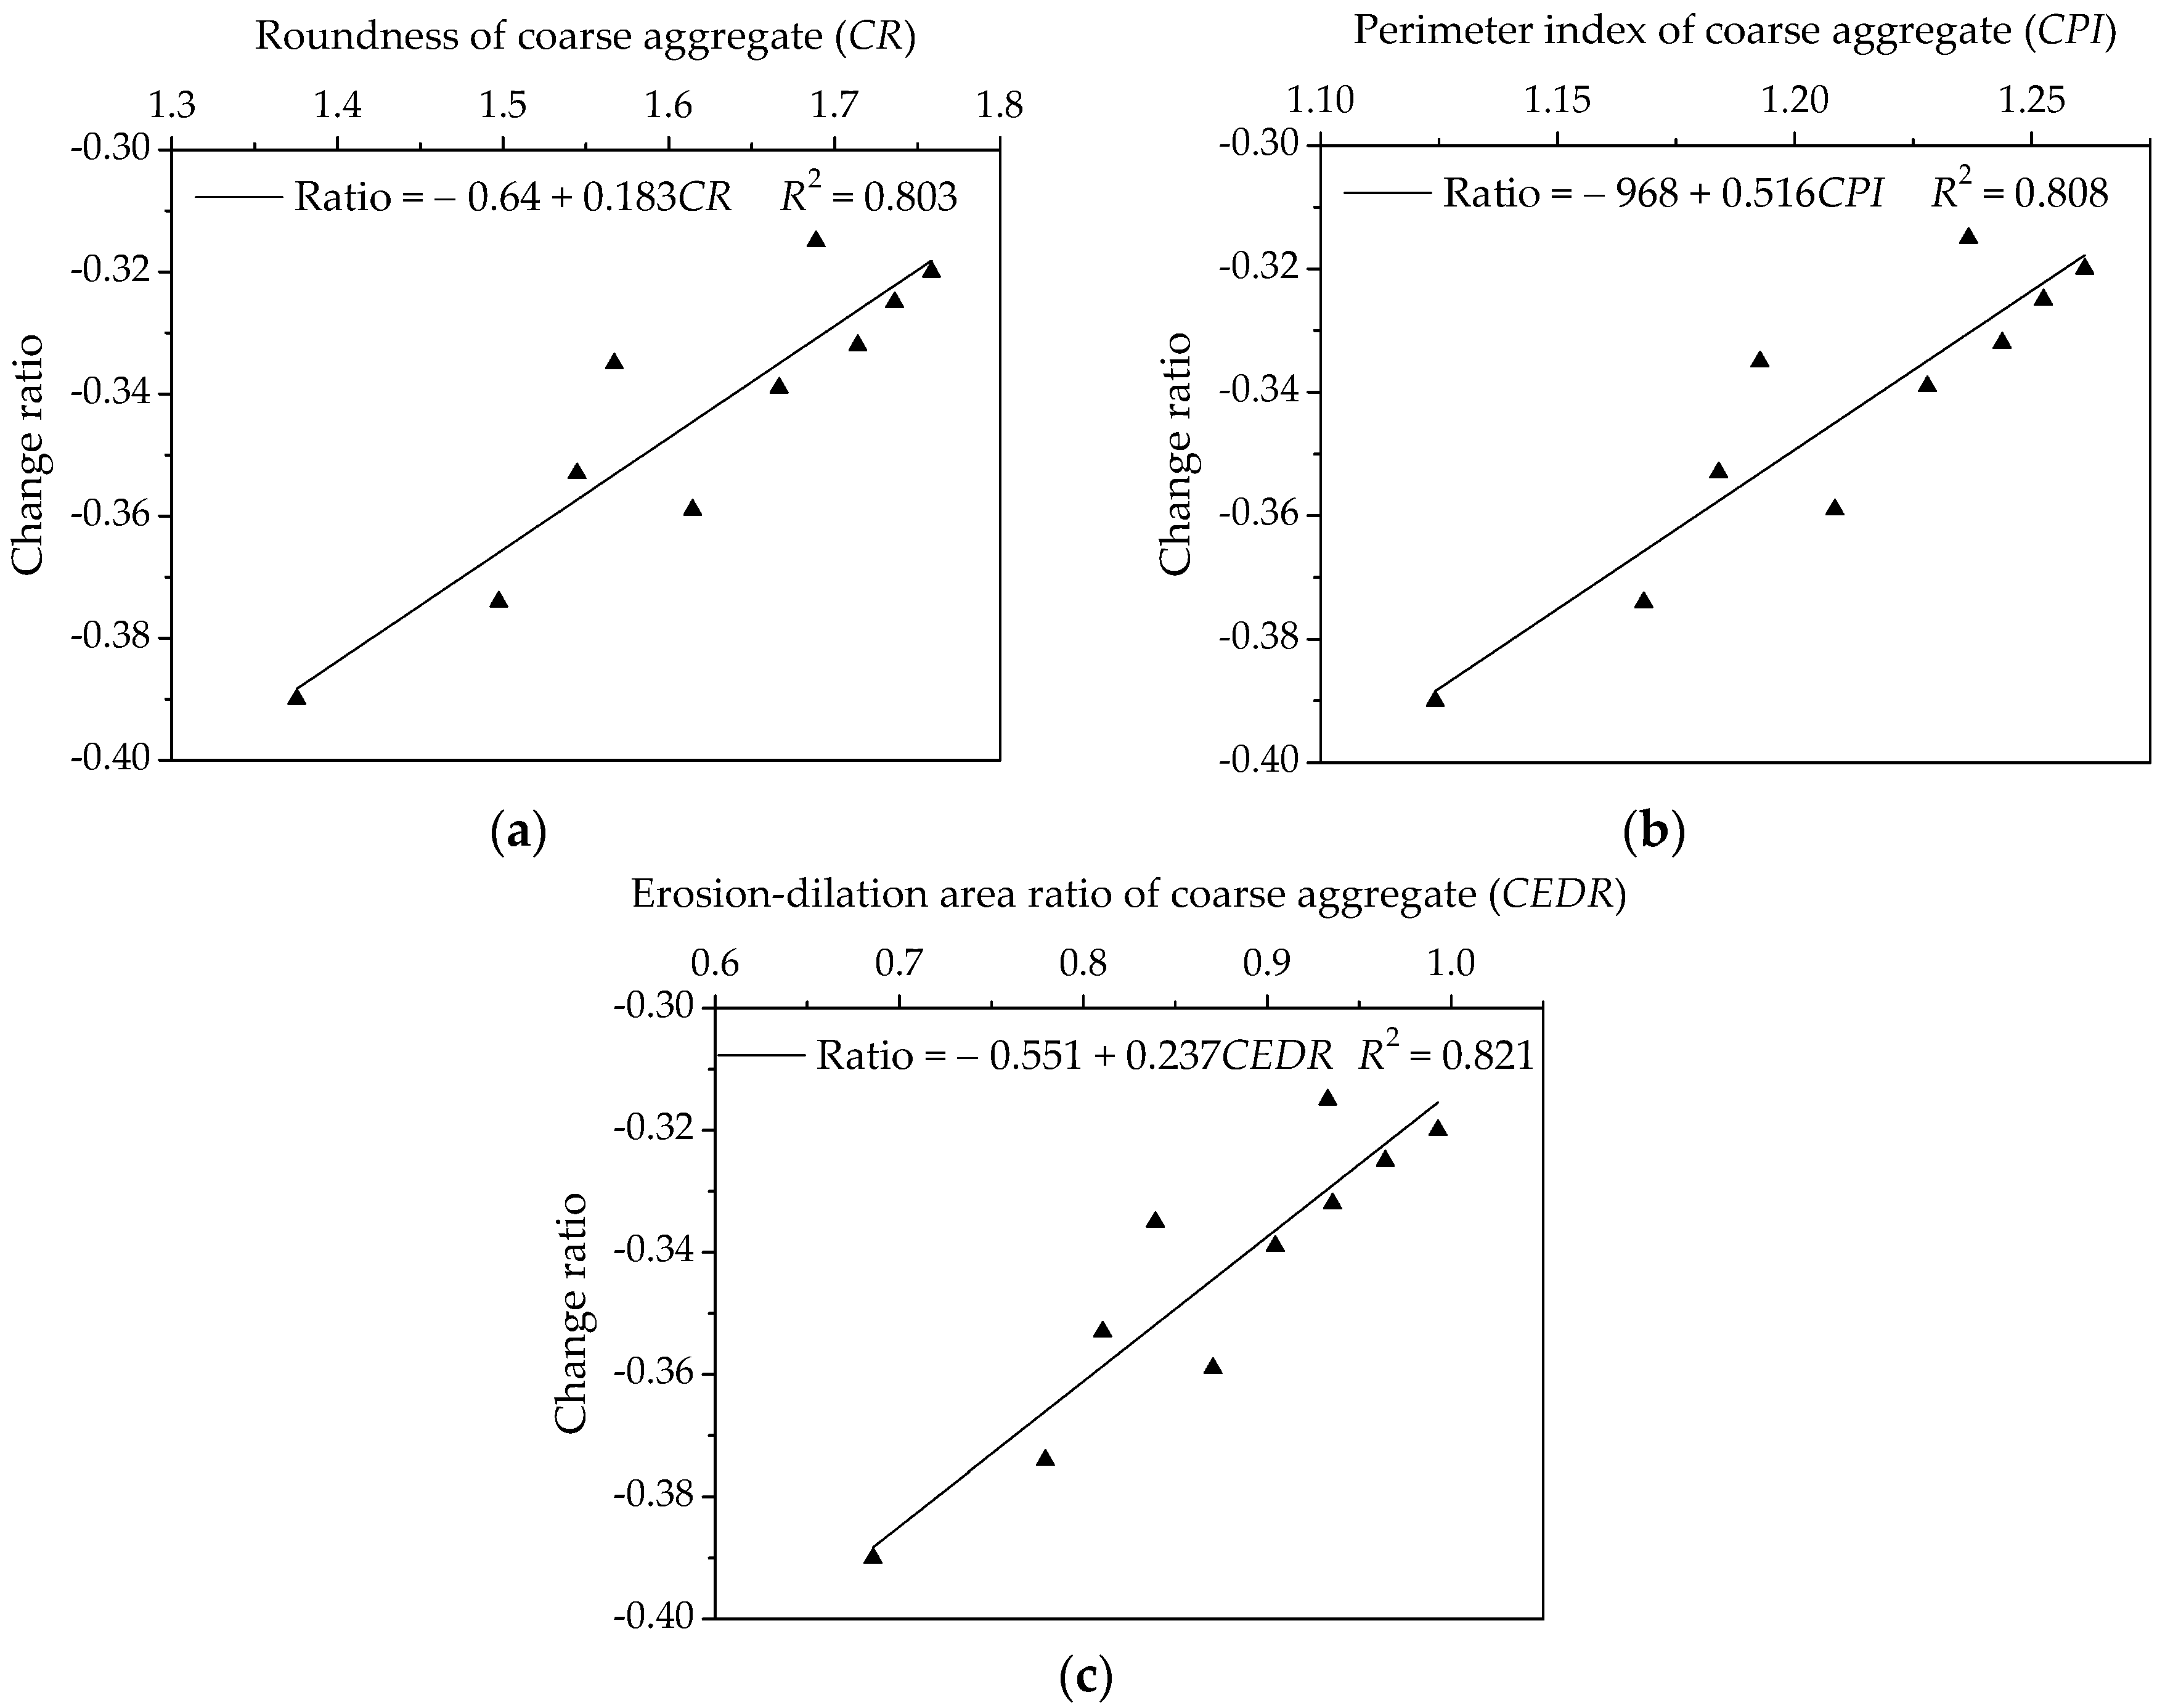
Figure 21.
Influences of coarse aggregate morphological characteristics of on change rate of relaxation modulus for asphalt mixtures: (a) Shape (CR); (b) Angularity (CPI); and, (c) Texture (CEDR).
Figure 21.
Influences of coarse aggregate morphological characteristics of on change rate of relaxation modulus for asphalt mixtures: (a) Shape (CR); (b) Angularity (CPI); and, (c) Texture (CEDR).
Table 1.
Physical properties of base asphalt AH-90.
Table 1.
Physical properties of base asphalt AH-90.
| Property | Unit | Measurement | Technical Criterion |
|---|
| Penetration @ 25 °C, 100 g, 5 s | 0.1 mm | 90 | 80~100 |
| Softening point | °C | 42.6 | ≥42 |
| Ductility @ 15 °C, 5 cm/min | cm | 195.2 | ≥100 |
| Density @ 15 °C | g/cm3 | 1.014 | - |
| After TFOT |
| Mass loss | % | 0.37 | ±0.8 |
| Penetration ratio @ 25 °C | % | 59 | ≥54 |
Table 2.
Properties of limestone powder.
Table 2.
Properties of limestone powder.
| Property | Specific Gravity | Specific Surface Area | Hydrophilic Coefficient | Main Composition |
|---|
| Value | 2.652 | 0.886 | 0.80 | CaCO3 |
| Unit | g/cm3 | m2/g | - | - |
Table 3.
Apparent densities of coarse and fine aggregates (Unit: g/cm3).
Table 3.
Apparent densities of coarse and fine aggregates (Unit: g/cm3).
| Size (mm) | 13.2 | 9.5 | 4.75 | 2.36 | 1.18 | 0.6 | 0.3 | 0.15 | 0.075 |
|---|
| Basalt | 2.782 | 2.774 | 2.770 | 2.758 | 2.713 | 2.720 | 2.699 | 2.647 | 2.700 |
| Andesite | 2.785 | 2.853 | 2.729 | 2.717 | 2.658 | 2.701 | 2.639 | 2.645 | 2.648 |
| Pebble/River Sand | 2.656 | 2.644 | 2.645 | 2.636 | 2.624 | 2.606 | 2.635 | 2.698 | 2.597 |
Table 4.
Properties of coarse aggregate.
Table 4.
Properties of coarse aggregate.
| Property | Natural Bulk Density (%) | Tapped Bulk Density (%) | Wearing Value (%) |
|---|
| Basalt Stone | 1.511 | 1.636 | 10.18 |
| Andesite Stone | 1.502 | 1.635 | 11.26 |
| Pebble | 1.536 | 1.640 | 23.64 |
Table 5.
Experimental proportion design based on simplex lattice design (SLD).
Table 5.
Experimental proportion design based on simplex lattice design (SLD).
| Mix Component | Sample Group |
|---|
| 1 | 2 | 3 | 4 | 5 | 6 | 7 | 8 | 9 | 10 |
|---|
| Basalt | 0.167 | 0.167 | 0.000 | 0.500 | 1.000 | 0.500 | 0.667 | 0.000 | 0.000 | 0.333 |
| Andesite | 0.667 | 0.167 | 1.000 | 0.000 | 0.000 | 0.500 | 0.167 | 0.000 | 0.500 | 0.333 |
| Pebble/River Sand | 0.167 | 0.667 | 0.000 | 0.500 | 0.000 | 0.000 | 0.167 | 1.000 | 0.500 | 0.333 |
Table 6.
Each component content of asphalt mixes.
Table 6.
Each component content of asphalt mixes.
| Component | Proportion | Aggregate | Filler | Asphalt | Air Void |
|---|
| Asphalt Mixture | Mass (%) | 89.5 | 5.7 | 4.8 | - |
| Volume (%) | 79.3 | 5.2 | 11.5 | 4 |
| Asphalt Mortar | Mass (%) | 74.1 | 14.3 | 11.6 | - |
| Volume (%) | 59.8 | 11.6 | 24.6 | 4 |
Table 7.
Composite morphological index of fine and coarse aggregates.
Table 7.
Composite morphological index of fine and coarse aggregates.
| Group | 1 | 2 | 3 | 4 | 5 | 6 | 7 | 8 | 9 | 10 |
|---|
| Asphalt Mortar | F1 | F2 | F3 | F4 | F5 | F6 | F7 | F8 | F9 | F10 |
| FR | 1.5658 | 1.4175 | 1.6143 | 1.4641 | 1.6103 | 1.6123 | 1.5638 | 1.3178 | 1.4661 | 1.5127 |
| FPI | 1.2385 | 1.1526 | 1.2723 | 1.1673 | 1.2340 | 1.2532 | 1.2194 | 1.1005 | 1.1864 | 1.2011 |
| FEDR | 0.7821 | 0.5729 | 0.8645 | 0.6151 | 0.7842 | 0.8244 | 0.7419 | 0.4461 | 0.6553 | 0.6976 |
| Asphalt Mixture | C1 | C2 | C3 | C4 | C5 | C6 | C7 | C8 | C9 | C10 |
| CR | 1.6889 | 1.4974 | 1.7586 | 1.5447 | 1.7140 | 1.7363 | 1.6666 | 1.3755 | 1.5671 | 1.6144 |
| CPI | 1.2367 | 1.1682 | 1.2612 | 1.1840 | 1.2438 | 1.2525 | 1.2280 | 1.1242 | 1.1927 | 1.2085 |
| CEDR | 0.9329 | 0.7794 | 0.9928 | 0.8106 | 0.9355 | 0.9642 | 0.9043 | 0.6857 | 0.8392 | 0.8705 |
Table 8.
Fitting results of Prony series for asphalt mortars.
Table 8.
Fitting results of Prony series for asphalt mortars.
| Group | F1 | F2 | F3 | F4 | F5 | F6 | F7 | F8 | F9 | F10 |
|---|
| E∞ (GPa) | 7.67 | 10.79 | 8.74 | 7.61 | 8.62 | 8.61 | 7.45 | 9.58 | 6.50 | 9.25 |
| E1 (GPa) | 4.28 | 2.72 | 5.72 | 3.79 | 5.00 | 5.57 | 4.24 | 2.84 | 4.03 | 3.47 |
| E2 (GPa) | 19.84 | 24.74 | 24.00 | 18.32 | 24.05 | 23.99 | 19.43 | 23.47 | 19.15 | 22.71 |
| E3 (GPa) | 1.77 | 1.10 | 2.51 | 1.46 | 2.11 | 2.38 | 1.70 | 1.10 | 1.44 | 1.45 |
| E4 (GPa) | 0.52 | 0.25 | 0.90 | 0.32 | 0.86 | 0.89 | 0.45 | 0.23 | 0.29 | 0.42 |
| E5 (GPa) | 0.17 | 0.06 | 0.37 | 0.10 | 0.23 | 0.29 | 0.14 | 0.05 | 0.06 | 0.12 |
| R 2 | 0.9991 | 0.9985 | 0.9989 | 0.9994 | 0.9995 | 0.9987 | 0.9992 | 0.9996 | 0.9998 | 0.9997 |
Table 9.
Fitting results of Prony series for asphalt mixtures.
Table 9.
Fitting results of Prony series for asphalt mixtures.
| Group | C1 | C2 | C3 | C4 | C5 | C6 | C7 | C8 | C9 | C10 |
|---|
| E∞ (GPa) | 19.66 | 11.31 | 30.16 | 18.80 | 27.41 | 32.27 | 22.70 | 20.15 | 18.09 | 23.68 |
| E1 (GPa) | 28.14 | 8.52 | 26.22 | 25.60 | 30.06 | 23.55 | 31.49 | 25.85 | 25.21 | 32.00 |
| E2 (GPa) | 10.06 | 34.84 | 12.52 | 7.96 | 11.62 | 12.21 | 10.31 | 7.15 | 8.36 | 9.76 |
| E3 (GPa) | 5.17 | 4.05 | 6.14 | 3.73 | 5.80 | 5.74 | 5.00 | 3.05 | 4.09 | 4.51 |
| E4 (GPa) | 2.67 | 1.31 | 2.87 | 1.79 | 2.43 | 2.84 | 2.47 | 1.37 | 2.03 | 2.14 |
| E5 (GPa) | 0.85 | 0.46 | 1.05 | 0.50 | 0.96 | 0.93 | 0.73 | 0.34 | 0.60 | 0.59 |
| R 2 | 0.9999 | 0.9996 | 0.9985 | 0.9994 | 0.9996 | 0.9989 | 0.9992 | 0.9994 | 0.9999 | 0.9993 |
Table 10.
Optimal value of multi-response for asphalt mortar.
Table 10.
Optimal value of multi-response for asphalt mortar.
| Property | High-Temperature Property | Low-Temperature Property |
|---|
| Failure Stress (MPa) | Retardation Time (s) | Bending Strain | Change Rate |
|---|
| Prediction | 2.98 | 150 | 5393 | −0.523 |
| Experiment | 3.06 | 145 | 5587 | −0.531 |
| Relative Error (%) | 2.7 | −3.3 | 3.6 | 1.5 |
Table 11.
Optimal value of multi-response for asphalt mixture.
Table 11.
Optimal value of multi-response for asphalt mixture.
| Property | High-Temperature Property | Low-Temperature Property |
|---|
| Failure Stress (MPa) | Retardation Time (s) | Bending Strain | Change Rate |
|---|
| Prediction | 3.15 | 81.6 | 2330 | −0.356 |
| Experiment | 3.21 | 86.5 | 2438 | −0.349 |
| Relative Error (%) | 1.9 | 6 | 4.6 | −2 |

