Article

Investigation on the Design Space of the Primary Drying Stage of Spray-Freeze-Drying Technology

1
MCC (Xiangtan) Heavy Industrial Equipment Co., Ltd., Xiangtan 411100, China
2
School of Electrical and Information Engineering, Hunan Institute of Engineering, Xiangtan 411100, China
3
School of Civil Engineering, Hunan University of Science and Technology, Xiangtan 411100, China
4
The Second Construction Co., Ltd. (CTCE Group), Suzhou 215100, China
*
Author to whom correspondence should be addressed.
Energies 2026, 19(8), 1989; https://doi.org/10.3390/en19081989
Submission received: 2 February 2026 / Revised: 12 April 2026 / Accepted: 17 April 2026 / Published: 20 April 2026
(This article belongs to the Section J1: Heat and Mass Transfer)

Abstract

Spray-freeze-drying technology has gained considerable interest worldwide. However, the high energy consumption and lengthy process duration have hindered its further development. The primary drying stage accounts for the largest proportion of both the total energy consumption and process duration. To improve the energy utilization efficiency of the drying stage, a mathematical model describing the drying stage was established. The obtained drying time and maximum product temperature were selected to represent the drying efficiency and the risk of failure, respectively. The design space of the drying stage was then constructed. The results show that the mathematical model gives an accurate description of the drying stage, and increasing the shelf temperature and decreasing the chamber pressure would be beneficial for improving drying efficiency but unfavorable for reducing the risk of failure. In addition, the drying efficiency shows higher sensitivity to the change in the operating conditions compared with the risk of failure. Moreover, the packing porosity is found to affect the design space. A lower packing porosity is found to expand the design space, allowing for a wider range of operating conditions. This study provides insights into the drying process and supports the optimization of operating parameters.

1. Introduction

Spray-freeze-drying technology is a novel method to remove the water in the products. It is mainly composed of three steps: the atomization, freezing and the drying stage [1]. The solution is firstly to be atomized to form droplets, and the droplets are then in contact with cold medium to be frozen. The frozen particles then sublimate under the vacuum conditions in the subsequent drying stage. There are different drying methods to remove the ice crystals, including conventional freeze-drying chambers, vacuum-assisted fluidized bed, microwave-assisted freeze drying, or other coupled systems [2]. And, finally, the dried products are then obtained.
The spray-freeze-drying technology offers several advantages over other drying technologies, such as better preservation of the products [3], less damage to the thermos-labile components [4,5] and longer shelf life [6]. Thus, the spray-freeze-drying technology has now received much attention from the scholar community and industry field. And it has been successfully applied in preparing ultra-fine powder [7], preserving bio-pharmaceuticals [8,9] and processing foods [10].
Although spray-freeze-drying technology could provide many benefits, the high energy cost and much longer duration have formed a barrier for its further development. It was reported that the drying stages are the most energy-consuming and time-consuming stages among all three sub-stages [11]. In the drying stage, the heat transfer occurring under the vacuum conditions is greatly restricted. The thermal conduction and the convection are weakened since there is little air during the drying stage [12]. It could be inferred that reducing the drying time could greatly improve the spray-freeze-drying process efficiency and further promote the development of spray-freeze-drying technology.
The main methods to reduce the drying duration are to regulate the shelf temperature and chamber pressure. Increasing the shelf temperature could make the energy input into the products become larger. However, the exorbitant energy in the products would make the product temperature exceed its collapse temperature, over which the product matrix will soften and then melt [13]. The collapse would lead to the failure of the drying process. Thus, it poses a necessity to make a compromise between reducing the drying duration and avoiding the process failure.
To address this issue, the concept of design space has been proposed [14]. The design space is defined as the relationship between the input variables and critical quality attributes (CQAs) [15]. The input variables are usually taken as the operating conditions, while CQAs usually refer to the parameters that receive attention, such as the drying time and the maximum product temperature [16,17]. They represent the drying efficiency and the risk of process failure, respectively. The design space could not only help to understand the effects of operating conditions on the CQAs [18] but also help choose the process parameters to shorten the drying duration while ensuring the process safety meanwhile.
The construction of the design space is usually achieved by simulation since building the design space experimentally would be much more time-consuming and expensive. Kyuya et al. [19] built the design spaces by introducing the pseudo-steady model describing the drying stages of the freeze-drying process and then investigated different factors impacting the design space, including the ice crystals morphology [19] and inner vapor transfer property [20]. A similar model was combined with the knowledge of ice crystals by Arsicio et al. [21] to investigate the impacts of freezing conditions on the design space of the drying stages, and they found that the freezing steps could be properly designed by using an appropriate design space. Moreover, Roland et al. [22] established a multi-vial design space for the freeze-drying process based on the pseudo-steady model, and they considered the heterogeneity between vials. In addition to the simplified pseudo-steady model, Luo et al. [23] established a transient model and built a design space for the initially unsaturated samples and studied the effects of different initial saturation on the design space of the drying stage during the freeze-drying process.
These works mentioned above give highly valuable insights for building the design space of the drying stage of the freeze-drying process. However, these works suffer from the limitation that they could not be directly used for the spray-freeze-drying process. There are distinct differences between the spray-freeze-drying and freeze-drying process [24,25]. The products to be dried in the freeze drying come from the freezing of solution, while that in the spray-freeze-drying process comes from the freezing of the droplets. The structure of the products used in freeze drying and spray freeze drying are different; the products in the freeze-drying process are dense and with no voids, while the products in the spray-freeze-drying technology could be viewed as the porous media. Thus, the heat and mass transfer mechanisms are different. And the approach to build the design space of the spray-freeze-drying technology should be developed.
However, there is little literature reporting the construction of the design space of the drying stage during the spray-freeze-drying process. There is plenty of research investigating the effects of individual parameters and the sensitivity analysis [26,27]. A comprehensive design space, defined as the multidimensional combination of process parameters that assures product quality through a mechanistic understanding, has yet to be established for SFD. This paper aims to build the design space of the drying stage of spray freeze drying and provide guidance for the optimization of the drying stage.
This paper is organized as follows: The methods of building the design space and the modeling of the drying stage are depicted in Section 2. Section 3 illustrates the implementation and validation of the mathematical model. Additionally, Section 4 discusses the design space and investigates the impacts of geometry parameters on the design space. The paper ends with the conclusions in Section 5.

2. Mathematical Model

2.1. Construction of the Design Space

The primary drying time and the maximum product temperature during the drying stage are taken to be the CQAs. The selected CQAs represent the drying efficiency and drying safety, respectively. In the drying stage, the product temperature above the collapse temperature would lead to the failure of the drying process. Thus, the maximum product temperature could reflect the risk of process failure.
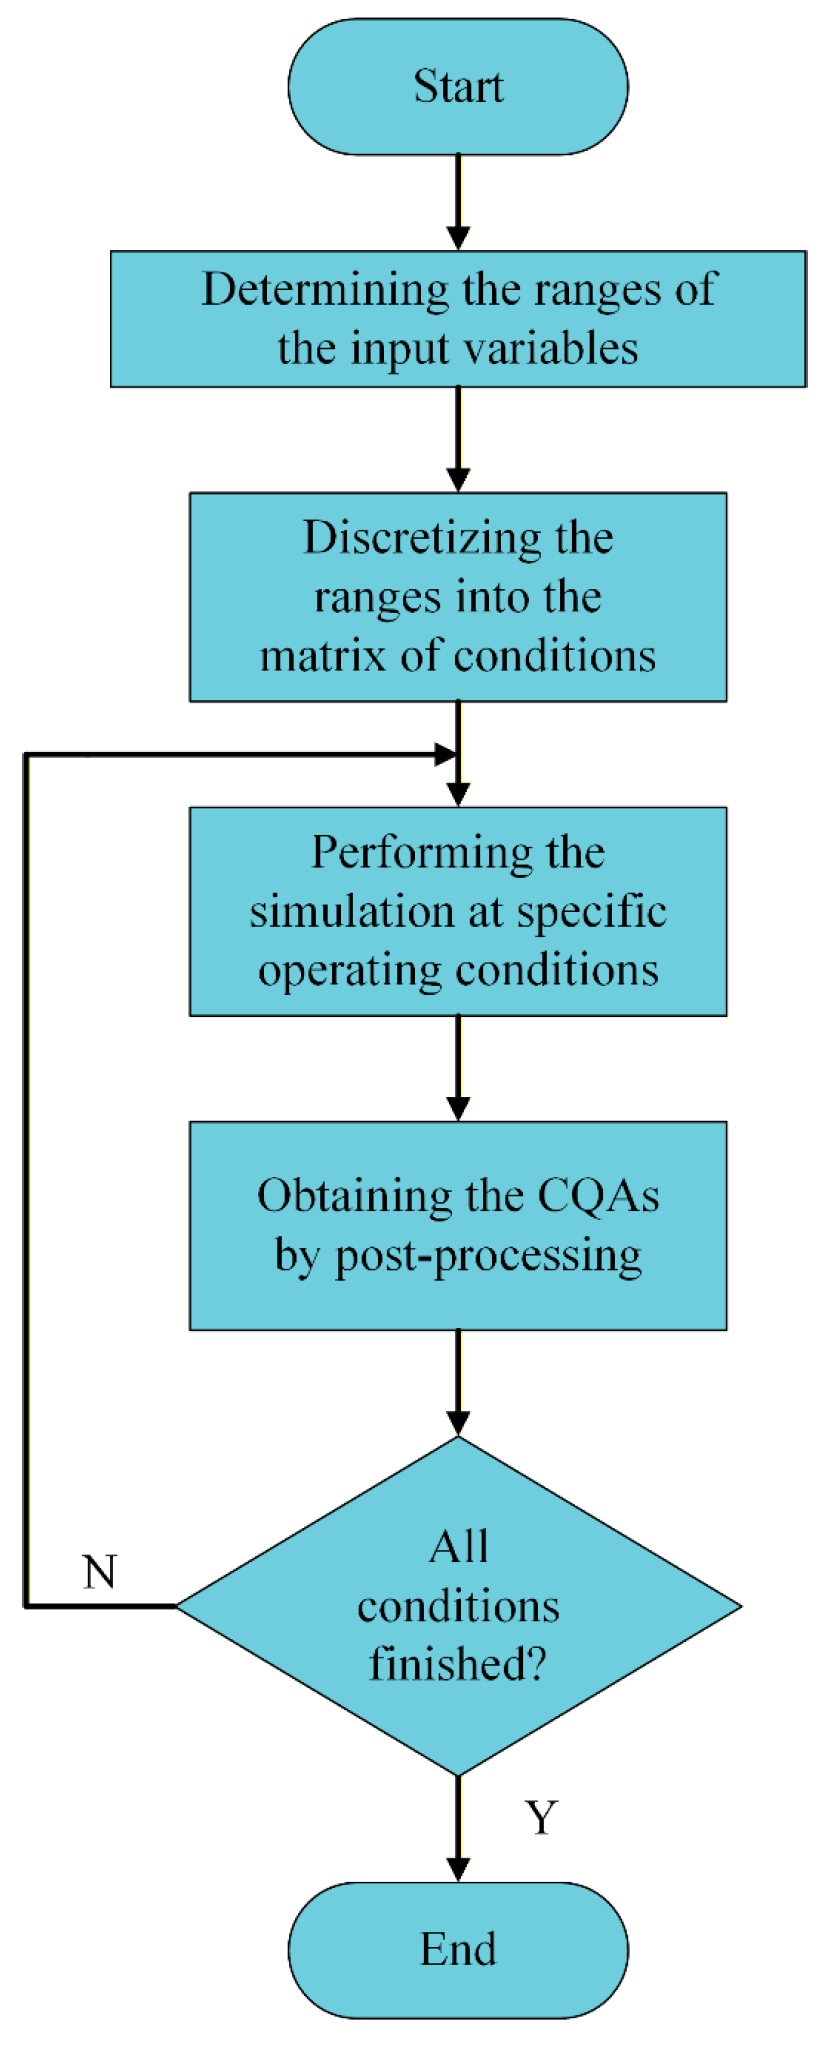
The design space for the primary drying stage is constructed mainly based on the simulation results, as illustrated in Figure 1. The procedure is made up of four main steps. Firstly, the critical process parameters (CPPs)—specifically, the shelf temperature and chamber pressure—are selected as input variables, since they are the main process parameters during the drying stage. Secondly, the mathematical model described in Section 2.2 is employed to simulate the drying process across a range of CPPs combinations. For each combination, the drying time and the maximum temperature were obtained from the simulation results. Thirdly, the obtained drying time and maximum temperature were imported into the Origin 2022 (OriginLab Corporation, Northampton, MA, USA) to generate contour plots of the CQAs. Finally, by applying the collapse temperature as a constraint, the region where the maximum product temperature remains below the collapse temperature was identified, thereby defining the design space boundary.

2.2. Modeling the Drying Stage

The drying stage of the ovalbumin solution was investigated in this paper, since it is a standard model protein widely used in the spray-freeze-drying research and there are adequate experimental data on the drying of ovalbumin solution.
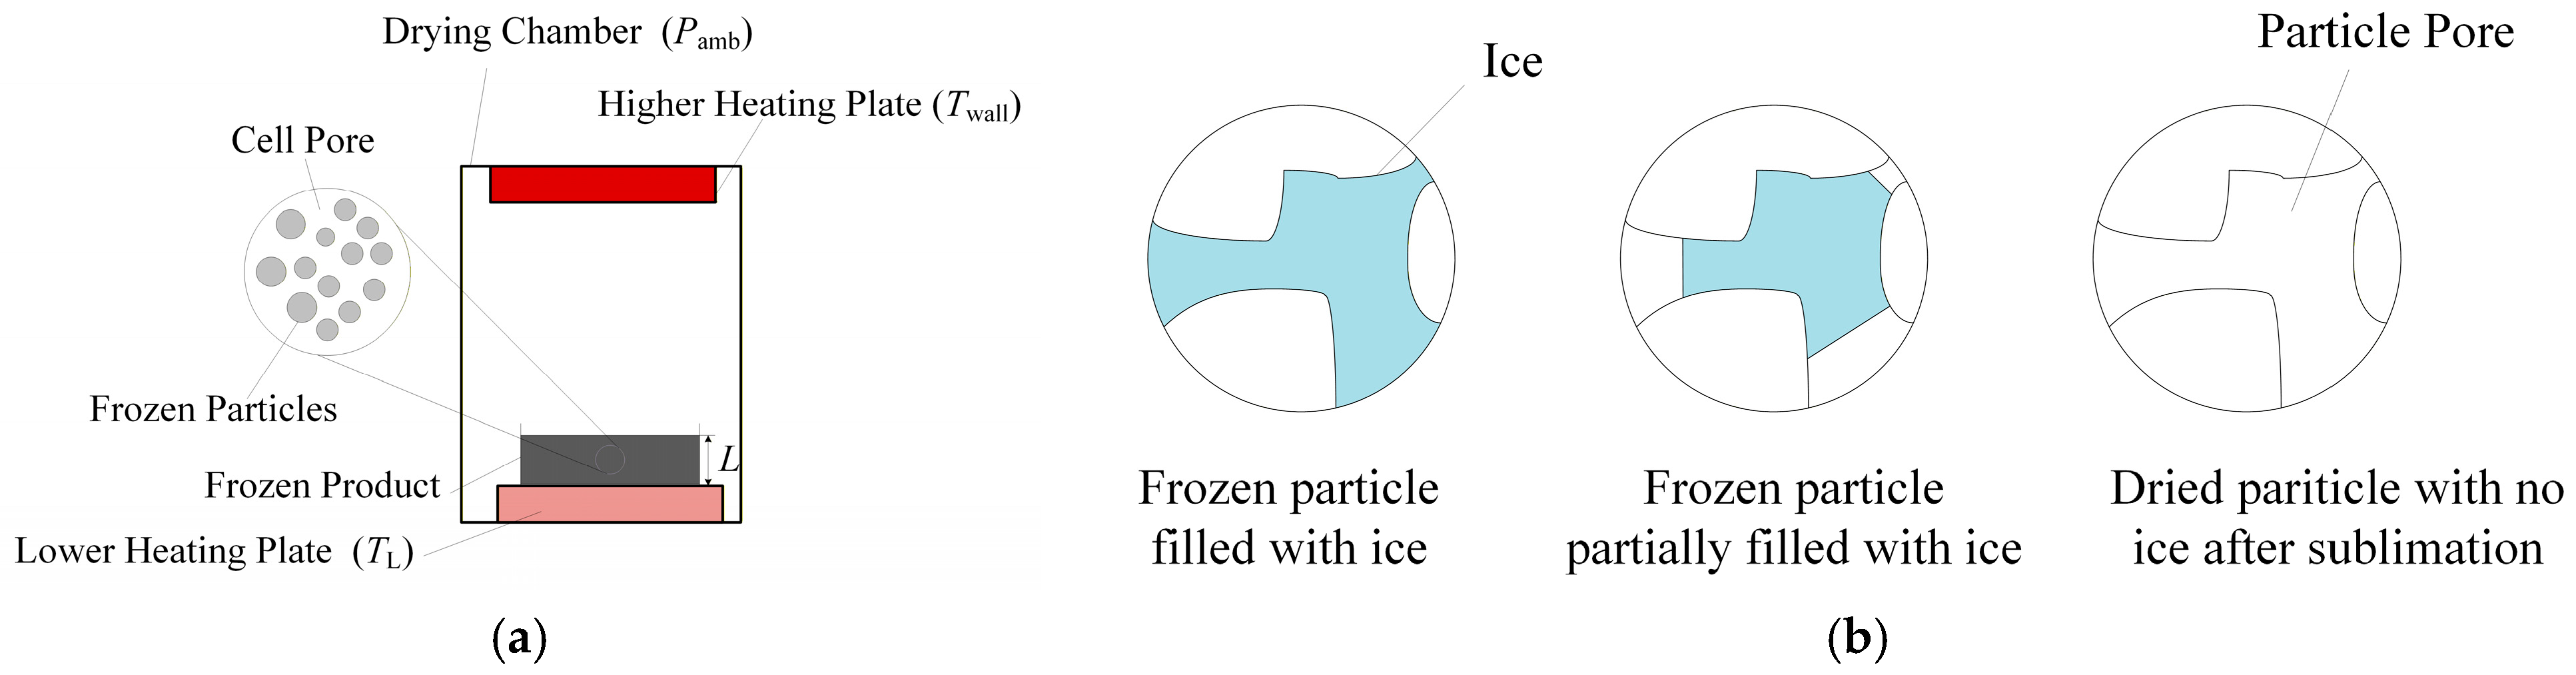
The primary drying stage of the particle-based products is schematically shown in Figure 2. The frozen particles are packed in a tray, forming a porous media characterized by the packing porosity εp. The tray is located at the drying chamber. There are two heat sources for the drying of the frozen particles; the lower heating plate provides energy input by heat conduction, with the heat transfer coefficient hf accounting for the heat transfer resistance. Moreover, the radiation from the higher heating plate also contributes to the heat flux at the product top surface. The mass transport of the water molecules is driven by the pressure difference between the chamber pressure and that of the products.
The products to be dried are composed of different frozen particles. The frozen particles are also porous media with a porosity of εc, partially filled with ice. During the drying stage, the ice within the frozen particles sublimates under the vacuum conditions, leaving pores and the frozen zone in the particles. As the drying stage proceeds, the amount of ice decreases, finally forming porous particles, as per Figure 2b.
The removal of the ice could be quantified by the concept of saturation S, which could be defined as the ratio of the volume of ice to the volume of the particle pores, and it is expressed as follows:
S = V ice V Particlepore

2.2.1. Governing Equations

The temperature distribution within the products could be described using the energy conservation equation, as shown in Equation (2):
ρ e c e T t + ρ v c v u · T = · ( λ e T ) + Δ H m s
where ρ is the density of the products, kg/m3; c represents the specific heat capacity of the products, kJ/(kg·K); u refers to the velocity of the vapor, m/s; and its value could be calculated by Equation (3). T is the temperature, K; λ represents the thermal conductivity, W/(m·K); ΔH represents the latent heat generated from sublimation, kJ/kg; ms is the mass source caused by sublimation, kg/(m3·s); and the subscript C represents the cell value.
It is worthy to note that the continuum assumption may not be applied under low pressure conditions. According to the definition of the Knudsen number (Kn = λMFP/dpore). The value of Kn is calculated to be in the range 35–115 for different chamber pressures, which indicates the flow belongs to the free molecular flow. The Knudsen effects are represented by incorporating the Knudsen diffusion mass diffusivity, which accounts for the molecule–pore wall collision effects at high Knudsen numbers. The inclusion of the Knudsen diffusion term ensures that the model could accurately describe the flow of water vapor. Thus, the velocity of the water vapor flow could be approximately calculated by the Darcy law in this paper, as shown below:
u = K μ v p
where p is the pressure of water vapor, Pa; K represents the permeability, m2; and μv is the dynamic viscosity, Pa·s.
The equations for calculating K and μv are listed in Equations (4) and (5) [26]:
K = ε c 2 180 ( 1 ε c ) 2 d p 2
μ v = 18.48 × 10 7 T T + 650
During the primary drying stage, the ice crystals sublime and turn into water vapor; the mass conservation could be described using Equation (6).
( ρ i ( 1 ε c ) ε p S ) t = m s
where the subscript i represents ice.
The driving force for sublimation is considered to be the pressure differences between the saturation pressure and the pressure of water vapor around the sublimation interface. And the mass source could be calculated based on Equation (7).
m s = k c ( p v eq p ) R v T ( ε c + ( 1 ε c ) ε p ( 1 S ) )
where the kc refers to the non-equilibrium constant, and its value reflects the equilibrium time of the sublimation process. Rv is the gas constant, J/(kg·K). p v eq is the equilibrium vapor pressure at the sublimation interface. Its expression could be expressed considering the hygroscopic material, as shown below:
p v eq = p v s f ( S , T )
where p v s is the saturation pressure of pure water; f(S,T) is the ratio between the saturation pressure and equilibrium pressure, and it is affected by the saturation and temperature. The equations to calculate the saturation pressure and the ratio are listed below [28]:
p v s = exp ( 9.550426 5723.265 T + 3.53068 ln ( T ) 0.00728332 T )
f ( S , T ) = ( S S 0 ) α
where α is a parameter determined by the experiment, and its value was set to be 1.8, as reported in the literature [29].
The distribution of sublimated water vapor within the products could be obtained based on the mass conservation of water vapor.
ε c ρ V t + · ( ρ V u ) = · ( ε c τ D k ρ V ) + m s
where τ refers to the tortuosity. Dk is the Knudsen mass diffusivity, m2/s. The flow of water vapor within the products could be treated as the Knudsen flow [30], and the value for Dk could be calculated as follows [31]:
D k = 48 . 5 ε c 1.5 d pore T M w
The mean pore diameter could be obtained from the frozen particle size, as shown below [32]:
d pore = 2 3 ε c 1 ε c d p
where dp is the size of frozen particles, m.

2.2.2. Initial Conditions and Boundary Conditions

The initial value of the product temperature, saturation and the initial chamber pressure are all set to be the same value. The initial temperature is taken to be 233.15 K, and the initial pressure is set as the same as the chamber pressure. Moreover, the initial saturation is taken to be 0.99 instead of 1 for the numerical convergence.
The boundary conditions at the top surfaces of the products could be expressed as follows:
λ e T z = L = σ e ( T wall 4 T 4 )
p z = L = p amb
S z = L = 0
where Twall refers to the top heat plate temperature, K; pamb is the chamber pressure, Pa.
In Equation (14), only radiative heat transfer is considered at the top surface, while convective heat transfer is neglected. This simplification is justified by the low chamber pressure (10–30 Pa) typical of freeze-drying processes. Under such vacuum conditions, the gas phase is in the free molecular flow regime, where the convective heat transfer coefficient is on the order of 0.44–0.59 W/(m2·K) according to the empirical equation. A simple order-of-magnitude estimation shows that the radiative heat flux (typically around 141 W/m2 under the considered conditions) significantly exceeds the convective heat flux (estimated to be 13.2–23.6 W/m2). Therefore, radiation dominates the heat transfer at the top surface, and neglecting convection is a reasonable simplification.
In Equation (16), a zero-gradient boundary condition for the saturation SS is imposed at the top surface of the product. Physically, this condition reflects that the top surface is exposed to the chamber vacuum and represents the free boundary where water vapor escapes. At this surface, ice has been completely removed and no ice flux crosses the boundary.
The boundary conditions at the bottom surfaces are listed below:
λ e T z = 0 = h f ( T L T )
p z = 0 = 0
S z = 0 = 0
where hf refers to the heat transfer coefficient, W/(m2·K); TL represents the temperature of the lower heating plate, K.

2.2.3. Material Properties

The physical properties of the products are obtained based on the volume-averaged theory. The heat capacity of the products could be obtained from the following equation:
( ρ c ) e = S ( ρ c ) F , C + ( 1 S ) ( ρ c ) D , C
The subscript F and D represent the frozen zone and dried zone, respectively. The subscript C refers to the value in the cell. For the particle-based products, it could be viewed as the mixtures of the solution-based products and voids. And the physical properties could be obtained from that of the solution-based products, and the relationship is expressed below:
( ρ c ) D , C = ( 1 ε c ) ( ρ c ) D
( ρ c ) F , C = ( 1 ε c ) ( ρ c ) F
Other physical properties, such as the thermal conductivity, could also be determined similar to the above equations, which are listed as follows:
λ = S λ F , C + ( 1 S ) λ D , C
λ F , C = ( 1 ε c ) 1.5 λ F
λ D , C = ( 1 ε c ) 1.5 λ D
The physical properties of the products are listed in Table 1.

2.3. Determination of the Design Space Variables

The chamber pressure is taken in the range between 10 Pa and 30 Pa, which is the widely adopted range in production. The interval of the chamber pressure is set to be 5 Pa. Since the lower heating plate contributes more to the energy input to the products compared with the higher heating plate, the heating from the lower heating plate is much more common in the actual production. The lower shelf temperature is selected as another input variable, named as the shelf temperature. and the value of the shelf temperature is taken to be in the range of 260.15 K to 280.15 K with the interval of 5 K.
The drying time and maximum product temperature at different operating conditions are obtained by running the simulation. The data are then imported to the Origin 2022 to generate the contour plane.

3. Model Implementation and Validation

The mathematical model used in this paper was solved using the Comsol Multiphysics 6.2 (COMSOL AB, Stockholm, Sweden). Song et al. [26] performed an experimental investigation on the drying process of ovalbumin solution, and they inserted a thermocouple at the position of the height of 5 mm and then obtained the temperature evolution. To validate the model accuracy, the temperature of the lower heating plate and higher heating plate and the chamber pressure are taken to be the same as that in the literature [26] and their values are listed in Table 2. The MUMPS solver was employed to solve the governing equations. The relative error was taken to be 10−4.
It is worthy to note that the convective heat transfer coefficient at the bottom surface, hf, is taken as a constant value of 10 W/(m2·K). This value is adopted from the experimental study by Song and Yeom [26], which also provided the validation data used in this work. In that study, the authors reported this value for the tray heating configuration under vacuum conditions. While it is acknowledged that, in practice, the heat transfer coefficient may vary with chamber pressure, temperature, and product moisture content, obtaining a fully pressure- and moisture-dependent expression would require detailed experimental characterization that is beyond the scope of this work. Therefore, following the common practice in freeze-drying modeling studies [24,26,32], a constant effective HTC is assumed.
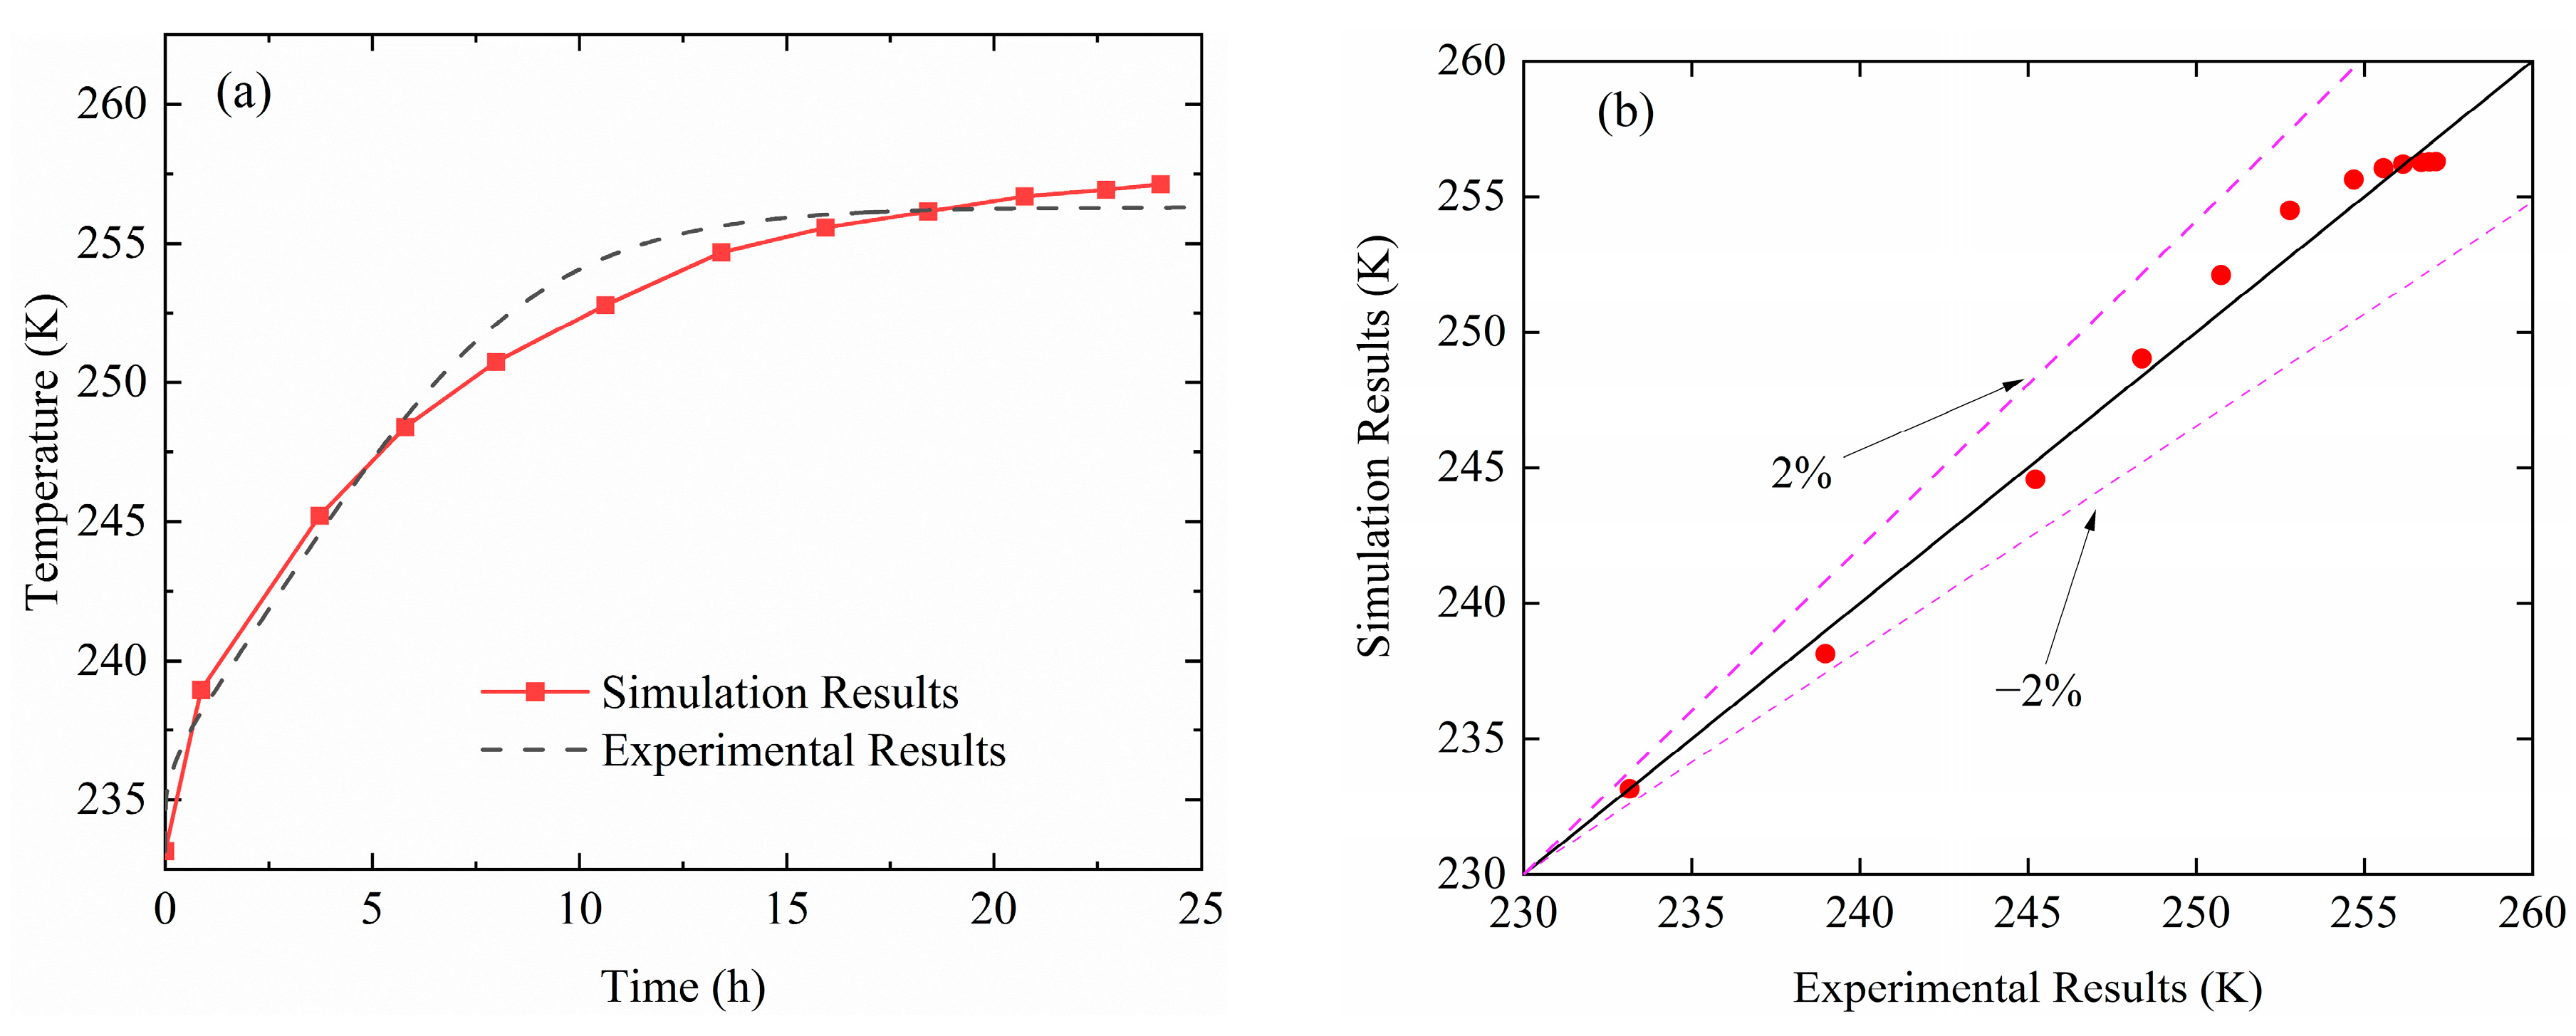
The validity of this simplification is supported by the good agreement between the simulation results and the experimental measurements, as shown in Figure 3, where the relative error remains below 2%. This suggests that, under the conditions considered, the chosen constant HTC provides a sufficiently accurate representation of the overall heat transfer process.
Figure 3 compares the temperature at the position of z = 5 mm between the experimentally measured value and the simulation results. It could be seen from the figures that the simulation results obtain good agreement with the experimental results. The relative error almost falls in the range of 2%, as in Figure 3b. It could be concluded from the figure that the model is accurate and reliable, and the mathematical model describing the drying stage could be used to build the design space.
It should be noted that the experimental validation of the present model is limited to temperature profiles at a single location (z = 5 mm), as the reference experimental study did not report data on total drying time, saturation evolution, or vapor pressure distribution. While the model captures the essential thermal behavior and demonstrates consistency with established freeze-drying principles, a more comprehensive validation, including direct measurements of drying kinetics and internal state variables, would further strengthen confidence in the design space predictions.

4. Results and Discussion

4.1. Drying Time

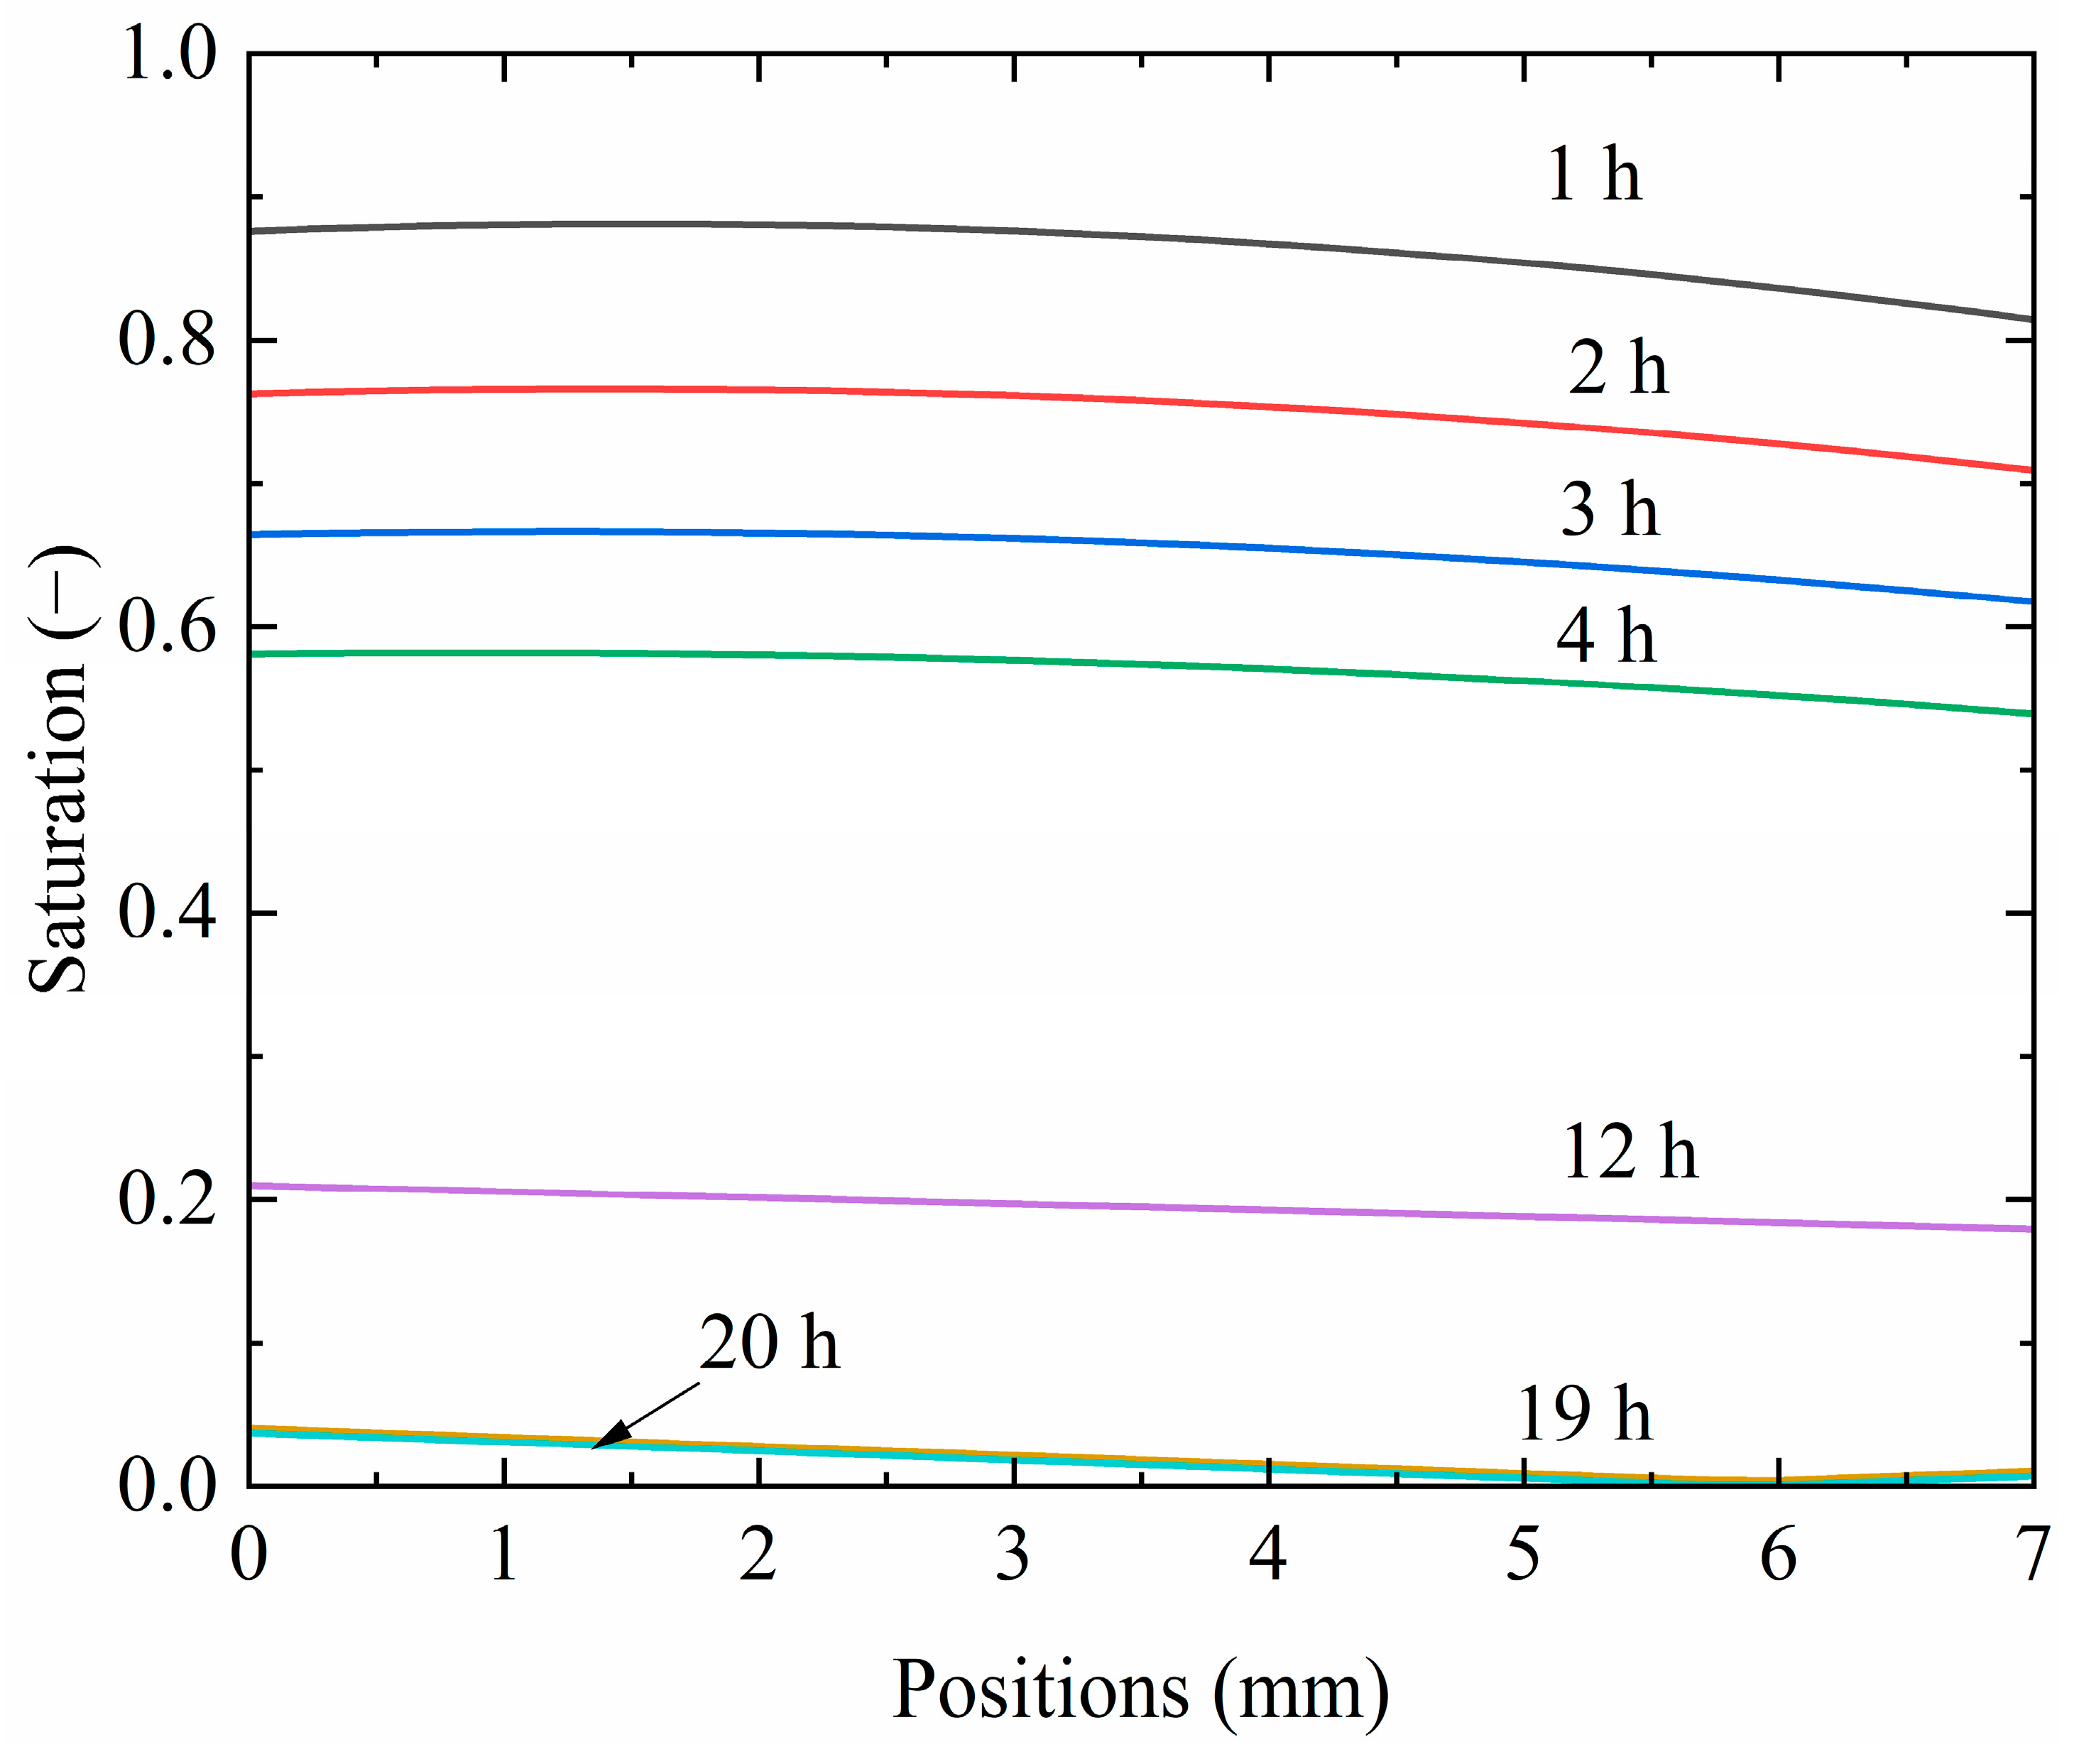
Figure 4 presents the saturation at different positions versus time. The saturation is defined as per Equation (1), which represents the ratio between the ice volume and the particle voids volume. Its value could be considered to represent the amount of the moisture content. The S with the value of 1 represents the particle voids being full with ice, while the value of 0 represents there being no ice within the particle voids, suggesting the total removal of the ice. As presented in Figure 4, the saturation at the middle of the products is higher than that of the bottom and the top. This is because there is energy input from the lower heating plate and higher heating plate at the bottom and the top.
In addition, as the drying process proceeds, the shape of the saturation curves gradually become flat, which means the ice crystals at the middle positions also sublimate, leading to decreased saturation. Moreover, the saturation at different positions all decrease, indicating the removal of the moisture content. When the time is 19 h, the saturation at all positions is near zero, implying the drying stage comes to an end. And there are no obvious changes in the saturation distribution when the drying time increases from 19 h to 20 h. This means that the removal of the ice crystals ends. The distribution of the saturation files gradually reaches the equilibrium state.
It can be seen from Figure 4 that, at the end of the drying stage, the value of the saturation experiences few changes. In addition, the different operating conditions lead to different residual moisture content. Thus, taking the value of the residual moisture content as the criteria under different conditions may lead to the incorrect judgement for the end of the drying stage. Instead, the change rate of the saturation is chosen as the criteria. To determine the value of the critical change rate, the sensitivity of the change rates of the saturation under the specific conditions (Tshelf = 275.15 K; Tamb = 15 Pa) is performed.
Table 3 presents the minimum value of the saturation within the products, the drying time and the maximum product temperature under different change rates of the saturation. It can be seen from the table that the parameters mentioned above change when the criteria differ. The change rates of the saturation are very low considering the value of saturation changing from 0.99 to 0 in a long duration. When the criteria are taken to be 10−5 s−1, the drying time would be thought to be in a very short duration, which is obviously not in accordance with the actual production. When the judgement criteria changes from 10−5 s−1 to 10−6 s−1, the drying time increases. However, the saturation, which represents the amount of ice, remains high. Thus, it could not be considered that the drying process ends.
Moreover, when the judgement criteria decrease from 10−6 s−1 to 10−7 s−1, the drying time also increases, and the saturation becomes a relatively low value, indicating the end of the drying stage. When further decreasing the value of the criteria, the saturation does not show significant changes. In addition, it is also noticed that the maximum product temperature obtains a slight increase when changing the value of the criteria; it is mainly due to the energy input from the heating plates. Considering the larger increment in the drying time and small increases in the maximum product temperature caused by the changes from 10−7 s−1 to 10−8 s−1, the criteria for judging the drying time are chosen to be 10−7 s−1 in this paper.
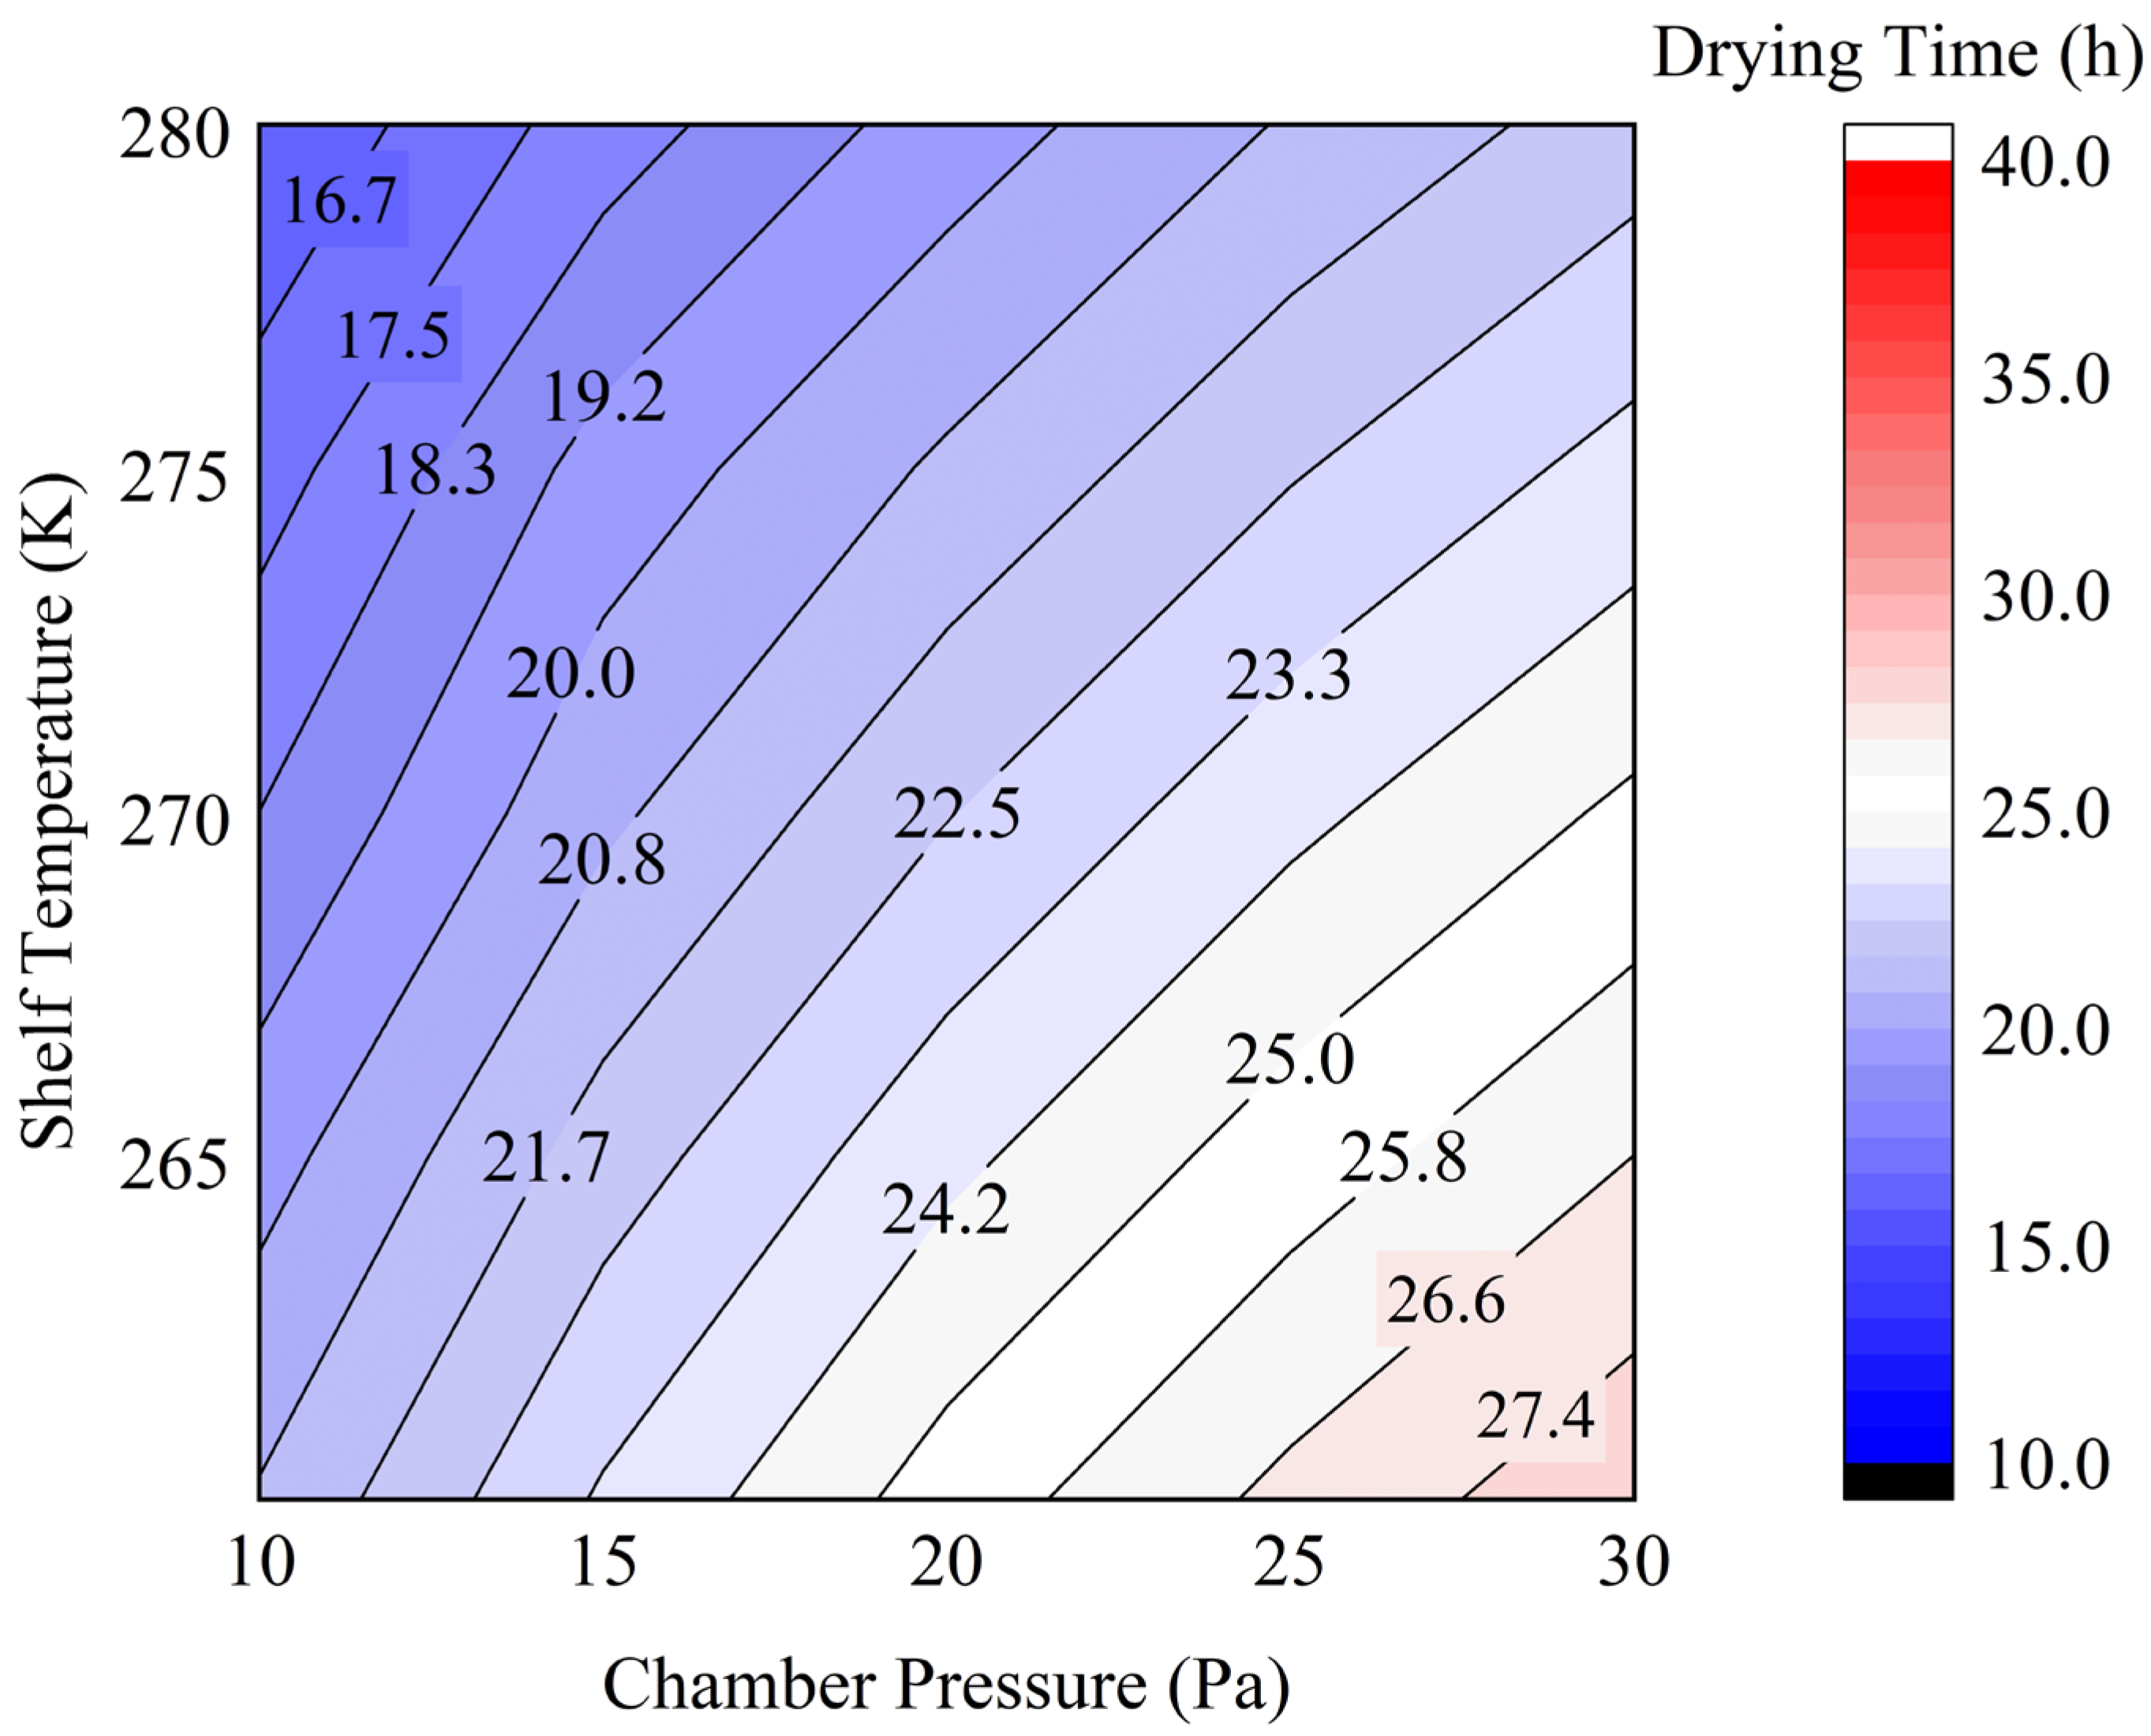
Figure 5 depicts the drying time at different combinations of operating conditions. It can be seen from the figure that the drying time varies when the operating conditions change. With the increase in the shelf temperature, the drying time gets smaller. This is due to the increase in the shelf temperature helping to enhance the heat transfer between the products and the shelf, allowing more energy input into the products. It will benefit shortening the process duration, which also coincides with the results reported in the literature [33]. Though the products used in Ref. [33] are different from that in this paper, the same trend confirms the effects of shelf temperature.
In addition, it is also noticed that the drying time decreases with the decrease in the chamber pressure. The chamber pressure has complex impacts on the primary duration. On the one hand, high chamber pressure would benefit the heat transfer, since the thermal conduction and convection would be enhanced. On the other hand, the mass transfer would be weakened when increasing the chamber pressure. Higher chamber pressure would reduce the pressure difference between the products and the chamber, thus hindering the mass transfer. Interested readers may refer to the detailed analysis of impacts of the chamber pressure on the drying time by Southard et al. [34]. In this paper, it is found that the increase in the chamber pressure would lead to a slight increase in the drying time, indicating inhibiting effects of increasing mass transfer resistance play the dominant role in the primary drying stage, rather than the enhancing effects.
In addition, it is worthy to note that the impacts of shelf temperature on the drying time are not as large as that of the chamber pressure. As shown in Figure 4, the increase in shelf temperature would lead to a much lower decrease in the drying time compared with that of the chamber pressure. Taking the case with shelf temperature of 260.15 K and chamber pressure of 15 Pa as an example, when the shelf temperature increases from 260.15 K to 265.15 K with the chamber pressure unchanged, the drying time decreases by 1.39 h, while this value of reduction becomes 2.53 h when the chamber pressure decreases from 15 Pa to 10 Pa. The same trend holds true for all other cases, highlighting the importance of controlling the chamber pressure.
The reasons behind the trend are that the saturation pressure at the sublimation interface is affected by the chamber pressure. The temperature at the sublimation interface is related to the saturation pressure. Thus, the variation in chamber pressure would lead to the changes in the temperature at the sublimation interface. The relation between the saturation pressure and temperature could be described by Equation (9), leading to the change in the temperature differences between the shelf and the sublimation. Therefore, the variation in the chamber pressure not only affects the driving forces of mass transfer but also the driving forces of heat transfer. It is also validated by the literature [35,36].
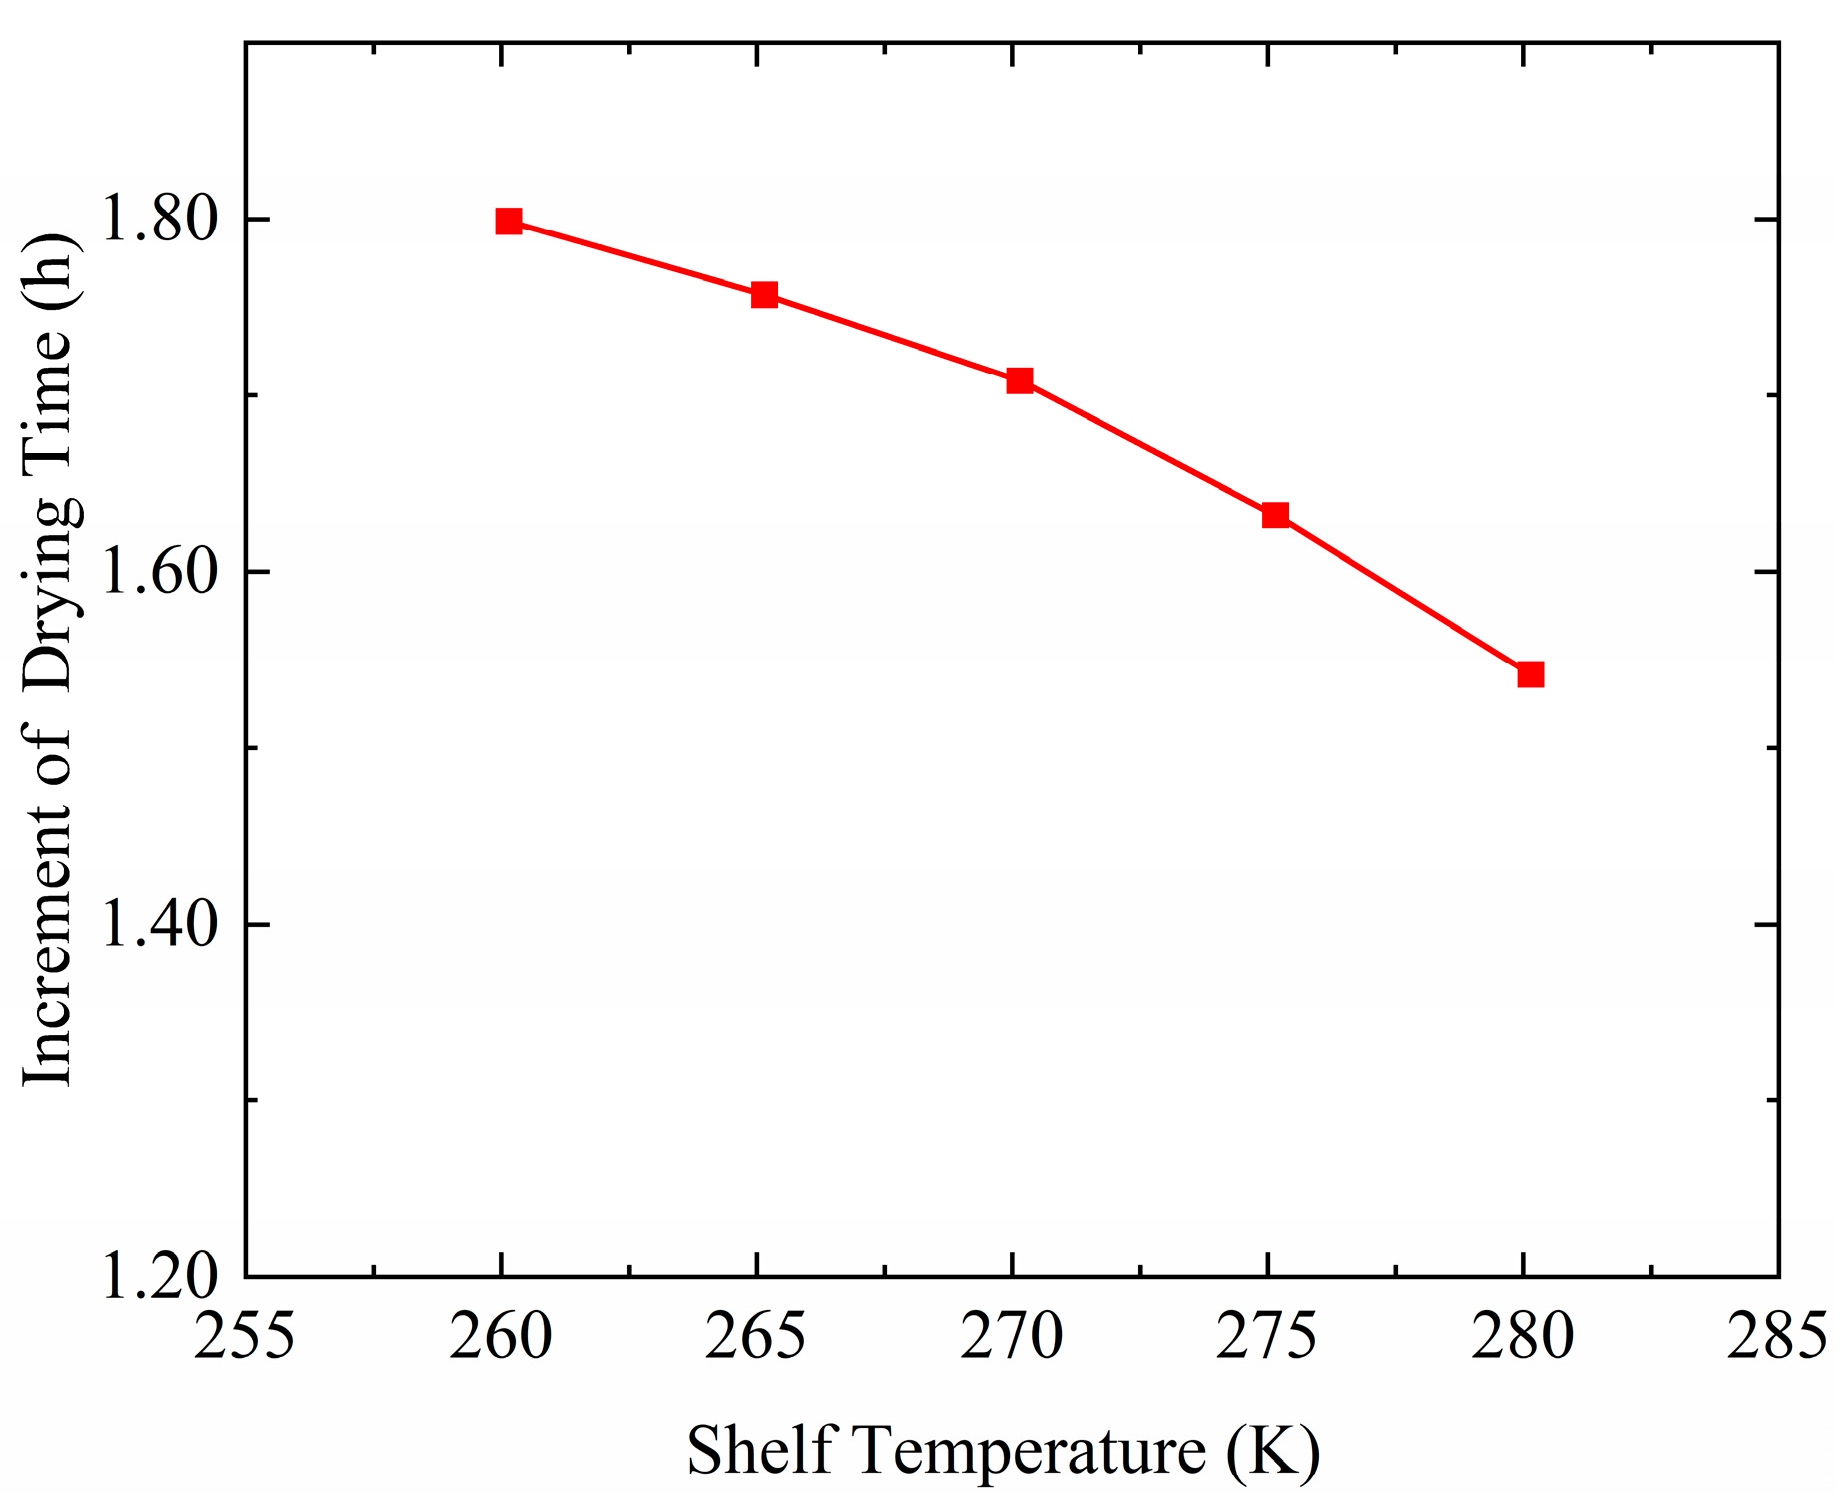
To better compare the impacts of chamber pressure on the drying time, the concept of the average increment of drying time is introduced in this paper. At the same shelf temperature, the variation in the chamber pressure would result in the change in the drying time. For example, when the chamber pressure increases from 10 Pa to 15 Pa, the drying time would increase from 20.92 h to 23.45 h, with an increment of 2.53 h. Similarly, as the chamber pressure increases from 15 Pa to 20 Pa, from 20 Pa to 25 Pa and et al., there would also be a drying time difference. The average increment of drying time is defined as the average value of the drying time differences caused by an increase in chamber pressure by a constant increment of 5 Pa. By contrast, the average decrement of drying time at other shelf temperatures could also be obtained. In this case, the average drying time decrement was determined for a 5 K increment in shelf temperature. The average increment and decrement of the drying time could help to perform the sensitivity analysis.
The average increment of drying time at different shelf temperatures is shown in Figure 6. The increment of the drying time is found for all shelf temperatures, which means the increase in chamber pressure would lead to the increase in drying time. This is due to the fact that increasing the chamber pressure would hinder the mass transfer resistance, leading to a longer drying process. In addition, it is also observed that the average increment of drying time decreases when the shelf temperature becomes larger. This is due to the fact that increasing the shelf temperature would help to reduce the drying time, thus weakening the negative effects of the increasing chamber pressure.
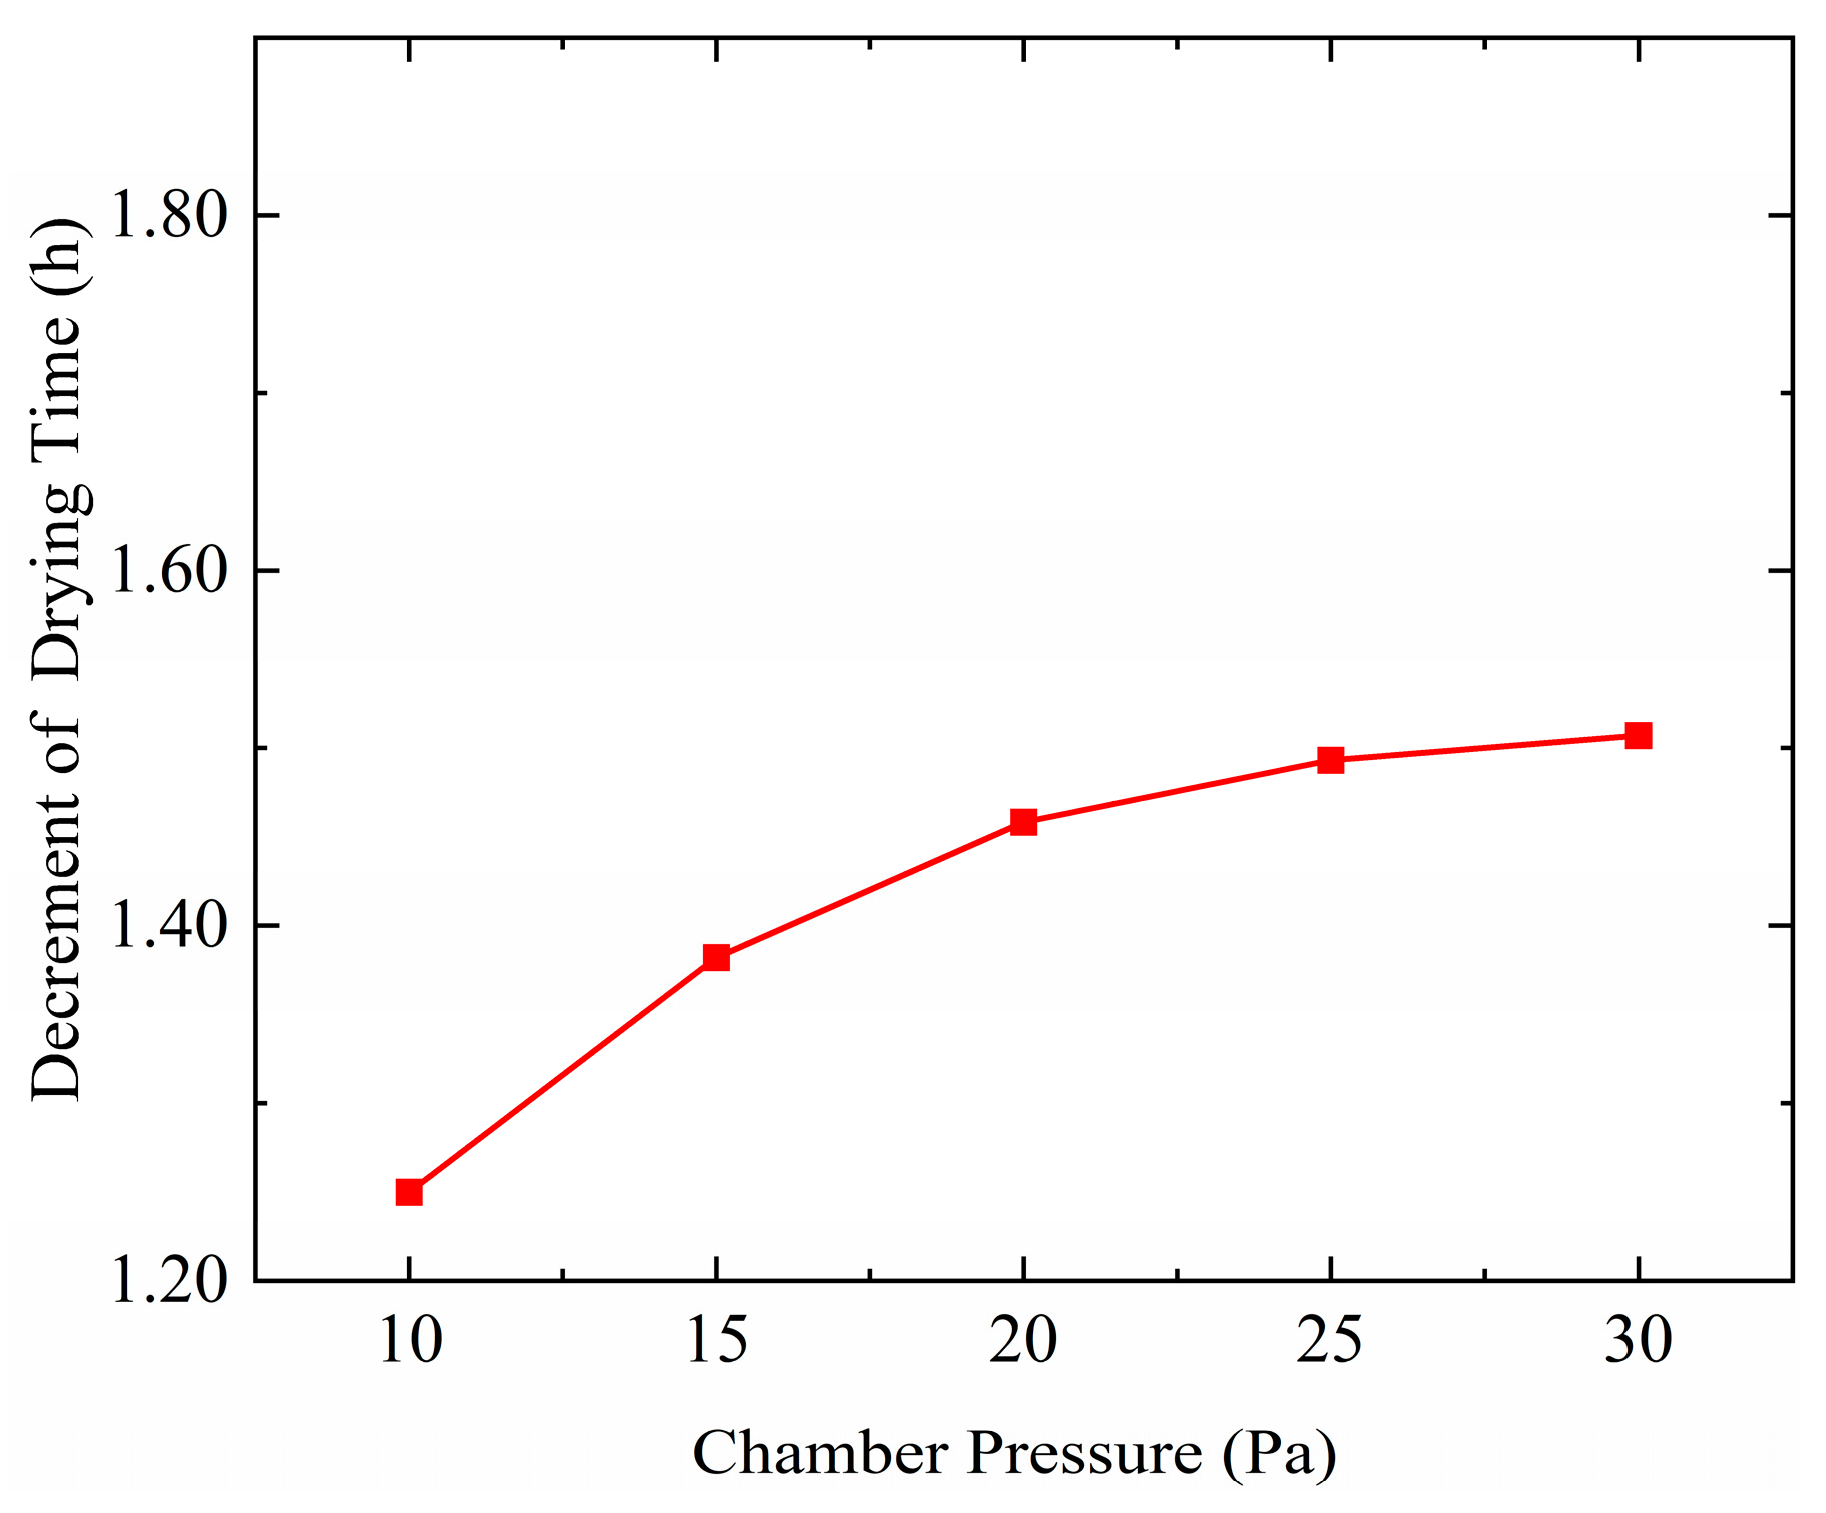
Similarly, the average decrement of drying time is obtained by fixing the chamber pressure. At the same chamber pressure, there would be a decrement of the drying time. For example, when the shelf temperature increases from 260.15 K to 265.15 K, the drying time would reduce by 1.25 h. The average decrement of drying time is defined as the average value of the time differences caused by increasing the shelf temperature.
Figure 7 presents the average decrement of the drying time at different chamber pressures. It can be seen from the figure that the average decrement becomes larger as the chamber pressure increases. This indicates that the reduction in drying time achieved by raising the shelf temperature is more pronounced at higher chamber pressures. It is mainly because the increase in chamber pressure would contribute to the intensified heat transfer, leading to a higher drying efficiency.

4.2. Maximum Product Temperature

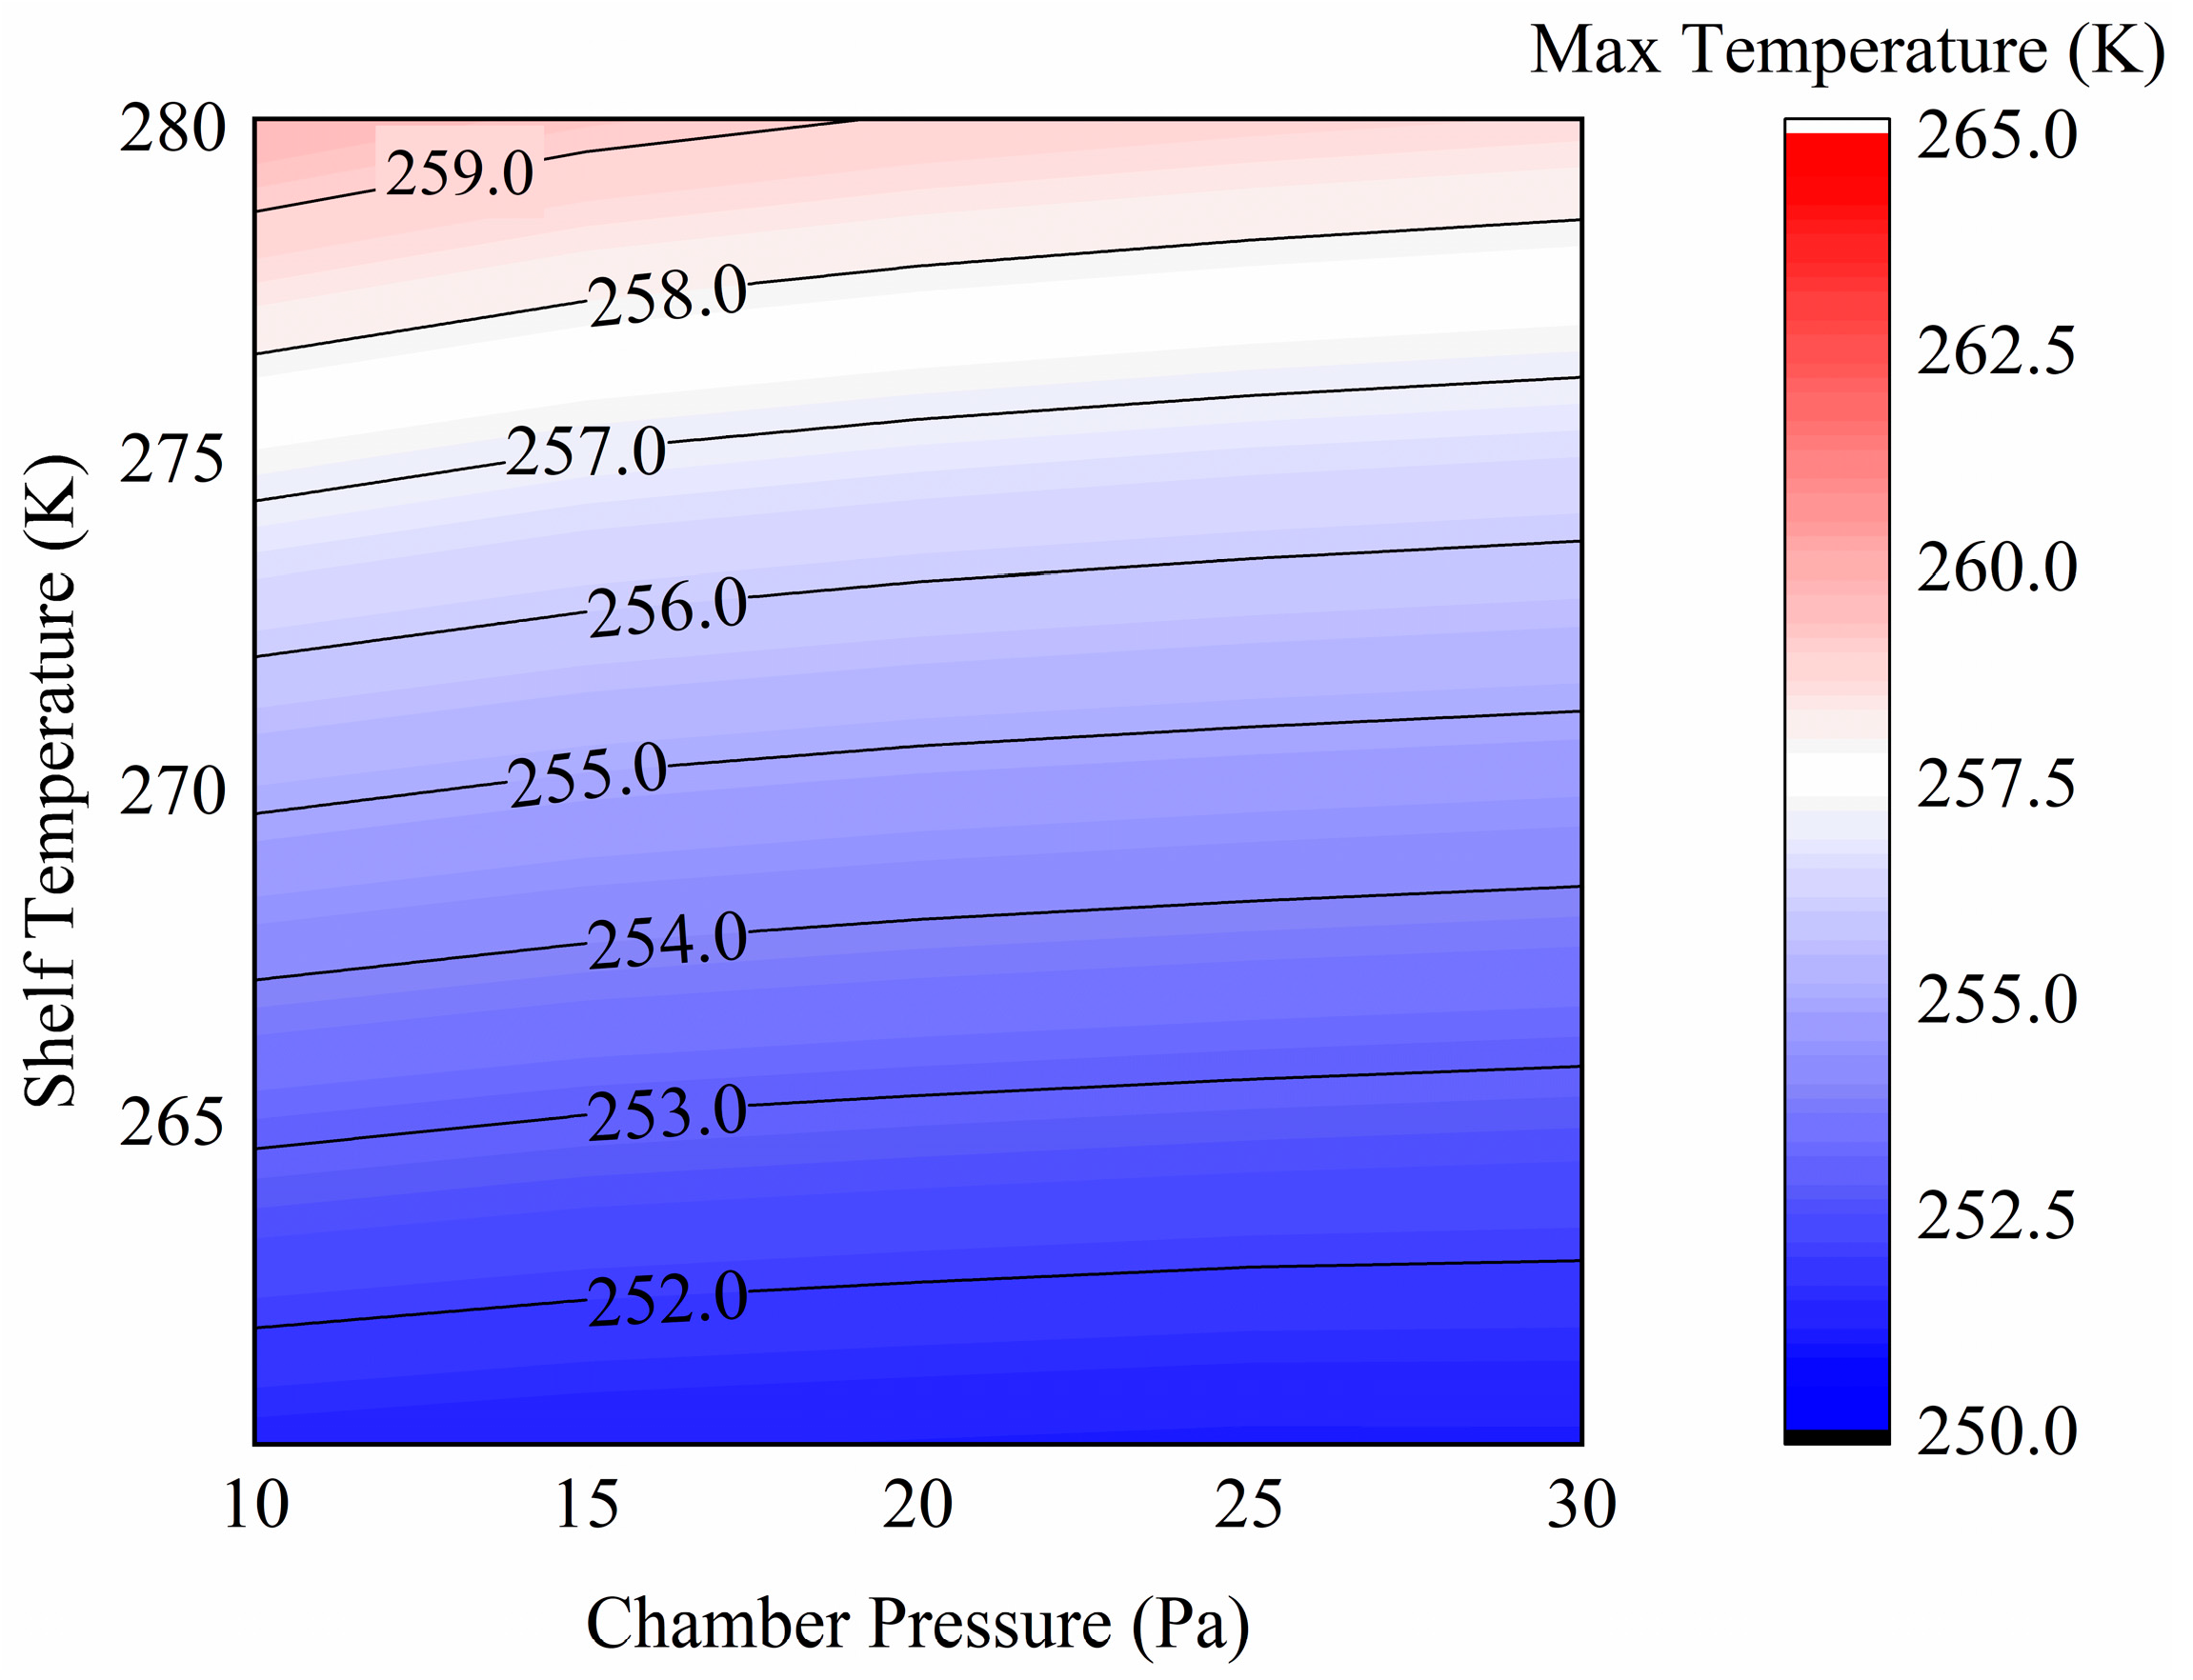
Figure 7 presents the maximum product temperature at different operating conditions. It can be seen from the figure that the decrease in chamber pressure would lead to the increase in the maximum product temperature, which means higher risk of collapse. This phenomenon could be explained by the coupled heat and mass transfer in the model. When the chamber pressure decreases, the pressure differences between the chamber and the products increase, leading to a larger driving force and higher sublimation rate. The temperature at the sublimation decreases since more heat is removed via sublimation, thus resulting in larger temperature differences between the sublimation interface and the bottom. Due to the low thermal conductivity, the heat transfer from the bottom to the sublimation interface is limited. The energy input accumulates at the products, leading to higher maximum product temperature at the conditions of low chamber pressure.
It is worthy to note the trend reported in the literature is different from that in the freeze-drying process, which may be attributed to the differences between the products structure as mentioned above. As discussed by Hu et al. [37], the heat transfer resistance in the drying stage of the spray-drying process is larger than that of the freeze-drying process, since there are many voids in the products in the spray-freeze-drying process, which dramatically increase the heat transfer resistance under the vacuum condition.
In addition, it is also worthy to note that increasing the shelf temperature would also lead to a higher product temperature. Under the case of higher shelf temperature, more heat would be absorbed by the products; the consequently larger amount of sensible heat would make the product temperature become higher, indicating higher risk of collapse of the products.
Moreover, it is also vivid from Figure 8 that the shelf temperature has more pronounced impacts on the maximum product temperature than that of the chamber pressure. The increase in chamber pressure leads to a slight decrease in the maximum product temperature, while the shelf temperature has more important impacts on the maximum product temperature. It presents a different trend with that on the drying time, where both the shelf temperature and chamber pressure both have great impacts on the drying time.
The differences could be explained as follows: The heat absorbed by the products is mainly transferred to the sublimation interface, and used for sublimation. Little energy is used to increase the sensible heat. When the chamber pressure decreases, the energy input into the products becomes larger, as discussed above; meanwhile, the sublimation rate also increases, removing more heat correspondingly. The phenomenon is validated by simulation presented by Luo et al. [38]. The drying efficiency is enhanced, while the product temperature does not experience significant changes.

4.3. Impacts of the Geometry Parameters

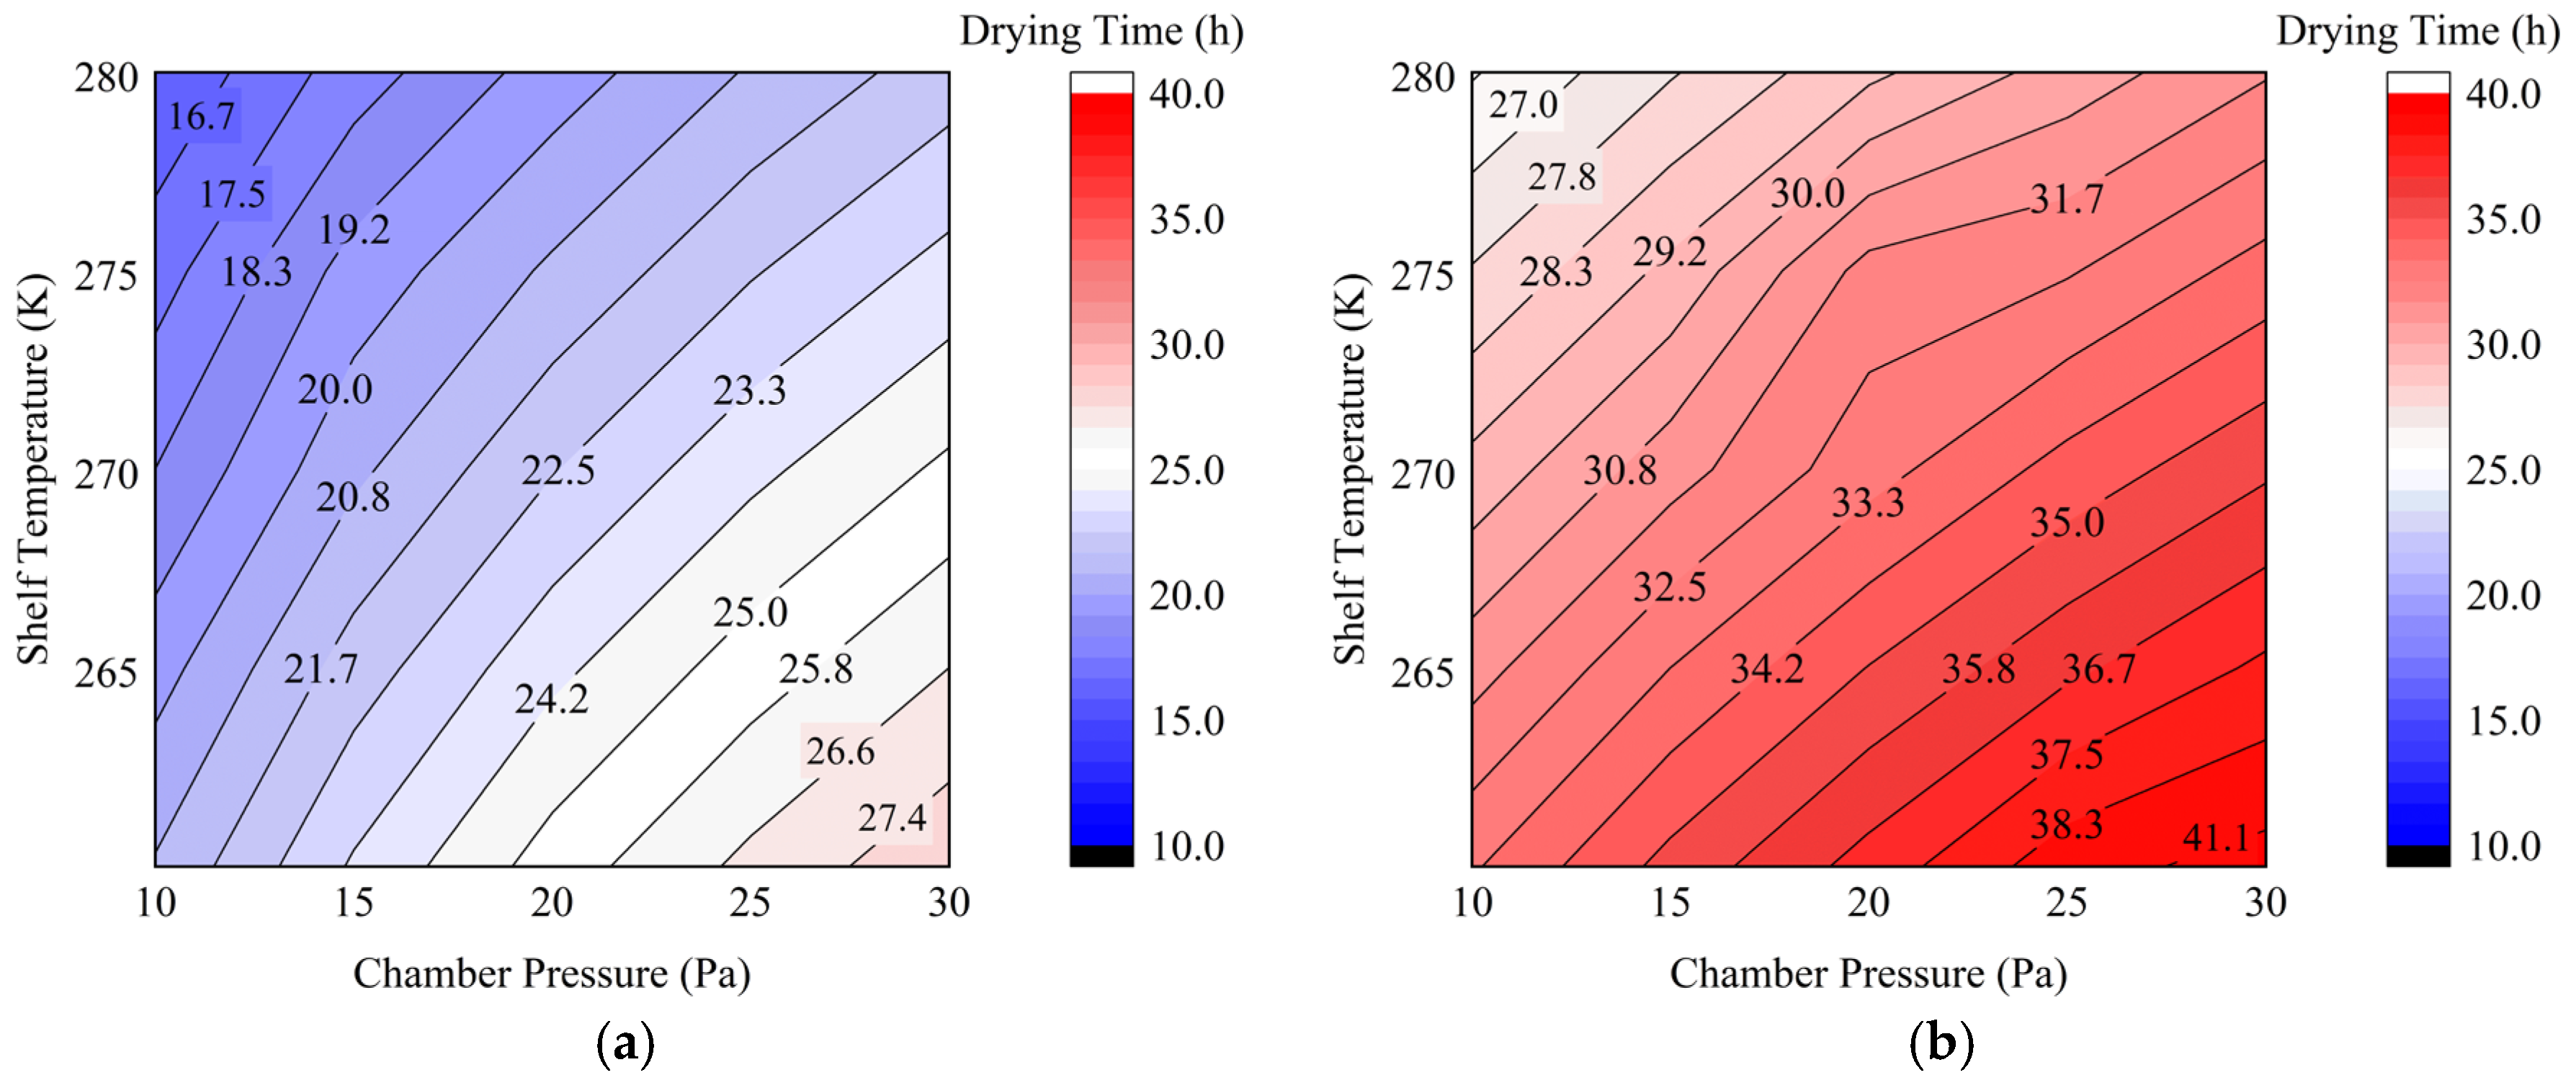
The freezing conditions would impact the inner structure of the particle-based solutions, leading to different geometry parameters of the particle-based products. Figure 9 compares the drying time under different packing porosity.
It can be seen from the figure above that the impacts of the operating conditions on the drying time at the condition of εp = 0.3 follow the same rule as that of εp = 0.5. Specifically, the increase in shelf temperature and the decrease in chamber pressure lead to the decrease in drying time. In addition, th ere are also differences between the two conditions. At the same conditions, the drying time obtained at εp = 0.3 is larger than that of εp = 0.5. This is due to the difference in the geometry. The higher packing porosity means larger pores and consequent smaller mass transfer resistance. Thus, high porosity would be beneficial for improving the drying efficiency.
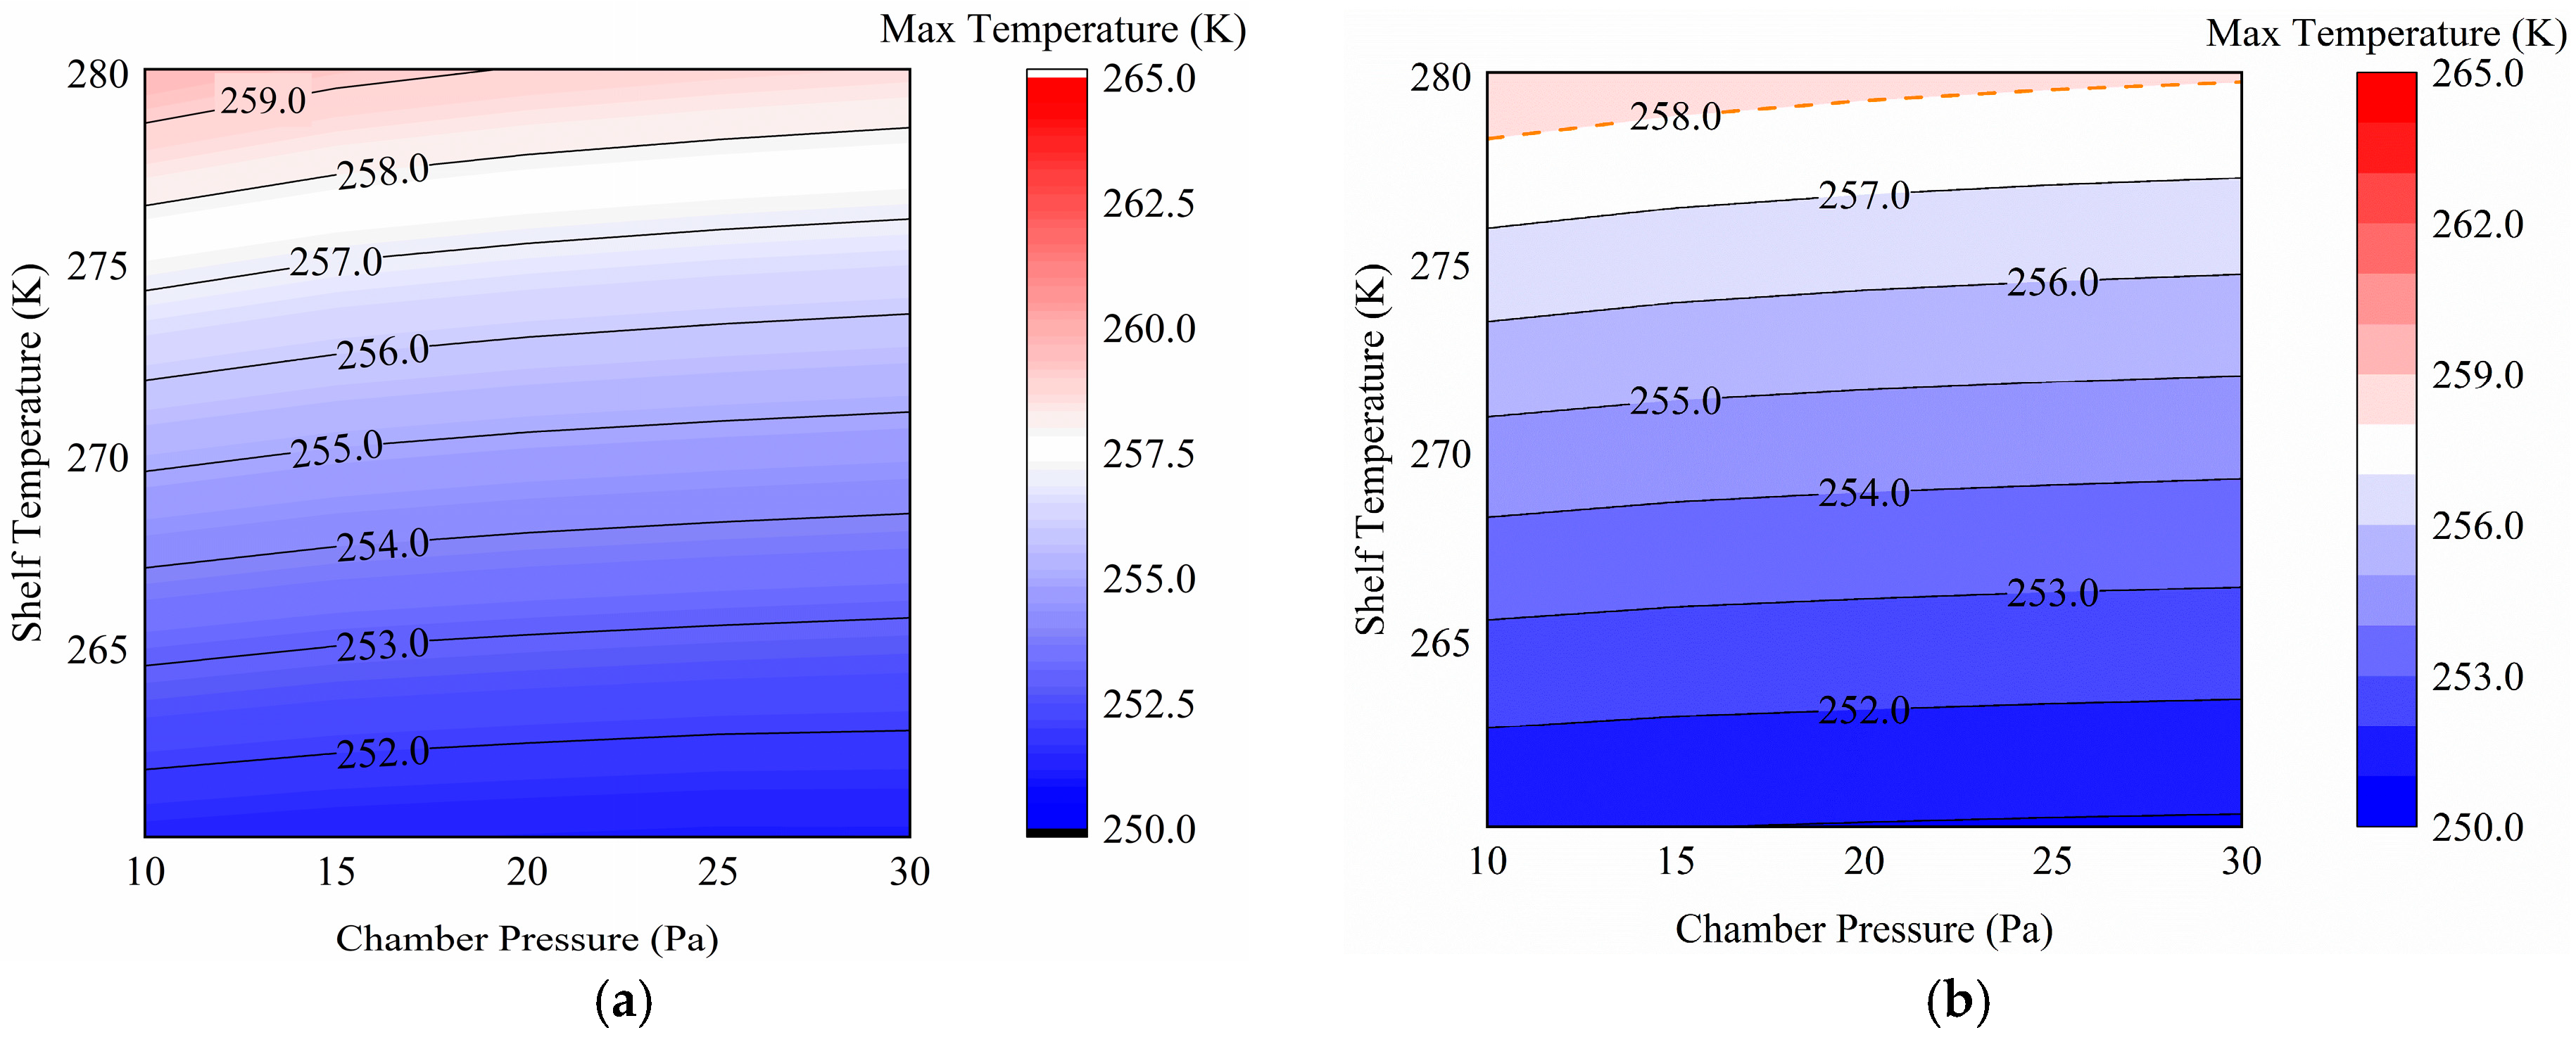
The comparison of the maximum product temperature obtained at different packing porosities is presented in Figure 10. The impacts of operating conditions on the maximum product temperature obey the same rule for both εp = 0.3 and εp = 0.5. The increase in shelf temperature and decrease in chamber pressure would lead to the increase in the maximum product temperature. Moreover, there are also differences when the packing porosity changes. At the same drying conditions, the maximum temperature obtained at εp = 0.3 is smaller than that of εp = 0.5. It should be noted that the value of the collapse temperature is assumed; there is no literature reporting its precise value. When taking the value of the collapse temperature to be 258 K, 257 K and 256 K, respectively, the region below the isotherms 258 K, 257 K and 256 K are the combinations of the process parameters which would not lead to the failure of the process. It can be seen from the figure that the design space for the case of εp = 0.5 is always smaller than that of εp = 0.3. The sensitivity analysis confirms our qualitative conclusions regarding the influence of porosity on the design space are robust to reasonable variations in the assumed collapse temperature.
The trend mentioned above is mainly due to the heat transfer being enhanced at low packing porosity, since the amounts of voids which insulate heat under vacuum conditions are decreased. The heat is not easy to accumulate in the products, leading to a relatively low temperature when the packing porosity is low. It was also reported that the pore at a certain size range would help to reduce the equivalent heat transfer resistance [39]. The SEM analysis also supported the evidence that inner structure would affect the heat and mass transfer resistance [40].
In addition, it can also be seen from the figure above that the product with low packing porosity allows a wider selection of operating conditions. There is no literature reporting the collapse temperature of ovalbumin solution. The primary aim is to compare the effects of geometry parameter on the design space. The critical temperature is assumed to be 258 K in this paper, as highlighted with the dotted line in Figure 9. The combination of drying conditions below the dotted line could be considered safe, and the drying process performed at these conditions would experience a low risk of failure. Comparing the two subfigures, it could be found that the ranges of permitted conditions are larger for products with low packing porosity. This means products with low packing porosity are less prone to collapse or drying failure at the same drying conditions, allowing a more safe drying process while increasing the drying efficiency.

5. Conclusions

In this paper, a mathematical model was employed to describe the drying stage. Based on this model, the design space of the primary drying stages was established, and the impacts of packing porosity on the design space were studied. The main conclusions are summarized as follows:
(1)
The model describing the drying stage of the ovalbumin solution was employed in this paper. The comparison between the simulation results and experimental results shows that the relative errors are less than 2%, which confirms the reliability of the proposed model for predicting the drying behavior and product temperature.
(2)
Based on the validated model, the design space was constructed by selecting drying time and maximum product temperature as critical quality attributes (CQAs). Within the investigated operating range (shelf temperature: 260.15–280.15 K; chamber pressure: 10–30 Pa), the results show that increasing the shelf temperature and decreasing the chamber pressure can significantly reduce the drying time, which is on the order of ~19 h under typical conditions. However, these changes simultaneously increase the maximum product temperature and thus elevate the risk of product collapse. Notably, the drying time exhibits a higher sensitivity to chamber pressure than to shelf temperature, indicating that pressure is the dominant factor governing mass transfer during the primary drying stage. Therefore, for process design, it is recommended to prioritize the optimization of chamber pressure within a safe operating window, while adjusting shelf temperature as a secondary parameter to improve efficiency without exceeding the critical temperature limit.
(3)
The effect of packing porosity on the design space was further clarified. A decrease in porosity results in an expansion of the feasible operating region, allowing a wider range of process parameters to simultaneously satisfy both efficiency and safety constraints. This finding highlights that the structural characteristics established during the atomization and freezing stages have a significant downstream impact on the primary drying performance. Consequently, controlling porosity in the early stages can serve as an effective strategy to enlarge the design space and enhance process flexibility.
Overall, this study provides a quantitative and practically applicable framework for the design of the primary drying stage in spray freeze drying. The established design space offers direct guidance for selecting process parameters, particularly in balancing drying efficiency and product safety. More importantly, the results highlight that pressure control and structural optimization (e.g., porosity regulation) should be considered as key levers in process design. The methodology developed in this work can be extended to other formulations and drying systems. Future work should focus on integrating the present drying model with atomization and freezing models to achieve a full-process optimization of spray freeze drying.

Author Contributions

Conceptualization, S.W. and L.C.; methodology, L.B.; software, S.W.; validation, S.W. and L.C.; formal analysis, S.W. and Y.W.; investigation, S.W.; resources, S.D.; data curation, S.D.; writing—original draft preparation, S.W.; writing—review and editing, L.B.; visualization, L.C. and S.D.; supervision, L.B.; project administration, L.B.; funding acquisition, L.B. and Y.W. All authors have read and agreed to the published version of the manuscript.

Funding

The research was funded by the Hunan Provincial Department of Education, grant number 24A0334.

Data Availability Statement

The original contributions presented in the study are included in the article, further inquiries can be directed to the corresponding author.

Acknowledgments

The conceptual development of this study was partly inspired by collaborative research activities within the following international programs, IEA-EBC (International Energy Agency-Energy in Buildings and Communities) Annex 97, Sustainable Cooling in Cities. The authors would like to express their sincere gratitude to the member for their kind help.

Conflicts of Interest

Author Shen Weihua was employed by the company MCC (Xiangtan) Heavy Industrial Equipment Co., Ltd. Author Sun Dongze was employed by the company The Second Construction Co., Ltd. (CTCE Group). The remaining authors declare that the research was conducted in the absence of any commercial or financial relationships that could be construed as a potential conflict of interest.

Abbreviations

cspecific heat capacity (J/(kg·K))
DkKnudsen mass diffusivity (m2/s)
dpparticle size (m)
dporemean pore diameter (m)
eemissivity (−)
hfoverall heat transfer coefficient (W/(m2·K))
Kpermeability (m2)
KnKnudsen number (−)
kcnon-equilibrium constant (1/s)
Lproduct height (m)
Mwmolecular weight (kg/kmol)
msmass source (kg/(m3·s))
ppressure (Pa)
Rvgas constant (J/(kg·K))
Sice saturation (−)
Ttemperature (K)
ttime (s)
uvelocity (m/s)
αfitting constant (−)
ρdensity (kg/m3)
λthermal conductivity (W/(m·K))
λMFPMean free path of molecules (m)
μvdynamic viscosity (Pa·s)
σStefan-Boltzmann constant (W/(m2·K4))
εccell porosity
εpparticle porosity
τtortuosity
ΔHlatent heat due to sublimation (J/kg)
φgvapor volume fraction
ambambient value
Ccell value
Ddried particles
eeffective value
Ffrozen particles
iice phase
vwater vapor
Wallwall parameter
0initial value
eqequilibrium value
ssaturated value

References

  1. Singh, P.; Pandey, V.K.; Singh, R.; Dar, A.H. Spray-freeze-drying as emerging and substantial quality enhancement technique in food industry. Food Sci. Biotechnol. 2023, 33, 231–243. [Google Scholar] [CrossRef] [Scilit]
  2. Walters, R.H.; Bhatnagar, B.; Tchessalov, S.; Izutsu, K.-I.; Tsumoto, K.; Ohtake, S. Next generation drying technologies for pharmaceutical applications. J. Pharm. Sci. 2014, 103, 2673–2695. [Google Scholar] [CrossRef] [Scilit] [PubMed]
  3. Fatima, M.; Sajid, M.; Saima, H.; Nadeem, M.T.; Ahmad, R.S.; Mehmood, S.; Khalid, M.Z.; Alharbi, S.A.; Ansari, M.J.; Kasongo, E.L.M. In vitro evaluation of spray and freeze-dried bovine colostrum powder and their effects on the nutritional and functional properties. Int. J. Food Prop. 2024, 27, 985–1002. [Google Scholar] [CrossRef] [Scilit]
  4. Parthasarathi, S.; Anandharamakrishnan, C. Enhancement of oral bioavailability of vitamin E by spray-freeze drying of whey protein microcapsules. Food Bioprod. Process. 2016, 100, 469–476. [Google Scholar] [CrossRef] [Scilit]
  5. Vishali, D.; Monisha, J.; Sivakamasundari, S.; Moses, J.; Anandharamakrishnan, C. Spray freeze drying: Emerging applications in drug delivery. J. Control. Release 2019, 300, 93–101. [Google Scholar] [CrossRef] [Scilit] [PubMed]
  6. Fu, N.; Hao, F.; Zhang, S.; Mao, H.; Lu, W.; Chen, X.D.; Wu, W.D. The survival and stability of Lactobacillus rhamnosus GG as affected by particle formation during spray drying and spray-freeze drying. J. Food Eng. 2024, 383, 112252. [Google Scholar] [CrossRef] [Scilit]
  7. Gordon, A.; Li, B.; Witten, J.; Nguyen, H.; Anderson, D.G. Inhalable dry powders for lung mRNA delivery. Adv. Heal. Mater. 2024, 13, e2400509. [Google Scholar] [CrossRef] [Scilit]
  8. Steegmans, A.; Plitzko, M.; Luy, B.; Lebeer, S.; Kiekens, F. Spray freeze drying as a novel drying process for the formulation of probiotic powders containing Lacticaseibacillus rhamnosus GG. Eur. J. Pharm. Biopharm. 2025, 212, 114748. [Google Scholar] [CrossRef] [Scilit]
  9. Ni, J.; Gong, C.; Su, Z.; Tian, C. Preparation and characterization of dried cellulose nanofibrils. Int. J. Mater. Res. 2021, 112, 617–622. [Google Scholar] [CrossRef] [Scilit]
  10. Zhang, F.; Ren, Z.; Xu, Q.; Dai, X.; Liu, R. Spray freeze dried milk products: Powder microstructure and shell morphology control. Dry. Technol. 2025, 43, 1287–1300. [Google Scholar] [CrossRef] [Scilit]
  11. Carfagna, M.; Rosa, M.; Lucke, M.; Hawe, A.; Frieß, W. Heat flux sensor to create a design space for freeze-drying development. Eur. J. Pharm. Biopharm. 2020, 153, 84–94. [Google Scholar] [CrossRef] [Scilit]
  12. Sebastião, I.B.; Robinson, T.D.; Alexeenko, A. Atmospheric spray freeze-drying: Numerical modeling and comparison with experimental measurements. J. Pharm. Sci. 2017, 106, 183–192. [Google Scholar] [CrossRef] [Scilit] [PubMed]
  13. Straller, G.; Lee, G. Shrinkage of spray-freeze-dried microparticles of pure protein for ballistic injection by manipulation of freeze-drying cycle. Int. J. Pharm. 2017, 532, 444–449. [Google Scholar] [CrossRef] [Scilit] [PubMed]
  14. Guidance for Industry: Q8(R2) Pharmaceutical Development, U.S. Department of Health and Human Services, Food and Drug Administration. Center for Drug Evaluation and Research (CDER), and Center for Biologics Evaluation and Research (CBER); 2009. Available online: https://www.fda.gov/regulatory-information/search-fda-guidance-documents/q8r2-pharmaceutical-development (accessed on 15 October 2015).
  15. Zuo, J.; de Araujo, G.L.B.; Stephano, M.A.; Zuo, Z.; Bou-Chacra, N.A.; Löbenberg, R. Design space approach in the development of esculetin nanocrystals by a small-scale wet-bead milling process. J. Drug Deliv. Sci. Technol. 2020, 55, 101486. [Google Scholar] [CrossRef] [Scilit]
  16. Fissore, D.; Pisano, R.; Barresi, A.A. Applying quality-by-design to develop a coffee freeze-drying process. J. Food Eng. 2014, 123, 179–187. [Google Scholar] [CrossRef] [Scilit]
  17. Harguindeguy, M.; Fissore, D. Micro freeze-dryer and infrared-based PAT: Novel tools for primary drying design space determination of freeze-drying processes. Pharm. Res. 2021, 38, 707–719. [Google Scholar] [CrossRef] [Scilit]
  18. Assegehegn, G.; la Fuente, E.B.-D.; Franco, J.M.; Gallegos, C. An experimental-based approach to construct the process design space of a freeze-drying process: An effective tool to design an optimum and robust freeze-drying process for pharmaceuticals. J. Pharm. Sci. 2020, 109, 785–796. [Google Scholar] [CrossRef] [Scilit]
  19. Goshima, H.; Do, G.; Nakagawa, K. Impact of ice morphology on design space of pharmaceutical freeze-drying. J. Pharm. Sci. 2016, 105, 1920–1933. [Google Scholar] [CrossRef] [Scilit]
  20. Nakagawa, K.; Tamiya, S. Influence of inner vapor transfer property of a freeze dryer on the design space of drying process. AIChE J. 2019, 65, e16571. [Google Scholar] [CrossRef] [Scilit]
  21. Arsiccio, A.; Pisano, R. Application of the quality by design approach to the freezing step of freeze-drying: Building the design space. J. Pharm. Sci. 2018, 107, 1586–1596. [Google Scholar] [CrossRef] [Scilit]
  22. Pérez, R.; Alvarez, M.A.; Acosta, L.L.; Terry, A.M.; Labrada, A. Establishing a Multi-Vial Design Space for the Freeze-Drying Process by Means of Mathematical Modeling of the Primary Drying Stage. J. Pharm. Sci. 2024, 113, 1506–1514. [Google Scholar] [CrossRef] [Scilit]
  23. Luo, C.; Liu, Z.; Mi, S.; Cai, L.; Zhang, Z. Comparison of the Design Space of Products with Different Initial Saturation. J. Pharm. Sci. 2022, 111, 717–726. [Google Scholar] [CrossRef] [Scilit]
  24. Sebastião, I.B.; Bhatnagar, B.; Tchessalov, S.; Ohtake, S.; Plitzko, M.; Luy, B.; Alexeenko, A. Bulk dynamic spray freeze-drying part 2: Model-based parametric study for spray-freezing process characterization. J. Pharm. Sci. 2019, 108, 2075–2085. [Google Scholar] [CrossRef] [Scilit]
  25. Sebastião, I.B.; Bhatnagar, B.; Tchessalov, S. A kinetic model for spray-freezing of pharmaceuticals. J. Pharm. Sci. 2021, 110, 2047–2062. [Google Scholar] [CrossRef] [Scilit] [PubMed]
  26. Song, C.-S.; Yeom, G.-S. Experiment and numerical simulation of heat and mass transfer during a spray freeze-drying process of ovalbumin in a tray. Heat Mass Transf. 2009, 46, 39–51. [Google Scholar] [CrossRef] [Scilit]
  27. Luo, C.; Mi, S.; Zhou, N.; Liu, Z.; Cai, L. Modelling the primary drying stage of the spray freeze drying process based on the non-equilibrium formulation. Int. J. Heat Mass Transf. 2022, 188, 122659. [Google Scholar] [CrossRef] [Scilit]
  28. Kaviany, M. Principles of Heat Transfer in Porous Media; Springer: Berlin/Heidelberg, Germany, 1991. [Google Scholar]
  29. Wang, W.; Yang, J.; Hu, D.; Pan, Y.; Wang, S.; Chen, G. Experimental and Numerical Investigations on Freeze-Drying of Porous Media with Prebuilt Porosity. Chem. Phys. Lett. 2018, 700, 80–87. [Google Scholar] [CrossRef] [Scilit]
  30. Warning, A.D.; Arquiza, J.; Datta, A.K. A multiphase porous medium transport model with distributed sublimation front to simulate vacuum freeze drying. Food Bioprod. Process. 2015, 94, 637–648. [Google Scholar] [CrossRef] [Scilit]
  31. Kim, Y.-Y.; Lee, K.-S. Comparative numerical study of freeze drying of solution and spray-frozen particles in trays and vials. Numer. Heat Transf. Part A Appl. 2008, 54, 406–425. [Google Scholar] [CrossRef] [Scilit]
  32. Liapis, A.; Bruttini, R. A mathematical model for the spray freeze drying process: The drying of frozen particles in trays and in vials on trays. Int. J. Heat Mass Transf. 2009, 52, 100–111. [Google Scholar] [CrossRef] [Scilit]
  33. Van, P.N.; Nguyen, A.N. Simulation and Experimental Analysis of Shelf Temperature Effects on the Primary Drying Stage of Cordyceps militaris Freeze-Drying. Processes 2025, 13, 2269. [Google Scholar] [CrossRef] [Scilit]
  34. Southard, B.; Williams, R.O., III; Cui, Z. Heat transfer characteristics of sublimation from frozen thin films. Int. J. Pharm. 2025, 672, 125346. [Google Scholar] [CrossRef] [Scilit] [PubMed]
  35. Da Silva Simão, R.; Zhang, L.; de Moraes, J.O.; Schröder, A.; Laurindo, J.B.; Schutyser, M.A. Low-pressure conductive thin film drying of açaí pulp. LWT 2022, 164, 113695. [Google Scholar] [CrossRef] [Scilit]
  36. Bjelošević, M.; Seljak, K.B.; Trstenjak, U.; Logar, M.; Brus, B.; Grabnar, P.A. Aggressive conditions during primary drying as a contemporary approach to optimise freeze-drying cycles of biopharmaceuticals. Eur. J. Pharm. Sci. 2018, 122, 292–302. [Google Scholar] [CrossRef] [Scilit] [PubMed]
  37. Hu, X.; Zhang, B.; Du, X.; Zhang, H.; Zhu, T.; Zhang, S.; Yang, X.; Zhang, Z.; Yang, T.; Wang, X.; et al. Recent advances and future perspectives on heat and mass transfer mechanisms enhanced by preformed porous Media in Vacuum Freeze-Drying of agricultural and food products. Foods 2025, 14, 2966. [Google Scholar] [CrossRef] [Scilit]
  38. Luo, C.; Liu, Z.; Mi, S.; Li, L. Quantitative investigation on the effects of ice crystal size on freeze-drying: The primary drying step. Dry. Technol. 2020, 40, 446–458. [Google Scholar] [CrossRef] [Scilit]
  39. Vasheghani Farahani, M.; Hassanpouryouzband, A.; Yang, J.; Tohidi, B. Heat transfer in unfrozen and frozen porous media: Experimental measurement and pore-scale modeling. Water Resour. Res. 2020, 56, e2020WR027885. [Google Scholar] [CrossRef] [Scilit]
  40. Lammens, J.; Goudarzi, N.M.; Leys, L.; Nuytten, G.; Van Bockstal, P.-J.; Vervaet, C.; Boone, M.N.; De Beer, T. Spin freezing and its impact on pore size, tortuosity and solid state. Pharmaceutics 2021, 13, 2126. [Google Scholar] [CrossRef] [Scilit]
Figure 1. The flowchart of constructing the design space.
Energies 19 01989 g001
Figure 2. Schematic diagram of the physical model: (a) the particle-based products; (b) different status of the frozen particles.
Energies 19 01989 g002
Figure 3. The model validation: (a) the comparison with the experimental results; (b) the relative errors between the simulation and experiments.
Energies 19 01989 g003
Figure 4. The saturation at different vertical positions versus time.
Energies 19 01989 g004
Figure 5. The drying time under different operating conditions.
Energies 19 01989 g005
Figure 6. The average increment of drying time at different shelf temperatures (at a constant chamber pressure increment of 5 Pa).
Energies 19 01989 g006
Figure 7. The average decrement of drying time at different chamber pressures (at a constant shelf temperature increment of 5 K).
Energies 19 01989 g007
Figure 8. The maximum product temperature under different operating conditions.
Energies 19 01989 g008
Figure 9. The comparison of the drying time with different packing porosity: (a) εp = 0.5; (b) εp = 0.3.
Energies 19 01989 g009
Figure 10. The comparison of the maximum product temperature with different packing porosity: (a) εp = 0.5; (b) εp = 0.3.
Energies 19 01989 g010
Table 1. Physical properties used in the simulation.
ParametersValueParametersValue
εp (−)0.5εc (−)0.785
ρi (kg/m3)921ΔH (kJ/kg)2840
Mw (kg/kmol)18dp (μm)15
ρF (kg/m3)1030ρD (kg/m3)328
cF (J/(kg·K))1930cD (J/(kg·K))2590
λF (W/(m·K))2.4λD (W/(m·K))0.05
Table 2. Operating parameters.
ParametersValueParametersValue
Twall (K)275.15TL (K)247.15
hf (W/(m2·K))10e (−)1
Pamb (Pa)15T0 (K)233.15
L (mm)7
Table 3. Sensitivity of the change rates of the saturation (Tshelf = 275.15 K; Tamb = 15 Pa).
Change RatesDrying Time (s) Maximum Product TemperatureSaturation
1 × 10−51300233.280.99
1 × 10−632,010249.090.30
1 × 10−771,5102570.024
1 × 10−8106,110257.720.023
Disclaimer/Publisher’s Note: The statements, opinions and data contained in all publications are solely those of the individual author(s) and contributor(s) and not of MDPI and/or the editor(s). MDPI and/or the editor(s) disclaim responsibility for any injury to people or property resulting from any ideas, methods, instructions or products referred to in the content.