Article

Improved YOLO11 with Mamba-2 (SSD) and Triplet Attention for High-Voltage Bushing Fault Detection from Infrared Images

School of Artificial Intelligence, China University of Geosciences Beijing, Beijing 100083, China
*
Author to whom correspondence should be addressed.
Energies 2026, 19(8), 1923; https://doi.org/10.3390/en19081923
Submission received: 11 February 2026 / Revised: 8 April 2026 / Accepted: 13 April 2026 / Published: 15 April 2026

Abstract

High-voltage bushings, the fault-prone key electrical components of transformers, are critical for real-time and high-accuracy fault monitoring and management. Intelligent fault detection via infrared images is plagued by low classification accuracy due to massive interference from similar tubular objects and small target characteristics. This study proposes a lightweight deep learning model, MTrip–YOLO, an improved YOLO11n integrated with Mamba-2 (Structured State Space Duality, SSD) and Triplet Attention, to achieve efficient fault monitoring in complex backgrounds. The training and validation dataset comprises open-source images, on-site data from a substation, and field-collected infrared images, categorized into four types: normal bushings, poor contact, oil shortage, and high dielectric loss faults. Mamba-2 captures the long-range global context of infrared features with its linear-complexity long-range modeling capability to enhance feature extraction, while Triplet Attention suppresses complex background radiation noise through cross-dimensional interaction without dimensionality reduction, enabling the model to focus on small targets and accurately classify bushings from morphologically similar strip-shaped objects. Experimental results show that MTrip–YOLO achieves a top mAP50 of 91.6% and a minimal parameter count of 1.9 M, outperforming Faster R-CNN, RT-DETR, and YOLO26n across all evaluated metrics and being potentially suitable for edge deployment on UAV-mounted or handheld infrared platforms, pending hardware validation on embedded computing devices. Ablation experiments verify the independent contributions of Mamba-2 (0.8027% mAP50 improvement) and Triplet Attention (0.89327% mAP50 improvement), with a synergistic effect from their combination. MTrip–YOLO provides a potential edge-deployable solution for high-voltage bushing fault monitoring, offering important application value for the intelligent operation and maintenance of substations.

1. Introduction

As the core connection hub between power transformers and the power grid, the insulation state of high-voltage bushings is directly related to the safe and stable operation of the entire power system. Under long-term exposure to high-voltage, large current, and complex environmental stresses, bushings are prone to thermal faults caused by poor contact, moisture, or material aging. Infrared Thermography (IRT) has become the mainstream method for condition detection of electrical equipment due to its prominent advantages such as non-contact, long-distance, and real-time monitoring [1,2,3]. However, with the advancement of smart grid construction, the infrared image data generated by substation inspection has experienced explosive growth. The traditional manual interpretation method is not only inefficient but also highly susceptible to the subjective experience and fatigue of inspectors, making it difficult to meet the demand for real-time and high-precision diagnosis [4]. Therefore, researching a high-robustness and automated bushing fault detection algorithm has important engineering significance.
To address these challenges, this study proposes MTrip–YOLO, a lightweight detection model based on improved YOLO11n, integrating Mamba-2 [5] for global context modeling and Triplet Attention [6,7] for small target feature enhancement. The experimental results demonstrate that MTrip–YOLO achieves a top mAP50 of 91.6% with only 1.9 M parameters, outperforming mainstream models including Faster R-CNN, RT-DETR, and YOLO26n, and is well-suited for edge deployment in substation inspection scenarios. The remainder of this paper is organized as follows: Section 2 reviews the current state of research on infrared fault detection; Section 3 describes the experimental dataset and augmentation strategies; Section 4 presents the proposed methodology; Section 5 reports results and analysis; Section 6 concludes the paper.

2. Literature Review and Current Research Status

This section provides a systematic review of existing research on infrared-based fault detection for power equipment, covering traditional image processing methods, deep learning approaches, and the key technical challenges that motivate this present work.

2.1. Traditional Image Processing Methods

In the early stage of automated diagnosis research, scholars mainly focused on extracting thermal features of fault areas using digital image processing technologies. The Otsu method, a maximum between-class variance algorithm, is widely applied for the threshold segmentation of hot spot areas [8]. Yu et al. further optimized the segmentation effect of electrical equipment in complex backgrounds by combining the Region Growing algorithm [9]. In addition, Laib dit Leksir et al. realized the classification of thermal anomalies using machine learning algorithms such as Support Vector Machine (SVM) by extracting texture and shape features [10]. Although these traditional methods perform well in simple backgrounds, infrared images inherently have defects such as low resolution, poor contrast, and blurry edges [8,9]. When facing complex metal structure backgrounds or uneven illumination in substations, algorithms relying on hand-crafted features struggle to adaptively separate targets from the background [9], leading to a high false detection rate.

2.2. Deep Learning-Based Detection Methods

In recent years, the breakthrough of deep learning technology has provided a new solution for power visual detection. Current mainstream algorithms are mainly divided into two-stage and one-stage categories. Two-stage algorithms represented by Mask R-CNN exhibit excellent detection accuracy. Jiang et al. realized the accurate localization and fault region segmentation of transformer bushings using Mask R-CNN, effectively solving the problem of insufficient feature extraction capability of traditional methods [11], and Gao et al. significantly improved the detection rate of overheating defects in composite insulators by improving Mask R-CNN and combining transfer learning [12]. Recent work has further demonstrated the applicability of segmentation-based approaches to hidden fault detection in power facilities [13]. However, two-stage algorithms have complex network structures and huge parameter counts, making it difficult to achieve real-time inference on edge devices with limited computing power, such as unmanned aerial vehicles (UAVs) or handheld terminals [14,15]. To balance speed and accuracy, one-stage algorithms represented by the YOLO (You Only Look Once) series have gradually become a research hotspot. Liu et al. realized the rapid localization of substation insulators based on YOLOv3 [16]. To improve diagnostic efficiency, Li et al. [15] developed the PEDNet framework, proving that specialized lightweight architectures can effectively balance speed and accuracy in substation monitoring. Li et al. further adapted YOLOv5 specifically to infrared image object detection, demonstrating improved performance on IR-specific challenges such as low contrast and thermal noise [17]. Kardaris et al. recently attempted to use YOLOv11 combined with RGB and thermal imaging data for the automatic inspection of ultra-high-voltage substation equipment [18]. More recently, State Space Model (SSM)-based architectures such as Mamba have emerged as a promising alternative to transformers for visual feature extraction, offering linear computational complexity while preserving global context modeling capability, and have been explored in both sequence modeling [5] and visual detection tasks [19,20].

2.3. Key Challenges in High-Voltage Bushing Infrared Detection

Although the existing YOLO series algorithms have achieved remarkable results in general object detection, they still face two severe challenges in the infrared fault detection task of high-voltage bushings. First is the difficulty of small object detection. According to the definition of Rekavandi et al., long-distance bushings in infrared images often appear as small targets with an extremely low pixel ratio (e.g., less than 32 × 32 pixels) and lack texture details [21]. After multiple downsampling operations of CNN, the feature information of these tiny targets is easily lost, leading to missed detection in long-distance or low-resolution monitoring scenarios [22]. Wang et al. attempted to enhance the features of infrared small targets through super-resolution reconstruction, but this also increased the computational burden [23]. Second is the interference problem in complex backgrounds. There are a large number of interfering objects with highly similar morphology to bushings in substation environments, such as bus bars, post insulators, arresters, and other tubular metal equipment [16]. These objects often exhibit similar radiation characteristics in infrared images, forming complex background noise. Existing detection models are mostly based on local receptive fields, and it is difficult to capture the global context information of images, resulting in the model being unable to accurately identify the bushing body and its faults in a background full of interfering heat sources.

2.4. Identified Gaps and Scientific Contributions

The foregoing review highlights three persistent technical limitations in existing approaches to infrared fault detection for high-voltage bushings in substation environments. (1) Representation bottleneck of convolutional architectures: CNN-based detectors are inherently constrained by local receptive fields and struggle to capture long-range spatial dependencies across the full image, which leads to systematic confusion between morphologically similar background structures—such as bus bars and post insulators—and the bushing body. (2) Efficiency–accuracy trade-off in global modeling: transformer-based architectures [24] and large-scale SSM-based visual models such as VMamba offer strong global context modeling, yet their substantial parameter counts and quadratic or near-quadratic complexity render real-time edge deployment on resource-constrained platforms (e.g., UAV-mounted computers, handheld infrared terminals) impractical; to the authors’ knowledge, this trade-off has not been satisfactorily resolved in the substation infrared inspection scenario. (3) Insufficient sensitivity to weak small-target thermal signatures: bushings observed from operational inspection distances frequently appear as small targets with pixel footprints below 32 × 32; repeated downsampling in standard multi-scale feature pyramids leads to an irreversible loss of fine spatial details, substantially degrading the detection of early-stage fault hot spots whose thermal contrast above the background is already inherently limited.
Motivated by the above limitations, this study proposes MTrip–YOLO, an improved lightweight detection model based on the YOLO11n architecture. The principal contributions and scientific novelty of this work are threefold. (1) While Mamba-2 has been applied in general visual detection tasks [19,20], this work presents its first integration into a YOLO-series backbone specifically targeting the substation bushing inspection scenario, where the longitudinal geometry of bushings and the background confusion from morphologically similar tubular structures present challenges that are fundamentally different from general aerial infrared detection. The Mamba-2 module is embedded at Stage 4 of the YOLO11n backbone, replacing C2PSA, enabling global context modeling at linear O(L) complexity to suppress false positives from background structures without the parameter overhead of transformer-based alternatives. (2) Although Triplet Attention is an established mechanism [6], its strategic embedding at the PANet neck fusion nodes—motivated by the specific feature dilution pattern of infrared small-target detection rather than by general design convention—combined with the task-driven removal of the P5 detection head based on dataset-level scale distribution analysis, constitute a domain-specific architectural contribution. (3) A lightweight dual-head architecture (P3/P4 only) combined with WI-ShapeIoU loss is designed to reduce the parameter count by approximately 27.8%, achieving 133 FPS inference speed while maintaining a competitive mAP50 of 91.6%, making the model practically deployable for real-time edge inspection in substations.

3. Experimental Data and Augmentation Strategies

3.1. Data Acquisition and Dataset Construction

The infrared fault dataset constructed in this study comprises three sources: First, open-source substation inspection images collected from publicly available engineering inspection reports and prior published works, covering multiple substation sites, varying meteorological conditions (clear, overcast, high-humidity), and multiple shooting angles. Second, fixed-point monitoring images from an ultra-high-voltage substation in North China, captured at operational inspection distances of 5–20 m. Third, field-collected images from physical degradation simulation experiments conducted under laboratory conditions, in which equivalent bushing specimens were configured to reproduce the fault states identified with temperature gradients verified against the DL/T 664-2016 standard [25].
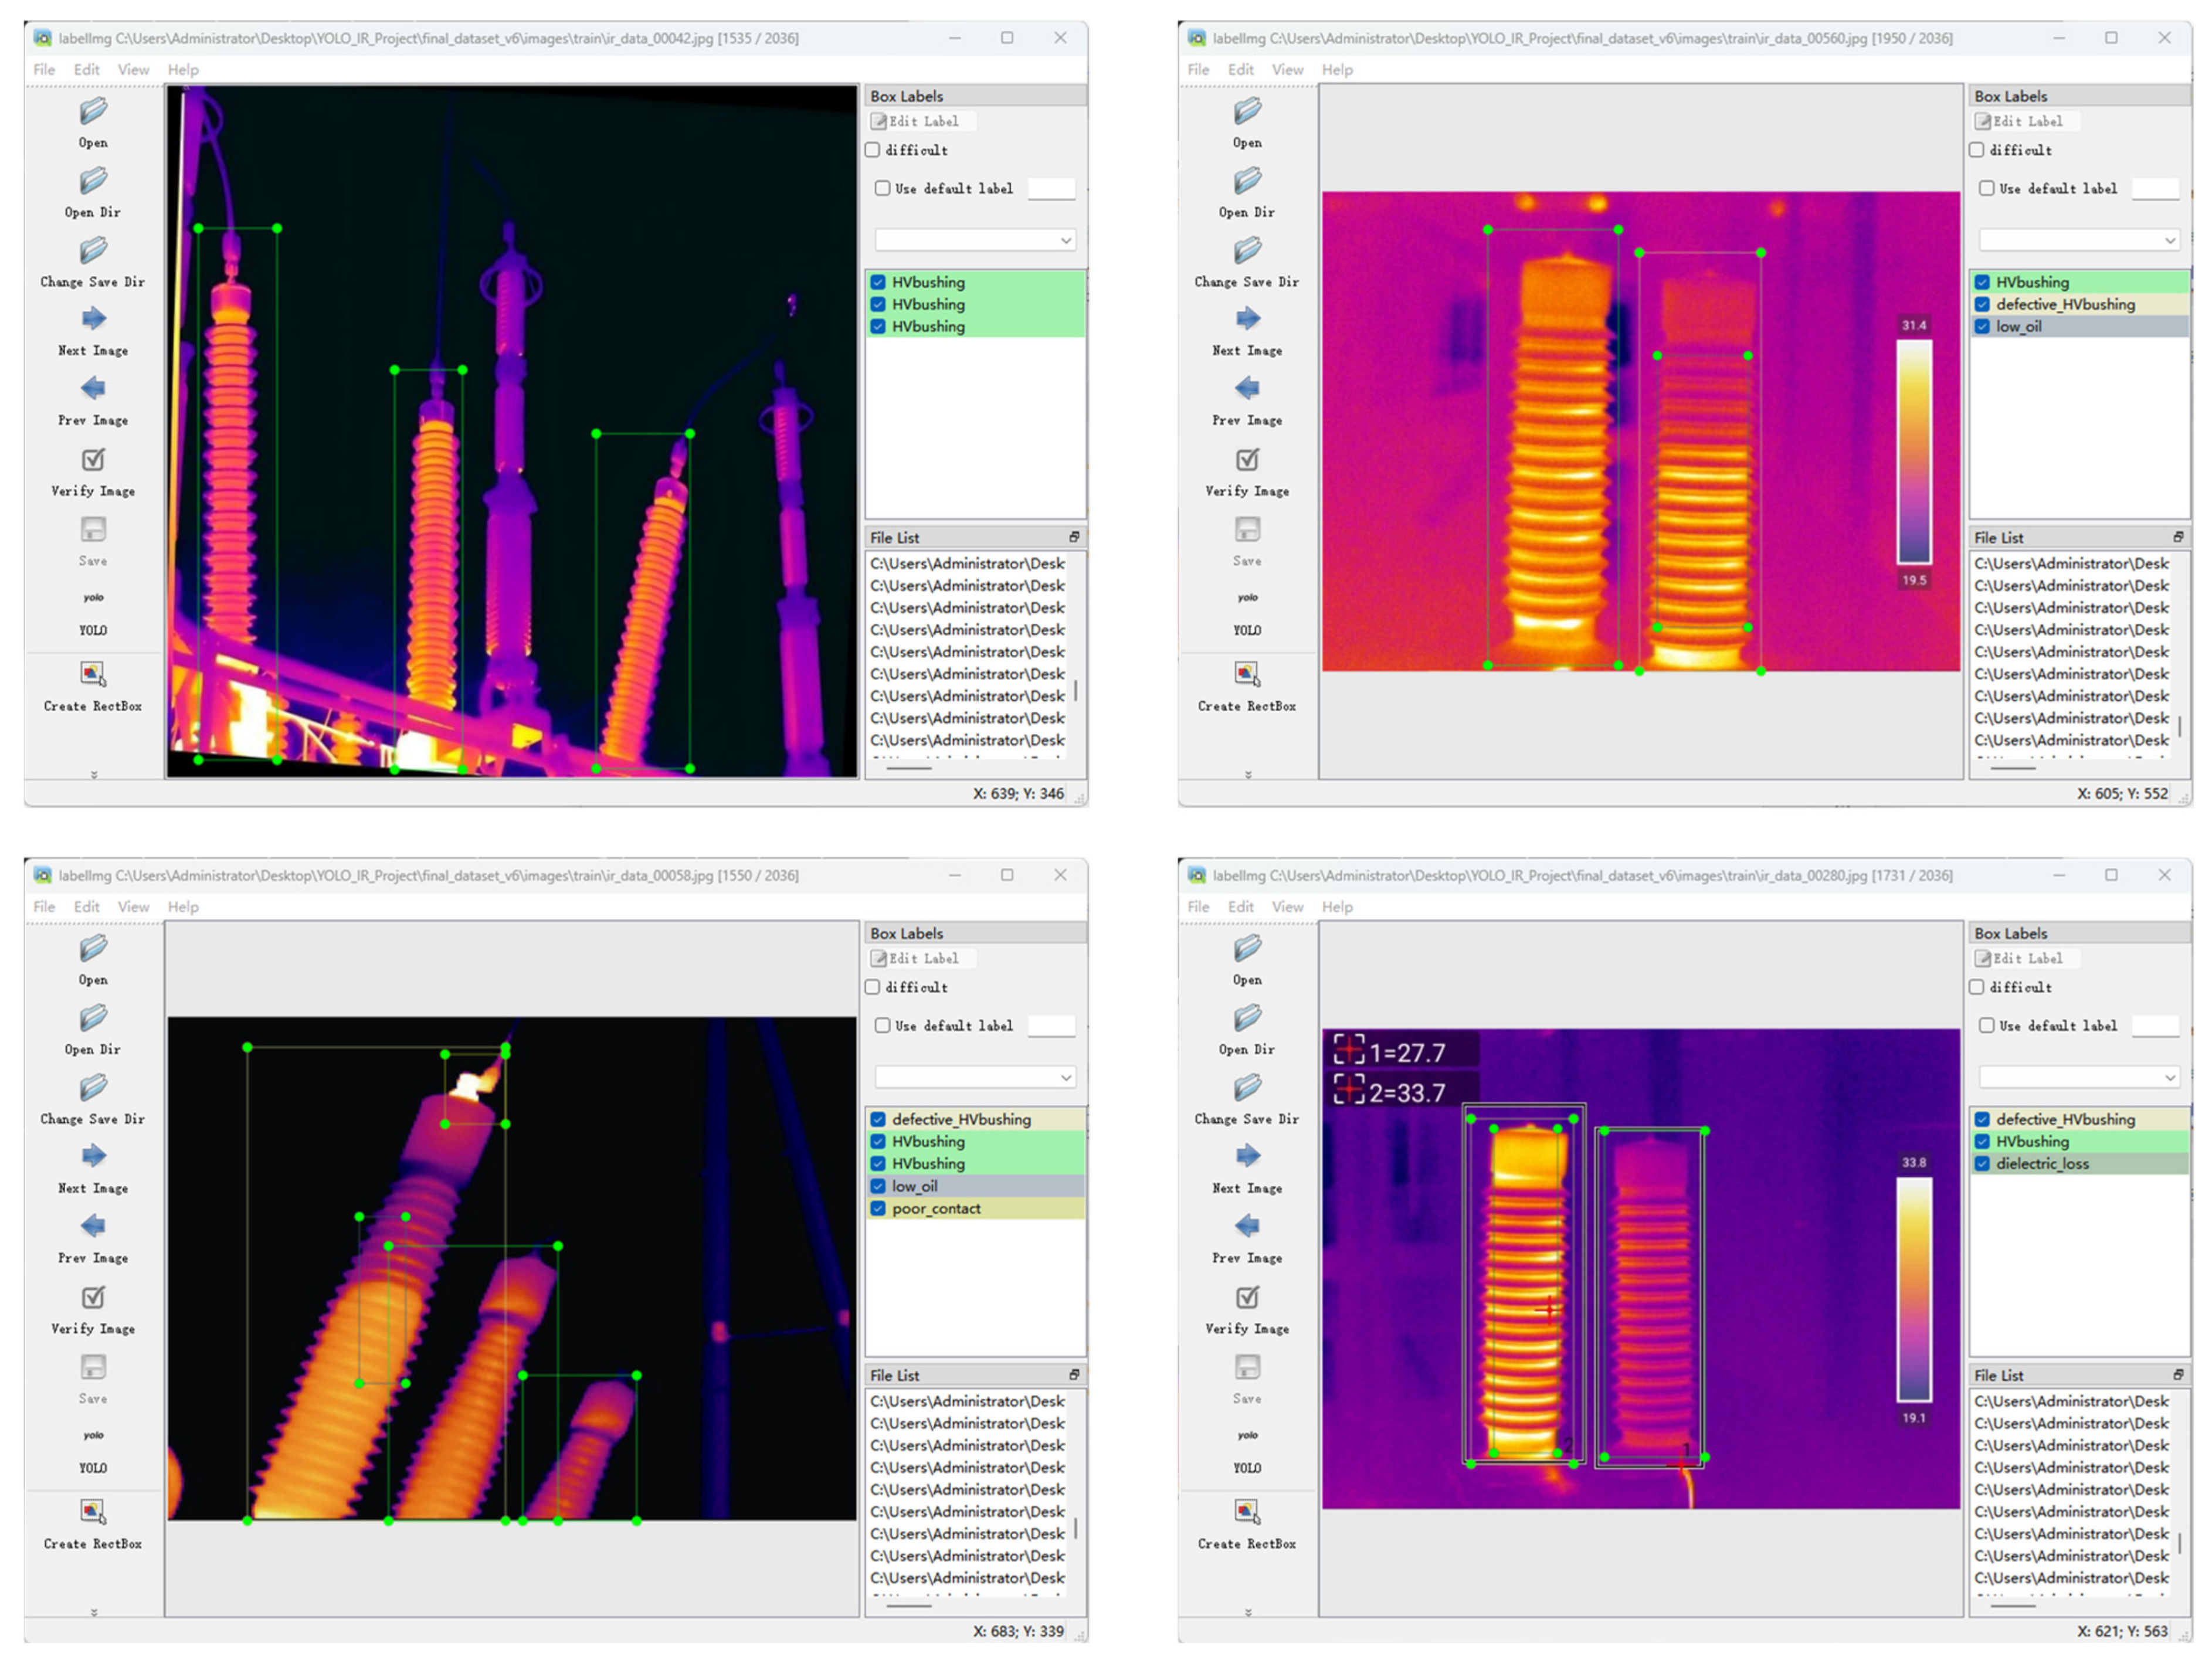
According to the common thermal fault types of high-voltage bushings and the standard Application Rules of Infrared Diagnosis for Live Electrical Equipment (DL/T 664-2016), the images are categorized into five target categories: normal high-voltage bushings, defective high-voltage, bushings poor contact faults, oil shortage faults, and high dielectric loss faults. The images were annotated using LabelImg in YOLO format (class index + normalized center coordinates + normalized width/height). Each image may contain multiple bushing instances. For normal bushing instances, each example needs to be marked with a bounding box and labeled with “HVbushing”. For defective bushing instances, at least two bounding boxes are annotated per instance—one assigned to the Defective-HVbushing label (covering the full bushing body) and one assigned to the specific fault-type label:poor contact, oil shortage, or high dielectric loss (covering the localized fault region). These two boxes represent physically distinct detection targets at different spatial scales. AP is computed independently per class using standard per-class IoU matching; since the two boxes belong to different classes, they are evaluated in separate per-class pipelines and no double-counting occurs. The Defective-HVbushing class is retained as an independent evaluation class because localizing the overall defective bushing body is operationally meaningful in its own right—it enables coarse-level fault flagging even in cases where the specific fault-region box is missed. Figure 1 shows part of the annotated page.
Preliminary statistics show that the original data present a typical long-tail distribution feature: there are a large number of normal samples and poor contact samples, while the samples of hidden faults such as oil shortage and high dielectric loss are extremely scarce, which poses a severe challenge to the generalization ability of deep learning-based object detection models.

3.2. Offline Data Augmentation Pipeline

To address the problems of scarce infrared fault samples and category imbalance, this study designs an Offline Augmentation Pipeline, which integrates the category-balanced Copy–Paste and Mosaic strategies, and introduces an inverse weighted sampling mechanism. The same offline augmentation pipeline is applied to the validation and test sets, with one critical constraint: all Copy–Paste patches and Mosaic source images are drawn exclusively from within each split’s own images—no training-set images are introduced into the validation or test sets at any stage. This intra-split augmentation strategy is motivated by the UAV inspection deployment scenario, in which the model encounters continuous video frames containing multiple co-occurring bushings at varying scales and partial occlusions. It is noted that this evaluation protocol differs from standard clean-image benchmarking practice, which may limit direct comparability with results reported on unaugmented test sets in other works.

3.2.1. Category-Balanced Copy–Paste (Weighted Copy–Paste)

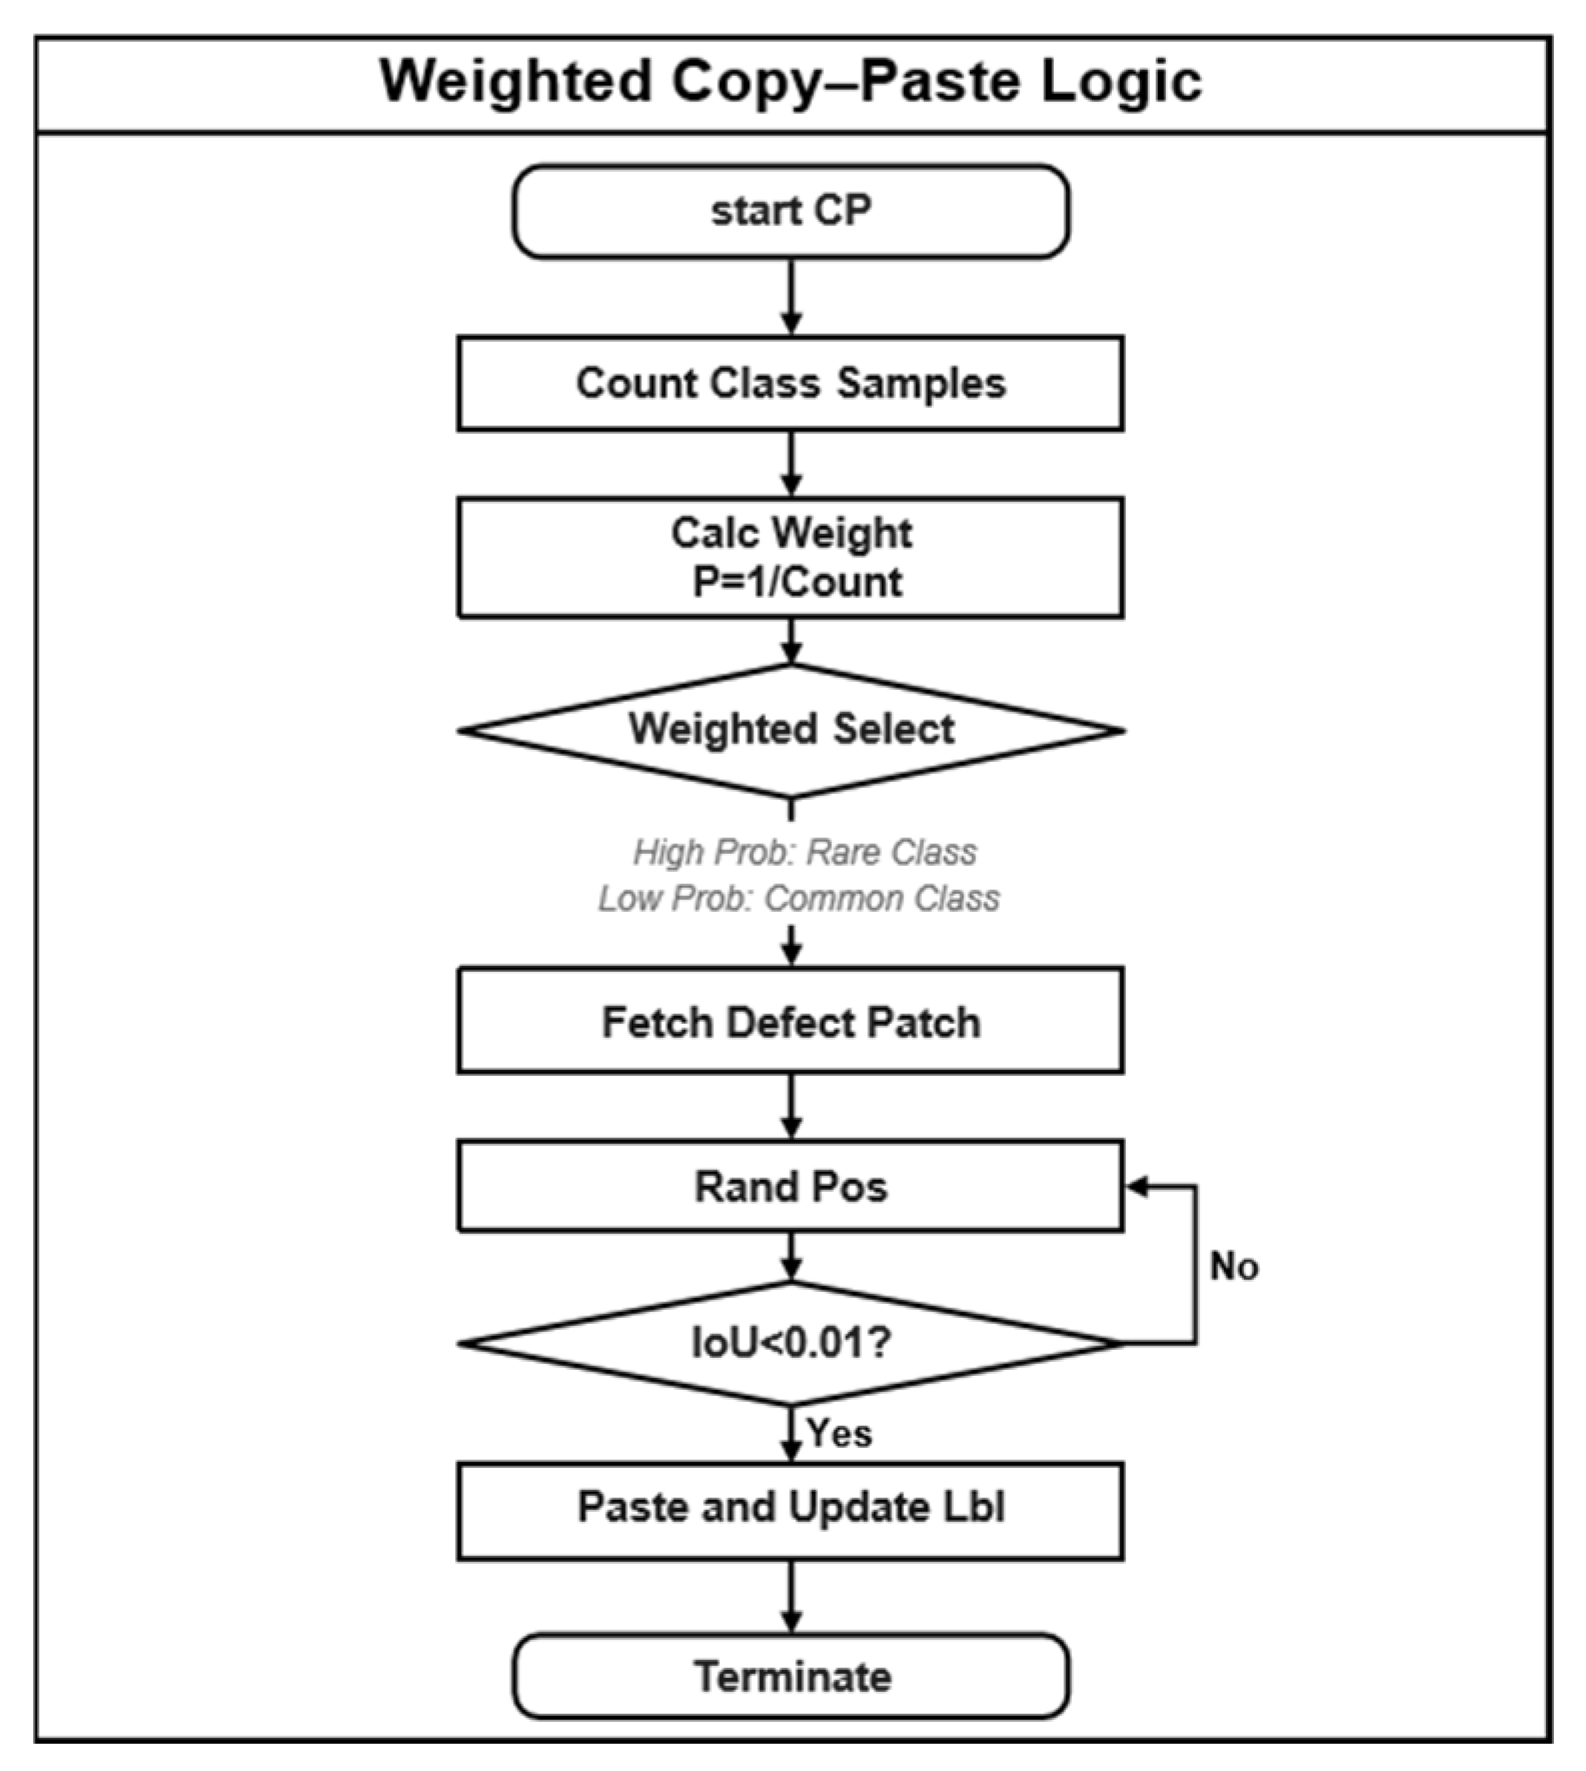
To solve the long-tail distribution problem, this module adopts a Copy–Paste strategy based on Inverse Weighted Sampling, as shown in Figure 2. First, the number of samples N c of each category in the training set is counted, and the sampling probability weight W c of the c-th category target is defined as the reciprocal of the number of samples:
W c = 1 N c + ϵ
where ϵ is a small constant to prevent the denominator from being zero. Patches of scarce fault samples (e.g., oil shortage and high dielectric loss) are extracted with priority according to this weight.
In the pasting process, to prevent the augmentation operation from destroying the original image semantics, an anti-occlusion detection mechanism is introduced. Let the bounding box of the patch to be pasted be Bpatch, and the set of bounding boxes of existing targets in the background image be B g t . The following Intersection over Union (IoU) constraint must be satisfied:
m a x B i B g t   I o U B p a t c h , B i < τ
The threshold τ is set to 0.01 in this experiment to ensure that pasted fault instances—which represent localized thermal signatures of specific fault regions—are not obscured by existing annotations, preserving the integrity of their diagnostic features. If the randomly generated position violates this constraint, the system will retry until an un-occluded area is found or the maximum number of retries is reached.

3.2.2. Enhanced Mosaic Strategy

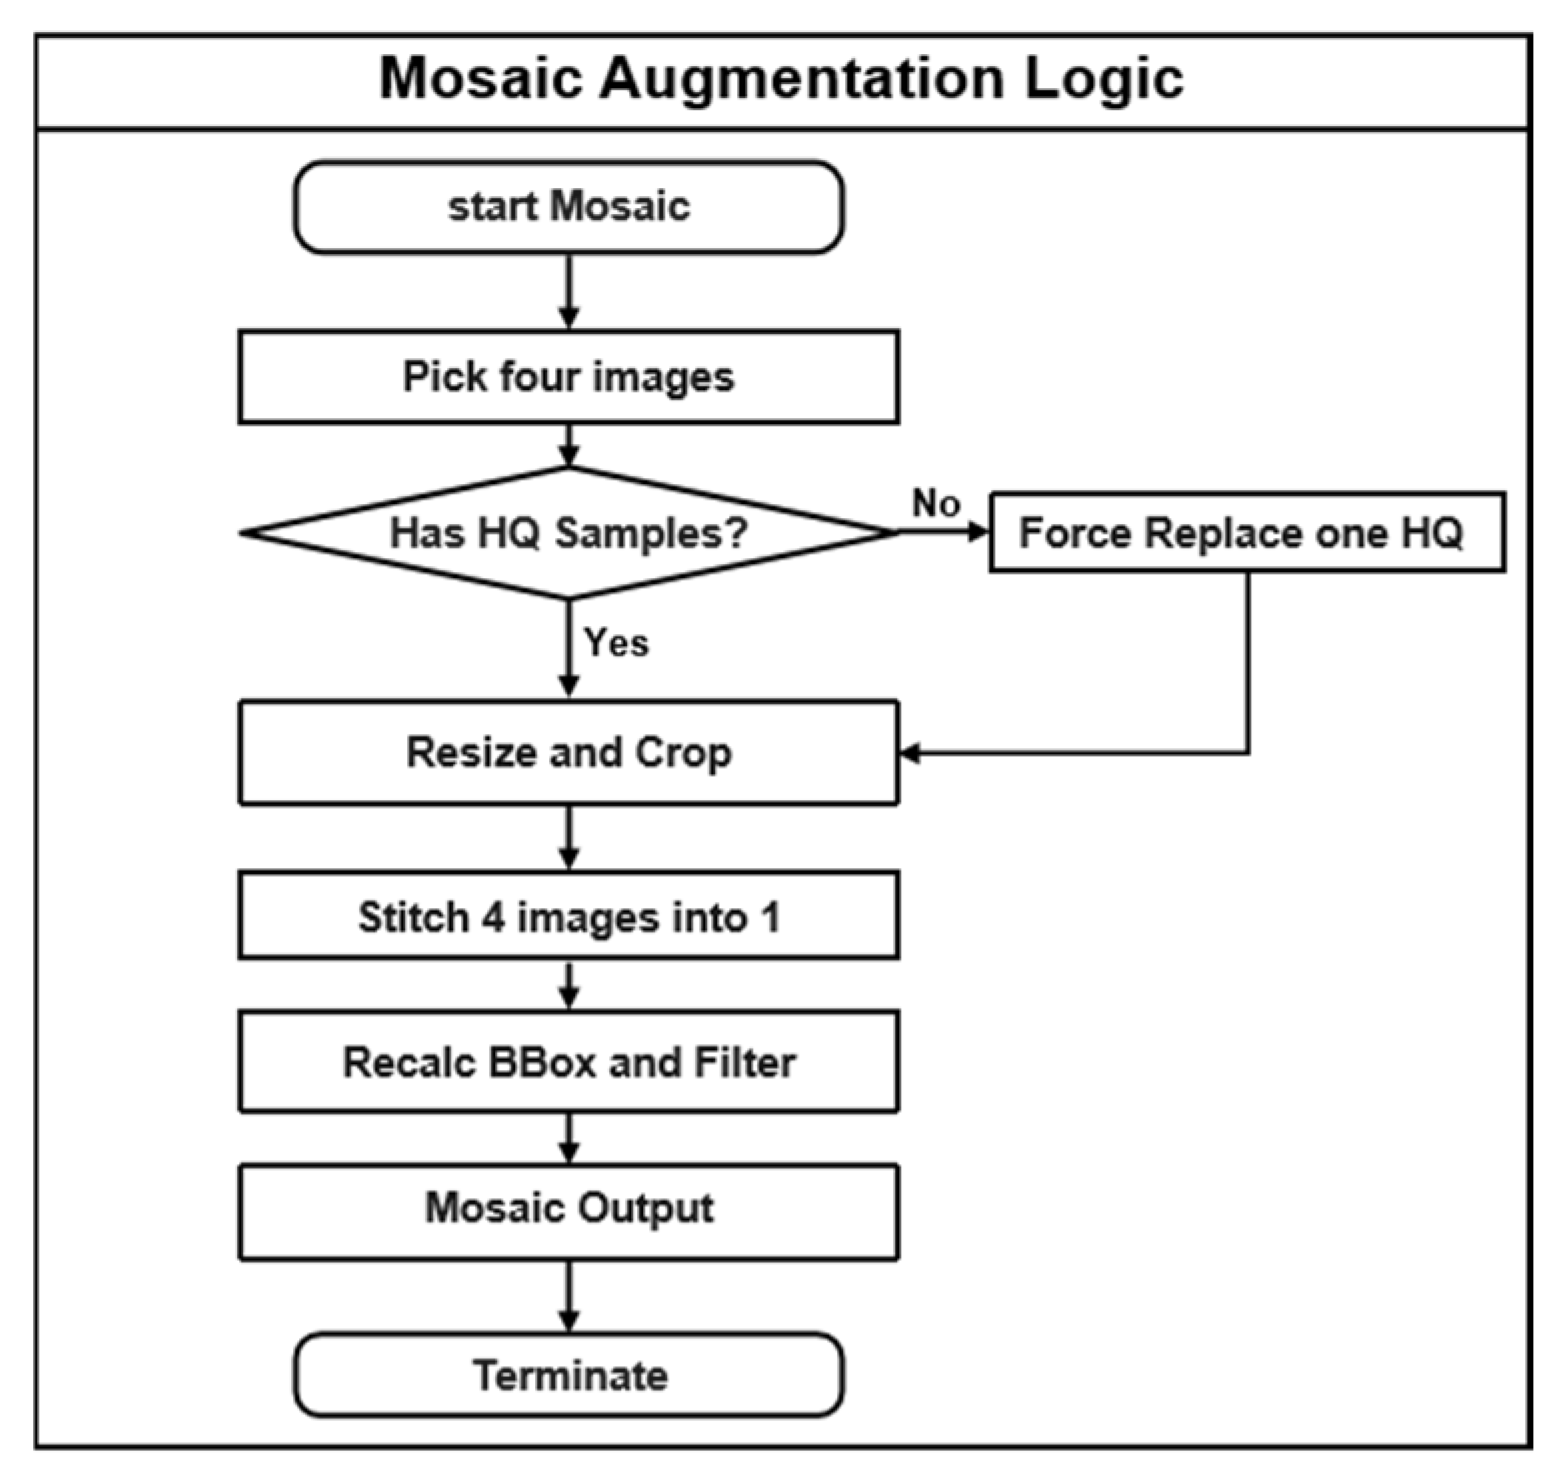
To improve the model’s detection capability for multi-scale targets, especially small targets in infrared images, this study adopts Mosaic augmentation. This method randomly selects four images for random scaling, cropping, and stitching. To prevent the loss of key high-quality (HQ) samples (high-voltage jacket images in complex backgrounds in real scenes), a forced retention logic is added to the algorithm during random cropping. Here, an HQ sample refers to an image that was captured under representative operational conditions (inspection distance 5–20 m, standard thermographic palette) and contains at least one instance of a complex background structure (e.g., bus bars, post insulators, or arresters) co-occurring with the bushing target, reflecting real substation scene complexity. If none of the four randomly selected images contain any scarce fault samples, one of them is forced to be replaced with a high-quality sample to ensure that the model can access hard samples in each training epoch, as shown in Figure 3.
Since the training data have been processed by the offline augmentation pipeline described in Section 3.2, all online strong augmentation strategies built into the YOLO framework—including Mosaic (mosaic = 0), MixUp (mixup = 0) and HSV color jitter (hsv_h = 0, hsv_s = 0, hsv_v = 0)—are disabled during training to avoid interaction with the offline augmentation and prevent distribution shift. Only lightweight online geometric augmentations are retained: random horizontal flip (p = 0.5), random scaling (±50% range), and small translation (±10%).

3.3. Balanced Dataset Splitting Strategy

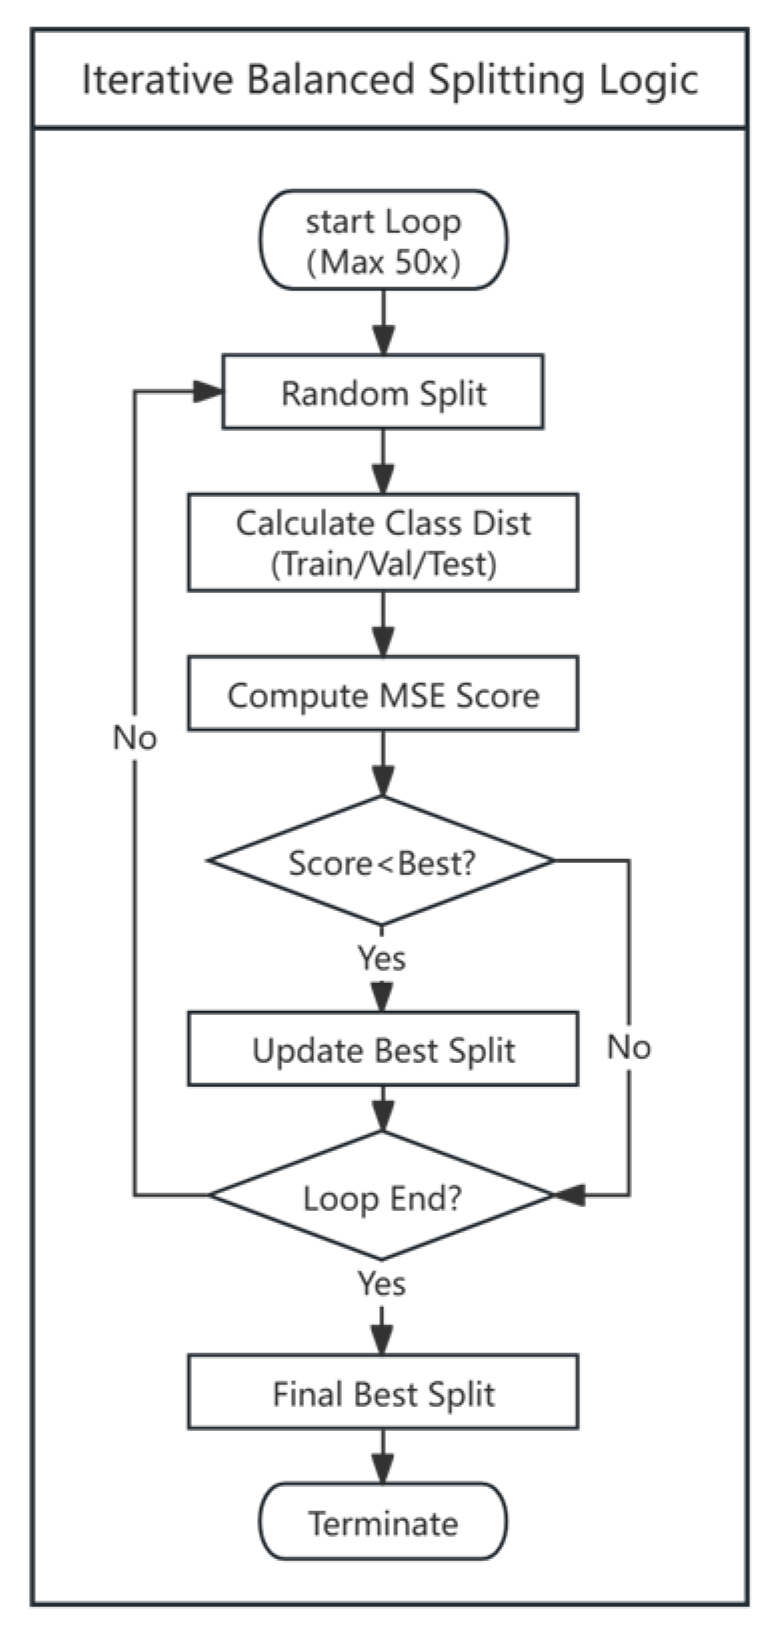
To avoid the distribution deviation of the validation set and test set caused by random splitting, this study abandons traditional random sampling and adopts an Iterative Balanced Splitting algorithm. The algorithm divides the dataset into a training set, validation set, and test set at a ratio of 8:1:1.
Let the dataset contain K categories, and the distribution ratio of the k-th category in the whole dataset be P g l o b a l ( k ) . In the i-th random splitting attempt, the distribution ratio of the k-th category in a subset (e.g., test set) is calculated as P s u b s e t , i ( k ) . To quantify the uniformity of splitting, the Mean Square Error (MSE) is introduced as the evaluation index, and its calculation formula is as follows:
M S E i = 1 K k = 1 K   ( P s u b s e t , i k P g l o b a l k ) 2
The algorithm executes 50 iterative cycles and selects the splitting scheme with the minimum M S E i as the final result, thus ensuring that the test set can truly reflect the model’s generalization performance for various faults. The specific process is shown in Figure 4 below.

3.4. Data Distribution Optimization Results

After the above-mentioned enhancement strategy, the total number of tag ghosts in the final dataset expands to more than 10,000, the total number of images in the dataset expands to more than 2000, and the category distribution is significantly improved. Table 1 reports the total number of annotated bounding-box instances (labels) after augmentation, not the number of images. Each image may contain multiple instances across different classes. “HVbushing” and “Defective-HVbushing” are parent-level meta-labels used during the augmentation pipeline to distinguish an intact state from any defective state; the five operational detection classes used for training and evaluation are normal (HVbushing), defective (Defective-HVbushing), poor contact, oil shortage, and high dielectric loss.
As shown in Table 1, the applied data augmentation pipeline effectively resolves the severe category imbalance present in the original dataset. By significantly increasing the number of hidden fault type label box cases with previously small sample sizes—specifically reaching 1084 cases for oil shortage and 877 cases for high dielectric loss—the enhanced dataset provides a robust and balanced foundation, preventing the model from being biased toward majority classes.
After screening and integration, the benchmark dataset finally constructed in this study contains a total of 2568 infrared images, which are divided into the training set, as shown in Table 2, laying a high-quality data foundation for the subsequent training of the MTrip–YOLO model.
Table 2 details the dataset splitting results based on the Iterative Balanced Splitting algorithm. The strictly controlled 8:1:1 ratio ensures that the MTrip–YOLO model is trained on a massive dataset (2036 images) while avoiding distribution deviation in the validation and test sets.

4. Methodology

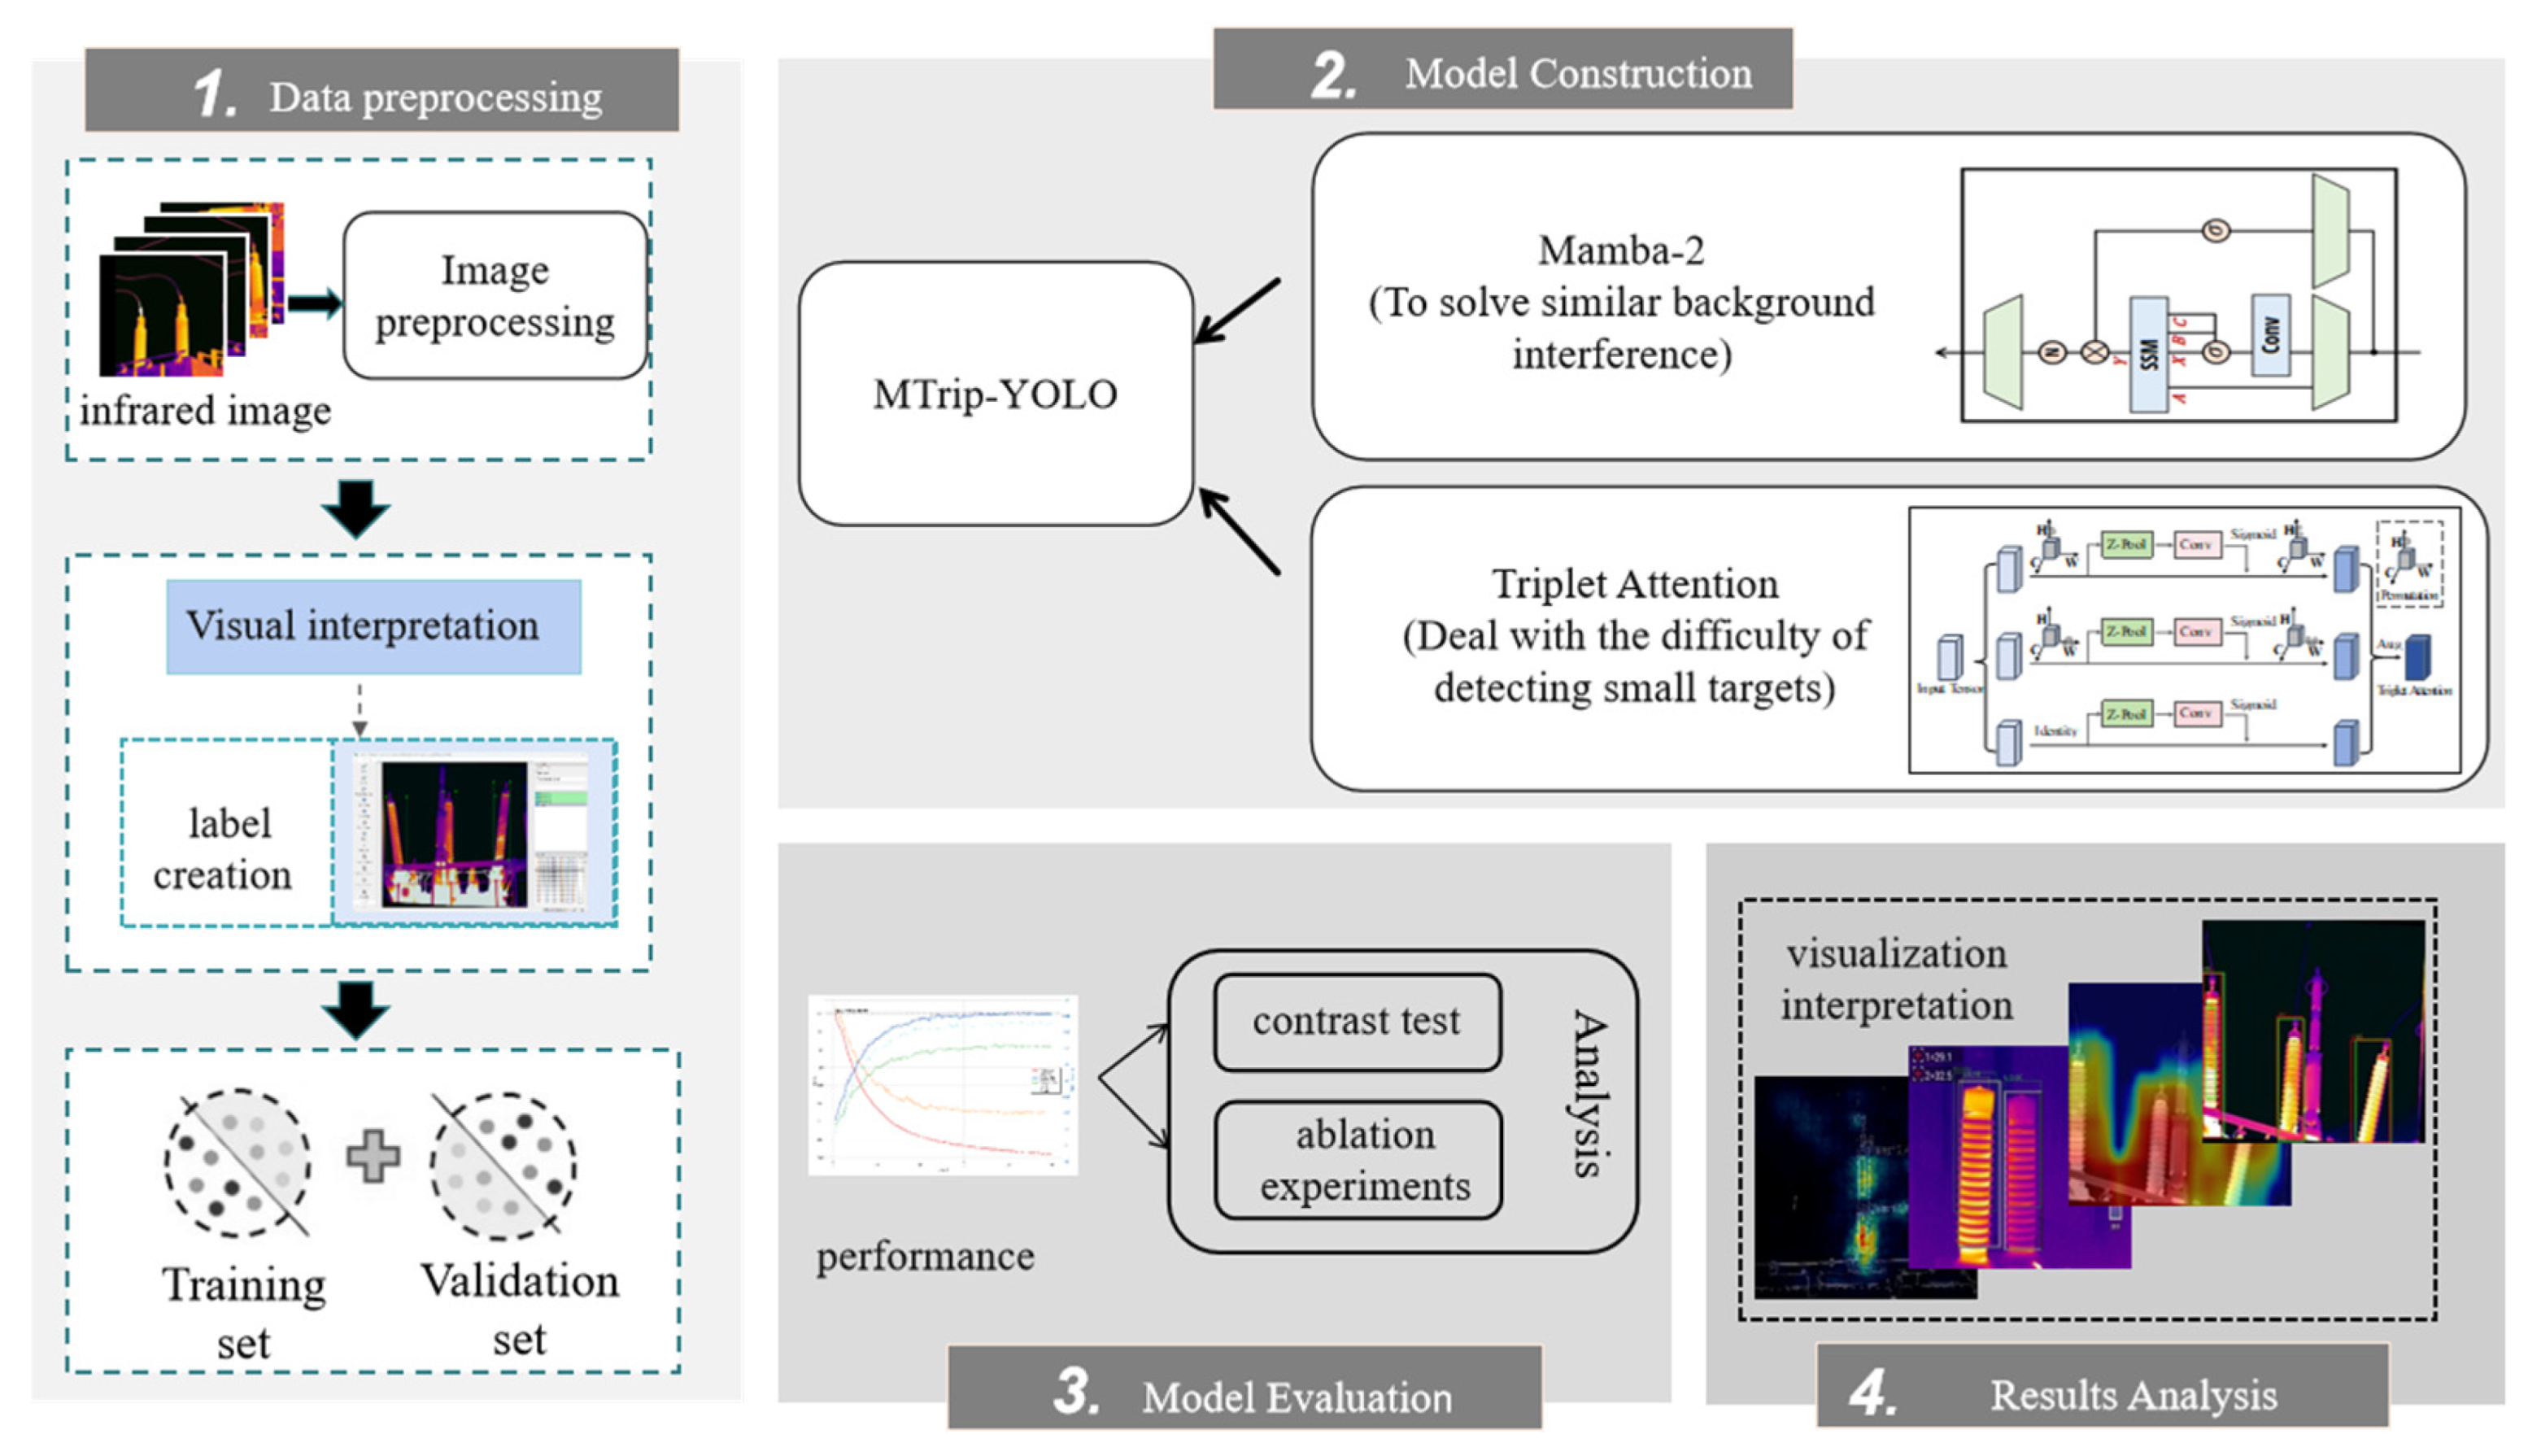
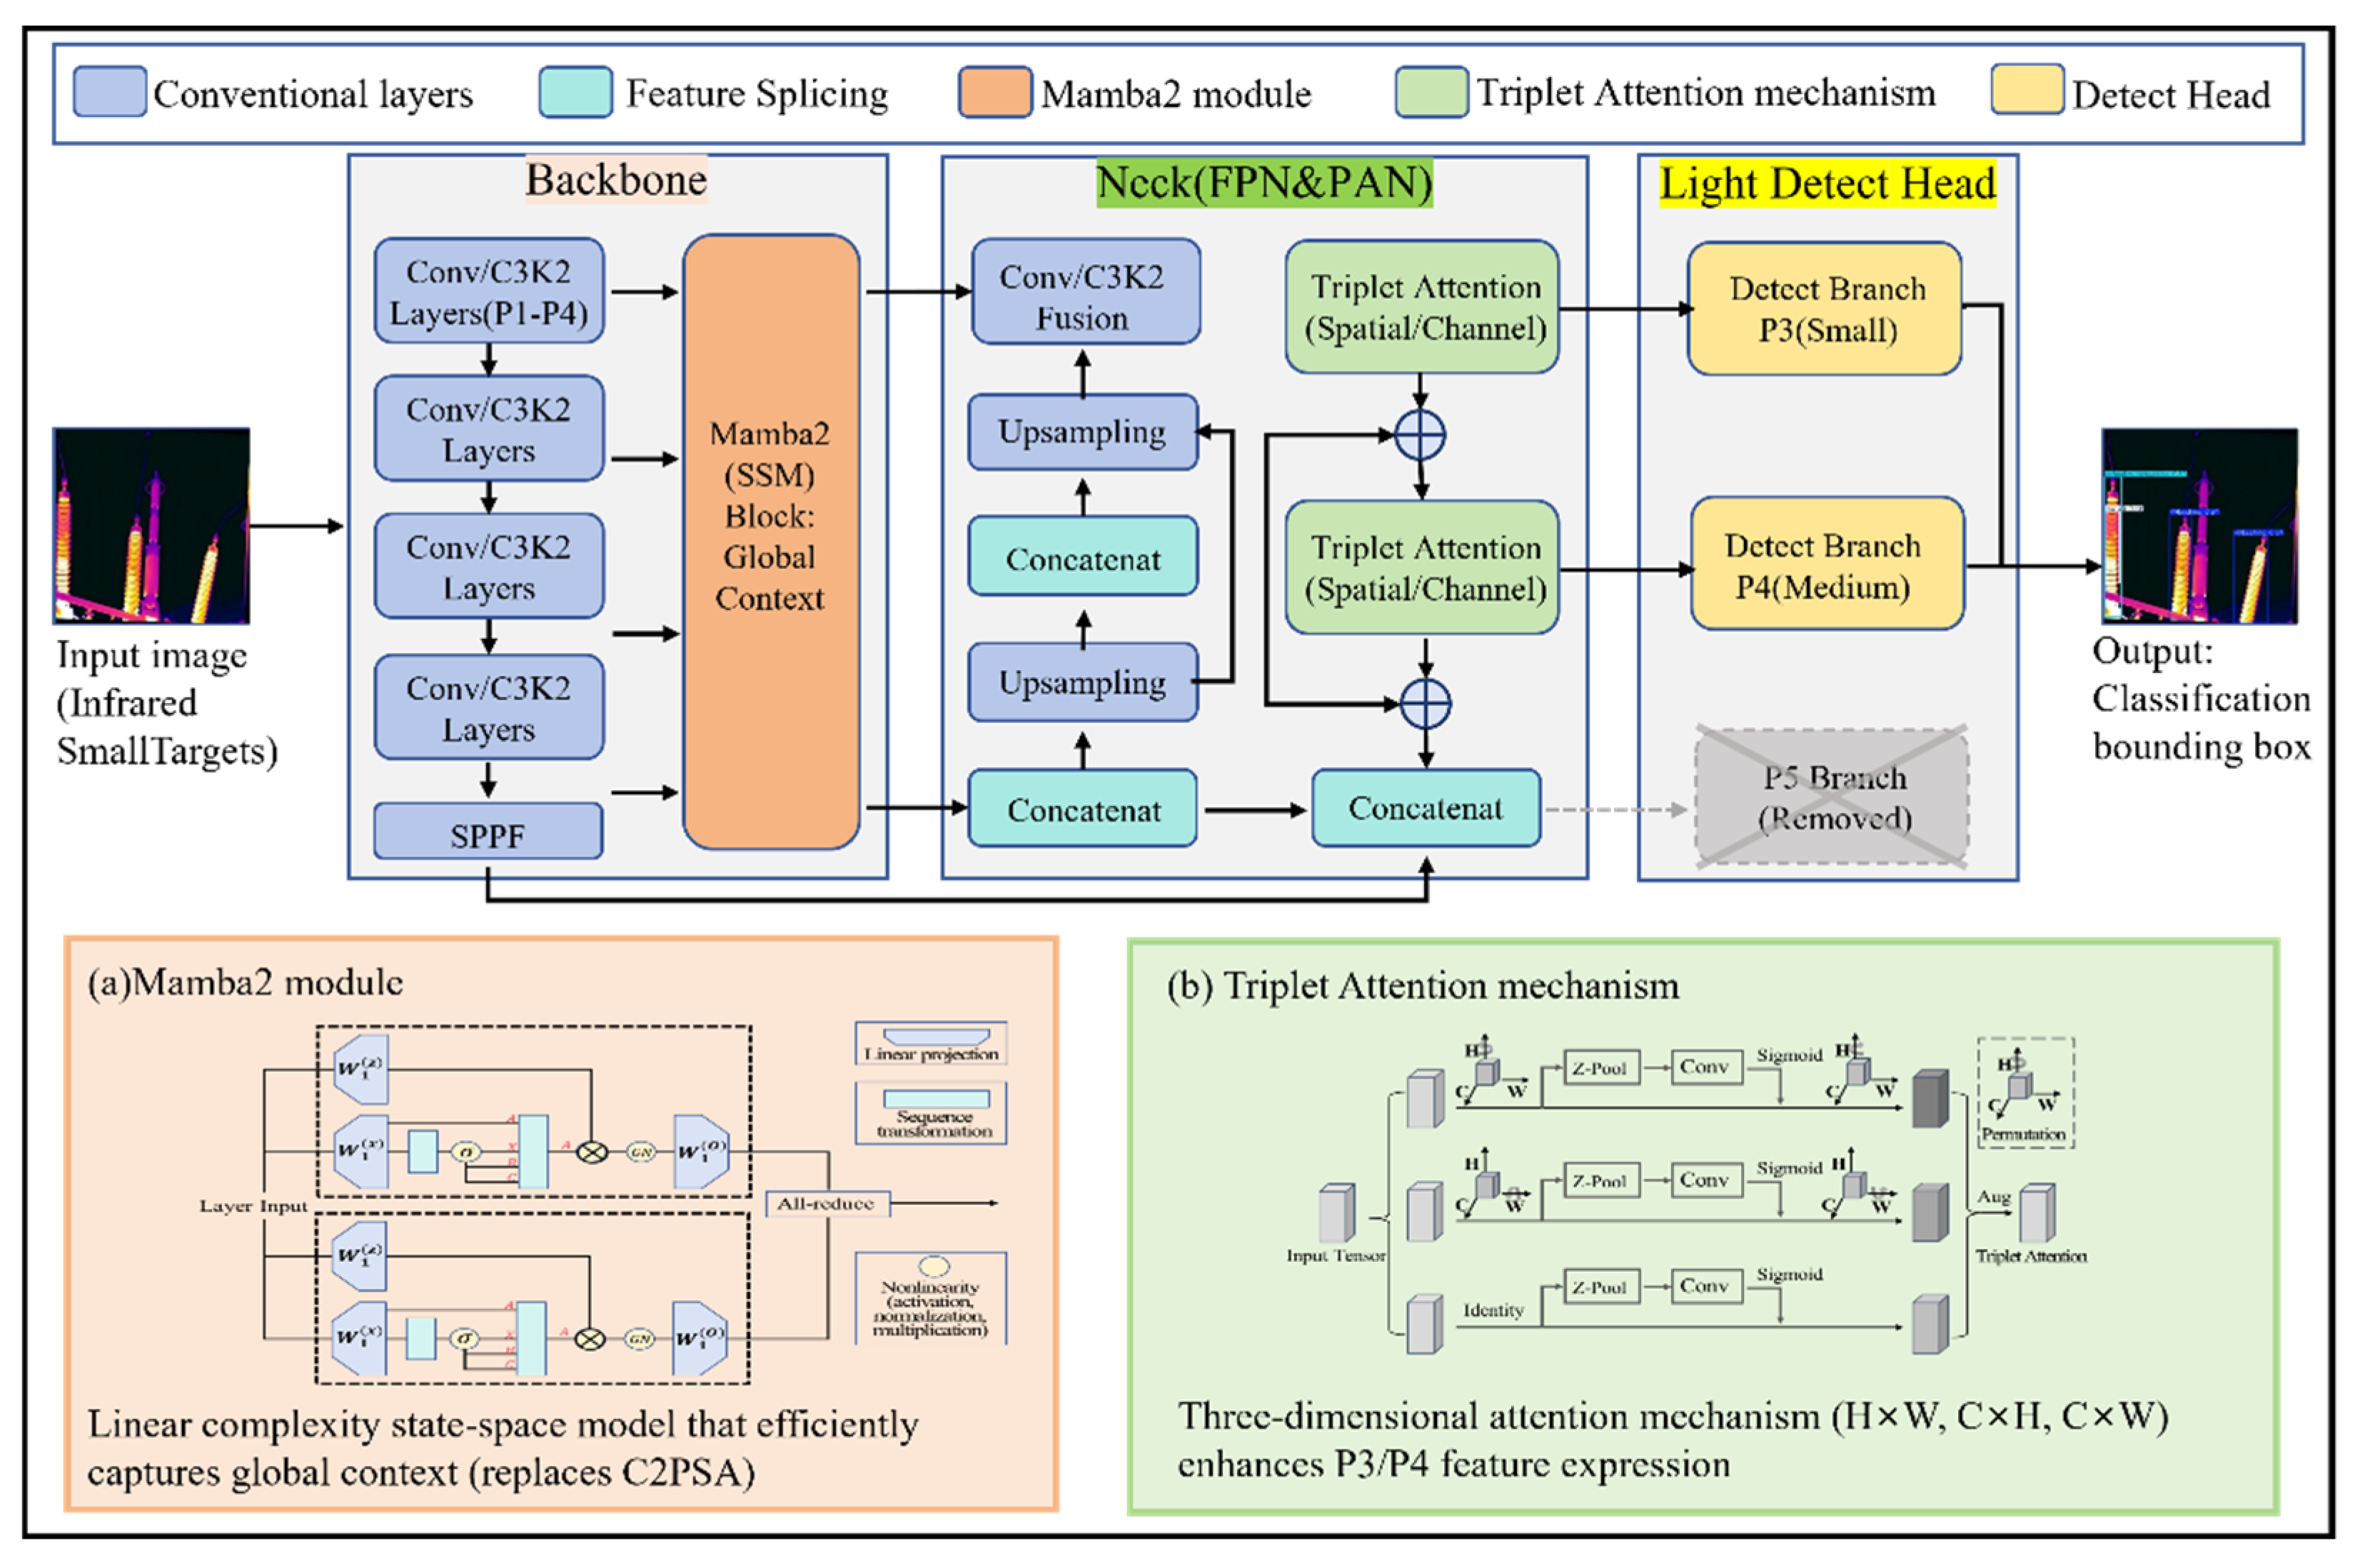
The overall technical framework constructed in this study is designed to solve the two core problems of “invisibility” (weak small target features) and “indistinction” (background interference from similar tubular objects) in infrared images (Figure 5).
The overall process mainly includes four stages: first, in the data preprocessing stage, the original infrared images are augmented and labeled; second, in the model construction stage, a lightweight detection network based on MTrip–YOLO is built, which integrates the Mamba-2 global context module to solve the background interference problem and introduces the Triplet Attention mechanism to overcome the difficulty of small target detection; third, in the model evaluation stage, the effectiveness of the improvement strategies is verified through ablation experiments and comparative experiments; finally, in the result analysis stage, the detection effect of different fault types is verified and analyzed through visualization.

4.1. Model Construction

4.1.1. MTrip–YOLO Architecture

YOLO11n was selected as the backbone architecture. First, YOLO11n introduces an enhanced C3k2 module and improved feature pyramid structure compared to its predecessors (YOLO v5/v8/v10), offering a better balance between accuracy and computational efficiency at the nano/small model scale. Second, YOLO11n provides a more modular architecture that facilitates the insertion of external attention and SSM modules with minimal structural disruption. Benchmark comparisons on standard datasets confirm that YOLO11n achieves superior mAP with fewer parameters than YOLO v8 and YOLO v10 under equivalent training conditions, making it the most suitable foundation for our lightweight edge-deployment objective.
To realize the real-time and high-precision detection of high-voltage bushing faults on edge computing devices, this study proposes an improved lightweight model—MTrip–YOLO.
The model is reconstructed based on YOLO11n architecture, and three core improvements are made for the characteristics of small target scales and complex background radiation in infrared images (Figure 6).
  • Global feature reconstruction: In the high-level feature stage after the C3k2 module of the backbone network (corresponding to the P5 semantic layer, the feature map resolution is 20 × 20), the Mamba-2 module is embedded to replace the C2PSA module operation, which captures the global dependency between bushings and substation environments by virtue of its long-range modeling capability with linear complexity.
  • Small target feature enhancement: The Triplet Attention mechanism is embedded in the feature fusion stage of the neck to enhance the feature expression of tiny fault points through cross-dimensional interaction.
  • Lightweight detection head: According to the characteristic that power equipment targets are mostly at small or medium scales, the P5 detection layer for detecting extremely large targets is removed, which significantly reduces the parameter count and computational redundancy.

4.1.2. Mamba-2 Backbone for Global Context Modeling

Traditional CNNs are often constrained by local receptive fields, making it difficult to capture long-range pixel dependencies in infrared imagery. To mitigate this within the convolutional framework, Zhang et al. [26] introduced a dynamic receptive field mechanism that enhances the model’s ability to localize distant features. Although the transformer architecture can better solve this problem through self-attention mechanisms, its quadratic computational complexity of O(N2) limits the inference speed [24].
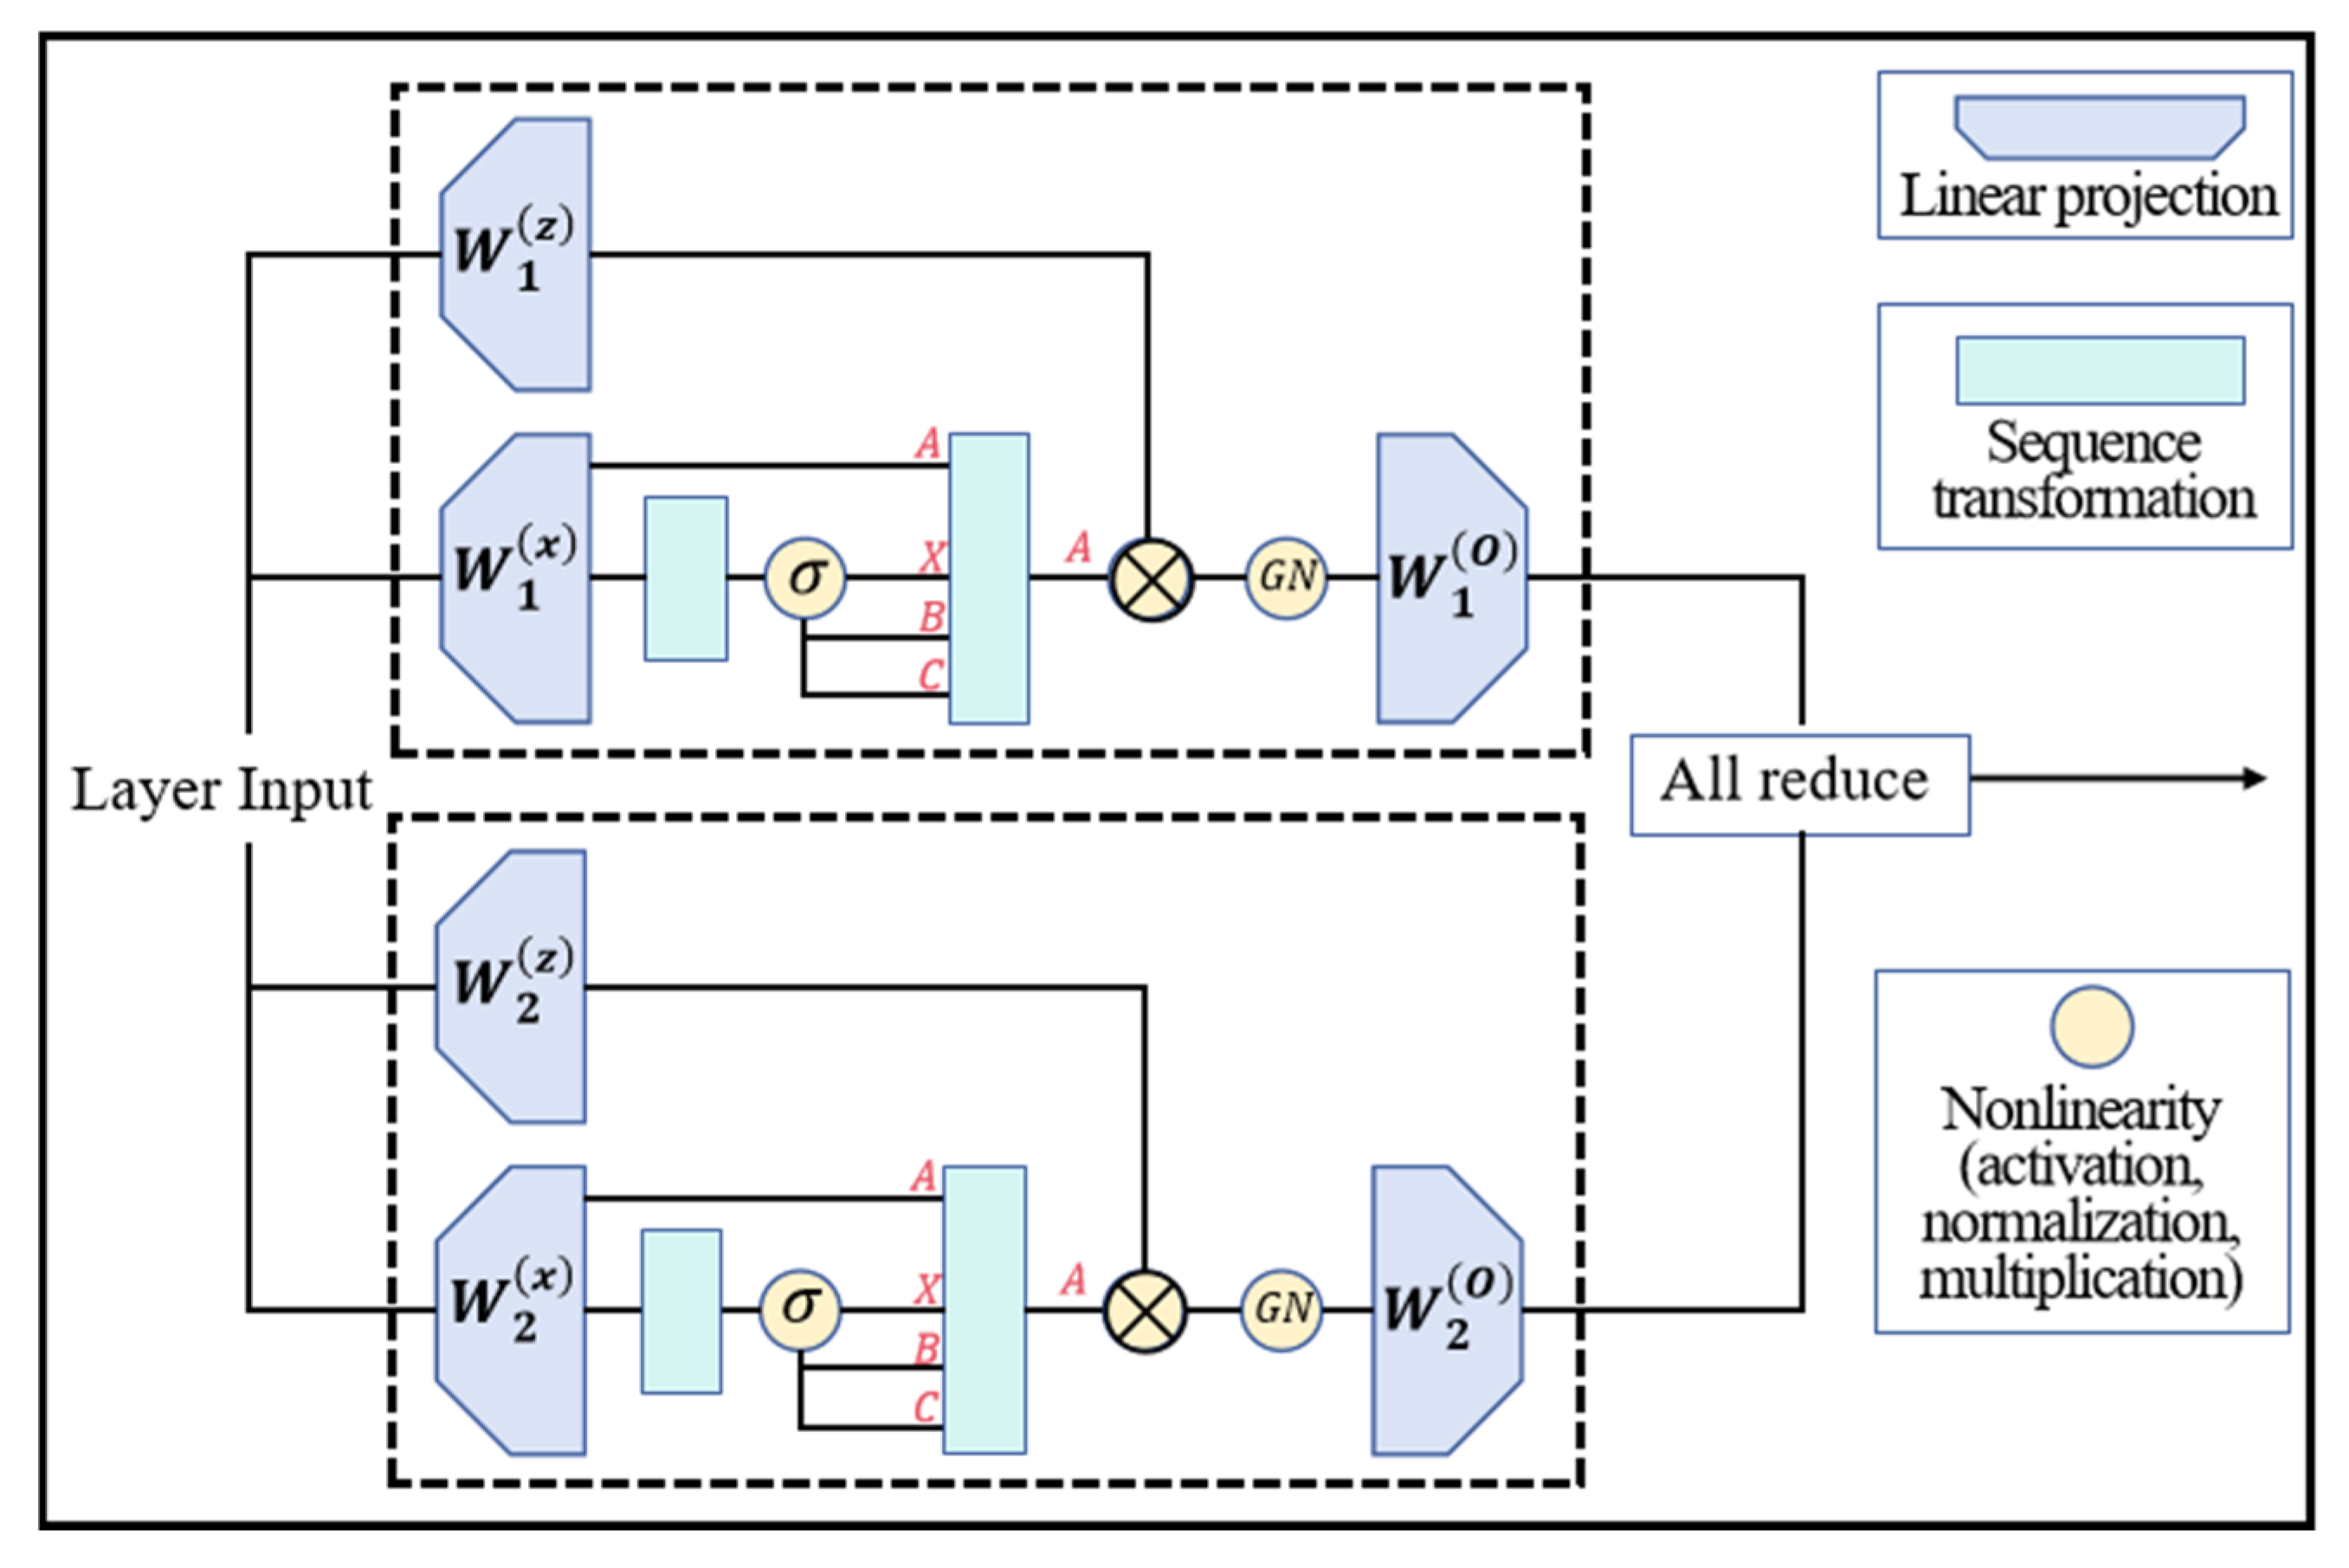
To balance long-range dependency modeling and inference efficiency, this study introduces the Mamba-2 module [24]. Built upon the State Space Model (SSM) framework, Mamba-2 introduces the Structured State Space Duality (SSD) theory, which establishes a mathematical equivalence between the SSM recurrence and a structured masked attention operation. This duality enables the SSD layer to avoid materializing the full L × L attention score matrix required by standard self-attention, yielding O(L) time and space complexity as a theoretical guarantee of the SSD formulation. As shown in Figure 7, its mathematical model discretizes the state equation of the continuous system, enabling the model to obtain the long-range geometric contour information of objects like sequence scanning:
h t = A ¯ h t 1 + B ¯ x t
y t = C h t
where x t is the input sequence, h t is the hidden state, and yt is the output. Mamba-2 optimizes the efficiency of matrix operations by introducing Structured State Space Duality (SSD).
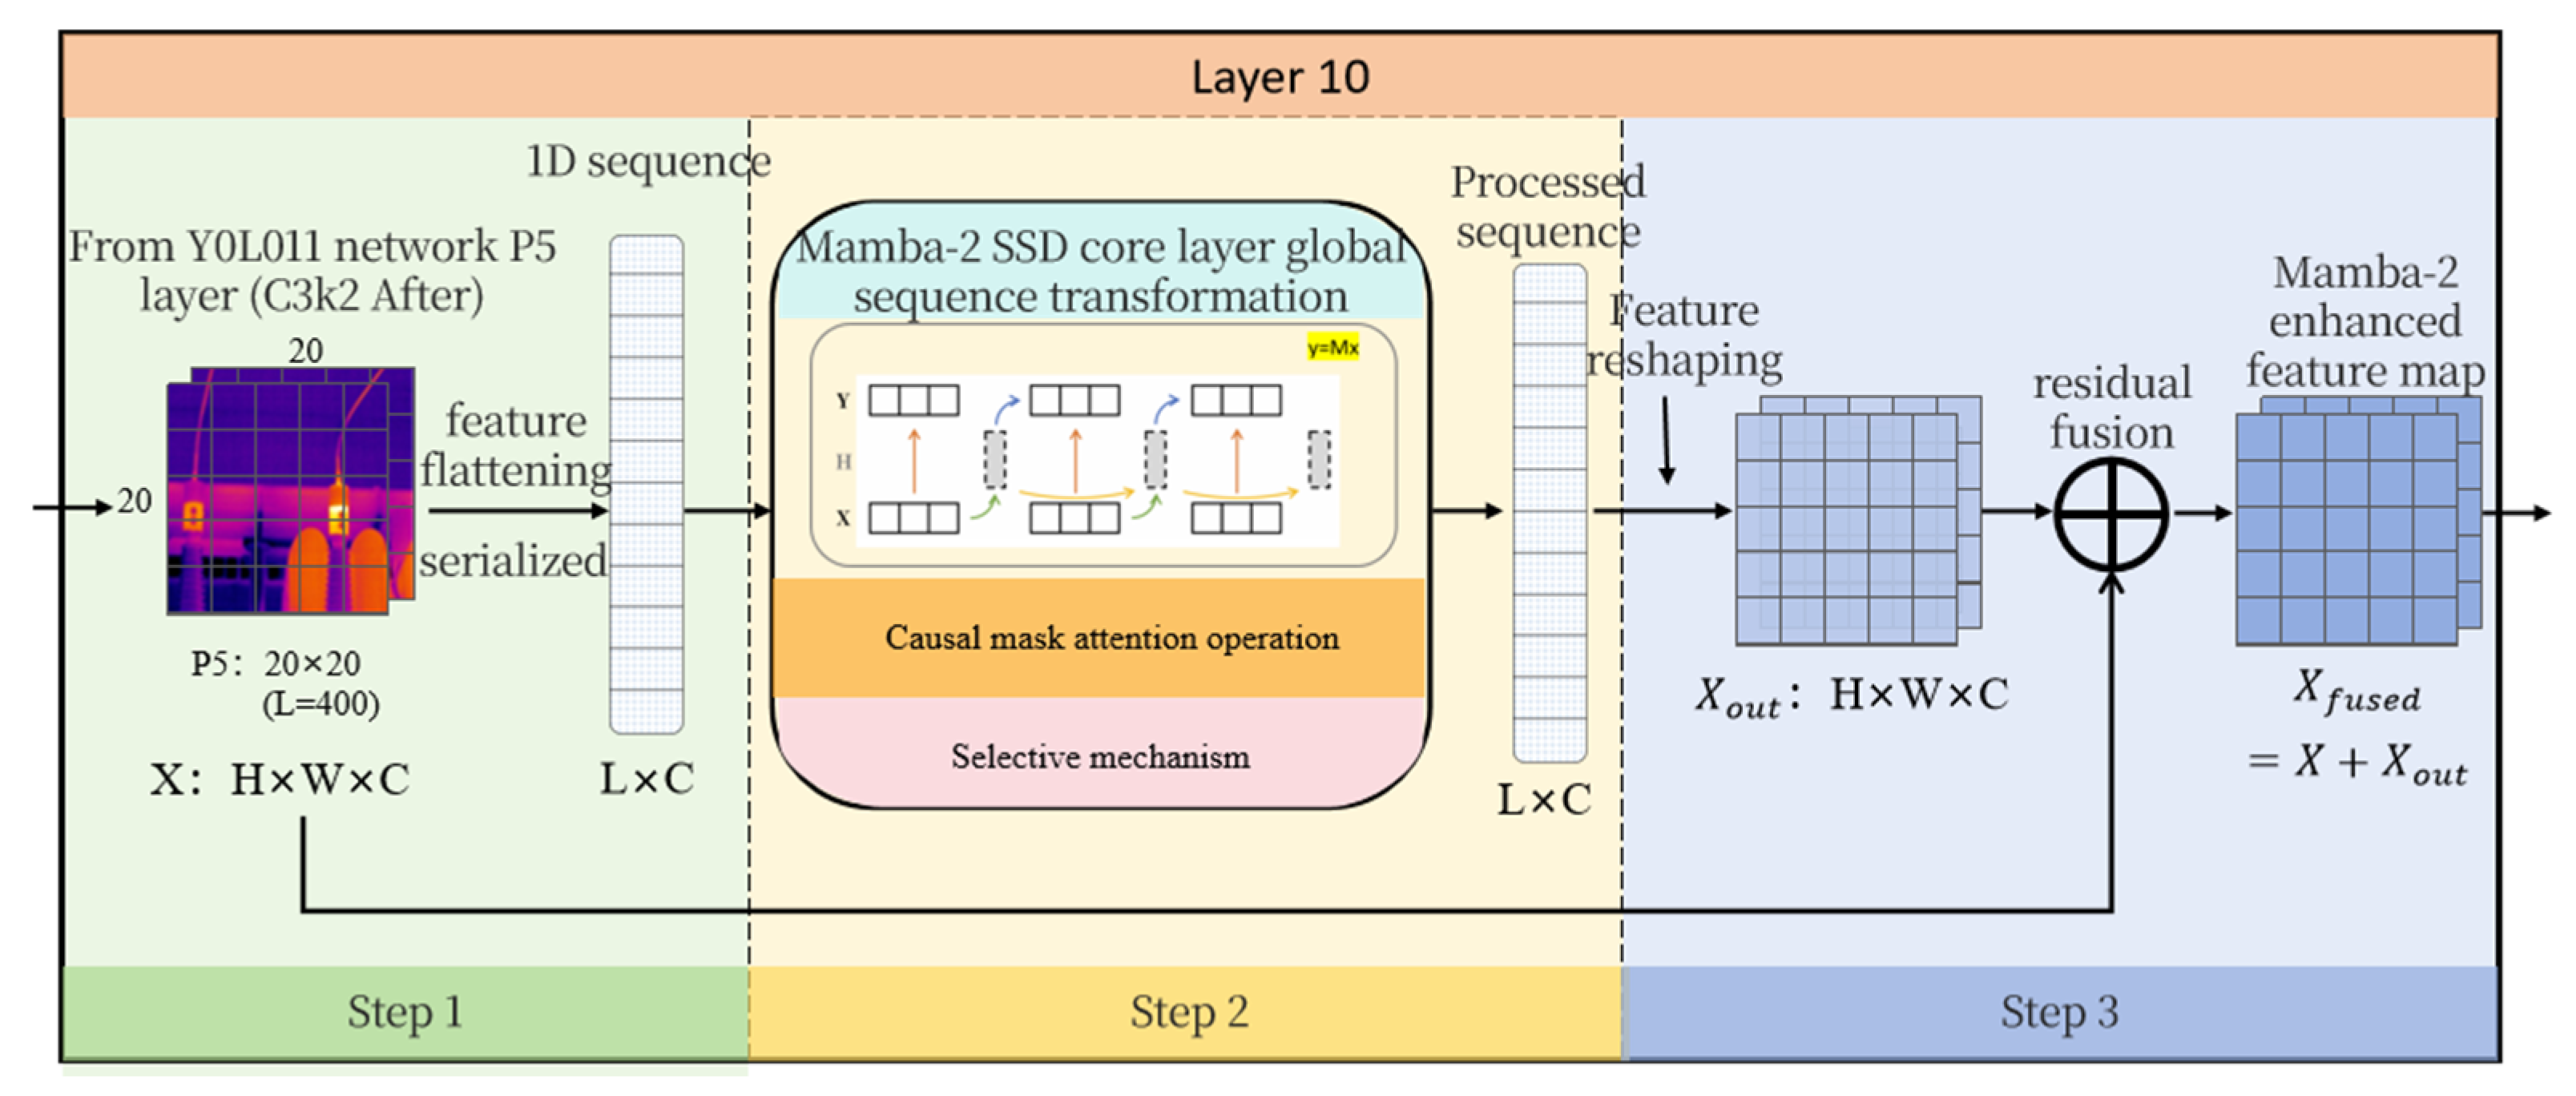
Specifically, the Mamba-2 module is inserted at Stage 4 of the YOLO11n backbone (feature map resolution 20 × 20, sequence length L = 400, channel dimension C = 512), replacing the C2PSA module at YAML layer 10. This placement is motivated by two considerations: On one hand, high-level features already contain rich local semantic information, so the global SSM scan supplements rather than replaces local texture extraction. On the other hand, the relatively small sequence length at Stage 4 (L = 400 vs. L = 6400 at Stage 1) limits computational overhead. As shown in Figure 8, The integration follows three steps: (i) flatten the 2D feature map X R H × C × W into a 1D sequence X seq R L × C ; (ii) apply the Mamba-2 SSD layer for global sequence transformation; (iii) reshape the output to the original 2D dimensions and fuse via residual addition.

4.1.3. Triplet Attention for Small Target Feature Enhancement

In practical substation inspection, infrared targets captured from long distances are often characterized by low pixel ratios and inherently weak feature representation, requiring tactical optimizations to maintain detection sensitivity [27]. This problem is further compounded during the feature fusion stage; specifically, within the neck layers of the baseline YOLO11n, the execution of multiple downsampling operations often leads to the unintended loss of critical spatial details, which are difficult to recover even with multi-scale enhancement [28]. Such degradation makes it challenging for the network to identify small-scale components in complex backgrounds.
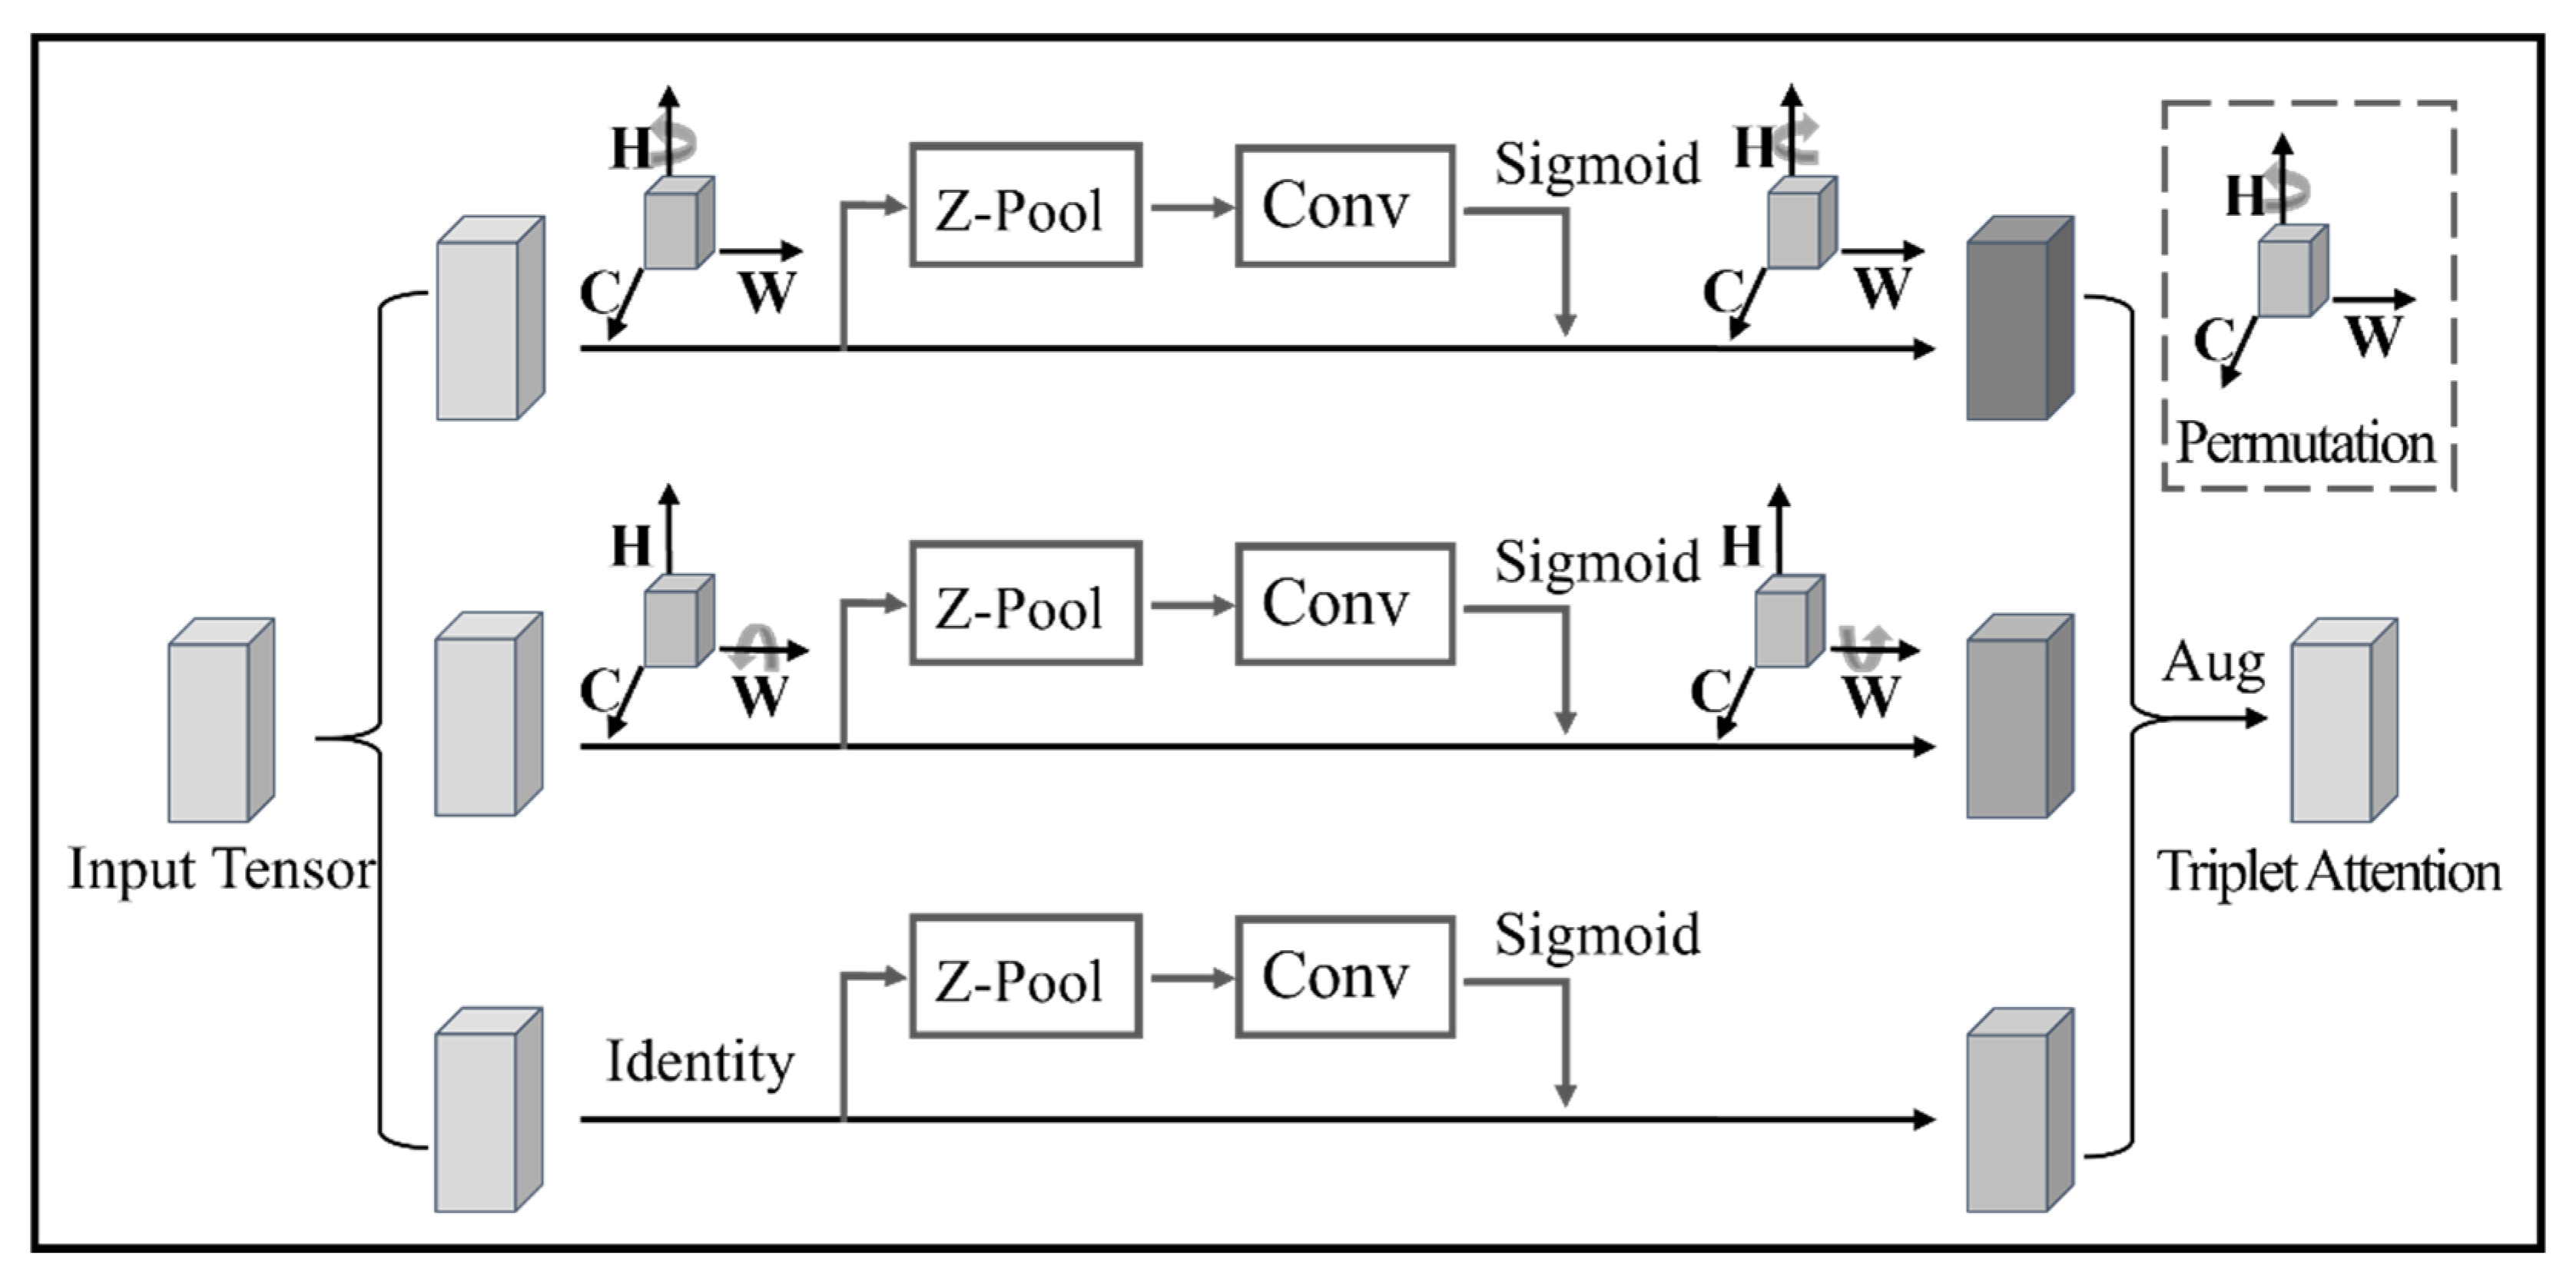
This study introduces the Triplet Attention mechanism in the neck feature fusion layer. Different from the SE module that only focuses on channel information or the Spatial Attention that only focuses on spatial information, the Triplet Attention establishes cross-dimension interaction dependencies through three branches without dimensionality reduction operations, thus avoiding the loss of feature information.
As shown in Figure 9, the Triplet Attention includes three parallel branches. (1) Cross-dimension interaction (C-H, C-W): two branches rotate the input tensor X along the height axis (H) and width axis (W), respectively, and then capture the correlation between channel and spatial dimensions through Z-Pool pooling and convolution layers to generate attention weights. (2) Spatial interaction (H-W): the third branch directly extracts features in the spatial dimension and maintains the (H, W) structure of the input.
For the input tensor X ∈ RC × H × W, the final output Y is the aggregation of enhanced features from the three branches:
Y = 1 3 X ^ c w + X ^ c h + X ^ h w
where X ^ c w , X ^ c h , and X ^ h w represent the weighted features of each branch after Sigmoid activation and inverse rotation transformation. This mechanism enables MTrip–YOLO to focus more accurately on the key edges and fault hot spots of bushings, significantly improving the Recall index of small targets.

4.1.4. Lightweight Detection Head and Loss Function

To further realize lightweight, the model removes the P5 detection layer for large targets and only retains the P3 (small target) and P4 (medium target) detection heads. The pruning strategy adopted is structured pruning at the architectural level: the entire P5 detection branch is removed as a complete structural unit, including its associated upsampling path and feature concatenation operations in the PANet neck. This differs from weight-level unstructured pruning (which applies sparsity masks to individual parameters) in that no sparsity ratio or per-layer criterion is required—the removal is a discrete binary decision based on the task-level analysis of target scale distribution. No post-pruning fine-tuning is required, as the remaining P3/P4 branches are trained end-to-end from the pretrained YOLO11n weights without any reinitialization. This improvement reduces the parameter count by 27.8% (2.63 M → 1.90 M). For reference, on batch = 16 throughput mode on the RTX 4070 SUPER, the model processes approximately 419 images/second; all FPS values reported in ablation experiment and comparison experiment use single-image inference (batch = 1, FP32, 640 × 640 input, including preprocessing and NMS) on the same platform to reflect single-frame latency relevant to sequential inspection scenarios.
In terms of the bounding box regression loss, WI-ShapeIoU (Weighted Instance-aware ShapeIoU) is adopted to replace CIoU. WI-ShapeIoU introduces two improvements over standard IoU-based losses. First, an instance-aware dynamic weighting mechanism assigns each prediction a loss weight w i   =   IoU i γ (γ = 0.5 in this work), which focuses gradient updates on samples with intermediate IoU quality—those that are nearly but not yet accurately localized—rather than distributing gradients uniformly across all samples. Second, a shape consistency penalty term is introduced:
Ω shape = ( w w gt ) 2 ( w + w gt ) 2 + ( h h gt ) 2 ( h + h gt ) 2
where w ,   h are the predicted box dimensions and w gt ,   h gt are the ground-truth dimensions. This normalized penalty is scale-invariant and directly constrains aspect-ratio drift—a particular concern in infrared imaging where thermal diffusion blurs target boundaries and causes systematic bounding-box shape distortion. Compared with CIoU, which applies uniform sample weighting and a coupled aspect-ratio term, WI-ShapeIoU better handles the elongated geometry of bushing targets and the edge ambiguity inherent to infrared thermal images.

4.2. Model Training and Implementation

Since the data have been processed by offline augmentation, the online Mosaic, Mixup, and HSV strong augmentation strategies of YOLO are turned off, and only geometric transformation is retained. All experiments are completed on the NVIDIA GeForce RTX 4070 GPU based on the PyTorch 2.0 framework, and the input image size is adjusted to 640 × 640. The detailed hyperparameter settings are shown in Table 3.

4.3. Performance Evaluation Metrics

To quantitatively evaluate the detection performance of the model, this study calculates Precision, Recall, and mAP (mean Average Precision) using the confusion matrix.
(1) Precision (P): Represents the proportion of actual positive samples among the samples predicted as positive, and the calculation formula is:
P = T P T P + F P
where TP is the number of true positive samples, and FP is the number of false positive samples.
(2) Recall (R): Represents the proportion of actual positive samples that are correctly predicted, which is mainly used to evaluate the missed detection situation:
R = T P T P + F N
where FN is the number of false negative samples.
(3) mAP50: The mean value of the Average Precision (AP) of all categories at the IoU threshold of 0.5, which is the core index to measure the comprehensive performance of the model:
A P = 0 1   P R d r
m A P = A P N
where N is the number of categories (N = 5 in this study). In addition, mAP50-95 is introduced to evaluate the localization accuracy at high thresholds (IoU from 0.5 to 0.95 with a step of 0.05).
(4) Params (Parameters): The core index to measure the spatial complexity of the model, representing the sum of all learnable weights and biases in the network. For resource-constrained substation edge computing terminals (e.g., UAV on-board computers or handheld thermal imagers), the parameter count of the model directly determines its memory footprint and storage requirements.
(5) FPS (Frames Per Second): The index to measure the temporal complexity and real-time inference capability of the model. It is defined as the number of image frames that the model can process per second, and its calculation formula is inversely proportional to the inference latency:
F P S = 1 T t o t a l = 1 T p r e + T i n f e r + T n m s
where T p r e ,     T i n f e r , and T n m s represent the time consumption of image preprocessing, network inference, and Non-Maximum Suppression (NMS) post-process.

5. Results and Analysis

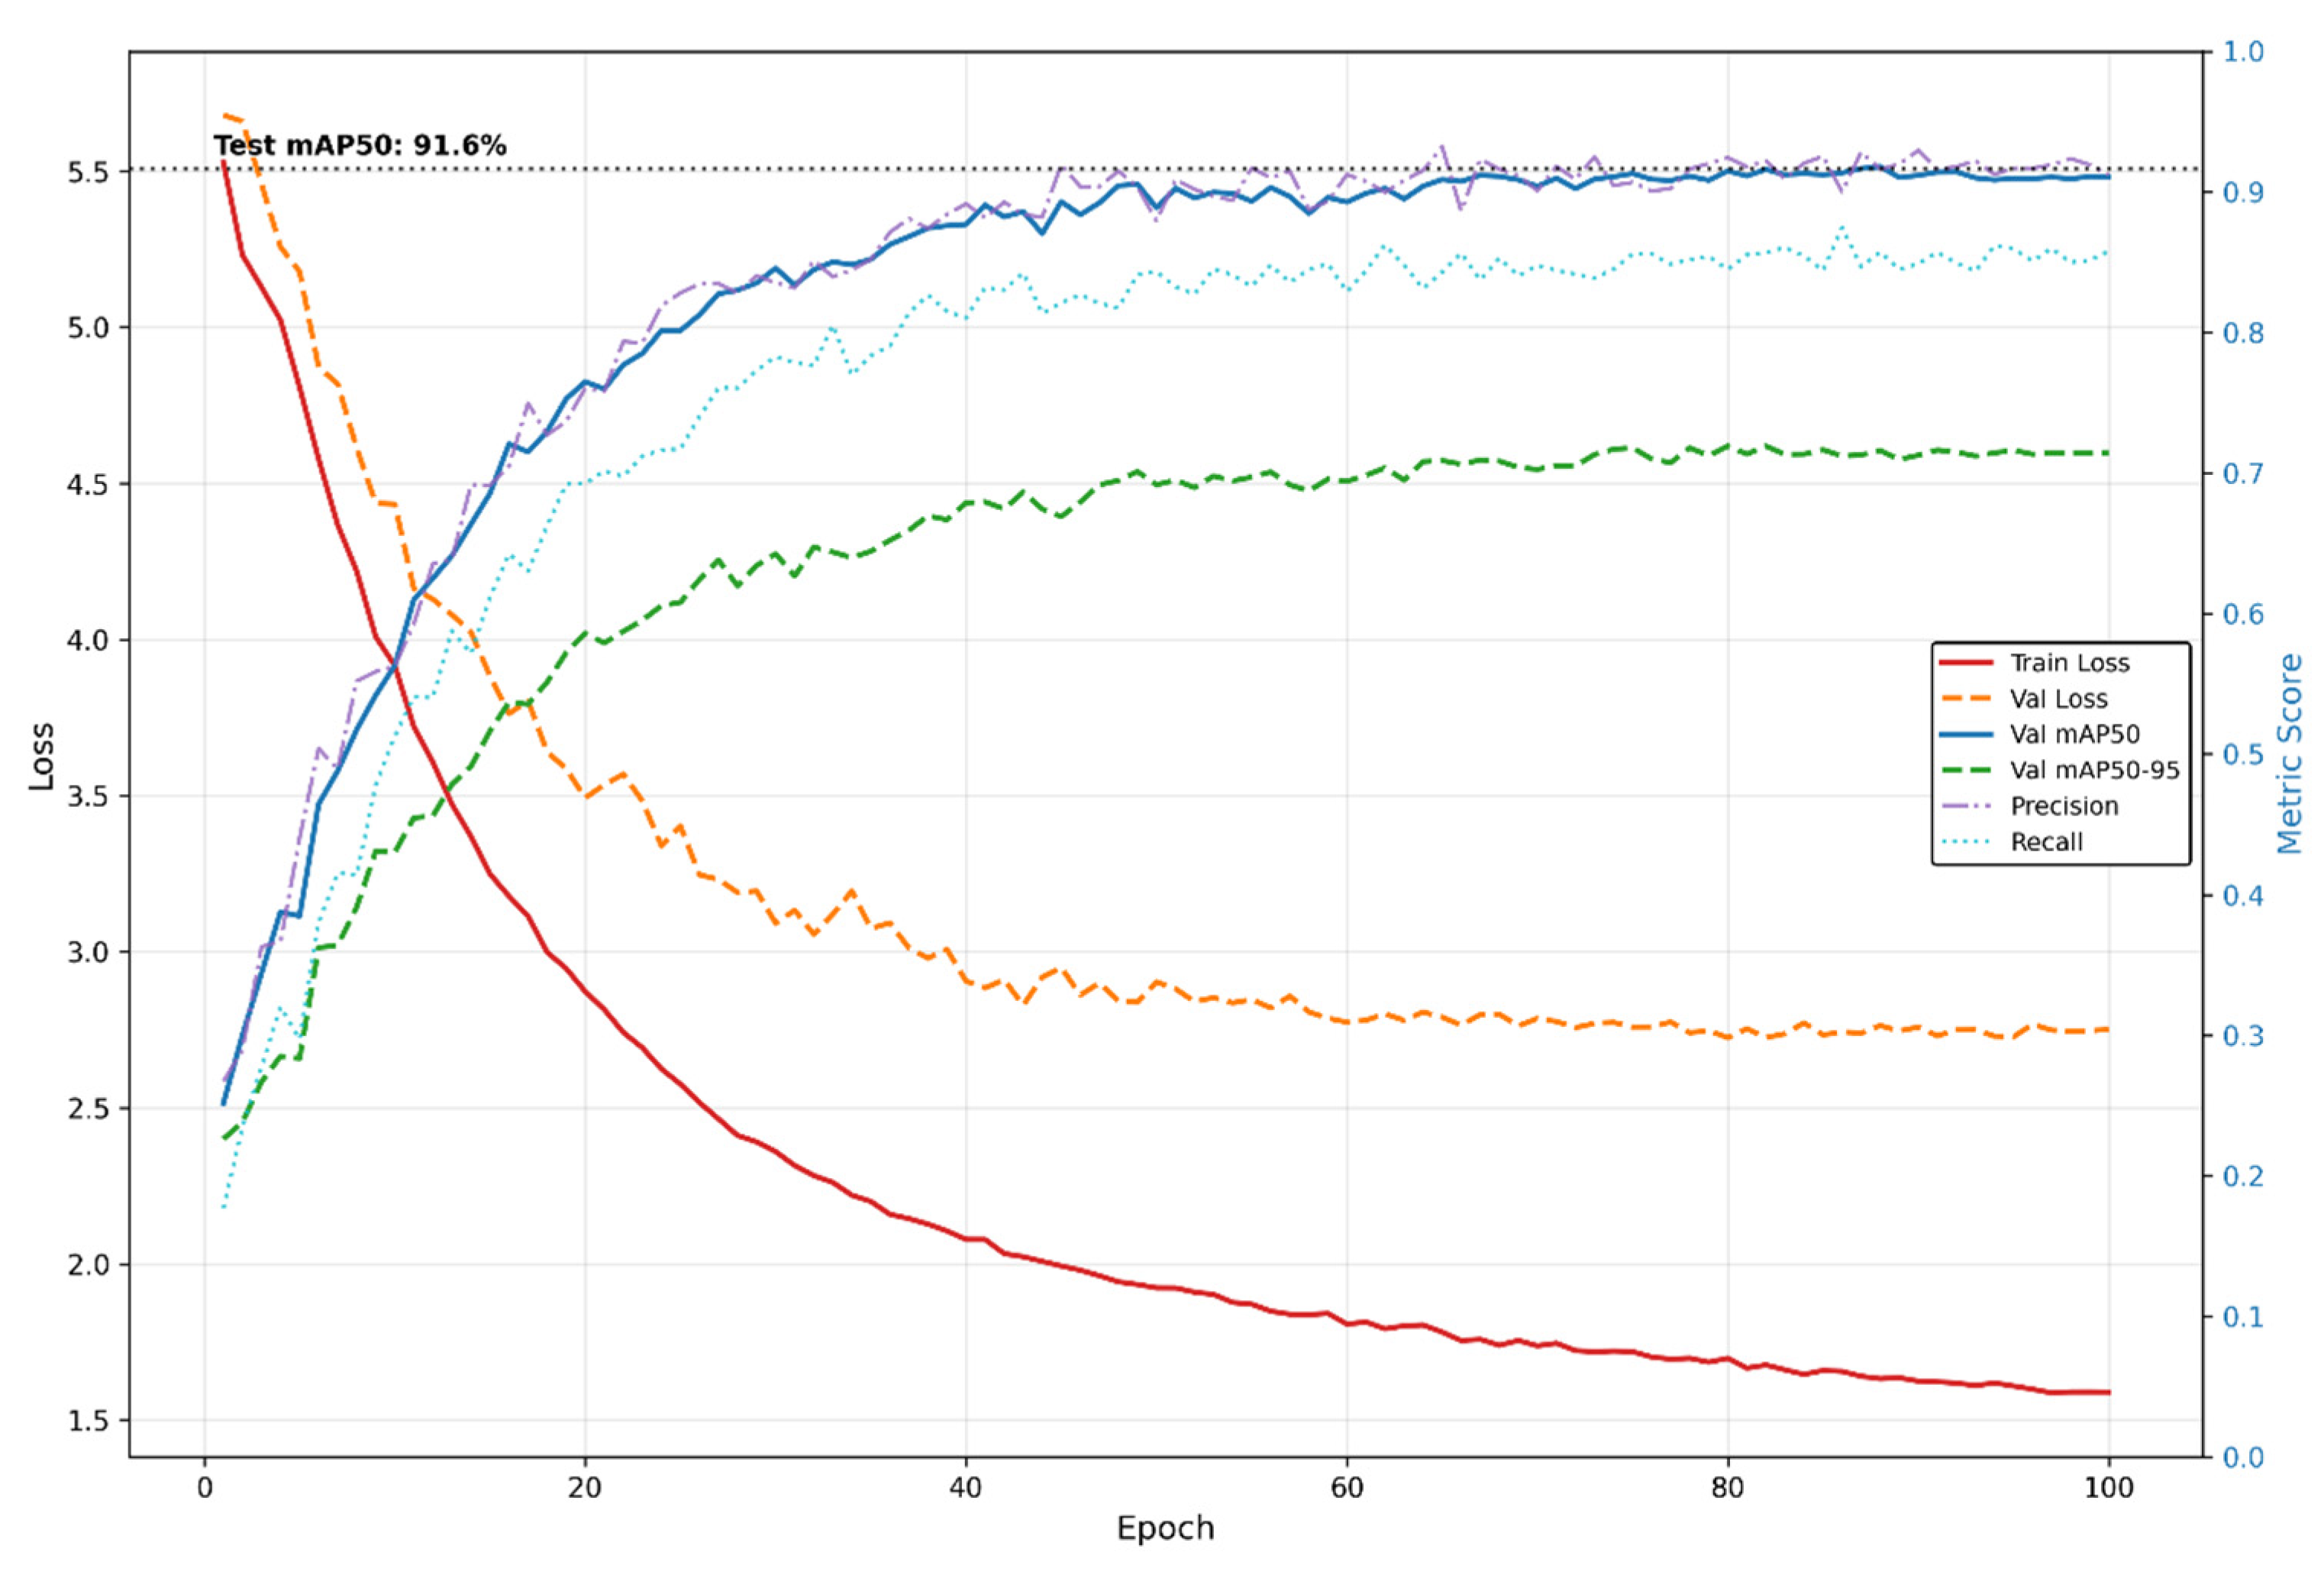
In this section, the performance of the MTrip–YOLO model in the infrared fault detection task of high-voltage bushings is comprehensively evaluated through detailed quantitative data and qualitative visualization analysis. First, through ablation studies, the contributions of Mamba-2 and Triplet Attention are quantified from a statistical perspective, and the internal decision mechanism of the model is deeply analyzed by using Effective Receptive Field (ERF) and Error Analysis (EA); second, through comparative experiments with mainstream models, combined with Grad-CAM heatmaps, the potential advantages of the model in edge computing scenarios are verified. The training and testing results of MTrip–YOLO are provided in Appendix Figure A1 (Convergence plot of performance results for the MTrip–YOLO model) and Table A1 (Class-by-class performance indicators corresponding to the best F1 point of the MTrip–YOLO model).

5.1. Ablation Study: Balancing Accuracy and Efficiency

To explore the specific impact of each improved module on the model performance and find a practically favorable balance between detection accuracy and lightweight efficiency, a series of ablation experiments are designed with the unpruned YOLO11n (baseline) as the benchmark. To assess statistical reliability, all ablation variants were trained independently three times using different random seeds under identical hyperparameter settings; the reported mAP50 values represent mean ± standard deviation across the three runs. All FPS values are measured under single-image inference (batch = 1, FP32, 640 × 640, torch.compile disabled, cudnn benchmark enabled, preprocessing, and NMS included) on an NVIDIA RTX 4070 SUPER GPU using the YOLO built-in benchmarking procedure. The experimental results are shown in Table 4.
The results presented in Table 4 demonstrate a practically favorable trade-off for the target edge-deployment scenario. While the combination of Mamba-2 and Triplet Attention without pruning achieves the highest mAP50 of 92.2%, the final pruned MTrip–YOLO model reduces the parameter count from 2.63 M to 1.90 M (−27.8%) and improves FPS from 125 to 133, at a cost of only 0.6% mAP50.

5.1.1. Contribution of Individual Modules

  • Global modeling capability of Mamba-2: After introducing Mamba-2, the mAP50 of the model is increased to 91.6%. Benefiting from the linear long-range modeling mechanism of SSD (Structured State Space Duality), the model shows stronger robustness when dealing with similar long tubular background interference in infrared images.
  • Feature enhancement of Triplet Attention: After introducing Triplet Attention alone, the mAP50 is increased to 91.7%. This proves that the cross-dimension interaction mechanism can effectively retain the spatial details of small targets and significantly improve the extraction capability of weak fault features.

5.1.2. The Trade-Off Strategy

When the two modules are integrated at the same time without pruning, Mamba-2_Trip_Clean achieves the highest detection accuracy (92.2%) in all experiments, but its FPS drops to 125 and the Params increase by 0.05 M. Considering the computing power limitation of edge devices, the final MTrip–YOLO adopts a pruning strategy: although the accuracy slightly drops back to 91.6% (still better than the baseline of 90.8%), the parameter count is greatly reduced to 1.90 M (a reduction of about 27.8%), and the FPS rises back to 133. This indicates that MTrip–YOLO successfully achieves a significant lightweight advantage at the cost of a small accuracy loss.

5.1.3. Visual Analysis of Ablation Modules

To further explain the internal reasons for the performance improvement in the ablation experiments, Effective Receptive Field (ERF) and Error Analysis (EA) are introduced for visualization verification.
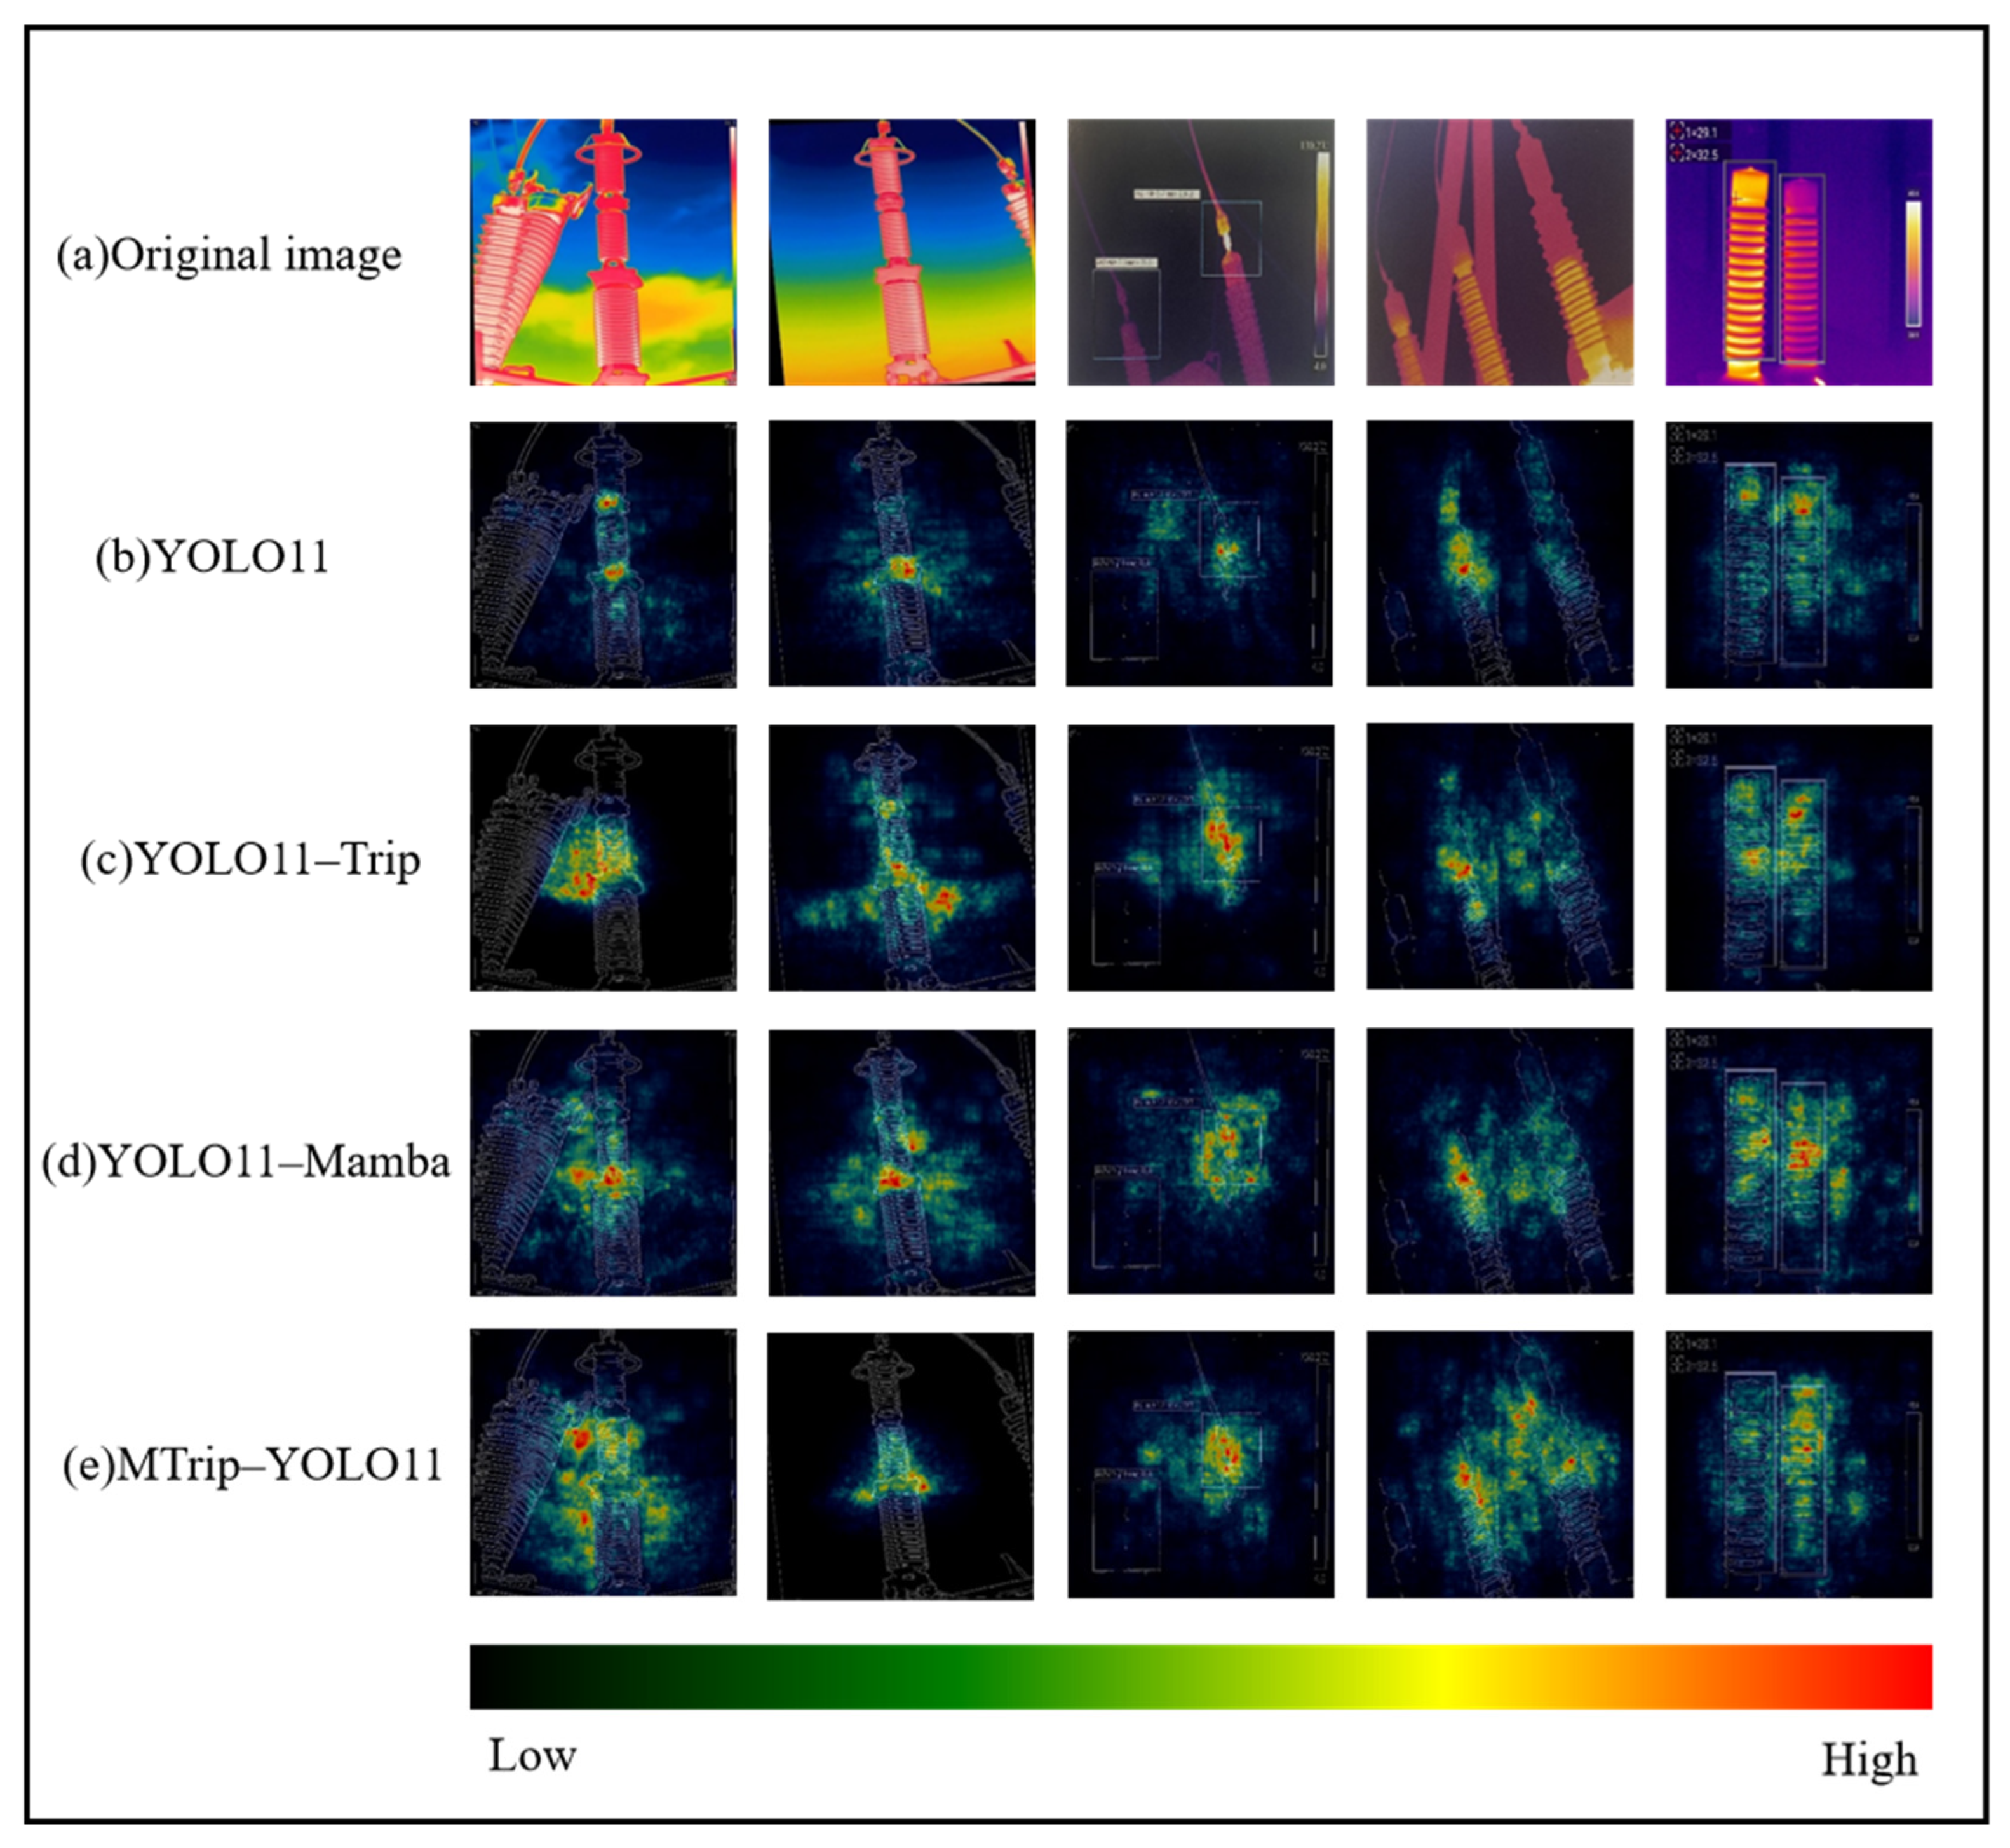
The ERF visualization in Figure 10 reveals a qualitative shift in spatial perception across model variants. In the baseline, the ERF distribution is concentrated in a localized Gaussian cluster around the target center, covering only the mid-section of the bushing and failing to capture its full longitudinal extent. After Mamba-2 integration, the ERF evolves into a strip-shaped distribution extending from the top connector to the bottom root of the bushing, consistent with the global sequence scanning mechanism described in Section 4.1.2. In Column 4 (complex multi-bushing scene with background tubular structures), the Mamba-2 variant shows notably reduced ERF response on background structures compared with the baseline, consistent with the false-positive suppression function of global context modeling. Triplet Attention broadens ERF coverage within the target region without achieving the same longitudinal extension. MTrip–YOLO combines both effects, showing simultaneous full-length coverage and concentrated activation at fault-relevant regions. These observations are presented as the qualitative mechanistic corroboration of the quantitative improvements in Table 4.
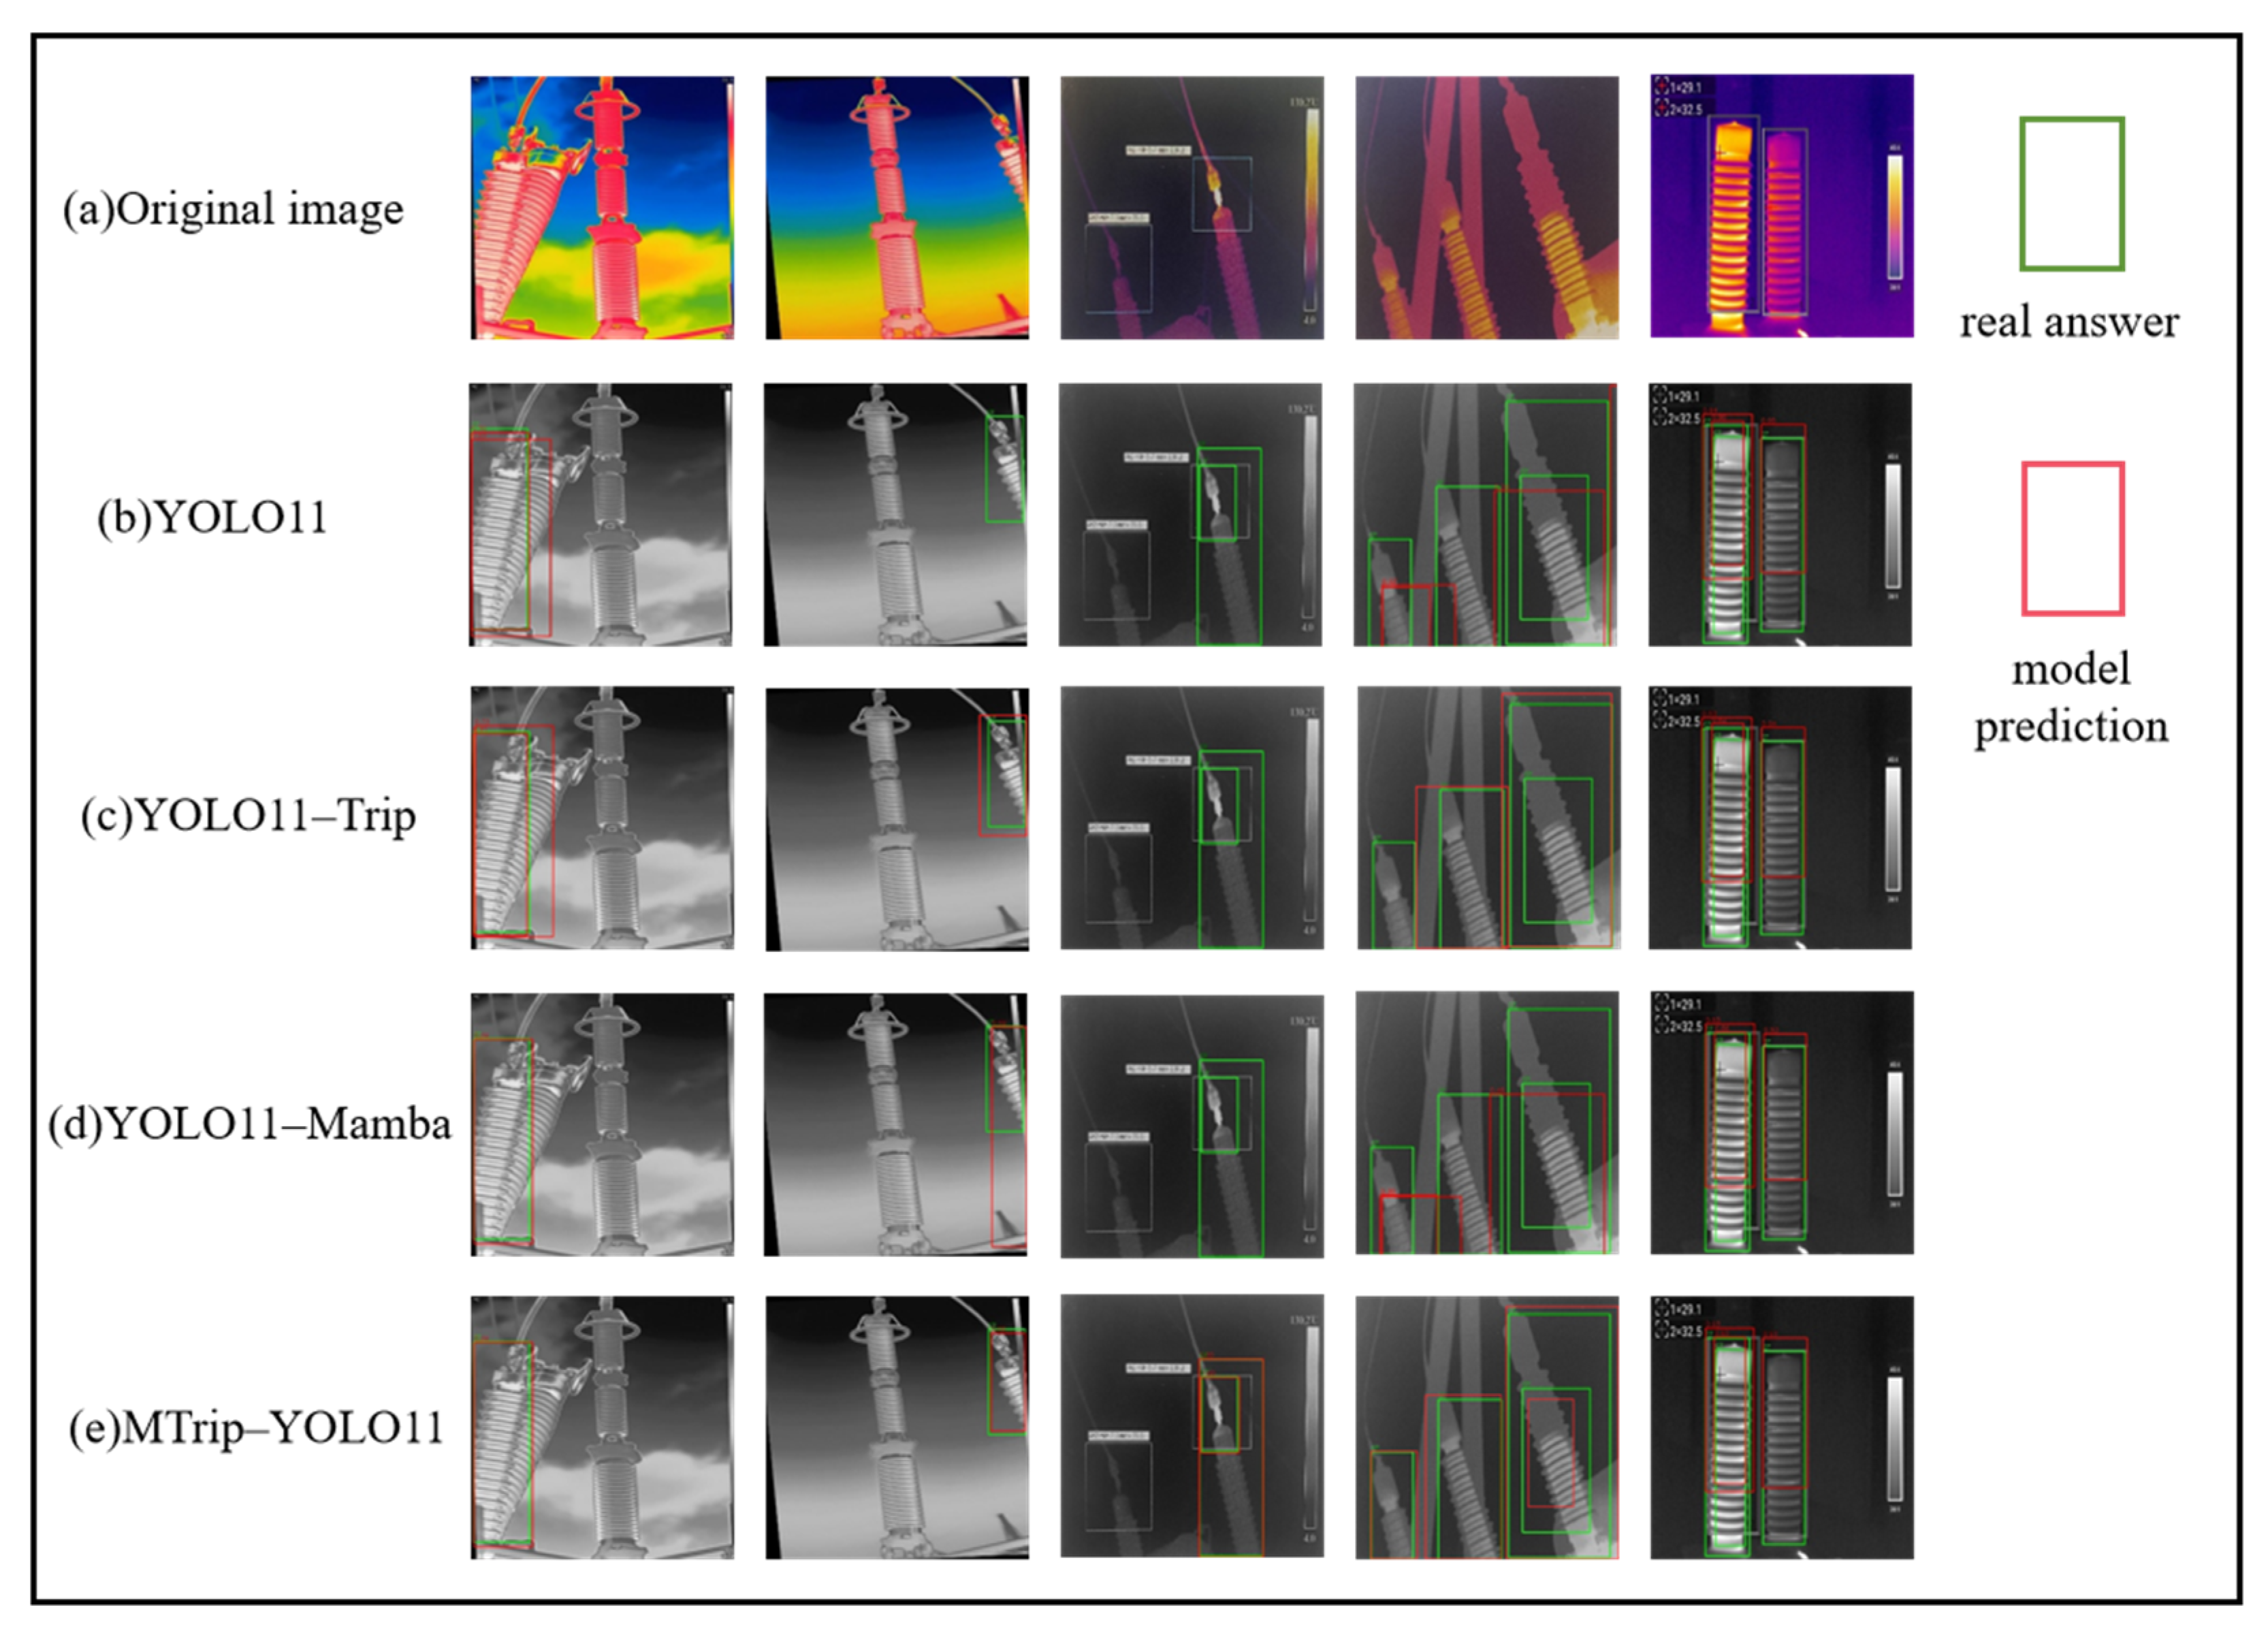
The EA comparison in Figure 11 identifies three representative failure modes and their resolution across model variants. First, in Column 1 (complex background with parallel tubular structures), the baseline generates false-detection boxes on background bus bars; after Mamba-2 integration, these false alarms are eliminated through global context discrimination. Second, in Column 2 (occluded small-scale bushing), the baseline produces a missed detection, while the Triplet Attention variant and MTrip–YOLO correctly localize the target with improved boundary alignment attributable to cross-dimensional feature reweighting. Third, in Columns 3–5 (fault scenarios), MTrip–YOLO shows more accurate bounding-box coverage of fault regions with reduced positional offset compared with the baseline. These failure-mode observations are consistent with the Precision and Recall improvements quantified in Table 4.

5.2. Comparative Study: Benchmarking Against SOTA

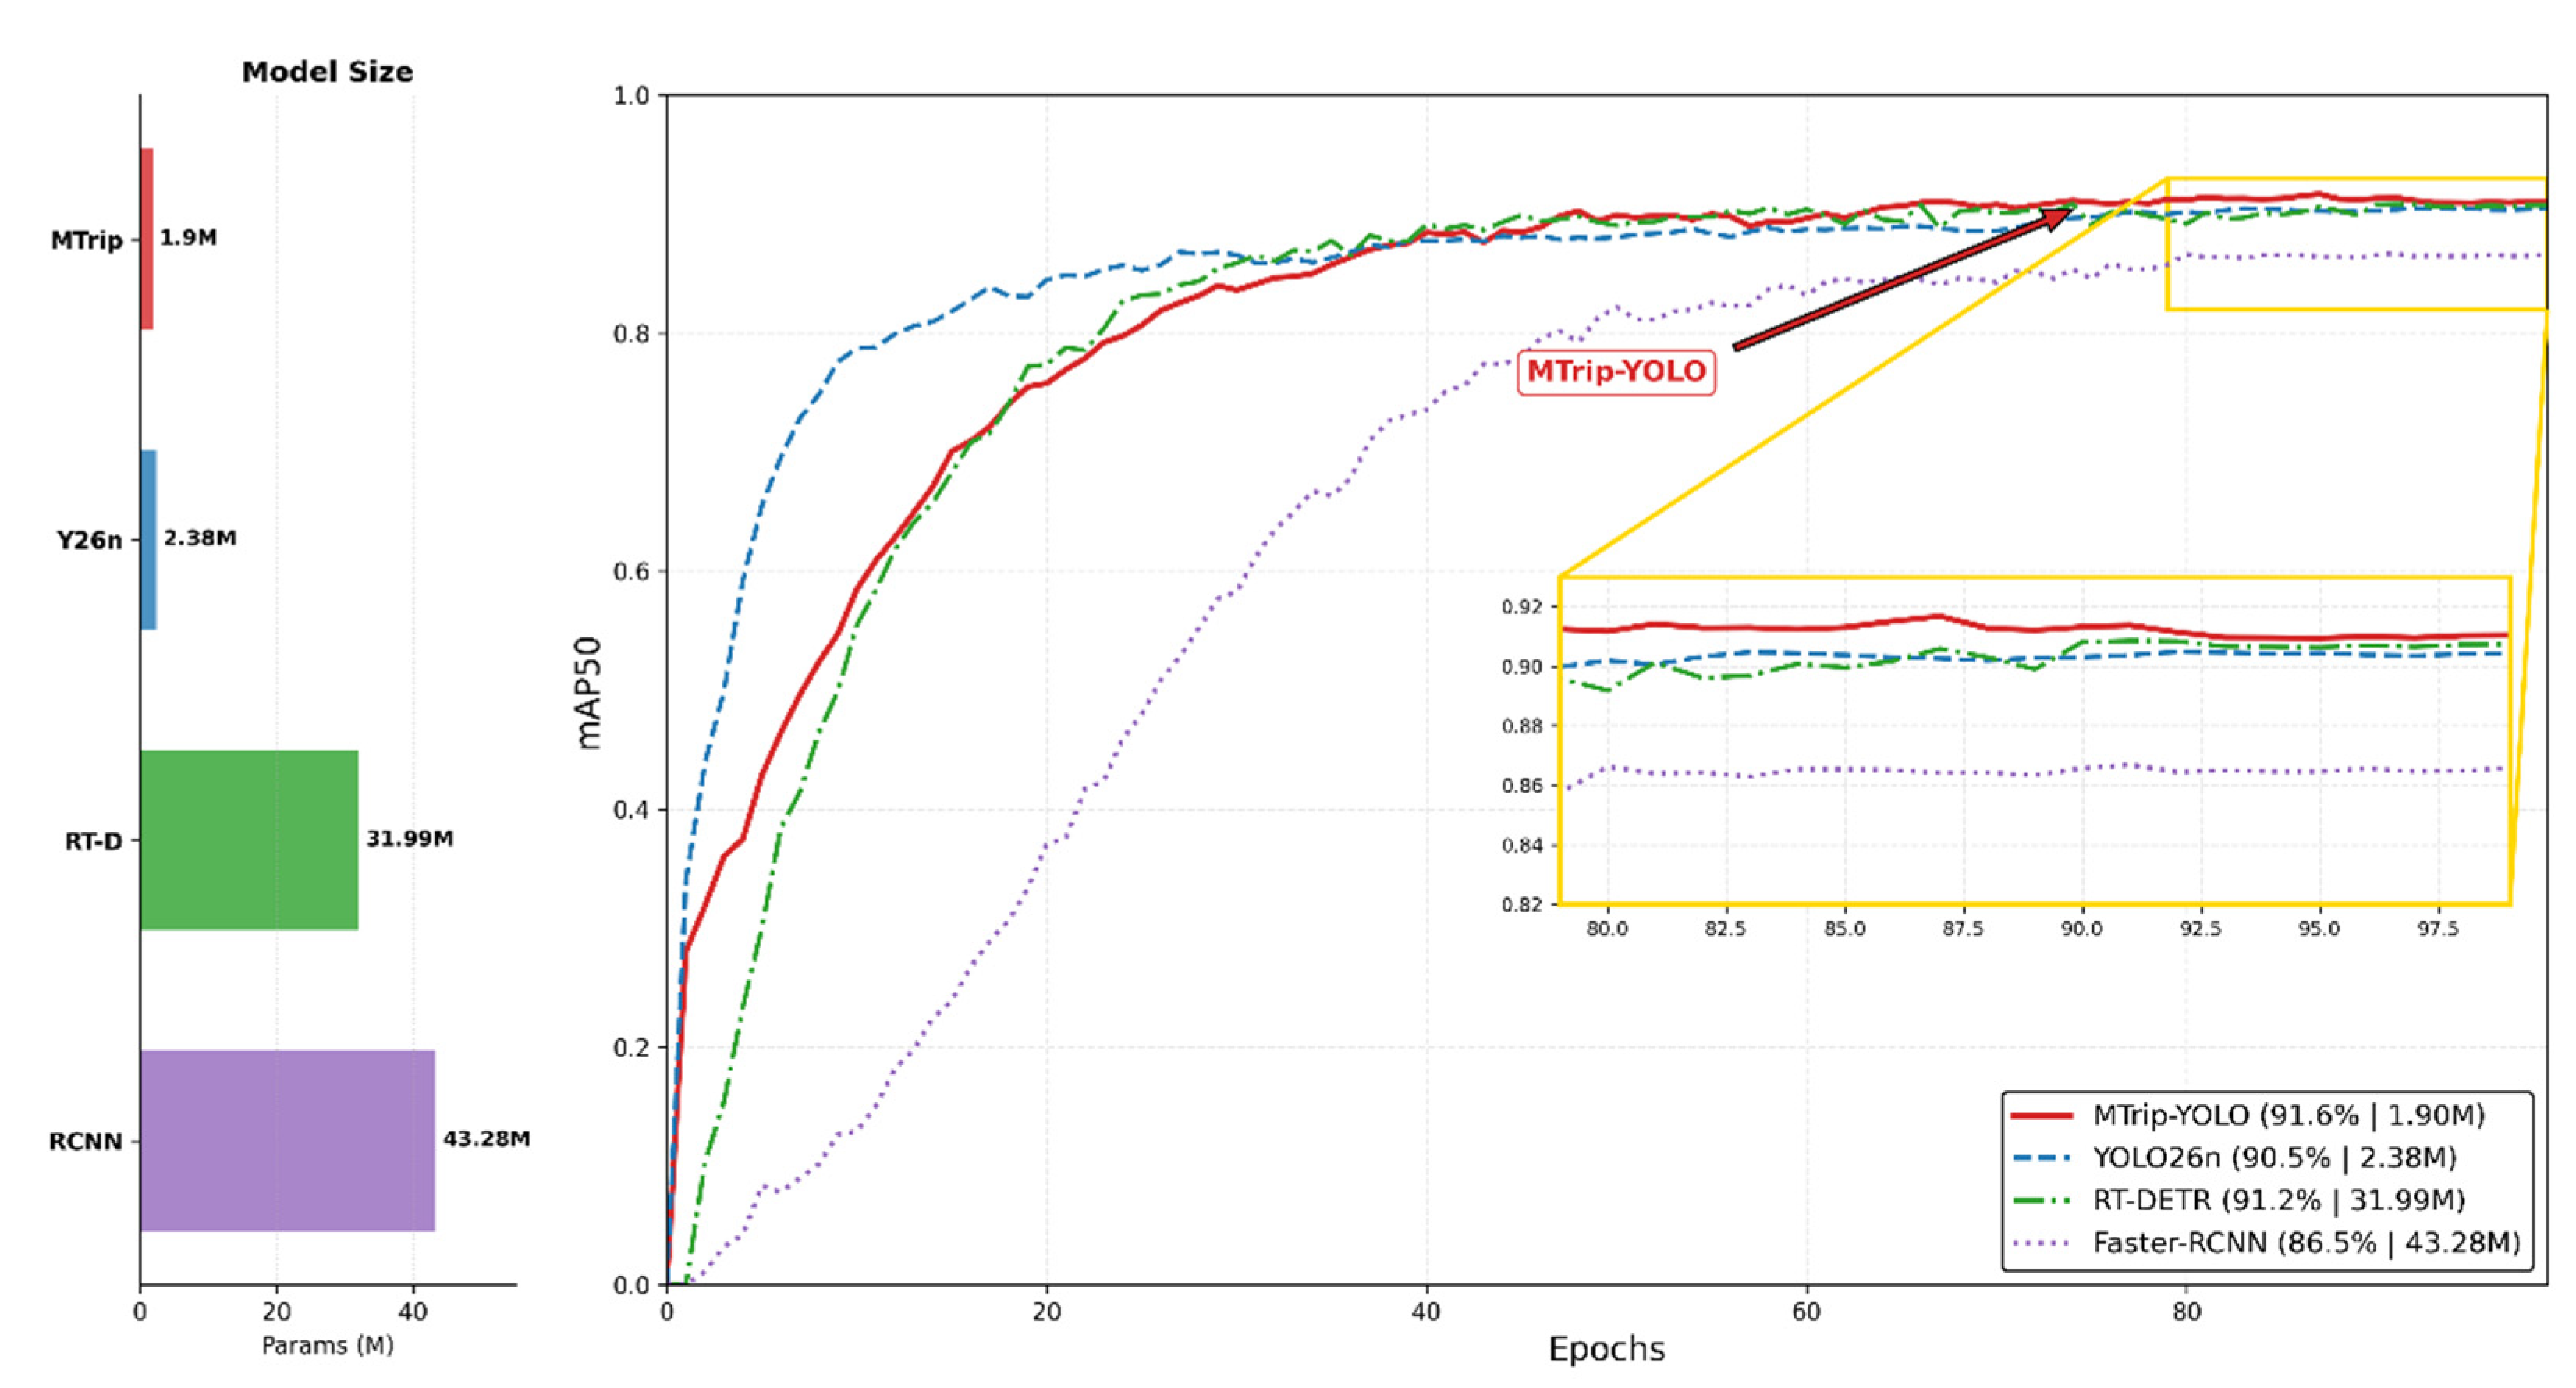
To evaluate the comprehensive competitiveness of MTrip–YOLO, it is compared with current mainstream object detection models, including the two-stage algorithm Faster R-CNN, the transformer-based algorithm RT-DETR, and the lightweight algorithm YOLO26n. To ensure fair comparison, all models were trained and evaluated on identical dataset splits (Table 2, 2036/266/266) with the same input resolution (640 × 640) and training duration (100 epochs). Each model was initialized with its official COCO-pretrained weights and fine-tuned on our dataset with a consistent optimizer configuration with cosine annealing scheduling. The same offline augmentation pipeline described in Section 3.2 was applied uniformly across all models, with YOLO built-in online augmentation (Mosaic, MixUp, HSV) disabled for all variants to avoid interaction with the offline pipeline. No model-specific hyperparameter tuning beyond this consistent setup was applied. All comparison models were likewise evaluated over three independent runs; mAP50 and mAP50-95 values in Table 5 represent mean ± standard deviation to ensure statistical comparability across models. The comparison results are shown in Table 5, and the model convergence curve is shown in Figure 12.
As quantified in Table 5, MTrip–YOLO achieves competitive performance across all evaluated metrics compared with existing models in edge computing scenarios. Notably, compared to the transformer-based RT-DETR, it achieves a higher mAP50 (91.64% vs. 91.15%) while utilizing only about 6% of the parameters (1.90 M vs. 31.99 M). Furthermore, its inference speed of 133 FPS satisfies the real-time processing requirement (>30 FPS) of UAV-mounted inspection.

5.2.1. Performance Analysis

  • Vs. RT-DETR: MTrip–YOLO surpasses RT-DETR in mAP50 (91.60% vs. 91.15%), and its parameter count is only 6% of the latter (1.90 M vs. 31.99 M), showing a substantially lower parameter count (a 94% reduction). The marginally lower mAP50-95 (71.51% vs. 71.90%) is attributable to the removal of the P5 detection head, which reduces boundary regression precision for large-scale instances (>96 × 96 pixels). For the dominant small-to-medium scale targets, localization precision remains sufficient, and in the fault detection context, detection reliability takes operational precedence over sub-pixel boundary accuracy. The mAP50-95 deficit therefore represents a deliberate trade-off in favor of the lightweight edge-deployment objective of this work.
  • Vs. YOLO26n: Compared with YOLO26n, MTrip–YOLO improves the accuracy by 1.1% while maintaining a lower parameter count (1.90 M vs. 2.51 M), and the inference speed of 133 FPS fully meets the real-time inspection requirements of substation UAV patrol.
  • Vs. Faster R-CNN: MTrip–YOLO achieves a significant improvement in mAP50 (an increase of 5.15%) and has a much smaller parameter count and higher inference speed, which is potentially more suitable for edge deployment scenarios.

5.2.2. Visual Analysis via Grad-CAM

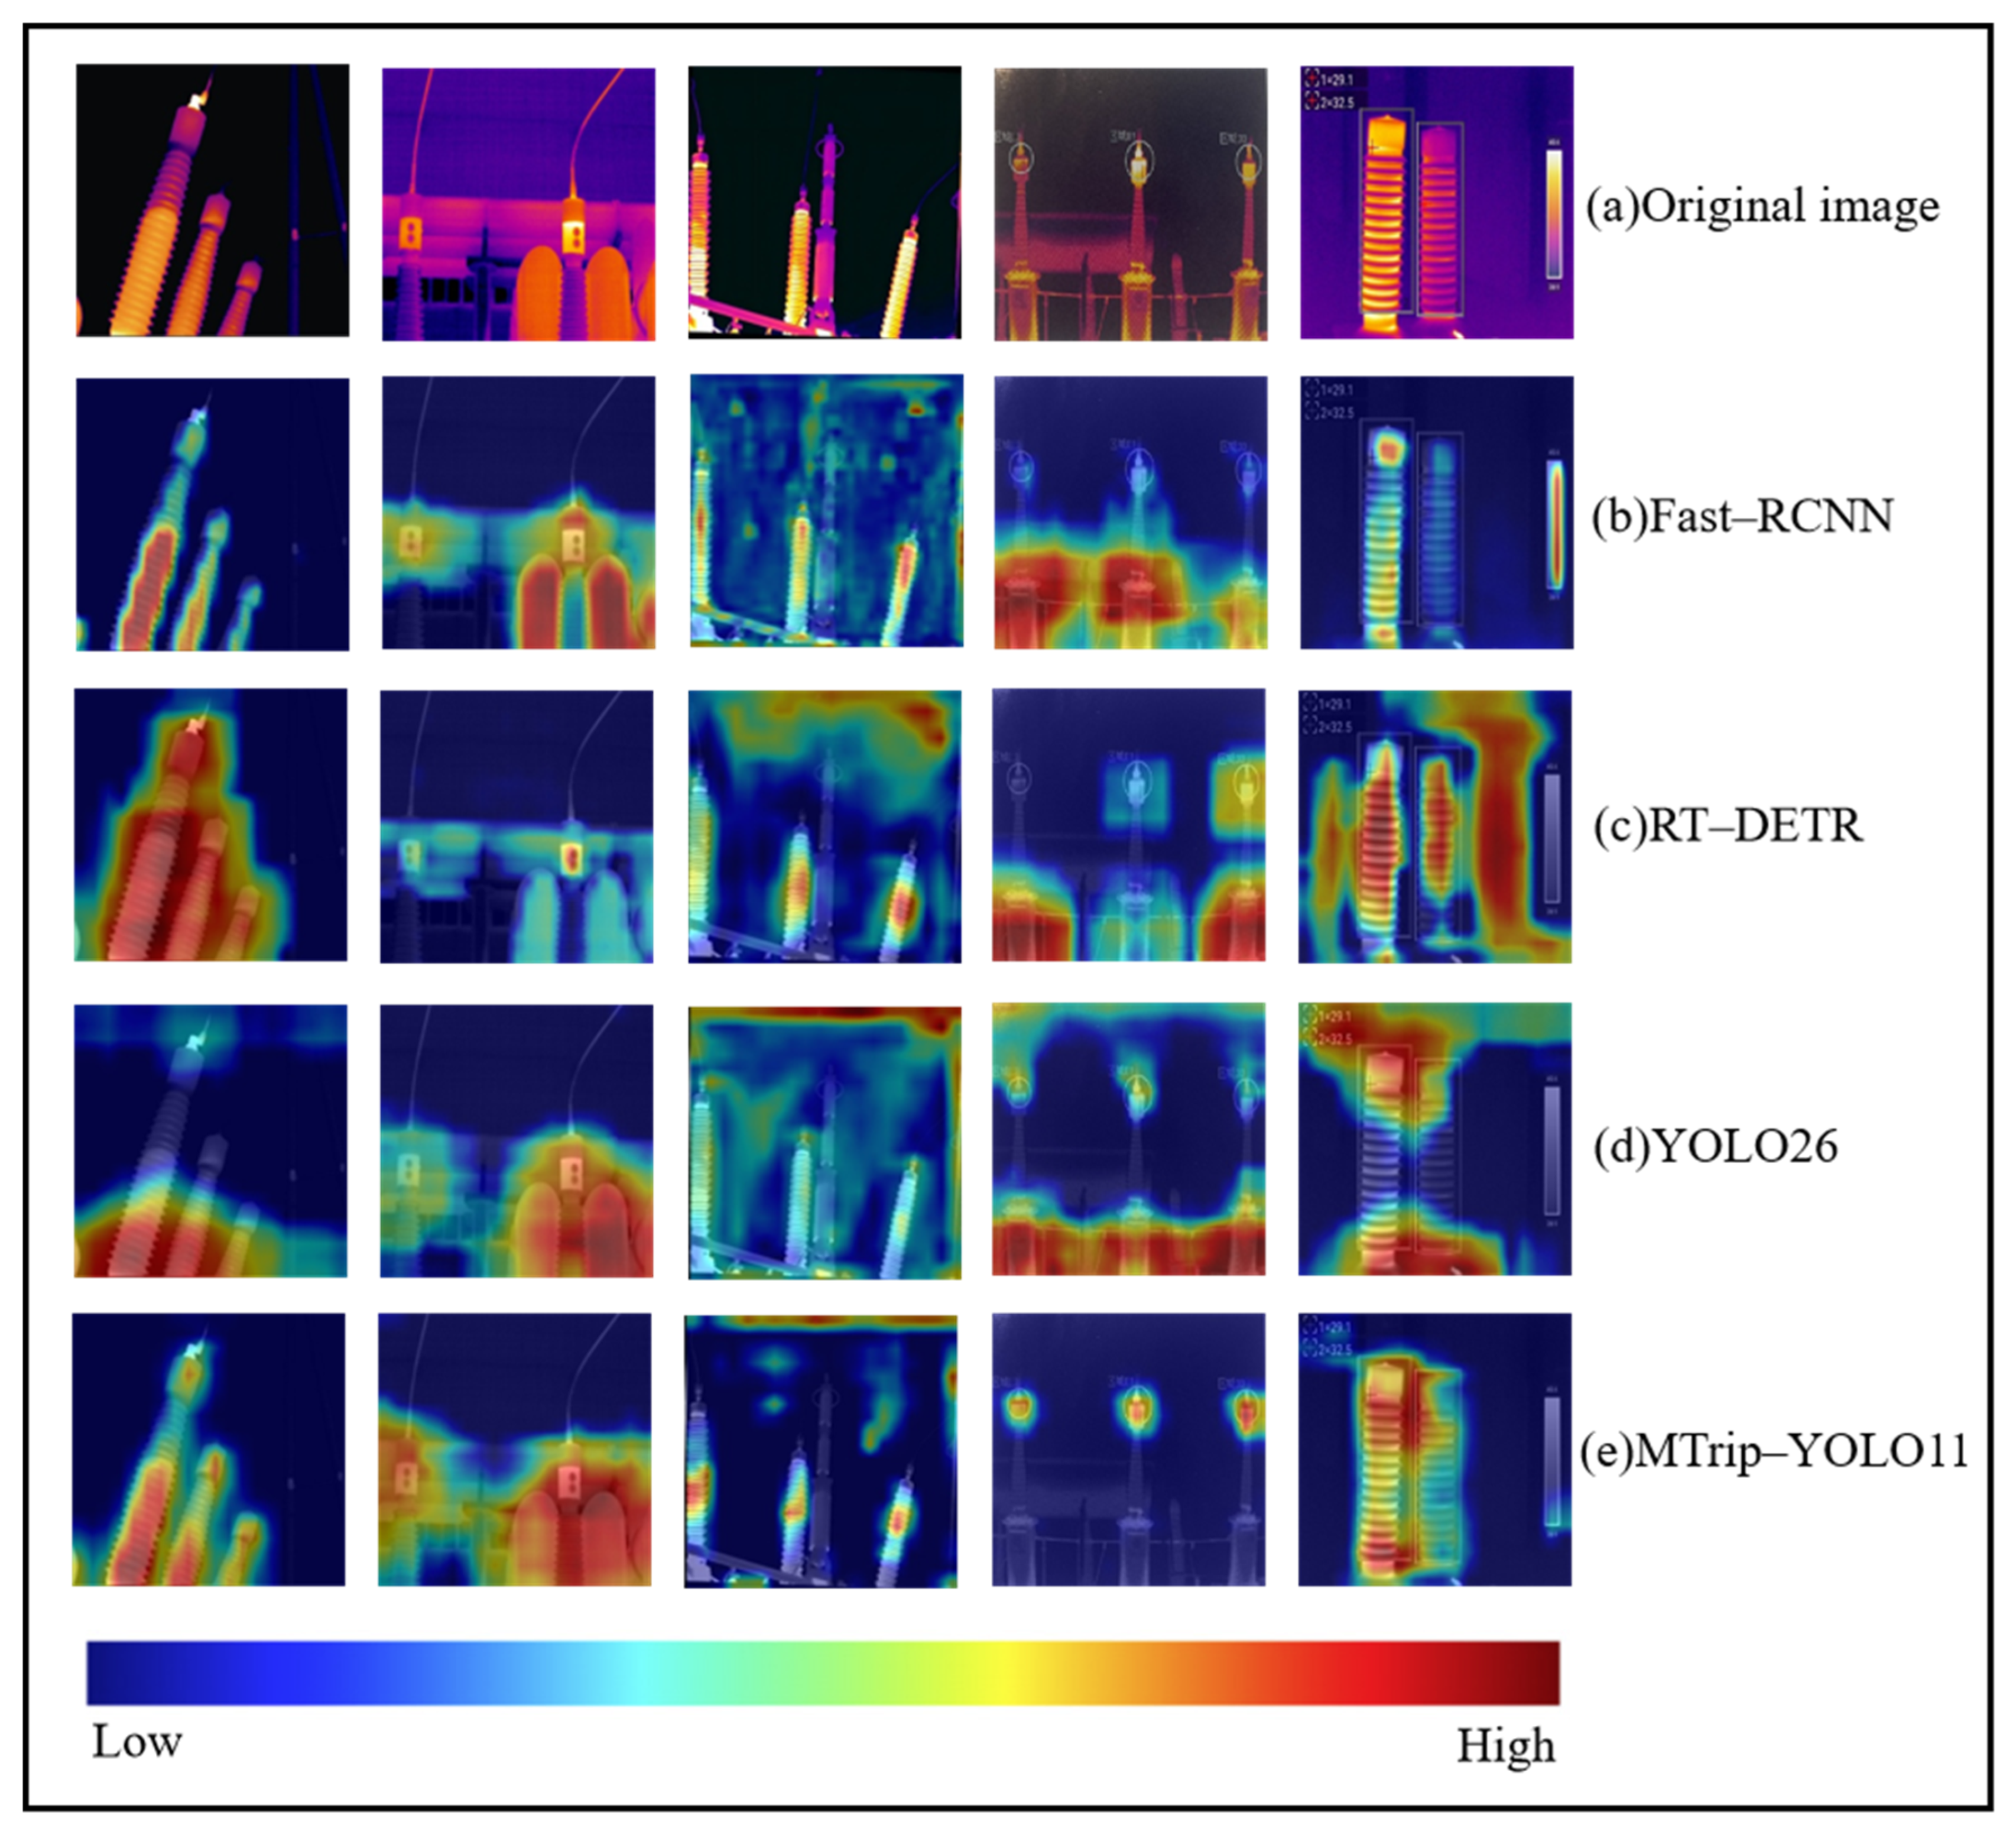
To qualitatively evaluate the differences in feature extraction among different models, the Grad-CAM (Gradient-weighted Class Activation Mapping) heatmaps of MTrip–YOLO and the comparison models are shown in Figure 13.
  • Focus Precision: The heatmaps of comparison models (e.g., YOLO26n) are often diffuse, and some activation areas overflow to the insulator strings or sky areas in the background. In contrast, the activation map of MTrip–YOLO is more concentrated on the bushing body, accurately covering the heating core areas of bushings (e.g., top joints or oil level lines).
  • Noise Suppression: In complex backgrounds, large models such as Fast-RCNN have relatively accurate localization but also show a certain activation response to metal structures in the background (False Response). Benefiting from the cross-dimensional suppression mechanism of Triplet Attention, the heatmap of MTrip–YOLO is almost cold in the background area, consistent with the false-positive suppression quantified in Table 5.
The Grad-CAM heatmaps in Figure 13 show that MTrip–YOLO’s activation is concentrated on the bushing body across all five test scenarios, with near-zero response in background regions—consistent with the false-positive suppression quantified in Table 5. The activation patterns also reflect fault-type-specific characteristics: for poor contact faults (Columns 2, 4), the highest activation is localized at the top connector area, corresponding to the physical location of contact resistance heating; for oil shortage and high dielectric loss faults (Columns 1, 3, 5), activation is distributed more diffusely along the bushing axis, reflecting the broader thermal signatures of these fault types. This correspondence between activation patterns and fault physical mechanisms indicates that the model’s decisions are grounded in thermally relevant features. These observations serve as qualitative mechanistic corroboration of the quantitative results in Table 4 and Table 5.

6. Discussion

The core contribution of this study is to effectively integrate the global long-range modeling idea of Mamba-2 with the Triplet Attention mechanism into the YOLO11n architecture, forming an optimized solution MTrip–YOLO for the infrared fault detection of high-voltage bushings.
The independent introduction of the Mamba-2 module mainly uses its SSD (Structured State Space Duality) theory to endow the model with global context perception capability with linear complexity, enabling it to understand the long-range geometric topology of objects in infrared images like processing sequences. This is crucial for dealing with complex backgrounds in substations (e.g., interference from a large number of morphologically similar equipment and structures). On the other hand, the Triplet Attention mechanism addresses the progressive attenuation of weak fault thermal signatures caused by repeated downsampling by establishing cross-dimensional (C-W, C-H, H-W) interactions without channel dimensionality reduction to preserve and re-weight small target spatial details during feature fusion. This design achieves a +0.9% mAP50 improvement at a zero parameter increase (Table 4), and the two modules together produce a synergistic gain of +1.4% mAP50—consistent with their functional complementarity: Mamba-2’s global context provides a more discriminative feature space within which Triplet Attention more precisely targets fault points.
Notably, the results of the ablation experiments (Table 4) clearly confirm that there is a synergistic effect of +1.4% mAP50 between these two modules: the macro global context information provided by Mamba-2 provides a more accurate attention guidance area for Triplet Attention, making it focus more on the bushing body rather than background noise; the micro feature enhancement of Triplet Attention makes up for the potential deficiency of Mamba-2 in local detail capture. The combination of this “Macro-modeling” and “Micro-enhancement” is the key reason why MTrip–YOLO can surpass the baseline model in both accuracy and recall.
To verify the robustness of the proposed method, a balanced sample dataset is constructed in this study. The experimental results show that MTrip–YOLO maintains consistent detection accuracy (mAP50 = 91.6%) and parameter lightweight (1.9 M) in the face of complex and variable shooting angles in the dataset. This robustness mainly comes from the generalized feature extraction capability of Mamba-2 and the sensitivity of Triplet Attention to weak features, which together overcome the interference problems of small targets and similar background objects in infrared images. This provides a solid technical foundation for extending this technology to the thermal fault detection of other types of electrical equipment (e.g., insulator strings, current transformers) [29].
To further refine feature expression, we followed the strategy of incorporating triplet dependencies within residual fusion [30], which has been shown to highlight target saliency more effectively than traditional attention mechanisms by capturing cross-dimensional interactions, but our MTrip–YOLO still has some limitations that warrant further discussion. First, since fault determination often needs to combine multi-source information such as the load current and environmental parameters of the equipment, a single modality as typically seen in existing collaborative computing [31] or lightweight frameworks [32] may limit the discriminant ability of the model under extreme meteorological conditions. Second, as exemplified by specialized architectures such as the TPH-MobileNetv3 proposed by Li et al. [33], existing frameworks focus primarily on the static detection of single-frame images, which presents a limitation in failing to fully exploit the dynamic features characterizing the evolution of thermal faults over time. In fact, many thermal faults (e.g., voltage-induced heating type) have a progressive development process [34], and ignoring time-dimensional information may miss the best time for early warning [35]. Third, the current model is trained and tested on a self-constructed dataset, and the generalization performance on a larger public dataset needs to be further verified.
Based on the above limitations, future research can focus on promising directions, including multi-modal data fusion within edge-based online monitoring systems [36], time-series modeling facilitated by hardware-efficient lightweight detection frameworks [37], and video stream analysis technology [38], which are expected to realize continuous monitoring and dynamic early warning of the fault temperature change trend, thus further improving the reliability and practicability of the intelligent operation and maintenance system.

7. Conclusions

Aiming at the problems of low small-target recognition accuracy and severe background interference in infrared detection of high-voltage bushings, this study proposes a lightweight detection model, MTrip–YOLO, based on the improved YOLO11n, with the main conclusions as follows:
  • Method effectiveness: The model integrates Mamba-2 global modeling and Triplet Attention feature enhancement mechanisms. Visual analysis (ERF and Grad-CAM) shows that this architecture can eliminate the interference of similar tubular objects from a global perspective and accurately locate tiny overheating areas, effectively reducing false and missed detections, and the two modules form a synergistic effect of +1.4% mAP50.
  • Performance advantages: In the multi-source heterogeneous high-voltage bushing dataset, MTrip–YOLO achieves an mAP50 of 91.6% and an mAP50-95 of 71.50%, outperforming mainstream models such as Faster R-CNN, RT-DETR, and YOLO26n. Meanwhile, the model has only 1.90 M parameters and an inference speed of up to 133 FPS, achieving a practically favorable balance between detection accuracy and computational efficiency.
  • Application value: While maintaining competitive detection accuracy, the model achieves substantial parameter reduction through structured pruning (1.90 M parameters, 6.0 GFLOPs), with an inference speed of 133 FPS measured on a desktop GPU platform. These characteristics suggest potential suitability for deployment in resource-constrained inspection platforms such as UAV-mounted computers and handheld thermal imagers, pending validation on embedded hardware. The proposed method provides a technical reference for the real-time state perception and early fault warning of high-voltage bushing equipment, contributing to the intelligent operation and maintenance of substations.

Author Contributions

Investigation and writing—original draft preparation Z.W.; conceptualization, writing—review and editing, and funding acquisition, C.Z.; supervision, formal analysis, visualization, M.D.; methodology, Y.X.; writing—review and editing H.L. All authors have read and agreed to the published version of the manuscript.

Funding

This research was partially funded by the National Natural Science Foundation of China, grant number 52377162, and partially funded by the Science and Technology Project of State Grid Hebei Electric Power Co., Ltd., grant number SGHEXA00YJJS2400654.

Data Availability Statement

To support reproducibility, the following resources are available upon request from the corresponding author: the de-identified open-source image subset, YOLO format annotation specifications and augmentation pipeline code. The complete class taxonomy, per-class instance counts, annotation format, augmentation pipeline, and model training configuration are documented in detail in Section 3 and Section 4 of the manuscript.

Acknowledgments

The authors would like to thank Weiwei Chi from the State Grid Hebei Electric Power Company Xiong’an New Area Power Supply Company for his project support and assistance with this work.

Conflicts of Interest

The authors declare that this study received funding from the Science and Technology Project of State Grid Hebei Electric Power Co., Ltd. The funder was not involved in the study design; collection, analysis, interpretation of data; the writing of this article; or the decision to submit it for publication.

Appendix A

Appendix A.1

Figure A1. Convergence plot of performance results for the MTrip–YOLO model.
Energies 19 01923 g0a1

Appendix A.2

Table A1. Class-by-class performance indicators corresponding to the best F1 point of the MTrip–YOLO model.
Class_IdClass_NamePrecisionRecallAP@0.50AP@0.50:0.95
0HVbushing0.81246165997774040.94822888283378750.94033418306494720.8128436027364907
1defective_HVbushing0.94551723663386060.841159965582120.9381899202301460.8105828642744225
2low_oil0.94492953270339820.72727272727272730.82059597286644310.5114951743065774
3poor_contact0.92316615619206830.93085106382978720.94125647085522260.6466045809472252
4dielectric_loss0.87836459091411530.91537640081072090.93787350278601160.7681835602888116

References

  1. Bagavathiappan, S.; Lahiri, B.B.; Saravanan, T.; Philip, J.; Jayakumar, T. Infrared thermography for condition monitoring—A review. Infrared Phys. Technol. 2013, 60, 35–55. [Google Scholar] [CrossRef]
  2. Zhao, Z.; Xu, G.; Qi, Y.; Pan, D. An intelligent on-line inspection and warning system based on infrared image for transformer bushings. Recent Adv. Electr. Electron. Eng. 2016, 9, 53–62. [Google Scholar] [CrossRef]
  3. Wang, J.; Ou, J.; Fan, Y.; Cai, L.; Zhou, M. Online monitoring of electrical equipment condition based on infrared image temperature data visualization. IEEJ Trans. Electr. Electron. Eng. 2022, 17, 583–591. [Google Scholar] [CrossRef]
  4. Han, S.; Yang, F.; Yang, G.; Gao, B.; Zhang, N.; Wang, D. Electrical equipment identification in infrared images based on ROI-selected CNN method. Electr. Power Syst. Res. 2020, 188, 106534. [Google Scholar] [CrossRef]
  5. Gu, A.; Dao, T. Mamba: Linear-time sequence modeling with selective state spaces. arXiv 2023, arXiv:2312.00752. [Google Scholar] [CrossRef]
  6. Misra, D.; Nalamada, T.; Arasanipalai, A.U.; Hou, Q. Rotate to attend: Convolutional triplet attention module. In Proceedings of the 2021 IEEE Winter Conference on Applications of Computer Vision (WACV), Waikoloa, HI, USA, 3–8 January 2021; pp. 3139–3148. [Google Scholar] [CrossRef]
  7. Cao, L.; Wang, Q.; Luo, Y.; Hou, Y.; Cao, J.; Zheng, W. Yolo-tsl: A lightweight target detection algorithm for UAV infrared images based on triplet attention and slim-neck. Infrared Phys. Technol. 2024, 141, 105487. [Google Scholar] [CrossRef]
  8. Otsu, N. A threshold selection method from gray-level histograms. IEEE Trans. Syst. Man Cybern. 1979, 9, 62–66. [Google Scholar] [CrossRef]
  9. Yu, H.; Wang, J. Infrared Image Segmentation for Power Equipment Using Linear Spectral Clustering and Maximal Similarity-based Region Merging. J. Comput. 2022, 33, 43–53. [Google Scholar] [CrossRef]
  10. Laib dit Leksir, Y.; Mansour, M.; Moussaoui, A. Localization of thermal anomalies in electrical equipment using Infrared Thermography and support vector machine. Infrared Phys. Technol. 2018, 89, 120–128. [Google Scholar] [CrossRef]
  11. Jiang, J.; Bie, Y.; Li, J.; Zhang, B. Fault diagnosis of the bushing infrared images based on mask R-CNN and improved PCNN joint algorithm. High Volt. 2021, 6, 116–124. [Google Scholar] [CrossRef]
  12. Gao, Y.; Tian, L.; Du, Q. Overheating Defect Detection of Composite Insulator Based on Mask R-CNN. Electr. Power 2021, 54, 135–141. [Google Scholar] [CrossRef]
  13. Duan, R.; Ma, C. Detection of Hidden Faults in Electric Power Facilities Combining SAM and U-Net. Int. Arch. Photogramm. Remote Sens. Spat. Inf. Sci. 2025, 48, 35–43. [Google Scholar] [CrossRef]
  14. Zhao, L.; Liu, H.; Gu, G.; Wan, F.; Feng, Y. Deep Reinforcement Learning-Based Target Detection and Autonomous Obstacle Avoidance Control for UAV. Int. J. Adv. Comput. Sci. Appl. 2025, 16, 63–78. [Google Scholar] [CrossRef]
  15. Li, J.; Xu, Y.; Nie, K.; Cao, B.; Zuo, S.; Zhu, J. PEDNet: A Lightweight Detection Network of Power Equipment in Infrared Image Based on YOLOv4-tiny. IEEE Trans. Instrum. Meas. 2023, 72, 5004312. [Google Scholar] [CrossRef]
  16. Liu, Y.; Ji, X.; Pei, S.; Ma, Z.; Zhang, G.; Lin, Y.; Chen, Y. Research on automatic location and recognition of insulators in substation based on YOLOv3. High Volt. 2020, 5, 62–68. [Google Scholar] [CrossRef]
  17. Li, S.; Li, Y.; Li, Y.; Li, M.; Xu, X. YOLO-FIRI: Improved YOLOv5 for Infrared Image Object Detection. IEEE Access 2021, 9, 141861–141875. [Google Scholar] [CrossRef]
  18. Kardaris, N.; Mermigkas, P.; Moustris, G.; Tzafestas, C.; Maragos, P. Automated Thermal Fault Detection in Ultra-High Voltage Substation Equipment. IFAC-PapersOnLine 2025, 59, 73–78. [Google Scholar] [CrossRef]
  19. Zhao, Z.; He, P. YOLO-Mamba: Object detection method for infrared aerial images. Signal Image Video Process. 2024, 18, 8793–8803. [Google Scholar] [CrossRef]
  20. Jiao, J.; Liu, Y.; Liu, Y.; Tian, Y.; Wang, Y.; Xie, L.; Ye, Q.; Yu, H.; Zhao, Y. VMamba: Visual State Space Model. Adv. Neural Inf. Process. Syst. 2024, 37, 103031–103063. [Google Scholar] [CrossRef]
  21. Rekavandi, A.M.; Xu, L.; Boussaid, F.; Seghouane, A.-K.; Hoefs, S.; Bennamoun, M. A guide to image and video based small object detection using deep learning: Case study of maritime surveillance. IEEE Trans. Intell. Transp. Syst. 2025, 26, 2851–2879. [Google Scholar] [CrossRef]
  22. Yuan, M.; Meng, D.; Xi, Z.; Zhao, T.; Zhao, S.; Dai, Y.; Wei, X. Seeing Through the Noise: Improving Infrared Small Target Detection and Segmentation from Noise Suppression Perspective. arXiv 2025, arXiv:2508.06878. [Google Scholar] [CrossRef]
  23. Wang, W.; Xu, J.; Zhang, R. Optimized small object detection in low resolution infrared images using super resolution and attention based feature fusion. PLoS ONE 2025, 20, e0328003. [Google Scholar] [CrossRef]
  24. Dao, T.; Gu, A. Transformers are SSMs: Generalized Models and Efficient Algorithms Through Structured State Space Duality. In Proceedings of the 41st International Conference on Machine Learning, PMLR, Vienna, Austria, 21–27 July 2024; Volume 235, pp. 10041–10071. Available online: https://proceedings.mlr.press/v235/dao24a.html (accessed on 18 January 2026).
  25. DL/T 664-2016; Application Rules of Infrared Diagnosis for Live Electrical Equipment. National Energy Administration, China Electric Power Press: Beijing, China, 2016.
  26. Zhang, Z.; Du, J.; Qian, S.; Xie, C. Detection of Pin Defects in Transmission Lines Based on Dynamic Receptive Field; Lecture Notes in Computer Science; Springer: Cham, Switzerland, 2022; Volume 13537, pp. 389–399. [Google Scholar] [CrossRef]
  27. Atrash, A.; Ertekin, S.; Uğur, Ö.; Moured, O.; Chen, Y.; Zhang, J. TY-RIST: Tactical YOLO Tricks for Real-time Infrared Small Target Detection. In Proceedings of the IEEE/CVF International Conference on Computer Vision Workshops (ICCVW), Honolulu, HI, USA, 19–20 October 2025; pp. 2222–2231. [Google Scholar] [CrossRef]
  28. Ma, T.; Wang, H.; Liang, J.; Peng, J.; Ma, Q.; Kai, Z. MSMA-Net: An Infrared Small Target Detection Network by Multiscale Super-Resolution Enhancement and Multilevel Attention Fusion. IEEE Trans. Geosci. Remote Sens. 2024, 62, 5602620. [Google Scholar] [CrossRef]
  29. Chi, W.; Wang, T.; Zhang, J.; Wang, Z.; Zhang, C. Full-Life-Cycle Management of High-Voltage Bushings Based on Digital Twin: Typical Scenarios, Core Technologies, and Research Prospects. Energies 2025, 18, 6343. [Google Scholar] [CrossRef]
  30. Zhang, P.; Deng, H.; Chen, Z. RT-YOLO: A Residual Feature Fusion Triple Attention Network for Aerial Image Target Detection. Comput. Mater. Contin. 2023, 75, 1411–1430. [Google Scholar] [CrossRef]
  31. Chen, Y.Y.; Jhong, S.Y.; Tu, S.K.; Lin, Y.H.; Wu, Y.C. Autonomous Smart-Edge Fault Diagnostics via Edge-Cloud-Orchestrated Collaborative Computing for Infrared Electrical Equipment Images. IEEE Sens. J. 2024, 24, 24630–24648. [Google Scholar] [CrossRef]
  32. Zhou, S.; Liu, J.; Fan, X.; Fu, Q.; Goh, H.H. Thermal Fault Diagnosis of Electrical Equipment in Substations Using Lightweight Convolutional Neural Network. IEEE Trans. Instrum. Meas. 2023, 72, 5005709. [Google Scholar] [CrossRef]
  33. Li, M.; Han, J.; Yang, Z.; Zhao, B.; Liu, P. Detection of the Pin Defects of Power Transmission Lines Based on Improved TPH-MobileNetv3. J. Electr. Comput. Eng. 2023, 2023, 7192814. [Google Scholar] [CrossRef]
  34. Li, Y.; Li, Z.; Sun, Y.; Zheng, W. Voltage-Induced Heating Defect Detection for Electrical Equipment in Thermal Images. Energies 2023, 16, 8036. [Google Scholar] [CrossRef]
  35. Miguel, C.M.P.; Marcos, E.G.A.; Claudio, S. Rapid and Very Rapid Evolution of Bushing Flaws Detected by Online Monitoring. In Proceedings of the XXI Snptee National Seminar on Production and Transmission of Electric Power, Recife, Brazil, 19–22 October 2011; pp. 1–9. Available online: https://treetech.com.br/en/rapid-and-very-rapid-evolution-of-bushing-flaws-detected-by-online-monitoring/ (accessed on 18 January 2026).
  36. Wei, B.; Xie, Z.; Liu, Y.; Wen, K.; Deng, F.; Zhang, P. Online Monitoring Method for Insulator Self-explosion Based on Edge Computing and Deep Learning. CSEE J. Power Energy Syst. 2022, 8, 1684–1696. [Google Scholar] [CrossRef]
  37. Zhan, W.; Rana, M.S.; Sun, C.; Zhang, Y. Electric Equipment Inspection on High Voltage Transmission Line Via Mobile Net-SSD. Convert. Mag. 2021, 2, 527–540. [Google Scholar] [CrossRef]
  38. Liu, Y.; Zhang, T.; Zhu, H. Spatio-Temporal Adaptive Graph Convolutional Networks (STAGCN) for Real-time Power Equipment Monitoring and Fault Warning. Informatica 2025, 49, 243–254. [Google Scholar] [CrossRef]
Figure 1. Display of some annotated pages.
Energies 19 01923 g001
Figure 2. Flowchart of Category–Balanced Copy–Paste mechanism.
Energies 19 01923 g002
Figure 3. Flowchart of Mosaic strategy.
Energies 19 01923 g003
Figure 4. Flowchart of Balanced Splitting algorithm.
Energies 19 01923 g004
Figure 5. The overall technical framework of MTrip–YOLO for high-voltage bushing infrared fault detection.
Energies 19 01923 g005
Figure 6. The overall framework of MTrip–YOLO: (a) the structure of Mamba-2 module; (b) the structure of Triplet Attention mechanism.
Energies 19 01923 g006
Figure 7. Mamba-2 global context modeling backbone structure diagram.
Energies 19 01923 g007
Figure 8. Schematic diagram of the integration method of Mamba-2 module in the backbone network.
Energies 19 01923 g008
Figure 9. Structural diagram of the Triplet Attention mechanism.
Energies 19 01923 g009
Figure 10. ERF visualization of four model variants (YOLO11n baseline, YOLO11–Trip, YOLO11–Mamba, MTrip–YOLO) across five representative test scenarios. Column 1: normal bushing in complex background; Column 2: occluded small-scale normal bushing; Column 3: poor contact fault in multi-bushing scene; Column 4: oil shortage fault in multi-bushing scene; Column 5: high dielectric loss fault in multi-bushing scene. Red areas represent high gradient response regions contributing most to model predictions.
Energies 19 01923 g010
Figure 11. EA (Error Analysis) visualization of four model variants across five representative test scenarios. Green boxes: ground-truth annotations; red boxes: model predictions. Column 1: normal bushing in complex background with parallel tubular structures; Column 2: occluded small-scale normal bushing; Column 3: poor contact fault; Column 4: oil shortage fault; Column 5: high dielectric loss fault.
Energies 19 01923 g011
Figure 12. The training convergence curve of MTrip–YOLO and comparison models on the high-voltage bushing infrared fault dataset.
Energies 19 01923 g012
Figure 13. Grad-CAM activation heatmaps of MTrip–YOLO across five test scenarios. Columns 1 and 3: oil shortage fault; Columns 2 and 4: poor contact fault; Column 5: high dielectric loss fault. Warm colors indicate high activation; cool colors indicate low activation.
Energies 19 01923 g013
Table 1. The enhanced data sample label distribution.
ClassHVbushingDefective-HVbushingLow-OilPoor-ContactDielectric-LossTotal
Train3150261310608506918364
Val450332110102115 1109
Test367392188132711150
Total396733371358108487710,623
%37.331.412.810.28.3100.0
Table 2. Dataset splitting results of the high-voltage bushing infrared fault dataset.
TrainValTest
2036266266
Table 3. Hyperparameters of the MTrip–YOLO model for high-voltage bushing fault detection.
HyperparameterValue
FrameworkPyTorch 2.0
Input Size640 × 640
Batch Size16
OptimizerAdam
initial LR (lr0)0.01
final LR ratio (lrf)0.01
momentum0.937
weight decay0.0005
warmup epochs3
AMP (automatic mixed precision)enabled
confidence threshold0.25
IoU threshold for NMS0.7
Epochs100
Loss FunctionWI-ShapeIoU
Table 4. Ablation study results of different module combinations for MTrip–YOLO.
Model VariantMamba-2Triplet AttnPruningmAP50 (Mean ± Std) (%)Params (M)FLOPs (G)FPS (Batch = 1)
Baseline 90.839 ± 0.0272.606.4128
Baseline + Pruning87.079 ± 0.2051.855.85137
Baseline + Mamba-2 91.648 ± 0.1472.636.4120
Baseline + Triplet 91.710 ± 0.0372.586.4122
Baseline+ Mamba-2 + Trip92.235 ± 0.0722.636.4125
MTrip–YOLO 91.643 ± 0.0111.906.0133
Table 5. Performance comparison with state-of-the-art models for high-voltage bushing infrared fault detection.
ModelmAP50 (Mean ± Std) (%)mAP50-95 (Mean ± Std) (%)Params (M)FLOPs (G)FPS (Batch = 1)
Faster R-CNN86.49 ± 0.0364.77 ± 0.0743.05280.825.0
RT-DETR91.16 ± 0.0171.90 ± 0.0431.99103.543.2
YOLO26n90.47 ± 0.0270.21 ± 0.012.515.867.3
MTrip–YOLO91.64 ± 0.0171.51 ± 0.031.906.0133
Disclaimer/Publisher’s Note: The statements, opinions and data contained in all publications are solely those of the individual author(s) and contributor(s) and not of MDPI and/or the editor(s). MDPI and/or the editor(s) disclaim responsibility for any injury to people or property resulting from any ideas, methods, instructions or products referred to in the content.