Article

Coordinated Emergency Operation Strategy for Distribution Networks and Photovoltaic-Storage-Charging Integrated Station Based on Master–Slave Game


1
College of Electrical and Information Engineering, Hunan University of Technology, Zhuzhou 412007, China
2
School of Electrical Engineering, City University of Hong Kong, Hong Kong 518057, China
*
Author to whom correspondence should be addressed.
Energies 2026, 19(8), 1922; https://doi.org/10.3390/en19081922
Submission received: 21 March 2026 / Revised: 5 April 2026 / Accepted: 13 April 2026 / Published: 15 April 2026

Abstract

Under fault conditions, Photovoltaic-Storage-Charging Integrated Stations (PSCISs) are regarded as a key resource for enhancing distribution network resilience. However, traditional centralized optimization fails to account for conflicts of interest between the distribution network and PSCISs and neglects the actual response behavior of EV users. To address these issues, a coordinated emergency operation strategy for distribution networks and PSCISs based on the master–slave game is proposed. Firstly, a bilevel optimization framework based on the master–slave game is constructed, where the upper level performs system-level coordination and the lower level handles autonomous decision-making. For the upper level, the minimization of distribution network operation cost is set as the optimization objective by the dispatching center to determine power purchase prices and load shedding rates, which serve as guidance signals for lower-level PSCISs. In terms of the lower level, a dual-factor S-shaped response curve is introduced into the lower-level model to precisely characterize EV users’ nonlinear response behavior to price incentives. Furthermore, based on the signals received from the upper level, the maximization of each PSCIS’s profit is set as the optimization objective to determine the PV output, storage dispatch, and V2G incentive prices. Subsequently, Model Predictive Control (MPC) is employed to implement rolling optimization during the fault period, addressing the source-load uncertainties. Finally, an improved IEEE 33-node distribution network is used for case analysis and validation of the proposed operation strategy. The results indicate that the proposed strategy can effectively coordinate the interests of multiple parties, achieving synergistic improvements in both the economy and reliability of the distribution network.

1. Introduction

With the global transition towards a low-carbon energy system [1], the penetration rate of high-proportion renewable energy sources, represented by photovoltaics, and new loads such as electric vehicles (EV) in distribution networks continues to increase [2,3], making system operation characteristics increasingly complex [4]. Extreme weather events can further exacerbate these challenges, leading to widespread power outages that affect critical infrastructure and essential services. Therefore, enhancing the ability to restore power supply under fault conditions is crucial for improving the resilience of distribution networks [5]. Fortunately, the Photovoltaic-Storage-Charging Integrated Station (PSCIS), which integrates PV, energy storage, and charging piles with Vehicle-to-Grid (V2G) functionality, is considered a key resource for supporting a reliable island power supply due to its time-shifted energy and fast power regulation capabilities [6]. How to coordinate the operation of the distribution network and PSCIS to achieve economical and reliable power supply restoration during fault periods [7] has become a critical issue that urgently needs to be addressed.
In fact, some scholars have begun to focus on the emergency potential of PSCISs in fault scenarios. Unlike early work that primarily focused on post-fault network reconfiguration [8] and island partitioning [9], these studies have begun to explore using PSCISs’ own resources to restore power supply, fully leveraging the coordinated regulation potential of flexible resources such as PV, storage, and V2G [10]. An optimal allocation method for coupled PSCISs in hybrid AC/DC distribution networks is proposed in [11], balancing economics and resilience to minimize load loss during emergency recovery periods. In [12], PV, energy storage systems, and EV charging characteristics within the station under extreme conditions are modeled, and a coordinated load restoration strategy based on a branch flow model is developed. The capability of a PSCIS to serve as an emergency power source during grid faults is studied in [13], focusing on scenarios such as hospitals with critical loads. Enabled by advanced power electronic converters [14], V2G has become a core function of PSCISs and is regarded as a key means to enhance power supply reliability. To fully tap its emergency potential, attention has been directed toward V2G emergency dispatch strategies. A post-disaster power supply restoration scheme incorporating V2G participation is proposed in [15], demonstrating that electric vehicle clusters can serve as auxiliary power sources to restore lost load rapidly. A two-stage EV dispatch framework that accounts for traffic conditions is proposed in [16] to enhance the resilience of coupled power–transportation systems under natural hazards and support post-disaster power restoration. In [17], EV drivers’ heterogeneous willingness to participate in V2G and the role of incentives are analyzed, revealing behavioral factors essential for designing effective post-disaster response strategies. However, the aforementioned studies mostly adopt a centralized optimization framework, which assumes a central dispatcher with full information and control authority to instruct all entities directly. This framework neglects the conflicts of interest between the distribution network and PSCISs as different stakeholders. In practice, PSCIS operators act as independent market participants, having the right to autonomously decide V2G incentive prices and charging/discharging strategies to maximize their own profits [18], rather than unconditionally obeying system commands. Consequently, the solution derived from centralized optimization inherently relies on the premise of full obedience, which fundamentally conflicts with the profit-driven behavior of PSCISs as independent entities. When the instructions of such a solution conflict with the PSCIS’s profit objectives, the PSCIS lacks the incentive to actively participate in coordinated operations, inevitably leading to a significant gap between theoretical optimality and actual operational outcomes.
As a modeling approach capable of effectively addressing conflicts of interest among multiple stakeholders, the master–slave game offers a promising way to tackle the above issues. It has been applied in power system studies, covering areas such as contract mechanisms between aggregators and users [19], coordination of V2G and air conditioning loads [20], and real-time pricing for integrated energy systems [21]. In these applications, however, two limitations remain. First, most of these studies are focused on market transactions under normal operating conditions, with the field of fault emergency response being largely unexplored. Second, the modeling of V2G response, a critical factor affecting system operation, is often simplified using linear or probabilistic approximations. In such models, users’ actual response behavior as rational individuals (e.g., response thresholds and saturation intervals) are neglected. This leads to overly optimistic estimates of V2G capability, potentially causing power shortfalls due to insufficient user participation and threatening system reliability.
To address the above shortcomings, a coordinated emergency operation strategy for distribution networks and PSCISs based on the master–slave game under fault conditions is proposed. Firstly, a bilevel optimization framework based on the master–slave game is constructed, where the upper level performs system-level coordination and the lower level handles autonomous decision-making. In the upper level, the distribution network operation cost is minimized by determining power purchase prices and load shedding rates, which are then transmitted to the lower-level PSCIS as guidance signals. In the lower level, to more accurately reflect real-world V2G behavior, an S-shaped response curve is introduced to characterize the price sensitivity of EV users and the physical constraints imposed by battery state of charge. Based on the signals received from the upper level, the PV output, storage dispatch, and V2G incentive prices are then independently optimized by each PSCIS to maximize its own profit. The power sales decisions of the lower level are subsequently fed back to the upper level, forming an interactive decision-making loop that captures the strategic interplay between the two levels. In addition, power-flow constraints are incorporated into the island-level optimization to ensure physical feasibility. Then, a rolling solution mechanism based on Model Predictive Control (MPC) is designed to handle the dynamics and uncertainties during the fault recovery process. Finally, a fault island scenario is constructed for the IEEE 33-node system to validate the proposed strategy. Through a stepwise comparison of different schemes, the effectiveness of the proposed strategy is demonstrated from multiple dimensions, including system economy, reliability, and individual profits, showing that it can effectively coordinate multi-party interests, significantly improve system economy while ensuring critical loads, and effectively incentivize PSCISs to actively participate in grid interaction, achieving a dual improvement in both the economy and reliability of the distribution network.

2. Coordinated Emergency Operation Framework for Distribution Network–PSCIS and V2G Response Mechanism

2.1. Structure and Operation Mechanism of PSCIS

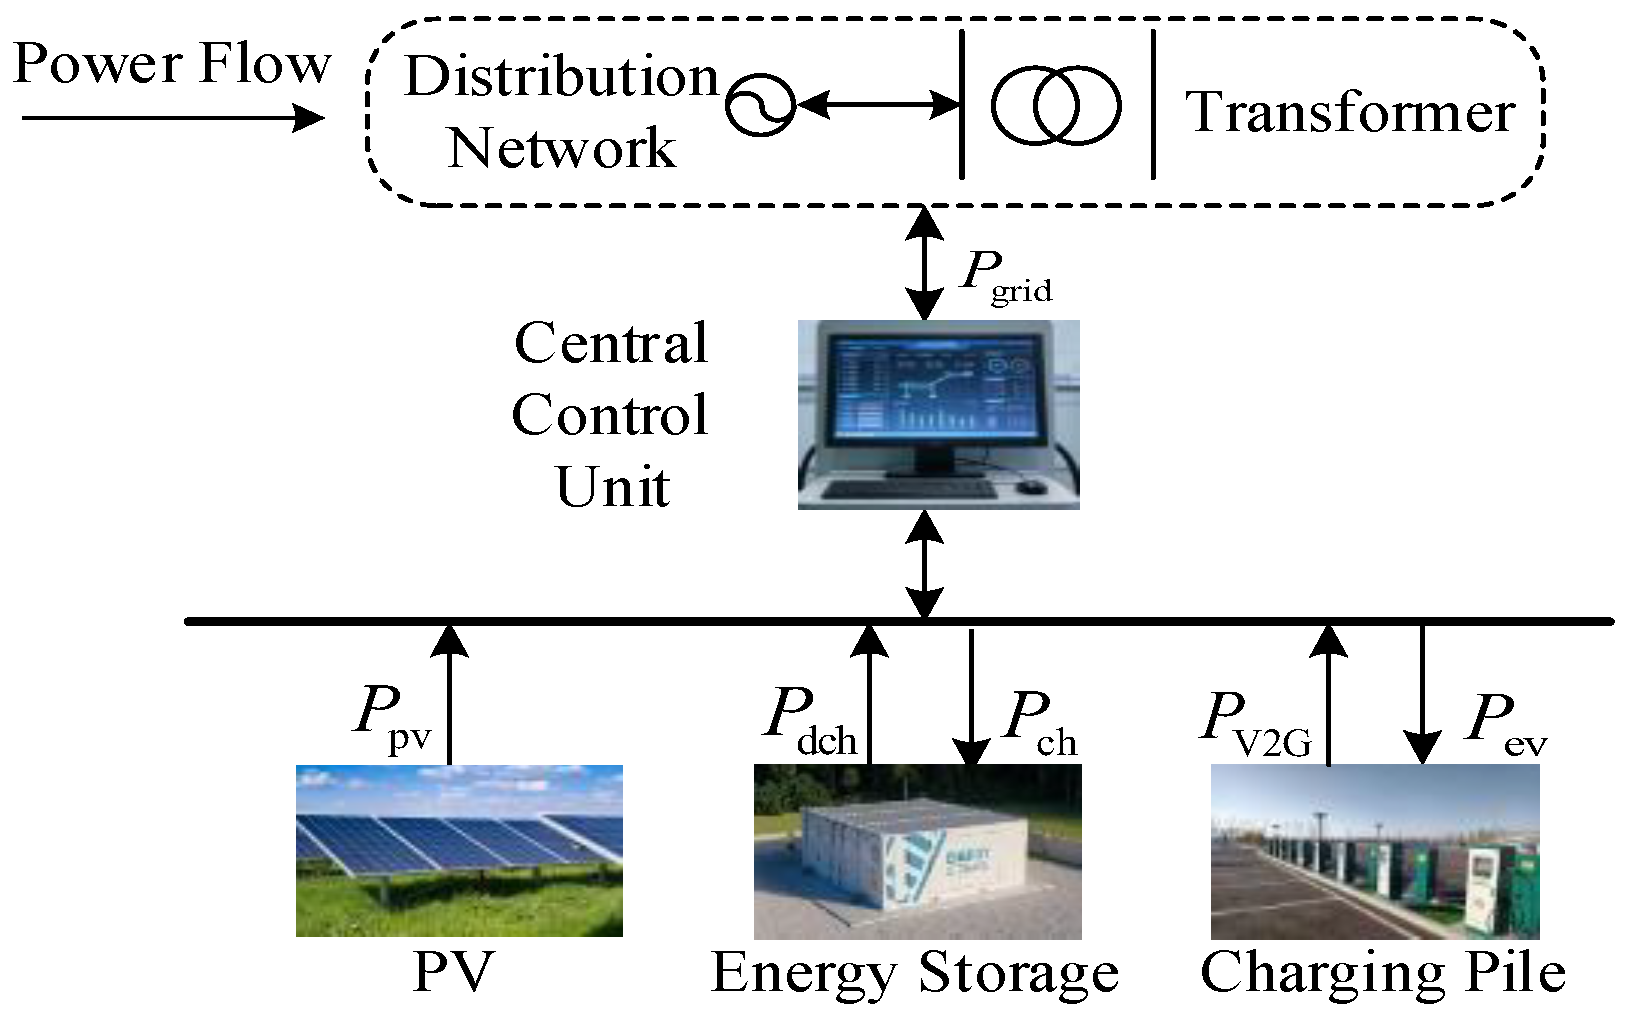
A PSCIS consists of PV, energy storage, a cluster of charging piles with Vehicle-to-Grid functionality, and a central control unit coordinating internal energy flow. Its basic structure is shown in Figure 1.
During normal grid-connected operation, the system operates in energy interconnection mode. After meeting the on-site charging load demand, surplus PV output can be stored in the energy storage system or fed into the upstream distribution network. When PV output is insufficient, the deficit can be made up by discharging the storage or by purchasing power from the grid. The power balance equation [11] is as follows:
P pv + P dch P ch + P V 2 G + P grid = P PSCIS
where Ppv represents PV output power, Pch and Pdch represent the charging and discharging power of the energy storage module, PV2G represents the reverse feed power of the electric vehicle, Pgrid represents the interactive power between the PSCIS and the main grid (positive for purchasing, negative for selling), and PPSCIS represents the PSCIS’s own load, including charging load and conventional site load.
However, when the distribution network is disconnected due to a fault, the PSCIS originally connected to the main grid switches to island operation, becoming the dominant power source in its islanded area and acting as a controllable load [22]. At this point, the power balance relationship of the PSCIS is reconstructed as:
P pv + P dch P ch + P V 2 G = P PSCIS + P ex
where Pex represents the power transmitted by the PSCIS to the other nodes within its governed island. This equation indicates that, under fault conditions, after meeting its own load, the surplus power generated by the PSCIS is injected into the island network to meet the load demands of other nodes.

2.2. Distribution Network–PSCIS Coordinated Operation Mechanism Based on Master–Slave Game and Model Predictive Control

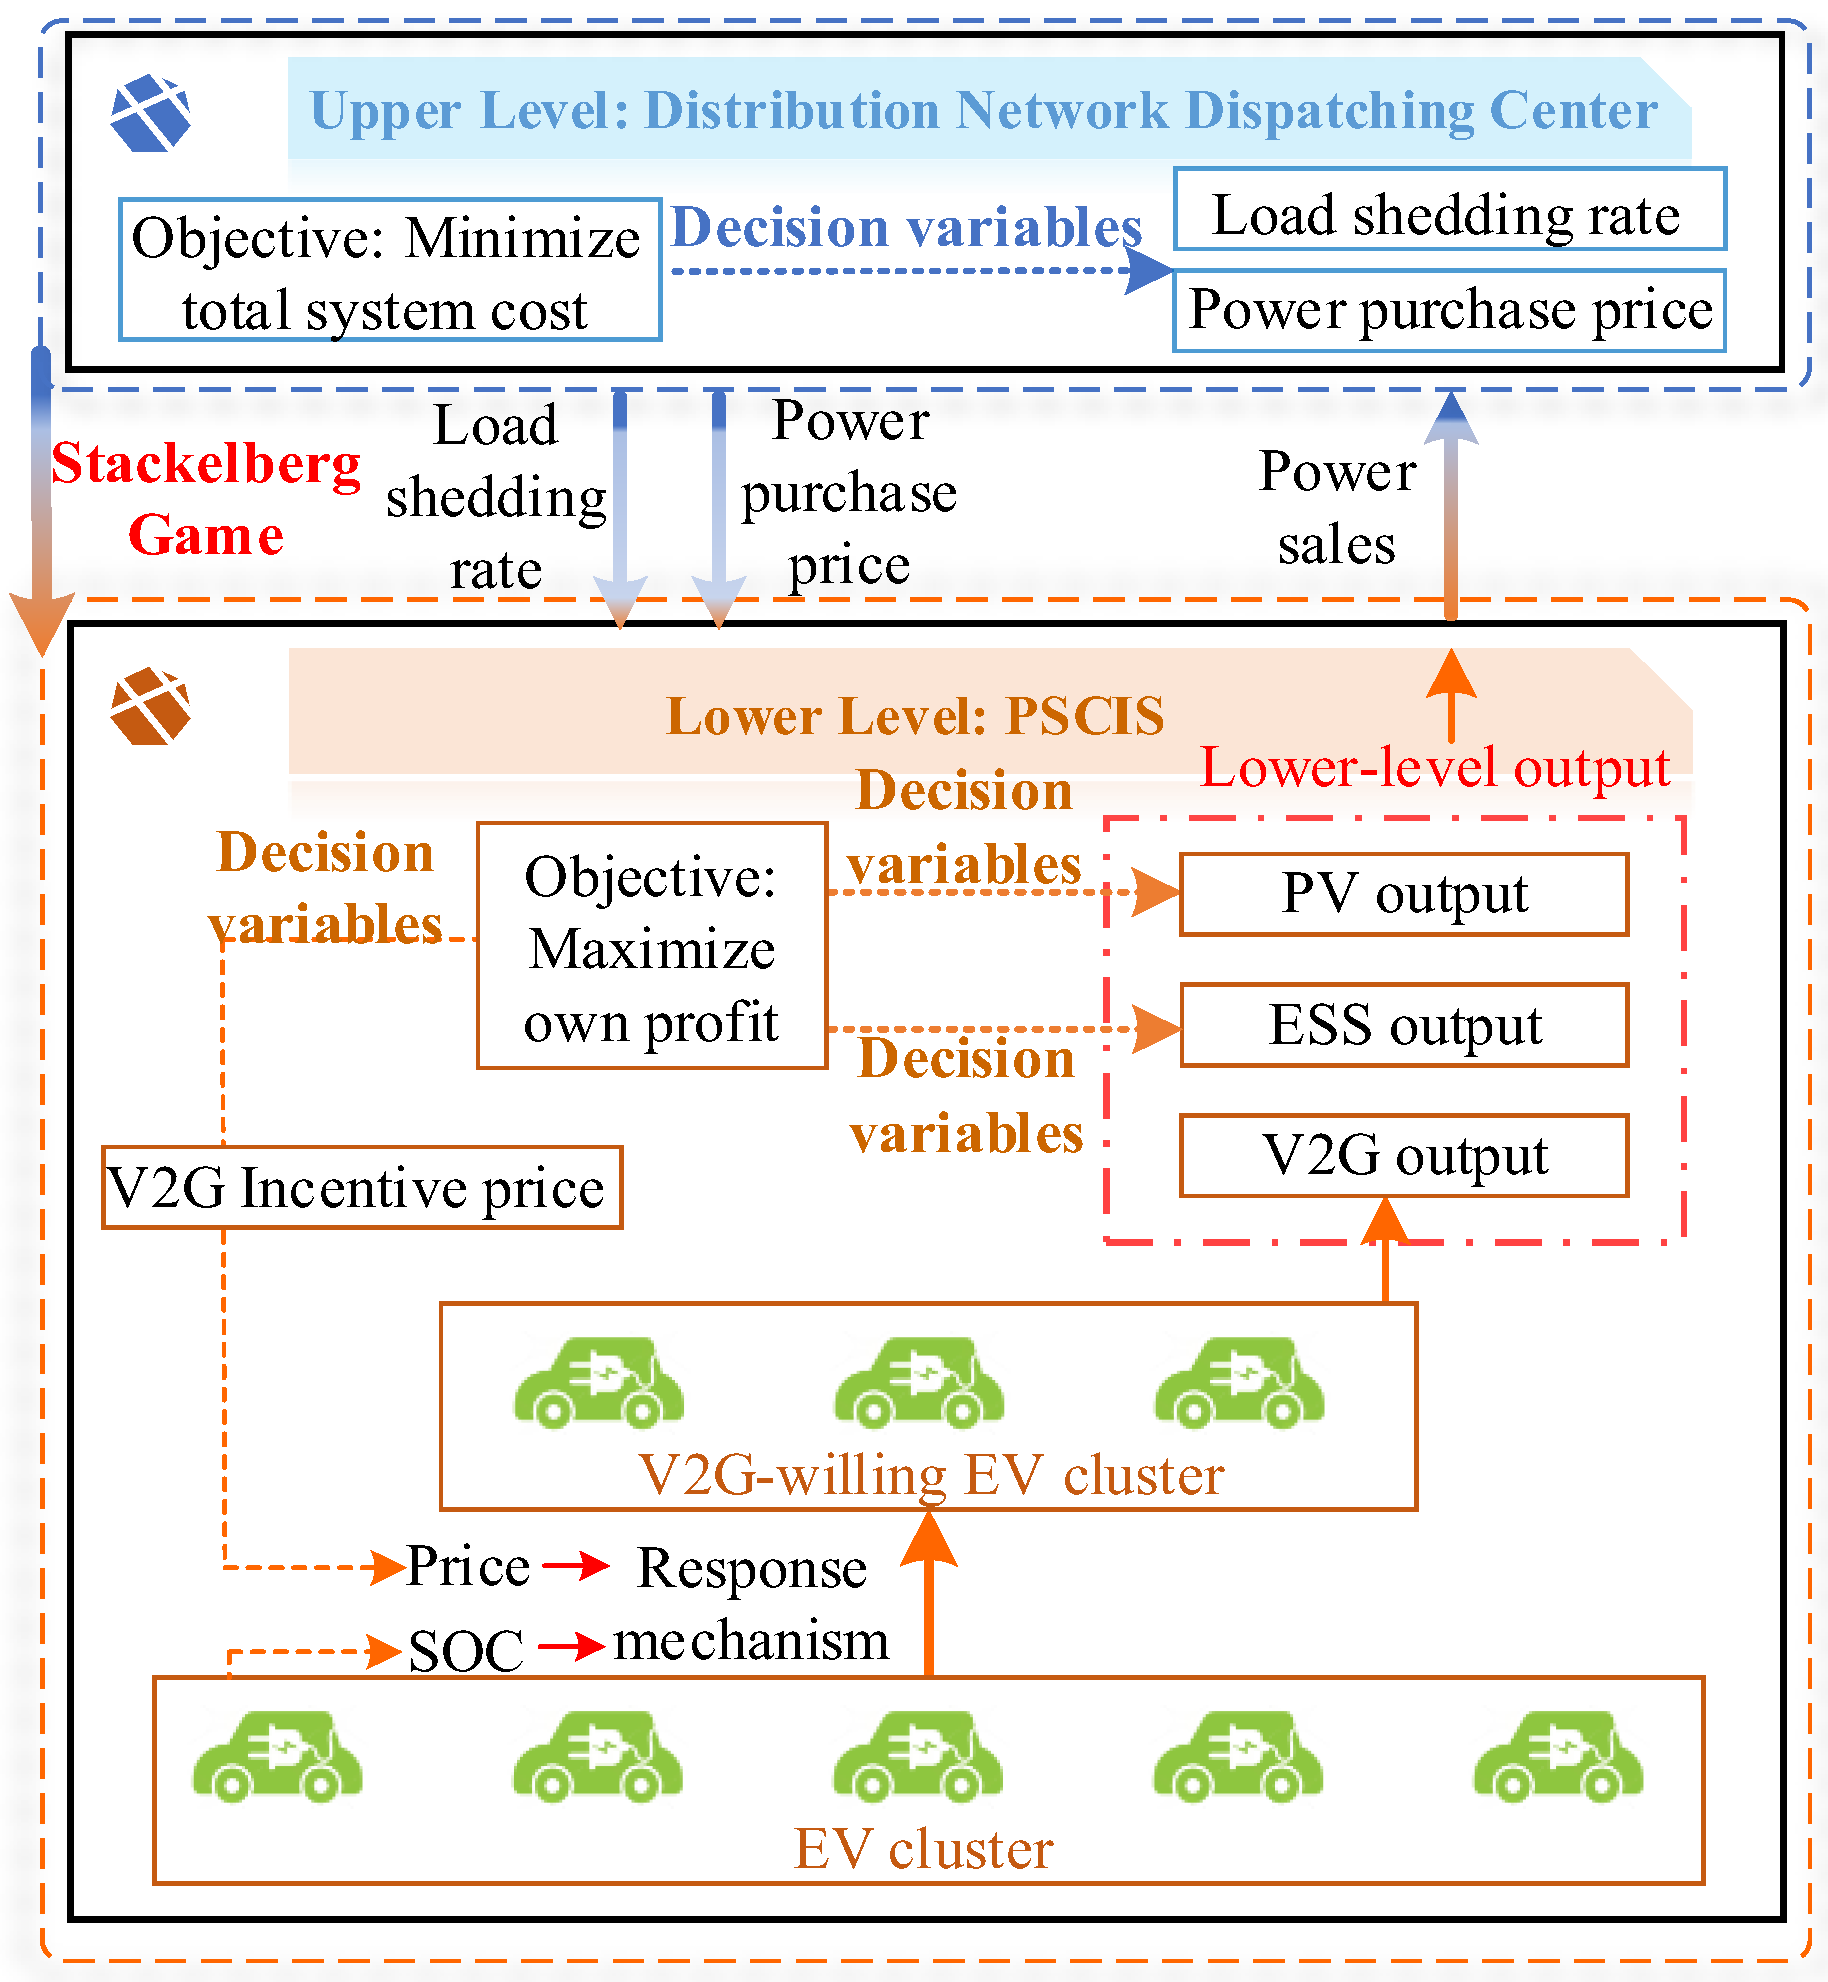
After a fault occurs, the distribution network forms multiple independently operated islands, each with a PSCIS as the dominant power source. The distribution network dispatching center, as the overall coordinator for system restoration, cannot directly control each PSCIS’s internal resources but can guide their operational behavior through economic signals. Meanwhile, each PSCIS, as an independent operating entity, makes autonomous decisions to maximize its own profit. To coordinate the decision-making interaction between the distribution network dispatching center and multiple independently operated PSCISs after a fault, this paper constructs a bilevel optimization framework integrating the master–slave game and Model Predictive Control. Its overall architecture is shown in Figure 2.
The upper-level decision-maker is the distribution network dispatching center, acting as the game leader. Its goal during the fault period is to minimize the total system cost, including the power purchase costs paid to each PSCIS and the penalty costs for load shedding due to insufficient power supply capacity. The dispatching center guides the lower level through two key types of signals: first, the power purchase price, i.e., the unit price paid to the PSCIS for purchased power, serving as an economic lever to incentivize the PSCISs to increase their output. Second, the load shedding rate, i.e., the allowable proportion of load reduction at each node within a time period. By treating the load shedding rate as an active decision variable jointly optimized with the power purchase price, the dispatching center can actively trade off supply reliability and economy in extreme scenarios.
The lower-level decision-makers are the PSCISs within each island, acting as the game followers. Upon receiving signals from the upper level, each PSCIS i, aiming to maximize its own operational profit, independently optimizes its dispatch strategy for its internal PV, storage, and V2G resources. Ultimately, it determines the power Pex, which it transmits to other nodes within its governed island. This power is included as sales revenue in the PSCIS’s profit calculation in the lower-level optimization. It corresponds to the power purchased by the distribution dispatching center in the upper-level optimization, serving as the direct channel for interaction between upper- and lower-level decision-making.
In the game framework, a closed-loop feedback loop is established between the upper and lower levels through price signals and power interactions: the upper level influences lower-level decisions by adjusting prices and load shedding rates, and the sales power fed back by the lower level determines the upper level’s cost. Both parties seek equilibrium through dynamic interaction.
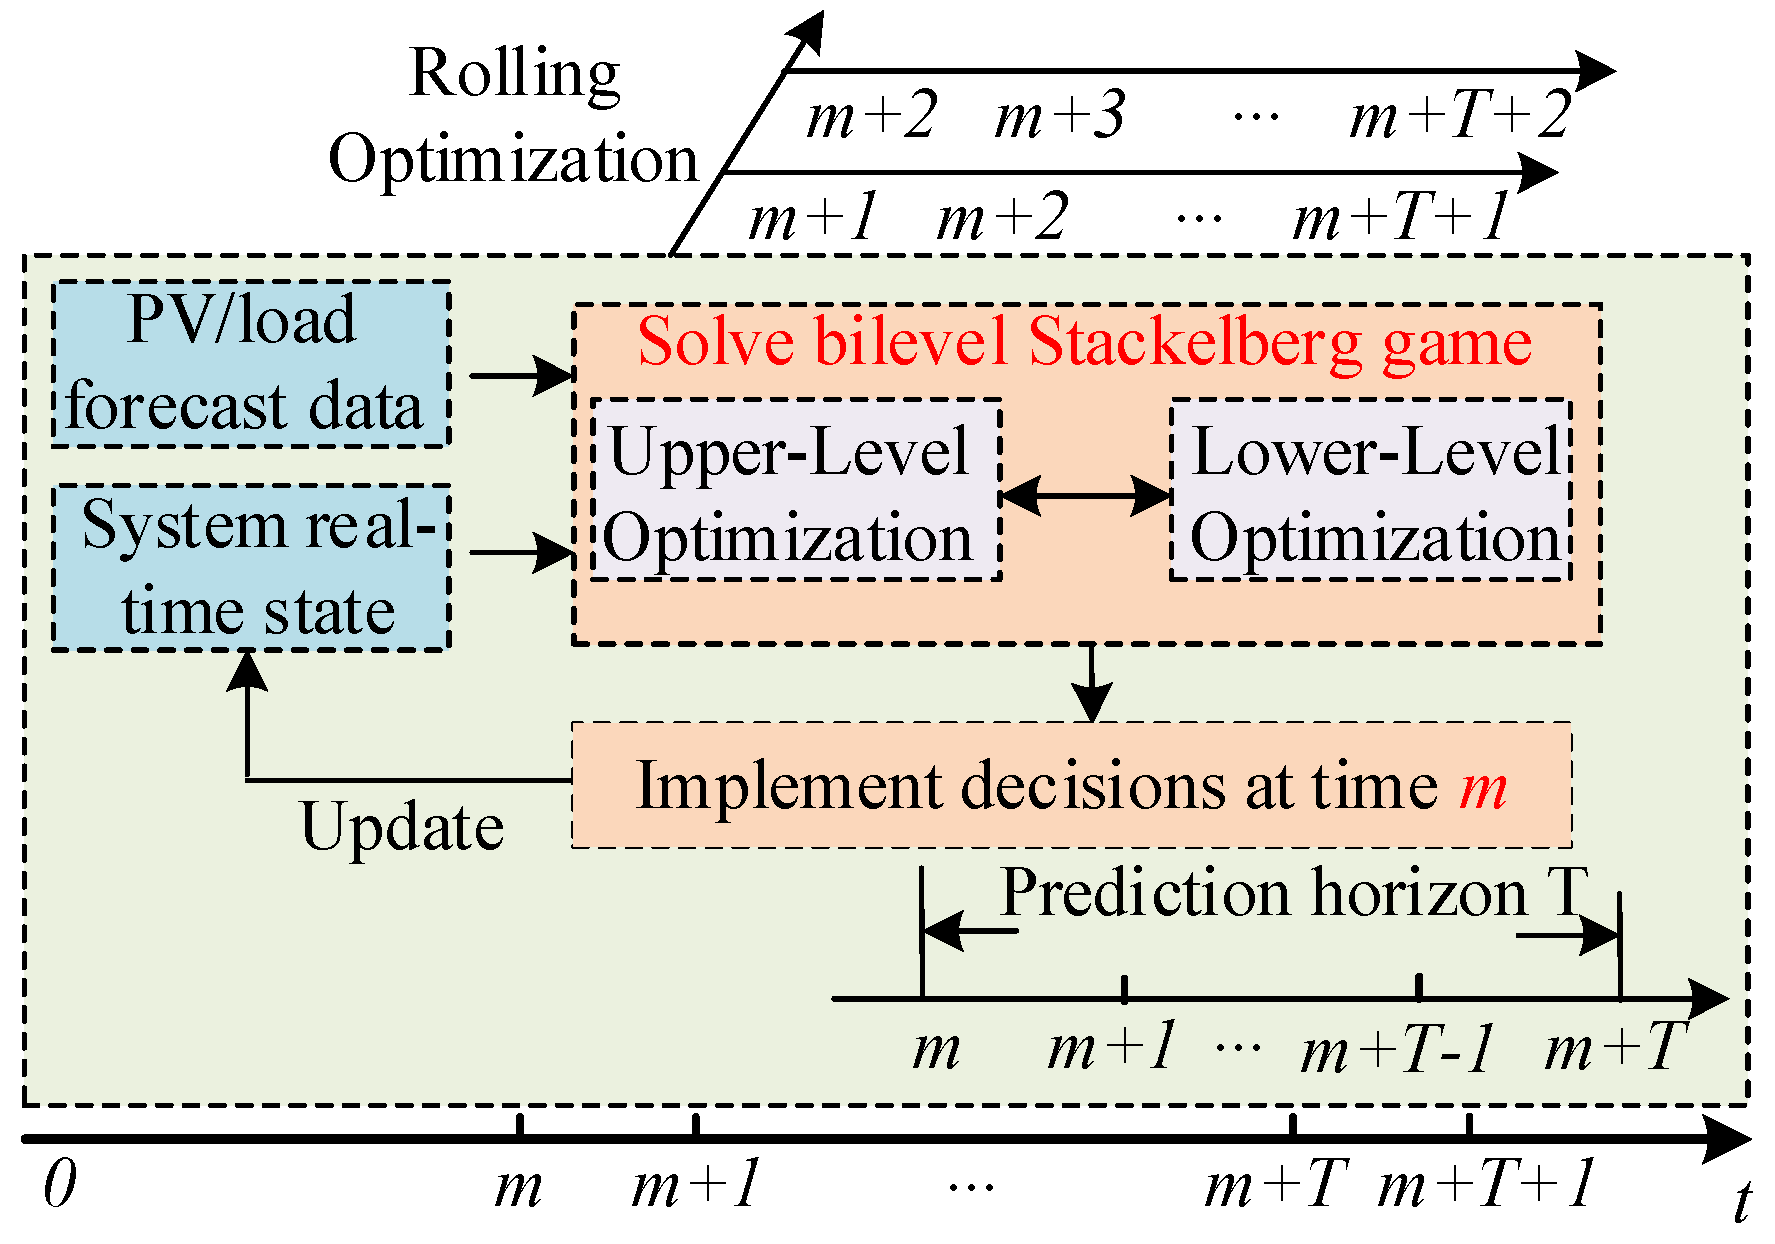
However, the fault recovery process typically lasts several hours, during which PV output and load demand exhibit significant uncertainty. To enhance the dynamic adaptability of the optimization strategy, this paper embeds the above static master–slave game into the rolling optimization framework of MPC, forming a “prediction-game-execution-feedback” closed loop as shown in Figure 3.
At each decision time m, the dispatch center solves a complete bilevel master–slave game problem in the prediction time domain based on the current system state (e.g., storage load state) and the PV and load forecasts for the next T time periods and obtains the optimal decision sequence for the future time periods (i.e., T time periods from m to m + T − 1); however, the system only executes the decision at the current time m. The system state is updated to the next time (m + 1), and forecast information is refreshed continuously. At time m + 1, the system state is updated, and the prediction information is refreshed on a rolling basis, repeating the above optimization process. Through this rolling optimization and feedback correction, the original static game can continuously adapt to an uncertain environment, thereby improving the strategy’s robustness.

2.3. V2G Response Mechanism Based on Price Incentives and SOC Constraints

In the optimization decision-making of the lower-level PSCIS, the dispatch capability of V2G resources fundamentally depends on the actual response behavior of electric vehicle users to incentive prices. Traditional optimization models often treat V2G power as a fixed value or a linear function of price, failing to capture the significant psychological thresholds and saturation effects in user decision-making. This leads to substantial deviations between the optimization plan and users’ actual willingness to participate, severely compromising the strategy’s executability.
To overcome this limitation, this paper introduces a V2G response model based on the logistic (S-shaped) function to more accurately characterize the nonlinear mapping from the incentive price to available power, while accounting for constraints imposed by the electric vehicles’ state of charge on their discharge capability. The core idea of this model stems from behavioral economics: at the price-incentive level, when the incentive price is below a certain psychological threshold, users’ willingness to participate is extremely low, and responses grow slowly. Once the price exceeds the threshold, the response increases rapidly. When the price reaches a high level, due to concerns about battery degradation or range anxiety, the response gradually tends towards saturation [23]. At the physical constraint level, the discharge capability of an electric vehicle is rigidly constrained by its current state of charge. Effective participation in V2G services is possible only when the SOC exceeds a threshold; as the SOC decreases, dispatchable power decays in an S-shaped manner. Its mathematical essence can be described by the function shown in the equation:
P V 2 G t = P max 1 1 + e α ( c V 2 G t c 0 ) 1 1 + e β ( SOC v 2 g t SOC 0 )
where Pmax is the theoretical maximum discharge power, determined by the total capacity of the electric vehicle cluster within the PSCIS’s jurisdiction; c V 2 G t is the V2G incentive price set by the PSCIS at the time t; c0 is the benchmark incentive price; α is the price sensitivity coefficient, characterizing the linear response degree of users to price incentives; SOC v 2 g t is the average state of charge of the electric vehicle cluster at that time; and SOC0 is the inflection point of the discharging capacity. The willingness to discharge drops sharply when the EV SOC is below this value; β is the steepness coefficient of the SOC curve, reflecting the rigidity degree of the SOC constraint.
Embedding this behavioral model into the lower-level optimization ensures that when setting the V2G incentive price, the PSCIS operator can clearly foresee the physical power that can be mobilized by that price and incorporate it into power balance and profit calculations. This better aligns the optimization results with actual user behavior, significantly improving the executability of the dispatch strategy.

3. Bilevel Optimization Model for Distribution Network–PSCIS Based on Master–Slave Game Under Fault Conditions

Based on the coordinated operation framework established in Chapter 2, this chapter develops a comprehensive bilevel master–slave game model for coordinated optimization of the distribution network and PSCIS under fault conditions.
In this paper, we use a model-predictive control-based rolling optimization framework. Let the current decision time be m and the prediction time domain be T; then, the set of time periods TMPC in the current optimization window is {m, m + 1, …, m + T − 1}. As the MPC scrolls forward, the current time m gradually increases from the fault onset time, and the optimization window slides forward accordingly until it covers the entire fault time period.
For simplicity of presentation, the same number i is used in this paper to identify the node and the PSCIS configured on it (if it exists). Variables associated with the PSCIS equipment have non-zero values only for i; otherwise, these variables are set to zero.

3.1. Upper-Level Model: Distribution Network Dispatching Center Optimization

As the game leader, the distribution network dispatching center, during the fault recovery period, guides each PSCIS to provide support through economic means and balances supply reliability and economy to minimize the overall cost of the distribution network.

3.1.1. Objective Function

The goal of the upper-level decision-making is to minimize the comprehensive system cost F within the optimization window. This cost consists of two parts: power purchase costs and load shedding penalties.
min F = F PUR + F EC
where FPUR denotes the total cost of power purchase from the distribution grid to each PSCIS, and FEC denotes the cost of penalizing the load demand that cannot be met.
  • Total Power Purchase Cost:
The total power purchase cost represents the cost paid by the distribution and dispatch center for obtaining the power support of the PSCIS within the optimization window, which guides the resource scheduling.
Thus, FPUR can be expressed as:
F PUR = t = m m + T 1 i Ω N c pur , i t P ex , i t Δ t
where P ex , i t denotes the power purchased from the distribution network to the PSCIS at node i in time period t (if node i is not configured with a PSCIS, the value is 0, and the same is true afterward); c pur , i t denotes the unit price of electricity purchased from the distribution network to the PSCIS at node i in time period t; Ω N denotes the set of the distribution network nodes; m is the current decision-making time; and T denotes the length of the prediction time domain. By adjusting the price, the upper level directly affects the power sales revenue of the lower-level PSCISs, thereby incentivizing or suppressing their output. Therefore, this cost term is not only an economic cost but also the core means for the upper level to achieve resource coordination.
2.
Load Shedding Penalty Cost
The load shedding penalty cost is the total penalty for the unmet load demand of the distribution network under extreme disaster scenarios, directly reflecting the degree of overall system power supply reliability deficiency:
F EC = t = m m + T 1 i Ω N c ec φ i μ i t p load , i t Δ t
where cec is the unit lost load shedding penalty coefficient; φ i is the importance weight determined based on the importance of load; μ i t is the proportion of load lost at node i at time t; and p load , i t is the active load demand of load at node i at time t. By assigning a much higher penalty coefficient to critical loads than to regular loads, this equation makes shedding critical loads far more costly, thereby prioritizing the supply of them during load shedding. This penalty cost thus reflects the trade-off between economic efficiency and power supply reliability.

3.1.2. Constraints

  • Electricity supply price constraints
To ensure market stability and prevent prices from getting out of control, the power purchase price for each PSCIS is limited to a reasonable range:
c pur , min c pur , i t c pur , max , i Ω N , t T M P C
where cpur,min and cpur,max denote the lower and upper limits of the power purchase price.
2.
Node Loss of Load Rate Constraint
The ratio of lost load at each node must be between 0 and 1:
0 μ i t 1 , i Ω N , t T M P C

3.2. Lower-Level Model: PSCIS Optimization

As a game follower, each PSCIS, upon receiving the price signal from the upper level, independently solves a local optimization problem aiming to maximize its own profit. It coordinates its internal PV, storage, and V2G resources within the island and strictly adheres to the physical operation constraints of the island network.

3.2.1. Objective Function

The lower-level optimization objective is to maximize its operational profit within the optimization window. This profit is obtained by subtracting various operating costs from the electricity sales revenue:
min f i = f PUR , i f V 2 G , i f ESS , i f PV , i
where f PUR , i is the revenue from the sale of electricity at the PSCIS at node i; f V 2 G , i is the incentive fee paid by the PSCIS at node i to the electric vehicle users participating in reverse charging; f ESS , i is the cost of the storage operation and maintenance of the PSCIS at node i; and f PV , i is the cost of the PV operation and maintenance of the PSCIS at node i. The formulas for calculating the benefits or costs of each component are as follows.
f PUR , i = t = m m + T 1 c pur , i t P ex , i t Δ t f V 2 G , i = t = m m + T 1 c V 2 G , i t P V 2 G , i t Δ t f ESS , i = t = m m + T 1 c ess t ( P dch , i t + P ch , i t ) Δ t f PV , i = t = m m + T 1 c PV t P PV , i t Δ t
where P ex , i t denotes the power sold by the PSCIS at node i at time t; c V 2 G , i t is the V2G unit incentive cost set by the PSCIS at node i at time t; P V 2 G , i t is the V2G reverse charging power received by the PSCIS at node i at time t; c ess t is the energy storage unit O&M cost at time t; P dch , i t and P ch , i t are the charging and discharging power of the PV portion of the PSCIS at node i at time t; c PV t is the PV unit O&M cost at time t; and P PV , i t is the generating power of the PV portion of the PSCIS at node i at time t.
According to the two-factor coupled V2G response model described in Section 2.3, the V2G reverse charging power P V 2 G , i t received by the PSCIS at node i is determined by its set incentive price and the average charging state of the EV cluster:
P V 2 G , i t = P max , i 1 1 + e α ( c V 2 G , i t c 0 , i ) 1 1 + e β ( SOC v 2 g , i t SOC 0 )
where c V 2 G , i t is the V2G incentive price set by the PSCIS at node i at time t and SOC v 2 g , i t is the average state of charge of the EV cluster in the silo under the jurisdiction of the PSCIS at that moment.

3.2.2. Constraints

  • PV Operation Constraint
The actual output of the PV in the PSCIS cannot exceed the forecasted maximum available output:
0 P PV , i t P PV , i forecast , t ,   i Ω N , t T M P C
where P PV , i forecast , t is the forecasted maximum PV output of the PSCIS configured at node i at time t.
2.
Energy Storage Operation Constraints
The energy storage system in the PSCIS must satisfy charging/discharging power limits, charging/discharging mutual exclusivity, energy dynamic balance, and state of charge constraints:
0 P ch , i t u ch , i t P ess , i set 0 P dch , i t u dch , i t P ess , i set i Ω N , t T M P C
u ch , i t + u dis , i t 1 , i Ω N , t T M P C
E i t + 1 = E i t + ( η ch P ch , i t P dch , i t η dch ) Δ t , i Ω N , t T M P C
S O C ess , i min E i t S O C ess , i max ,   i Ω N , t T M P C
Equation (13) is the energy storage charging and discharging power constraint: u ch , i t and u dch , i t are the charging and discharging identifiers, respectively, indicating whether the energy storage in the PSCIS at node i is charged and discharged at time t, and P ess , i set is the rated power of the storage system configured in the PSCIS at node i. P ch , i t and P dch , i t are the charging and discharging power of the storage at time t, which is subject to the constraints of the charging and discharging identifiers and rated power, respectively. Equation (14) is the energy storage charging and discharging mutual exclusion constraint, which indicates that the energy storage cannot be charged and discharged at the same time. Equation (15) is the energy dynamic balance constraint, and E i t is the residual power of the energy storage at the time t; η ch and η dch are the energy storage charging and discharging efficiencies, respectively; Equation (16) is the constraint on the charge state of the storage. S O C ess , i min and S O C ess , i max are the upper and lower bounds of the charge state of the energy storage, respectively.
3.
V2G Incentive Price Constraint
The V2G incentive price must be within a reasonable range:
c V 2 G , i min c V 2 G , i t c V 2 G , i max , i Ω N , t T M P C
where c V 2 G , i min and c V 2 G , i max are the lower and upper limits of the incentive price.
4.
Non-negativity Constraint for Power Sales
In fault island mode, the PSCIS only acts as a power source supplying the local network, so the power sold is non-negative:
P ex , i t 0 , i Ω N , t T M P C
5.
Node Power Balance Constraint
For the island governed by the PSCIS at the node i, any node j within the island must satisfy the node power balance:
1 μ j t p load , j t + p j t + P EV , j t = P PV , j t + P dch , j t P ch , j t + P V 2 G , j t , 1 μ j t q load , j t + q j t = Q PV , j t , j N i , t T MPC
where N i is the set of nodes in the silo governed by the PSCIS at node i, and j is any node within the set ( i , j N i ); μ j t is the percentage of lost load at node j; p load , j t and q load , j t are the active and reactive loads at node j, respectively; and p j t and q j t are the injected active and reactive power at node j, respectively. For node i configured with a PSCIS (i.e., i = j), the injected power p j t is numerically equal to the power P ex , i t delivered by this PSCIS to the remaining nodes in the island. For nodes not configured with a PSCIS (ij), all outgoing powers are zero.
6.
Power Flow Constraints
For the island governed by the PSCIS at node i, the DistFlow power flow constraints must be satisfied:
V k t = V j t 2 r j k P j k t + x j k Q j k t + r j k 2 + x j k 2 I j k t , 2 P j k t 2 Q j k t I j k t V j t 2 I j k t + V j t , j , k N i , t T MPC
where P j k t and Q j k t are the active and reactive power flowing from node j to the next node k at time t, respectively; I j k t is the square of the current magnitude on the branch between node j and node k; V j t and V k t are the squares of the voltage magnitudes at node j and node k, respectively; and r j k 2 and x j k 2 are the resistance and reactance of the branch between node j and node k, respectively.
7.
Safe Operation Constraints:
( V j , min ) 2 V j t ( V j , max ) 2 ( I j k , min ) 2 I j k t ( I j k , max ) 2 j , k N i , t T MPC
where V j , max and V j , min are the upper and lower voltage limits for node j and I j k , max and I j k , min are the upper and lower current limits for the branch between nodes j and k.

4. Case Study Analysis

4.1. Parameter Settings

In this paper, an improved IEEE 33-node distribution network is used for arithmetic analysis with a reference capacity of 1 MVA and a reference voltage of 12.66 kV.
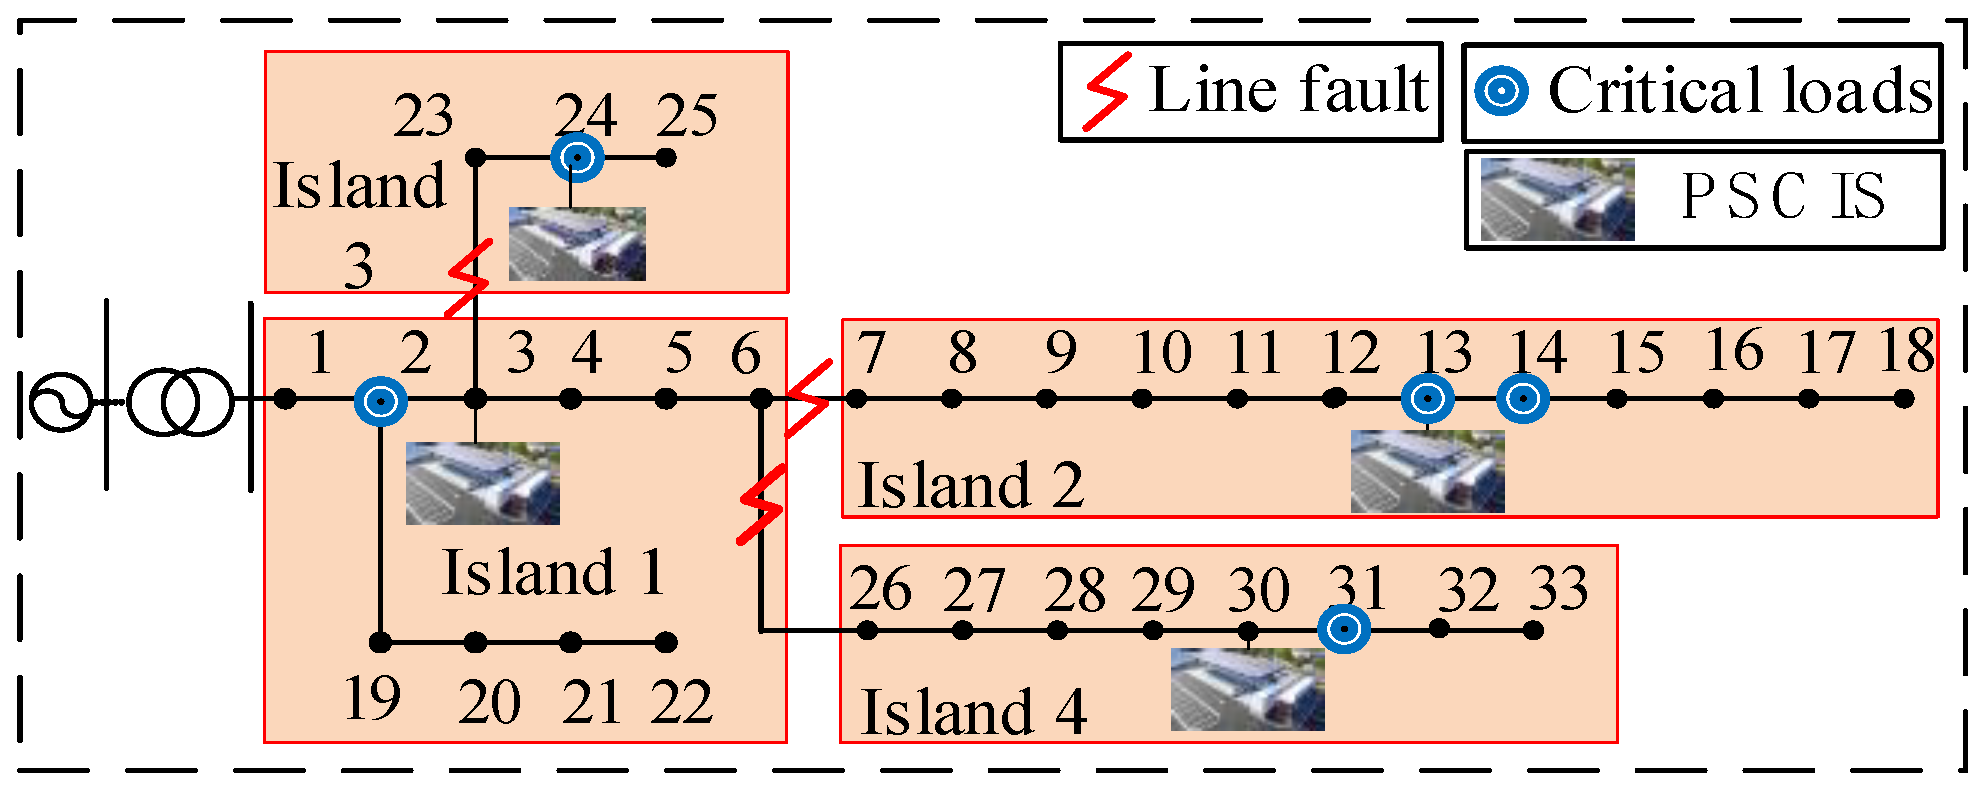
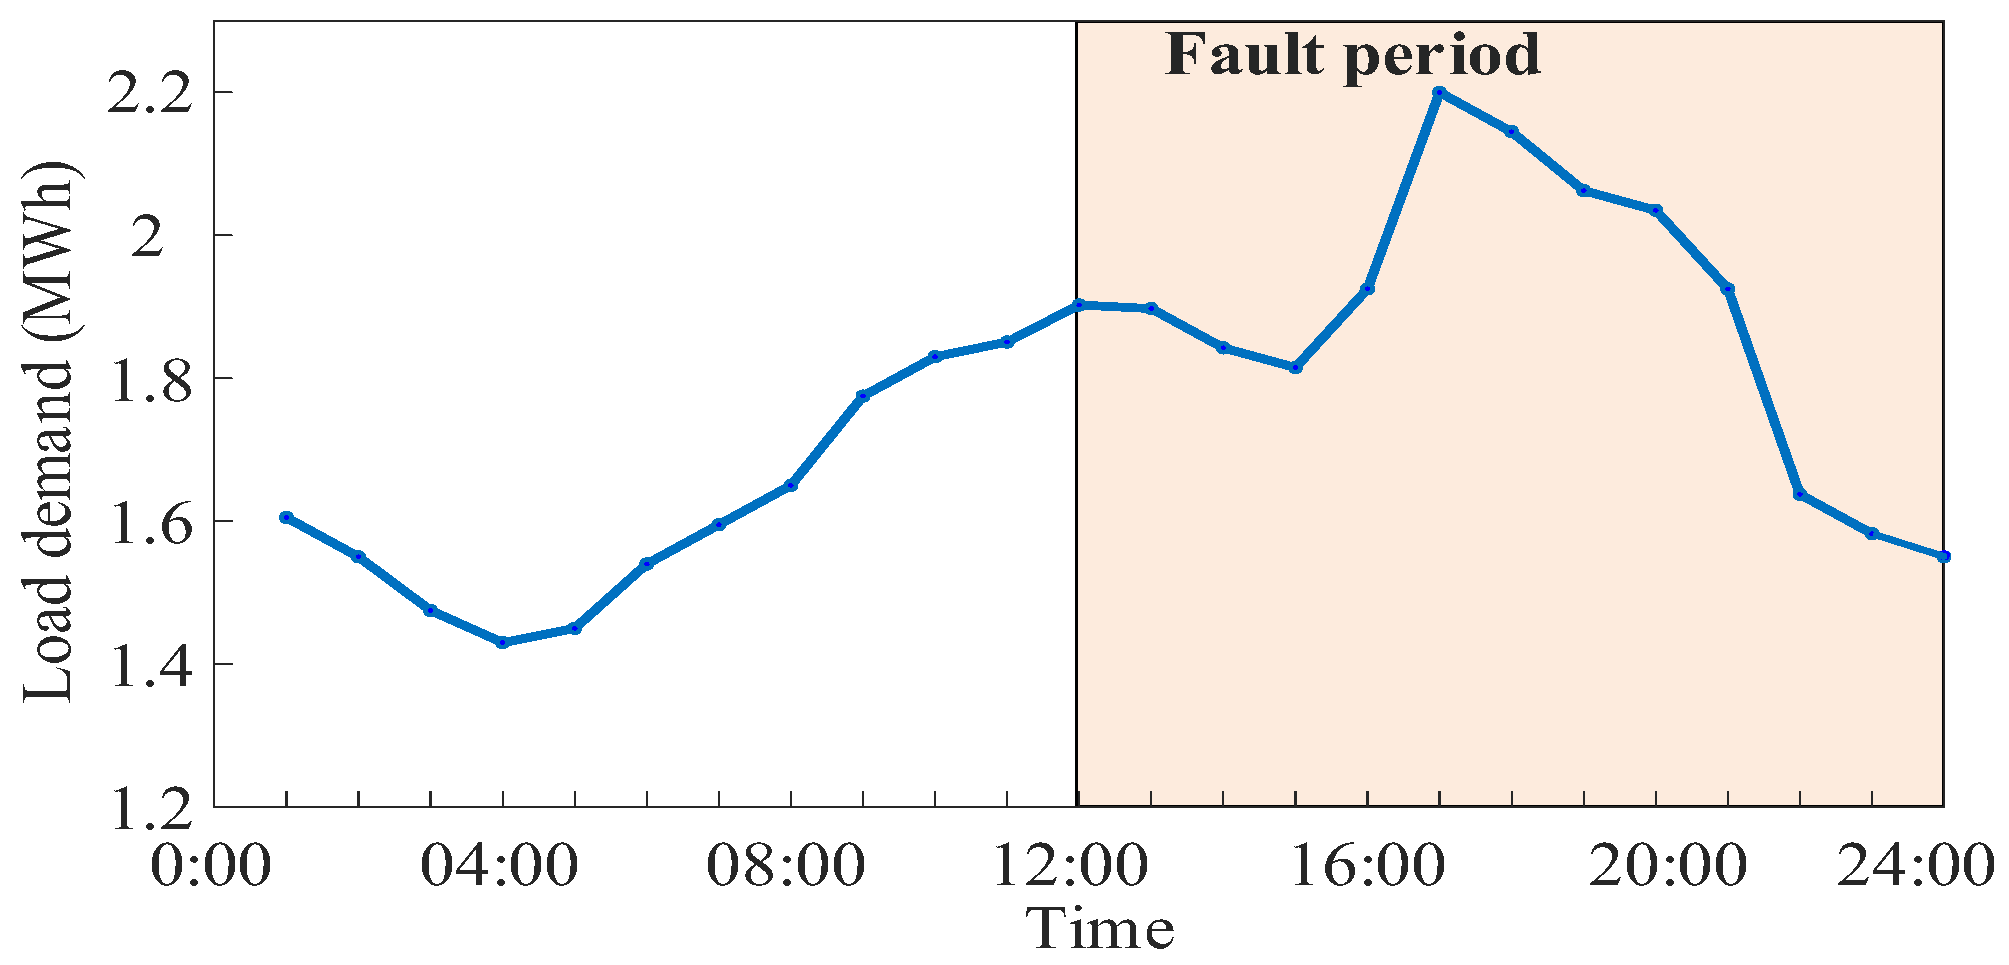
To fully reflect the operation strategy under fault conditions, the fault period is set from 12:00 to 24:00 (12 h total). Based on a typhoon disaster scenario, lines 3–23, 6–7, and 6–26 are set as faulty, dividing the network into four islands. Island 1 consists of nodes 1–6 and 19–22; Island 2 consists of nodes 7–18; Island 3 consists of nodes 23–25; and Island 4 consists of nodes 26–33. Each island is equipped with one PSCIS, located at node 3 (Island 1), node 13 (Island 2), node 24 (Island 3), and node 30 (Island 4). Critical loads are located at nodes 2, 13, 14, 24, and 31. The specific topology is shown in Figure 4. The configuration parameters for PV and energy storage within the PSCIS are shown in Table 1. The load shedding penalty coefficient is set at 10 RMB/kWh, and for critical loads (nodes 2, 13, 14, 24, 31) it is set at 200 RMB/kWh. The load curve of the distribution network is shown in Figure 5. The prediction horizon is set to 4 h, which balances resilience performance, forecast accuracy, and computational burden.

4.2. Analysis of Results

In this paper, the effectiveness of the method proposed is verified by setting up the following three optimized operation schemes for comparative analysis:
(1) Scheme 1: V2G-free centralized optimization scheme, considering only PV and storage power supply, as a baseline scheme without V2G.
(2) Scheme 2: Traditional centralized optimization scheme with V2G, considering PV, energy storage, and V2G power supply, with the V2G price pre-determined by centralized optimization.
(3) Scheme 3: In this paper, the master–slave game cooperative operation scheme, the distribution grid, and the PSCIS interact with each other through the master–slave game, the upper layer dynamically pricing, and the lower layer autonomously optimizing the equipment output and V2G discharging.
To reveal the optimism bias caused by traditional centralized optimization that ignores actual user responses, Scheme 2 is further divided into two schemes: the ideal plan (ignoring actual user responses) and the actual result (considering actual user responses). The data for Scheme 2 in Section 4.2.1, Section 4.2.2 and Section 4.2.3 are the result of rescheduling based on actual user responses (i.e., Scheme 2-Actual), which are included in the comparison as real executable plans for traditional centralized optimization. The ideal plan for Scheme 2 (ignoring actual user responses) will be specifically analyzed in Section 4.2.4.

4.2.1. Comparative Analysis of Resource Mobilization and System Economics

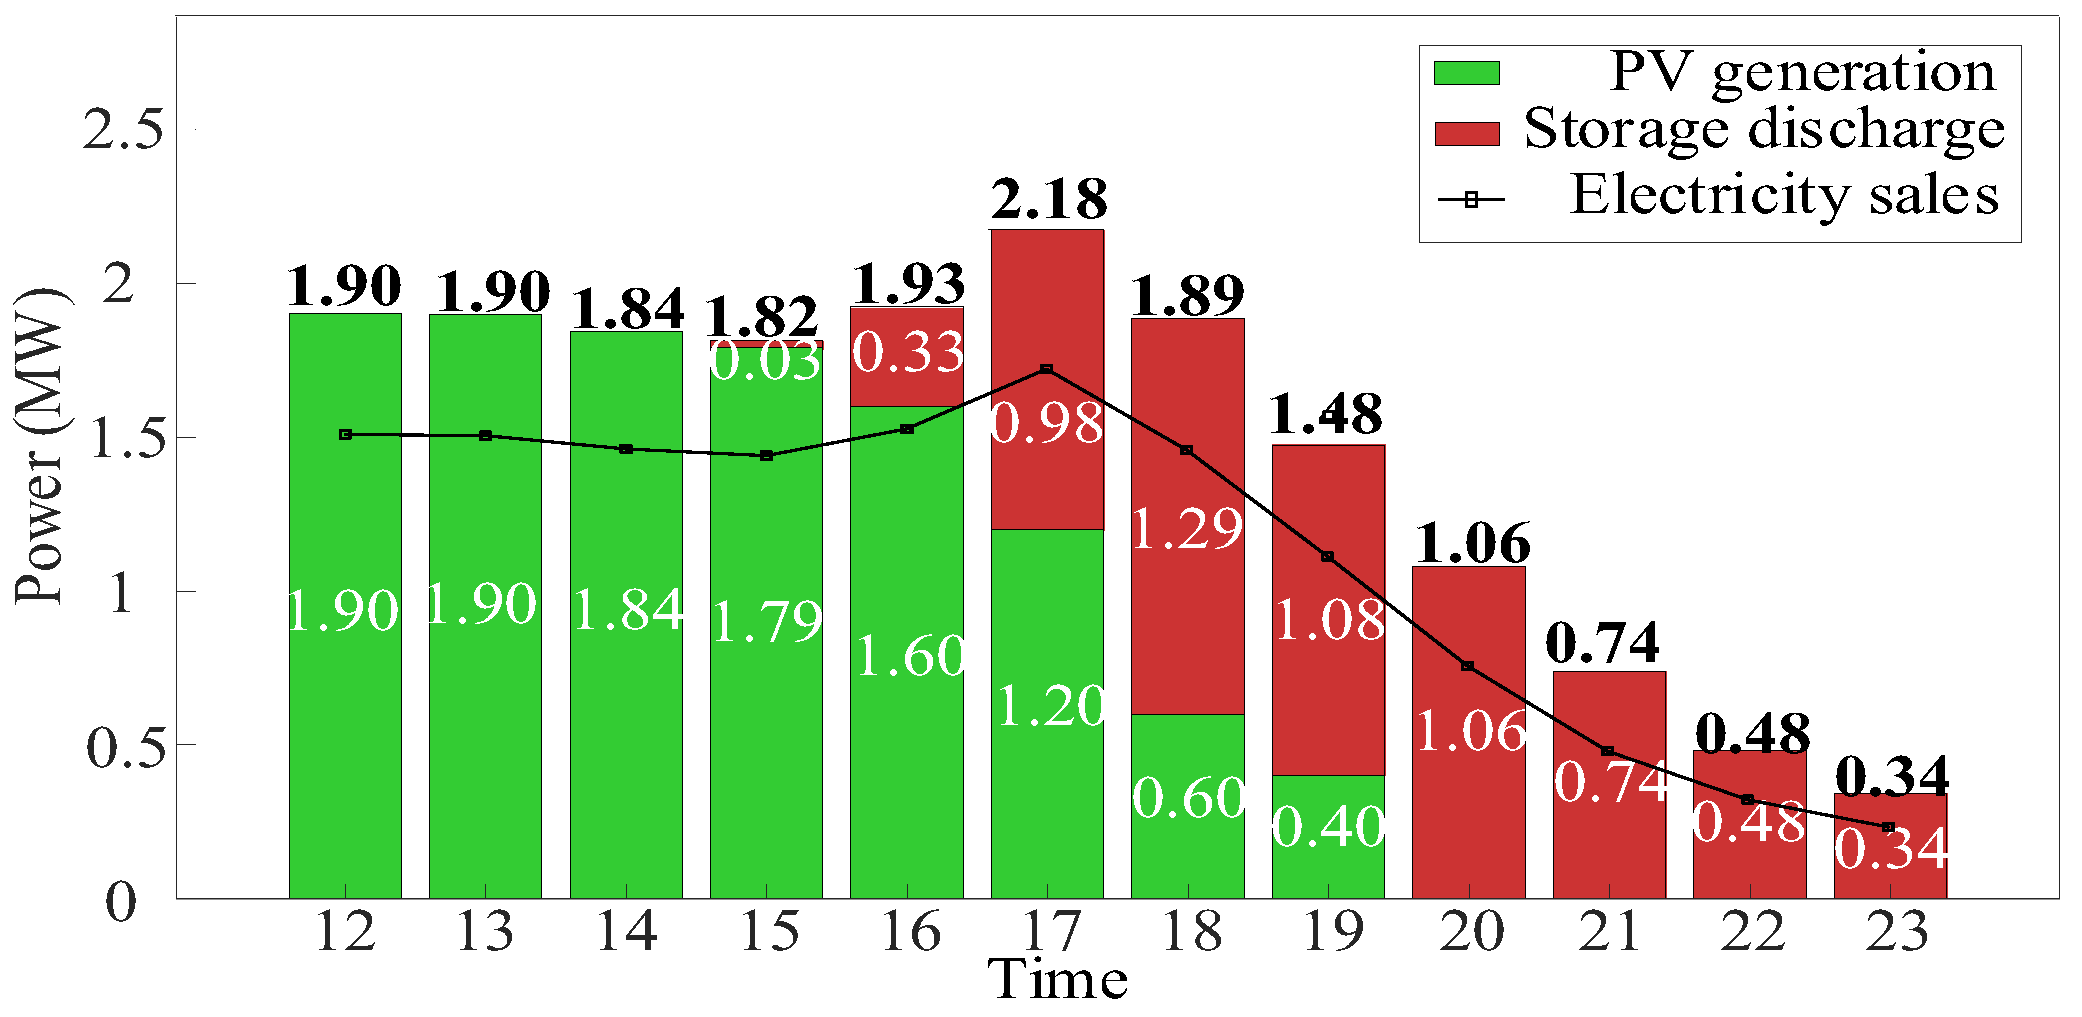
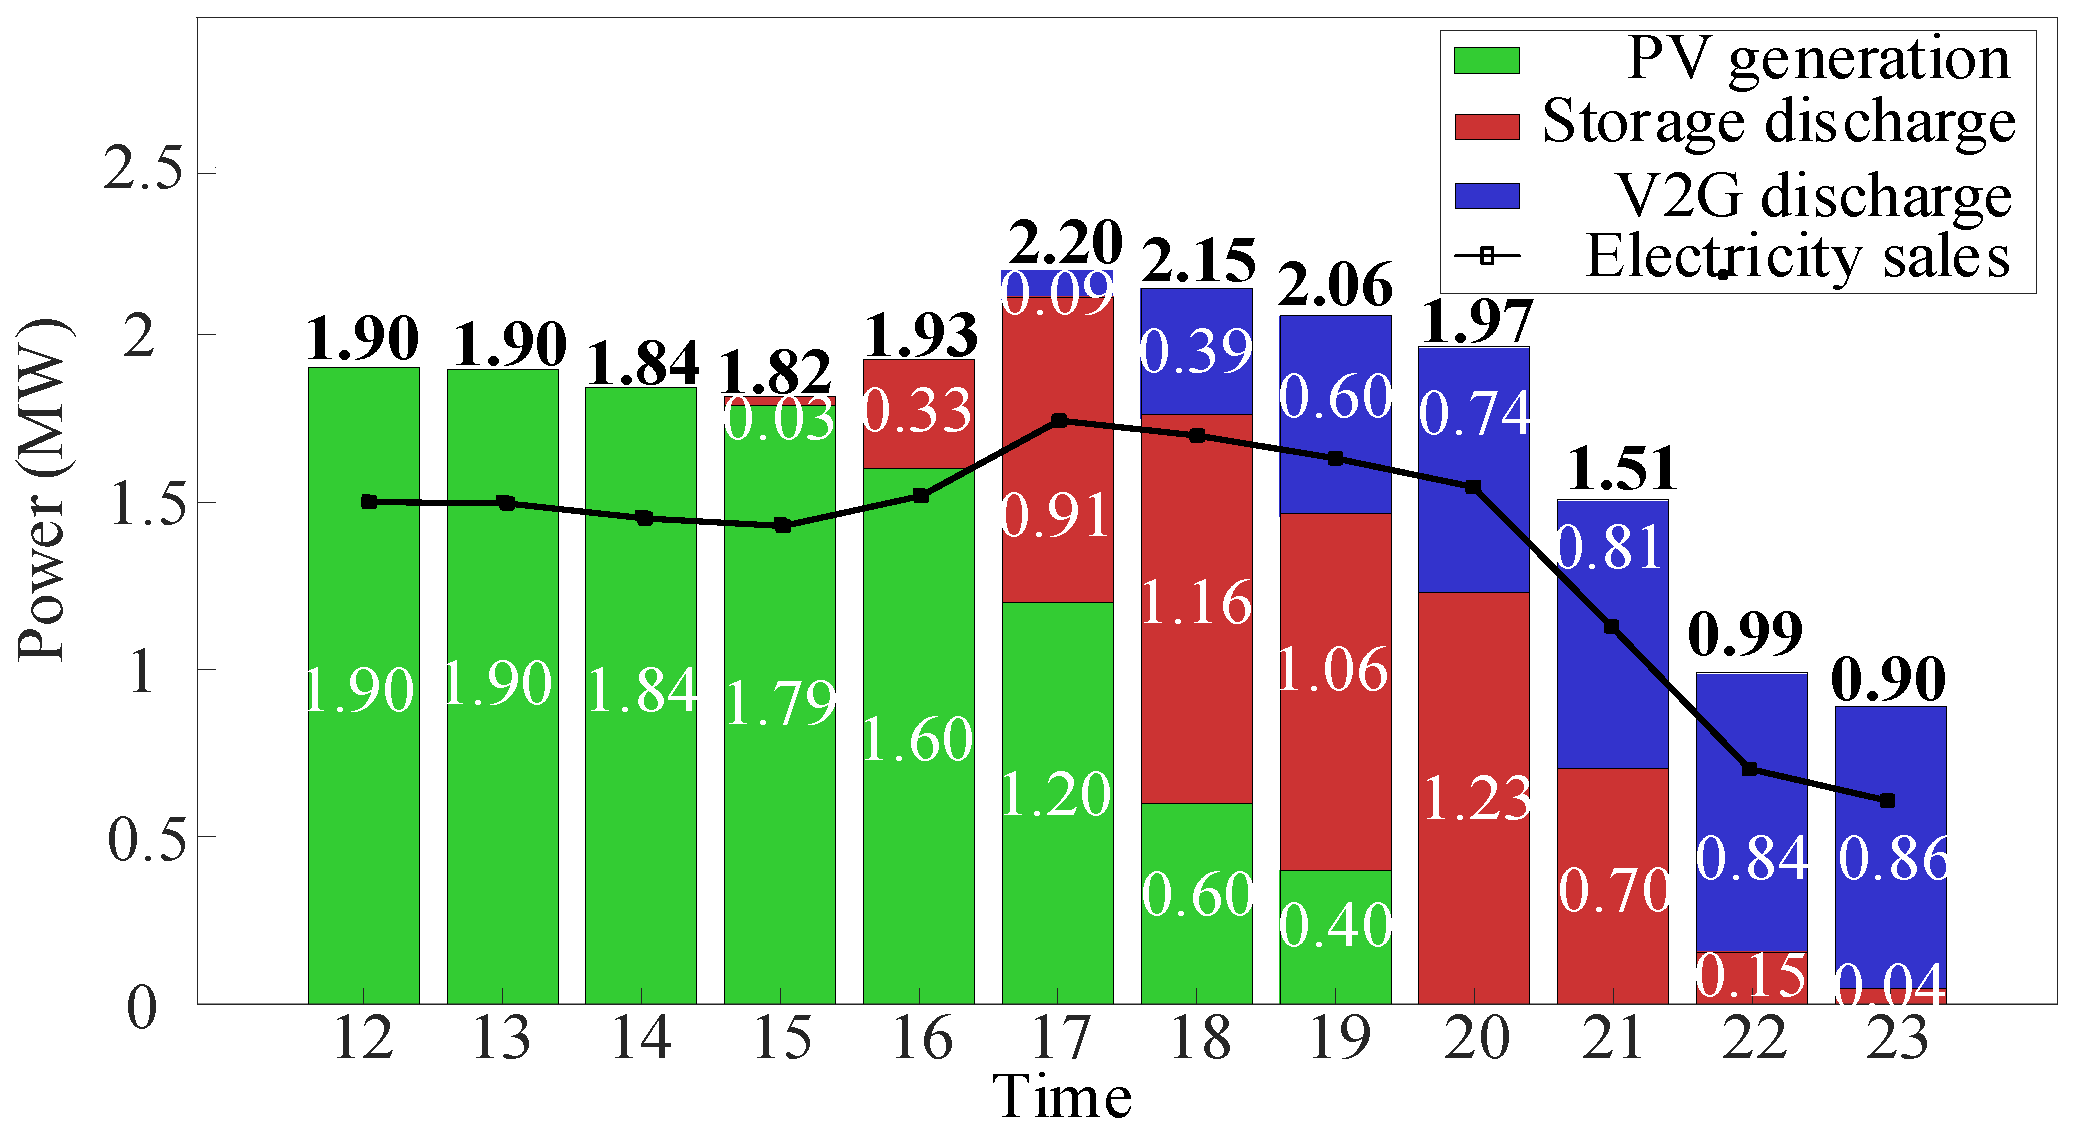
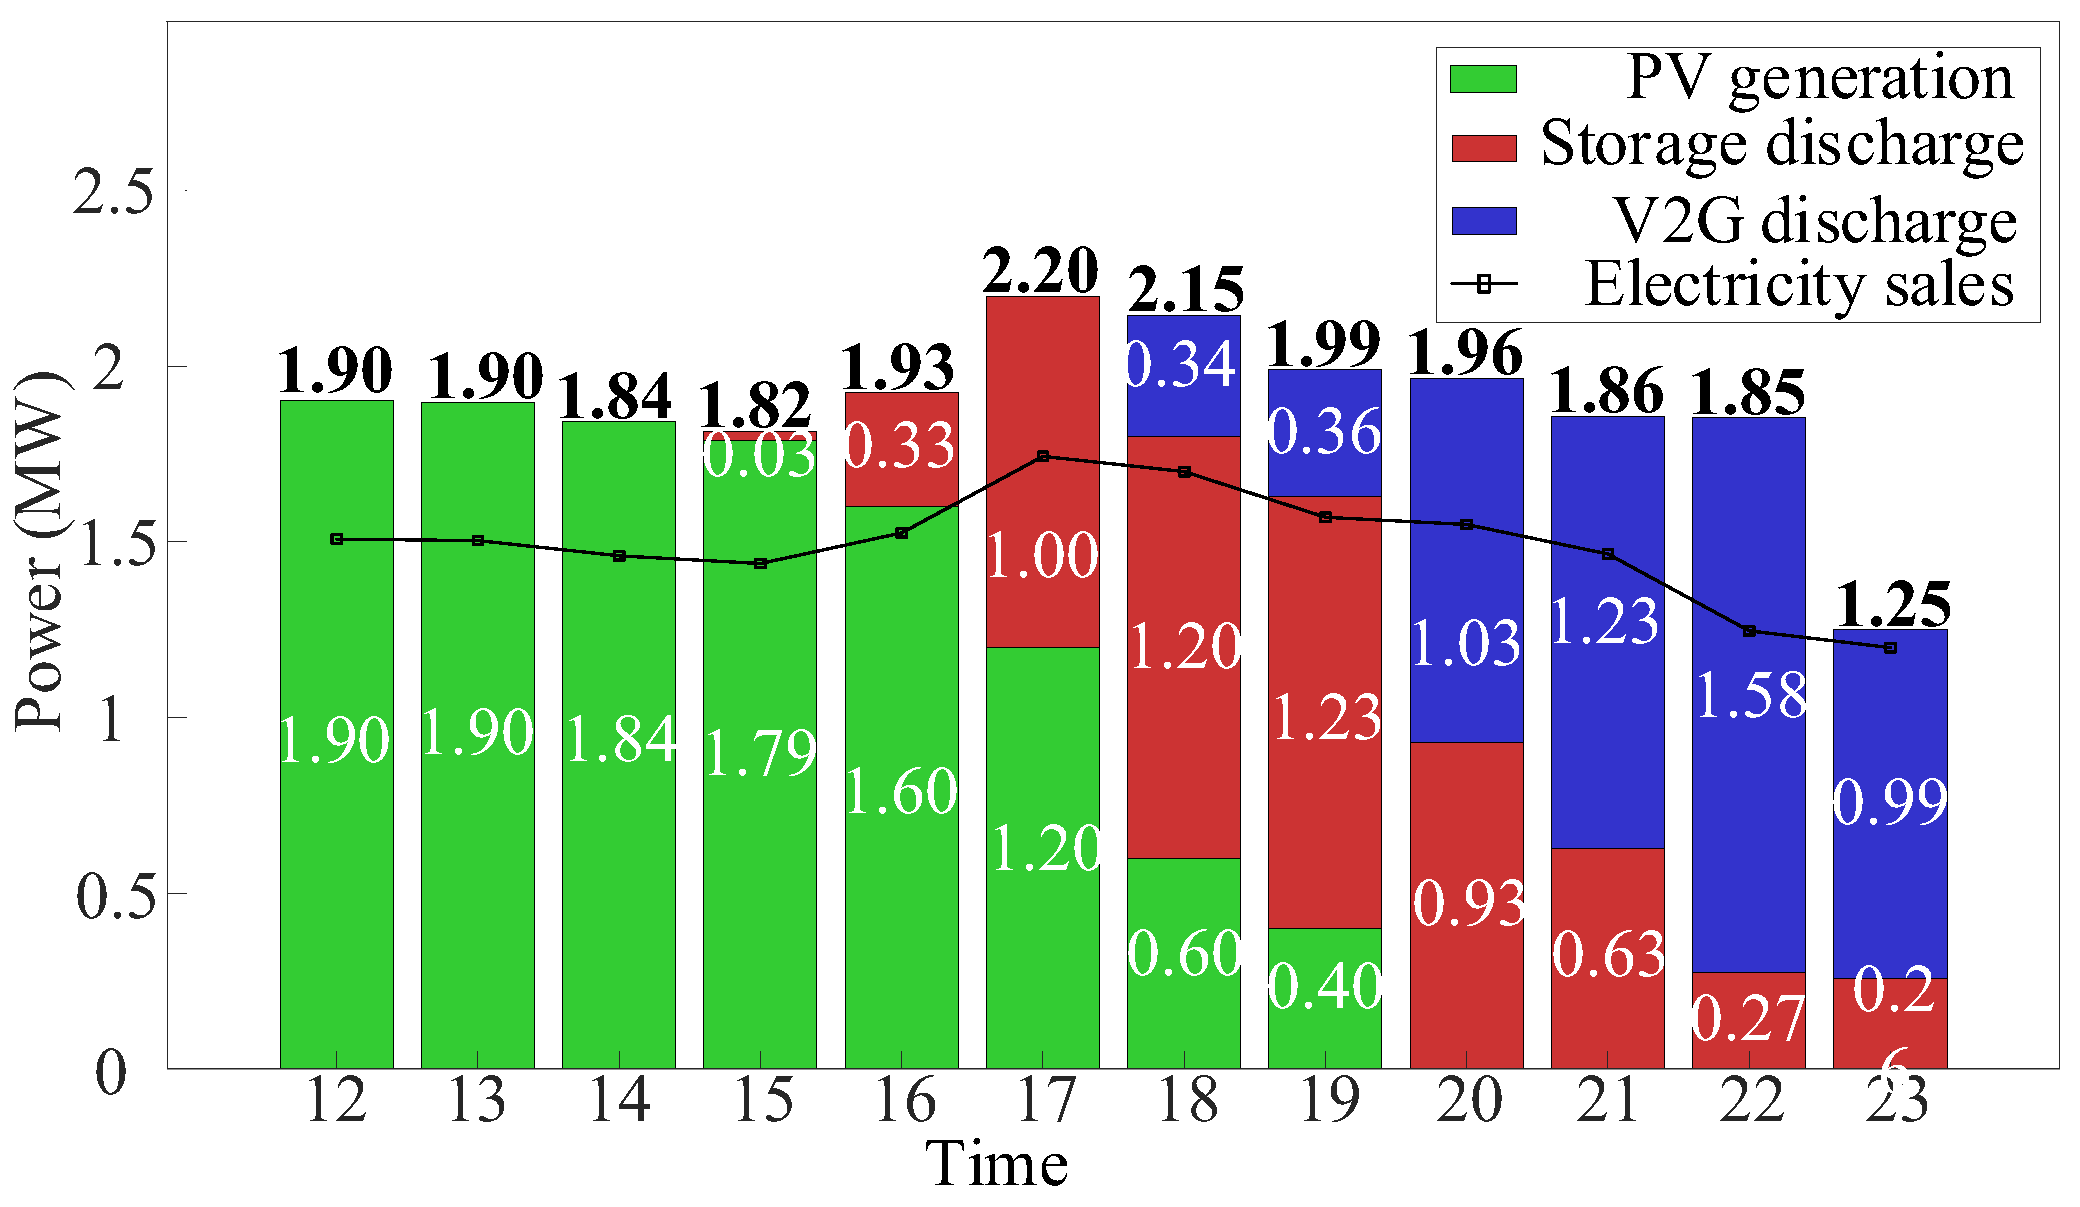
The resource scheduling under different schemes is shown in Table 2 and Figure 6, Figure 7 and Figure 8. The total resource output is the sum of PV, storage discharges, and V2G discharges, part of which is used to satisfy the PSCIS node’s own load, and the remaining part is sold to support other node loads on the island.
Scheme 1 lacks V2G support. At night, energy storage is the only dispatchable resource. To reduce load shedding, the storage has to discharge as much as possible, reaching 6.33 MWh, resulting in a total of 13.50 MWh in electricity sales. With the introduction of V2G in Scheme 2, the V2G discharge reaches 4.32 MWh, and electricity sales increase to 16.60 MWh. However, Scheme 2 adopts a centralized optimization framework and must bear the responsibility for future load shedding risks. Therefore, it has to reserve part of its storage capacity during dispatch, resulting in a reduction in storage discharge to 5.61 MWh and underutilization of its storage potential.
Scheme 3 generates time-varying electricity prices through the master–slave game model to guide resource output. Unlike traditional centralized optimization, the game framework assigns the load shedding risk entirely to the upper level, while the lower-level PSCIS aims only to maximize its own profits. Consequently, the lower level does not need to excessively and actively reserve storage for the future and actively discharges to generate profits, achieving a storage discharge of 5.87 MWh. When storage becomes scarce, the V2G incentive price increases to mobilize V2G supplementation, achieving a discharge of 5.55 MWh (28.5% higher than Scheme 2). The increased total resource output raises electricity sales to 17.92 MWh, an 8.0% improvement over Scheme 2. This indicates that the game mechanism releases the proactiveness of lower-level PSCIS through risk stratification, achieving coordinated resource optimization.
From a system-wide perspective, total system cost is defined as the sum of the lost load penalty, equipment O&M, and V2G incentive costs, plus the upper-tier power purchase cost and the lower-tier power sales revenue, which are internal transfers between the systems and are not included in the total system cost. The total cost and its composition under different schemes are shown in Table 3.
Scheme 1, lacking V2G support, incurs a high load shedding penalty of RMB 86,000.49, resulting in a total cost of RMB 86,766.46. Scheme 2, with the introduction of V2G, pays a V2G incentive cost of RMB 1522.32 but reduces the load shedding penalty to RMB 18,089.80, achieving a 76.6% reduction in total cost compared to Scheme 1.
In contrast, Scheme 3 optimizes resource allocation via a bilevel game model, thereby significantly enhancing power supply capacity. This reduces the load shedding penalty to RMB 3271.47. Although the combined O&M and V2G incentive costs amount to RMB 3841.18, the substantial reduction in load shedding costs brings the total cost down to RMB 7112.65, which is 65.0% lower than Scheme 2 and 91.8% lower than Scheme 1. It is evident that the proposed scheme significantly improves system economy while enhancing power supply capacity.

4.2.2. Comparative Analysis of System Reliability

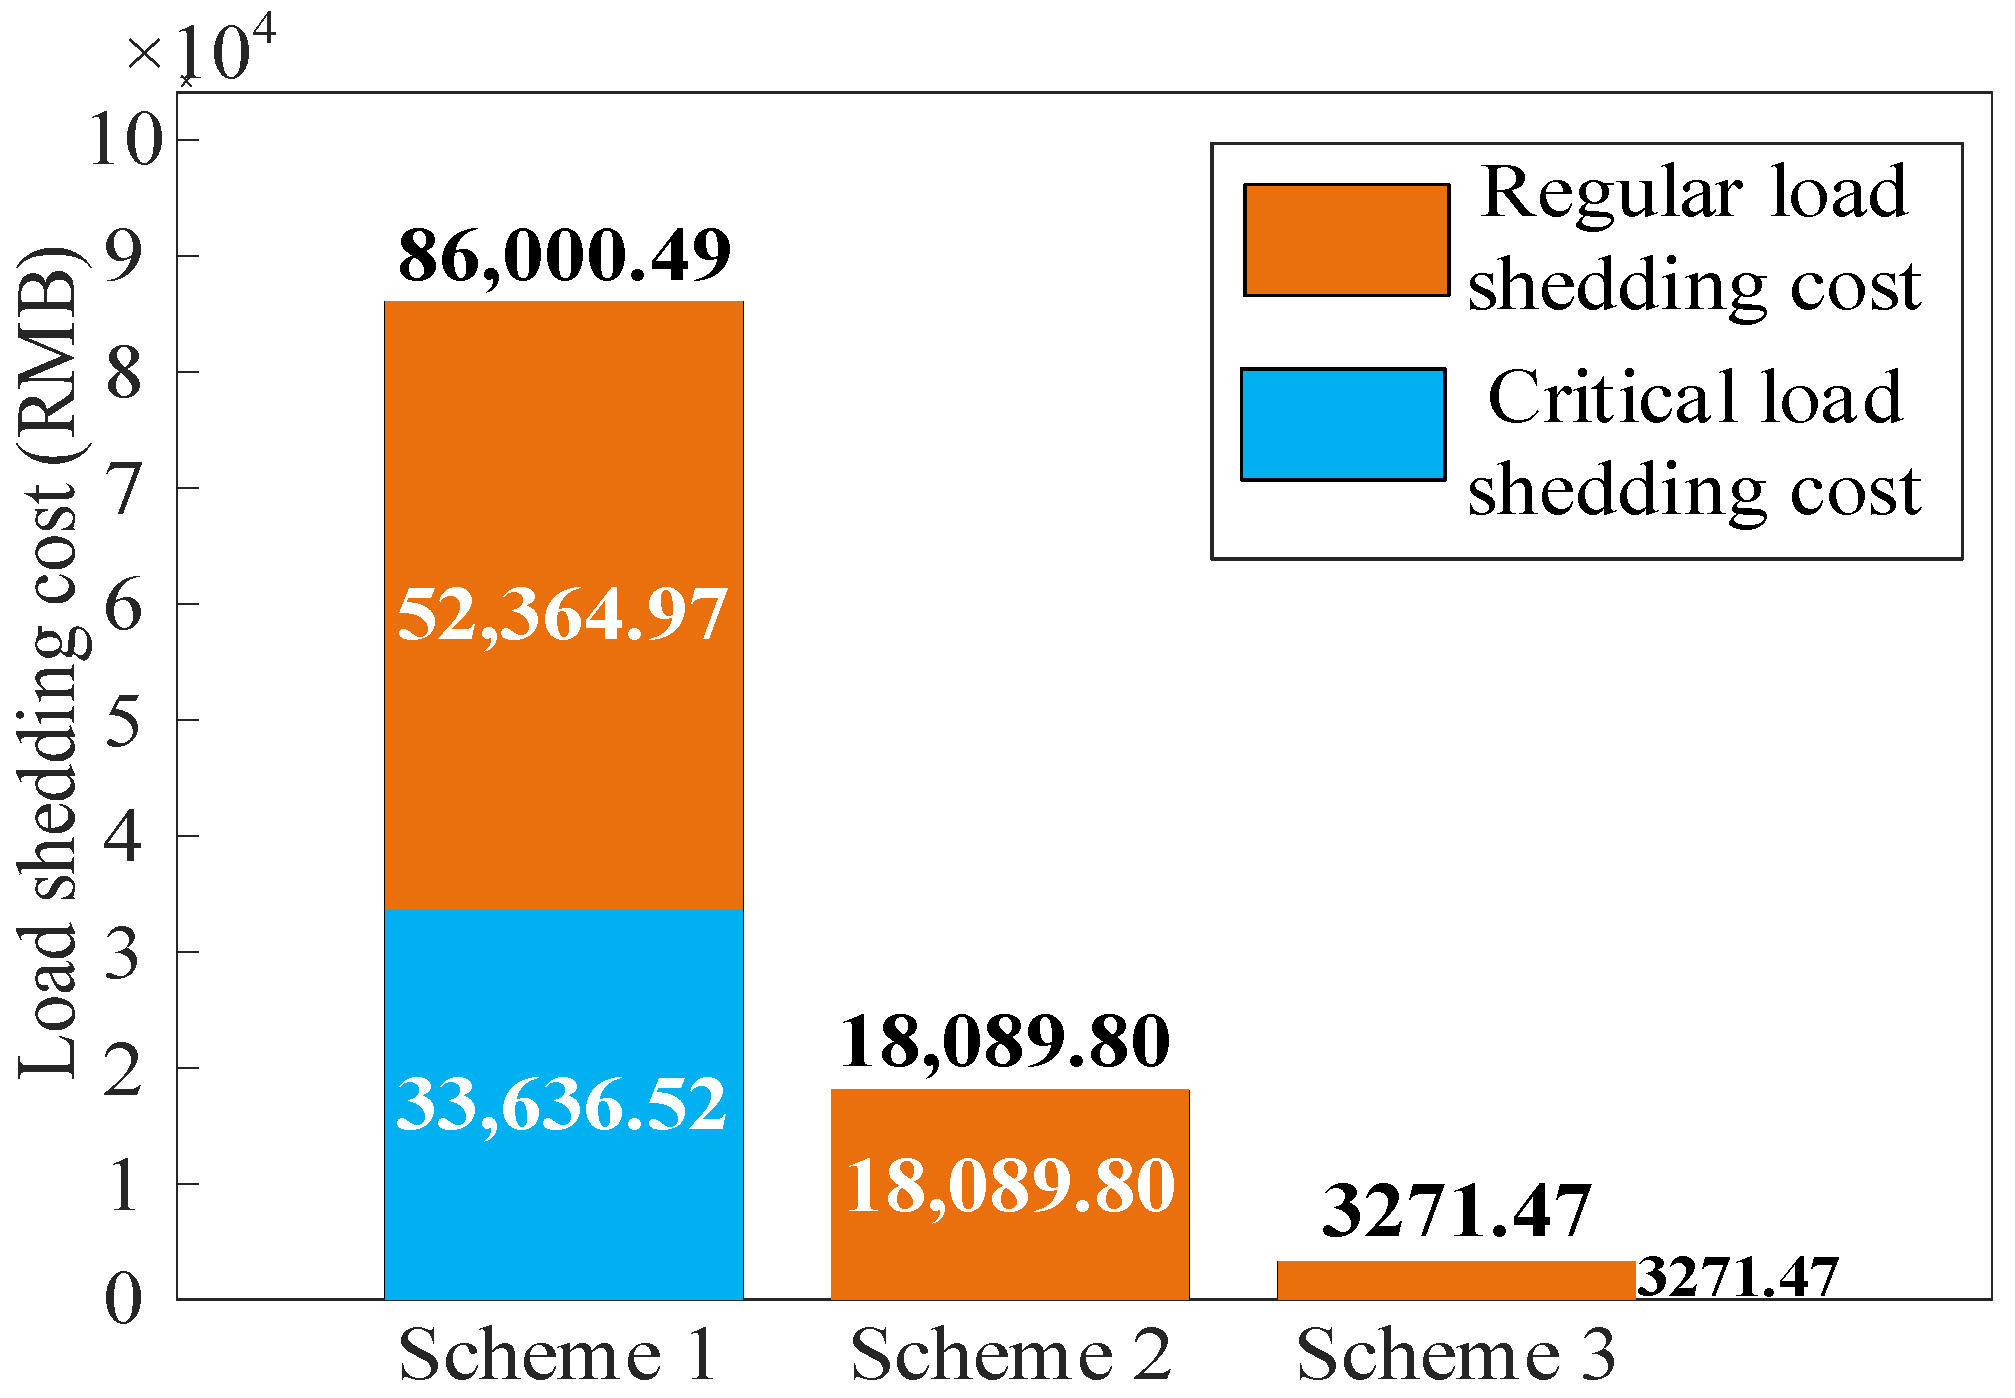
A comparison of the lost load costs for each scheme is shown in Figure 9.
In Scheme 1, without V2G support, the load shedding cost for critical loads reaches RMB 33,635.52, accounting for 39.1% of the total load shedding cost of RMB 86,000.49, indicating that a significant amount of critical load is shed. In Scheme 2, after introducing V2G, the load shedding cost for critical loads drops to 0, but regular loads still incur a load shedding cost of RMB 18,089.80. Scheme 3, using a bilevel game, enhances the system’s power supply capacity. While achieving zero load shedding for critical loads, it further reduces the load shedding cost for regular loads to RMB 3271.47, an 81.9% reduction compared to Scheme 2.
The results show that both Scheme 2 and Scheme 3 can ensure power supply for critical loads. However, Scheme 3, by coordinating resources through price signals, achieves the same level of critical load protection while significantly reducing the loss of regular loads, thereby synergistically improving both system reliability and economy.

4.2.3. Price Curve and Revenue Analysis of PSCIS

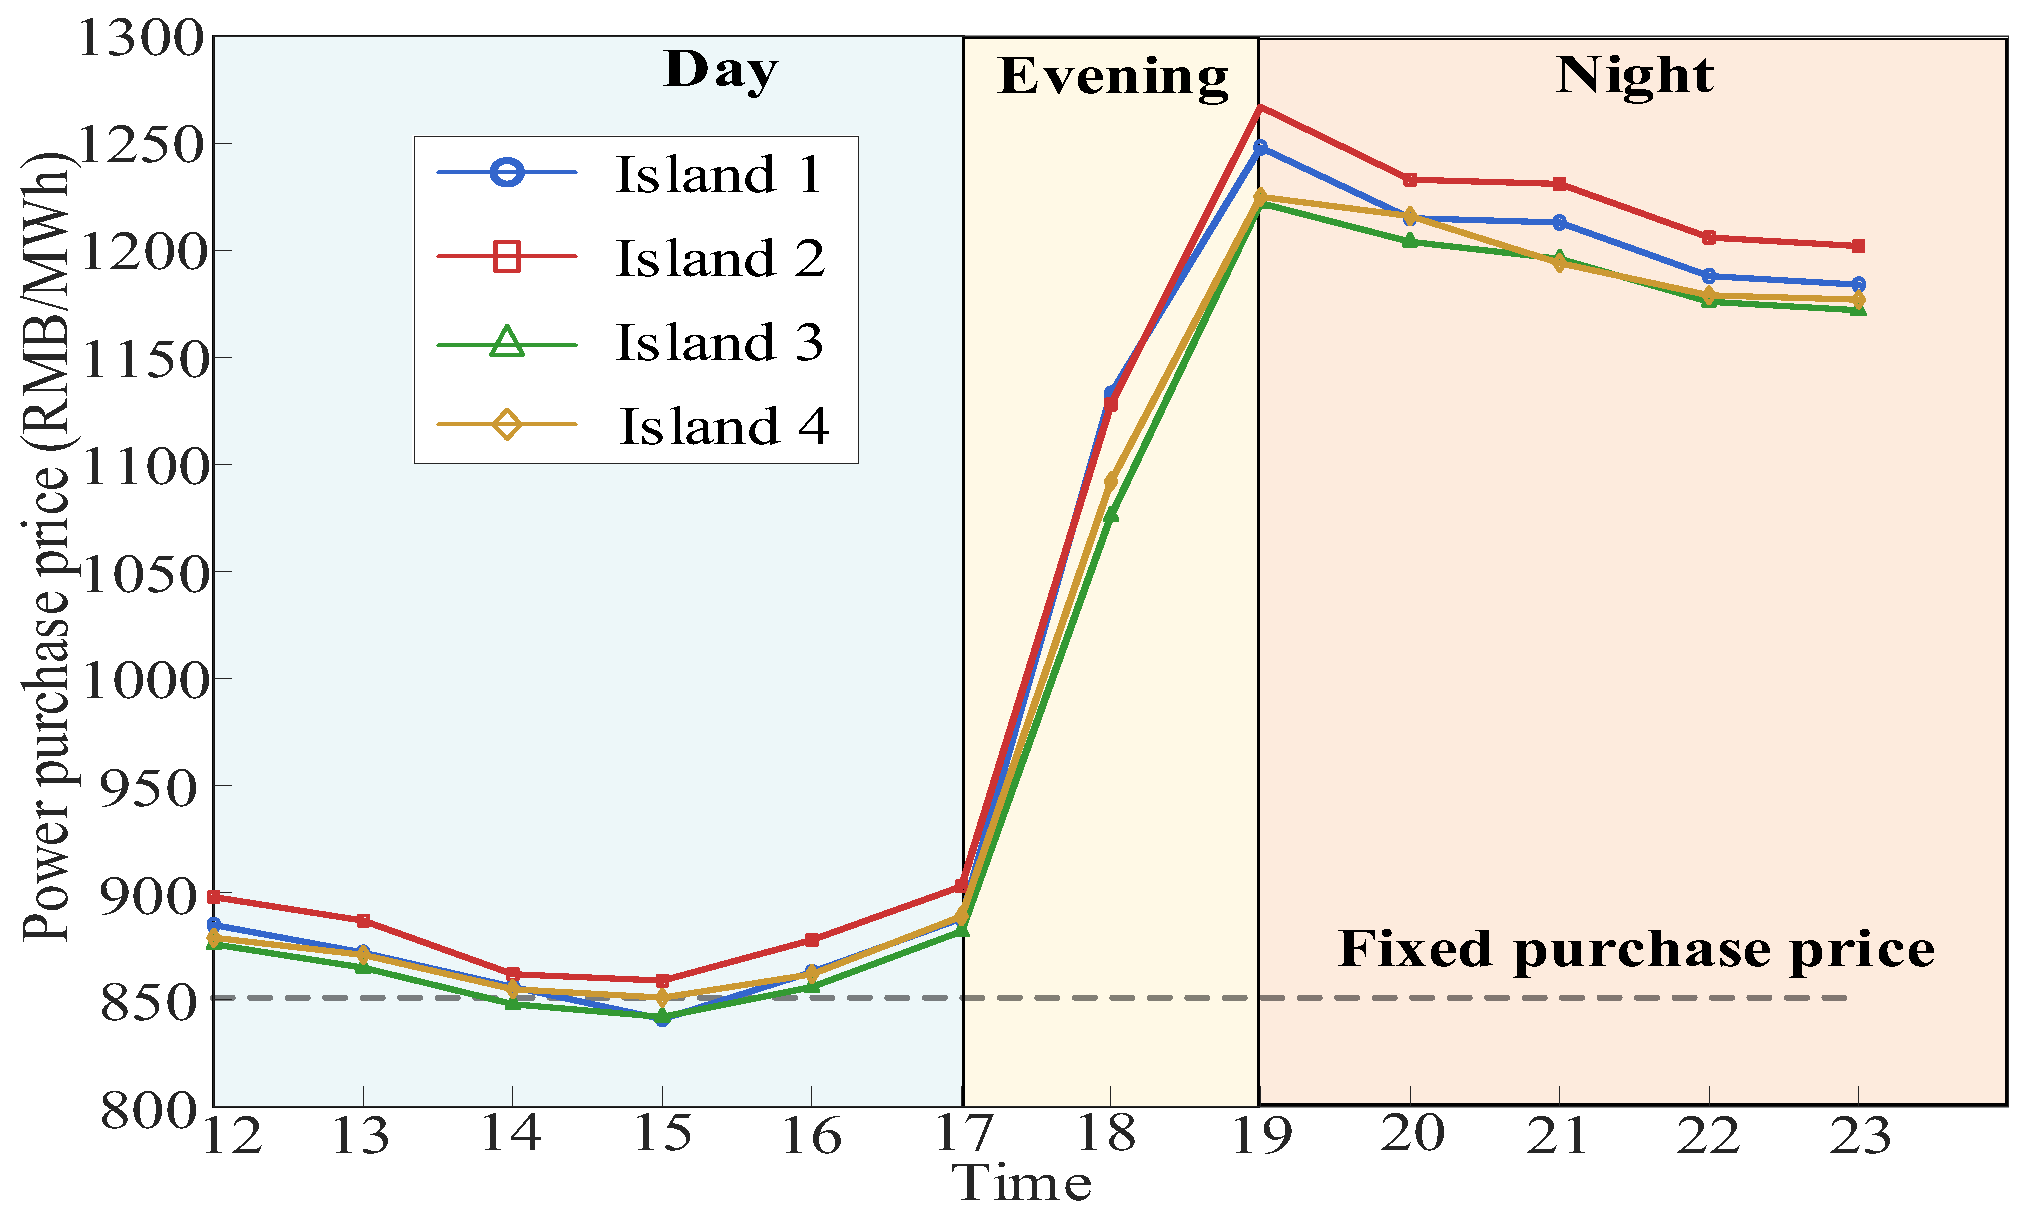
The power purchase prices offered by the distribution network to the PSCIS in Scheme 3 are shown in Figure 10. These prices, generated iteratively through the bilevel game, exhibit distinct time-varying characteristics. During the daytime (12:00–17:00), prices range from 841 to 903 RMB/MWh, fluctuating with reductions in afternoon PV output and load variations. In the evening, PV output drops sharply, driving prices to 1076–1133 RMB/MWh. During the nighttime (19:00–23:00), PV output is zero, and the storage SOC continuously declines, increasing resource scarcity. Prices further rise to 1162–1267 RMB/MWh, peaking at 19:00, then slightly decline as load decreases. Moreover, significant price differences exist among the islands, stemming from differences in load distributions and node voltage constraints within each island.
The above results show that the price signals generated by the proposed scheme can respond to real-time changes in system supply and demand, demonstrating the effectiveness of the game mechanism in price discovery and resource allocation.
For comparison, Schemes 1 and 2 adopt a fixed power purchase and sale price model based on industrial and commercial power consumption prices in typical areas, with RMB 850/MWh as the typical fixed power purchase price.
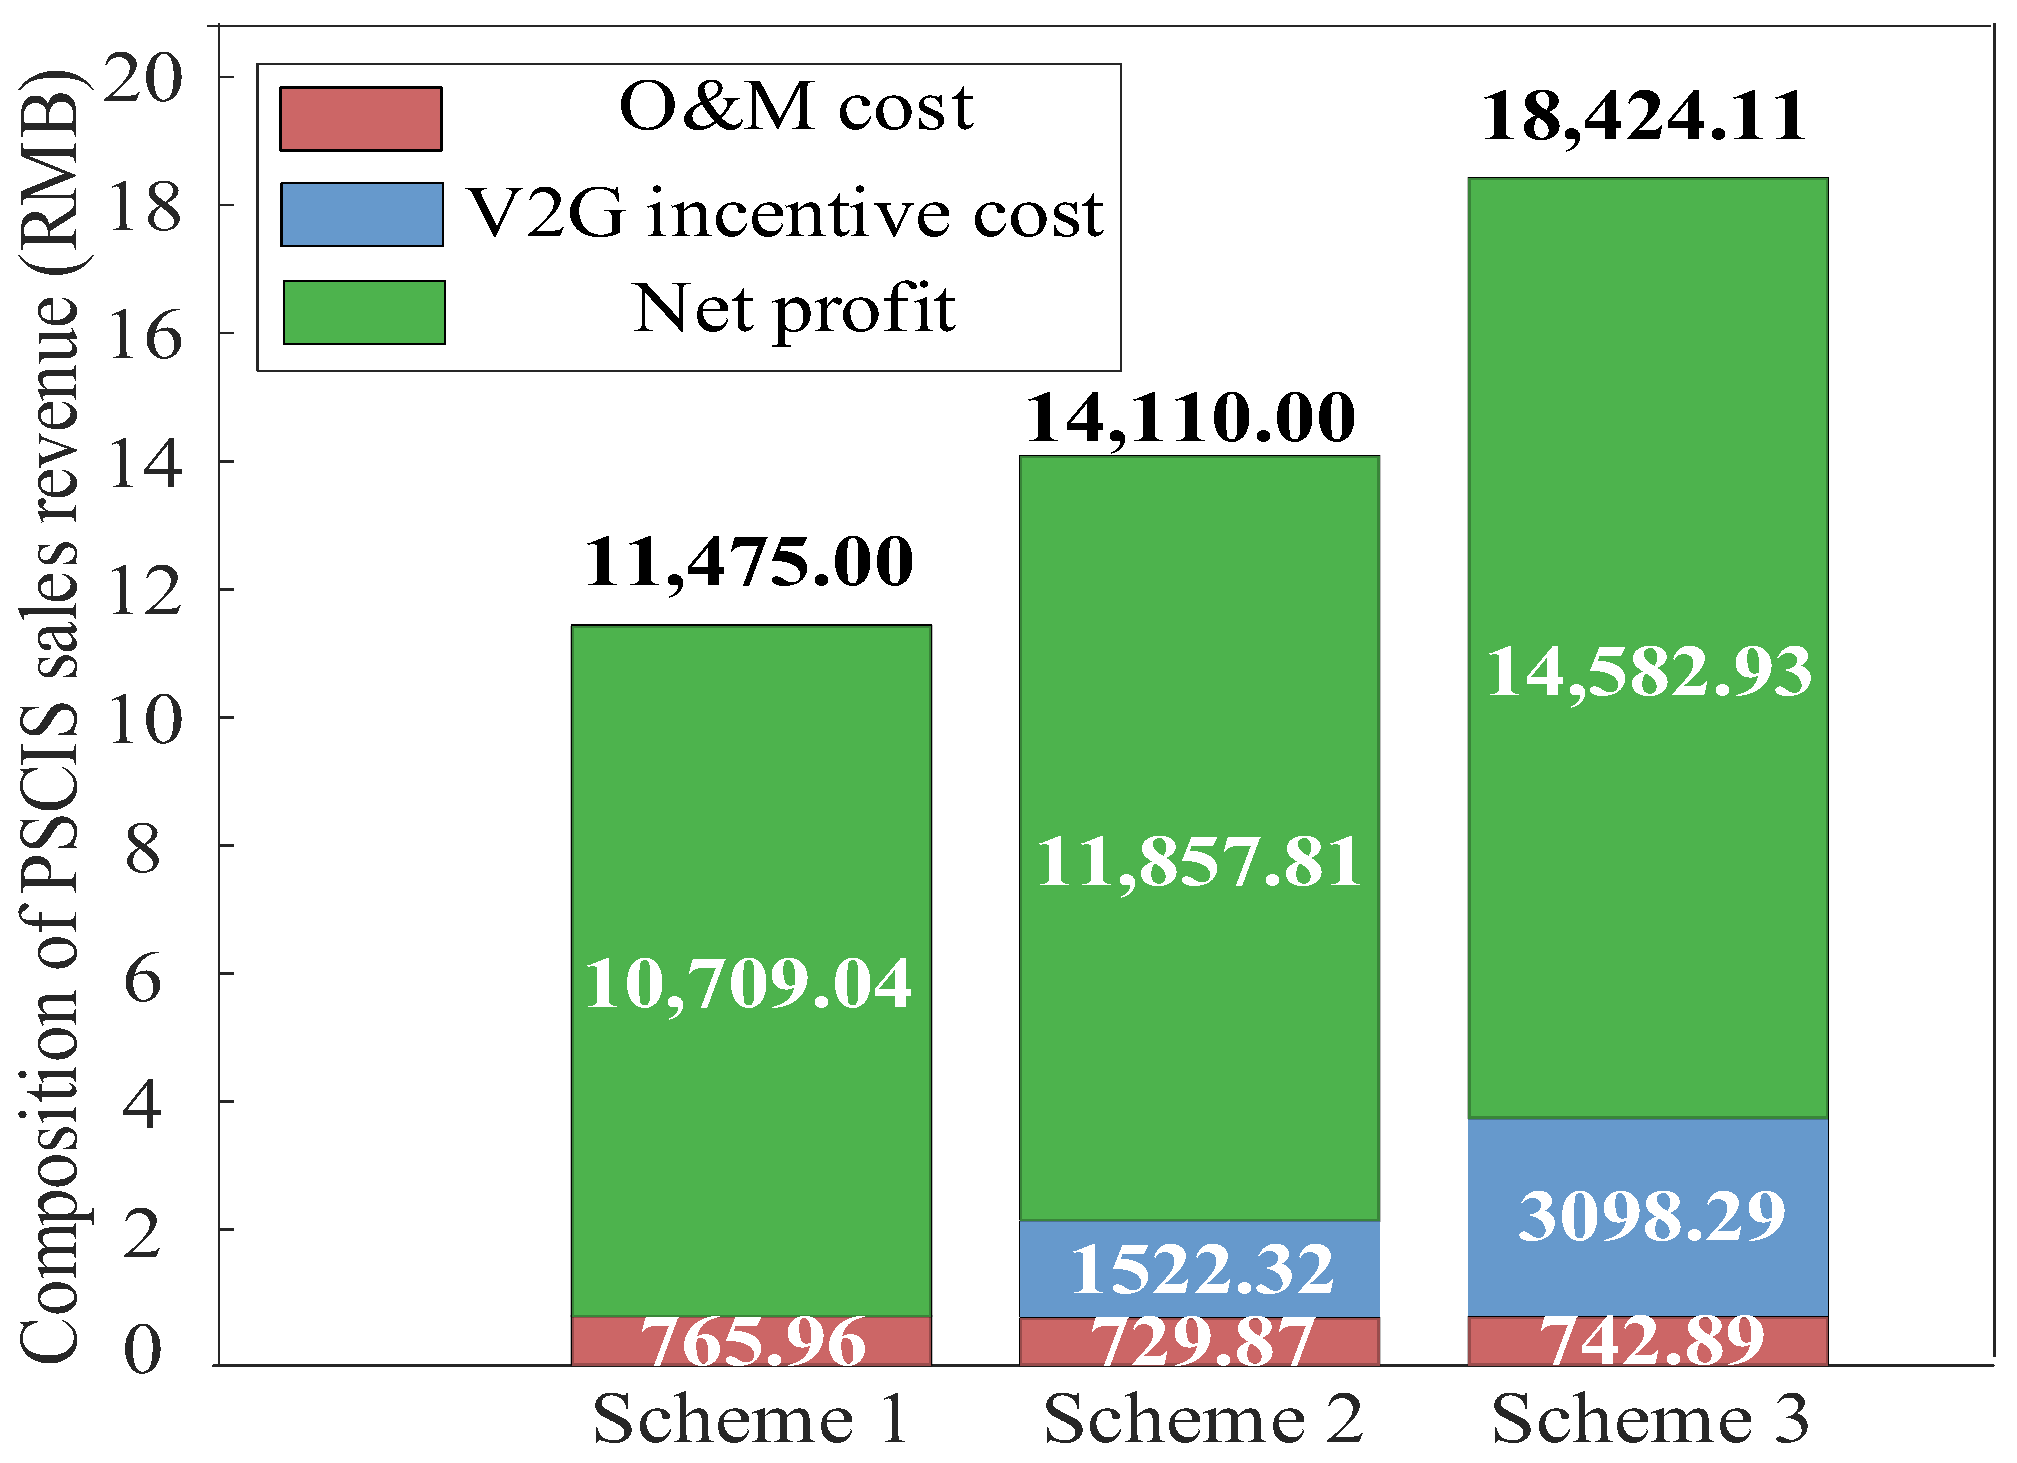
Furthermore, from the perspective of PSCIS profit, net profit is obtained by subtracting equipment O&M costs and V2G incentive costs from electricity sales revenue. The revenue comparison under different schemes is shown in Figure 11.
As shown in Figure 11, Scheme 1, using a fixed purchase price, generates electricity sales revenue of RMB 11,475.00 and, after deducting equipment costs of RMB 765.96, yields a net profit of RMB 10,709.04. Scheme 2, also with a fixed purchase price, achieves sales revenue of RMB 14,110.00 and a net profit of RMB 11,857.81. This indicates that the fixed-price model under centralized optimization cannot provide dynamic incentives for the PSCISs, and rigid price signals constrain their profits.
In contrast, Scheme 3 achieves dynamic pricing via a bilevel game, effectively incentivizing resource output and boosting electricity sales. Sales revenue reaches RMB 18,424.11, and net profit reaches RMB 14,582.93, representing increases of 36.2% and 23.0% compared to Scheme 1 and Scheme 2, respectively. This demonstrates that the time-varying prices generated by the proposed scheme not only guide the optimal allocation of lower-level resources but also provide significantly higher economic returns for the PSCISs, effectively motivating their active participation in grid interaction.

4.2.4. Comparative Analysis of the Effectiveness of V2G Resource Calls

This section further compares the two schemes of Scheme 2 with the V2G calls of Scheme 3, as shown in Table 4:
As shown in the table, the traditional centralized optimization scheme, by ignoring the actual willingness to respond of electric vehicle users, treats V2G as an ideally controllable power source, significantly overestimating its dispatchable capacity. The ideal optimization model for Scheme 2 does not account for EV users’ actual responses to incentive prices. Under the planned price sequence for this model, the V2G discharge reaches 9.02 MWh, and system load shedding is 0. However, when actual response constraints are introduced using the S-shaped response function from this paper under the same incentive price sequence, and the dispatch is re-optimized, the V2G discharge drops to 4.32 MWh, and the load shedding cost rises to RMB 18,089.80. This comparison shows that traditional centralized optimization exhibits a significant optimistic bias in estimating V2G dispatchable capacity by neglecting EVs’ charging willingness, posing a risk of substantial load shedding during actual operation.
Scheme 3 in this paper adopts a V2G response model based on a dual-factor S-shaped curve, dynamically adjusting incentive prices via a bilevel game to achieve better resource coordination under realistic response constraints. The average V2G procurement price in Scheme 3 rises to 558 RMB/MWh and the discharge reaches 5.55 MWh, a 28.5% increase compared to Scheme 2-Actual. Simultaneously, the dynamic price signals guide the PSCISs to prioritize calling on low-cost storage (discharge 5.87 MWh), reducing the load shedding cost to RMB 3271.47, an 81.9% decrease compared to Scheme 2-Actual.
The results demonstrate that the proposed scheme avoids the optimistic bias of traditional centralized optimization by accurately characterizing EV user response behavior. It precisely taps into the true regulation potential of V2G through price signals, achieving effective utilization of V2G resources and synergistic improvement in system benefits.

5. Conclusions

In this paper, we propose a master–slave game-based bilevel optimization strategy for a distribution network–PSCIS to address the problems of neglecting the actual response of electric vehicle users under faulty conditions, the absence of a game of interests between the distribution grid and the PSCIS, and the urgent need to improve reliability. The following conclusions are obtained through the analysis of arithmetic examples:
  • The bilevel game mechanism significantly improves system economy. The proposed scheme guides resource output through dynamic pricing by the distribution network and releases the potential of lower-level resources through risk stratification, increasing total electricity sales to 17.92 MWh. Resource optimization reduces the total system cost by 91.8% compared to the scheme without V2G and by 65.0% compared to the traditional centralized optimization scheme, significantly enhancing system economy.
  • Dynamic pricing, considering actual EV response, mitigates the reliability risks of traditional optimization. Traditional centralized optimization, which ignores EV user response, overestimates V2G dispatchable capacity by up to 8.02 MWh, leading to overly optimistic estimates of supply capability and potentially causing load shedding. The proposed scheme, adopting a dual-factor S-shaped response model, achieves a V2G discharge of 5.55 MWh under realistic response constraints. While achieving zero load shedding for critical loads, it reduces the cost of load shedding by 81.9% compared to the traditional centralized optimization scheme, significantly improving power supply reliability under fault conditions.
  • Price signals effectively incentivize active participation from PSCISs, achieving a win-win situation for multiple parties. The proposed scheme yields a net profit of RMB 14,582.93 for the PSCIS, which is 1.36 times that of the scheme without V2G and 1.23 times that of the traditional centralized optimization scheme, effectively stimulating the market entities’ initiative to participate in grid interaction.
Future research will extend the current work in the following aspects:
  • Communication resilience: Investigate local autonomous decision mechanisms for PSCISs to operate when communication fails.
  • User behavior uncertainty: Introduce stochastic or robust modeling of EV user behavior under extreme irrational responses.
  • Multi-follower game: Extend the lower-level model to a multi-follower game for islands with multiple competing PSCISs.
  • Battery degradation: Incorporate detailed degradation cost modeling for V2G to refine profit calculations.
These extensions will further enhance the engineering applicability of the proposed strategy.

Author Contributions

Z.L. and J.Z. conceptualized the idea of this research project. Z.L. and J.Z. developed the mathematical model. J.Z. conducted the simulation and case validation. Z.L., J.Z. and X.W. contributed to the writing and review of the manuscript. All authors have read and agreed to the published version of the manuscript.

Funding

This research was funded by the Hunan Provincial Natural Science Foundation of China (grant number 2025JJ50232) and the Scientific Research Key Program of the Hunan Provincial Education Department (grant number 24A0404).

Data Availability Statement

The original contributions presented in this study are included in the article. Further inquiries can be directed to the corresponding author.

Acknowledgments

The funding support for our work is greatly appreciated.

Conflicts of Interest

The authors declare no conflicts of interest.

Abbreviations

The following abbreviations are used in this manuscript:
PSCISPhotovoltaic-Storage-Charging Integrated Station
EVElectric vehicle
V2GVehicle-to-Grid
MPCModel Predictive Control

References

  1. Gielen, D.; Boshell, F.; Saygin, D.; Bazilian, M.D.; Wagner, N.; Gorini, R. The role of renewable energy in the global energy transformation. Energy Strategy Rev. 2019, 24, 38–50. [Google Scholar] [CrossRef]
  2. Mahla, R.; Garg, M.M. Introduction to high renewable energy penetration in utility grid. In Renewable Energy Integration in Utility Grids; Elsevier: Amsterdam, The Netherlands, 2025; pp. 3–16. [Google Scholar]
  3. Almazroui, A.; Mohagheghi, S. Probabilistic analysis of power system performance under high PV and EV penetration. In Proceedings of the 2025 IEEE Green Technologies Conference (GreenTech), Wichita, KS, USA, 30 April 2025; pp. 1–5. [Google Scholar]
  4. Li, J.; Guo, Q.; Wang, X.; Tu, C.; Xiao, F.; Hou, Y.; Shen, X. Parallel-execute-based real-time energy management strategy for FTPSS integrated PV and ESS. Appl. Energy 2025, 385, 125538. [Google Scholar] [CrossRef]
  5. Yoon, M.; Zhang, X.; Choi, S. Strategic intentional islanding method considering temporary overvoltage in disaster situations. Int. J. Electr. Power Energy Syst. 2025, 165, 110488. [Google Scholar] [CrossRef]
  6. Hull, C.; Wust, J.; Booysen, M.J.; McCulloch, M.D. Techno-economic optimization and assessment of solar-battery charging station under grid constraints with varying levels of fleet EV penetration. Appl. Energy 2024, 374, 123990. [Google Scholar] [CrossRef]
  7. Sun, W.; Wang, Y.; Hao, Y.; Alharthi, Y.Z.; Wang, Y. A resilience-oriented optimization framework for smart grid operation and recovery before, during, and after natural disasters. Appl. Energy 2025, 398, 126414. [Google Scholar] [CrossRef]
  8. Chen, Z.; Wang, X.; Guo, Q.; Tu, C.; Xiao, F.; Li, J. Flexible reconfiguration strategy for novel advanced traction power supply equipment under fault conditions. IEEE Trans. Transp. Electrif. 2026. early access. [Google Scholar] [CrossRef]
  9. Seif, A.; Radmanesh, H. Flexible improvement in distribution network under intelligent automation system. In Proceedings of the 2025 Fifth National and the First International Conference on Applied Research in Electrical Engineering (AREE), Ahvaz, Iran, 4–5 February 2025; pp. 1–6. [Google Scholar]
  10. Wang, J.; Li, M.; Yin, D.; Ouyang, J. Fault recovery strategy of distribution network considering active participation of photovoltaic-storage-charging integrated station under extreme weather disasters. Sustain. Energy Grids Netw. 2024, 40, 101586. [Google Scholar] [CrossRef]
  11. Ma, Z.; Zhang, L.; Cai, Y.; Tang, W.; Long, C. Allocation method of coupled PV-energy storage-charging station in hybrid AC/DC distribution networks balanced with economics and resilience. IET Renew. Power Gener. 2024, 18, 1060–1071. [Google Scholar] [CrossRef]
  12. Yang, M.; Shen, C.; Zhang, Y. Load restoration of distribution network with solar-storage-charging stations integration. In Proceedings of the 2024 IEEE 8th Conference on Energy Internet and Energy System Integration (EI2), Shenyang, China, 29 November 2024–2 December 2024; pp. 4218–4222. [Google Scholar]
  13. Liang, Z.F.; Qi, F.R.; Wang, D.Y.; Wang, X.W. Configuration of optical storage & charging and discharging power station considering emergency power function. Power Syst. Technol. 2023, 47, 3376–3384. [Google Scholar]
  14. Wang, X.; Chen, X.F.; Ding, L.; Tse, C.K.; Hui, S.Y.R. Constant output voltage three-phase capacitive-power-transfer converters with phase expansion and design methods. IEEE Trans. Power Electron. 2026. early access. [Google Scholar] [CrossRef]
  15. Du, Y.; Zhang, J.; Chen, Y.; Liu, Z.; Zhang, H.; Ji, H.; Wang, C.; Yan, J. Impact of electric vehicles on post-disaster power supply restoration of urban distribution systems. Appl. Energy 2025, 383, 125302. [Google Scholar] [CrossRef]
  16. Kong, L.; Zhang, H.; Xie, D.; Dai, N. Leveraging electric vehicles to enhance resilience of interconnected power-transportation system under natural hazards. IEEE Trans. Transp. Electrif. 2025, 11, 1126–1140. [Google Scholar] [CrossRef]
  17. Yun, S.; Woo, J.R.; Kwak, K. Unlocking peak shaving: How EV driver heterogeneity shapes V2G potential. Energy 2025, 329, 136773. [Google Scholar] [CrossRef]
  18. Liu, Z.; Wu, J.; Zhu, R.; Kong, D.; Guo, H. Double layers optimal scheduling of distribution networks and photovoltaic charging and storage station cluster based on leader follower game theory. Sci. Rep. 2025, 15, 612. [Google Scholar] [CrossRef] [PubMed]
  19. Wang, Y.; Wang, X.; Ma, L.; Luo, H.; Yuan, B.; Qin, Q.; Yang, C.; Zhou, Y.; Xu, Y. Aggregator-electric vehicle day-ahead trading mechanism and scheduling strategy based on master-slave game. In Proceedings of the2025 8th Asia Conference on Energy and Electrical Engineering (ACEEE), Qingdao, China, 25–27 July 2025; pp. 293–298. [Google Scholar]
  20. Wu, D.; Zhong, D.; Li, L. Coordination mechanism between electric vehicles and air conditioning loads based on price guidance. Energies 2025, 18, 5984. [Google Scholar] [CrossRef]
  21. Zhang, Y.; Zhou, D.; Lin, B. Paving the way for sustainable energy solutions: A real-time pricing mechanism in integrated energy systems with electric vehicles. Renew. Energy 2026, 256, 124656. [Google Scholar] [CrossRef]
  22. Sun, Y.; Wang, W.; Bao, L.; Pei, Z.; Liu, C.; Zhao, Z.; Wang, J. Real-time control based on power hierarchy for photovoltaic-storage-charging distribution substation. J. Electr. Eng. 2025, 20, 250–258. [Google Scholar]
  23. Chen, Q.; Wang, W.Q.; Wang, H.Y.; Dong, Y.C.; He, S. Information gap-based coordination scheme for active distribution network considering charging/discharging optimization for electric vehicles and demand response. Int. J. Electr. Power Energy Syst. 2023, 145, 108652. [Google Scholar] [CrossRef]
Figure 1. Schematic diagram of the structure of the PSCIS.
Energies 19 01922 g001
Figure 2. The bilevel optimization framework based on the master–slave game.
Energies 19 01922 g002
Figure 3. Rolling optimization framework.
Energies 19 01922 g003
Figure 4. Schematic diagram of the improved IEEE33 node distribution network.
Energies 19 01922 g004
Figure 5. Load demand of the distribution network under extreme disaster scenarios.
Energies 19 01922 g005
Figure 6. Resource utilization and electricity sales in Scheme 1. Black numbers above the bars indicate the total value of the stacked bar, while white numbers inside the bars indicate the value of each component.
Energies 19 01922 g006
Figure 7. Resource utilization and electricity sales in Scheme 2. Black numbers above the bars indicate the total value of the stacked bar, while white numbers inside the bars indicate the value of each component.
Energies 19 01922 g007
Figure 8. Resource utilization and electricity sales in Scheme 3. Black numbers above the bars indicate the total value of the stacked bar, while white numbers inside the bars indicate the value of each component.
Energies 19 01922 g008
Figure 9. Comparison chart of load loss costs under different schemes. Black numbers above the bars indicate the total value of the stacked bar, while white numbers inside the bars indicate the value of each component.
Energies 19 01922 g009
Figure 10. Schematic diagram of electricity purchase and sale prices for each island in Scheme 3.
Energies 19 01922 g010
Figure 11. Revenue comparison diagram of PSCIS under different schemes. Black numbers above the bars indicate the total value of the stacked bar, while white numbers inside the bars indicate the value of each component.
Energies 19 01922 g011
Table 1. The basic parameters.
CategoryParameterValue
Energy StorageStorage capacity (kWh)2500
Storage charging/discharging efficiency0.95
Storage rated power (kW)500
Storage unit O&M cost (RMB/kWh)0.05
Initial state of charge for fault operation0.9
Storage state of charge limits[0.1, 0.9]
Electric Vehicle ClusterNumber of EVs per island200
Single EV battery capacity (kWh)60
Single EV V2G Power (kW)7
V2G charging/discharging efficiency0.95
EV SOC limits[0.1, 0.9]
Incentive price inflection point (c0)500
Price sensitivity (α)0.005
SOC discharge inflection point (SOC0)0.5
SOC curve steepness coefficient (β)15
PVPV installed capacity (kW)2500
PV unit O&M cost (RMB/kW)0.04
Rolling OptimizationPrediction horizon length (h)4
Table 2. Resource utilization in different schemes (MWh).
Schemes123
PV Generation11.2311.2311.23
Storage Discharge6.335.615.87
V2G Discharge-4.335.55
PSCIS Node Own Load 14.064.564.73
Electricity Sales13.5016.6017.92
1 The differences in PSCIS node own load across schemes arise from varying load shedding rates; the lower the load shedding rate, the higher the actual node load.
Table 3. Total system cost in different schemes (RMB).
SchemesLoad Shedding CostO&M CostV2G Incentive CostTotal Cost
186,000.49765.96-86,766.46
218,089.80729.871522.3220,341.99
33271.47742.893098.297112.65
Table 4. V2G utilization under different schemes.
SchemesAverage Incentive Price (RMB/MWh)V2G Discharge (MWh)Load Shedding Cost (RMB)
2 (Ideal)3209.020
2 (Actual)3204.3218,089.80
35585.553271.47
Disclaimer/Publisher’s Note: The statements, opinions and data contained in all publications are solely those of the individual author(s) and contributor(s) and not of MDPI and/or the editor(s). MDPI and/or the editor(s) disclaim responsibility for any injury to people or property resulting from any ideas, methods, instructions or products referred to in the content.