1. Introduction
With the rapid development of economy and the continuous improvement of electrification, the demand for electricity has exhibited a rapid growth trend. High-voltage cross-linked polyethylene (XLPE) cables have become the primary choice in urban power transmission projects due to their excellent performance [
1,
2,
3]. Although the corrugated aluminum sheath combined with the water-blocking buffer layer wrapping tape in the cable can mitigate electric field distortion and provide longitudinal water-blocking functionality, buffer layer ablation has led to multiple cable failures in recent years, even posing a serious threat to the safe operation of power systems [
4,
5,
6]. Therefore, investigating buffer layer ablation is of significant engineering importance.
Extensive research has been carried out on buffer layer ablation, mainly focusing on experimental investigations and numerical simulations. From the experimental perspective, Ref. [
7] analyzed the characteristics of buffer layer defects and reported the presence of white powder between the buffer layer and the corrugated aluminum sheath, as well as ablation spots on the insulation shield. Ref. [
8] demonstrated through electrolysis experiments that, under the coupled action of electric field and moisture, the electrochemical decomposition of sodium polyacrylate (PAANa) produces NaHCO
3 and Na
2CO
3, which significantly enhance the local Joule heating effect and thereby promote discharge-induced ablation phenomena. Ref. [
9] analyzed the main components of white spots using X-ray diffraction and confirmed that Al(OH)
3 in the white spots is formed due to AC electrochemical corrosion between the aluminum sheath and the water-blocking buffer layer in an alkaline environment. Ref. [
10] applied an AC voltage to a buffer layer sample with a diameter of 60 mm placed between aluminum electrodes and measured an ablation current of 155 mA under dry conditions, corresponding to an ablation current density of 14 A/m
2. Ref. [
11] reported that when a floating voltage of varying amplitude was applied to the buffer layer, poor contact with a 1.5 mm air gap resulted in an interfacial electric field of 2 kV/mm, sufficient to induce erosion spots in the buffer layer. Ref. [
12] observed, through simulation experiments, different degrees of temperature rise and ablation damage at locations where current concentration occurred despite good contact between the aluminum electrode and buffer layer. The onset temperature of local ablation was approximately 165 °C, while more severe buffer layer damage was observed when the temperature exceeded 220 °C.
Experimental approaches cannot achieve comprehensive, full-parameter observation of cable operating states, whereas numerical simulation offers significant advantages in visualization and in compensating for the limitations of physical testing. Ref. [
13] systematically analyzed the current-carrying capacity of power cables, clarifying the effects of conductor properties, structural configuration, and environmental conditions on temperature rise and ampacity, thereby establishing a theoretical basis for cable design and operational assessment. Refs. [
14,
15] highlighted the impact of insulation degradation, interfacial contact deterioration, and sheath-related defects on local electric field distortion and associated thermal risks, and provided standardized procedures for on-site testing, ageing evaluation, and insulation performance assessment. Ref. [
16] comprehensively summarized ageing mechanisms in medium- and high-voltage cables, including moisture ingress, void formation, and corrosion product accumulation. Together, these studies and standards offer fundamental guidance for electro–thermal modeling, defect identification, and risk evaluation of cable systems. In terms of simulation-based investigations, Ref. [
17] analyzed the effects of buffer layer materials and structural configurations, as well as metallic sheath structures, on the electric field distribution in high-voltage cables. Ref. [
18] employed a numerical simulation model to evaluate the influence of corrugated aluminum sheath pitch and corrugation depth on the maximum electric field strength within air gaps. From the perspective of current crowding-induced temperature rise, Ref. [
12] examined the thermal ablation behavior of the buffer layer and demonstrated that current density increases with the length of poor contact, resulting in a corresponding rise in temperature. Ref. [
19] reported that floating potentials arising within the buffer layer can induce distortion of the surrounding air-gap electric field and even trigger sustained partial discharge, ultimately leading to insulation breakdown. Ref. [
20] further revealed that both moisture ingress and poor interfacial contact may cause electric field concentration in void regions, thereby accelerating ablation processes. Finally, Ref. [
21] characterized the elemental composition and morphological features of white powder observed in buffer layer ablation faults, summarized three principal ablation mechanisms, and discussed corresponding defect detection and remediation techniques.
This study focuses on the risk of buffer layer ablation during long-term cable operation and conducts a systematic comparative investigation of three typical defect types: air-gap barrier, moisture ingress, and white-powder barrier. This approach overcomes the limitation of existing studies, which predominantly concentrate on a single defect scenario. First, key material parameters were obtained through electrical characterization tests of the water-blocking buffer layer, providing a reliable basis for subsequent simulations. Second, an electro–thermal coupled model was established under realistic operating conditions to quantitatively characterize air-gap electric field enhancement, current density concentration at contact interfaces, volumetric heat generation distribution, and temperature rise evolution. Finally, the electro–thermal response characteristics under multiple coexisting defects were further analyzed, revealing the synergistic interaction mechanisms among different defect types. On this basis, a non-destructive quantitative risk assessment framework applicable to energized cables was developed, thereby systematically enhancing the mechanistic interpretability and engineering applicability of the proposed model.
2. Finite Element Simulation Theory
2.1. Finite Element Simulation Method
Under power-frequency operating conditions, the electromagnetic behavior and thermal response of high-voltage cables exhibit significant multiphysics coupling characteristics. To accurately reveal the correlation among non-uniform electric field distribution, current concentration, and locally intensified heat sources and temperature rise between the buffer layer and corrugated aluminum sheath during cable operation, this study couples the Maxwell equations with the heat conduction equation to solve the dynamic feedback relationship between the electric field and temperature field [
22]. It should be noted that the electro–thermal model established in this study is based on several simplifying assumptions. The simulations are performed under steady-state power-frequency conditions, and all materials are considered linear and isotropic media.
At 50 Hz, the electromagnetic wavelength is approximately 6000 km, which is several orders of magnitude larger than the characteristic dimensions of the cable studied herein. Therefore, wave propagation effects can be neglected, and the electric field can be approximated as quasi-static. The governing electrostatic equation is expressed in Equation (1):
where
denotes the electric field intensity (kV/mm), and
is the electric potential (V),
is the electric displacement vector (C/m
2),
is the electrical conductivity of the material (S/m),
is the vacuum permittivity (8.85 × 10
−12 F/m), and
is the relative permittivity (1).
In linear isotropic media, the relationship between current density and electric field strength follows Ohm’s law, as expressed in the electrical conduction Equation (2):
where
is the current density (A/m
2), and
ω is the angular frequency (rad/s).
All cable layers are solid dielectrics, and heat transfer is mainly governed by thermal conduction; thus, the temperature field evolution is described by the heat conduction equation. To account for heat dissipation to the environment, a convective heat transfer boundary condition is applied at the outer surface of the corrugated aluminum sheath. The temperature field equation is given in Equation (3).
where
is the heat source density (W/m
3),
is the material density (kg/m
3),
is the specific heat capacity (J/(kg·K)),
is the thermal conductivity (W/(m·K)),
is the temperature (°C), and
is the ambient air temperature, taken as 25 °C. This equation characterizes the temporal and spatial evolution of temperature within the cable during energized operation.
When the electric field distribution is distorted or current concentrates in local regions, the volumetric heat generation is significantly enhanced, resulting in localized regions of high heat flux near the buffer layer–corrugated aluminum sheath interface. This mechanism represents a critical physical origin of local overheating and thermal failure in cables.
2.2. Cable Electric–Thermal Field Modeling
Based on the theoretical framework and methodological guidance provided by IEC 60287-1-1 [
13], IEEE Std 400-2023 [
14], IEEE Std 575-2014 [
15], and CIGRE Technical Brochure No. 722 [
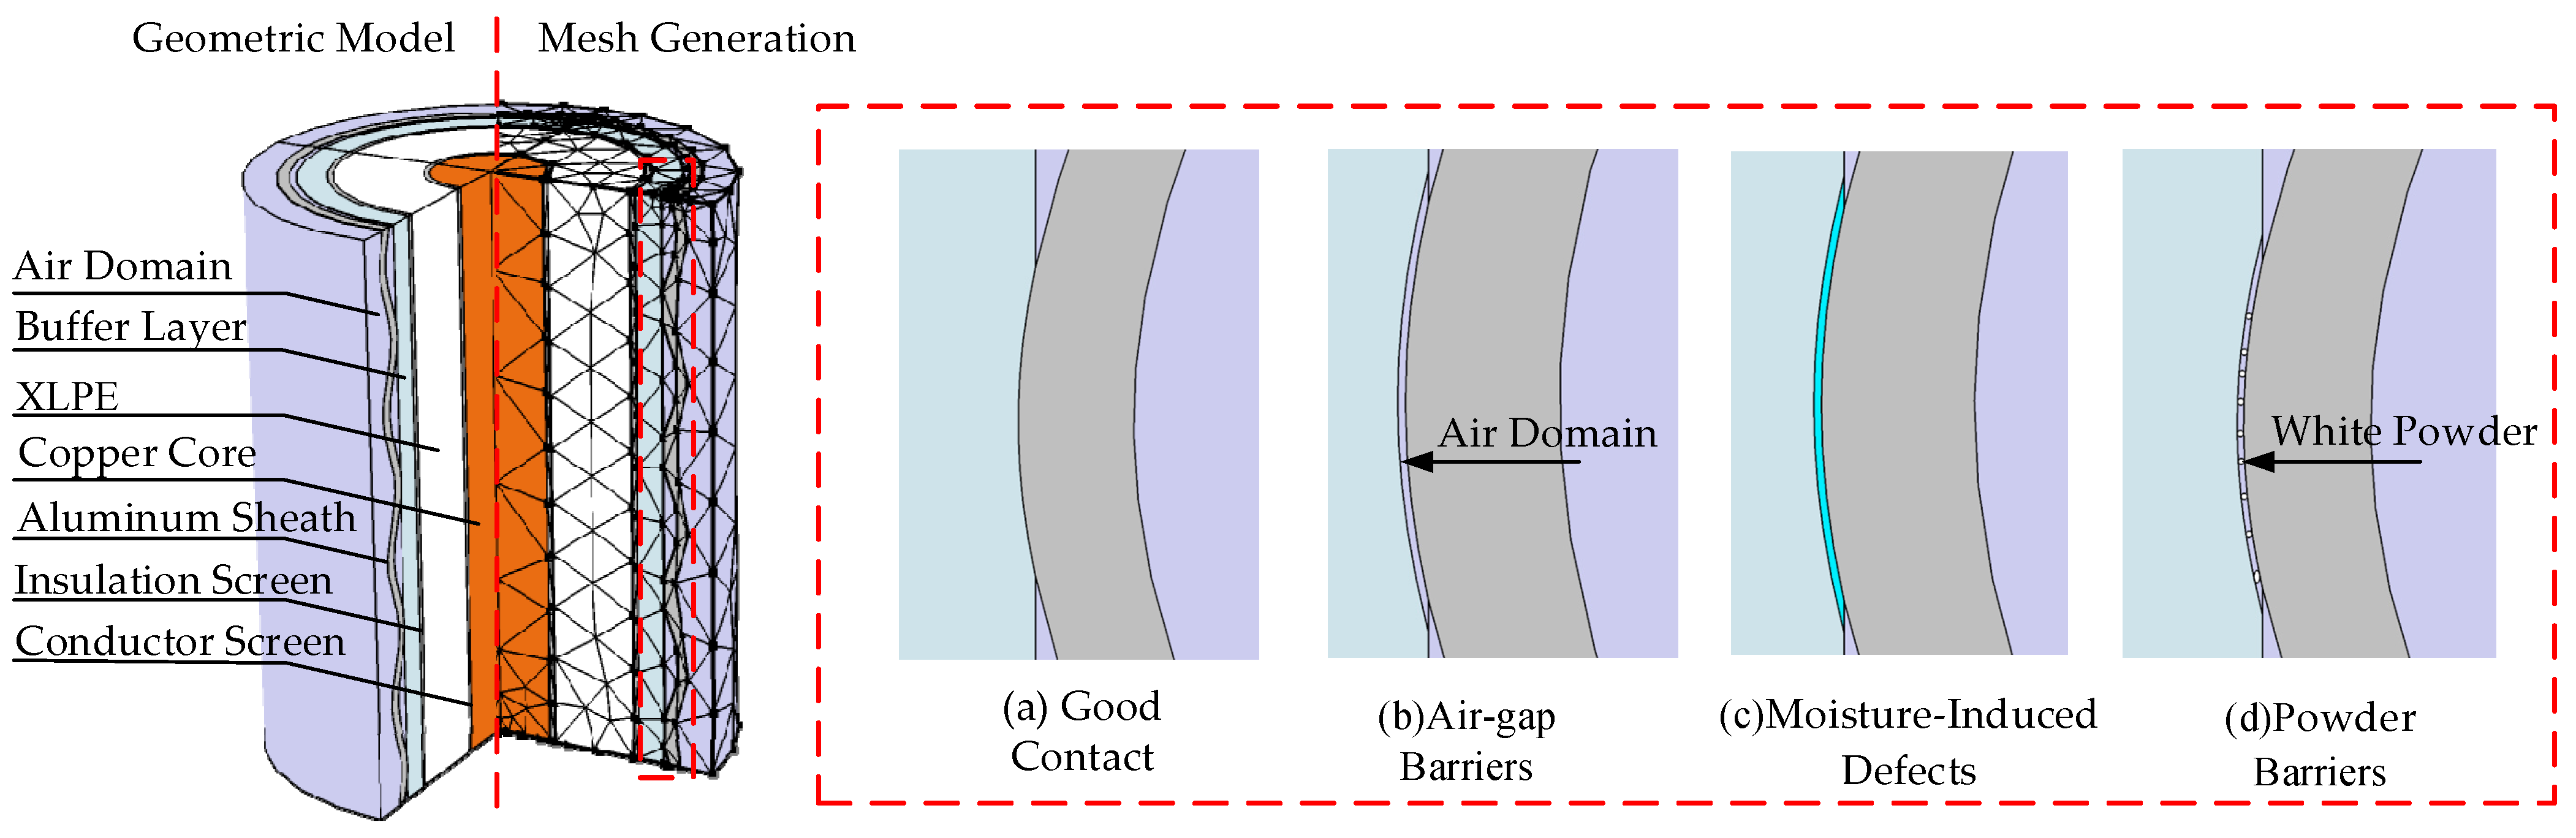
16], an electro–thermal coupled finite element model was established using COMSOL Multiphysics (version 6.2) to investigate the coupled current field and solid heat transfer field of a ZC-YJWO3-55/66 kV 1 × 500 single-core XLPE cable (Cable sample: Chongqing Kebao Cable Co., Ltd. (Chongqing, China)). The model was developed to analyze the electro–thermal parameter variations of the buffer layer and corrugated aluminum sheath under different operating conditions. As illustrated in
Figure 1, the simulated cable model has an axial length of 1000 mm. The thickness of the corrugated aluminum sheath is 2 mm, the buffer layer thickness is 5 mm, and the insulation shield layer and conductor shield layer are each 1 mm thick. The XLPE insulation thickness is 15 mm, and the conductor diameter is 20 mm. The interference fit is set to 0.3 mm, and the corrugation pitch of the aluminum sheath is 25 mm.
The corresponding material parameters are summarized in
Table 1. The electrical conductivity of the buffer layer is defined as temperature-dependent, as shown in Equation (4), and is iteratively updated during the electro–thermal coupling process. For simplification, the relative permittivity is assumed to be independent of temperature.
Four types of contact conditions exist between the cable buffer layer and corrugated aluminum sheath.
Figure 1a illustrates the case of good contact. During long-term operation under various stress conditions, poor contact may occur between the sheath valleys and the buffer layer, resulting in partial non-contact and air-gap barriers, as shown in
Figure 1b.
Figure 1c depicts a moisture defect in the water-blocking buffer layer. Under long-term chemical interaction between the corrugated aluminum sheath and the buffer layer, compounds such as Al
2O
3, Al(OH)
3, and Na
2CO
3 are generated and, together with the precipitated water-blocking powder from the buffer layer, form white granular crystalline products (hereinafter referred to as white powder) [
8,
9]. As shown in
Figure 1d, the buffer layer can be electrically disconnected by the white powder. Considering that its specific composition and corresponding physical properties may vary under different operating conditions, in this study the white powder is equivalently modeled as an insulating layer. Based on Ref. [
23], the representative electro-thermal parameters are listed in
Table 1, and the simulation results remain robust within a reasonable parameter range.
In the simulation, the conductor voltage was set to 38 kV (phase-to-ground), and the corrugated aluminum sheath was grounded. Heat Source 1 denotes electromagnetic heating induced by the phase-to-ground voltage of the conductor, while Heat Source 2 represents electromagnetic volumetric losses in the buffer layer–corrugated aluminum sheath region. The ambient temperature was 25 °C. Convective heat flux was applied at the air boundary, with a heat transfer coefficient of 7 W/(m2·K) between the outer sheath and air. Since the modeled cable length is much larger than its radial dimension, electrically insulating and thermally adiabatic boundary conditions were imposed at both axial ends to eliminate axial end effects in the electric and temperature fields. The cable model was discretized using a free triangular mesh. For the buffer layer, corrugated aluminum sheath, and air domain, a user-defined mesh sequence was applied, with a maximum element size of 2 mm and a minimum element size of 0.001 mm. The remaining domains were meshed using physics-controlled mesh sequences, with the element size set to finer, in order to achieve an appropriate balance between computational accuracy and efficiency.
In practical cable engineering, high-precision thermal analysis is typically based on the steady-state thermal equilibrium framework defined in IEC 60287 and numerically implemented using the finite element method (FEM). Such models generally focus on improving geometric representation accuracy, incorporating complex operating conditions, and accounting for sheath loss distribution. In more advanced industrial-grade simulations, electro–thermal coupling mechanisms are further introduced to account for temperature-dependent material properties. However, most existing high-precision models still treat each cable layer as a continuous medium and do not explicitly parameterize interfacial degradation phenomena, such as air-gap formation, moisture-induced conductivity variation, or corrosion product deposition. Compared with conventional FEM-based engineering models, the present study introduces a defect-sensitive interfacial characterization method within a steady-state electro–thermal coupling framework. The model explicitly incorporates interface variations and material parameter perturbations induced by degradation mechanisms, enabling quantitative evaluation of defect-induced local effects under steady-state operating conditions.
3. Coupled Electro–Thermal Simulation of the Buffer Layer
3.1. Simulation Model Validation
To systematically validate the physical rationality and engineering applicability of the established electro–thermal coupled model, model verification was conducted from three perspectives: comparative analysis of defect conditions, on-site live inspection data, and cross-validation with published simulation results.
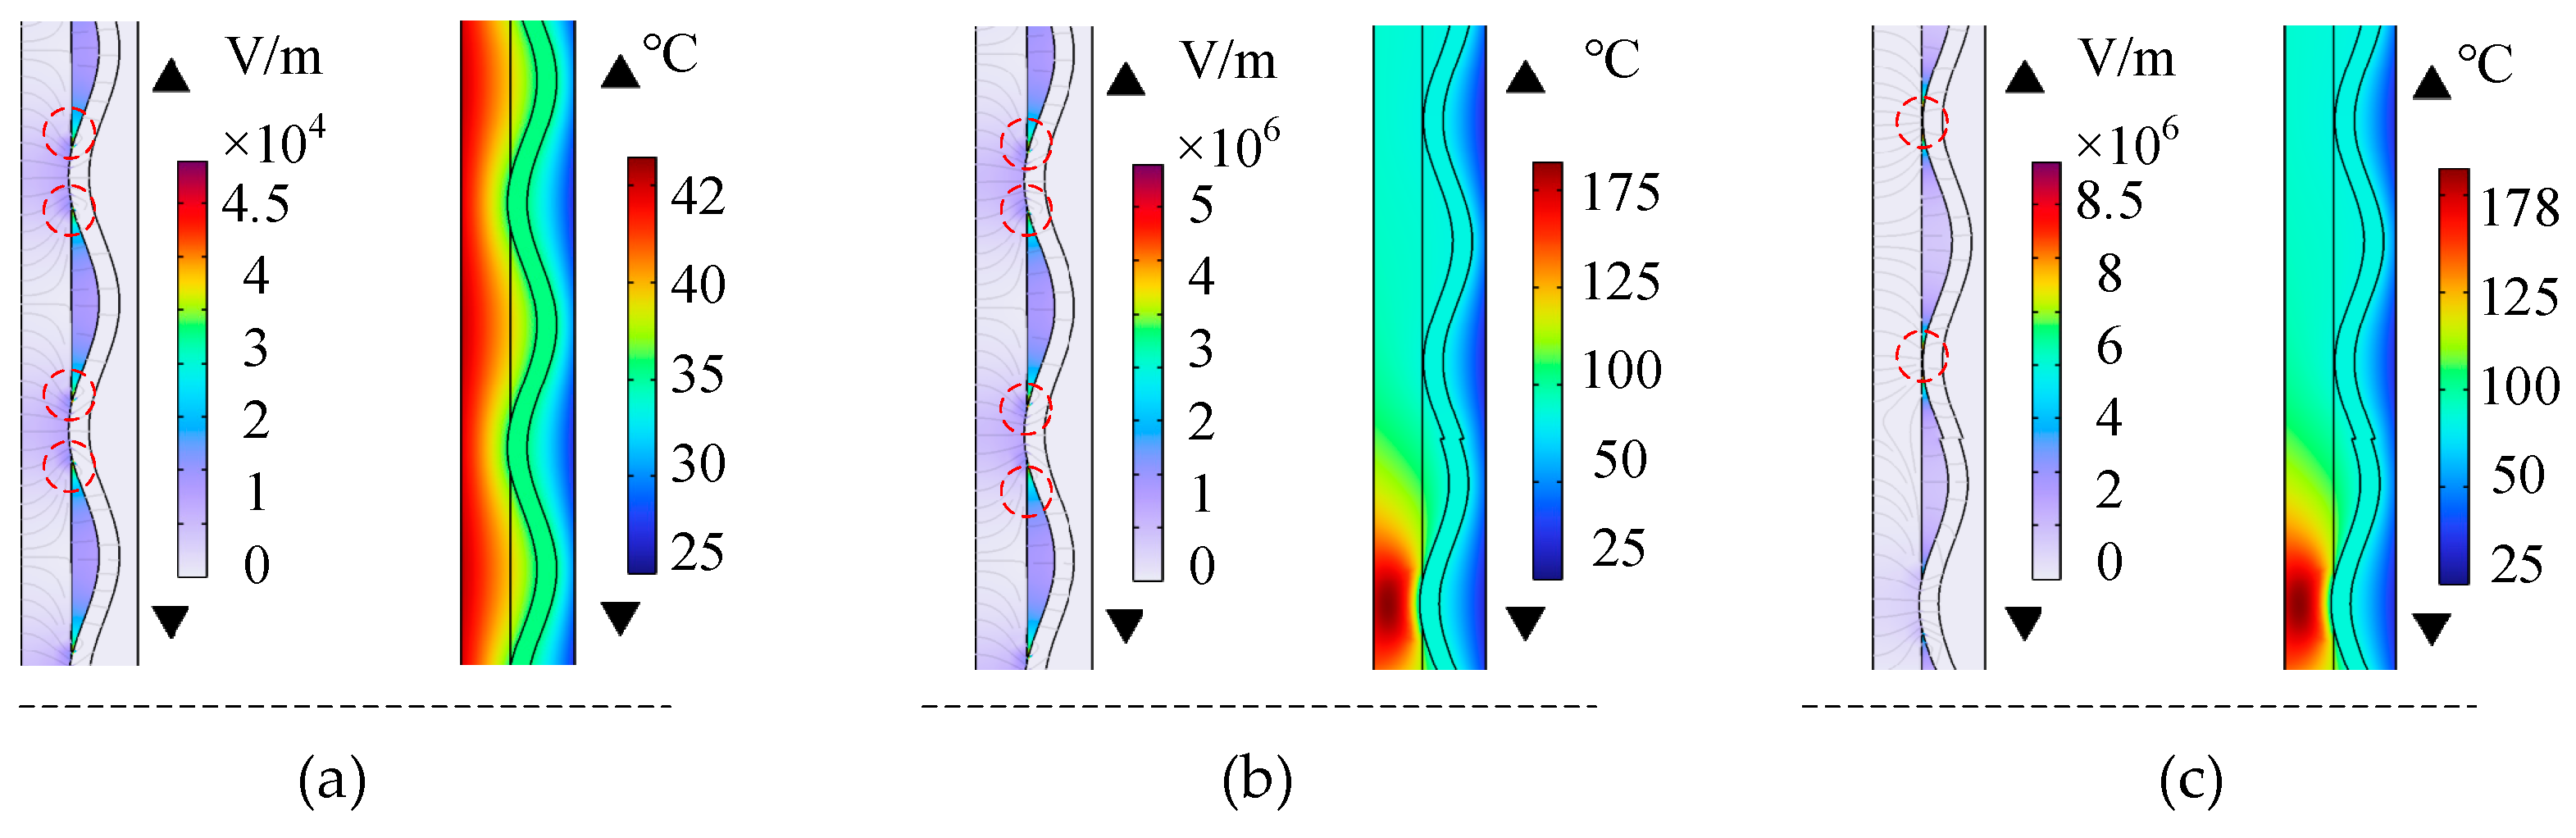
As shown in
Figure 2, a comparison of the electric field and temperature distributions under three operating conditions—good contact, moisture ingress in the buffer layer, and 2 m powder blockage—indicates the following:
Under good contact conditions, the maximum electric field in the buffer layer is relatively low and is mainly concentrated in the air-gap region surrounding the corrugated aluminum sheath. The overall temperature field exhibits a typical radial gradient distribution, decreasing gradually from a maximum of approximately 42 °C in the buffer layer to the ambient temperature of 25 °C. When the volumetric moisture content of the buffer layer reaches 20%, the maximum electric field still appears in the surrounding air gap; however, its magnitude reaches 5 kV/mm, exceeding the dielectric strength of air. Under poor contact conditions, the highest temperature occurs at the region maintaining good contact with the buffer layer. In the presence of a 2 m powder barrier, the electric field in the gap between the buffer layer and the corrugated aluminum sheath becomes significantly distorted, with a magnitude exceeding the dielectric strength of air. The temperature field also shows pronounced non-uniformity, and a clear thermal concentration phenomenon forms in the well-contacted region adjacent to the blockage. These results reveal that the enhancement of electro–thermal coupling promotes the risk of ablation.
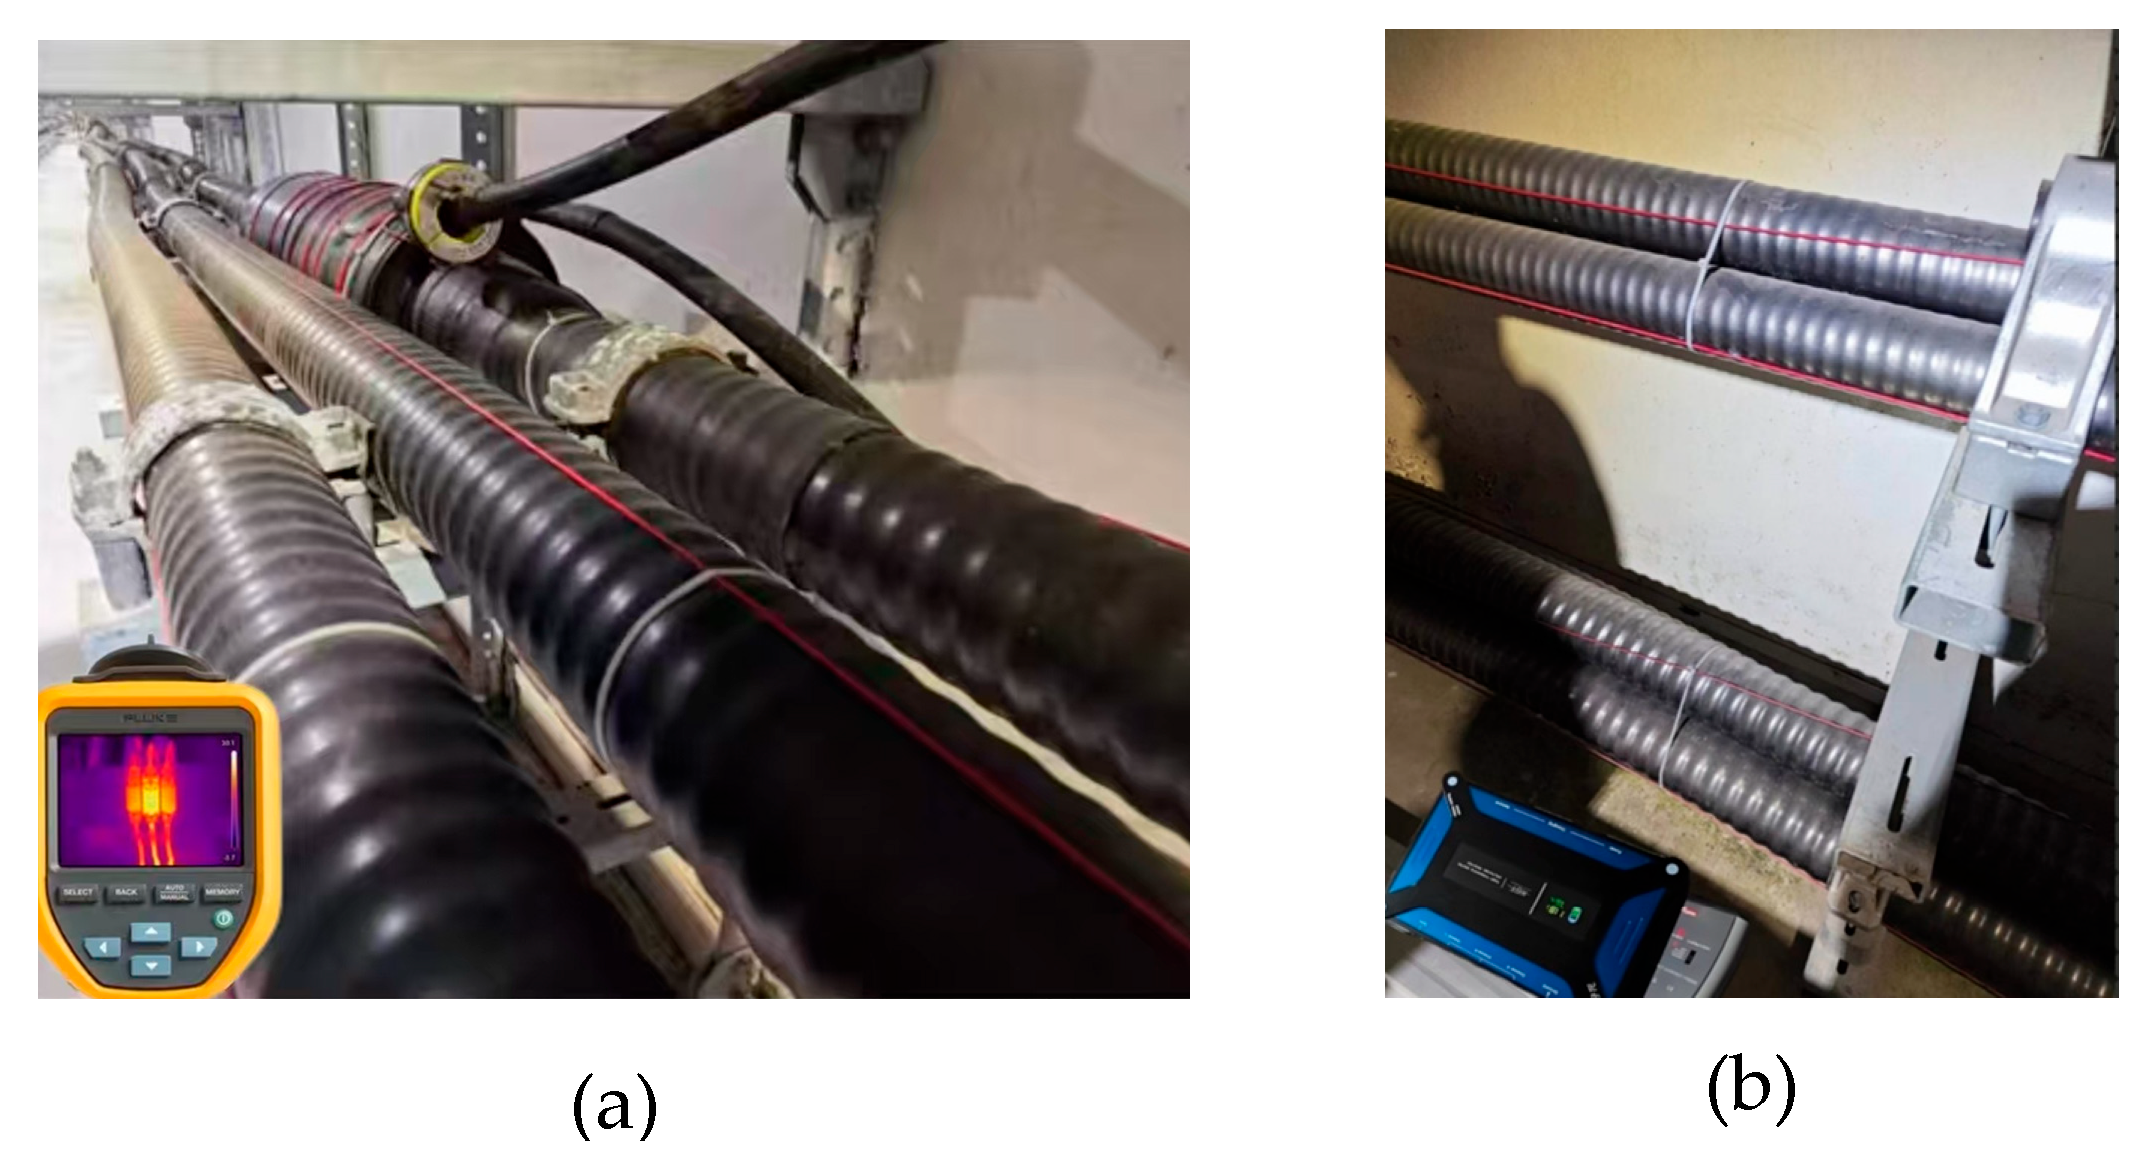
As shown in
Figure 3, on-site energized inspections were conducted on two segments of 66 kV cables in actual service: one in operation for approximately one year and the other in service for more than ten years and approaching retirement. Partial discharge measurements were performed using a KGT high-frequency cable partial discharge detector, and infrared thermography was carried out with a FLUKE thermal imager. The inspection results indicate that no partial discharge activity was detected in the newly commissioned cable, and the buffer layer temperature distribution was uniform and within the normal operating range. In contrast, the cable nearing retirement exhibited severe buffer layer ablation, accompanied by frequent partial discharge activity and a markedly non-uniform temperature distribution, with significant localized temperature rise observed in certain regions. Subsequently, the retired cable was recovered for moisture assessment and dissection analysis. The examination revealed severe moisture ingress in the buffer layer and the presence of a substantial amount of white powder. As summarized in
Table 2, comparison between the field-measured electric and thermal characteristics and the simulation predictions shows good agreement in both operational state identification and abnormal region distribution, thereby validating the model’s capability to accurately characterize the actual service condition of the cable.
The electric field simulation results reported in Ref. [
20] indicate that when the water-blocking buffer layer is in good contact, the maximum electric field strength in the air gap is approximately 0.072 kV/mm, whereas under poor contact conditions, the maximum field strength in the gap between the buffer layer and the aluminum sheath can reach 3.89 kV/mm. This value significantly exceeds the dielectric strength of air and is sufficient to induce air breakdown and subsequent electrical ablation. Furthermore, the current-induced thermal ablation simulation in Ref. [
12] shows that when the length of poor contact in the buffer layer reaches 2 m, the temperature rise can exceed 155 °C, with the characteristic ablation temperature being approximately 165 °C. Although the specific numerical values differ due to variations in boundary condition settings, the orders of magnitude are consistent. This comparison verifies the correctness of the present model’s simulation results in terms of order of magnitude relative to the existing literature.
In summary, through validation against live on-site inspection data and quantitative cross-comparison with existing simulation studies, the proposed electro–thermal coupled model has been systematically demonstrated to possess sound physical interpretability, numerical accuracy, and engineering applicability.
3.2. Influence of Air-Gap Barriers in the Buffer Layer on the Electro–Thermal Fields
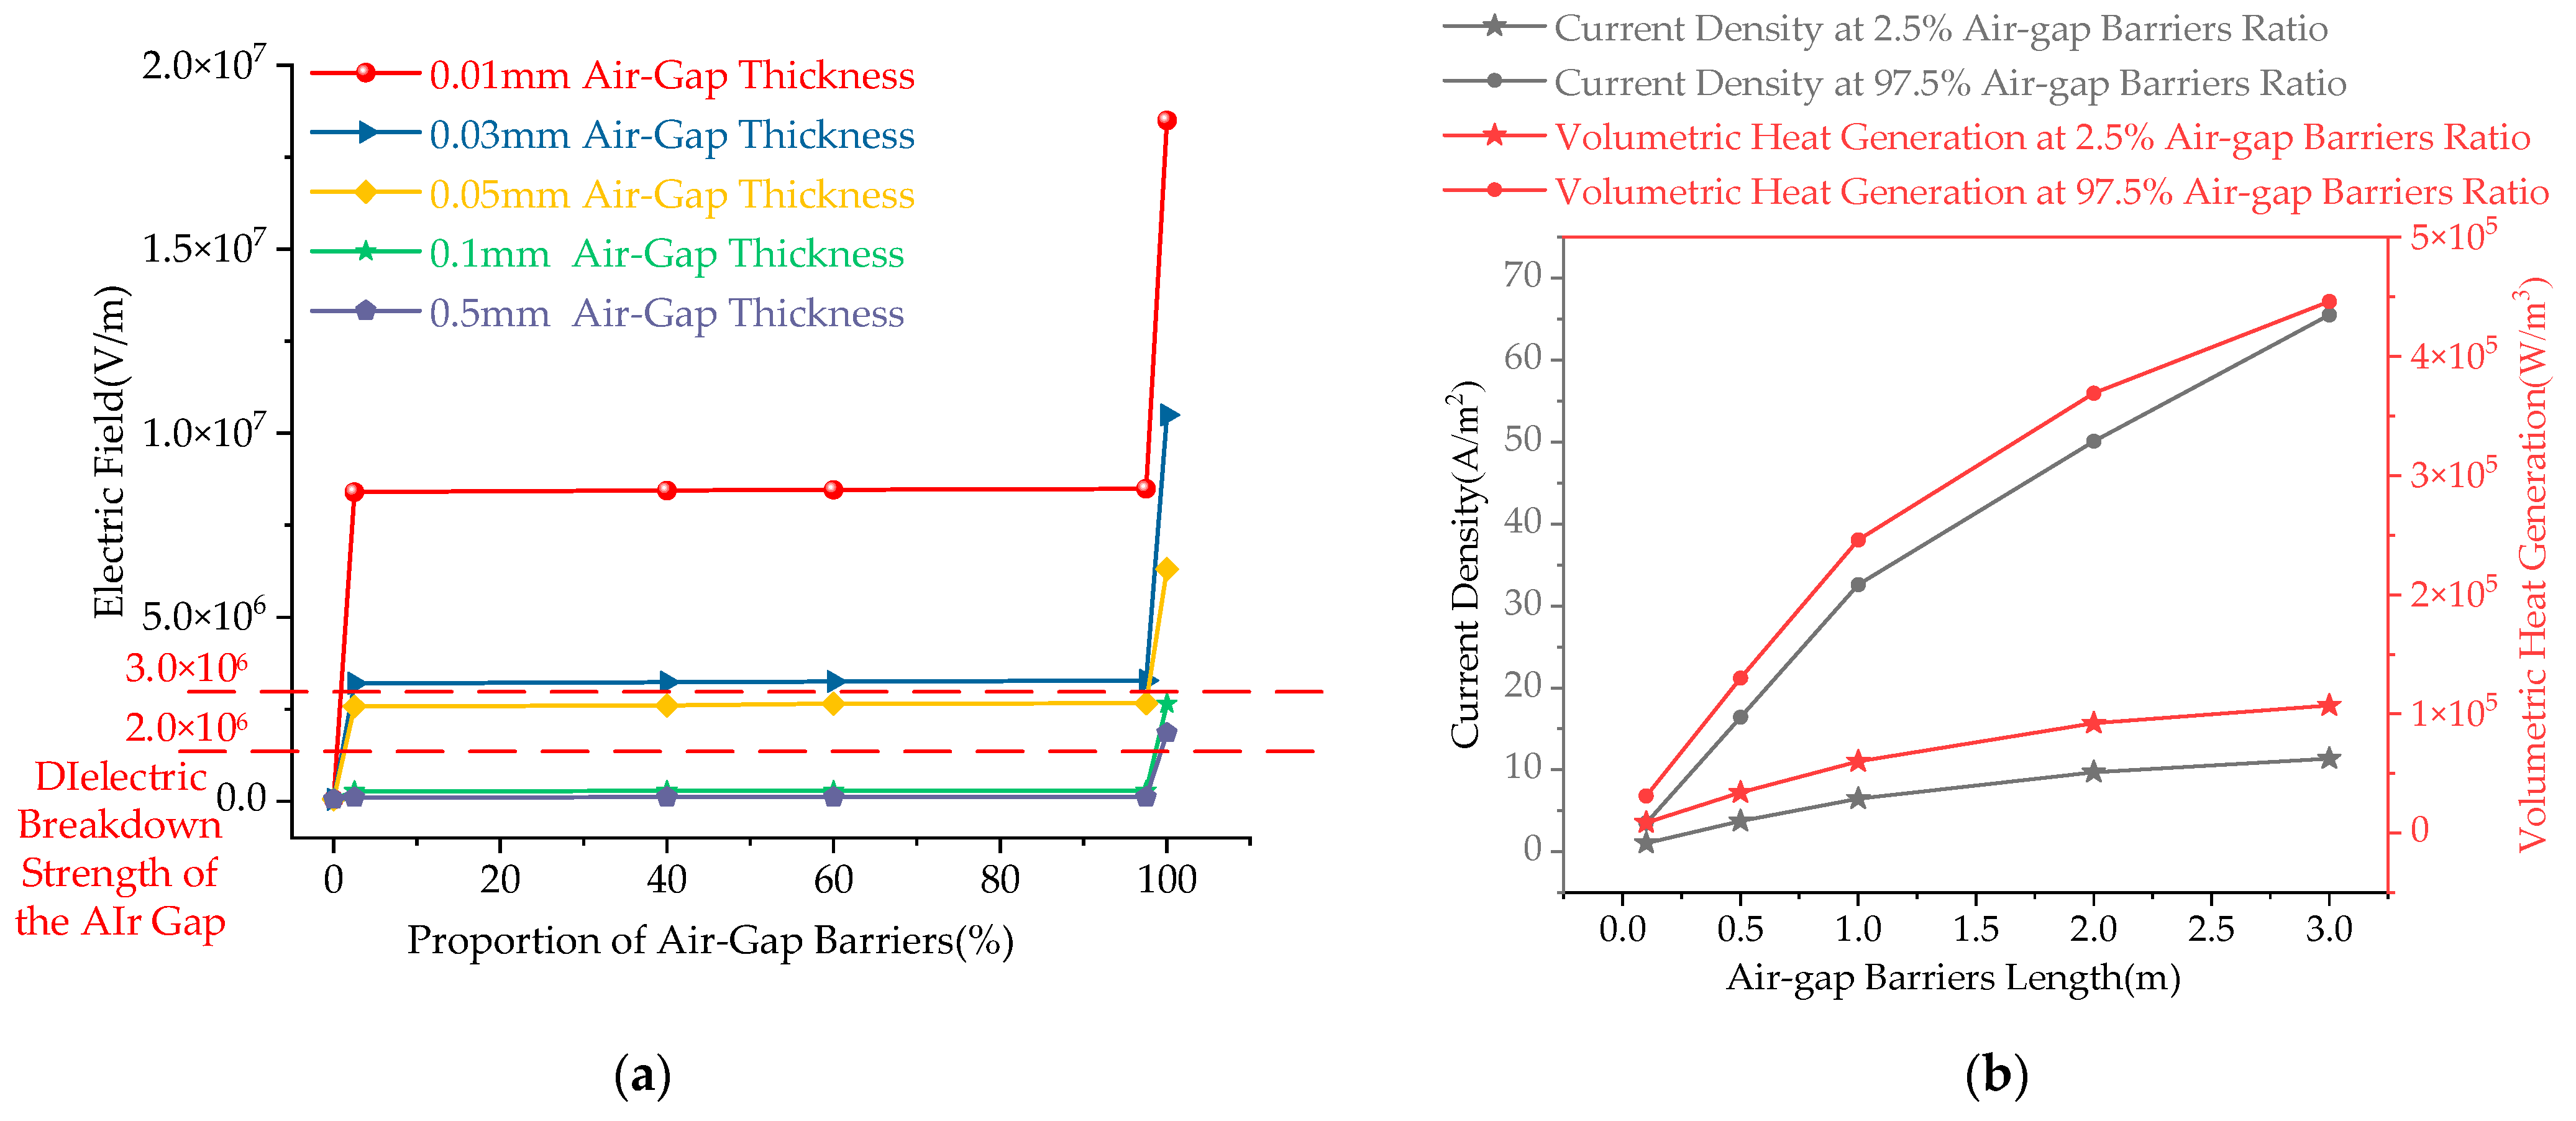
Under the condition that the cable axial length is fixed at 1 m, the influence of the radial air-gap thickness between the buffer layer and the corrugated aluminum sheath on the electric field distribution was investigated. The electric field characteristics under different air-gap barrier ratios (defined as the ratio of the air-gap barrier length to the total length of good contact along the buffer layer) were calculated, as shown in
Figure 4a. When the air-gap barrier ratio is 0%, the buffer layer is in complete good contact with the corrugated aluminum sheath. The maximum electric field is 0.045 kV/mm, mainly concentrated in the small air region near the troughs of the corrugated sheath. As the barrier ratio increases from 0% to 2.5%, the first trough becomes fully insulated by air, indicating the initiation of air-gap defects. A significant increase in the maximum electric field occurs at the air-gap location. When the barrier ratio further increases from 2.5% to 97.5%, the electric field in the air gap rises gradually with a relatively stable trend. As the ratio increases from 97.5% to 100%, the last trough is completely blocked by air, meaning that the entire buffer layer is isolated by the air gap, and the maximum electric field exhibits another pronounced increase. In addition, the radial air-gap thickness has a significant effect on field concentration. Within the barrier ratio range of 2.5–97.5%, a smaller radial air-gap thickness results in a higher and relatively stable electric field in the gap. When the radial air-gap thickness is 0.01 mm, the electric field reaches 8.5 kV/mm, which is far higher than the breakdown strength of air. With increasing air-gap thickness, the electric field decreases gradually. When the thickness exceeds 0.1 mm, the air-gap electric field stabilizes at approximately 0.13 kV/mm, indicating that breakdown is unlikely to occur at the defective contact region.
The axial length of the air-gap barrier at the defective contact between the buffer layer and the corrugated aluminum sheath significantly affects current concentration in the remaining good-contact region, thereby influencing the temperature field distribution. Two representative air-gap barrier ratios with pronounced differences (2.5% and 97.5%) were selected for comparison. The current density and volumetric heat source distributions under different axial air-gap lengths were calculated, as shown in
Figure 4b.
For an air-gap barrier ratio of 2.5%, when the axial air-gap length increases from 0.1 m to 3 m, the current density in the good-contact region rises from 1.03 A/m2 to 11.36 A/m2. The maximum current density consistently appears in the good-contact segment adjacent to the air-gap barrier. For an air-gap barrier ratio of 97.5%, the current density is substantially higher than that under the 2.5% condition, increasing from 3.5 to 65.5 A/m2 as the axial air-gap length extends. The intensified current concentration further enhances Joule heating at the contact interface, with the volumetric heat source increasing from 3.1 × 10⁴ to 4.5 × 10⁵ W/m3.
3.3. Influence of Moisture Defects in the Buffer Layer on Electro–Thermal Parameters
The moisture ingress process of the water-blocking buffer layer was simulated by incorporating experimentally measured relationships between conductivity, relative permittivity, and volumetric moisture content into the material parameters of the buffer layer. A 66 kV single-core XLPE cable sample was selected for the experiment. After removing the structure from the buffer layer to the outer sheath, aluminum foil was attached to the inner side of the buffer layer as an electrode. An Agilent E4980A LCR meter, with a basic impedance measurement accuracy of 0.05%, was used to measure the insulation resistance and bulk capacitance prior to water injection. Water was then injected into the buffer layer in 2 mL increments, and the corresponding insulation resistance and bulk capacitance were recorded at each moisture level. The measurement frequency was fixed at 50 Hz. All tests were conducted at an ambient temperature of (25 ± 2) °C. For each moisture condition, measurements were repeated five times.
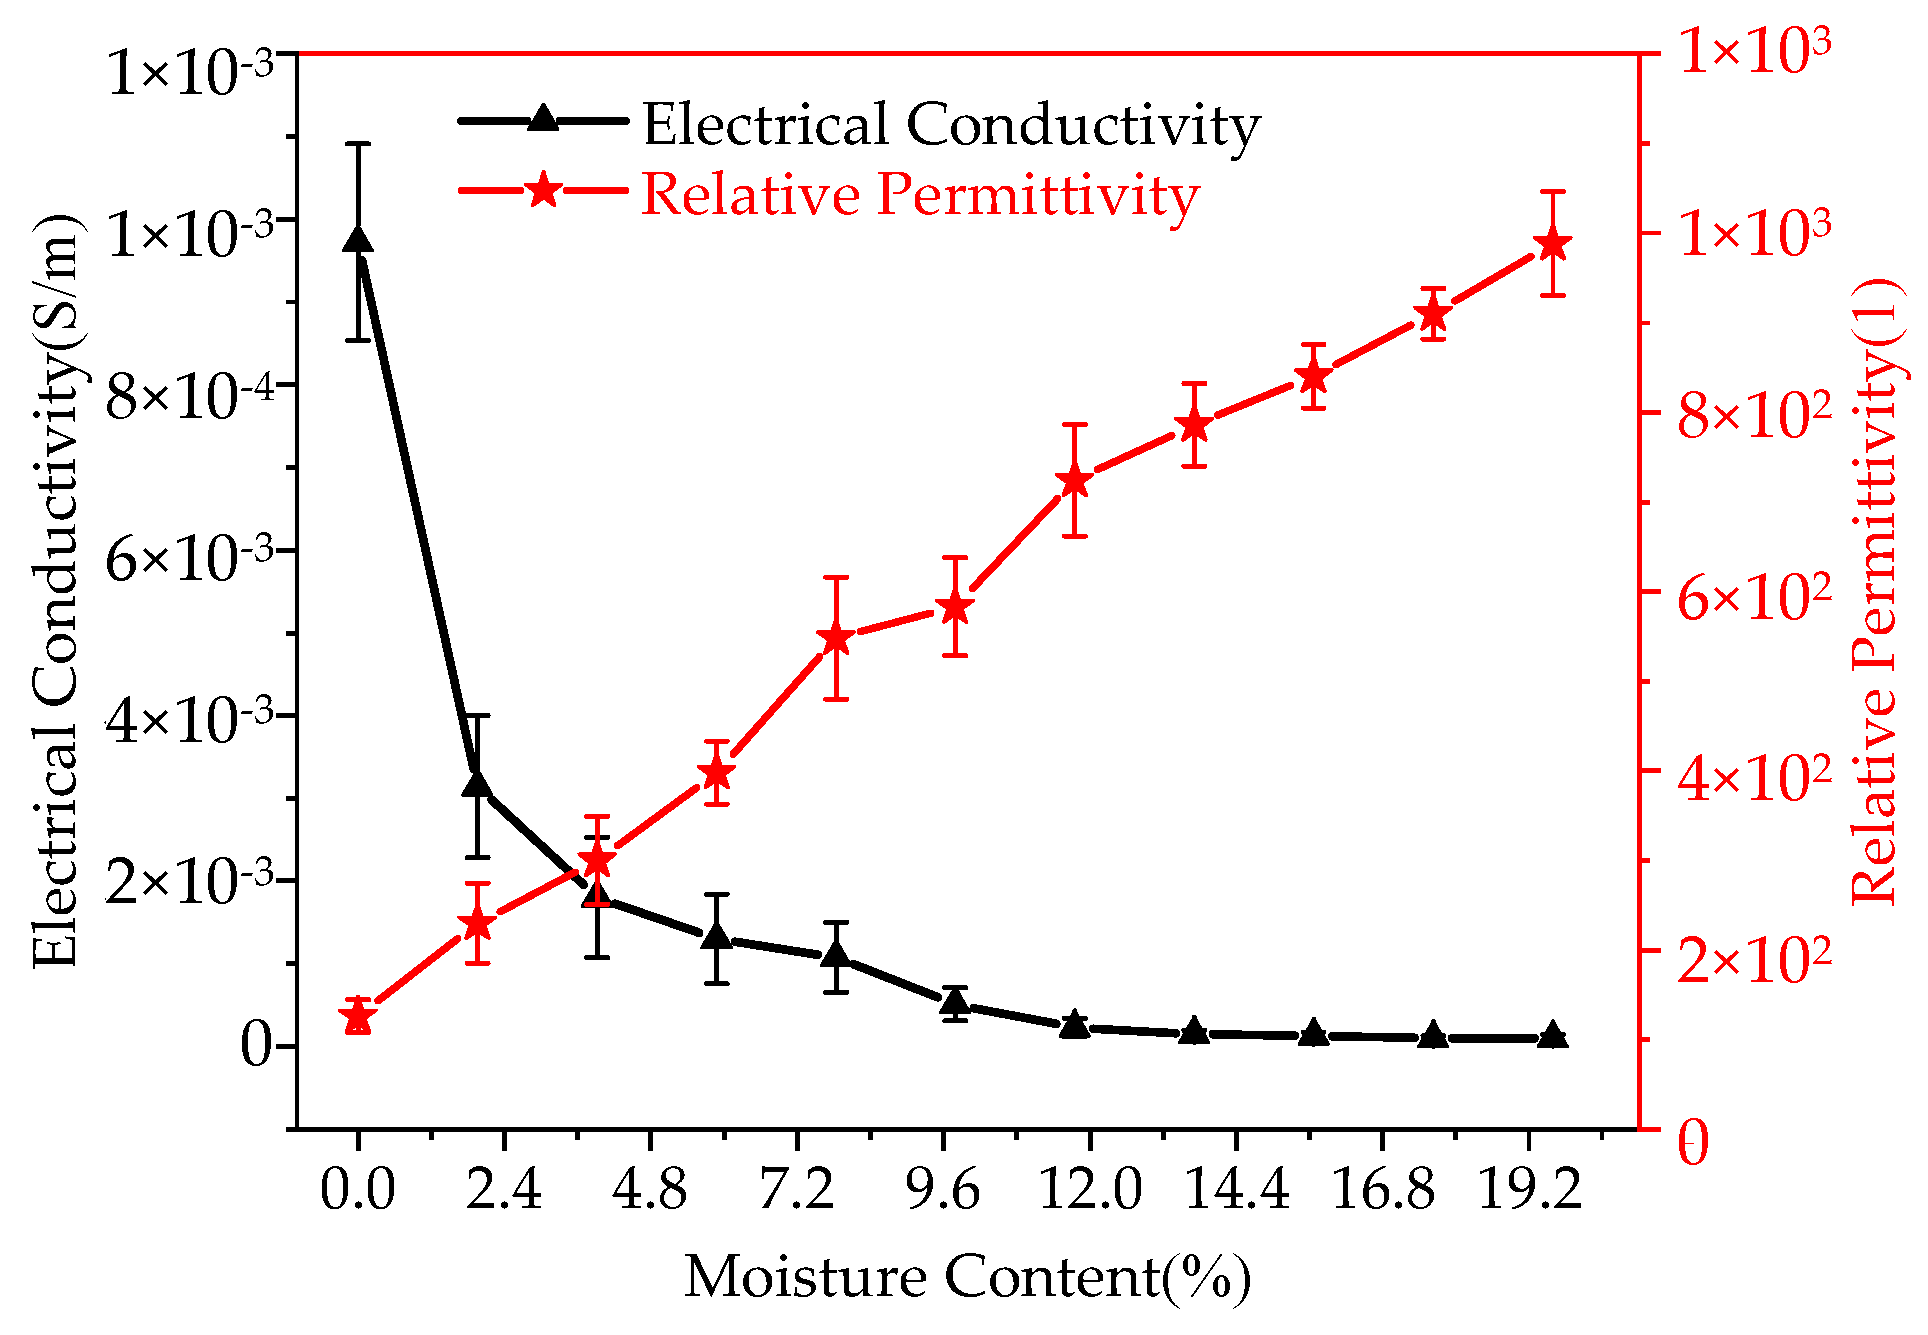
Based on the measured insulation resistance and bulk capacitance at different water injection volumes, the conductivity and relative permittivity of the buffer layer were calculated, and the corresponding variation curves are shown in
Figure 5. The curves represent the average values of repeated experiments with standard deviation error bars. The relative standard deviation is generally below 40% for conductivity and below 20% for relative permittivity, and the overall trends of repeated measurements remain consistent. With increasing volumetric moisture content, the relative permittivity of the buffer layer gradually increases, primarily because air within the porous fibrous structure is progressively replaced by water, which has a higher relative permittivity. Meanwhile, sodium polyacrylate in the water-blocking buffer layer forms a hydrogel after water absorption, converting part of the free water into bound water and reducing the number of effective conductive ions, thereby leading to a gradual decrease in conductivity.
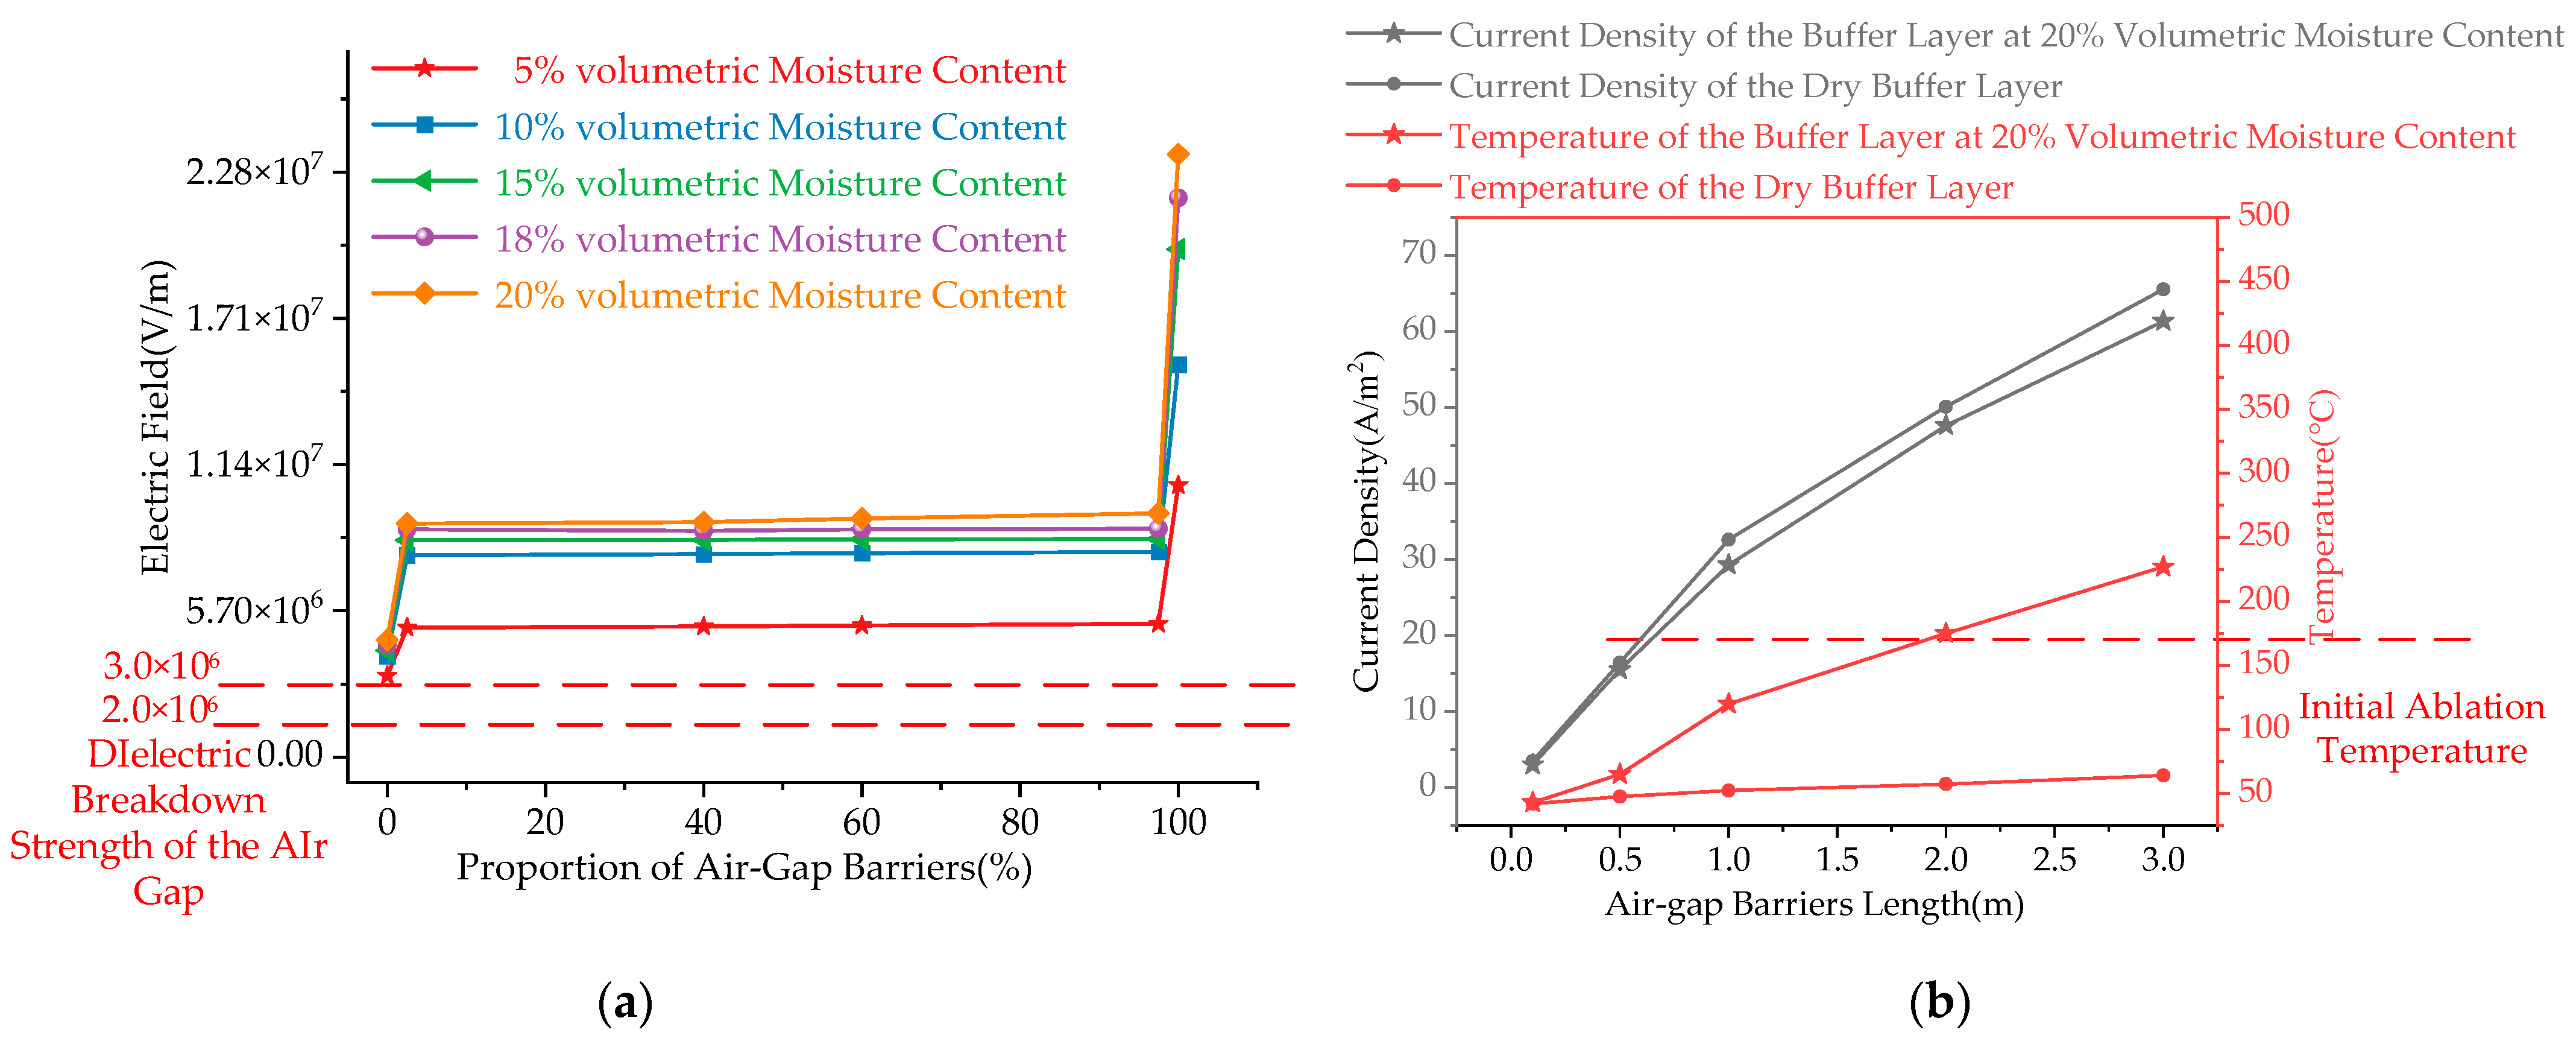
By incorporating the experimentally obtained conductivity and relative permittivity data, the influence of the buffer-layer volumetric moisture content on the air-gap electric field was analyzed. The electric field distributions under different air-gap barrier ratios are presented in
Figure 6a. An air-gap barrier ratio of 0% represents a well-contacted condition between the moist buffer layer and the corrugated aluminum sheath. In this case, the maximum electric field appears in the air region surrounding the corrugation valleys of the aluminum sheath. As the volumetric moisture content increases, the air-gap electric field correspondingly increases and, in all cases, exceeds the air breakdown strength, indicating the potential for partial discharge. When the insulation ratio increases from 0% to 2.5%, the first corrugation valley becomes fully isolated by an air gap, resulting in a pronounced rise in the maximum electric field within the gap. As the ratio further increases from 2.5% to 97.5%, the air-gap electric field increases gradually. When the ratio increases from 97.5% to 100%, corresponding to complete air-gap barrier along the entire buffer layer, the maximum electric field exhibits another significant increase. As the volumetric moisture content increases from 5% to 20%, the air-gap electric field is markedly enhanced. This behavior is attributed to the increase in the relative permittivity of the buffer layer with moisture content, which strengthens electric field concentration within the air gap. The electric field ranges from 5 to 9 kV/mm, substantially exceeding the air breakdown threshold and indicating a high risk of partial discharge in the air-gap region.
In addition, the axial length of the air-gap barrier between the moist buffer layer and the corrugated aluminum sheath alters current crowding in the remaining well-contacted regions and significantly affects the temperature field distribution. The electro–thermal responses under dry conditions and at a volumetric moisture content of 20% were compared. The calculated current density and temperature distributions for different axial air-gap lengths are shown in
Figure 6b. As the axial air-gap length increases from 0.1 to 3 m, the current density in the buffer layer increases from 3 to 61.3 A/m
2, while the maximum temperature rises from 43 to 227 °C. After moisture absorption, the increased relative permittivity enhances the capacitive characteristics of the poorly contacted regions, leading to local electric field intensification at interfaces such as the buffer layer–aluminum sheath boundary. Under AC voltage excitation, the displacement current increases and preferentially concentrates in the well-contacted regions adjacent to the air-gap defects, resulting in significant local current density enhancement. Therefore, although the bulk electrical conductivity of the buffer layer decreases after moisture absorption, Joule heating in the well-contacted regions can still be substantially intensified.
3.4. Influence of White-Powder Barriers in the Buffer Layer on Electro–Thermal Parameters
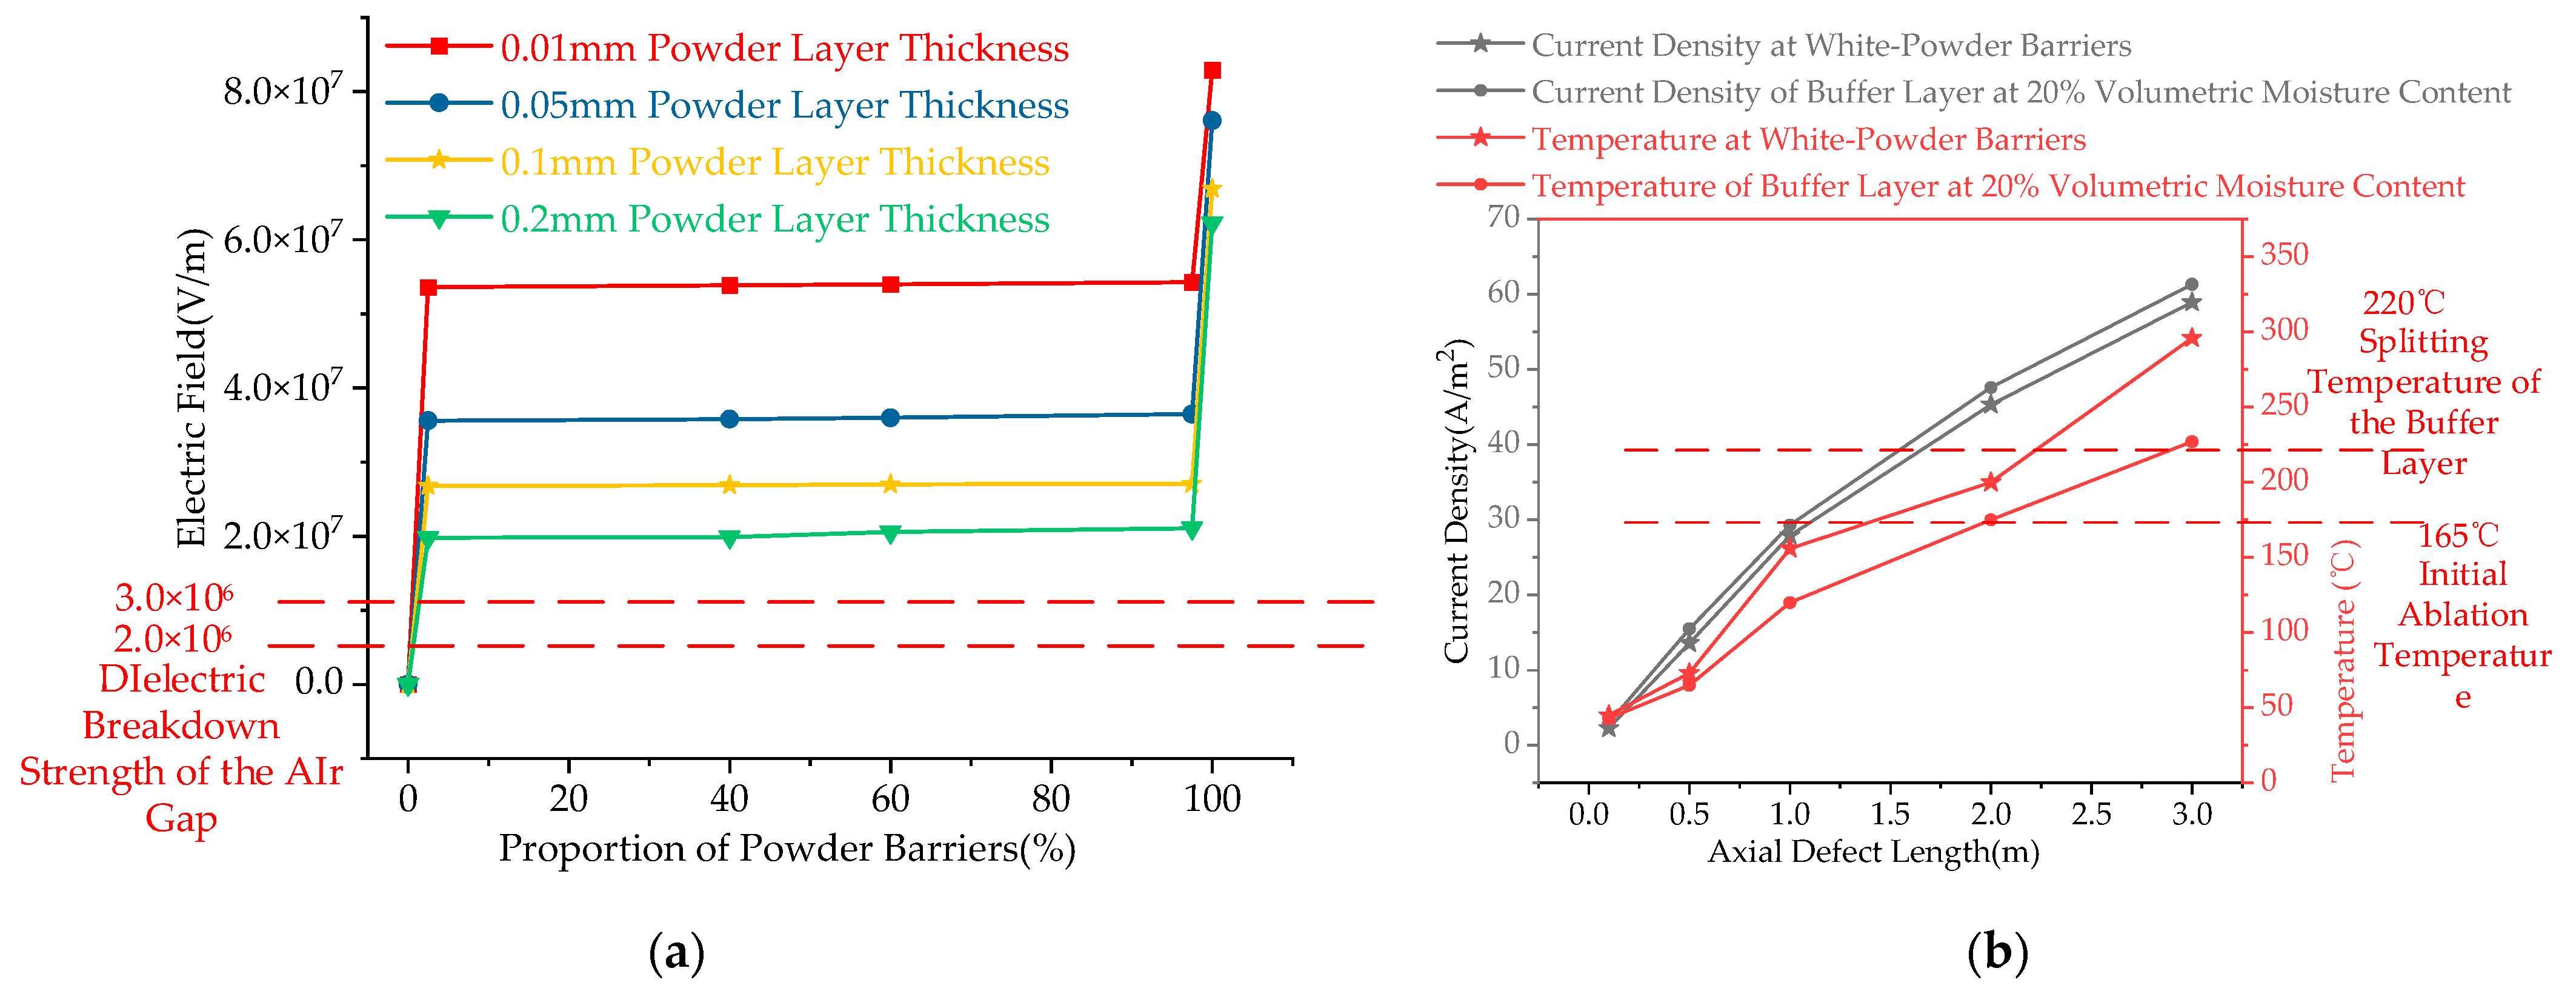
The formation of white powder between the buffer layer and the corrugated aluminum sheath disrupts their electrical contact. At such defective contact locations, the radial thickness of the white powder significantly influences electric field concentration within the gap. With the cable length fixed at 1 m, the effect of the radial thickness of the white powder on the electric field distribution was investigated. The electric field distributions under different white-powder barrier ratios—defined as the ratio of the white-powder barrier length to the total effective contact length of the buffer layer—are shown in
Figure 7a.
A white-powder barrier ratio of 0% represents a well-contacted condition between the buffer layer and the corrugated aluminum sheath. Under this condition, the maximum electric field is 0.045 kV/mm and is mainly located in the air region surrounding the corrugation valleys at the well-contacted interface. As the insulation ratio increases from 0% to 2.5%, the first corrugation valley becomes fully isolated by white powder, marking the initial formation of powder barrier. At this stage, the maximum electric field increases sharply and concentrates in the gap surrounding the white powder. As the ratio further increases from 2.5% to 97.5%, the electric field within the gap rises gradually. When the ratio increases from 97.5% to 100%, corresponding to a complete white-powder barrier along the entire buffer layer, the maximum electric field exhibits another pronounced increase. Within the relatively stable range of insulation ratios from 2.5% to 97.5%, a smaller radial thickness of white powder results in a higher electric field level in the gap. When the radial thickness is 0.01 mm, the electric field in the surrounding gap reaches 50 kV/mm. Although increasing the powder thickness reduces the electric field to some extent, the field stabilizes at approximately 20 kV/mm when the thickness exceeds 0.2 mm. This value remains far above the air breakdown strength, indicating a high risk of electrical breakdown at the defective contact locations.
The axial length of white-powder barrier between the buffer layer and the corrugated aluminum sheath affects current crowding in the remaining well-contacted regions, leading to an increase in local electro–thermal heat generation and, consequently, significant changes in the temperature field. The current density and volumetric heat generation distributions under different axial white-powder barrier lengths are calculated, as shown in
Figure 7b.
As the axial length of white-powder barrier increases from 0.1 to 3 m, the maximum current density—located at the well-contacted region closest to the white-powder barrier—rises from 2.3 to 58.9 A/m2. Correspondingly, the maximum temperature increases from 45 °C to nearly 300 °C. Compared with the moist buffer-layer condition at a volumetric moisture content of 20%, the current density induced by white-powder barrier is relatively lower. However, due to the poor thermal conductivity of the white powder, the temperature rise is significantly higher under the same insulation length. This pronounced thermal accumulation further increases the risk of buffer-layer ablation.
3.5. Influence of Multiple Coexisting Defects in the Buffer Layer on Electro–Thermal Parameters
In practical operation, cables may simultaneously exhibit multiple interface conditions, including good contact, air-gap barrier, moisture-induced defects, and white-powder barrier effects. The operational states at different service stages can be represented by assigning different contact length ratios along the cable axial direction, corresponding to the proportions of good contact, air-gap barrier, moisture defects, and white-powder barriers, respectively.
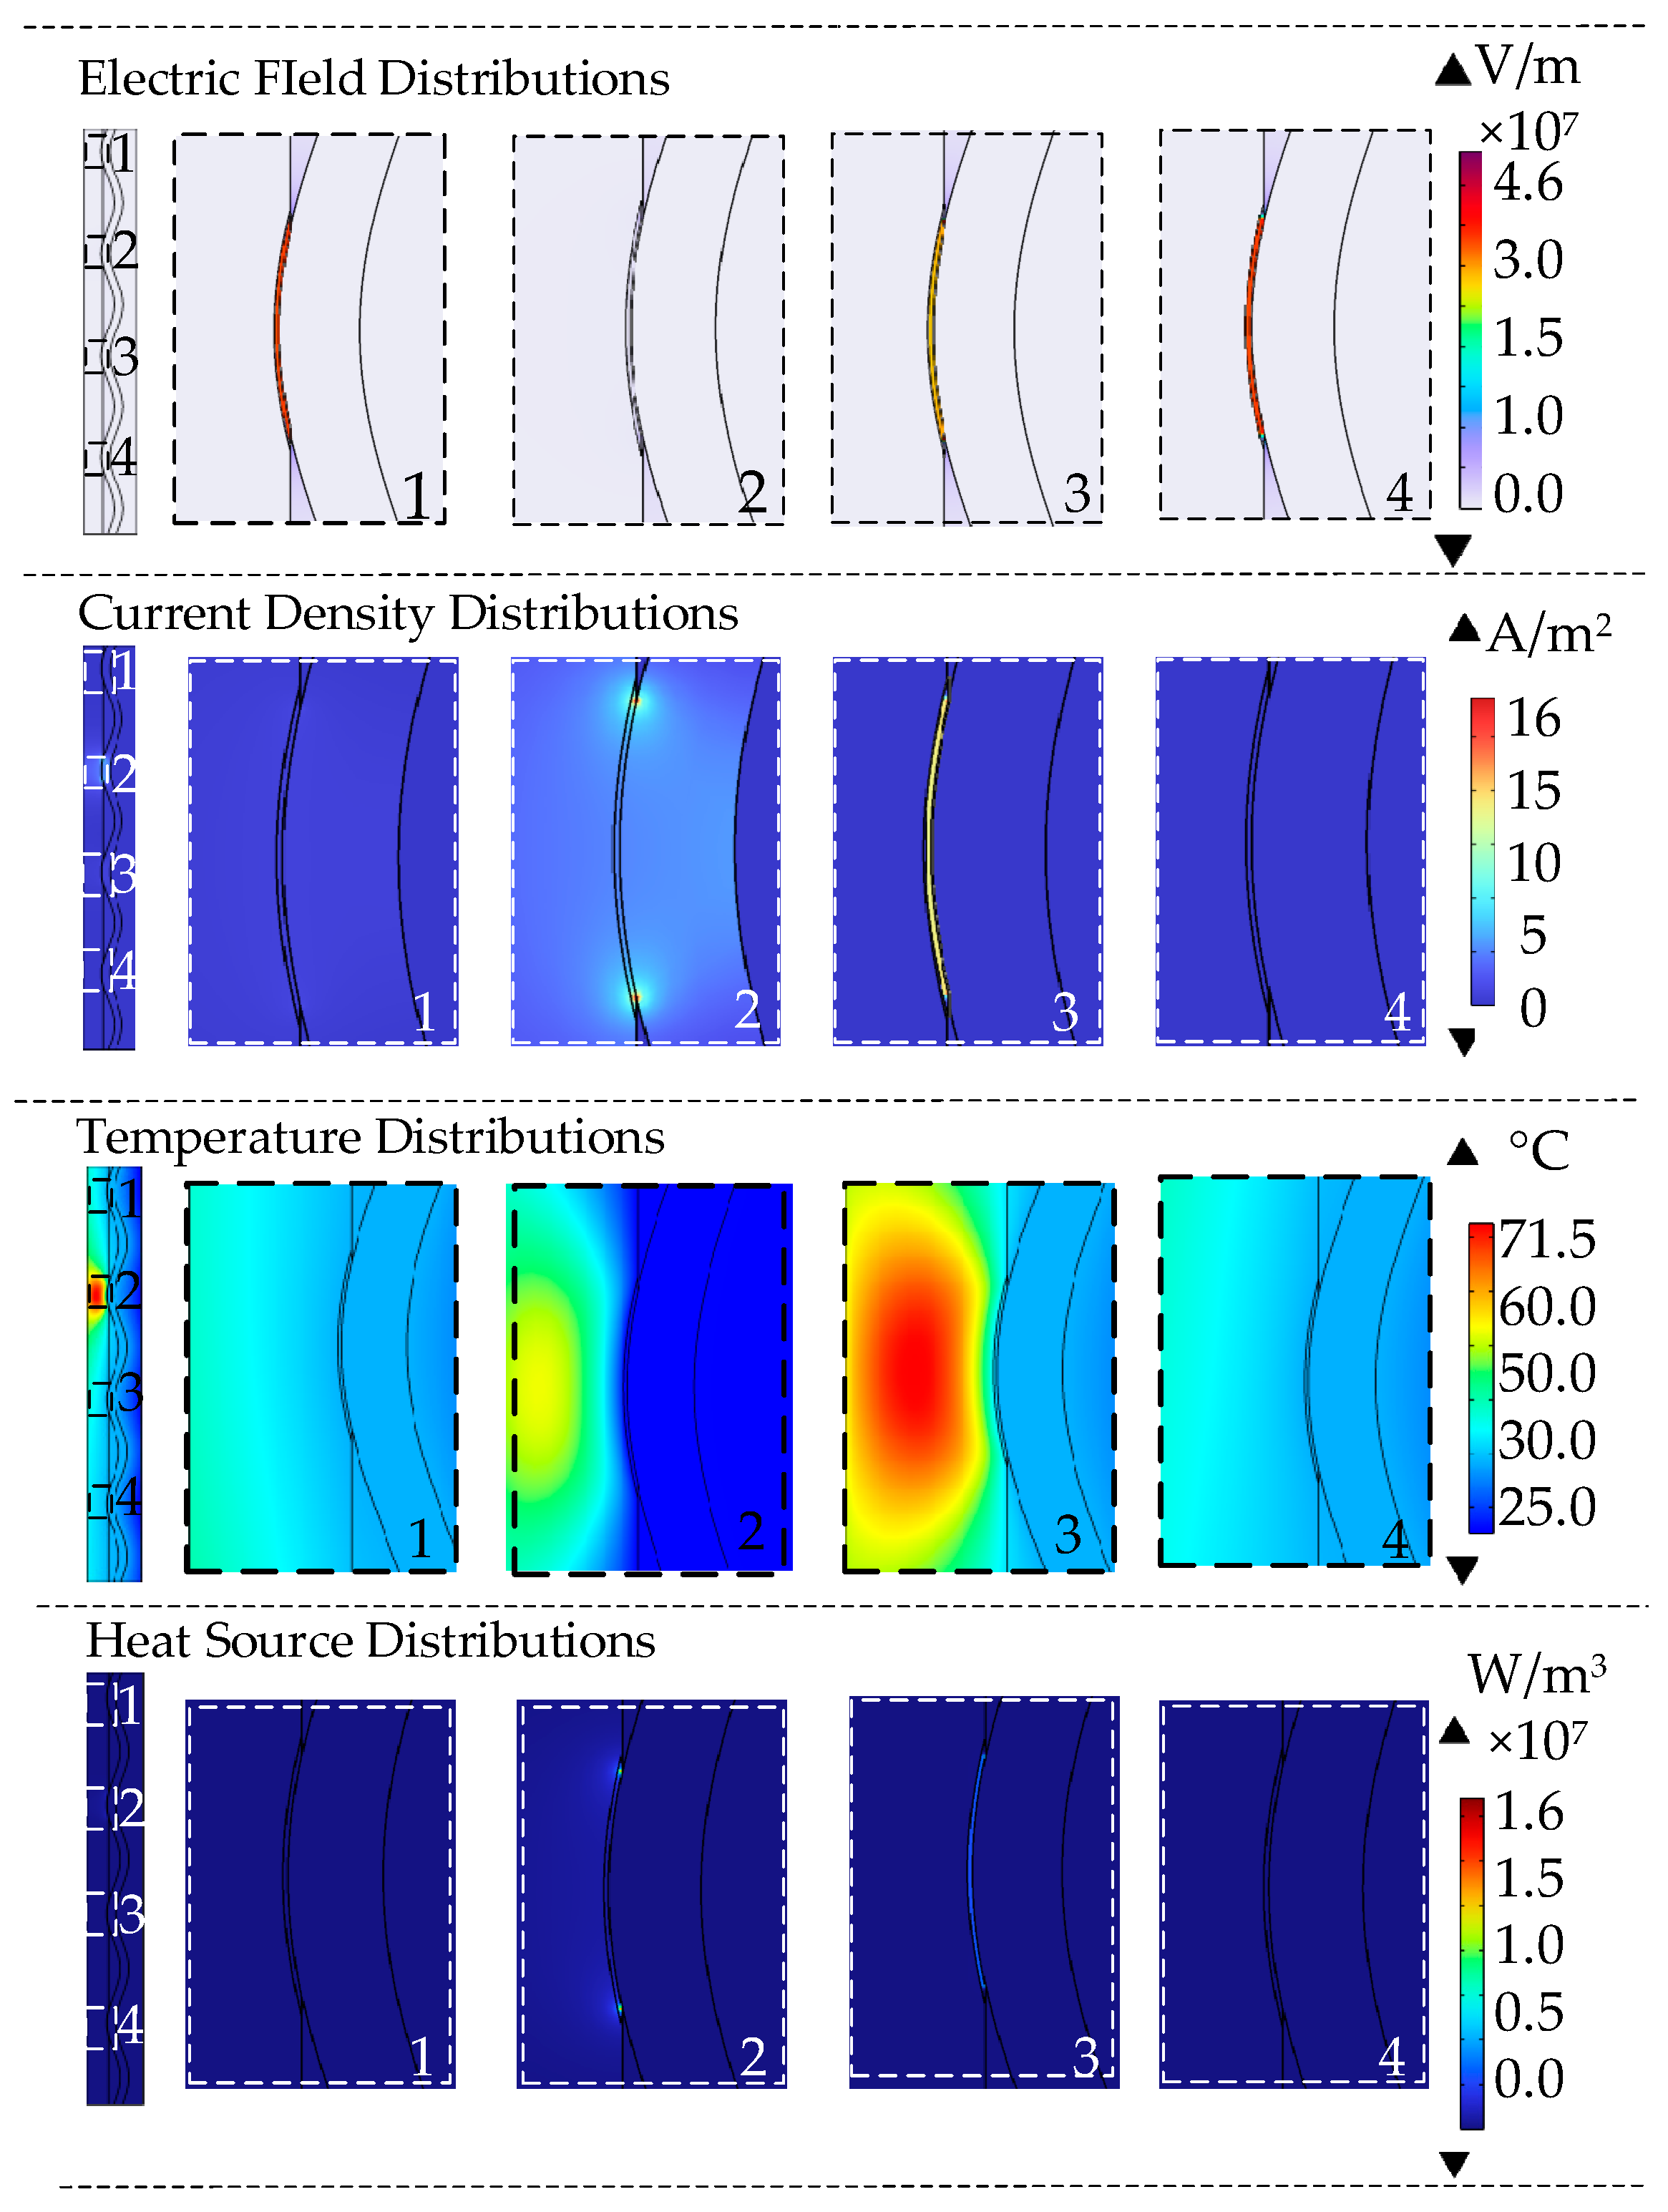
As shown in
Figure 8, the overall and local electro–thermal field distributions of the water-blocking buffer layer and the corrugated aluminum sheath are simulated for a contact-length ratio of air-gap barrier: well contact: moisture defect: white-powder barrier equal to 1:1:1:1. Strong electric field concentrations are observed at the air-gap and white-powder barrier regions, with the maximum electric field distortion occurring at the white-powder barrier and reaching 46 kV/mm, whereas the electric field at the well-contacted regions is close to zero. The current blocked by the insulated regions accumulates at the well-contacted interfaces, where the current density reaches up to 16 A/m
2. The maximum temperature of the buffer layer appears in the well-contacted regions due to localized Joule heating, with a peak temperature of 71.5 °C. Although the electrical conductivity of the moist defect region is lower than that of the well-contacted region, it is significantly higher than that of the air-gap and white-powder barrier regions. Meanwhile, its high relative permittivity promotes electric field concentration, resulting in the highest volumetric heat generation density of 1.6 × 10
7 W/m
3 under relatively high current density.
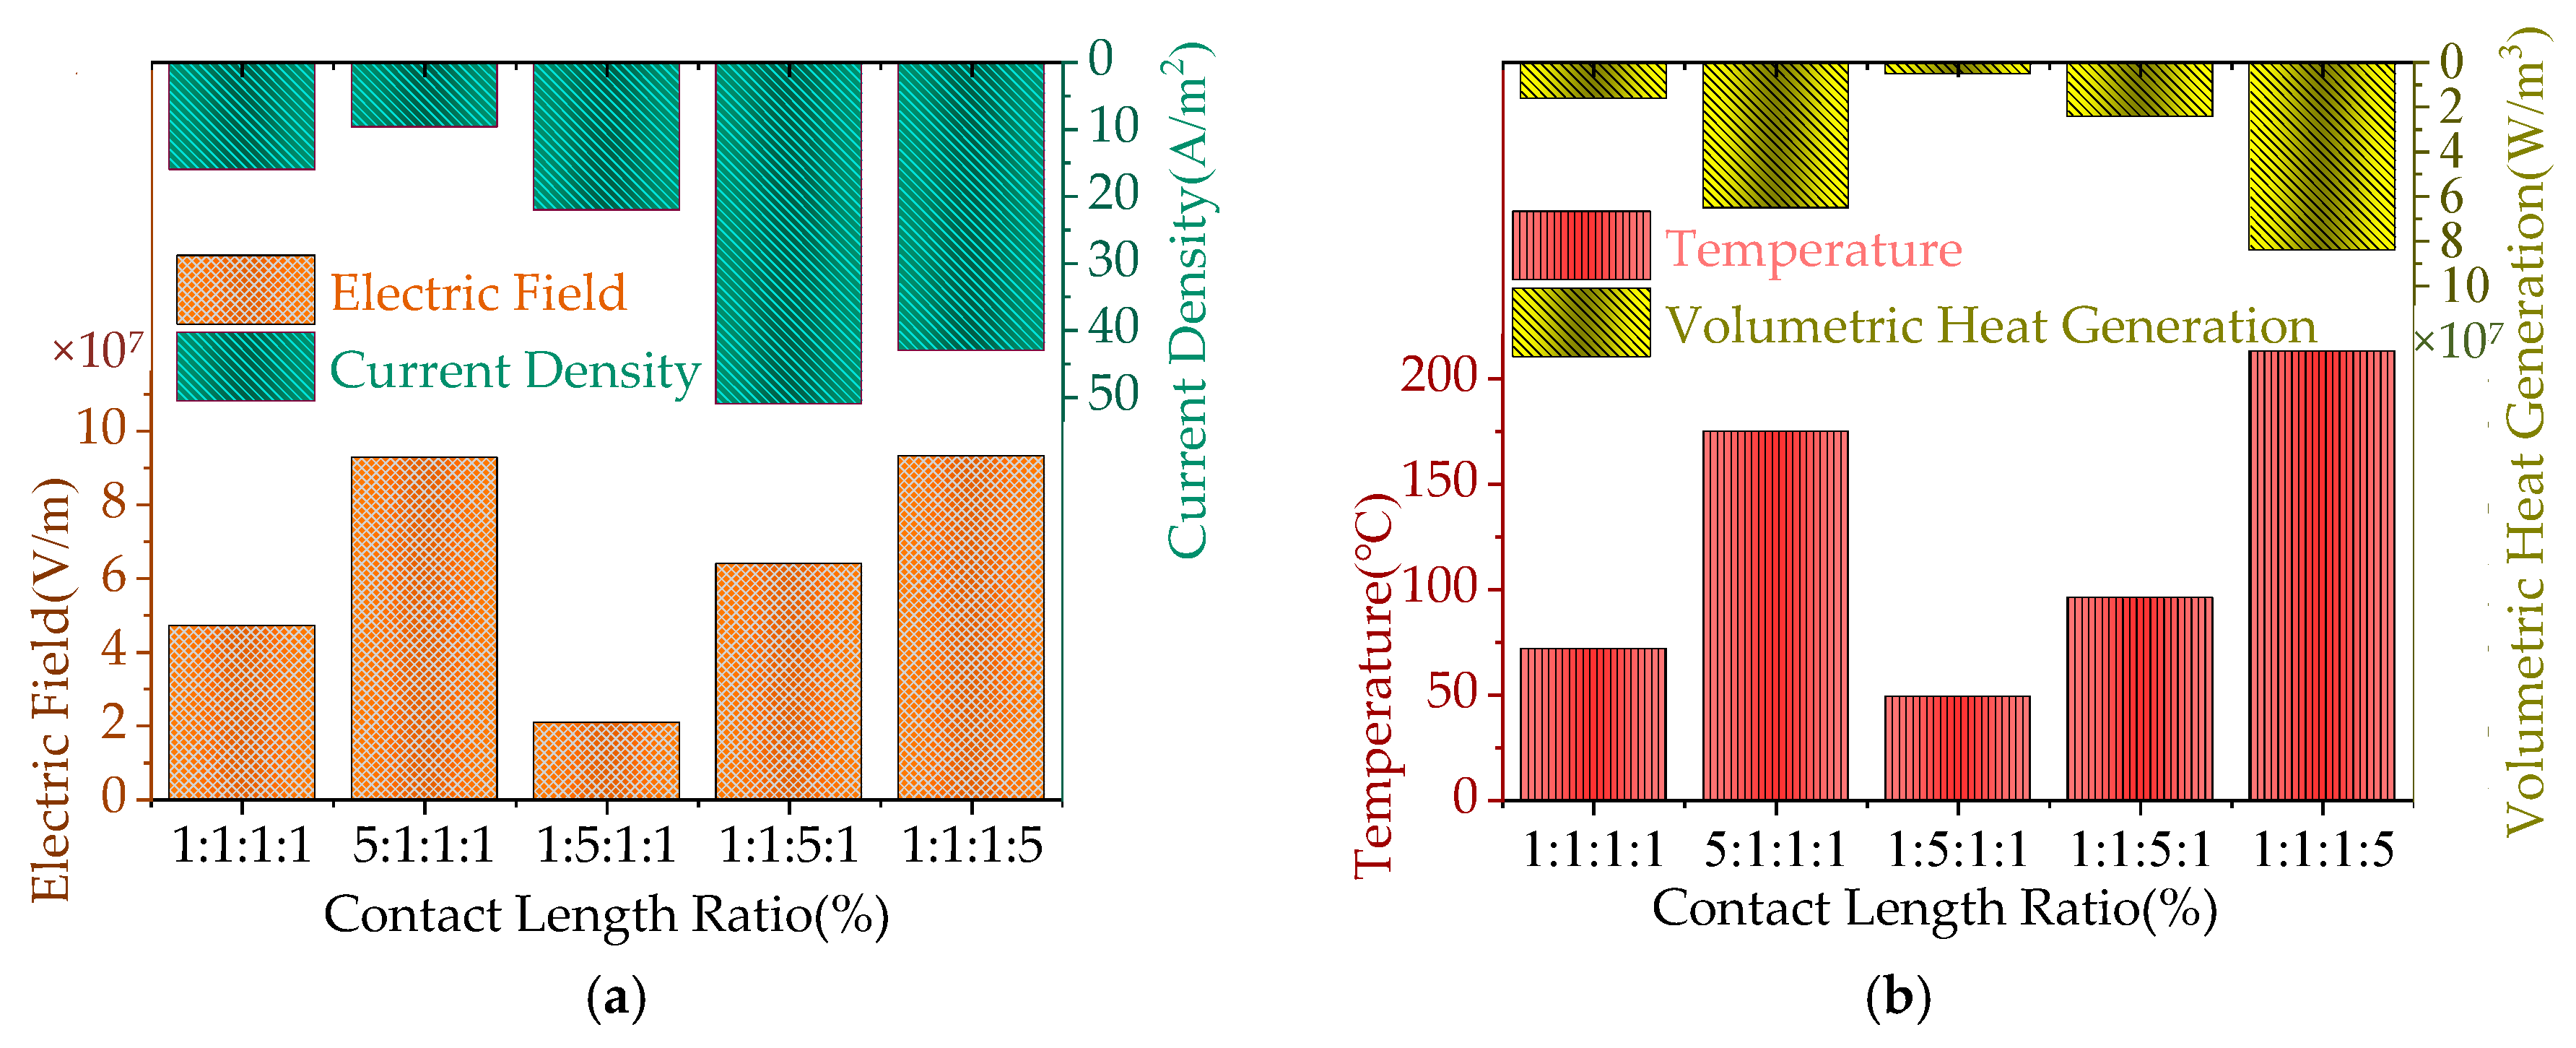
Figure 9 illustrates the electro–thermal field variation of the buffer layer under different defect contact length ratios. It should be noted that the contact length ratios defined in this study are intended to represent typical operating conditions corresponding to different defect severity levels. Taking the contact length ratio of air-gap barrier: good contact: moisture defect: powder barrier = 1:1:1:1 as the reference condition, the following representative scenarios are analyzed:
When the contact length ratio is 1:5:1:1, it represents the early stage of insulation-type defects in the cable. Under this condition, the proportion of good-contact regions is the largest, and the electric field distortion in both air-gap and powder barrier regions is minimal. The current density in the good-contact region is the lowest, at 9.6 A/m2, and the buffer-layer temperature is 49.2 °C, which is slightly higher than the normal operating temperature.
When the contact length ratio is 5:1:1:1, it represents a severe air-gap barrier defect condition. In this case, the electric field in the air gap is distorted to 93 kV/mm. Significant current crowding occurs in the good-contact region, where the current density can reach 51.6 A/m2, and the maximum buffer-layer temperature rises to 175 °C.
When the contact length ratio is 1:1:5:1, it represents a severe moisture ingress condition. Under this condition, all electro–thermal field parameters are higher than those under the reference ratio of 1:1:1:1. The electric field, current density, temperature, and heat source are 64 kV/mm, 22 A/m2, 96.2 °C, and 2.4 × 10⁷ W/m3, respectively.
When the contact length ratio is 1:1:1:5, it represents a severe white-powder barrier condition. In this case, the maximum electric field distortion in the powder barrier region reaches 94 kV/mm. The current density in the good-contact region reaches 43.3 A/m2, the buffer-layer temperature increases to 213 °C, and the maximum heat source appears in the moisture-affected region, reaching 8.4 × 10⁷ W/m3.
The analysis of cable operation with multiple coexisting defects demonstrates that air-gap barrier and white-powder barrier at poor-contact locations produce the most severe electric field distortion, while current tends to accumulate in the well-contacted and moist regions. Both effects intensify local heat generation and elevate the buffer-layer temperature. Such localized and non-uniform thermal accumulation may trigger buffer-layer ablation and simultaneously accelerate the formation of white powder. Therefore, buffer-layer ablation is not caused by a single electric or thermal factor, but rather by the coupled effects of the electric field and temperature field acting synergistically.
4. Discussion
A steady-state electro–thermal field assumption was adopted in this study, with the primary objective of evaluating the long-term ablation risk induced by buffer-layer defects under continuous power-frequency operating conditions. Mechanical stress was not explicitly considered in the model. Although material aging may result in parameter degradation, it does not alter the dominant ablation mechanism governed by the combined effects of electric field enhancement, current concentration, and localized temperature rise. It should be clearly stated that, according to Refs. [
11,
21], the air-gap breakdown field strength in this study is assumed to range from 2 to 3 kV/mm. When the air-gap electric field approaches or exceeds this range, local partial discharge may occur. In addition, 165 °C is regarded as the ablation initiation temperature of the buffer layer, while temperatures above 220 °C correspond to its thermal decomposition temperature [
12,
21]. These thresholds serve as reference criteria for simulation-based assessment and may vary depending on the operating environmental conditions.
Simulation results under different buffer-layer conditions in
Section 3 indicate that when the buffer layer maintains good contact with the corrugated aluminum sheath, the maximum electric field in the air gap around the trough of the sheath is 0.045 kV/mm (lower than the electric field threshold), which is consistent with the experimental observation in Ref. [
20] that no ablation occurs when the dry buffer layer is in good contact. In
Section 3.2, when an air-gap barrier begins to form between the buffer layer and the aluminum sheath, the electric field in a radial air gap of 0.01 mm reaches 8.5 kV/mm (exceeding the electric field threshold). This result agrees with Ref. [
11], in which a floating voltage was applied to a buffer layer with an air-gap barrier and ablation spots were observed. Under the condition of a 97.5% air-gap barrier ratio in
Section 3.2, increasing the axial length of the air-gap barrier from 0.1 m to 3 m causes the current density to increase from 3.5 A/m
2 to 65.5 A/m
2. In comparison, Ref. [
10] reported experimentally that a local current density of 14 A/m
2 is sufficient to trigger current-induced ablation in the buffer layer. In
Section 3.3, as the moisture content of the buffer layer increases from 5% to 20%, the air-gap electric field ranges from 5 to 9 kV/mm (all exceeding the electric field threshold), which is consistent with Ref. [
24], where it was concluded that moisture ingress causes the electric field within the air gap to exceed the dielectric strength of air. Furthermore, when the axial length of the air-gap barrier increases from 0.1 m to 3 m under moist conditions, the current density of the moisture-conditioned buffer layer increases from 3 A/m
2 to 61.3 A/m
2, and the maximum temperature rises from 43 °C to 227 °C. These results are consistent with Ref. [
12], which reported that when the poor-contact length of a moisture-conditioned buffer layer reaches 1–2 m, the temperature rise can exceed 47 °C and 155 °C, respectively.
Under the combined action of an electric field and moisture, PAANa undergoes electrochemical decomposition and induces electrochemical corrosion of the aluminum sheath, generating high-resistivity products such as NaHCO
3, Na
2CO
3, and Al(OH)
3 [
8,
9]. As shown in
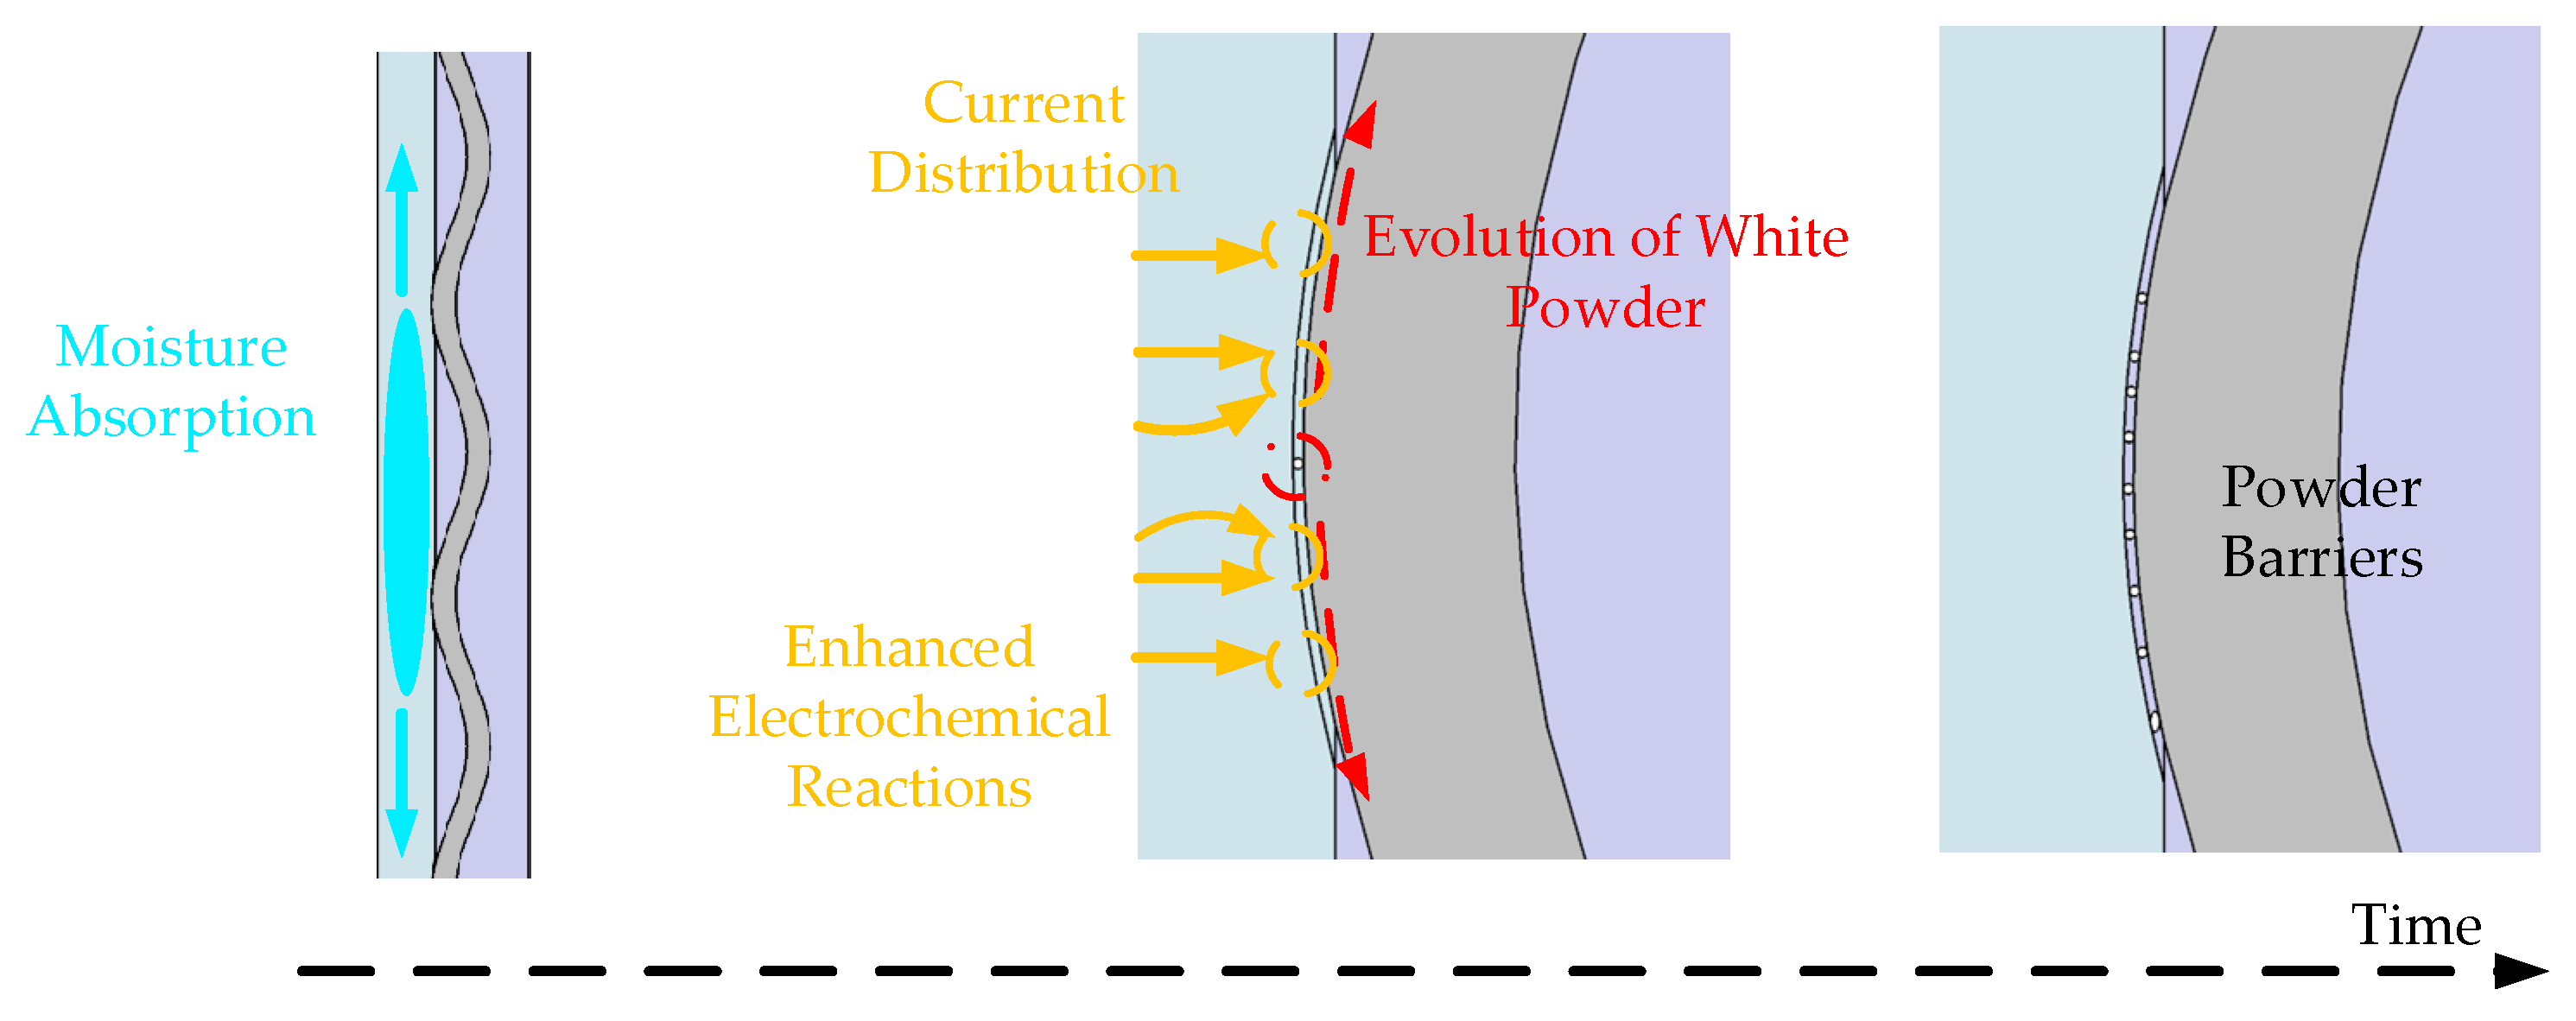
Figure 10, in the initial stage, white-powder precipitates at the contact interface between the buffer layer and the aluminum sheath. Although electrical contact is still maintained at this stage, its high resistivity increases the surrounding current density, thereby accelerating the electrochemical corrosion of the aluminum sheath. When the white powder develops along the interface to the extent that the electrical contact between the buffer layer and the aluminum sheath is interrupted, the local electric field at the initial white-powder region may exceed the breakdown strength of air. The resulting partial discharge and localized overheating act as direct triggers for buffer-layer ablation. Simulations in
Section 3.4 show that the interruption of current flow at this trough leads to increased current density in adjacent trough regions. As the powder barrier region continues to expand, higher current densities accumulate in both the well-contacted and moisture-affected regions, and the local temperature may reach the ablation initiation temperature of the buffer layer. Ref. [
20] experimentally observed that a moisture-conditioned buffer layer with poor contact generates white powder on the moist surface, accompanied by severe corrosion of the aluminum electrode and surface carbonization. This material degradation phenomenon is in good agreement with the electro–thermal field distortion characteristics observed in the present numerical simulations. The ablation initiation process of the buffer layer can be summarized as follows: moisture ingress leads to an increase in buffer-layer temperature, which accelerates the electrochemical corrosion reaction of the aluminum sheath and the dehydration of semiconductive adhesive materials. The generated white-powder barrier then induces local discharge, current concentration, and localized overheating at different stages, ultimately promoting buffer-layer ablation.