Article

Structural Design and Electromechanical Performance Verification of High-Voltage Optical Fiber Composite Insulators Based on Finite Element Simulation


1
Tsinghua Shenzhen International Graduate School, Tsinghua University, Shenzhen 518071, China
2
Electric Power Science Research Institute, State Grid Jibei Electric Power Co., Ltd., Beijing 102206, China
3
Beijing Grid Electric Power Technology Co., Ltd., Beijing 100005, China
*
Authors to whom correspondence should be addressed.
These authors contributed equally to this work.
Energies 2026, 19(5), 1202; https://doi.org/10.3390/en19051202
Submission received: 30 December 2025 / Revised: 17 February 2026 / Accepted: 25 February 2026 / Published: 27 February 2026

Abstract

Silicone rubber optical fiber composite insulators introduce interface defects due to embedded optical fibers, and their structural design remains immature, resulting in inadequate interface sealing performance. In actual operation, the combined effects of high electric fields, high humidity and heat, and mechanical loads lead to frequent failures. This study proposes replacing conventional silicone rubber with cycloaliphatic epoxy resin (CEP), which exhibits superior aging resistance, to enhance long-term operational reliability. However, the correlation mechanism between the structural parameters of CEP optical fiber insulators and their electromechanical properties remains unclear, lacking corresponding design basis. Therefore, based on finite element simulation technology, this study systematically analyzed the influence patterns of core rod diameter, fiber implantation method, spiral groove angle, fiber implantation quantity, and voltage equalization ring structural parameters (outer diameter, circular tube radius, shielding depth) on their mechanical and electrical properties. Research findings indicate that in terms of mechanical properties, the helical groove structure with a 40 mm core rod diameter, a groove angle of 135°, and six embedded optical fibers exhibits the lowest optical fiber strain. In terms of electrical performance, the minimum peak electric field strength at the end of the insulator occurs when the equalizing ring has an outer diameter of 370 mm, the circular tube radius is 25 mm, and the shielding depth is 50 mm, reaching only 4.6 kV/cm, which meets the requirements of DL/T 1000.3-2015. This study establishes optimization principles for key structural parameters of CEP optical fiber composite insulators, offering significant engineering value for enhancing the overall performance of optical fiber composite insulators and improving the operational safety of power systems.

1. Introduction

With the accelerated development of new power systems, new optical current transformers (OCTs) have gained widespread adoption in critical scenarios such as converter stations. This is due to their ability to perform sensing measurements and data transmission primarily through optical signals, offering the advantage of immunity to electromagnetic interference [1,2]. As a core component of OCTs, fiber-optic insulators are based on composite insulator structures with embedded optical fibers to achieve both optical signal transmission and electrical insulation. When these embedded fibers are engraved with gratings, they can also perform sensing functions, attracting significant scholarly attention in recent years [3,4]. The comprehensive performance of optical fiber insulators is significantly influenced by structural design and fabrication processes. Existing research primarily focuses on silicone rubber umbrella sleeve materials, with limited comparative studies on the performance differences among various optical fiber insulator structures. Currently, optical fiber insulators can be categorized based on optical fiber implantation methods into core-through, slotted, surface-mounted, integral pultruded, and integral wound types [5].
Through-hole-type optical fiber insulators feature a hollow glass-fiber-reinforced epoxy resin core rod as the main body, with the optical fiber directly embedded into the central through-hole. Internal insulation is achieved by filling with an inert gas or securing with insulating potting material [6]. The through-hole type currently faces challenges in maintaining long-term seal integrity at the optical fiber interface, prone to leakage of filling gas and potting material [7,8]. Slotted-type optical fiber insulators feature grooves machined into the core rod surface, with optical fibers secured within these slots using adhesive [9,10]. Research on the slotted type remains limited and primarily focuses on monitoring performance. Surface-mounted optical fiber insulators directly bond the optical fiber to the core rod surface using adhesive, then cure a protective cap over both the core rod and optical fiber surface to complete the insulator [11,12]. Surface-mounted insulators share structural similarities with slotted types. Their uncompromising core rod design has gained broader acceptance among researchers. However, silicone rubber optical fiber insulators with this structure still exhibit multiple interfaces. During operation, aging effects on these interfaces can lead to defects and failures, hindering long-term stable performance. Meanwhile, integral pultrusion and integral winding methods remain in the research phase due to their high manufacturing complexity, lacking mature processes and commercial products [13,14].
Existing optical fiber insulator structures primarily rely on silicone rubber skirting materials. The embedded optical fibers inevitably introduce heterogeneous interfaces, and coupled with immature structural designs, this leads to frequent interface sealing defects. Consequently, these interfaces become the weak points triggering internal insulation failures in fiber-optic insulators. During actual operation, the combined effects of high electric fields, high humidity and heat environments, and mechanical loads frequently cause failures in optical fiber composite insulators due to the aforementioned interface issues. This poses serious challenges to the safe and stable operation of power grids [15]. Therefore, there is an urgent need to introduce new materials and structures to develop a structural design that enhances the interface performance of optical fiber composite insulators, thereby fundamentally resolving the interface problems associated with these devices.
In recent years, cycloaliphatic epoxy resin (CEP) has gained attention for its excellent outdoor weather resistance, water-blocking properties, and interfacial adhesion. Consequently, researchers have gradually shifted their focus from silicone rubber composite insulators to CEP composite insulators [16]. Existing research indicates that the water vapor transmission rate of cycloaliphatic epoxy resin at room temperature is only 5% that of silicone rubber materials. This property effectively blocks water molecules from penetrating the sheath to reach the interface, thereby inhibiting interface aging and failure [17]. Compared to silicone rubber sheathing materials, the cap body and core rod of cycloaliphatic epoxy resin can form an interface with superior performance [18]. Liu Y et al. conducted a simulation study on the temperature distribution during the curing process of cycloaliphatic epoxy resin insulators, discovering that thermal conductivity significantly influences the axial temperature distribution of the insulator, while curing temperature plays a dominant role in determining the degree of curing and temperature overshoot [19]. It is evident that replacing high-temperature vulcanized silicone rubber with CEP as the sheath material for optical fibers composite insulators, while incorporating a silicone rubber skirt over the cycloaliphatic epoxy sheath, yields an optical fiber composite insulator that simultaneously achieves excellent sealing performance, superior interface properties, and a simplified manufacturing process [20,21]. This approach holds promise for fundamentally resolving the inherent risk of interface failure in traditional optical fiber composite insulators.
However, cycloaliphatic epoxy resin exhibits distinct material properties compared to the traditional silicone rubber cap used in optical fiber composite insulators. The existing composite insulator structural design system primarily focuses on silicone rubber composite insulators, lacking standardized specifications for structural parameters such as fiber implantation methods and fiber quantities in optical fiber insulators. Currently, there are few finite element simulations studying the structural properties of annular cycloaliphatic epoxy resin insulators. When using existing fiber embedding methods to fabricate annular cycloaliphatic epoxy resin fiber insulators, the performance differences and relative advantages/disadvantages between different structures remain unclear, and structural design guidelines are lacking. Research in this area is urgently needed.
Therefore, this paper systematically analyzes and verifies the strain distribution characteristics and electric field distribution characteristics of CEP optical fiber composite insulators under different structural parameters based on finite element simulation technology and theoretical calculation methods. It proposes a structural optimization design method for cycloaliphatic epoxy resin optical fiber composite insulators. The mechanical property simulation results were verified through experiments, and the electrical property simulation results meet relevant standards. This research provides a theoretical foundation for the development and engineering application of cycloaliphatic epoxy resin optical fiber insulators.

2. Simulation Methods

2.1. Geometric Model

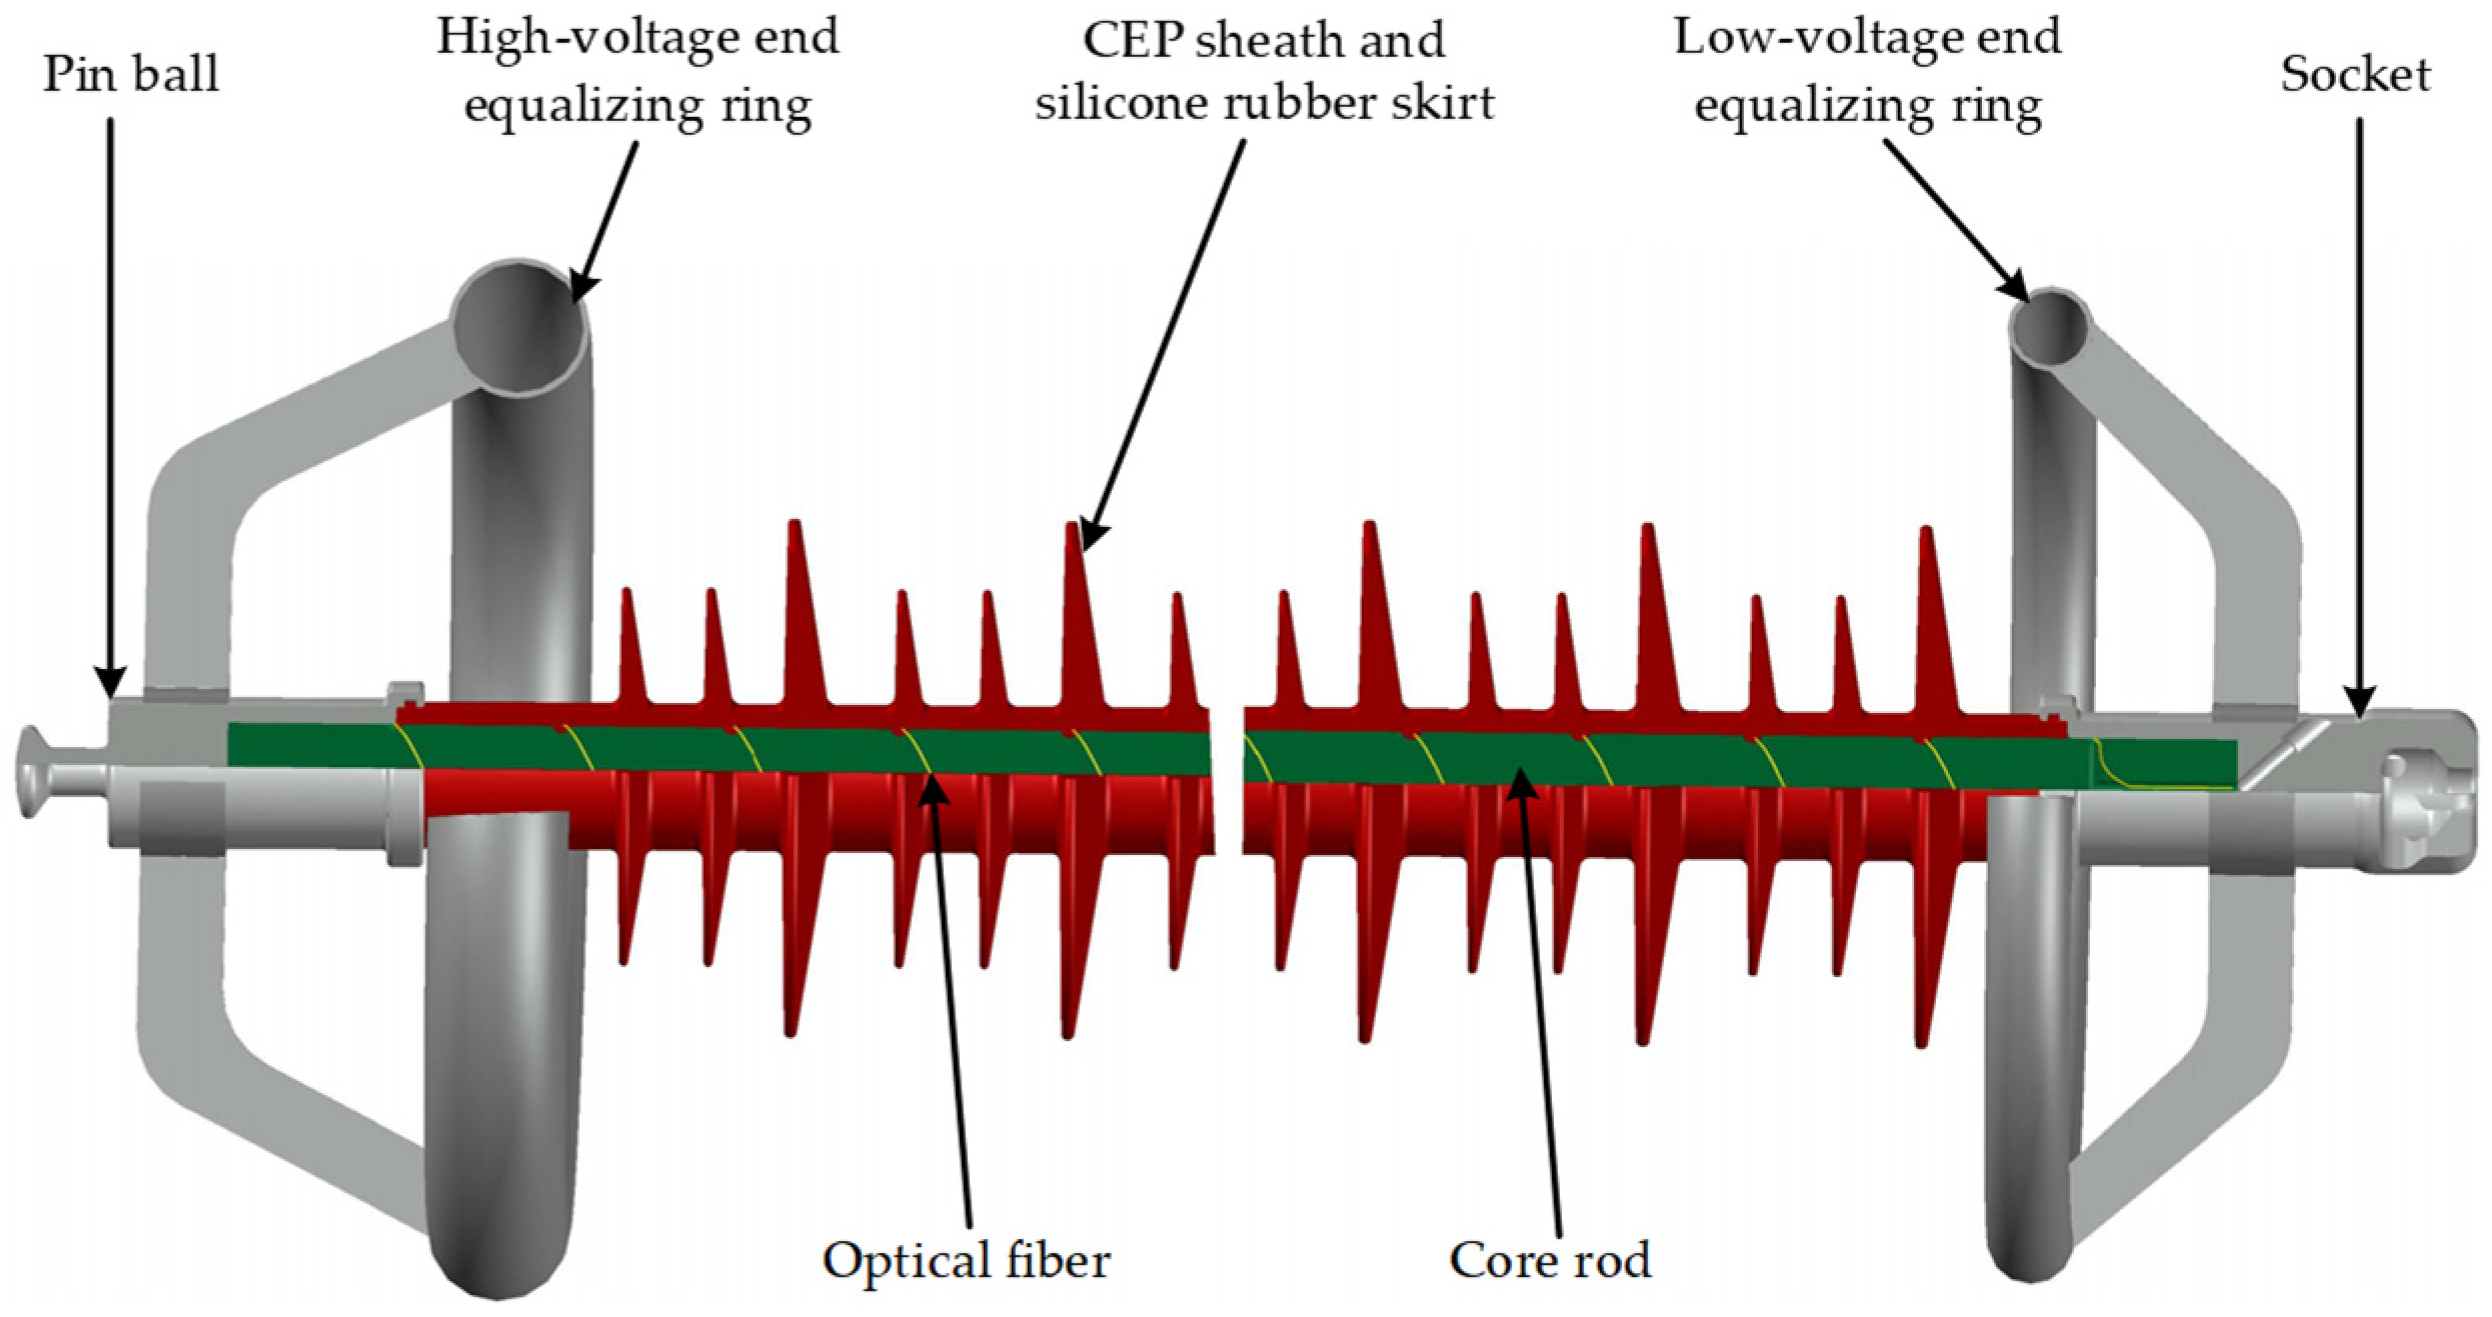
The simulation model in this paper was created using SOLIDWORKS 2022 software and analyzed via finite element simulation with COMSOL Multiphysics 6.2 software. Figure 1 shows the schematic structure of a CEP optical fiber composite insulator rated at 500 kV. Its structure consists of a core rod, optical fiber, end fittings (pin ball, socket and voltage equalizing ring), a CEP sheath, and a silicone rubber skirt assembly. The optical fiber and core rod are enclosed within the skirt sheath. The selection of structural parameters for the umbrella cover referenced State Grid Corporation of China’s enterprise standard Q/GDW 13253.1-2019 [22]. Both the high-voltage and low-voltage ends are equipped with an annular voltage equalizing ring, whose structural dimensions comply with power industry standards DL/T 1000.3-2015 [23]. Specifically, the high-voltage-end equalizing ring has an outer diameter of 370 mm, a circular tube radius of 25 mm, and a shielding depth of 50 mm; the low-voltage-end equalizing ring has an outer diameter of 350 mm, a circular tube radius of 15 mm, and a shielding depth of 30 mm.
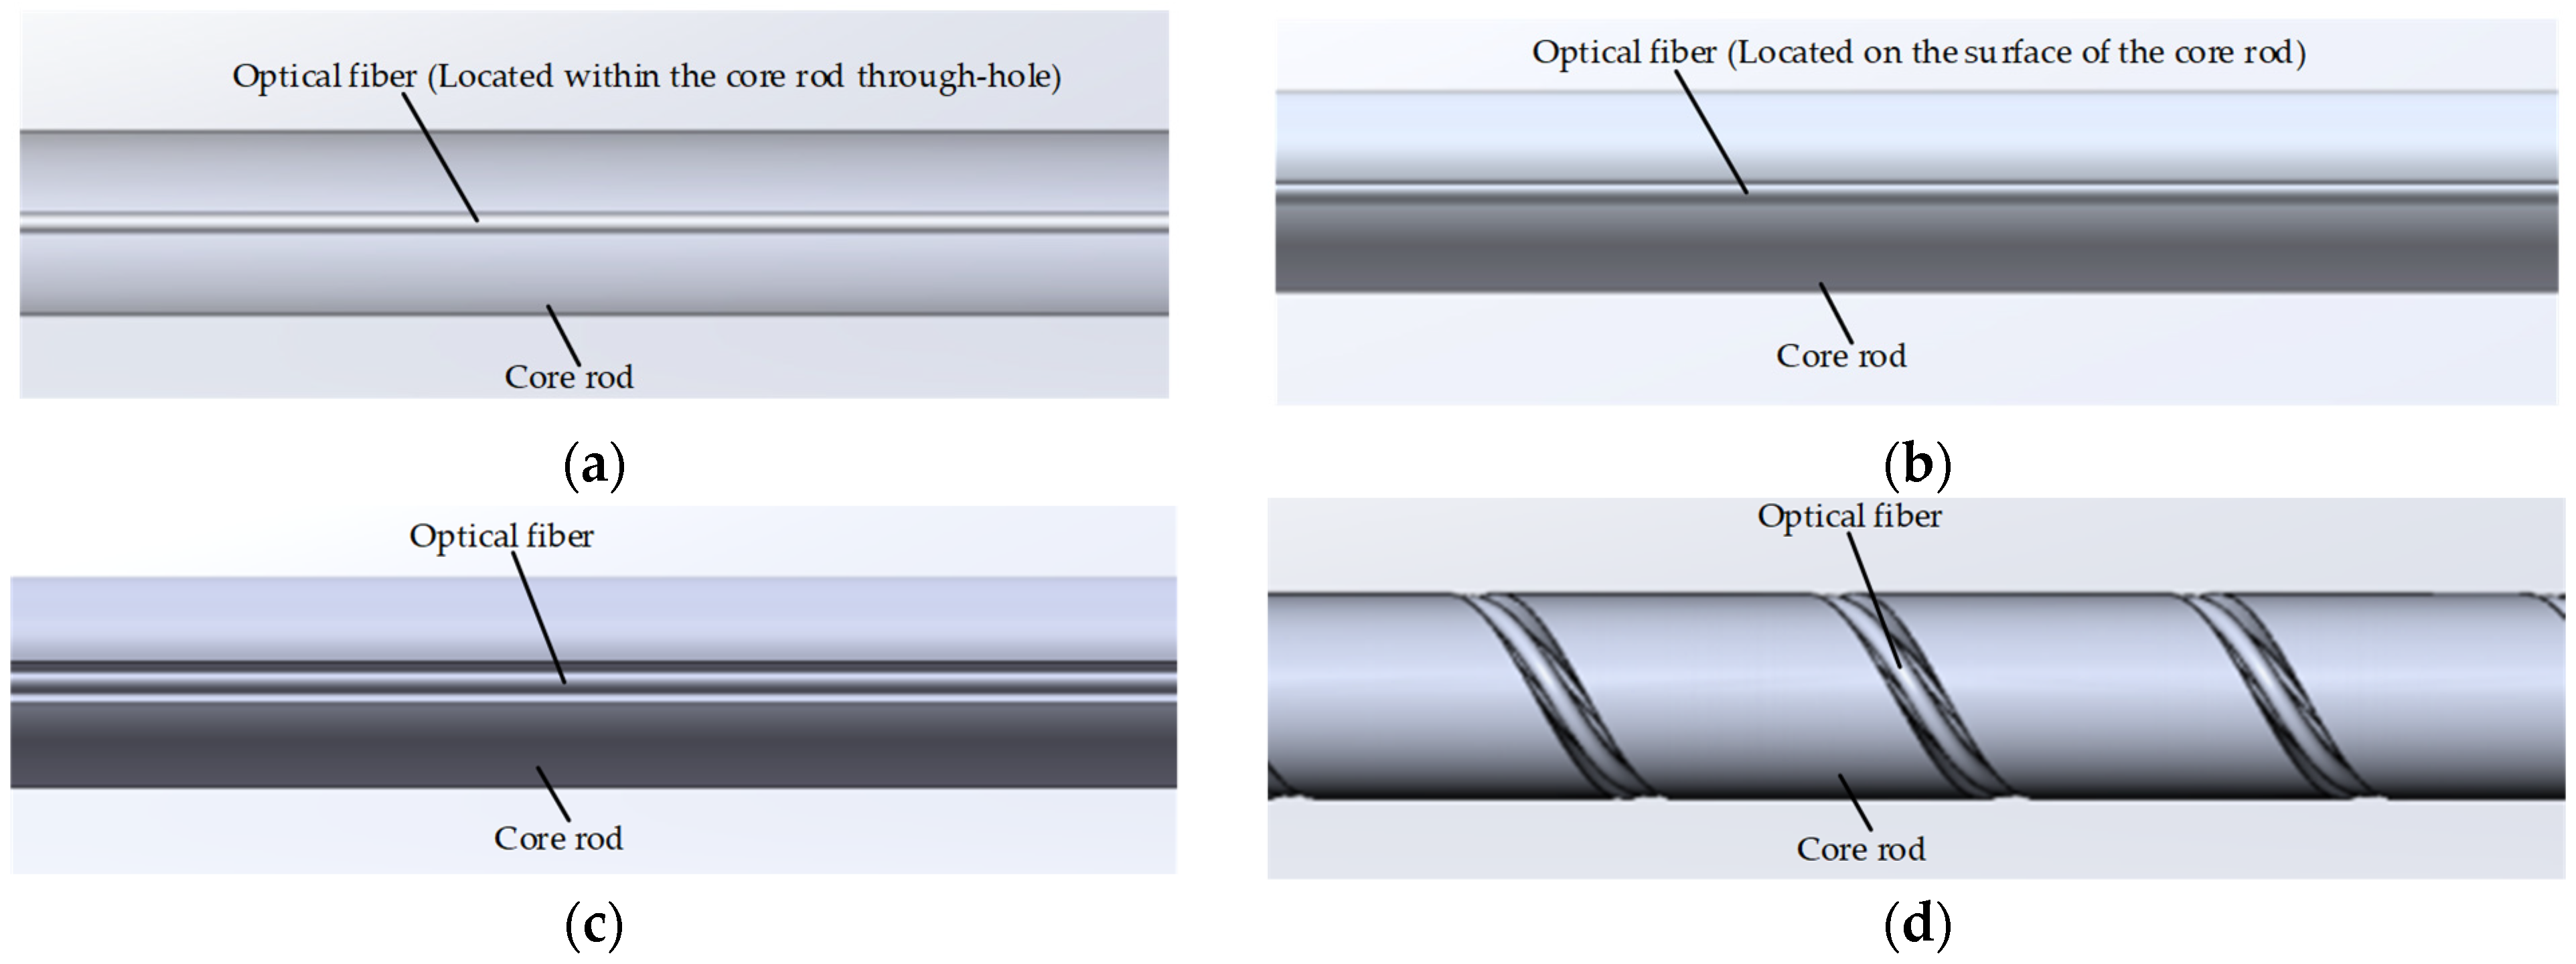
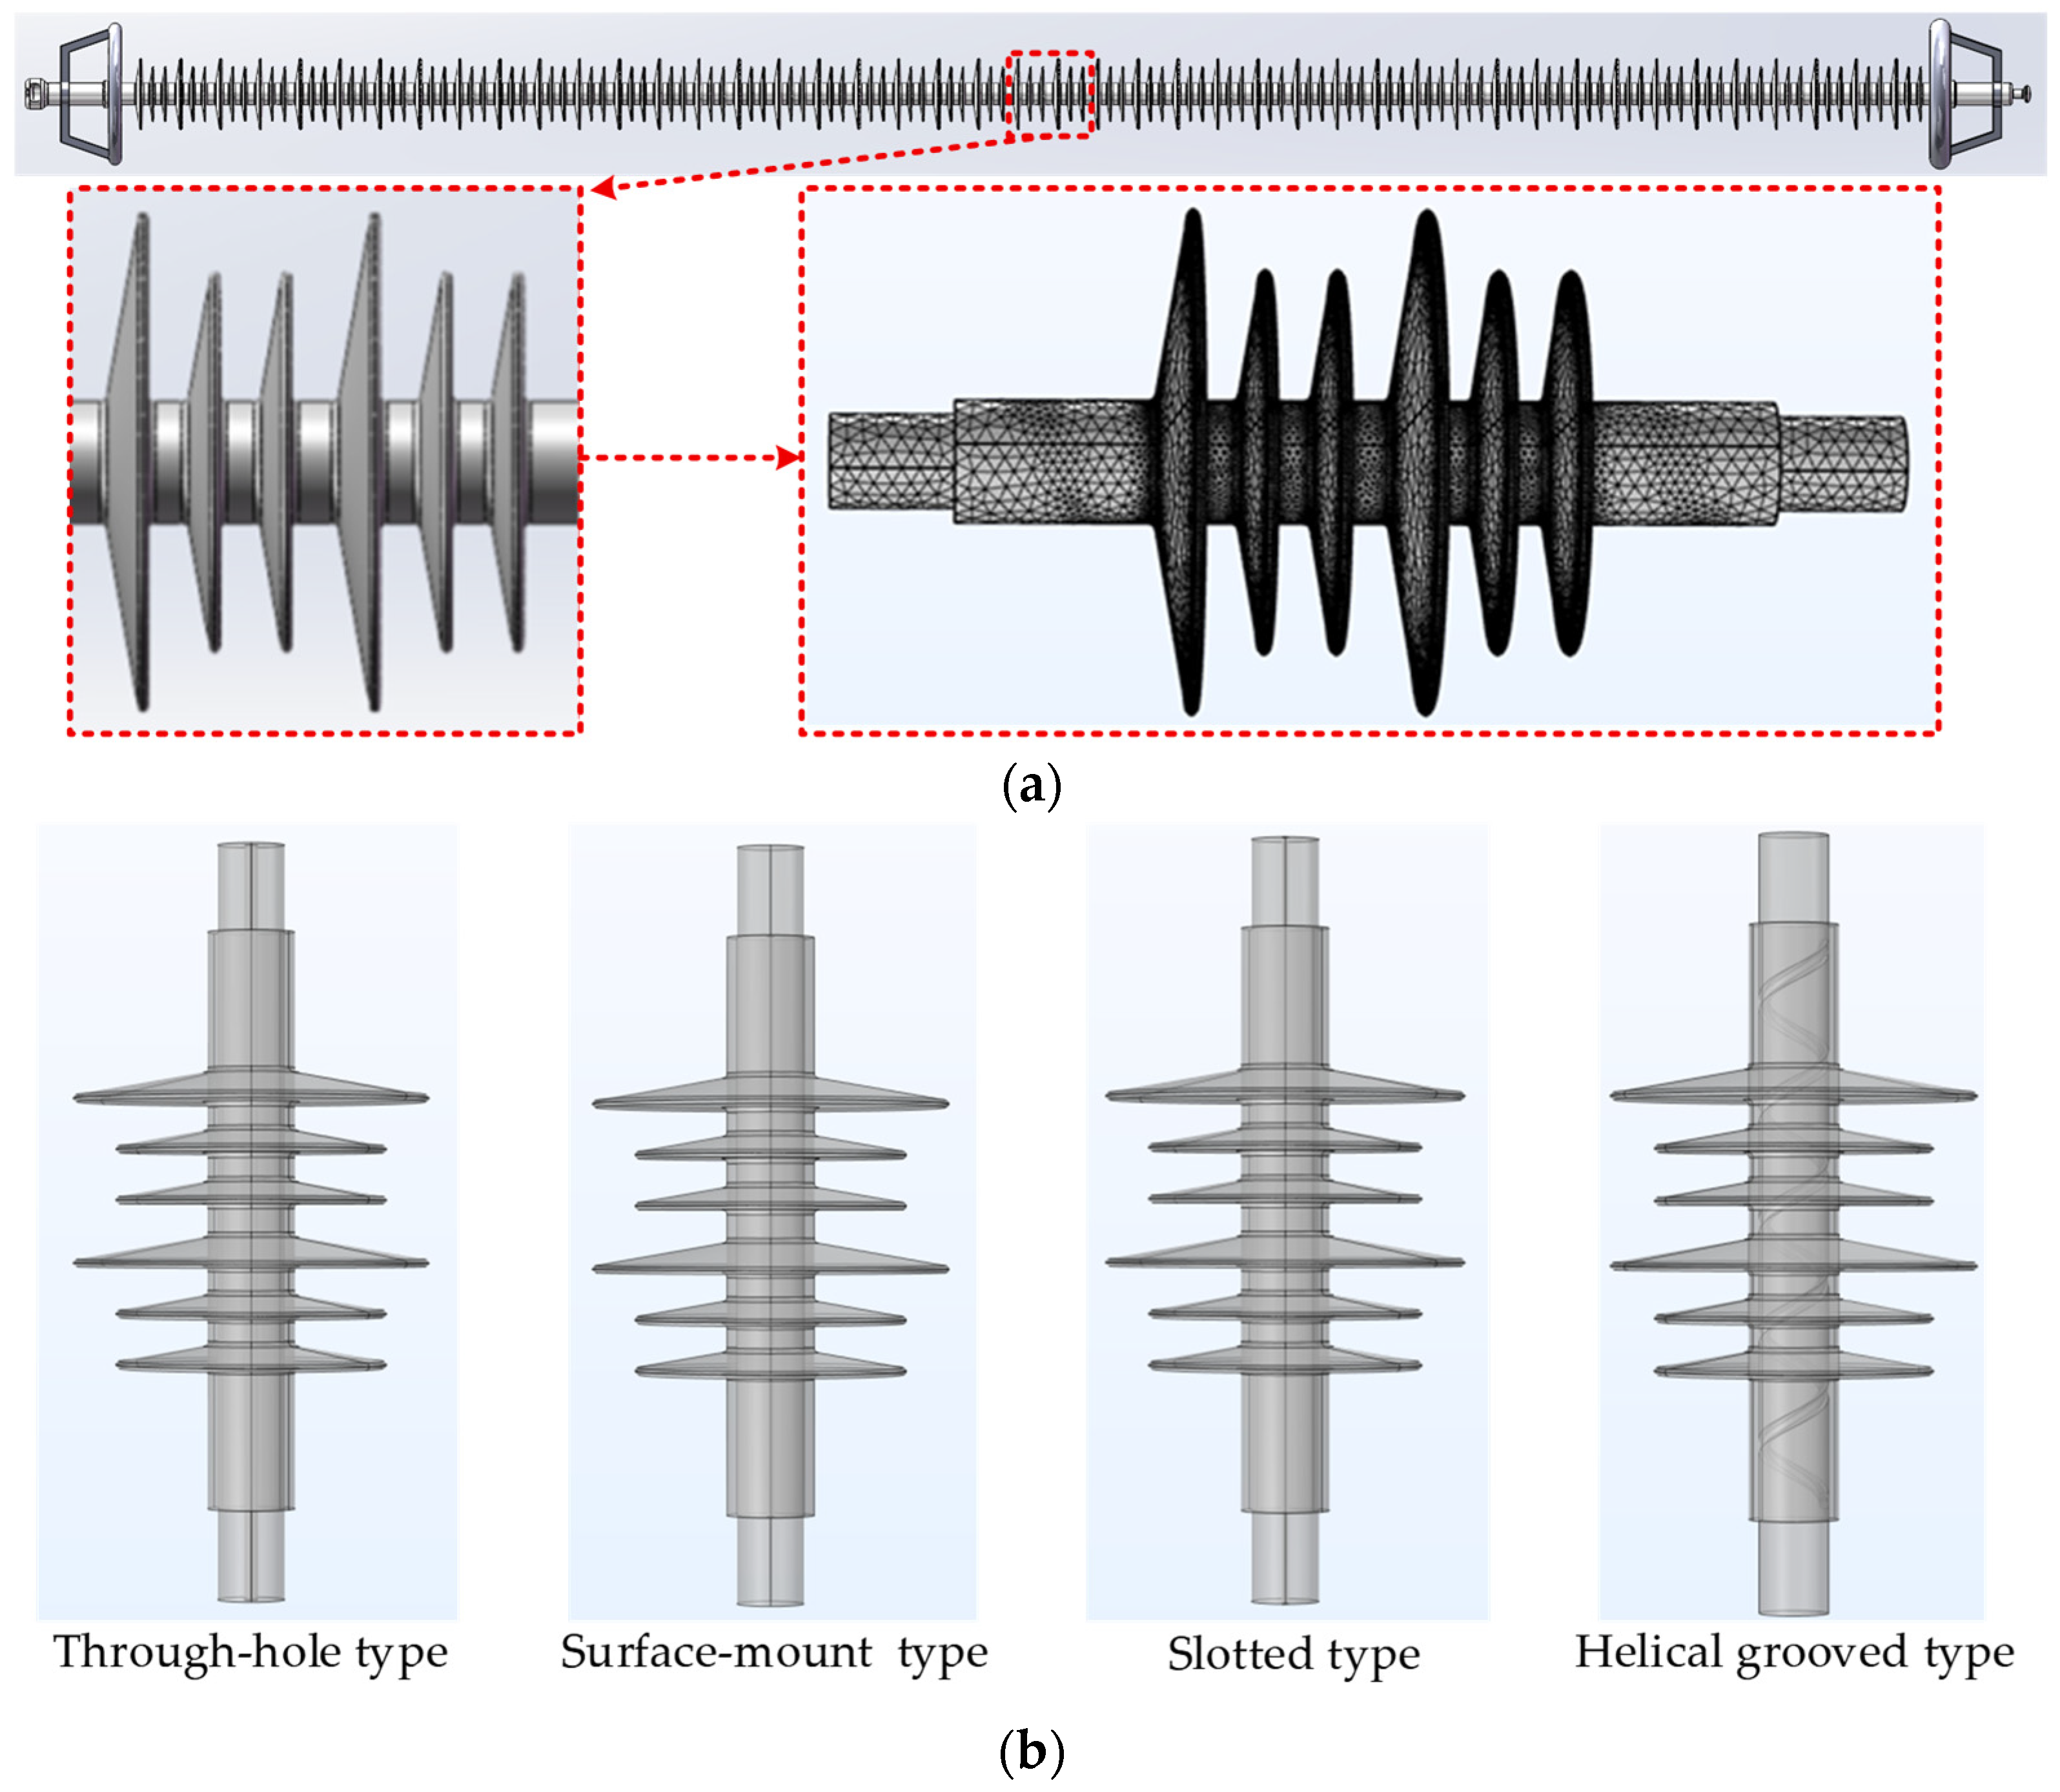
Among the remaining three methods, this paper proposes a helical grooved fiber embedding technique based on the slotted method and conducts mechanical performance simulations on the four selected fiber embedding approaches. The finite element simulation models were of the four fiber implantation methods shown in Figure 2. Given the excessive length of the full-length optical fiber composite insulator model and the prevalence of repetitive structures within it, calculations using the entire model yielded largely redundant results and incurred significant computational time. Therefore, the simulation model was simplified by extracting a segment encompassing two umbrella skirt cycles from the original model. Finite element simulation analysis was conducted using this model, as shown in Figure 3. In the simulation model, the core rod groove has a depth of 4 mm and a width of 8 mm. To simplify modeling at the fiber location and facilitate mesh generation, the modeling of individual fibers is equivalent. For instance, when implanting four 1 mm diameter fibers, they are simplified to a single 4 mm diameter fiber. Except for Section 3.1.4, all simulation models employ four fibers.
Following the introduction of the model setup, we proceed to define the boundary conditions. After importing the model into the software, we execute the “Form Composite” operation to simulate the bonded interface state post-curing. For the mechanical simulation, a partial schematic of the fiber–mandrel model is shown in Figure 2. A fixed constraint is applied at one end of the mandrel, while a boundary load is applied at the other end. The four fiber–mandrel–umbrella-sleeve models with two umbrella skirt cycles are shown in Figure 3. The mandrel cross-section on the socket side (left side of the model in Figure 3a) is set as a fixed constraint, while the mandrel cross-section on the pin ball side (right side of the model in Figure 3a) is set as a boundary load. During simulation, the model remains fixed in space relative to the fixed constraint surface. Tensile forces perpendicular to the boundary load surface generate stresses, strains, and displacements. The tensile load selection in the simulation referenced standard DL/T 2386-2021 [24]. Given the specialized application of the fiber-optic insulator as an OCT accessory, its typical tensile load test requirement is only 10 kN. Therefore, the applied load in the simulation was set to 10 kN. For the electric field simulation, a complete fiber-optic insulator model (as shown in Figure 1) was employed. The socket fitting was designated as the grounding end, while voltage excitation was applied at the ball head fitting. Considering the line’s effective operating voltage, the rated voltage applied at the pin ball fitting should be (500 kV × 1.1)/√3 ≈ 318 kV. The air domain boundary was defined as an “infinite element” to prevent boundary reflections from affecting the electric field distribution. Structural parameters of the CEP skirt sleeve are listed in Table 1. Material parameters for each component are detailed in Table 2 and Table 3.
To ensure the accuracy and reliability of the finite element simulation results, this section analyzes and explains the meshing scheme and its convergence. For the mesh type, we choose the free tetrahedral mesh because this mesh can not only completely describe the linear strain field and fundamentally avoid shear locking [34,35], but also can fit the complex curved surfaces and irregular boundaries in the insulator structure, facilitating local meshing in key areas such as interfaces and edges to ensure the accuracy of the solution for core physical quantities such as fiber strain and end field strength, and providing a reliable calculation basis for subsequent structural optimization. Therefore, the simulation in this study decides to adopt the free tetrahedral mesh.
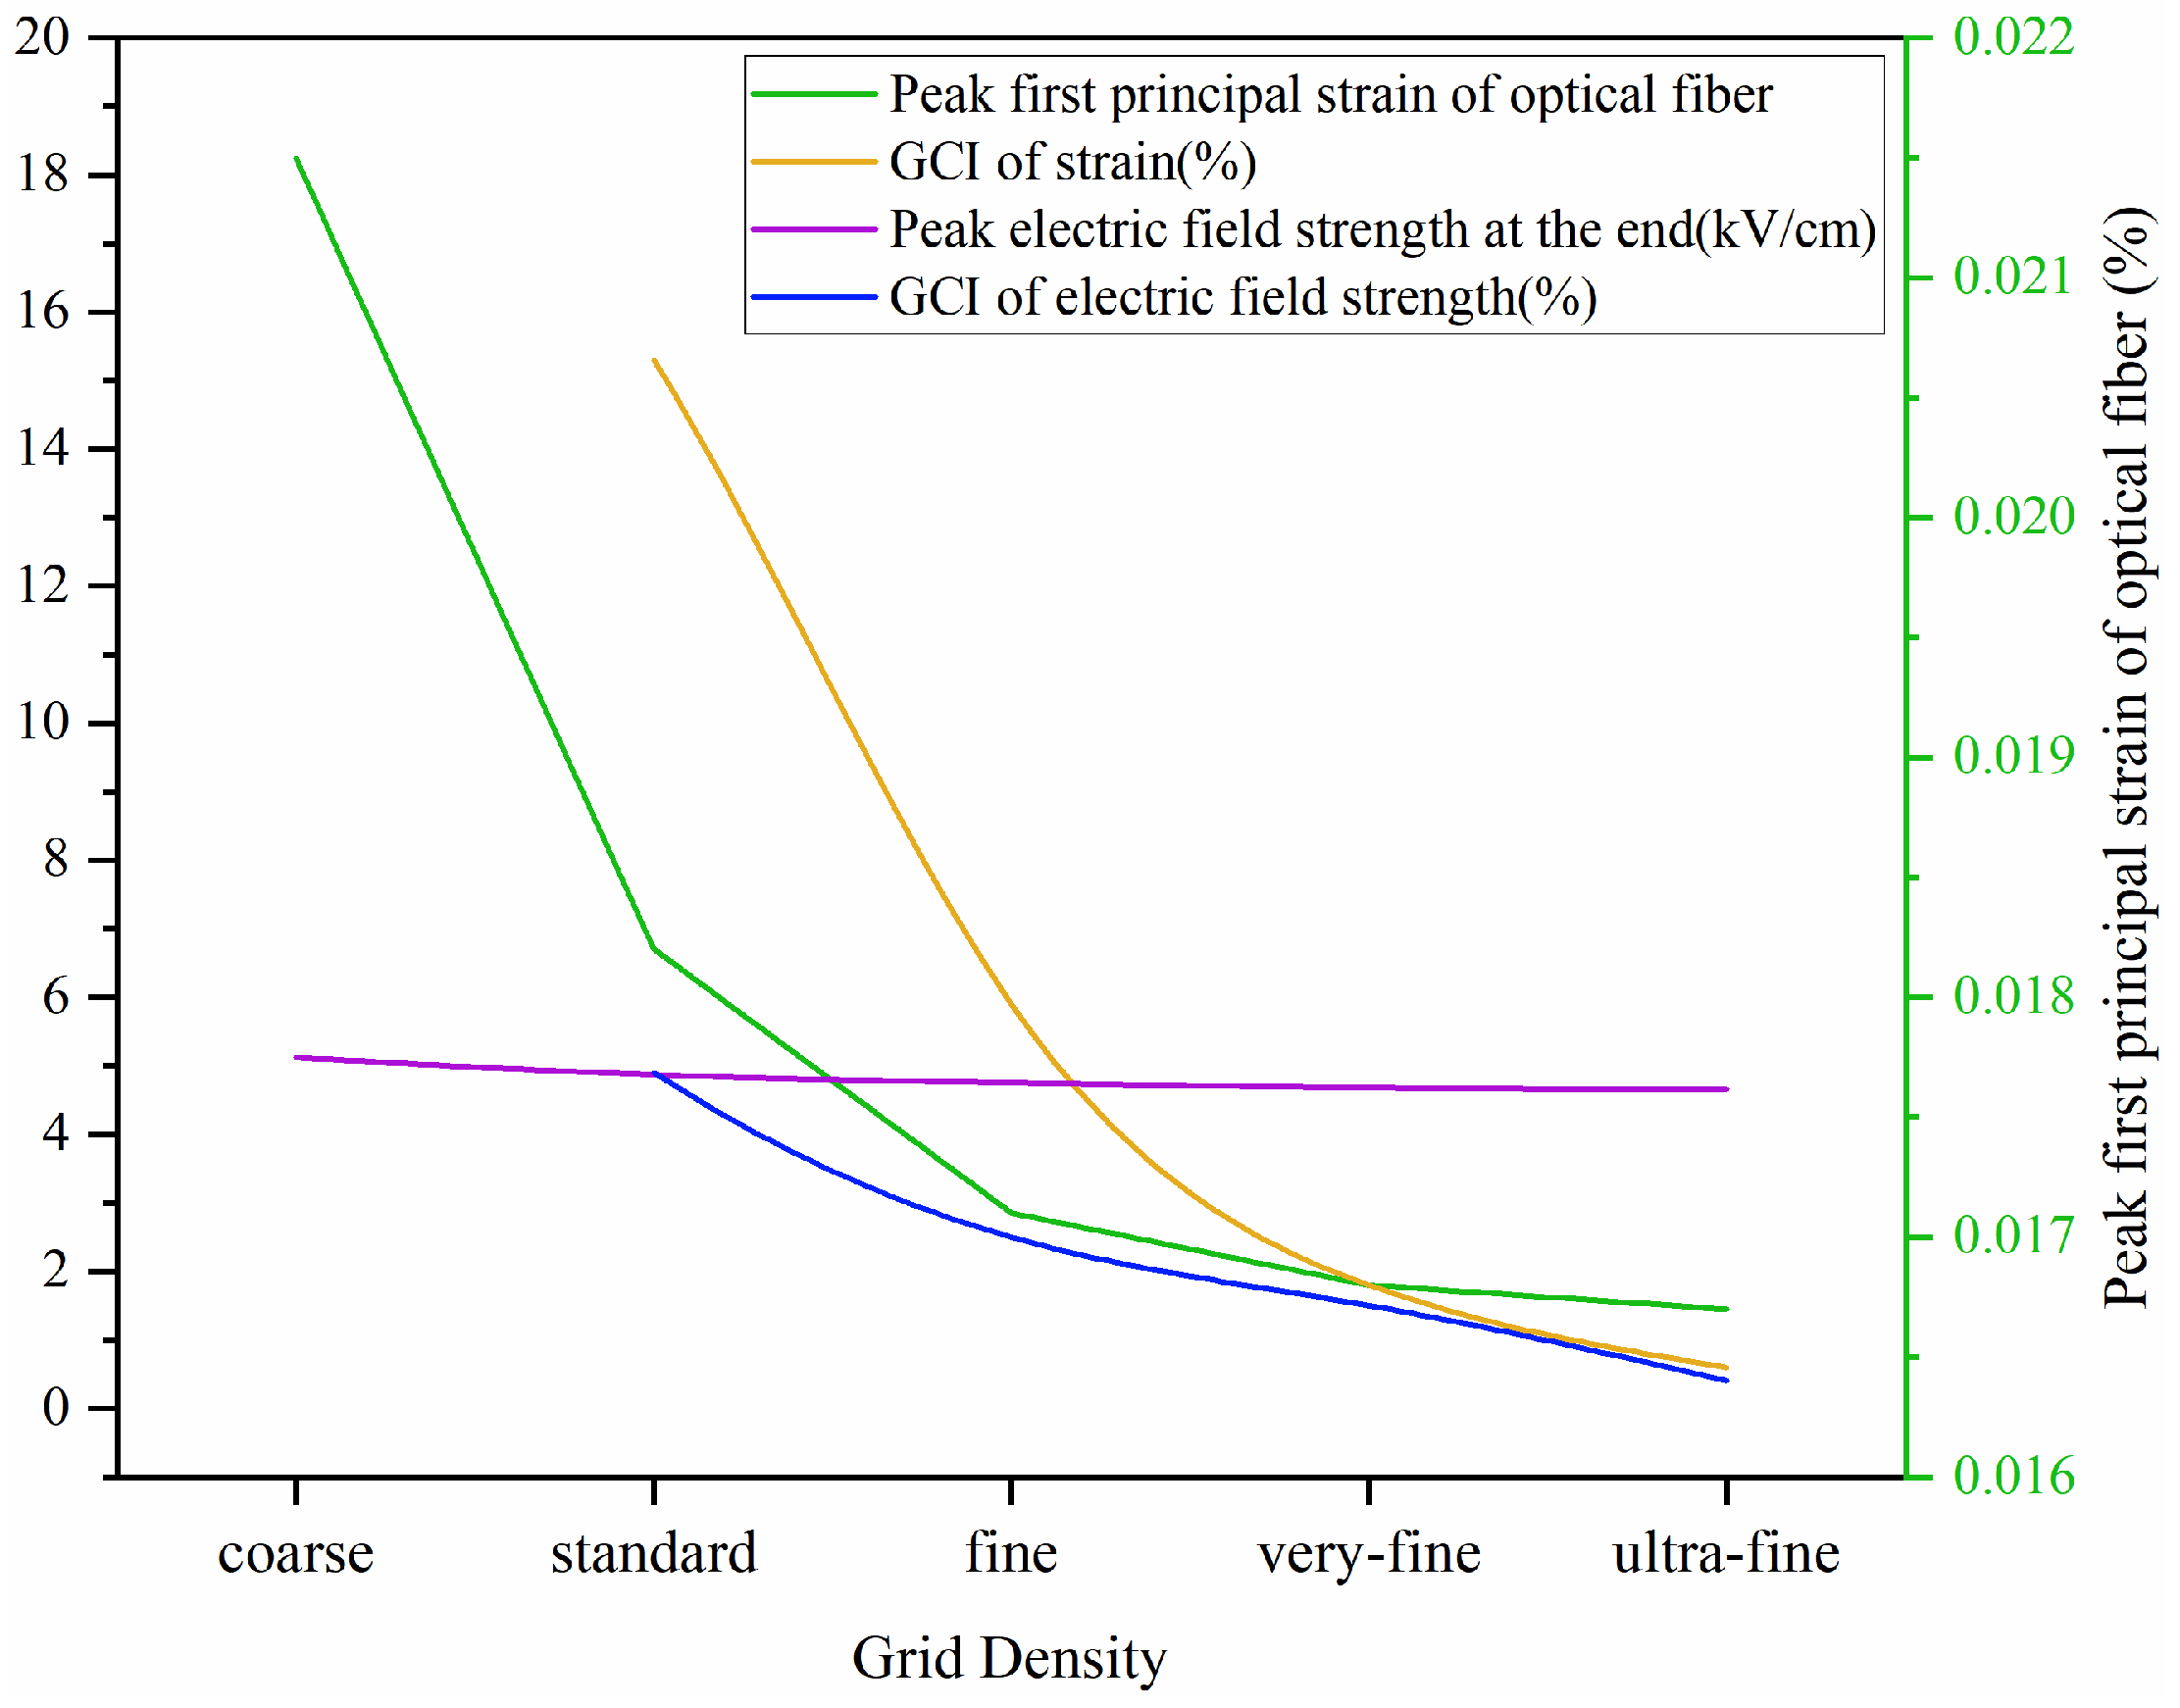
For the analysis of mesh convergence, the grid convergence index, GCI is used to analyze the meshing strategy of the mechanical and electric field simulation models. When the GCI value is less than 3%, the mesh quality meets the accuracy requirements of the simulation results [36]. The simulation is calculated successively using five preset meshes: “coarsening (minimum 12.5 mm)”, “conventional (minimum 8.03 mm)”, “refinement (minimum 4.46 mm)”, “more refinement (minimum 1.78 mm)”, and “extreme refinement (minimum 0.669 mm)”. The relationship between the grid convergence index and the mesh satisfies:
G C I = F s | ϵ | r p 1
ϵ = ϕ f i n e ϕ c o a r s e ϕ f i n e
where ϵ denotes the mesh refinement ratio, F s represents the safety factor (set to 1.25), p is the convergence accuracy index for adjacent meshes, r is the mesh refinement ratio, and ϕ f i n e and ϕ c o a r s e represent the simulation calculation results of the coarser and finer grids at the adjacent two levels respectively.
Figure 4 shows the grid convergence analysis results of the mechanical and electric field simulations under the same boundary conditions. It can be seen that when the grid level is refined from “coarse” to “moderately refined”, the GCI values of the maximum first principal strain of the fiber and the maximum electric field intensity at the end have both dropped below 2% (1.8% and 1.5% respectively), indicating that the grid quality has met the simulation accuracy requirements. Continuing to refine to the “extremely refined” grid, the change in result accuracy is relatively small, but the simulation calculation cost significantly increases. Therefore, considering both calculation accuracy and efficiency, all subsequent parametric simulation studies in this paper adopt the “moderately refined” grid setting.

2.2. Mathematical Models

2.2.1. A Mathematical Model for Mechanics Simulation

Mechanical property simulation is based on linear elasticity theory and complies with Hooke’s law [37]:
σ i j = C i j k l ε k l
where σ i j is the stress tensor, C i j k l is the elastic stiffness tensor, and ε k l is the strain tensor.

2.2.2. A Mathematical Model for Electric Field Simulation

The electrical performance simulation of insulators follows the simplified form of Maxwell’s equations [38] for electrostatic fields, neglecting displacement currents. The governing equations are:
D = ρ f
× E = 0
× H = J f + D t
D = ε E
E = φ
( ε E ) = ρ
where E is the electric field intensity, φ is the electric potential, ε is the relative permittivity of the material, and ρ is the free charge density.

3. Results and Discussion

3.1. Effect of Structural Parameters on the Mechanical Properties of Aromatic Epoxy Optical Fiber Composite Insulators

3.1.1. Selection of Core Rod Diameter

In the structural design of CEP optical fiber composite insulators, to ensure structural height consistency while maintaining mechanical properties and electrical distribution, comprehensive consideration must be given to the structural parameter design of each component. First, the end fittings are installed using crimping technology. A longer hole depth increases the crimping area, thereby enhancing tensile strength. However, constrained by the structural height and insulation distance of the optical fiber composite insulator, the crimping zone length must be minimized as much as possible. Therefore, reference is made to the power industry standards DL/T 1579-2024 [39] and DL/T 1580-2021 [40]. The crimping depth and core rod diameter for optical fiber composite insulator end fittings are designed to be subjected to a mechanical load of 210 kN. Due to the static friction between the core rod and the fitting F and crimp length L and core rod diameter A, the product is directly proportional. Therefore, when the crimp length of the 500 kV optical fiber composite insulator core rod is shortened, the core rod diameter must be increased. The relationship between the modified crimp length L and the core rod diameter A must satisfy Equation (10). Calculations show that the relationship between the crimping length L of the insulator core rod and its diameter A in Table 4 satisfies: 40 mm > 30 mm > the recommended value in the power industry standard DL/T 1579-2024. When the core rod diameter is selected as 30 mm or 40 mm, the static friction force between the hardware and the core rod meets the requirements specified in the power industry standard DL/T 1579-2024.
F = A 1 L 1 < A 1 L 1
where A1 and L1 represent core rod parameters from the power industry standard DL/T 1579-2024, while A2 and L2 denote the revised core rod parameters selected after modification. The specific parameters are detailed in Table 4.
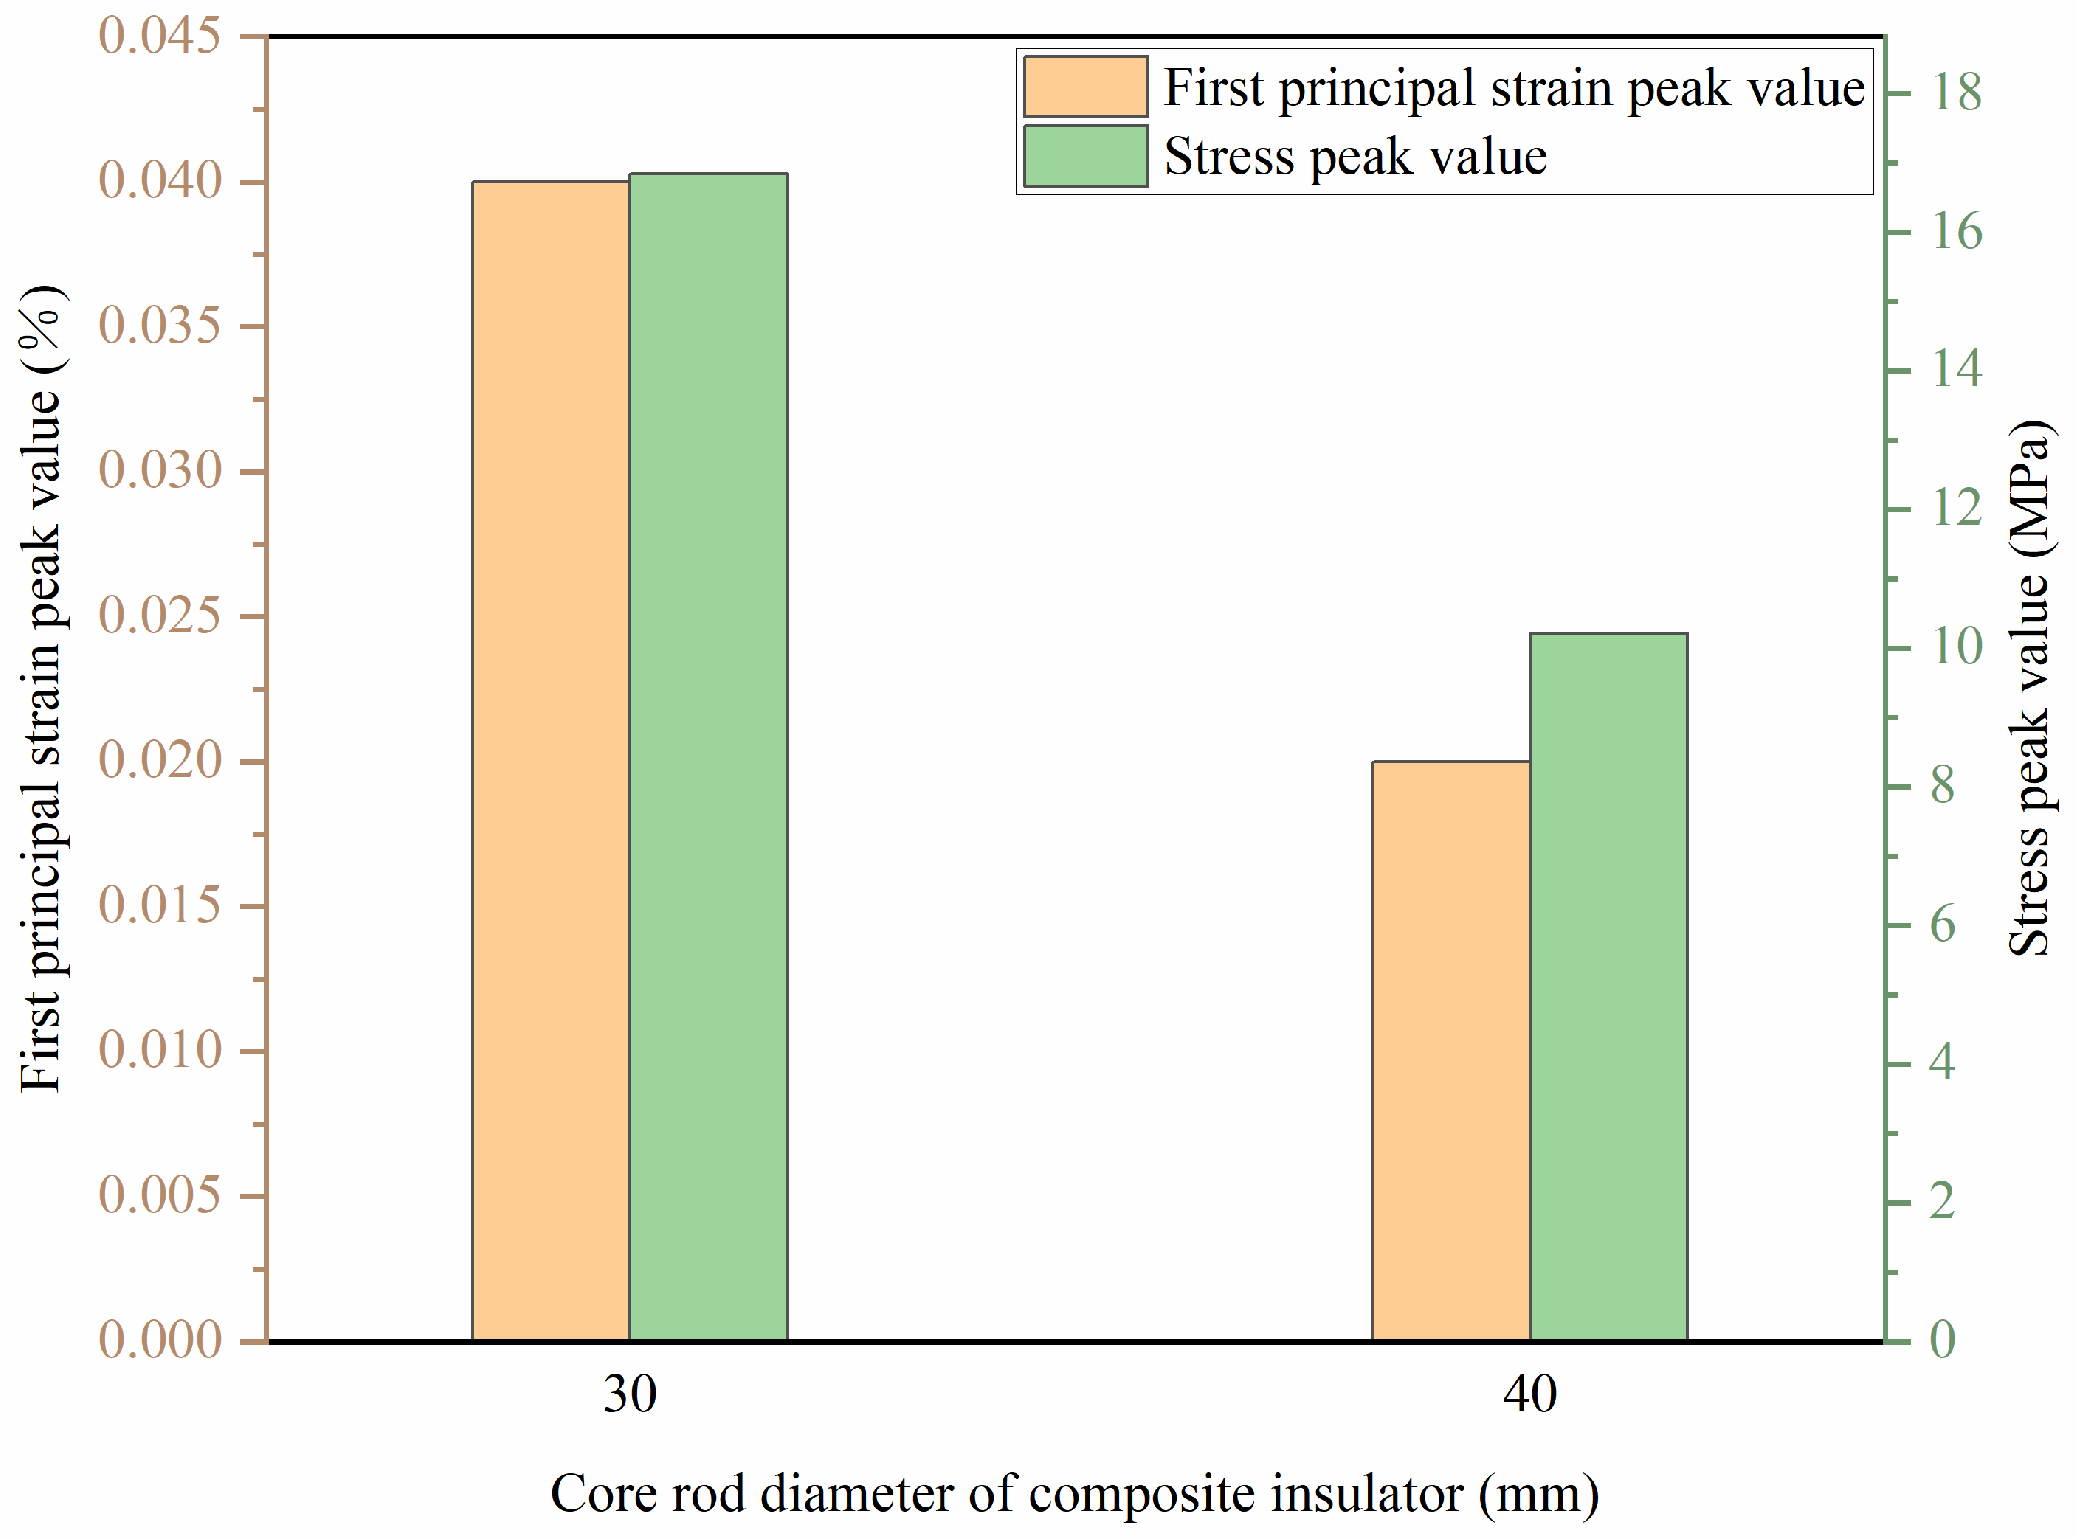
To further validate the selection of core rod diameters for optical fiber composite insulators, tensile load mechanical property simulations were conducted on core rods of varying diameters. With one end of the core rod fixed, a tensile load of 10 kN was applied to the other end to calculate the stress–strain distribution across different core rod diameters. Figure 5 presents the calculated first principal stress results for core rods with diameters of 30 mm and 40 mm.
The maximum first principal stress for the 30 mm diameter core rod was 16.84 MPa, with a maximum first principal strain of 0.04%. For the 40 mm diameter core rod, the maximum first principal stress was 10.21 MPa, and the maximum first principal strain was 0.02%. Comparing the simulation results for the 30 mm and 40 mm diameter core rods reveals that under a 10 kN tensile load, both stress and strain values are lower for the 40 mm diameter core rod. According to material mechanics stress formulas, under identical loads, the cross-sectional area of the 40 mm core rod is 1.78 times that of the 30 mm core rod, significantly reducing stress per unit area. Simultaneously, the larger diameter core rod exhibits superior “load dispersion capability” for axial forces, mitigating localized strain concentration. Therefore, selecting a 40 mm core rod diameter yields superior mechanical properties for the insulator. Consequently, the CEP optical fiber composite insulator employs a 40 mm diameter core rod.

3.1.2. Selection of Optical Fiber Implantation Methods

In optical fiber composite insulators, optical fibers are embedded within the core rod to enable online monitoring of insulator degradation. Therefore, the reliability of the optical fibers within the insulator during operation is particularly critical. To address this, simulation studies on the optical fiber embedding methods for optical fiber composite insulators are required. First, a simulation study was conducted on the mechanical behavior of core rod–optical fiber system structures under tensile load for different optical fiber implantation methods. With one end of the core rod fixed, a tensile load of 10 kN was applied to the other end. The stress–strain distribution of the core rod and optical fiber in optical fiber composite insulators with different structures was calculated.
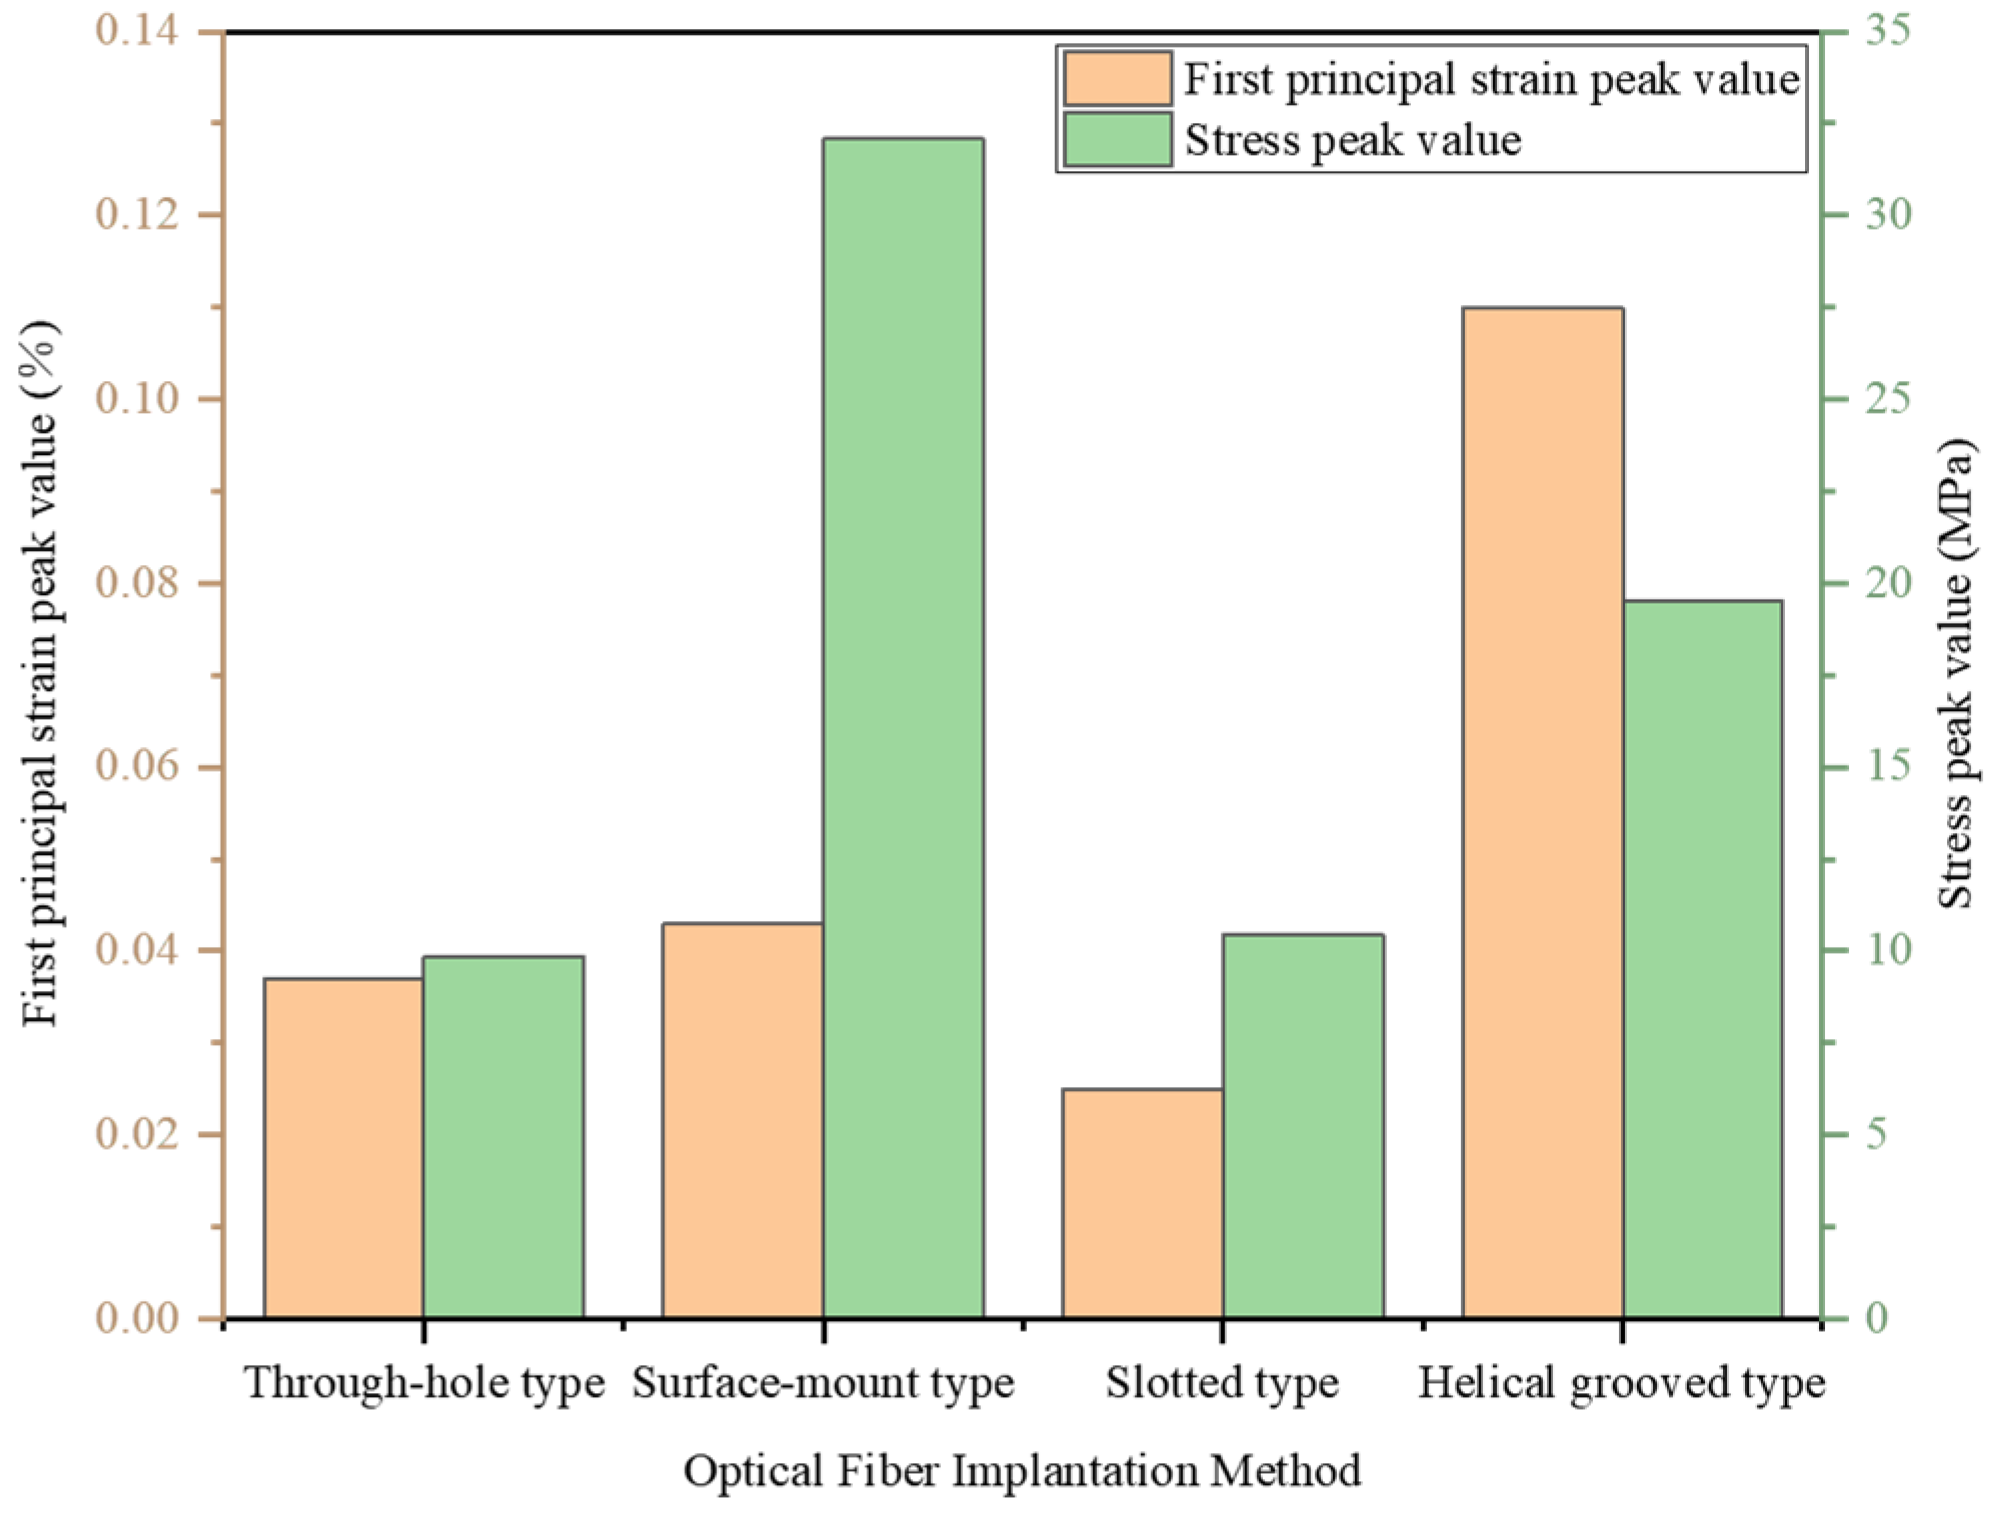
As shown in Figure 6, the first principal strain of the optical fiber is minimal in the slotted structure, with a maximum stress of only 10.43 MPa. The strain in the helical grooved structure is nearly double that of the surface-mounted type. This occurs because strain primarily develops at the interface between the optical fiber and the core rod. The optical fiber is wound within the core rod grooves, so when the core rod experiences tensile loading, the optical fiber simultaneously undergoes axial stretching. Due to the differing elastic moduli of the optical fiber and core rod, stress concentration occurs between them, leading to strain. Furthermore, the optical fiber’s small volume relative to the core rod’s larger volume creates a trade-off between mesh size and simulation memory during modeling. Refining the model’s mesh increases computational time and memory requirements, while insufficient mesh refinement for the optical fiber may cause stress singularities on its surface. Additionally, the simulation model does not account for the umbrella sleeve structure of the optical fiber composite insulator.
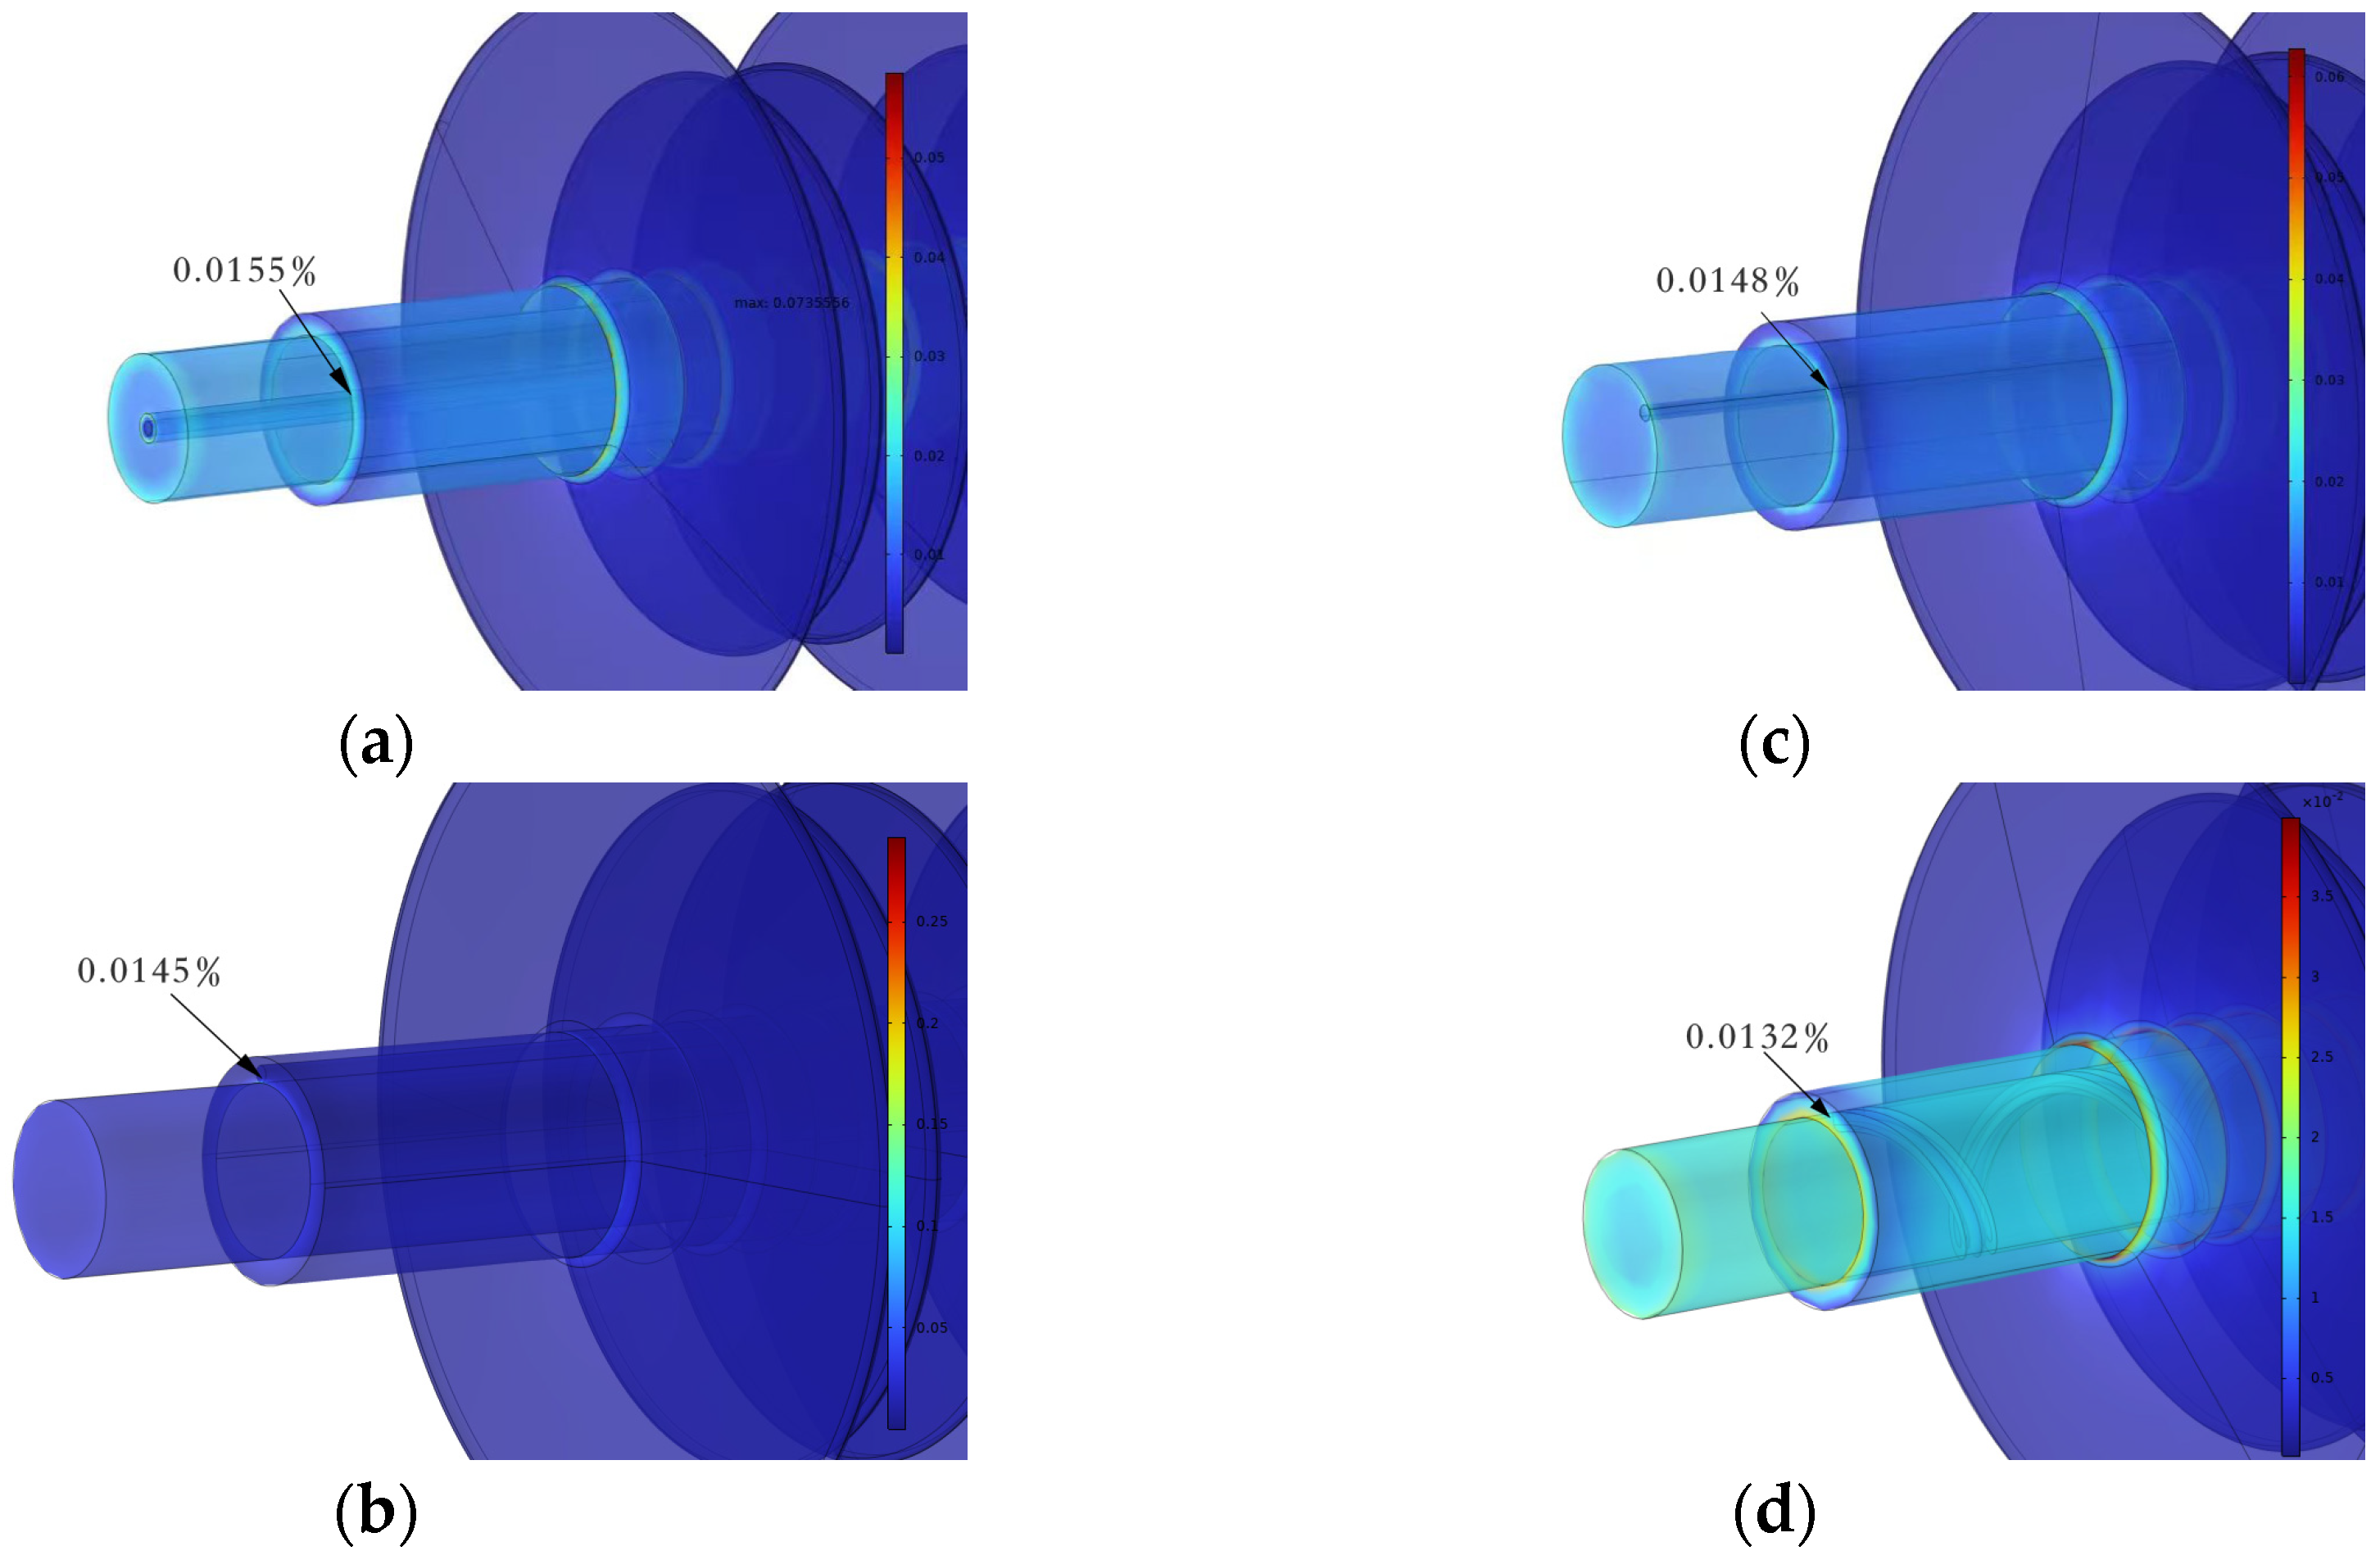
Furthermore, different fiber implantation methods under the presence of a protective sleeve are discussed, with results shown in Figure 7. Simulation results indicate that when the umbrella sleeve structure is integrated into the mandrel–fiber system, the fiber strain at the umbrella sleeve end under identical tensile loads is as follows: for the through-core structure, the first principal strain is 0.0155%; for the surface-mounted structure, the first principal strain is 0.0145%; for the slotted structure, the first principal strain is 0.0148%. For the helical grooved structure, the first principal strain is 0.0132%.
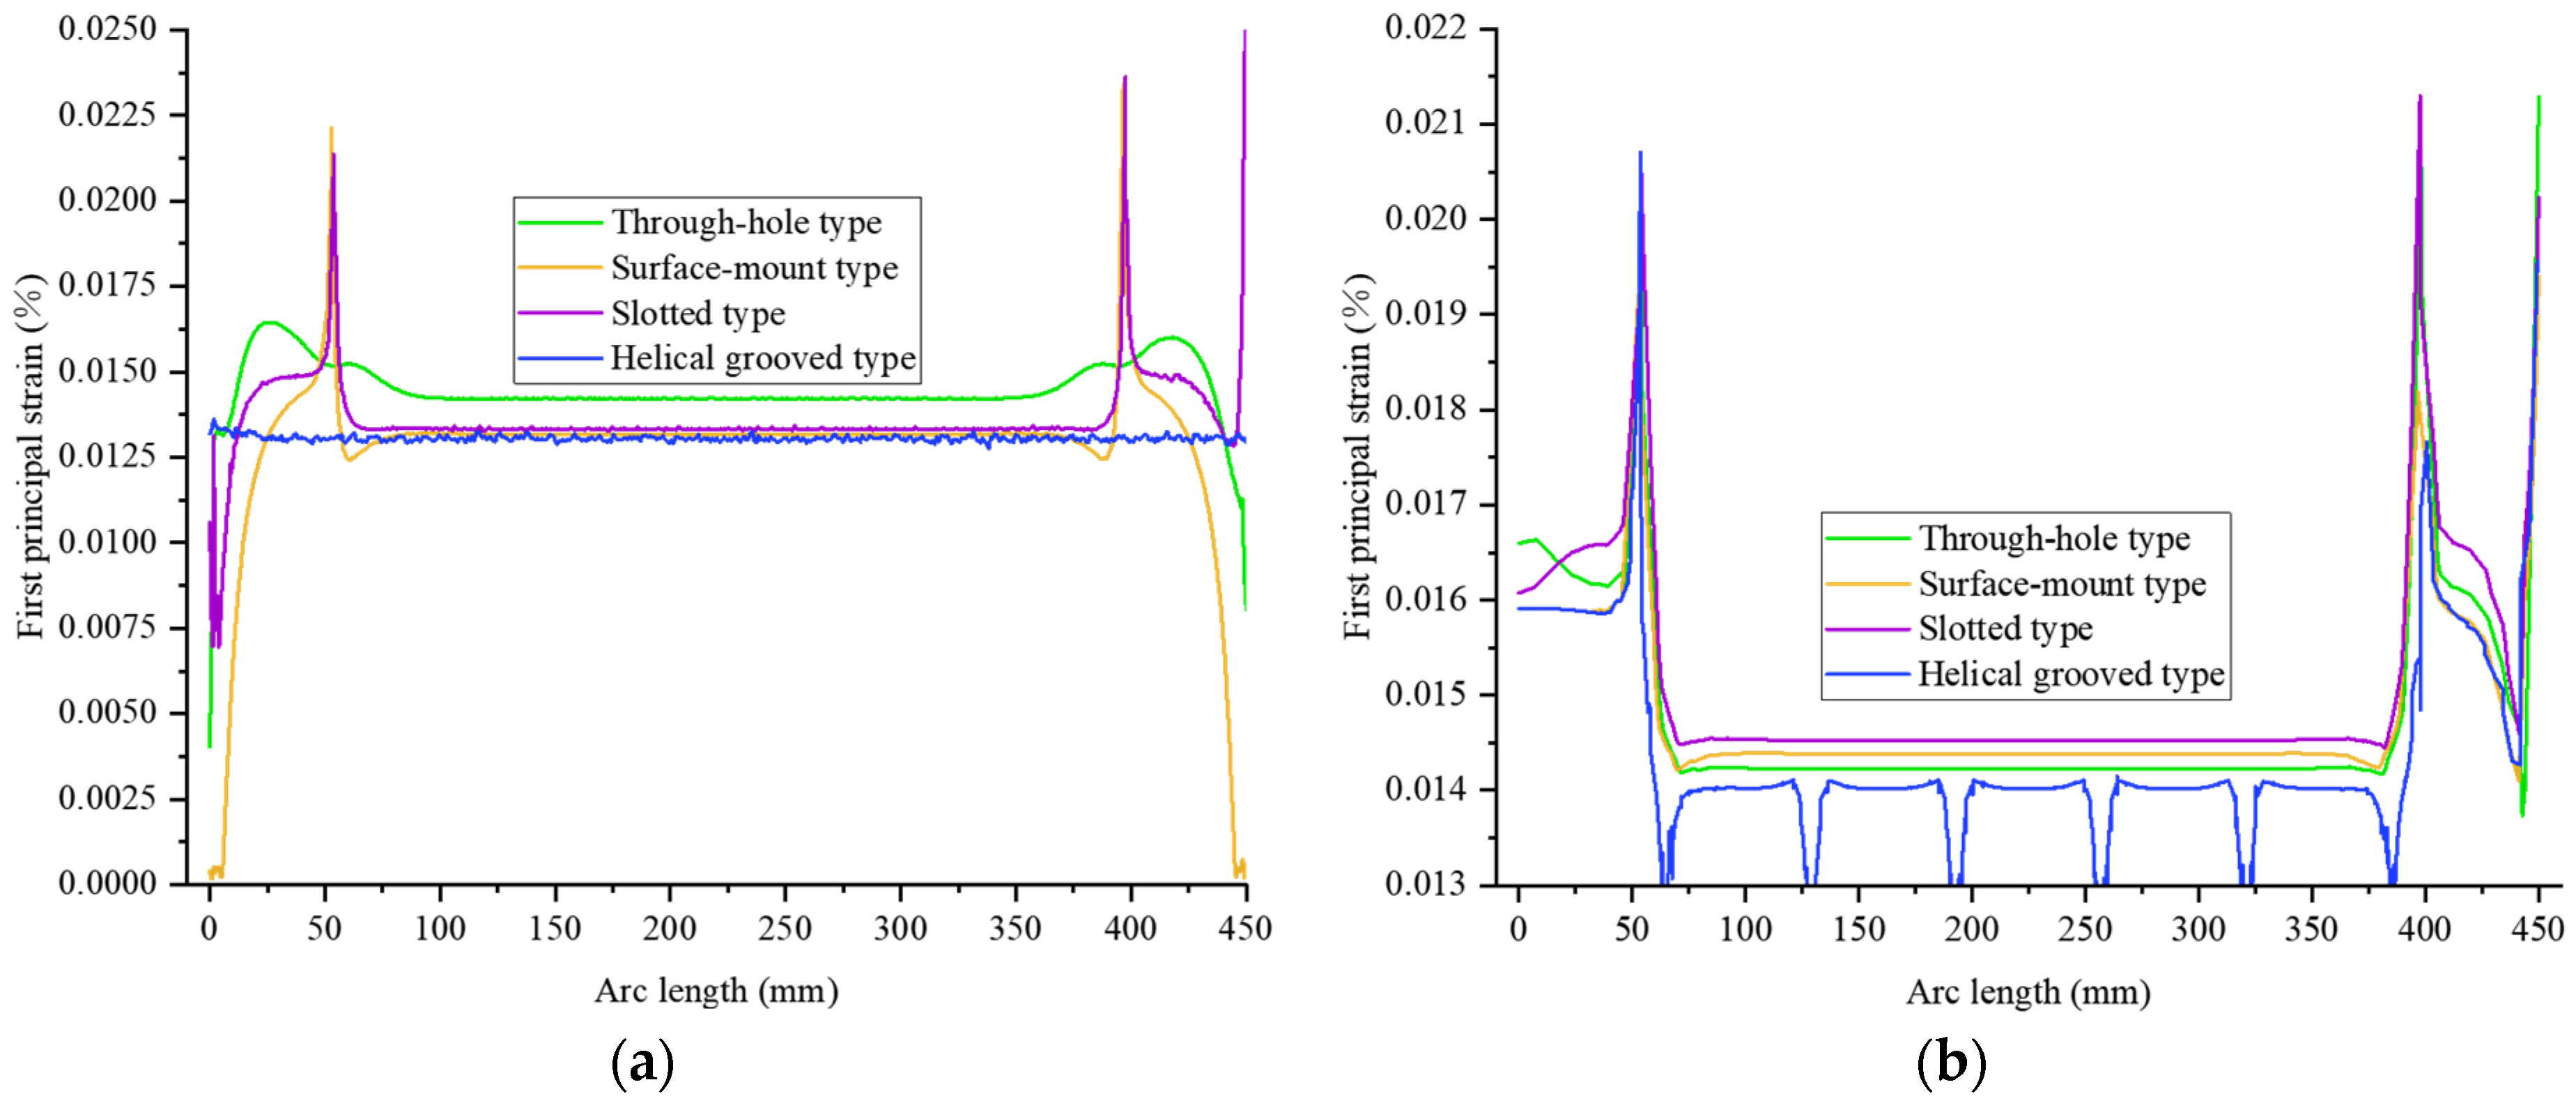
Figure 8 further presents the axial strain distribution curves of the four model fibers and the core rod. From Figure 8b, it can be seen that the core rod strain reaches significant peaks at arc lengths of 50 mm and 400 mm, and the strain levels within the two peak intervals are significantly lower than those outside the peak regions. This phenomenon is mainly attributed to the fact that the length of the mandrel in the simulation model is greater than that of the umbrella sleeve. At the position of the jacket section, the sudden change in the cross-sectional area of the force-bearing area causes local stress concentration, resulting in the emergence of strain peaks. Similarly, the decrease in the core rod strain between the two peaks is also due to the fact that the umbrella sleeve structure shares the tensile load of the core rod, causing a significant reduction in the core rod’s strain. Moreover, from the core rod strain distribution graph, it can be observed that compared with the other structures, the core rod strain curve of the helical grooved structure shows a significantly different trend. There are six troughs within the two peak intervals, and its strain level is the lowest. This is because the area within the mandrel of the helical grooved structure that is wrapped by the jacket has six corresponding grooves, and the umbrella sleeve structure shares the tensile load at the grooves of the core rod, thereby reducing the strain at the helical grooves of the core rod. At the same time, the angled helical grooved structure changes the stress transfer path, increases the strain shared by the umbrella sleeve of the core rod, and thus reduces the strain of the helical grooved structure of the core rod. Similarly, due to the fact that the fiber is fixed in the core rod’s helical grooves by the jacket, compared with the other structures, the helical grooved structure of the fiber experiences an increase in radial stress and no longer relies mainly on axial stress, thereby reducing the fiber strain. From Figure 8a, it can be seen that the average strain of the fiber within the two peak intervals is the smallest, which is consistent with the above analysis pattern. Therefore, the fiber implantation method selects the helical grooved structure.

3.1.3. Selection of Core Rod Grooving Angle

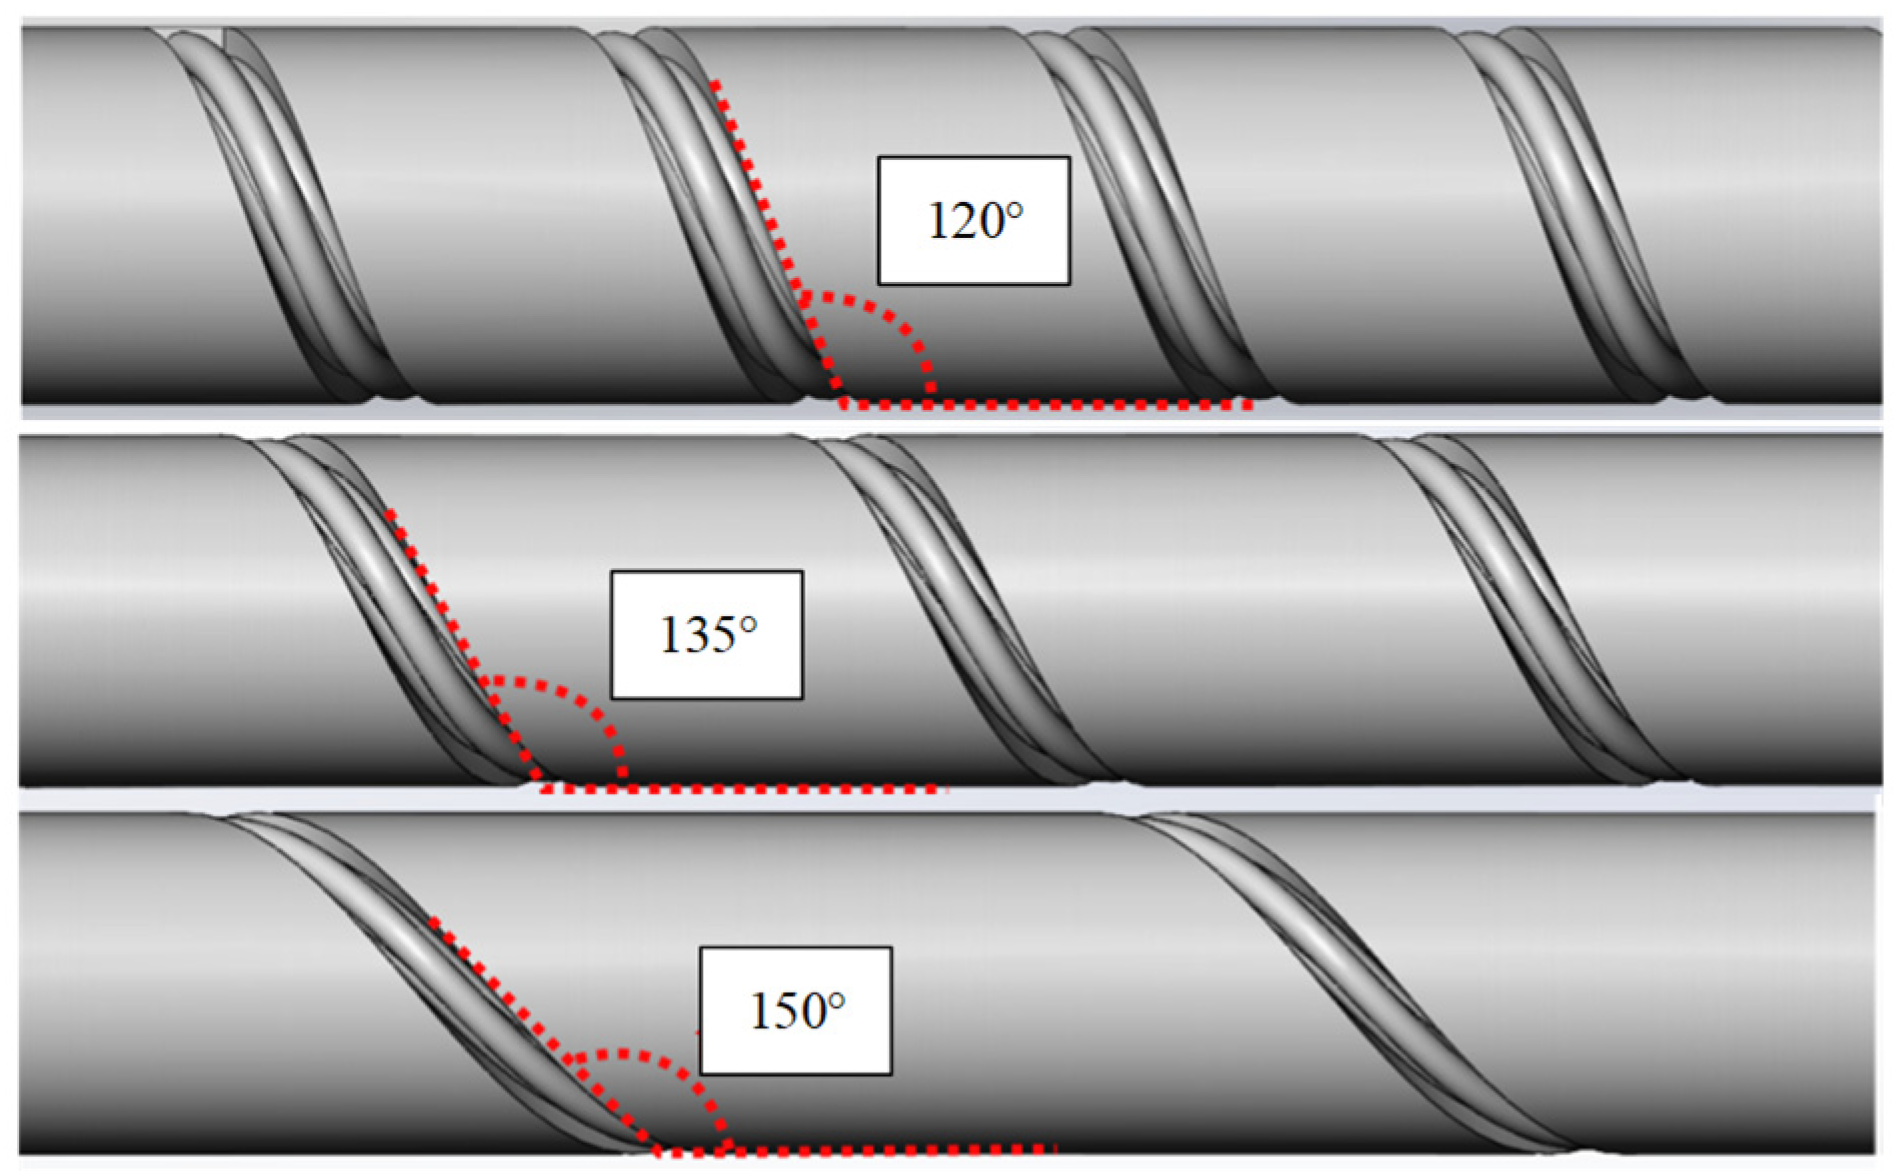
After selecting the helical grooved type as the fiber implantation technique for this paper, the grooving angle must be determined. Engineering experience indicates that a larger helical groove angle and wider pitch result in shorter fiber lengths implanted into the insulator and reduced processing time for the mandrel. However, excessively large angles cause uneven distribution of grating measurement points within the insulator, compromising its monitoring performance. Balancing practical application costs with the accuracy of monitoring performance after grating integration, this study selected three grooving angles: 120°, 135°, and 150°, as shown in Figure 9. By analyzing the variation patterns in mechanical properties of the optical fiber insulator under different grooving angles, an optimal grooving angle was determined.
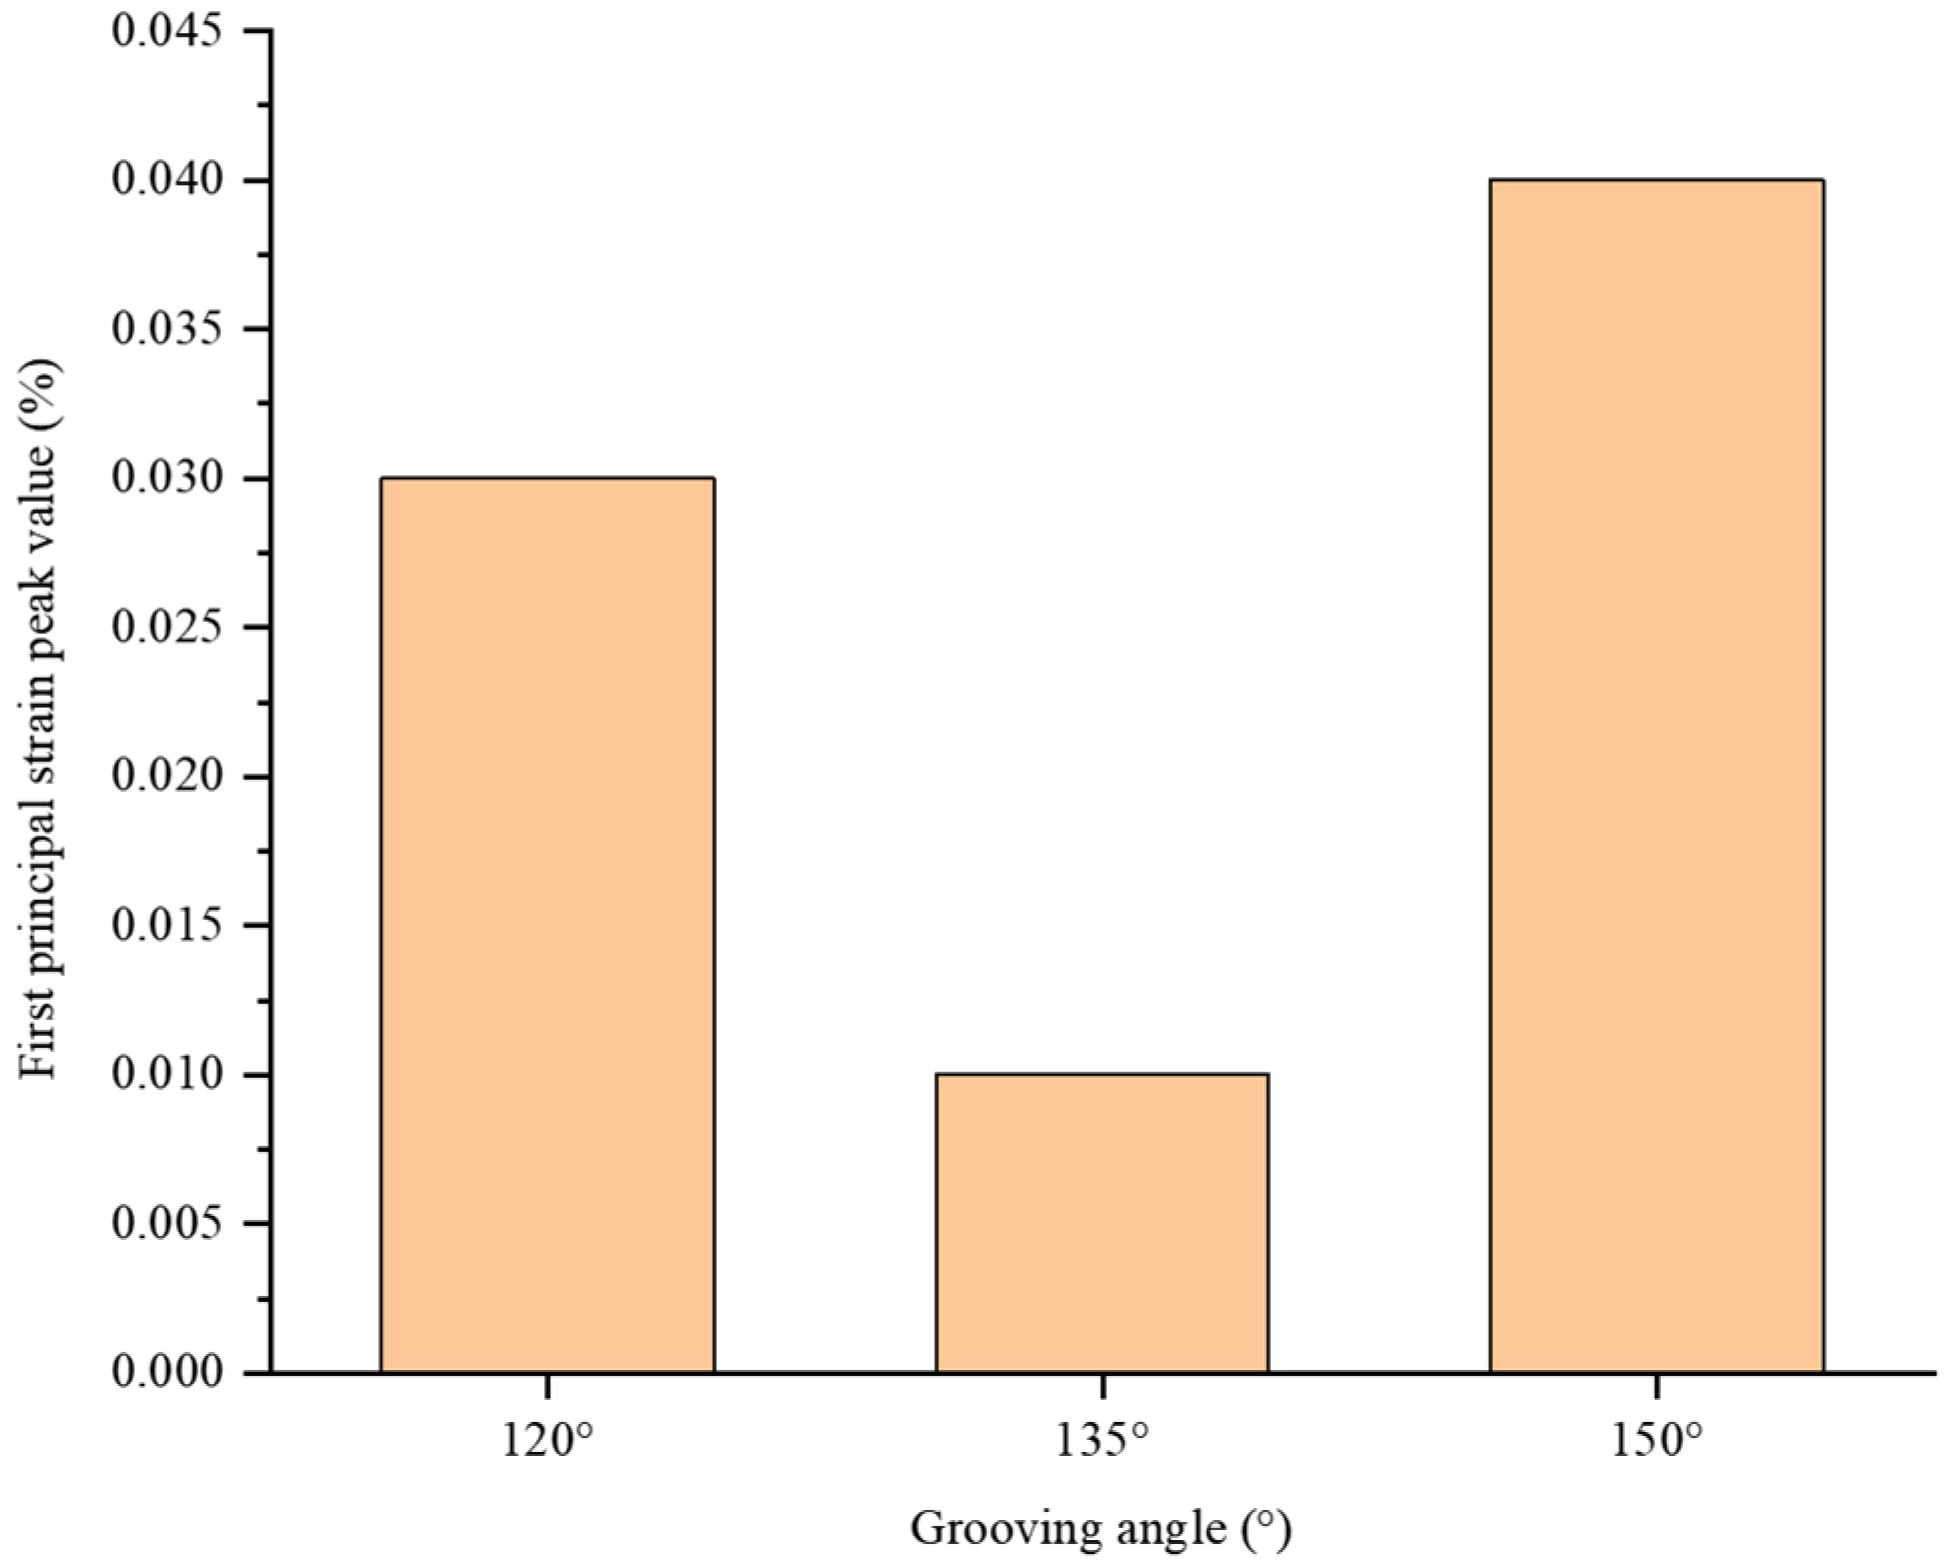
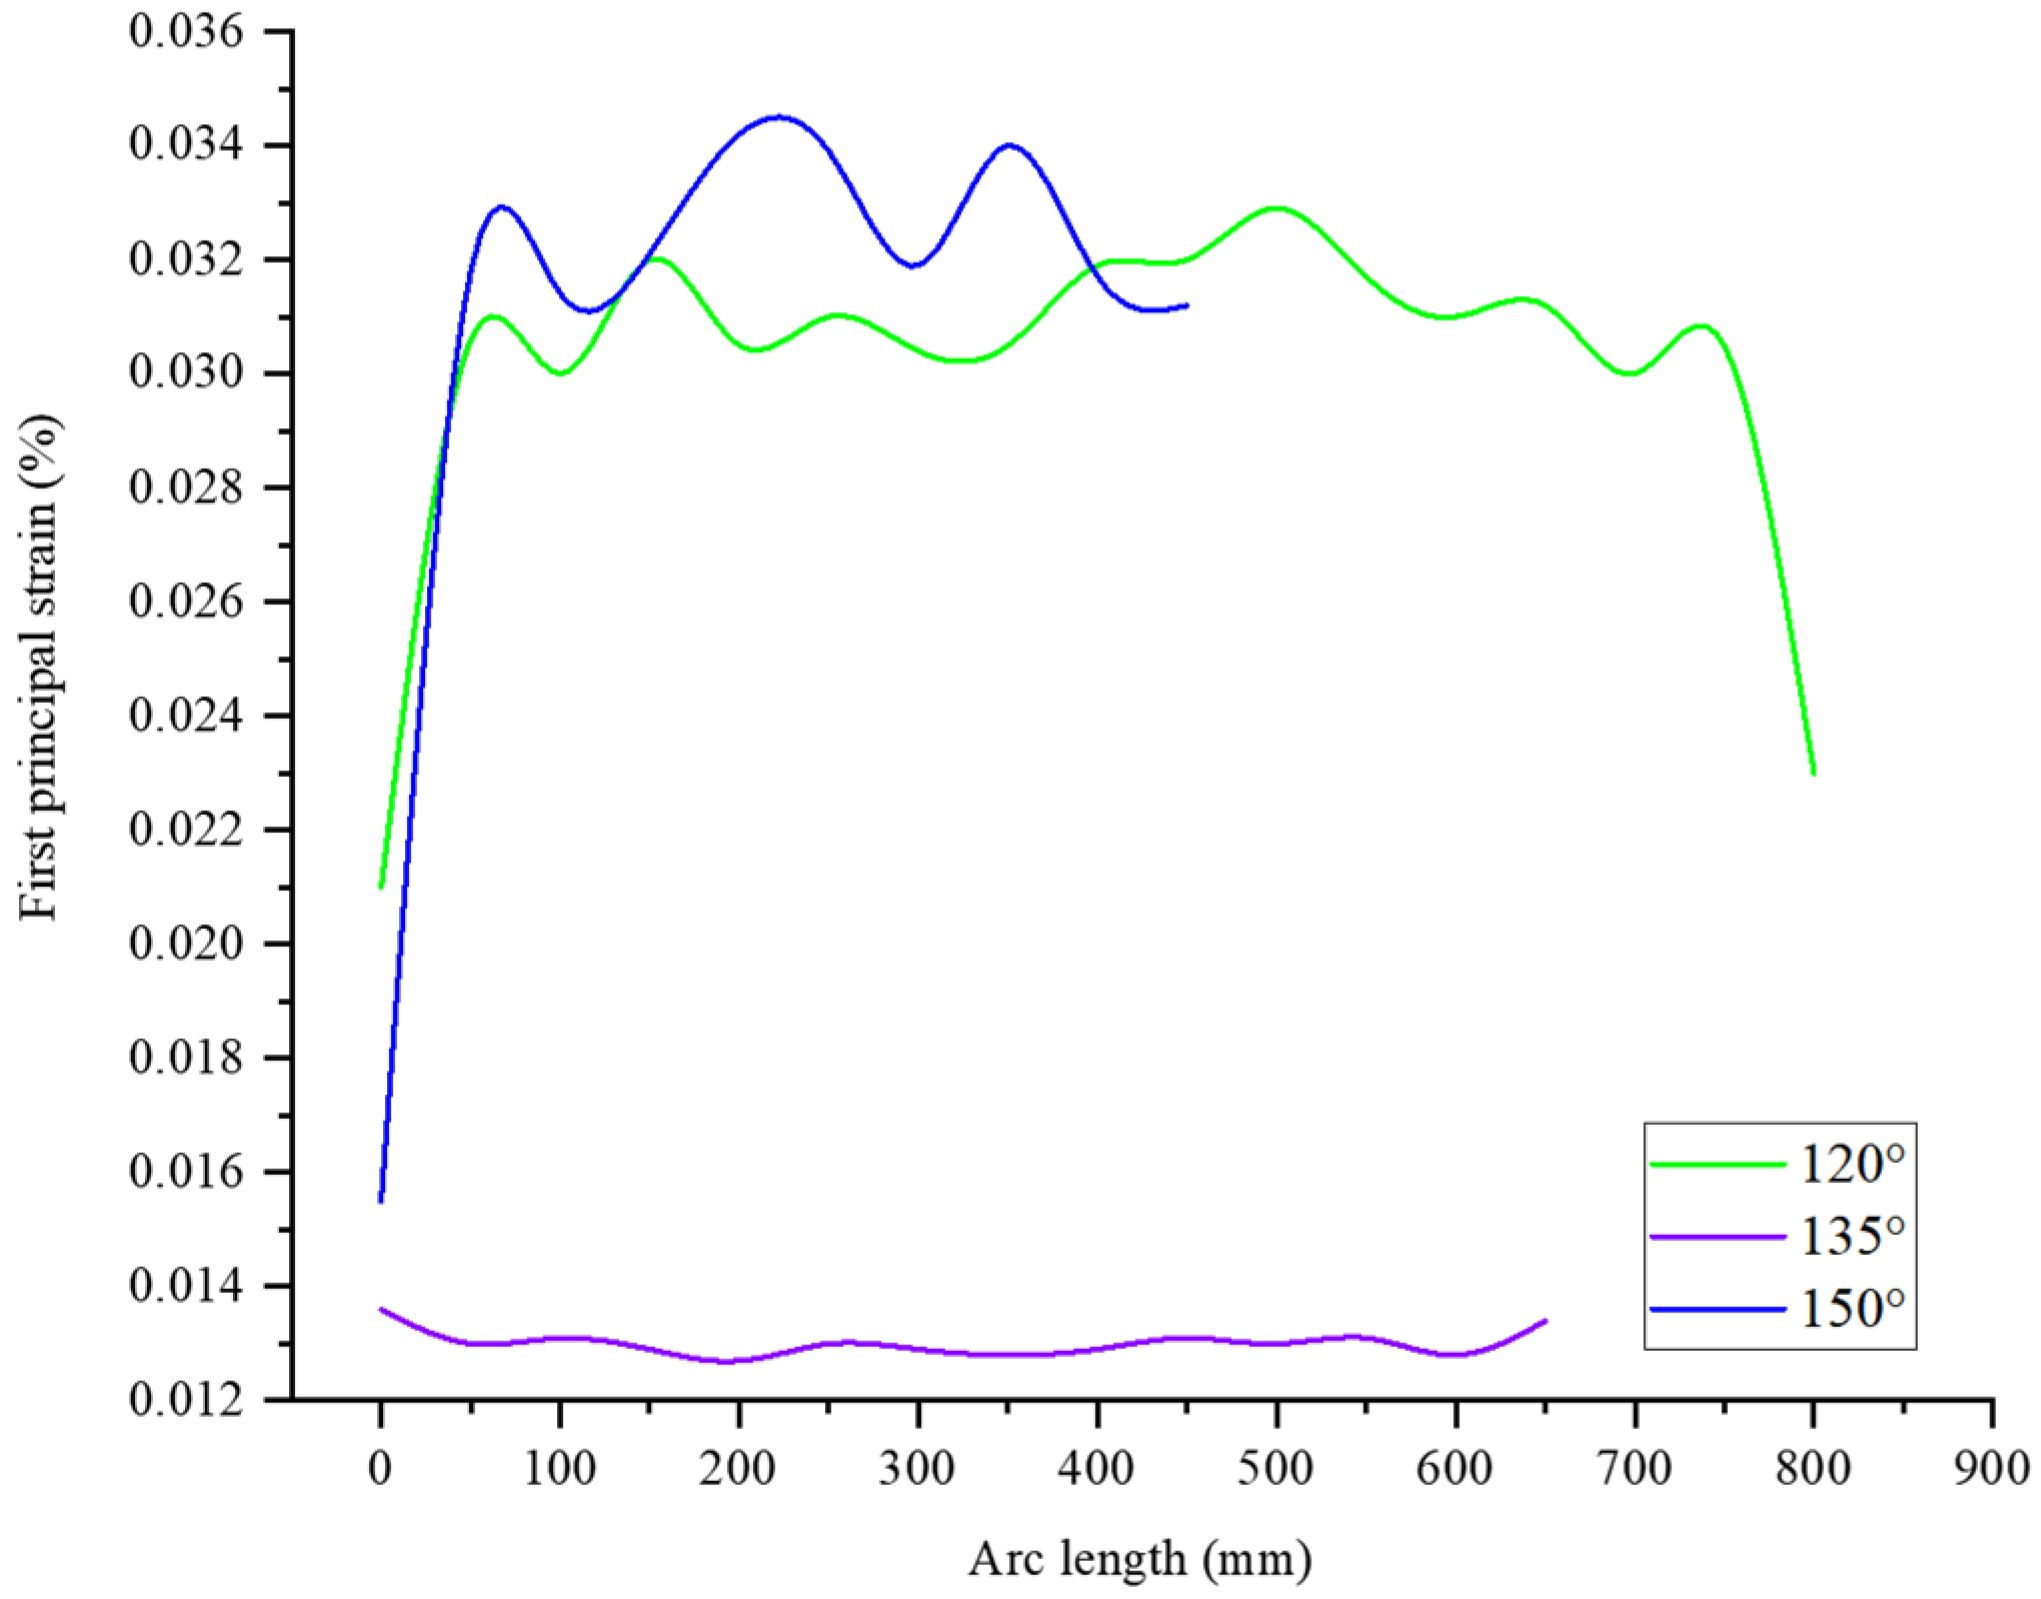
As shown in Figure 10, for helical grooves with angles of 120°, 135°, and 150°, the maximum first principal strain of the optical fiber is 0.03%, 0.01%, and 0.04%, respectively. Comparisons reveal that under identical tensile loads, the first principal strain of the optical fiber in composite insulators with a 135° slot angle is lower than that in insulators with 120° and 150° slot angles. The first principal strain curves of the optical fiber across different slot angle configurations are shown in Figure 11.
As shown in Figure 11, the length of the embedded optical fiber within the model increases with the increase in the core rod’s grooving angle. Specifically, when the helical grooving angle is 150°and 120°, the average strain of the insulator is relatively high, reaching over 0.03%; while at 135°, the average strain on the embedded optical fiber is minimal, only 0.01%. Since the optical fiber is secured within the helical groove by the umbrella sleeve, the force acting upon it is the shear force applied by the sleeve. Analysis of the forces on the embedded optical fiber suggests that when the helical groove angle is 135°, the resultant axial force on the optical fiber is minimal, thereby causing the smallest strain. Selecting a 135° groove angle not only provides an optimal spiral groove spacing for favorable distribution of grating measurement points, but also results in lower average strain on the embedded fiber under equivalent loads compared to the other two groove angles. Therefore, the fiber groove angle is selected as 135°.

3.1.4. Selection of Optical Fiber Implantation Quantity

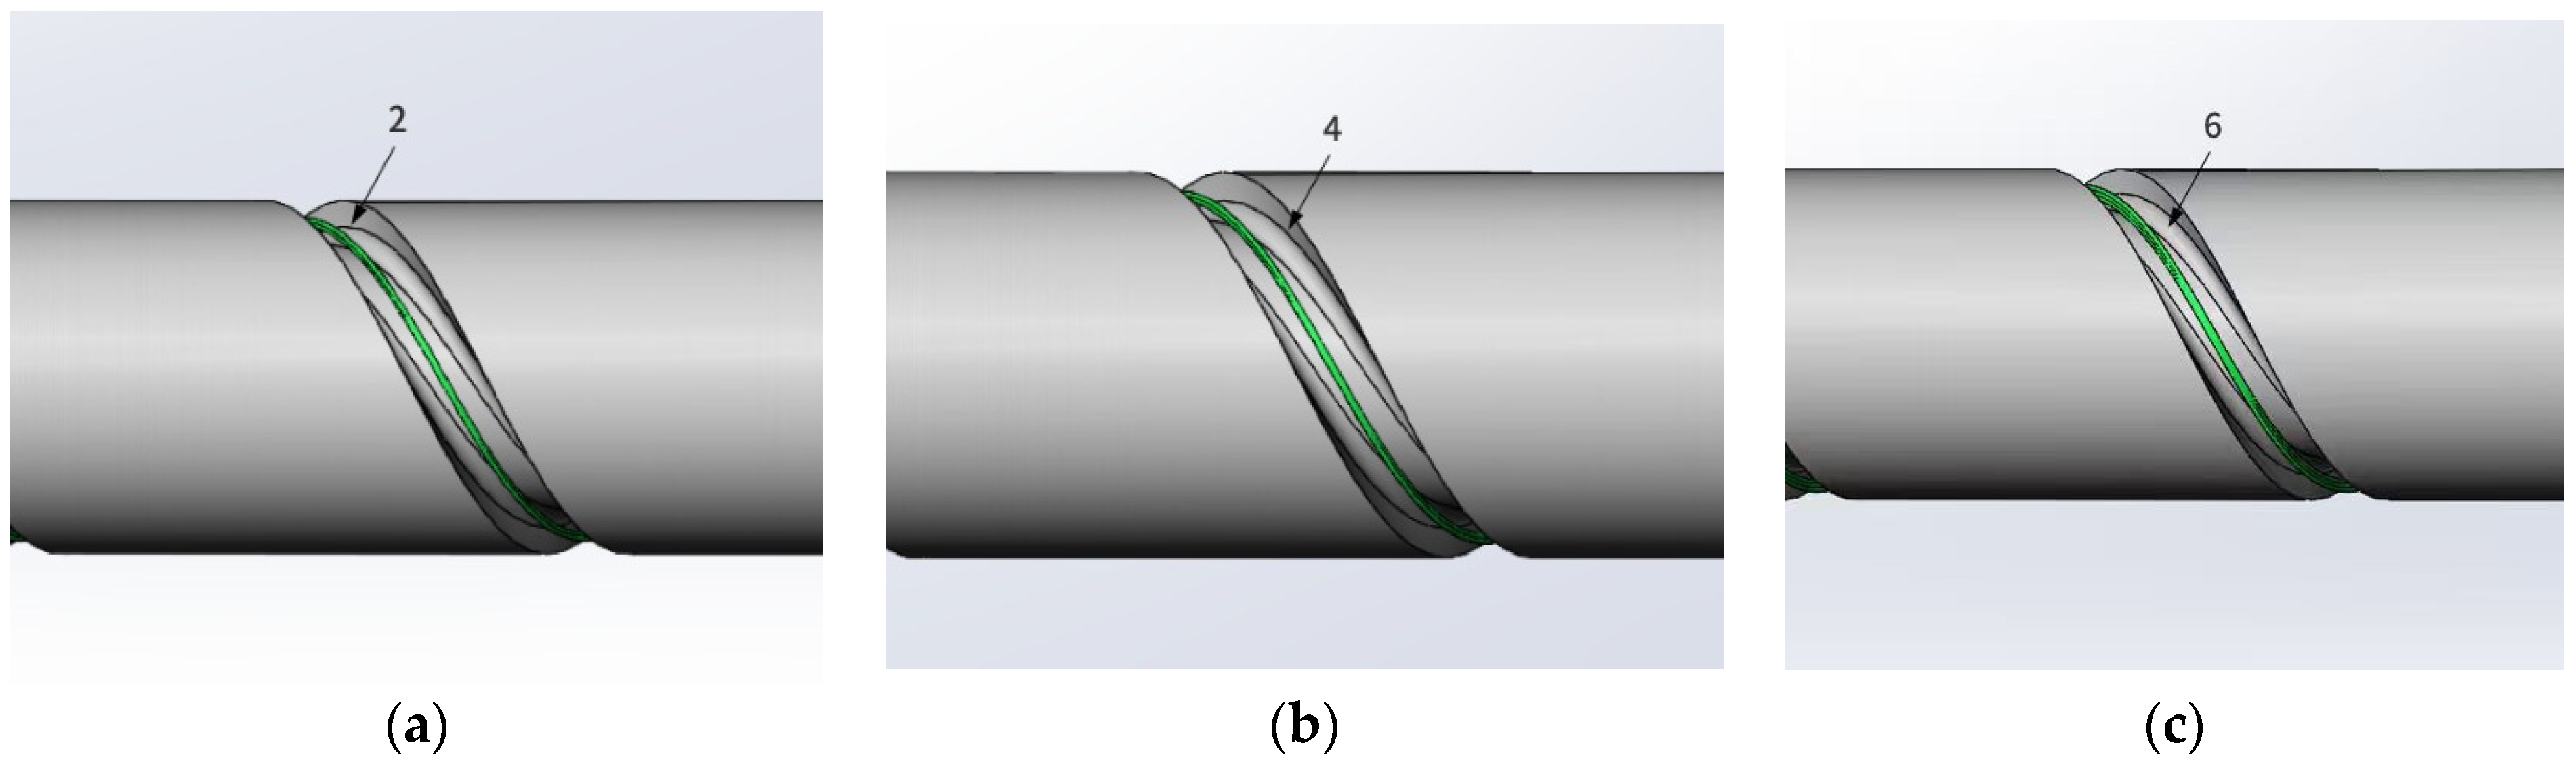
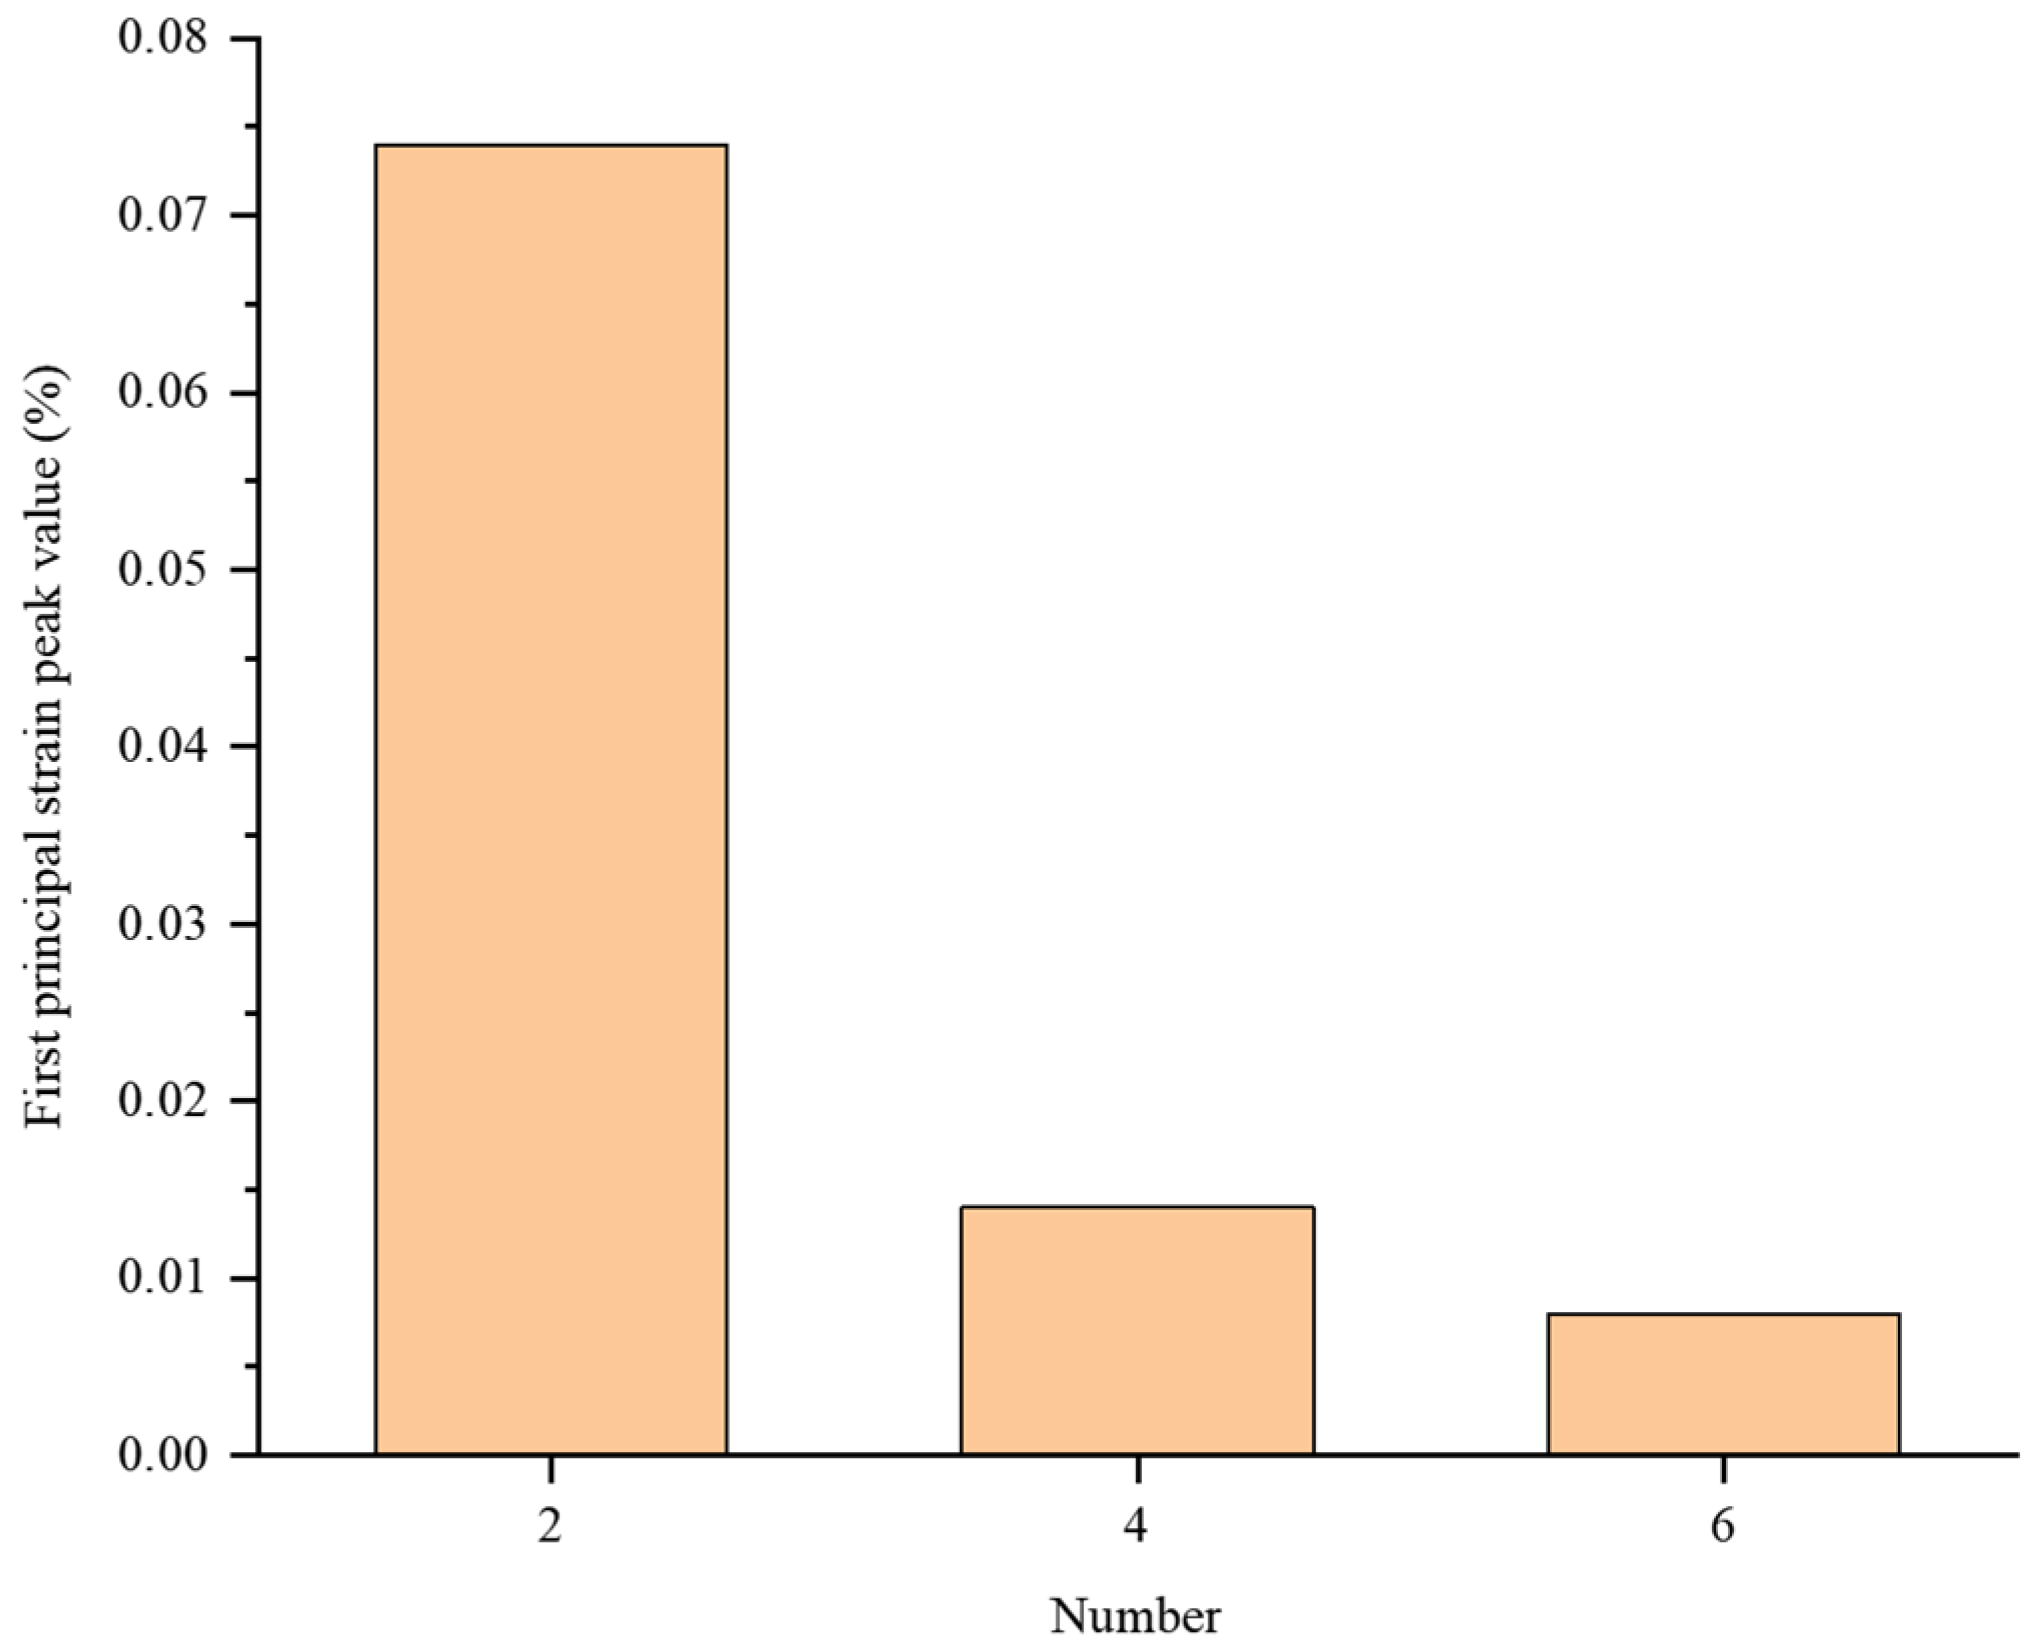
Considering the monitoring requirements for multiple parameters such as temperature and strain in practical applications of cycloaliphatic epoxy resin fiber-optic composite insulators, it is necessary to embed multiple optical fibers simultaneously to provide sufficient data acquisition channels. This approach meets the diverse parameter monitoring needs of the fiber-optic composite insulators discussed in this paper. As cycloaliphatic epoxy fiber-optic composite insulators are composite insulators, the umbrella sleeve section encasing the optical fibers is typically manufactured using an integrated injection molding and curing process. This makes fiber channel replacement impossible once damaged. To enhance the reliability of monitoring channels in cycloaliphatic epoxy fiber insulators and reduce operational costs, spare fibers can be embedded during manufacturing. Considering that optical fiber insulators typically use no more than four fibers in practical applications [15,41], and as the impregnation mechanism of cycloaliphatic epoxy resin on multiple fibers remains unclear [42], an excessive number of fibers may lead to bubble defects at the fiber interfaces after curing [43]. Therefore, when determining the number of embedded fibers, care should be taken to meet basic sensing needs while keeping redundancy limited, so as not to unduly complicate the manufacturing process. The influence of fiber number on the mechanical properties of cycloaliphatic epoxy resin optical fiber composite insulators has not yet been clearly understood. As shown in Figure 12, this study establishes models of optical fiber composite insulators with two, four, and six embedded fibers to simulate and analyze the effects of different fiber counts on their mechanical performance. With each fiber diameter set at 1 mm, the mechanical behavior under tensile load is investigated through simulation. Simulation results for the first principal strain under a tensile load of 10 kN with two, four, and six implanted optical fibers are shown in Figure 13, respectively.
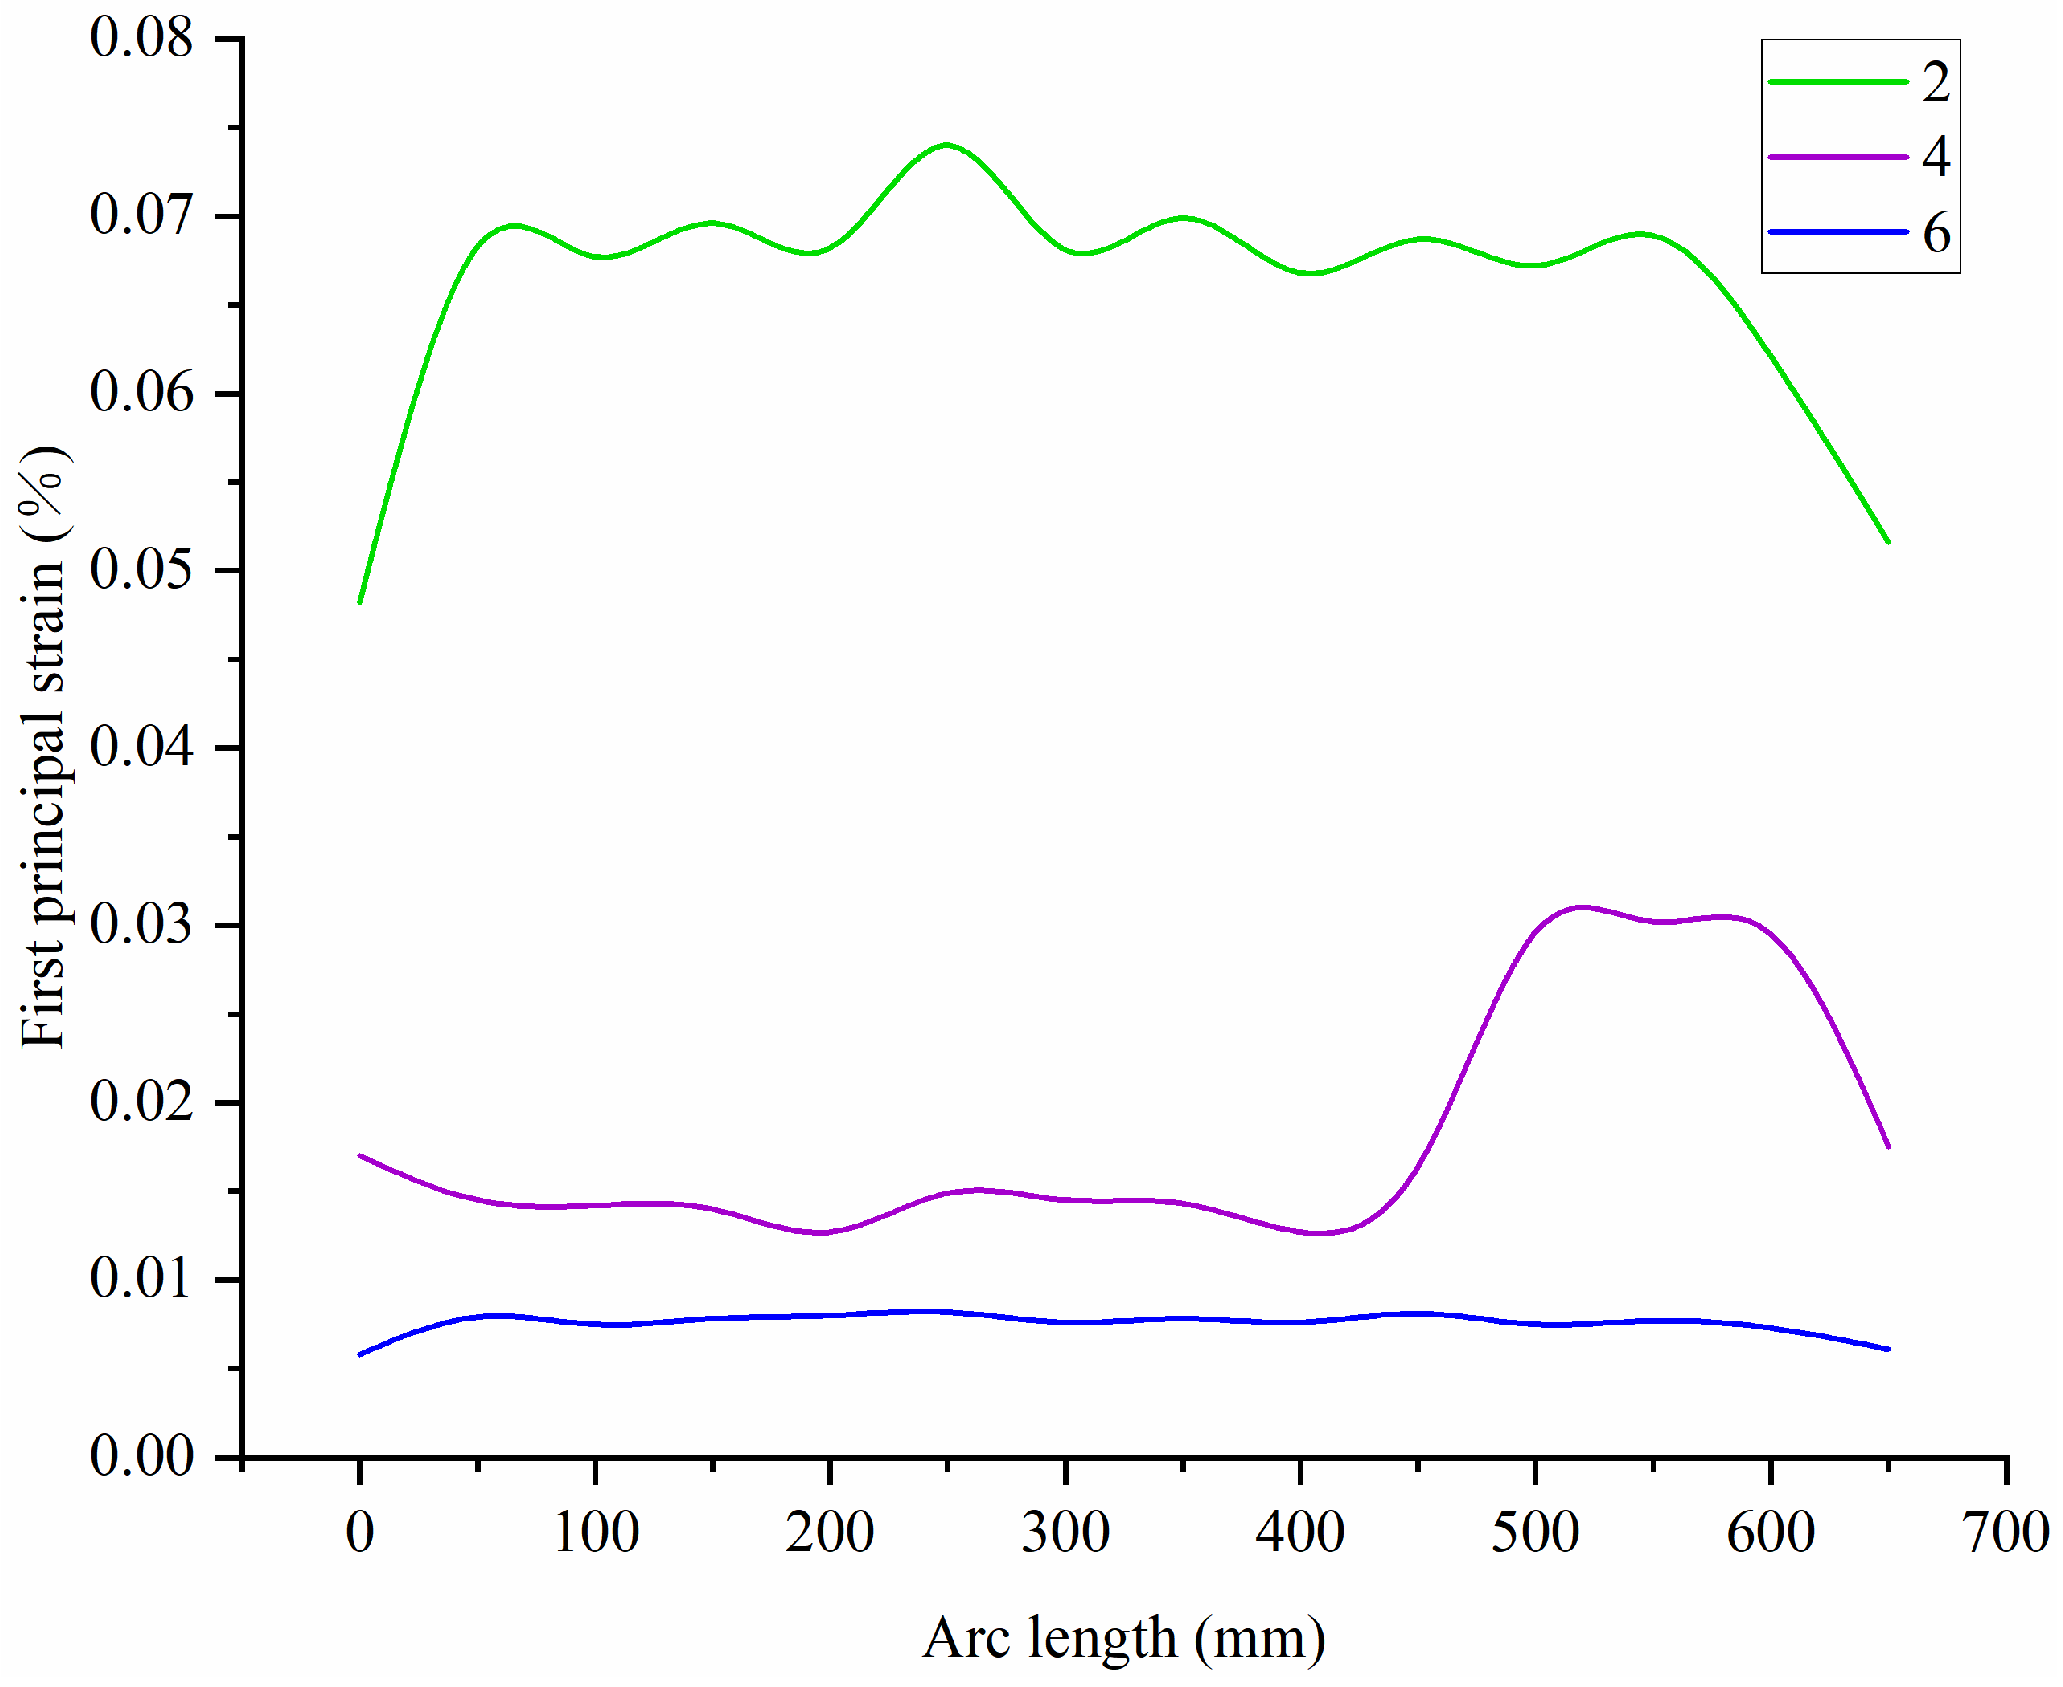
As shown in Figure 13, under identical tensile loads, the maximum first principal strain of the model was 0.074%, 0.01%, and 0.008% when implanting two, four, and six optical fibers, respectively. Comparing the simulation results, the trend of the first principal strain of the optical fibers exhibits a similar pattern across different fiber implant quantities. Notably, when six fibers are implanted, the first principal strain is 0.02%, which is lower than that observed with two or four fibers implanted. Figure 14 illustrates the distribution curves of the first principal strain of the optical fibers within structures featuring different groove angles.
As shown in Figure 14, the strain distribution within the embedded optical fibers decreases as the number of implanted fibers increases. The average strain is minimal when six fibers are implanted, at approximately 0.027%. The lack of a linear relationship in simulation results across different fiber implantations is likely due to the cable diameter being too small when fewer fibers are implanted, resulting in negligible strain differences constrained by the mesh. When six fibers are implanted, the cable diameter becomes sufficiently large to reveal the resolution of the simulation results. Analysis based on Hooke’s law indicates that increasing the number of implanted fibers enlarges the stress-bearing cross-sectional area of the fiber cable, thereby reducing the stress experienced. The simulation pattern aligns with theoretical analysis. Considering that current common designs do not reserve excess fiber length, and based on the simulation analysis results, this paper selects six fiber implants.

3.2. Effect of Structural Parameters on the Electrical Properties of Aromatic Epoxy Optical Fiber Composite Insulators

3.2.1. Electrical Field Simulation Model for Fiber-Optic Composite Insulators

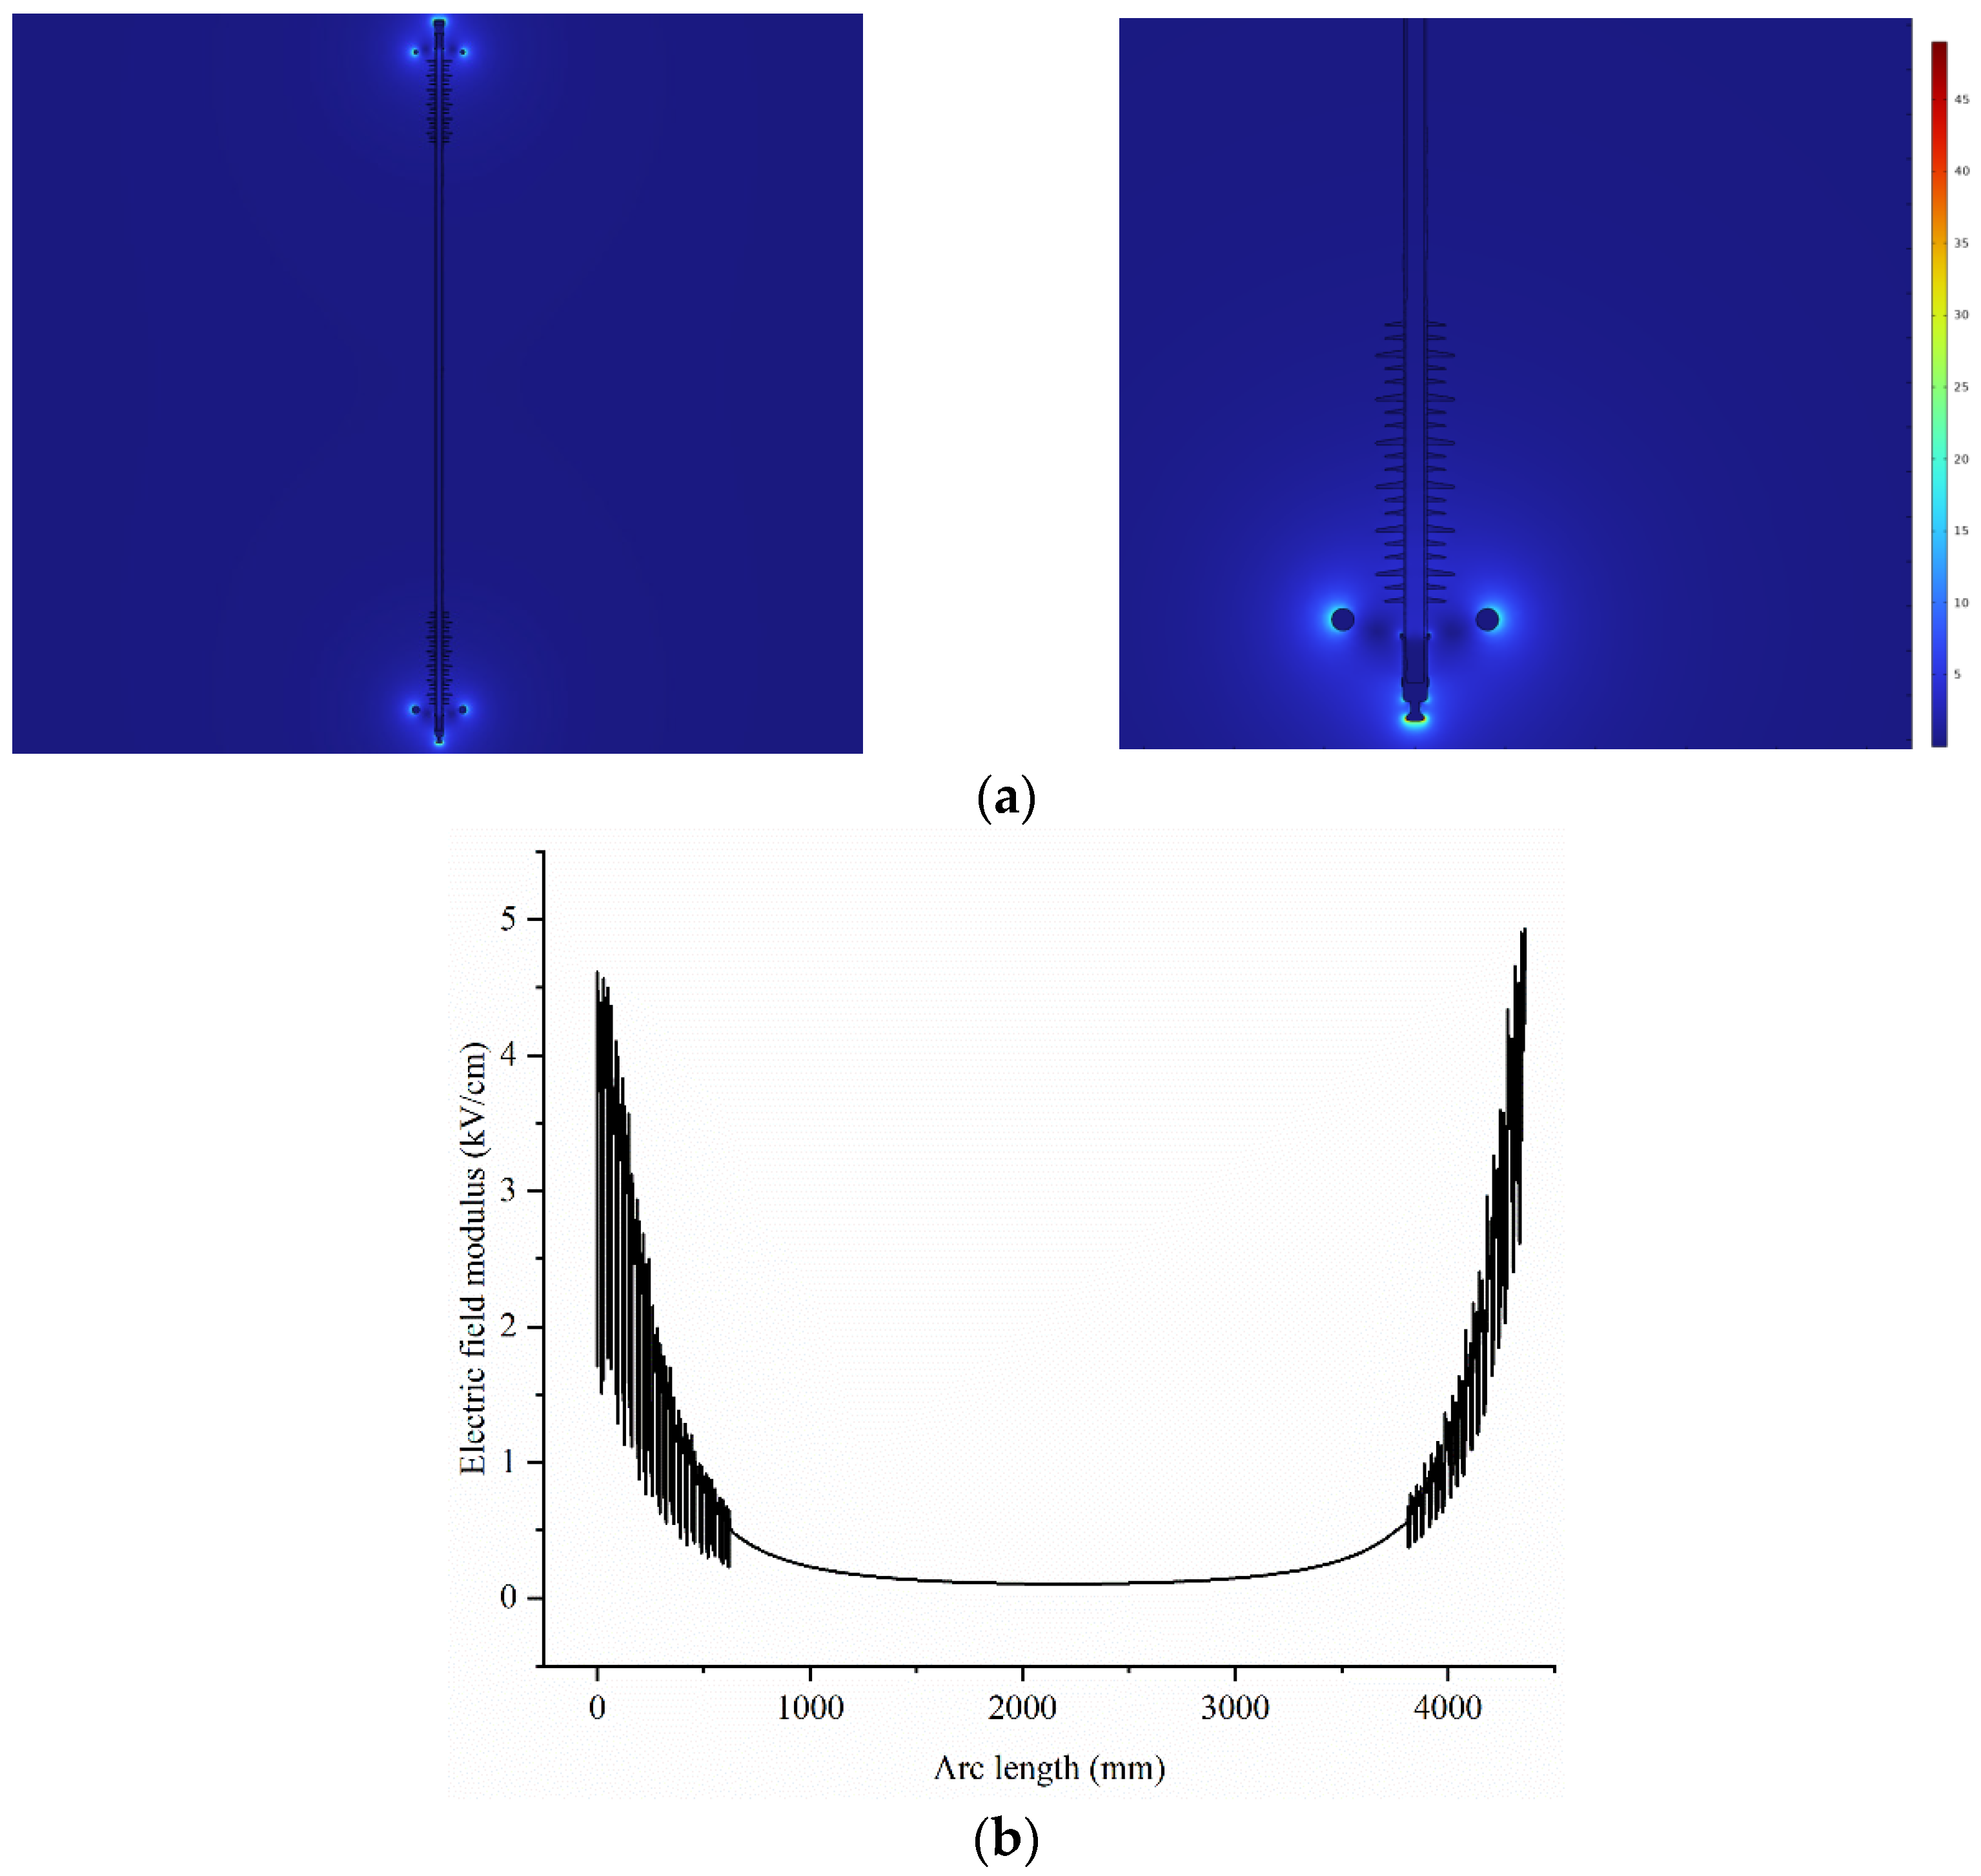
The voltage equalization ring plays a crucial role in regulating the uniformity of the electric field distribution around insulators, directly impacting both corona suppression and insulation performance. The primary function of the voltage equalizing ring is to uniformly distribute the electric field and voltage around the fiber-optic composite insulator and its end fittings. This suppresses corona discharge caused by excessive local field strength, thereby improving insulation conditions and ensuring the insulating performance of the fiber-optic composite insulator. Therefore, it is necessary to conduct simulation studies on the structure of fiber-optic composite insulators and the configuration of their voltage equalizing rings. Figure 15 illustrates the electric field distribution of a fiber-optic composite insulator with a voltage equalizing ring featuring an outer diameter of 370 mm, a tube radius of 25 mm, and a shielding depth of 50 mm. The maximum surface electric field distribution on the insulator reaches 4.6 kV/cm, meeting the requirements of the power industry standard DL/T 1000.3-2015 that the maximum electric field strength at the end of the insulator shall not exceed 5 kV/cm.
The outer diameter of the voltage equalizing ring determines the radial diffusion range of the electric field. The radius of the circular tube correlates with surface field strength and corona initiation characteristics. The shielding depth influences the electric field shielding efficiency at the base of end fittings and insulators. All three are core structural parameters governing the electric field distribution. For gradient selection, we reference the conventional engineering design range for voltage equalizing rings in the power industry (e.g., parameter spans across multiple voltage levels in standards) to ensure variables fall within a practical design domain. Additionally, based on parameter sensitivity analysis, we set small step gradients of ±10% to 15% relative to the original dimensions. This approach captures the continuous influence of parameters on electric field performance while covering the range of “below, equal to, and above the original dimensions.” It clarifies the marginal effects of parameter changes on electric field uniformity, maximum field strength, and corona suppression effectiveness. This approach balances simulation resources with result validity, systematically quantifying each parameter’s regulatory mechanism on the electric field distribution of 500 kV fiber-optic composite insulators and providing scientific basis for structural optimization. This study conducts electric field simulations on the voltage equalizing ring structure design for 500 kV cycloaliphatic epoxy fiber composite insulators. It focuses on single-parameter studies of key structural parameters (outer diameter, tube radius, shielding depth) for the high- and low-voltage-end voltage equalizing ring, performing separate electric field simulations to analyze the influence mechanisms of each parameter on the electric field.

3.2.2. Selection of Voltage Equalizing Ring Outer Diameter

The outer diameter of the voltage equalizing ring on fiber-optic composite insulators determines the radial diffusion range of the electric field. A larger outer diameter enhances the radial diffusion capability of the electric field; however, an excessively large outer diameter leads to redundant dimensions in the voltage equalizing ring itself, causing new issues of field concentration. This study aims to clarify the differences in electric field uniformity between the insulator and the voltage equalizing ring surface under various outer diameters, select the outer diameter that achieves the most uniform electric field distribution, and prevent excessive local field strengths that could trigger corona discharge.
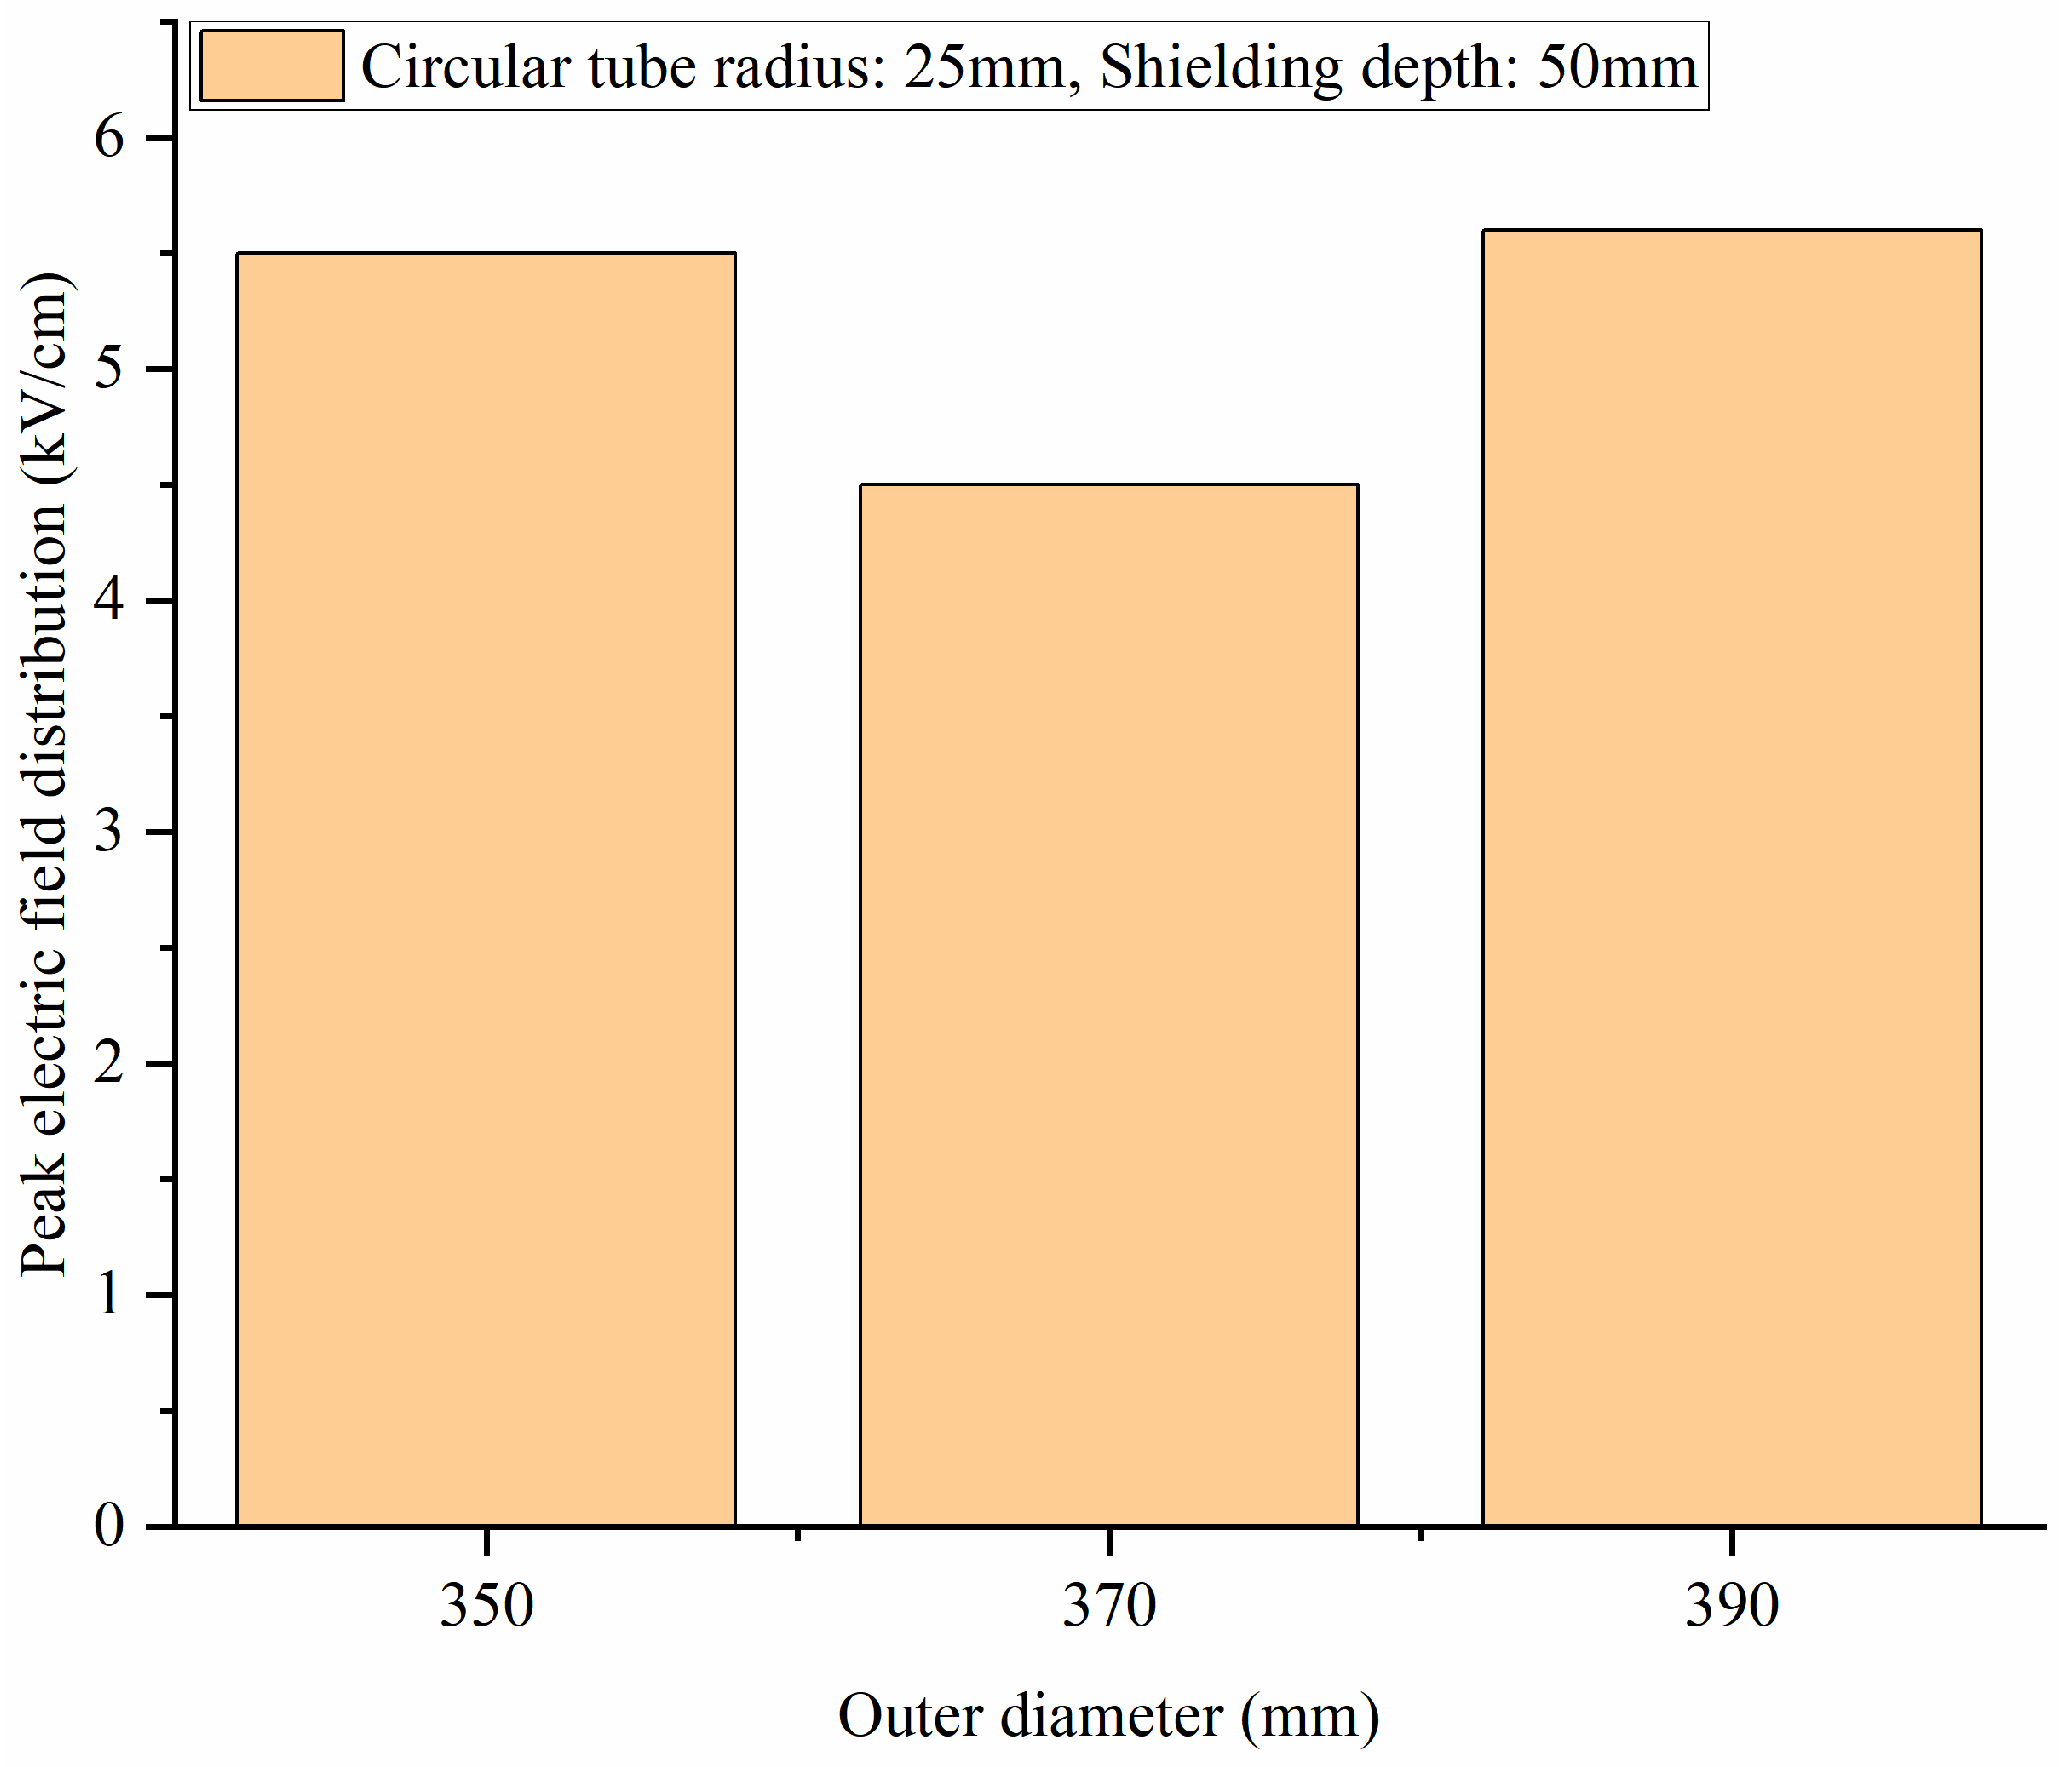
Figure 16 presents the electric field simulation study of the voltage equalizing ring outer diameter, focusing on the radial diffusion characteristics of the electric field. Using the control variable method, the radius of the circular tube was fixed at 25 mm and the shielding depth at 50 mm. Only the outer diameter of the voltage equalizing ring was varied to 350 mm, 370 mm, and 390 mm for the electric field simulation of the 500 kV aliphatic epoxy fiber composite insulator. Simulation results reveal significant variations in maximum surface electric field strength across different outer diameters. At 350 mm outer diameter, the maximum field strength reached 5.5 kV/cm, exceeding the standard limit of 5 kV/cm; at 370 mm, the maximum field strength decreased to 4.6 kV/cm, meeting industry standards while exhibiting the most uniform field distribution. However, increasing the outer diameter to 390 mm caused the maximum field strength to rise again to 5.6 kV/cm, once more exceeding the standard threshold.
Simulation results indicate that regulating the outer diameter of the voltage equalization ring fundamentally balances the diffusion capacity of the electric field with the risk of charge concentration on the ring surface: an excessively small outer diameter restricts radial electric field diffusion, leading to field strength concentration near the ring; conversely, an excessively large outer diameter causes excessive charge accumulation on the ring surface, triggering increased field strength on the ring itself. The 370 mm outer diameter achieves the optimal balance between “effective electric field diffusion” and “uniform charge distribution,” providing clear quantitative guidance for engineering selection while avoiding material waste and structural compatibility issues caused by dimensional redundancy.

3.2.3. Selection of Voltage Equalizing Ring Circular Pipe Radius

Since the radius of the equalizing ring’s circular tube in fiber-optic composite insulators reflects the curvature characteristics of the equalizing ring, a smaller radius indicates greater curvature of the ring body. Higher curvature facilitates the concentration of electric fields on the ring surface, thereby influencing the corona initiation field strength. This study investigates the effects of varying equalizing ring tube radii on both the ring’s corona suppression capability and electric field uniformity. It aims to identify the optimal tube radius that simultaneously suppresses corona discharge and ensures uniform electric field distribution.
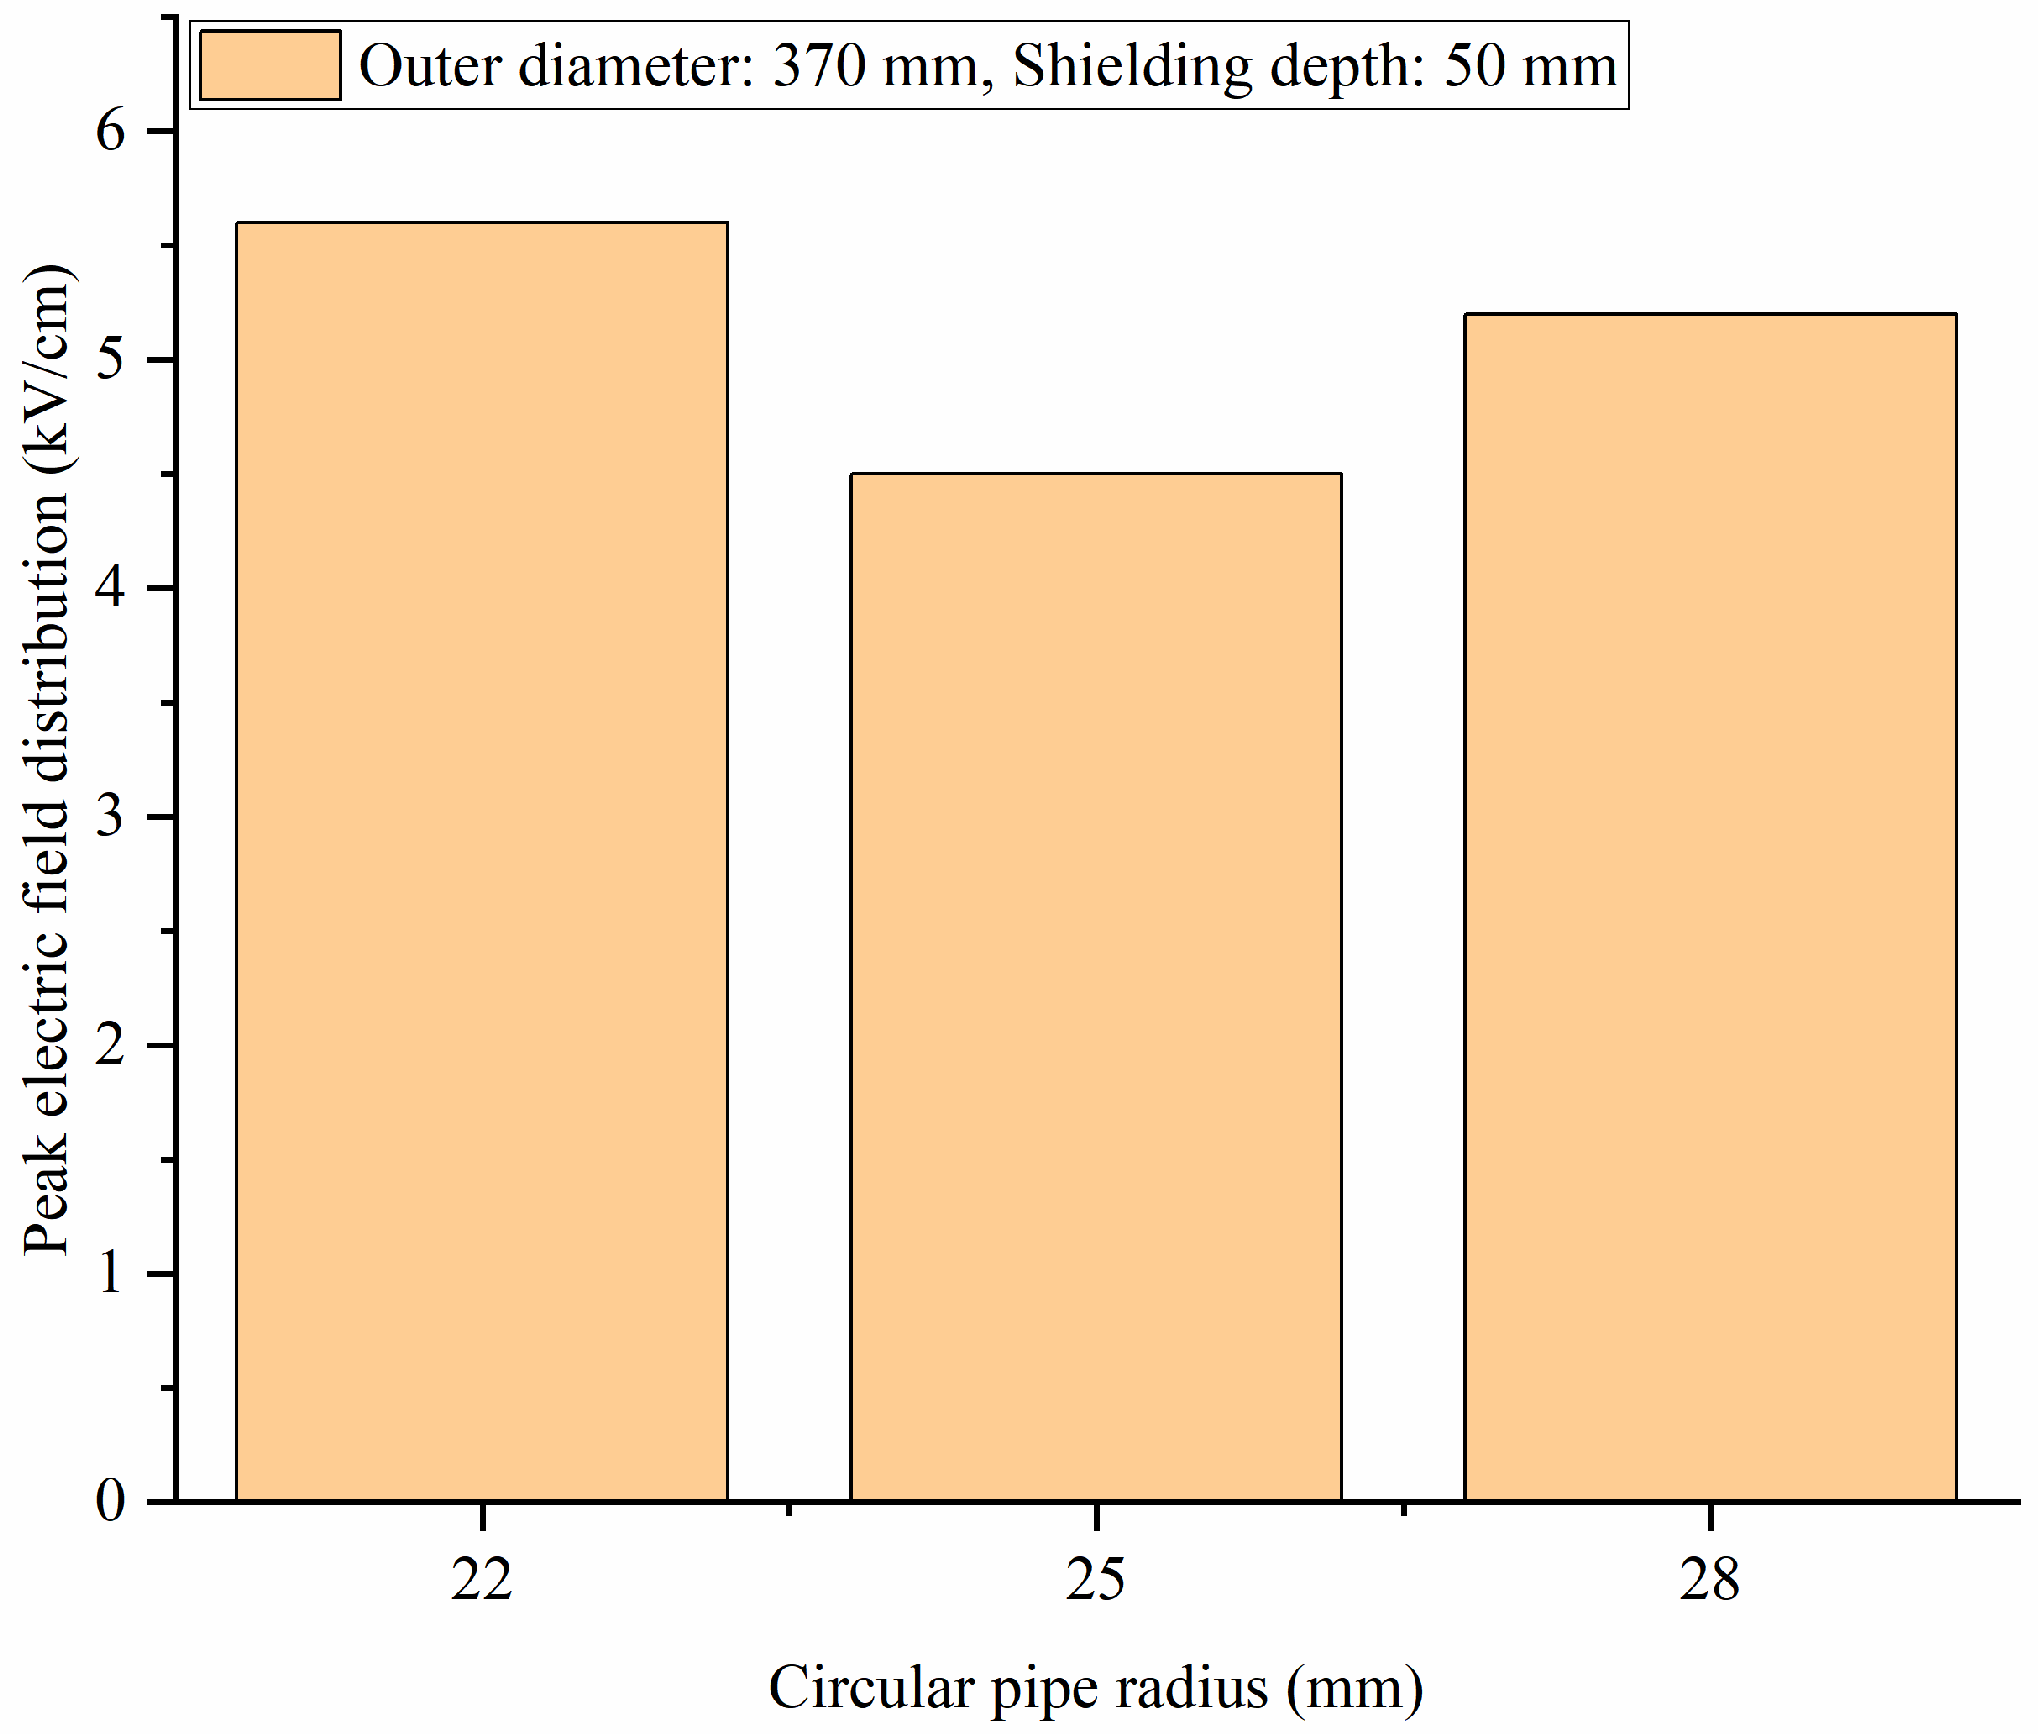
Figure 17 presents the simulation study of the electric-field-focusing curvature characteristics of the equalizing ring’s circular tube radius, examining its impact on corona suppression and electric field uniformity. Under fixed conditions of an outer diameter of 370 mm and a shielding depth of 50 mm, comparative simulations were conducted with circular tube radius gradients of 22 mm, 25 mm, and 28 mm. The specific simulation results are as follows: At a radius of 22 mm, the maximum electric field strength on the insulator surface reached 5.6 kV/cm, far exceeding the standard limit. At a radius of 25 mm, the maximum field strength decreased to 4.6 kV/cm, with uniform distribution and no local concentration. When the radius increased to 28 mm, the maximum field strength was 5.2 kV/cm. Although lower than the 22 mm condition, the electric field uniformity deteriorated significantly.
Simulation results indicate that the electric field characteristics can be controlled by adjusting the curvature of the ring body through changes in the pipe radius: a small radius (22 mm) causes a sharp increase in surface electric field strength due to excessive curvature, making it prone to corona discharge; a larger radius (28 mm) reduces the ring’s curvature but diminishes its ability to guide and regulate the surrounding electric field, resulting in disordered electric field distribution on the insulator surface. The 25 mm radius achieves a balance of “moderate curvature and effective regulation,” suppressing corona initiation through optimal curvature while ensuring electric field uniformity. This provides a parameter standard for equalizing ring design that balances electrical performance and engineering practicality.

3.2.4. Selection of Voltage Equalizing Ring Shielding Depth

The shielding depth of the voltage equalization ring in fiber-optic composite insulators determines the extent to which the ring shields the electric field at the insulator base and hardware. Insufficient depth leads to inadequate shielding and a sharp increase in base field strength; excessive depth results in redundant ring positioning, disrupting overall electric field diffusion. This study identifies the optimal shielding depth that simultaneously reduces root-end field strength without compromising overall field uniformity by quantifying the suppression effect of different shielding depths on insulator root-end electric fields.
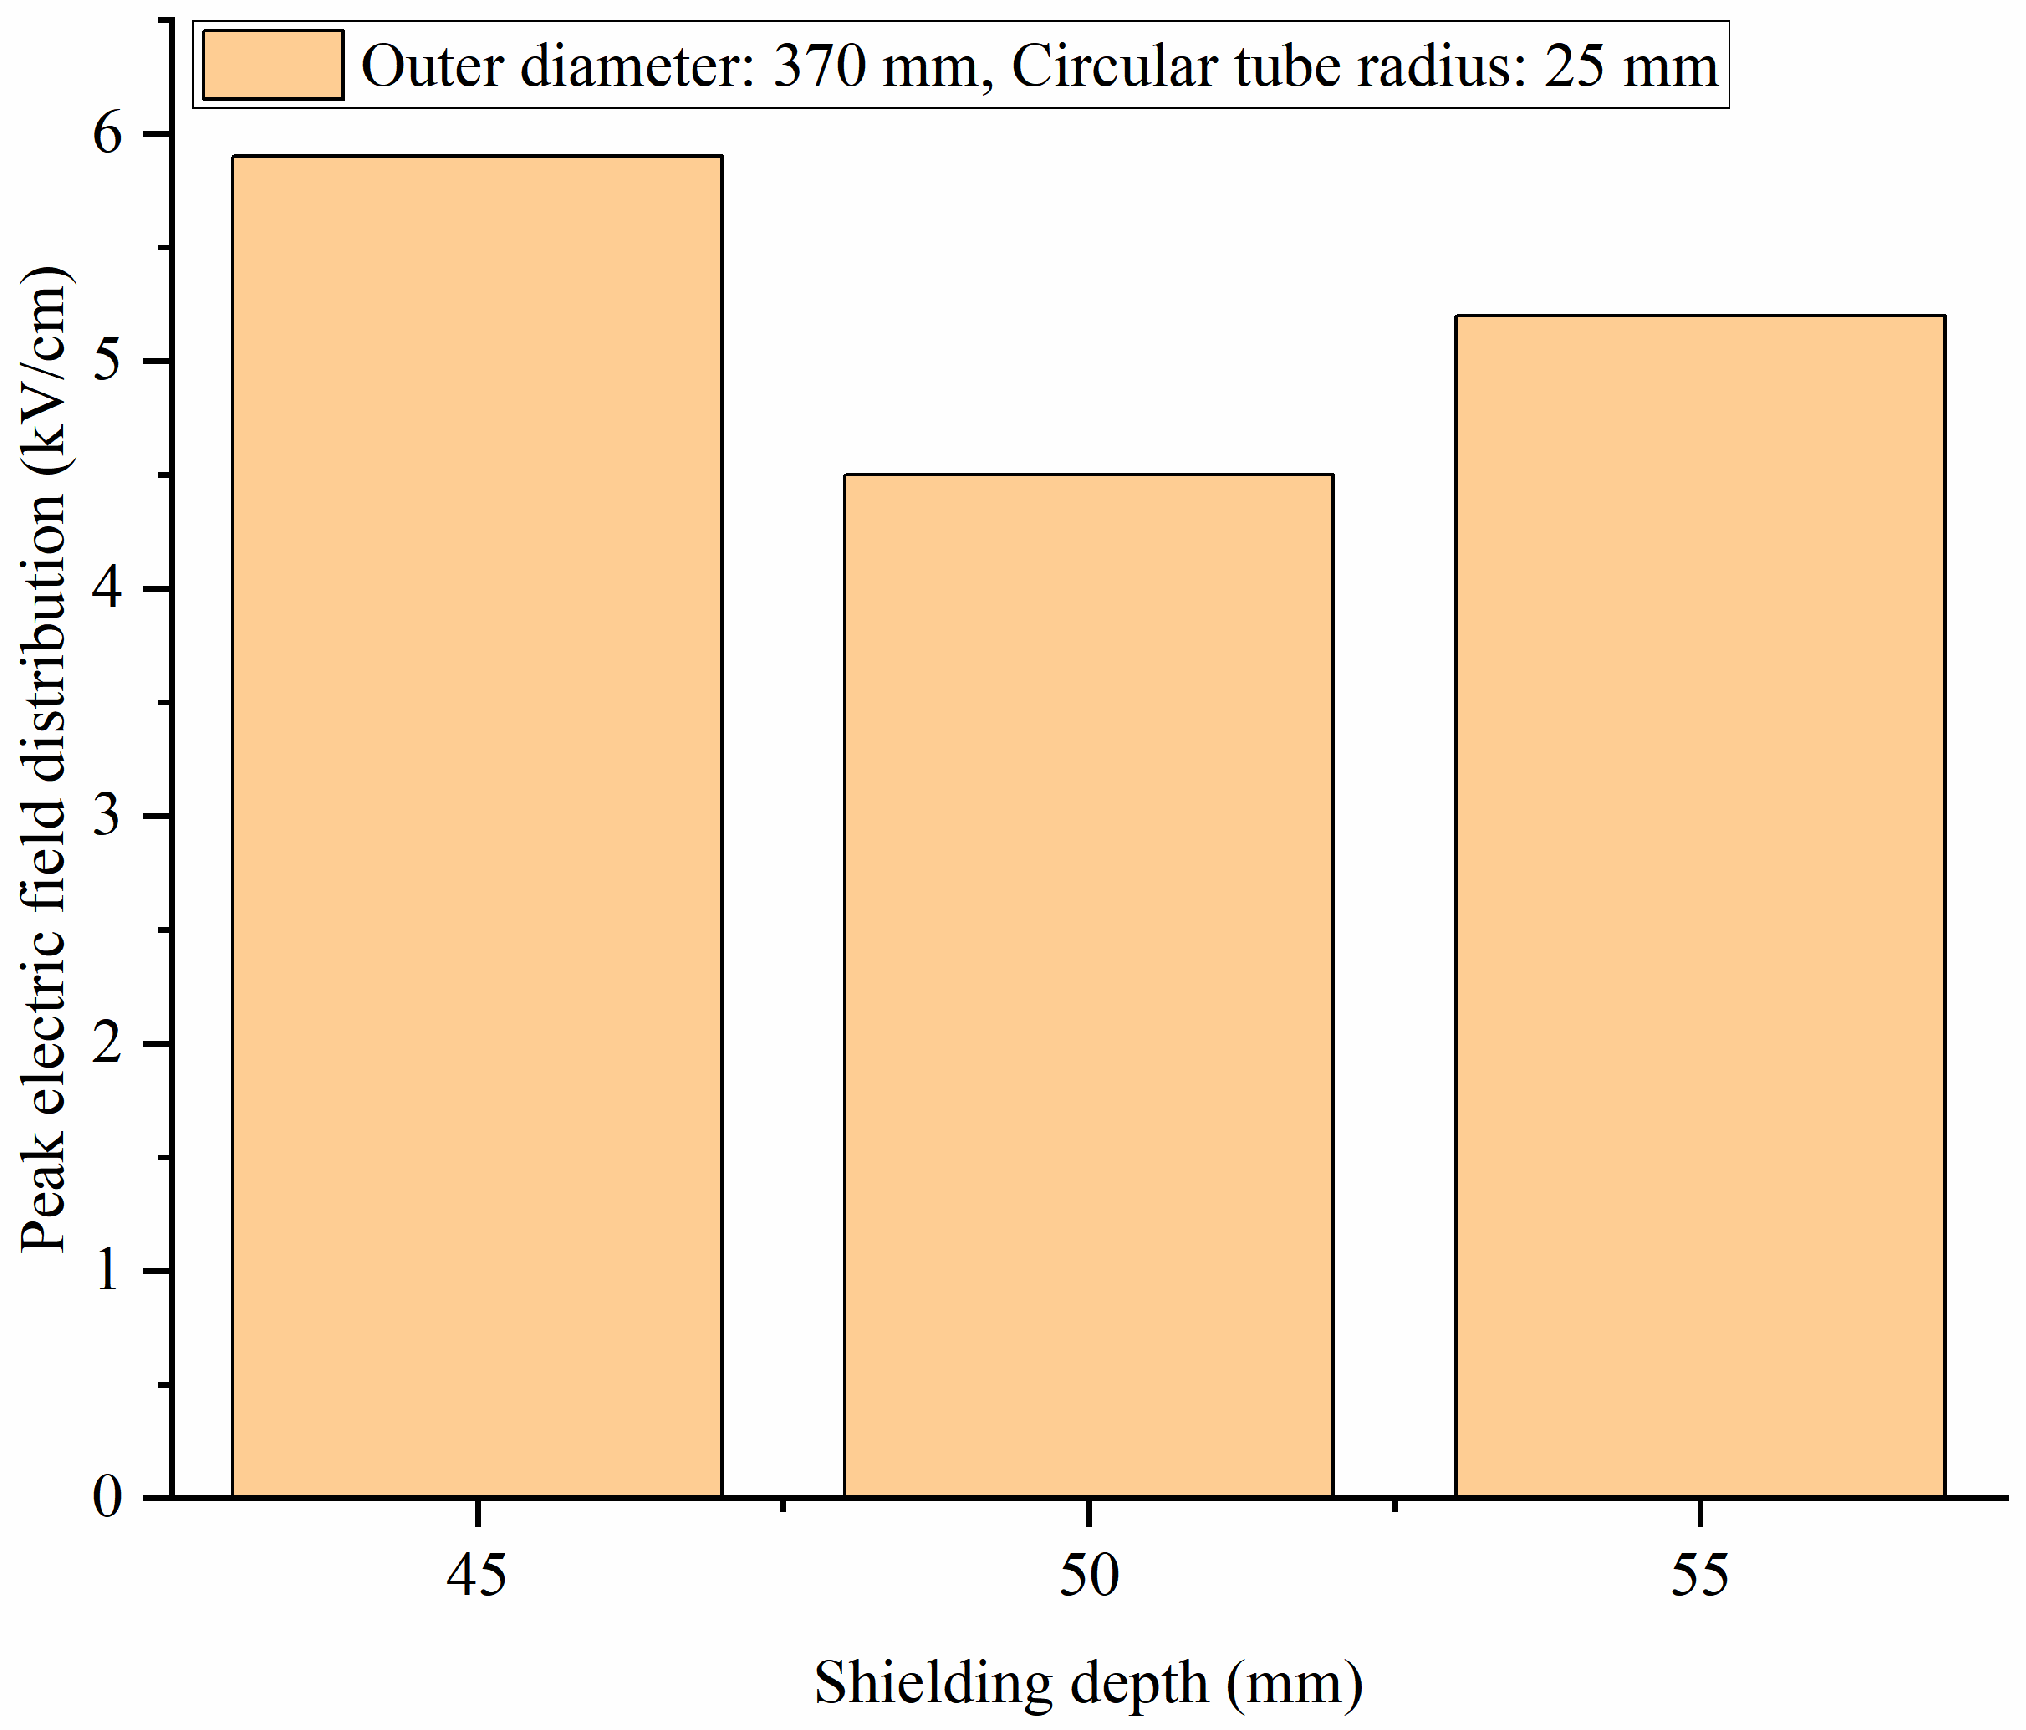
Figure 18 presents an electric field simulation study on the shielding depth of voltage equalizing rings, focusing on the shielding effectiveness at the base of end fittings and insulators. With a fixed outer diameter of 370 mm and a circular tube radius of 25 mm, simulations were conducted at shielding depths of 45 mm, 50 mm, and 55 mm. Simulation results indicate the following: at 45 mm depth, maximum field strength near the insulator base and hardware reached 5.9 kV/cm, with insufficient shielding causing severe local field strength exceedances; at a depth of 50 mm, the maximum field strength decreased to 4.6 kV/cm, with effective suppression of root-area field strength and overall uniform electric field distribution. At a depth of 55 mm, the maximum field strength was 5.2 kV/cm—lower than the 45 mm condition—but abnormal field strength increases occurred in the middle section of the insulator.
The core function of shielding depth is to regulate the electric field coverage of the voltage equalizing ring over critical areas: if too shallow (45 mm), it fails to fully shield the high-field zones near end fittings and roots, potentially triggering partial discharges; excessive depth (55 mm) causes the ring body to retract too far inward, disrupting the normal diffusion path of the electric field and leading to distortion in the central region. A shielding depth of 50 mm achieves a synergistic balance of “adequate shielding and orderly diffusion.” It precisely covers critical areas to reduce field strength at the base while avoiding interference with the overall electric field distribution, providing precise quantitative parameters for the installation positioning of the voltage equalizing ring.
Simulation results indicate that at a shielding depth of 45 mm, insufficient shielding causes significantly elevated electric field strengths at the insulator base and hardware, increasing the risk of partial discharge. At a shielding depth of 50 mm, shielding effectiveness and electric field uniformity achieve equilibrium, effectively suppressing base field strengths and yielding optimal overall electric field distribution. At a shielding depth of 55 mm, the ring body retracts excessively inward, disrupting the normal diffusion of the external electric field. This causes an abnormal increase in the electric field strength at the midpoint of the fiber-optic composite insulator.
Research indicates that the outer diameter, circular tube radius, and shielding depth of the voltage equalizing ring in 500 kV cycloaliphatic epoxy resin fiber-reinforced composite insulators serve as core structural parameters governing their electric field distribution. These parameters significantly influence the electric field uniformity between the insulator and ring surface, the corona suppression effect, and the field strength at the base of the hardware/insulator. Specifically, the outer diameter must balance radial electric field diffusion capability with the risk of local field concentration within the ring body; optimizing the circular tube radius requires considering both the curvature’s effect on corona initiation characteristics and the need for electric field uniformity; and controlling the shielding depth necessitates coordinating the suppression efficiency of hardware/base field strength with the overall electric field diffusion pattern. In engineering practice, synergistic optimization of these three parameters based on their quantitative impact mechanisms on electric field performance is essential to maximize the electric field control efficiency of the equalizing ring. This approach effectively enhances the insulation reliability and service life of 500 kV aliphatic epoxy fiber composite insulators, providing theoretical support and technical reference for electric field optimization design in high-voltage transmission equipment.

3.3. Effect of Different Umbrella Cover Materials on the Mechanical Properties of Fiber-Optic Insulators

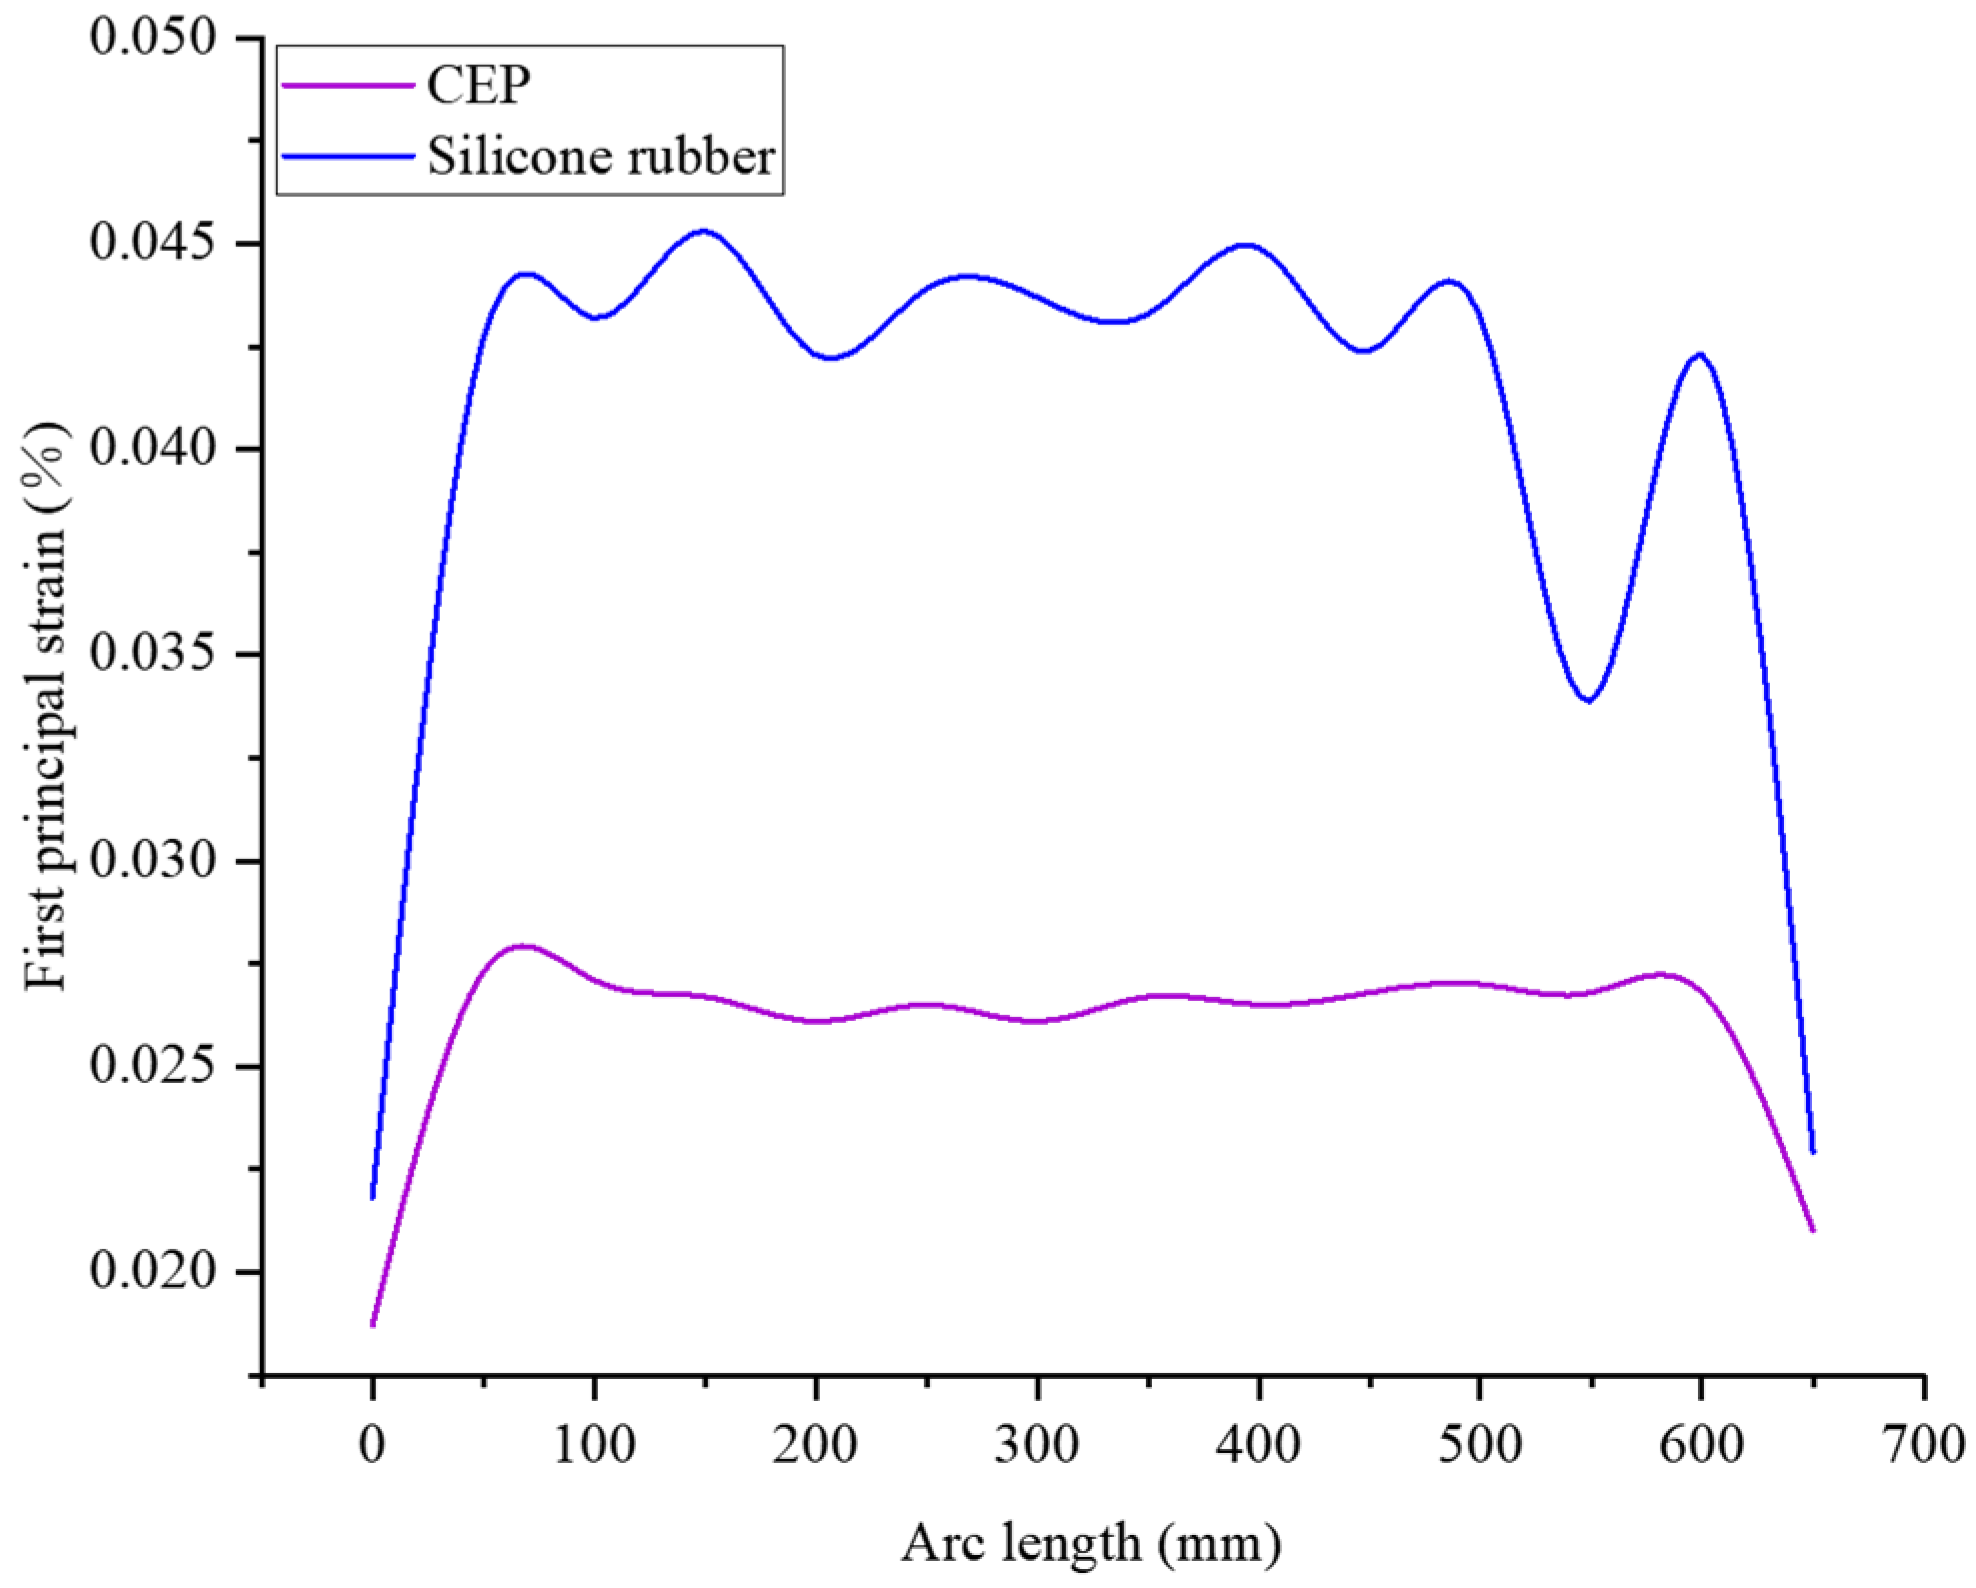
As optical fiber composite insulators represent an emerging research field lacking relevant design standards, the product design primarily referenced existing standards for composite insulators primarily made of silicone rubber. After completing the structural design of the cycloaliphatic epoxy resin optical fiber insulator, it was compared with a silicone rubber optical fiber insulator of identical structure to validate the rationality of the cycloaliphatic epoxy resin design. The comparison simulation employed the same settings as the previous simulation. The strain distribution curves for the embedded optical fibers in both simulation sets are shown in Figure 19.
As clearly shown in Figure 18, the strain on the embedded optical fiber in CEP optical fiber insulators is smaller than that in silicone rubber optical fiber insulators. It is speculated that due to the significantly higher elastic modulus of CEP material compared to silicone rubber, under identical structural conditions, the CEP sheath experiences lower strain, resulting in reduced shear force transmitted to the optical fiber. Conversely, silicone rubber exhibits relatively higher strain, leading to greater strain transferred to the optical fiber. Therefore, the cycloaliphatic epoxy resin optical fiber insulator structure proposed in this paper exhibits lower strain on the embedded optical fiber compared to conventional silicone optical fiber insulators with equivalent structures.

3.4. Core Rod Pull Test

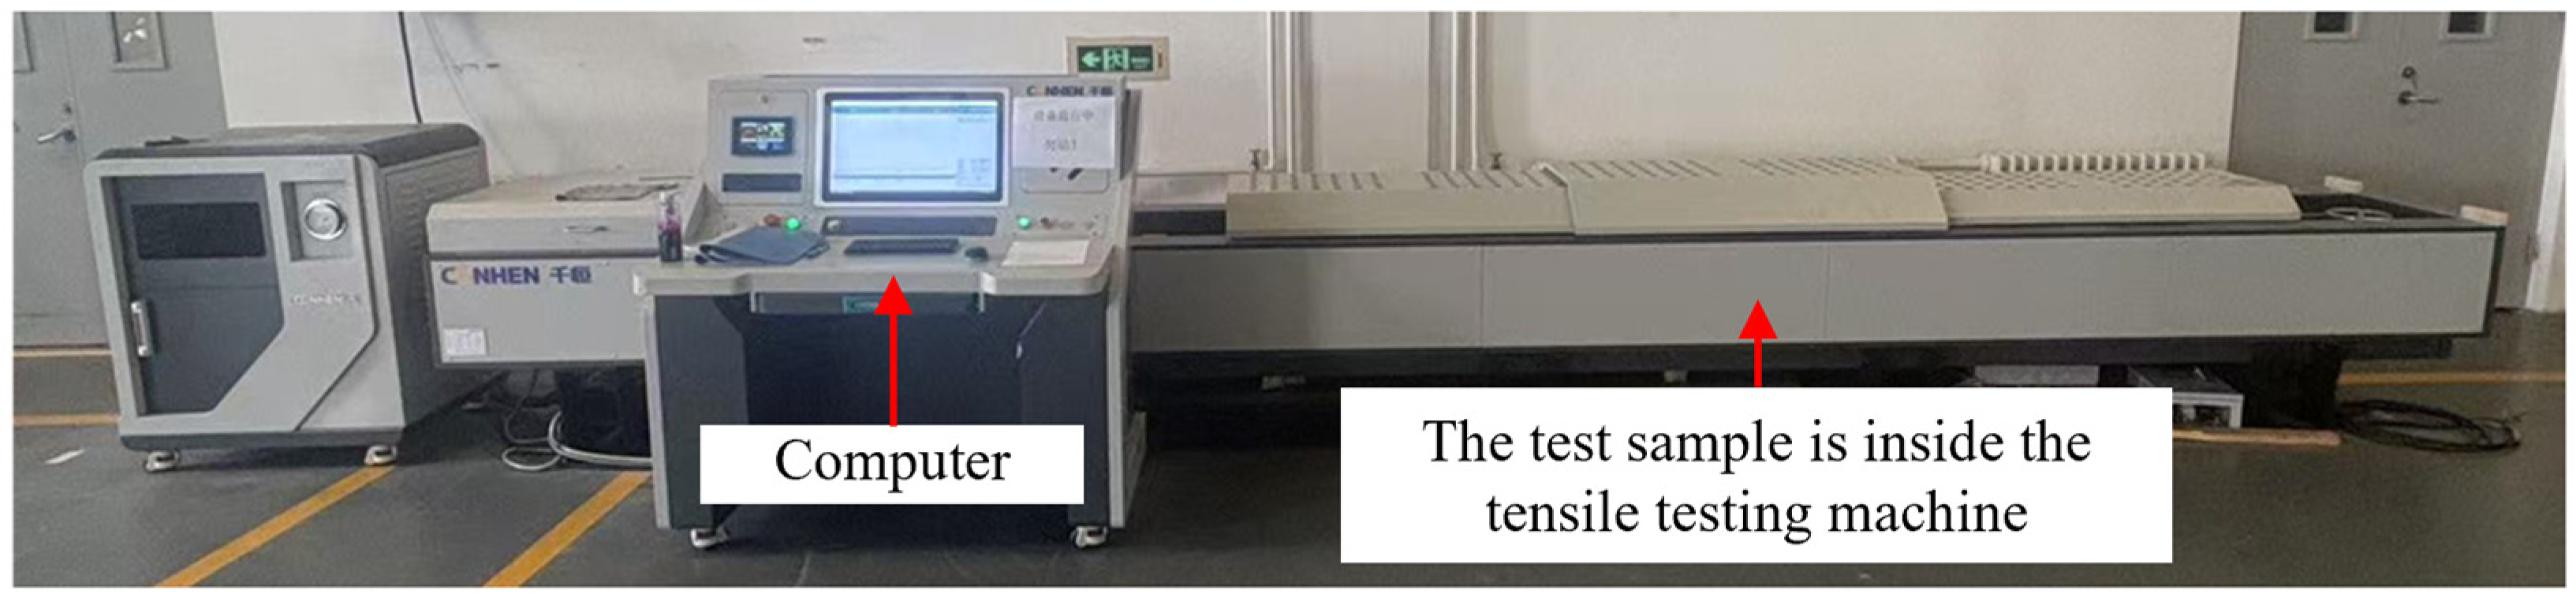
In this section, a specimen with a diameter of 18 mm is used to verify the accuracy of the simulation results. The verification process includes a mechanical simulation of the tensile process using the finite element method and subsequent tensile tests. The experimental results are compared with the simulation data to confirm their reliability. The testing equipment employed a horizontal tensile testing machine (Zibo Qianheng Automation Engineering Co., Ltd., Zibo, China, QH-WLW-300 kN), as shown in Figure 20. Details of the applied loads in the simulation and the comparison with the experimental results are provided in Table 5. Comparative analysis shows that the simulation results agree well with the measured data, effectively capturing the deformation behavior of the core rod under tensile loading. Notably, at a load of 90 kN, the elongation error between the simulation and the experiment is only 2.5%, indicating high precision. The overall simulation error remains within 10%, which demonstrates that the established numerical model has good predictive ability and engineering applicability. These findings provide a reference for simulating the mechanical performance of similar structures and further validate the appropriateness of the material constitutive model and boundary conditions used.

4. Conclusions

High-voltage optical fiber composite insulators are critical components for ensuring the reliable operation of new power systems, particularly optical current transformers (OCTs). However, traditional silicone rubber optical fiber insulators frequently fail under high electric fields and high-humidity thermal conditions due to interface defects. To enhance long-term reliability, this study proposes replacing silicone rubber with cycloaliphatic epoxy resin (CEP). Addressing the lack of structural design principles, a systematic structural optimization study based on finite element simulation was conducted. This paper establishes optimization principles for key structural parameters of 500 kV CEP optical fiber insulators, providing a methodology for designing and developing high-reliability optical fiber insulators. The relevant conclusions are as follows:
  • Different fiber implantation methods affect the strain distribution of embedded fibers within CEP optical fiber insulators. Mechanical simulations indicate that within the investigated design space, the 500 kV cycloaliphatic epoxy resin fiber insulator with a 40 mm core rod, 135° helical groove angle, and six embedded fibers exhibits the lowest strain distribution between the embedded optical fibers and core rod. The optical fiber strain is only 0.01%. This provides simulation-based design references for selecting fiber implantation methods in optical fiber insulators under specific conditions.
  • The electric field distribution at the insulator end varies with the design of the grading ring. The equalizing ring structure design for 500 kV CEP optical fiber insulators is also applicable to reference DL/T 1000.3-2015. Verified through electric field simulation, when the high-voltage-end equalizing ring structure parameters are selected as an outer diameter of 370 mm, a circular tube radius of 25 mm, and a shielding depth of 50 mm, the peak end electric field strength reaches 4.6 kV/cm. This meets the maximum allowable end electric field strength requirement for standard equalizing ring structures specified in DL/T 1000.3-2015, confirming that the structural design satisfies operational requirements.
  • The structural design of CEP optical fiber insulators complies with four relevant standards. Mechanical simulations indicate that under identical conditions, the average strain experienced by optical fibers in CEP optical fiber insulators is approximately half that in silicone rubber fiber insulators. This provides a theoretical basis for selecting umbrella sleeve materials for optical fiber insulators in practical engineering applications.

Author Contributions

Conceptualization, J.F. and L.W.; methodology, J.F. and F.Y.; software, Y.L.; validation, X.H. and D.H.; formal analysis, F.Y. and X.H.; investigation, D.H.; resources, Y.G.; data curation, Y.L. and D.H.; writing—original draft preparation, D.C.; writing—review and editing, J.F., Y.G., L.W. and K.W.; visualization, J.F.; supervision, L.W. and F.Y.; project administration, K.W.; funding acquisition, Y.G. and Y.L. All authors have read and agreed to the published version of the manuscript.

Funding

This work was funded by the State Grid Jibei Electric Power Co., Ltd. Electric Power Science Research Institute Scientific Research Project Grant No. 52018K250002, entitled “State Grid Jibei Electric Power Co., Ltd. Electric Power Science Research Institute Research on the Degradation Mechanism of Fiber-Optic Insulators in Complex Environments from 2025 to 2026”.

Data Availability Statement

The original contributions presented in this study are included in the article. Further inquiries can be directed to the corresponding authors.

Conflicts of Interest

Authors Y.G., Y.L., X.H. and K.W. were employed by State Grid Jibei Electric Power Co., Ltd. Electric Power Science Research Institute. Author D.H. was employed by Beijing Grid Electric Power Technology Co., Ltd. The remaining authors declare that the research was conducted in the absence of any commercial or financial relationships that could be construed as potential conflicts of interest.

References

  1. Li, Z.; Cui, J.; Chen, H.; Lu, H.; Zhou, F.; Rocha, P.R.F.; Yang, C. Research progress of all-fiber optic current transformers in novel power systems: A review. Microw. Opt. Technol. Lett. 2025, 67, e70061. [Google Scholar] [CrossRef]
  2. Bohnert, K.; Frank, A.; Müller, G.; Yang, L.; Lenner, M.; Gabus, P.; Gu, X.; Marchese, S.V. Fiber optic current and voltage sensors for electric power transmission systems. In Fiber Optic Sensors and Applications XV; SPIE: Bellingham, WA, USA, 2018; Volume 10654, p. 1065402. [Google Scholar] [CrossRef]
  3. Song, Y.; Tao, A.; Chen, W.; Zhang, W.; Wang, C.; Zhu, X.; Liu, B.; Tian, H.; Liu, H. A novel fiber-optic implantable basin insulator and its detection of current-excited GIS vibration signals. Measurement 2025, 256, 118100. [Google Scholar] [CrossRef]
  4. Wu, X.; Hao, Y.; Wu, Z.; Bi, J.; Wu, H.; Huang, L. Early Warning of AC Salt Fog Flashover on Composite Insulators Using Fiber Bragg Grating Sensing and Visible Arc Images. Micromachines 2025, 16, 1171. [Google Scholar] [CrossRef] [PubMed]
  5. Li, L.; Xu, K.Z.; Liu, Y.; Tan, S.; Wu, W.; Zhang, Z.; Yang, L.; Tang, L. Study on the Core Properties of Fiber-Optic Composite Insulators Based on Epoxy-Based Composite Foam Materials. Proc. Chin. Soc. Electr. Eng. 2025, 45, 7383–7395. (In Chinese) [Google Scholar] [CrossRef]
  6. Seike, S.; Mima, T.; Nozaki, M.; Tani, N.; Ikeda, M. Optical Fiber Composite Insulator. U.S. Patent US5090793A, 25 February 1992. [Google Scholar]
  7. Changyuan High-Energy Electric Co., Ltd. A Fiber-Optic Composite Insulator Based on Multi-Core Mandrel Technology. CN Patent CN201921639978.7, 21 April 2020. (In Chinese) [Google Scholar]
  8. Wang, M.; Li, C.; Zhang, X.; Xiong, X.; Zhao, Z.; Xie, T.; Li, Y. High-Voltage Withstand Capability Study of High-Voltage Contact-Type Fiber Optic Insulators. Adv. Technol. Electr. Eng. Energy 2014, 33, 44–46+57. Available online: https://kns.cnki.net/kcms2/article/abstract?v=A-1EuXenf_okGHNKfjNtPzLATK0ban5SgBeS2tkruY6G7gIwoc6QGPfpD1F4lIgIy7HgyLuGSqi1Dqlz_LUYacM10Z2CgEnw1Zvd6mWS_c-yAXmVOnKV33u3HZNmSToAiyd8ZS7WCCgHL6Je2aih-NHOhpiIpTjX1H2MmzhpbF3G1KRNPfzf8A==&uniplatform=NZKPT&language=CHS (accessed on 24 February 2026). (In Chinese)
  9. Kerrouche, A.; Boyle, W.; Sun, T.; Grattan, K.T.V.; Schmidt, J.W.; Taljsten, B. Strain measurement using embedded fiber Bragg grating sensors inside an anchored carbon fiber polymer reinforcement prestressing rod for structural monitoring. IEEE Sens. J. 2009, 9, 1456–1461. [Google Scholar] [CrossRef]
  10. Cai, D.; Yang, Y. Suspension Fiber-Optic Composite Insulator. CN Patent CN02249703.X, 22 October 2003. (In Chinese) [Google Scholar]
  11. Gao, C.; Peng, Y.; Zhang, G. Composite insulator interface discharge accelerated decay-like aging and analysis. In Proceedings of the 2021 IEEE 2nd China International Youth Conference on Electrical Engineering, Chengdu, China, 5–17 December 2021. [Google Scholar] [CrossRef]
  12. Huang, N.; Jia, S.; Wang, L.; Yang, Z.; Li, Y. Research on Fiber Bragg Grating Matching Demodulation Based on Surface-Mounted Strain Transducer. J. Appl. Opt. 2025, 46, 530–537. Available online: https://kns.cnki.net/kcms2/article/abstract?v=A-1EuXenf_qekKMR4XdNPGAyxKhyBY_JyDDN81n0i5kQbQ7xQpqYK7fYzzq1328Pdd3T9FGiLoytVujUEJhOEgX1V3OUoDw0qu6OQ7BEYRMrbu4AK_k81prKrUToQj-8VLYsLvyvL8A4HYpkUaea5D4zBhjUGl6Fcg1WniRuitzztsHxjs3kJQ==&uniplatform=NZKPT&language=CHS (accessed on 24 February 2026). (In Chinese)
  13. Kalamkarov, A.L.; Fitzgerald, S.B.; MacDonald, D.O.; Georgiades, A. On the processing and evaluation of pultruded smart composites. Compos. Part B Eng. 1999, 30, 753–763. [Google Scholar] [CrossRef]
  14. Central China Grid Company Limited; Wuhan Comp Evergreen Software Technology Co., Ltd.; Xiangyang State Grid Composite Insulator Co., Ltd. A Fiber-Optic Grating Composite Insulator and Its Manufacturing Method. CN Patent CN201010287316.5, 16 November 2011. (In Chinese) [Google Scholar]
  15. Wang, Z.; Liu, J.; Zhang, X.; Ai, Y.; Li, W.; Liu, D. Analysis of Breakdown Faults in Composite Insulators for All-Optical Current Sensors. Insul. Surge Arresters 2020, 5, 242–247. (In Chinese) [Google Scholar] [CrossRef]
  16. Zeng, X.; Cai, D.; Yin, F.; Wang, L. Study on Interface Performance of Fiber Optic Hard Composite Insulator. In Proceedings of the 2023 IEEE 7th Conference on Energy Internet and Energy System Integration, Hangzhou, China, 15–18 December 2023. [Google Scholar] [CrossRef]
  17. Wang, L.; Nie, Z.; Zhao, C.; Zhou, J.; Geng, W. Water Permeation Characteristics in Epoxy Composite Insulator Sleeves. High Volt. Eng. 2019, 45, 173–180. (In Chinese) [Google Scholar] [CrossRef]
  18. Meng, X.; Shang, R.; Fan, H.; Wang, Z.; Cui, J.; Diao, W.; Wang, L.; Yin, F. Study on Aging Characteristics of the Core-Sheath Interface in Aromatic Epoxy Resin Insulators and Silicone Rubber Composite Insulators under Humid and Hot Conditions. Power Syst. Technol. 2023, 47, 396–403. (In Chinese) [Google Scholar] [CrossRef]
  19. Liu, Y.; Lin, Y.; Wu, K.; Fan, H.; Wang, L. Analysis and Optimization on Non-uniformity of Temperature Distribution in Hydrophobic Cycloaliphatic Epoxy Resin Insulators during the Curing Process. IEEE Trans. Dielectr. Electr. Insul. 2021, 28, 1810–1818. [Google Scholar] [CrossRef]
  20. Wang, Y.; Liu, Y.; Mei, H.; Xie, M.; Wang, L. Research of cycloaliphatic epoxy resin and silicone rubber composite insulator interface based on four-electrode system and temperature rise model. High Volt. 2023, 8, 560–569. [Google Scholar] [CrossRef]
  21. Liu, Y.; Li, W.; Zeng, S.; Yan, X.; Liu, H.; Liu, Y.; Zhang, G. AC corona aging behavior and performance comparison of HTV silicone rubber, cycloaliphatic epoxy resin, and glass fiber-reinforced epoxy used in composite insulators. RSC Adv. 2025, 15, 31884–31898. [Google Scholar] [CrossRef] [PubMed]
  22. Q/GDW 13253.1—2014; Purchasing Standard of Long Rod Composite Insulators for 10kV~1000kV AC Systems. China Electric Power Press: Beijing, China, 2019. (In Chinese)
  23. DL/T 1000.3-2015; Guidelines for the Use of Insulators for Overhead Lines with Nominal Voltage Above 1000V—Part 3: Rod-Type Suspension Composite Insulators for AC Systems. China Electric Power Press: Beijing, China, 2015. (In Chinese)
  24. DL/T 2386-2021; Technical Specification of Composite Insulator with Optical Fiber. China Electric Power Press: Beijing, China, 2021. (In Chinese)
  25. Zhu, Q.; Wu, G.; Zeng, J.; Jiang, Z.; Yue, Y.; Xiang, C.; Zhan, J.; Zhao, B. Enhanced Strain Field Reconstruction in Ship Stiffened Panels Using Optical Fiber Sensors and the Strain Function-Inverse Finite Element Method. Appl. Sci. 2024, 14, 370. [Google Scholar] [CrossRef]
  26. Farzana, M.; Marjanul, H.; Sonali, S.; Mollah, M.; Amin, M.A.; Khan, S.A.; Islam, F.; Khan, R.A. Thermo-Mechanical Properties and Applications of Glass Fiber Reinforced Polymer Composites. Mod. Concepts Mater. Sci. 2023, 5, 1–9. [Google Scholar] [CrossRef]
  27. Wang, Y.; Liu, Y.; Fan, H.; Wang, L. Hydrothermal aging characteristics of silicone rubber and cycloaliphatic epoxy resin composite insulators interface. High Volt. Eng. 2022, 48, 2028–2035. (In Chinese) [Google Scholar] [CrossRef]
  28. Kim, S.H.; Cherney, E.A.; Hackam, R. The loss and recovery of hydrophobicity of RTV silicone rubber insulator coatings. IEEE Trans. Power Deliv. 1990, 5, 1491–1500. [Google Scholar] [CrossRef]
  29. ASM Handbook Committee. Properties and Selection: Nonferrous Alloys and Special-Purpose Materials; Metals Handbook; ASM International: Almere, The Netherlands, 1990; Volume 2. [Google Scholar] [CrossRef]
  30. El-Refaie, E.; Ab-Elrahman, M.; Mohamed, M. Electric field distribution of optimized composite insulator profiles under different pollution conditions. Ain Shams Eng. J. 2018, 9, 1349–1356. [Google Scholar] [CrossRef]
  31. Mazzanti, G.; Marzinotto, M. Extruded Cables for High-Voltage Direct-Current Transmission: Advances in Research and Development; Wiley-IEEE Press: Hoboken, NJ, USA, 2013; Available online: https://ieeexplore.ieee.org/servlet/opac?bknumber=6558567 (accessed on 24 February 2026).
  32. Aziz, E.; Aouabed, F.; Abdellah, H.; Dineva, A. Optimizing Grading Ring Design for High Voltage Polymeric Insulators in Power Transmission Systems for Enhanced Electric Field and Voltage Distribution by Using a Finite Element Method. Energies 2023, 16, 5235. [Google Scholar] [CrossRef]
  33. Bouhaouche, M.; Mekhaldi, A.; Teguar, M. Improvement of electric field distribution by integrating composite insulators in a 400 kV AC double circuit line in Algeria. IEEE Trans. Dielectr. Electr. Insul. 2017, 24, 3549–3558. [Google Scholar] [CrossRef]
  34. Kelly, L.W.S. Comparison of Informed and Un-Informed Shear Strength Reduction Procedures for Finite Element Method Slope Stability Analysis. Master’s Thesis, Queen’s University, Kingston, ON, Canada, 2023. [Google Scholar]
  35. Dyson, A.P.; Griffiths, D.V. An efficient strength reduction method for finite element slope stability analysis. Comput. Geotech. 2024, 174, 106593. [Google Scholar] [CrossRef]
  36. Celik, I.B.; Ghia, U.; Roache, P.J.; Freitas, C.J.; Coleman, H.; Raad, P.E. Procedure for Estimation and Reporting of Discretization Error in CFD Applications. J. Fluids Eng. 2008, 130, 078001. [Google Scholar] [CrossRef]
  37. Liu, R.; Zhao, Z.; Bai, S. Strain Transfer Analysis of Simplified Interface of Embedded Optical Fiber Smart Composites Material. Mater. Rep. 2021, 35, 20161–20165. (In Chinese) [Google Scholar] [CrossRef]
  38. Liu, D.; Tong, X.; Liu, L.; Dong, X.; Yan, T.; Tang, W.; Wang, L.; Cao, B.; Luo, Z. A Simulation and a Computational Study on the Reliability Verification of Epoxy Resin Paper-Impregnated Bushings in Power Transformers. Energies 2025, 18, 3239. [Google Scholar] [CrossRef]
  39. DL/T 1579-2024; Technical Specification for End Fittings of Composite Insulators for Overhead Lines. China Electric Power Press: Beijing, China, 2024. (In Chinese)
  40. DL/T 1580-2021; Technical Specifications for Core Components of AC/DC Composite Insulators. China Electric Power Press: Beijing, China, 2021. (In Chinese)
  41. Cao, H.; Hao, Y.; Zhang, Z.; Wei, J.; Yang, L. System and Method of Quasi-Distributed Fiber Bragg Gratings Monitoring Brittle Fracture Process of Composite Insulators. IEEE Trans. Instrum. Meas. 2021, 70, 6009110. [Google Scholar] [CrossRef]
  42. Fu, J.; Lin, Z.; Luo, J.; Zheng, Y.; Liu, Y.; Cao, B.; Yin, F.; Wang, L. Understanding the Interfacial Behavior of Cycloaliphatic-like Epoxy Resin with Optical Fibers: Insights from Experiments and Molecular Simulations. Materials 2025, 18, 3830. [Google Scholar] [CrossRef] [PubMed]
  43. Fu, J.; Li, H.; Yin, F.; Wang, L.; Cai, D.; Luo, Z. Research on the Interfacial Characteristics of Epoxy Resin Optical Fiber Composite Insulators. In Proceedings of the 2025 8th International Conference on Energy, Electrical and Power Engineering (CEEPE), Wuxi, China, 25–27 April 2025. [Google Scholar] [CrossRef]
Figure 1. Schematic diagram of structure of 500 kV optical fiber insulator.
Energies 19 01202 g001
Figure 2. Four different optical fiber implantation methods: (a) Through-hole type; (b) Surface-mount type; (c) Slotted type; (d) Helical grooved type.
Energies 19 01202 g002
Figure 3. Simulation model of optical fiber insulator: (a) Two sets of umbrella-skirts; (b) Four models of optical fiber implantation methods.
Energies 19 01202 g003
Figure 4. Finite element model mesh convergence analysis results for optical fiber composite insulators.
Energies 19 01202 g004
Figure 5. First principal strain and stress peak of the core rod under different core rod diameters.
Energies 19 01202 g005
Figure 6. First principal strain and stress peaks for four different optical fiber implantation methods.
Energies 19 01202 g006
Figure 7. First principal strain and stress distribution of optical fibers under four implantation methods: (a) Through-hole type; (b) Surface-mount type; (c) Slotted type; (d) Helical grooved type.
Energies 19 01202 g007
Figure 8. Optical fiber and core rod strain distribution curves under different implant structures: (a) Strain distribution of optical fiber; (b) Strain distribution of core rod.
Energies 19 01202 g008
Figure 9. Schematic diagram of models with different helical groove angles.
Energies 19 01202 g009
Figure 10. Optical fiber first principal strain peak value for three helical groove angle models under 10 kN tensile load.
Energies 19 01202 g010
Figure 11. Optical fiber strain distribution curves at different groove angles.
Energies 19 01202 g011
Figure 12. Schematic diagram of models with different optical fiber implantation quantity: (a) 2; (b) 4; (c) 6.
Energies 19 01202 g012
Figure 13. Optical fiber first principal strain peak value for three optical fiber implantation quantity models under 10 kN tensile load.
Energies 19 01202 g013
Figure 14. Optical fiber strain distribution curves for different numbers of fibers.
Energies 19 01202 g014
Figure 15. Electric field distribution of 500 kV optical fiber composite insulators: (a) Electric field distribution cloud map of optical fiber composite insulators; (b) Electric field distribution curve diagram of optical fiber composite insulators.
Energies 19 01202 g015
Figure 16. Peak electric field for different voltage equalizing ring outer diameters.
Energies 19 01202 g016
Figure 17. Peak electric field for different voltage equalizing ring circular pipe radius.
Energies 19 01202 g017
Figure 18. Peak electric field for different voltage equalizing ring shielding depth.
Energies 19 01202 g018
Figure 19. Optical fiber strain distribution curves for fiber insulators with different sheath materials.
Energies 19 01202 g019
Figure 20. Core rod tensile test site.
Energies 19 01202 g020
Table 1. Structural parameters of umbrella skirts and sleeves.
Sheath ParametersUmbrella Skirt Specifications
Jacket Thickness
(mm)
Nominal Structural Height
(mm)
Nominal Creepage Distance
(mm)
Large/Small Umbrella Skirt Diameter
(mm)
Umbrella Skirt Cycle Length
(mm)
Umbrella Skirt Slope
(°)
Large/Small Umbrella Skirt Hem Bevel
(°)
Small-to-Large Umbrella Skirt Spacing
(mm)
6490016,000210/16097106/237
Table 2. Material parameters for mechanical simulation [25,26,27,28,29].
ParametersOptical FiberCore RodEpoxy Resin SheathSilicone Rubber Umbrella SkirtHardware
Elastic model (GPa)7550100.003200
Poisson ratio0.170.300.300.400.20
Density (kg/m3)22002200150011002700
Table 3. Material parameters for electric field simulation [30,31,32,33].
MaterialsRelative Permittivity
Air1
End fittings, voltage equalizing ring107
Core rod5.5
Epoxy resin sheath7
Silicone rubber umbrella skirt4
Table 4. Design of core rod structural parameters.
Rod-Type Suspension Composite InsulatorCEP Optical Fiber Composite Insulator
Electric Power Industry Standard DL/T 1579-2024When the Core Rod Diameter Is Selected as 40 mmWhen the Core Rod Diameter Is Selected as 30 mm
Rated Mechanical Load (kN)Hardware Hole Depth (L/mm)Core Rod Diameter
(A/mm)
Core Rod Diameter (L/mm)Hardware Hole Depth (A/mm)Hardware Hole Depth (L/mm)Core Rod Diameter (A/mm)
210 kN125241104011030
Table 5. Comparison of simulation and experimental results of core rod tensile test.
Load (kN)Simulation ResultsExperimental ResultsError (%)
Core Rod Total Length (mm)Elongation (mm)Core Rod Total Length (mm)Elongation (mm)
0939.0-939.0--
30941.72.7942.03.010
60944.45.4945.06.010
90947.28.2947.08.02.5
Disclaimer/Publisher’s Note: The statements, opinions and data contained in all publications are solely those of the individual author(s) and contributor(s) and not of MDPI and/or the editor(s). MDPI and/or the editor(s) disclaim responsibility for any injury to people or property resulting from any ideas, methods, instructions or products referred to in the content.