Perspective

Non-Contact Detection Technology of Operation Status for Transmission Line Insulators: Characteristics, Perspectives, and Challenges


1
Xuefeng Mountain Energy Equipment Safety National Observation and Research Station, Chongqing University, Chongqing 400044, China
2
State Grid Chongqing Electric Power Company, Chongqing 400014, China
*
Author to whom correspondence should be addressed.
Energies 2026, 19(3), 636; https://doi.org/10.3390/en19030636
Submission received: 31 December 2025 / Revised: 20 January 2026 / Accepted: 21 January 2026 / Published: 26 January 2026
(This article belongs to the Section F: Electrical Engineering)

Abstract

The operation status of transmission line insulators, such as damage, zero-value, pollution, and deterioration, affect the safe operation of power grids. Non-contact detection technology judges the operating status of transmission line insulators through indirect means such as electrical, thermal, acoustic, and image signals. Due to its advantages of rapidity and high efficiency, it has been widely accepted by operation departments. This paper summarizes existing non-contact detection technologies for transmission line insulator conditions, including acoustic wave detection, electric field detection, infrared/ultraviolet imaging detection and spectral detection. It analyzes the principle, characteristics, and application scenarios of each non-contact detection technology. Combined with the rapid development of artificial intelligence technology, the paper looks forward to future new detection methods, such as those integrating deep learning, multi-component comprehensive detection, and multi-source data-driven detection. Finally, the challenges faced by the detection of Ultra-High Voltage (UHV) transmission lines are analyzed. This study provides a reference for the research and development of non-contact detection technology for transmission line insulators.

1. Introduction

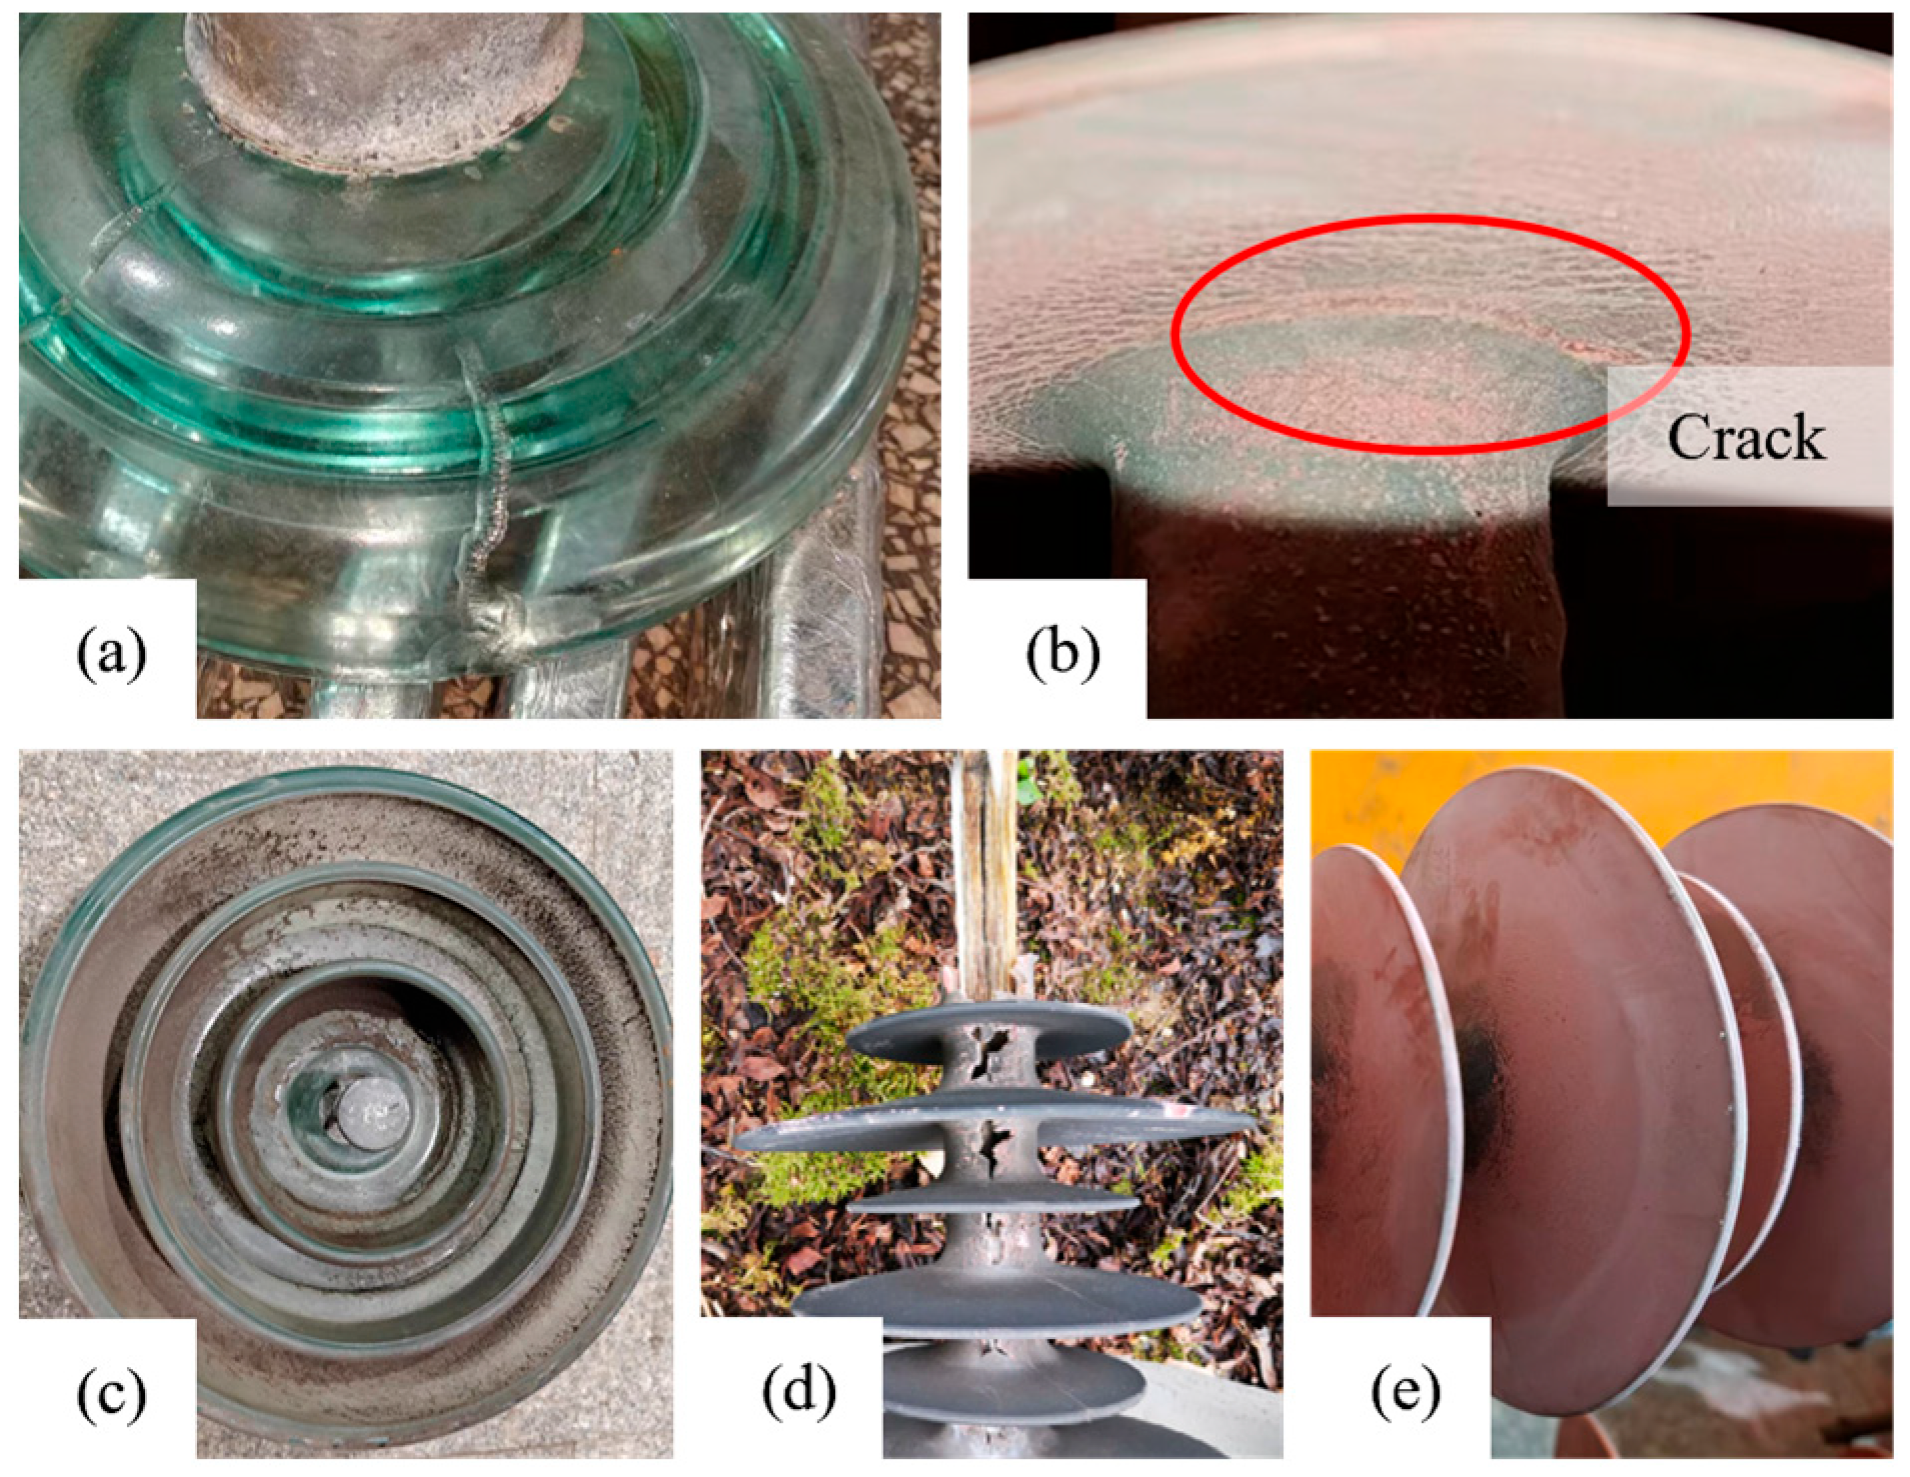
Insulators are one of the key components for maintaining the safe and stable operation of transmission lines, featuring a large quantity and wide distribution [1]. Their operating status is directly related to the safety and stability of the power system. Since being put into operation, insulators have long sustained erosion by natural factors such as wind, sunlight, rain, snow, and contamination, as well as electrical stress and mechanical loads of transmission lines. Under the combined effect of multiple factors, insulators may develop defects including material aging, contamination deposition, and surface or internal damage [1,2,3,4]; in extreme cases, insulation failure may occur, leading to “zero-value insulators” [5]. Common insulation faults are shown in Figure 1. This will lead to a decline in insulation performance, an increased risk of accidents such as flashover and tripping of transmission lines, and will pose a serious threat to the reliability and economy of the power grid [6,7]. Therefore, timely and accurate detection of insulator status is crucial.
Traditional insulator detection mostly relies on manual inspection or contact measurement, such as Equivalent Salt Deposit Density (ESDD) detection, manual visual inspection, and detection with electric field detectors [8,9,10]. These methods are often characterized by low efficiency, insufficient safety, and high risks of missed detection or false detection [11], which cannot meet the development needs of large-scale, high-voltage-grade transmission networks. In recent years, with the advancement of sensor technology and signal processing methods, non-contact detection technology has been widely applied in the field of transmission line operation and maintenance due to its advantages of fast speed, high efficiency, and non-contact detection. By collecting various physical signals (e.g., acoustic, optical, electrical, and thermal signals) generated by insulators, this technology indirectly evaluates their operating status, providing an effective approach for achieving intelligent and automated inspection [12,13]. Currently, non-contact detection methods based on acoustic waves [14,15], electric field measurement [5,16], infrared thermography [17,18], ultraviolet imaging [19,20], and spectrum [21] have been applied in different scenarios, each with distinct characteristics and scopes of application.
Ultra-High Voltage (UHV) power transmission technology has the characteristics of long-distance and large-capacity power transmission, providing solid technical support for the growing industrial energy demand as well as the development and integration of new energy [22]. Since the 1960s, countries such as China, Russia (the former Soviet Union), the United States, Japan, Canada, and Italy have successively carried out research on UHV transmission technology [23]. However, with the advancement of UHV power transmission projects, the operating environment of insulators has become more complex, and detection is confronted with challenges such as strong signal interference, increased safe detection distance, and high discrimination difficulty [24,25,26].
This paper aims to systematically review various non-contact detection technologies for transmission line insulators, focusing on the two core themes of “AI technology empowerment + complex working condition adaptation.” It analyzes the core limitations and breakthrough directions of existing technologies, such as acoustic wave detection, electric field detection, infrared/ultraviolet detection, and spectral detection, and proposes three forward-looking pathways: deep learning-based single-modal empowerment, multi-dimensional comprehensive detection, and multi-source data-driven prediction. This work provides targeted guidance for technological iteration and engineering implementation in this field.
Rather than a comprehensive review of existing technologies, this paper distills a forward-looking research framework and practical logic by integrating the technological transformation of artificial intelligence. Based on the unique challenges of UHV scenarios, it helps break through the transformation bottleneck from “laboratory technology” to “engineering application.” To support the core perspective of “AI + UHV” in this paper, the literature screening focuses on three dimensions: (1) primarily covering studies on non-contact detection technologies for transmission line insulators published in the past five years (2020–2025); (2) innovative solutions integrating AI technologies such as deep learning and data fusion (highlighting the adaptability of algorithms to detection scenarios); and (3) challenge-oriented studies targeting strong electromagnetic interference and large-scale operation and maintenance in UHV scenarios (excluding pure theoretical literature that only focuses on conventional voltage levels). The retrieval databases include Web of Science (Philadelphia, PA, USA), IEEE Xplore (Piscataway, NJ, USA), CNKI (Beijing, China), and MDPI (Basel, Switzerland), and 120 core literatures were ultimately included to ensure the relevance and forward-looking nature of the perspectives.

2. Characteristics: Non-Contact Detection Technology

This chapter aims to systematically review the mainstream non-contact detection technologies for transmission line insulators, mainly elaborating on their technical principles, characteristics, and applications. It will conduct a comparative analysis of the application scope and limitations of current non-contact detection technologies so as to lay a foundation for the prospect of emerging detection technologies and addressing the challenges posed by UHV transmission lines in the following sections.

2.1. Acoustic Wave Detection Technology

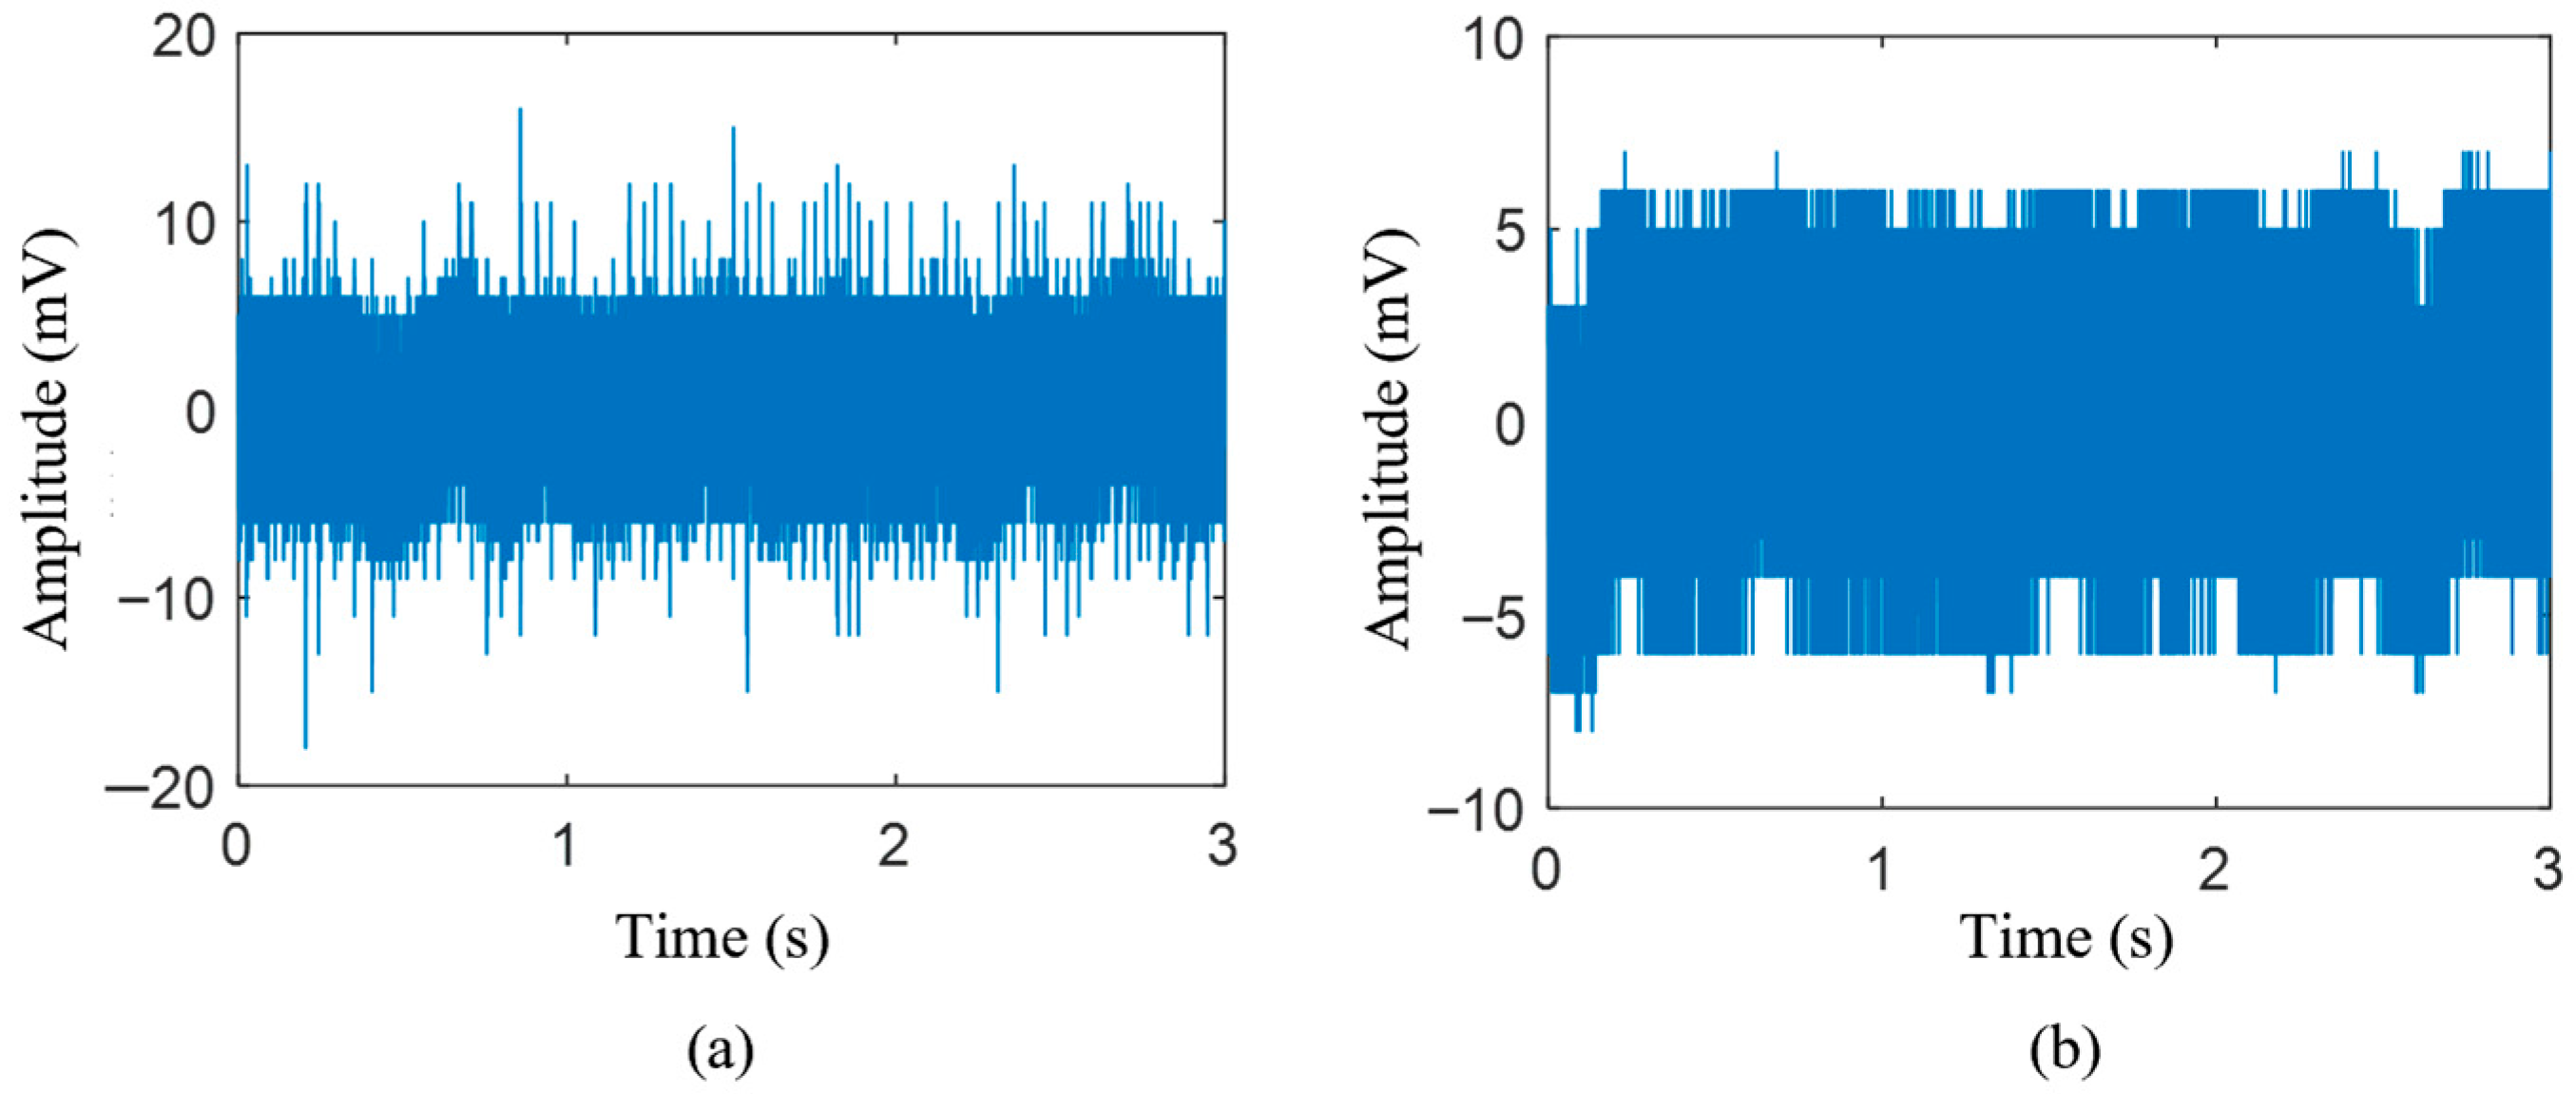
Defects in insulators (such as corona discharge, dry band arcing, internal puncture, and interface debonding) can trigger local energy release [3,27], exciting mechanical vibrations or pressure waves that generate acoustic wave signals with specific frequencies [14,28]. When acoustic waves propagate through insulator materials (e.g., ceramics, epoxy composite materials, and silicone rubber) and surrounding media (e.g., air and oil), their velocity, attenuation coefficient, and reflection coefficient vary with material properties and defect states [29,30,31,32]. By analyzing the characteristics of such signal distortions, the location and severity of defects can be inferred. Typical acoustic wave detection results are shown in Figure 2.
Acoustic wave detection enables long-distance non-contact operation (max. 25 m) [33], is immune to electromagnetic interference [34], and is compatible with various insulator defects (e.g., cracks, contamination, breakdown, delamination, inclusions, and aging) [3,27,35,36]. It features high detection sensitivity and maintains high recognition accuracy even for micro-defects. Combined with multi-array sensors and information post-processing technology, it can achieve defect localization and quantitative detection [15]. In practical applications, due to the significant acoustic impedance difference between air and solid materials (such as silicone rubber and ceramics), ultrasonic waves have extremely high energy reflectivity at the interface, thus resulting in limited energy entering the defect areas of insulators. This causes the arrangement angle and distance of detection equipment to significantly affect the detection results, and the complex structure of the detected objects also makes signal discrimination difficult. For entire insulator strings that are several meters long and consist of dozens of insulators, there is a lack of efficient ultrasonic rapid scanning and imaging methods for the entire string. Weak signals are also vulnerable to environmental noise (such as electromagnetic noise, wind noise, and rain noise), which may mask defect signals. Therefore, the development of high-frequency and high-energy ultrasonic probes, environmental noise suppression methods, and global rapid imaging algorithms remains the future optimization directions of ultrasonic detection technology.

2.2. Electric Field Detection Technology

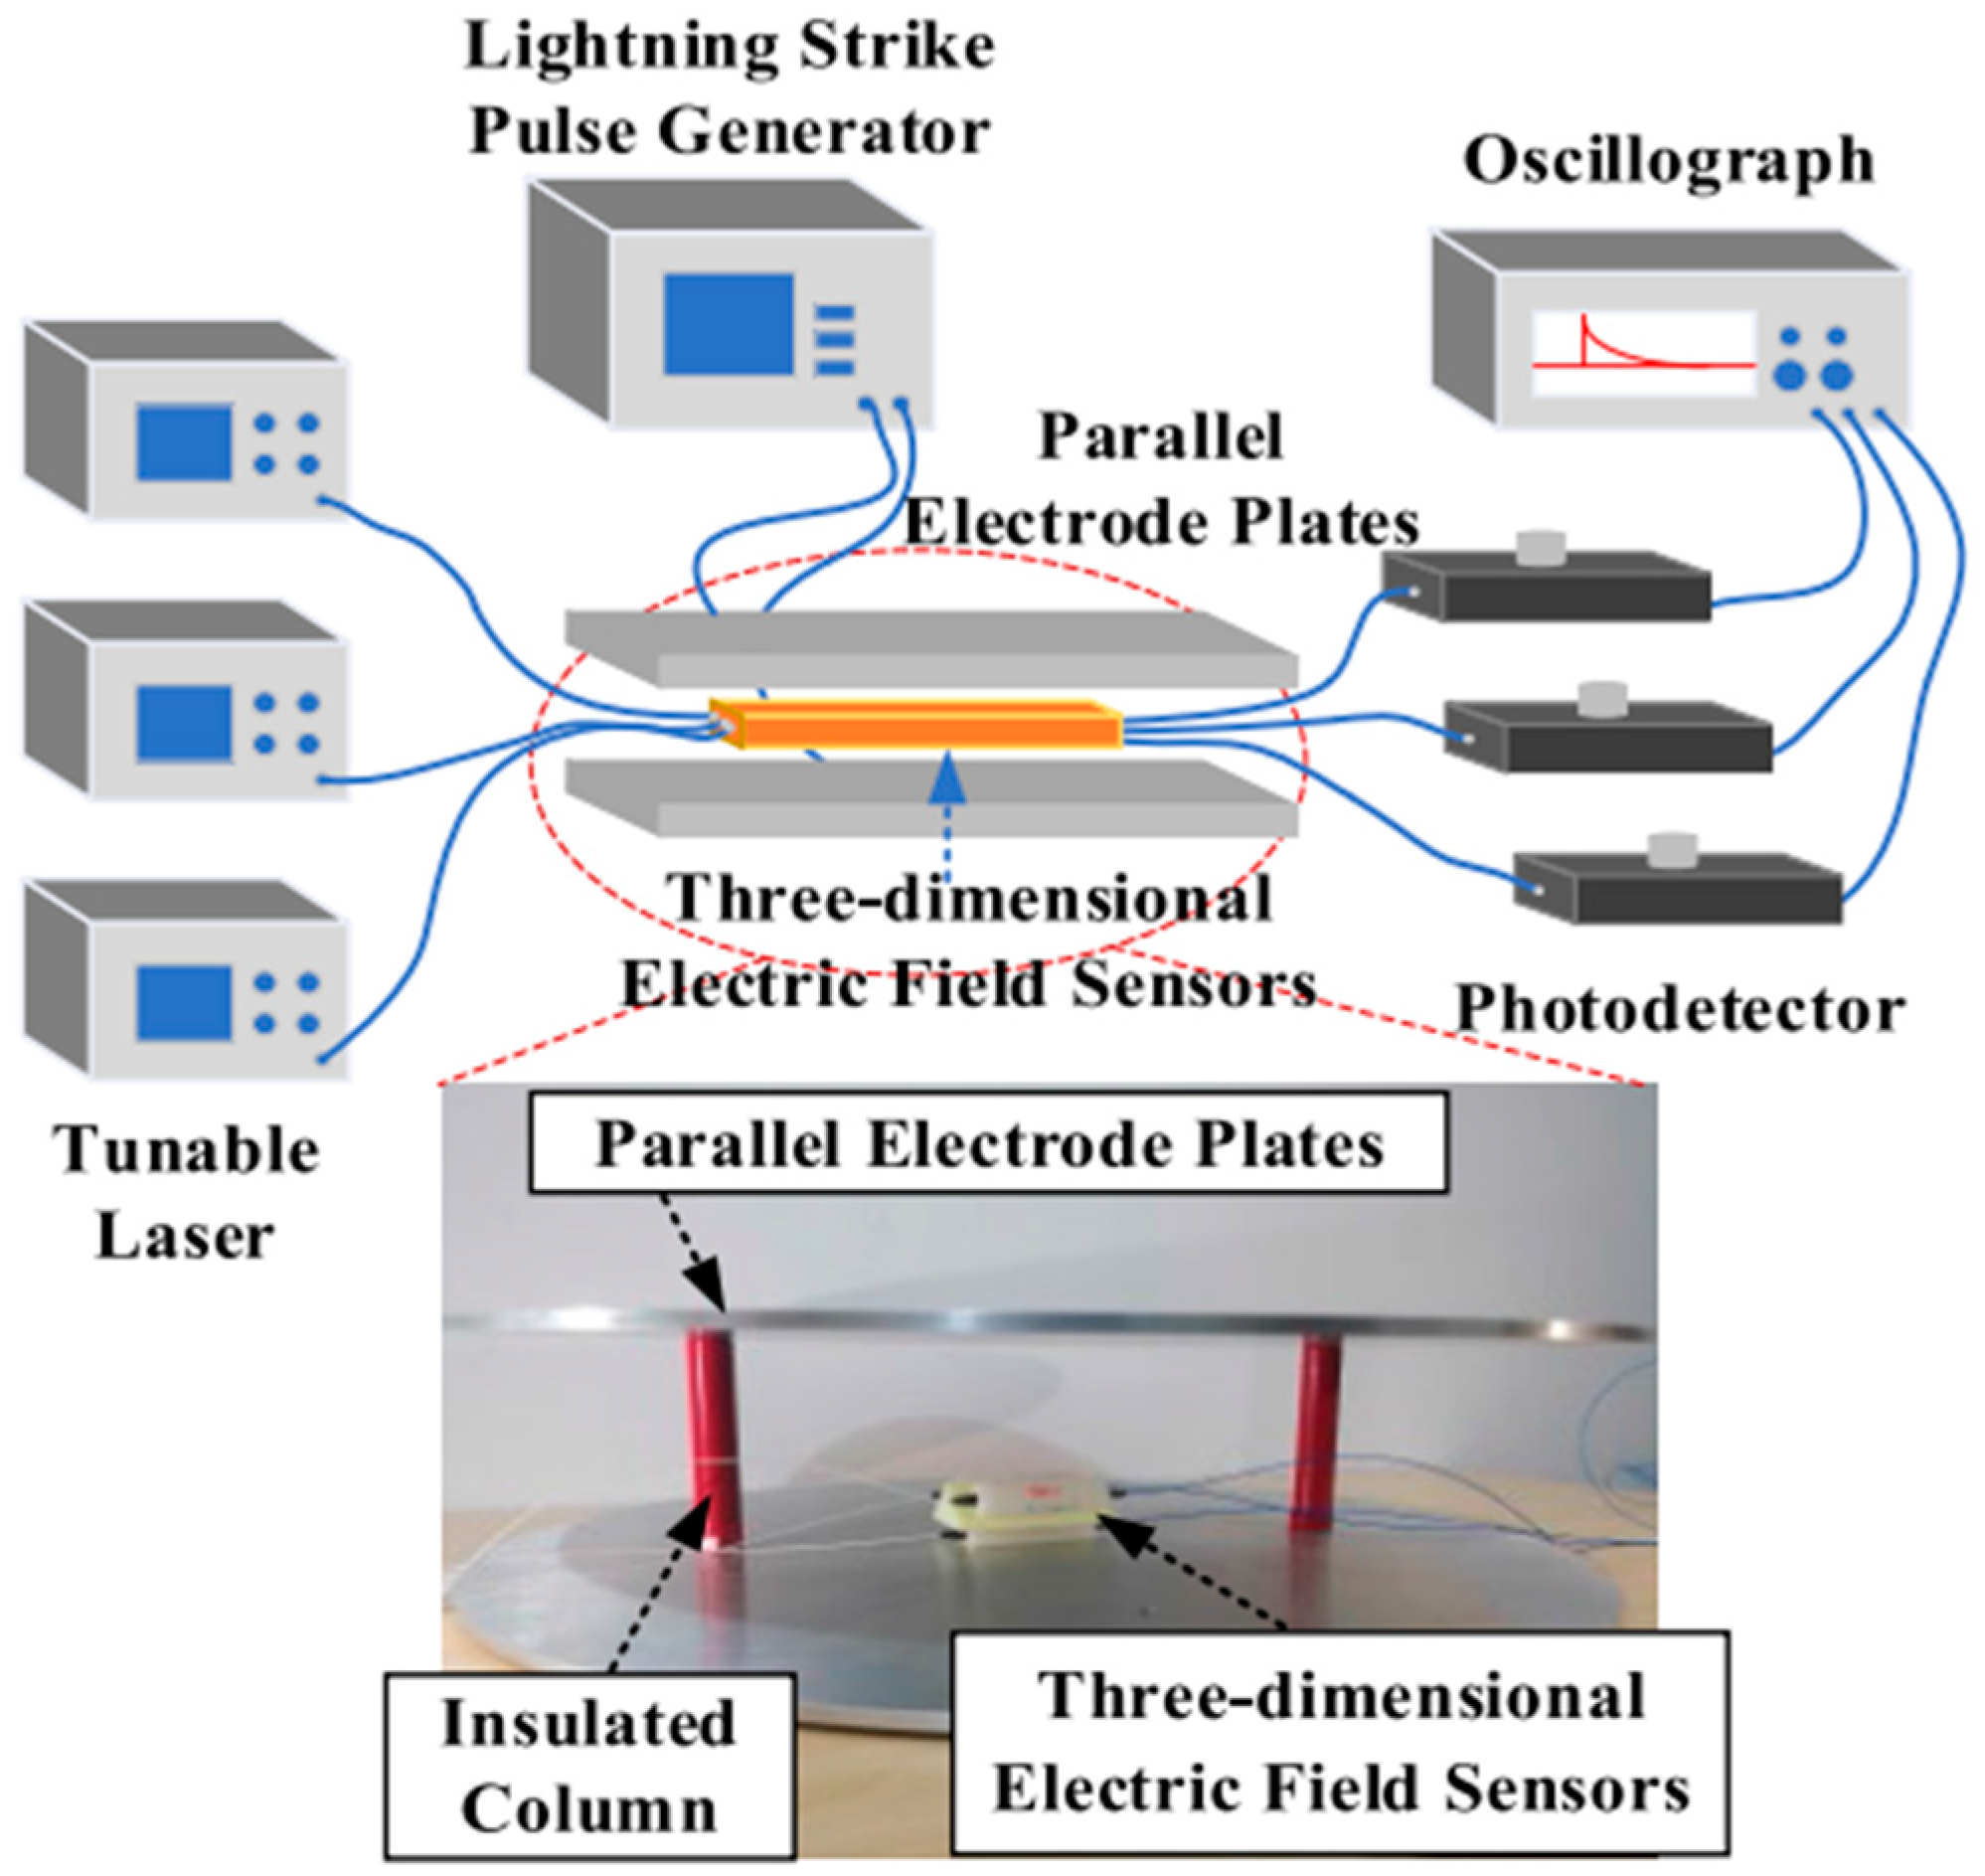
Electric field detection is based on the spatial electric field distribution distortion effect caused by insulator defects. It captures changes in electric field parameters through non-contact sensors to infer the defect status. Based on different detection parameters, it can be classified into axial/radial electric field detection [5,37,38], harmonic electric field response [39,40], indirect magnetic field correlation, and other methods [40,41]. A typical electric field detection layout is shown in Figure 3.
Electric field detection technology is mainly applied to the insulator condition inspection of 110–500 kV AC/DC transmission lines [37,39,42]. It is less affected by humidity and air pressure and can be mounted on UAVs to realize high-altitude inspection [5]. It exhibits significant responses to defects such as zero-value insulators and contamination, with the recognition rate of end defects by harmonic electric field detection approaching 100% [16,39,43]. The detection time for a single string of insulators is only tens of seconds, and batch rapid inspection of transmission lines can be achieved when combined with UAVs [44]. However, this method has significant inherent limitations: high-precision sensors are costly and complex to maintain; the intensity of detection signals drops sharply with increasing distance, restricting its long-distance operation capability; and when defects such as surface contamination and internal zero-value of insulators coexist, electric and magnetic field signals are prone to superimposed interference, leading to misclassification of defect types. In addition, this method lacks unified electric field threshold standards across different voltage levels and insulator types, resulting in limited versatility. Future research should focus on developing low-cost, anti-interference new sensors and integrating other physical features (e.g., multi-spectral and ultrasonic) for comprehensive diagnosis to break through the existing bottlenecks.

2.3. Infrared Detection Technology

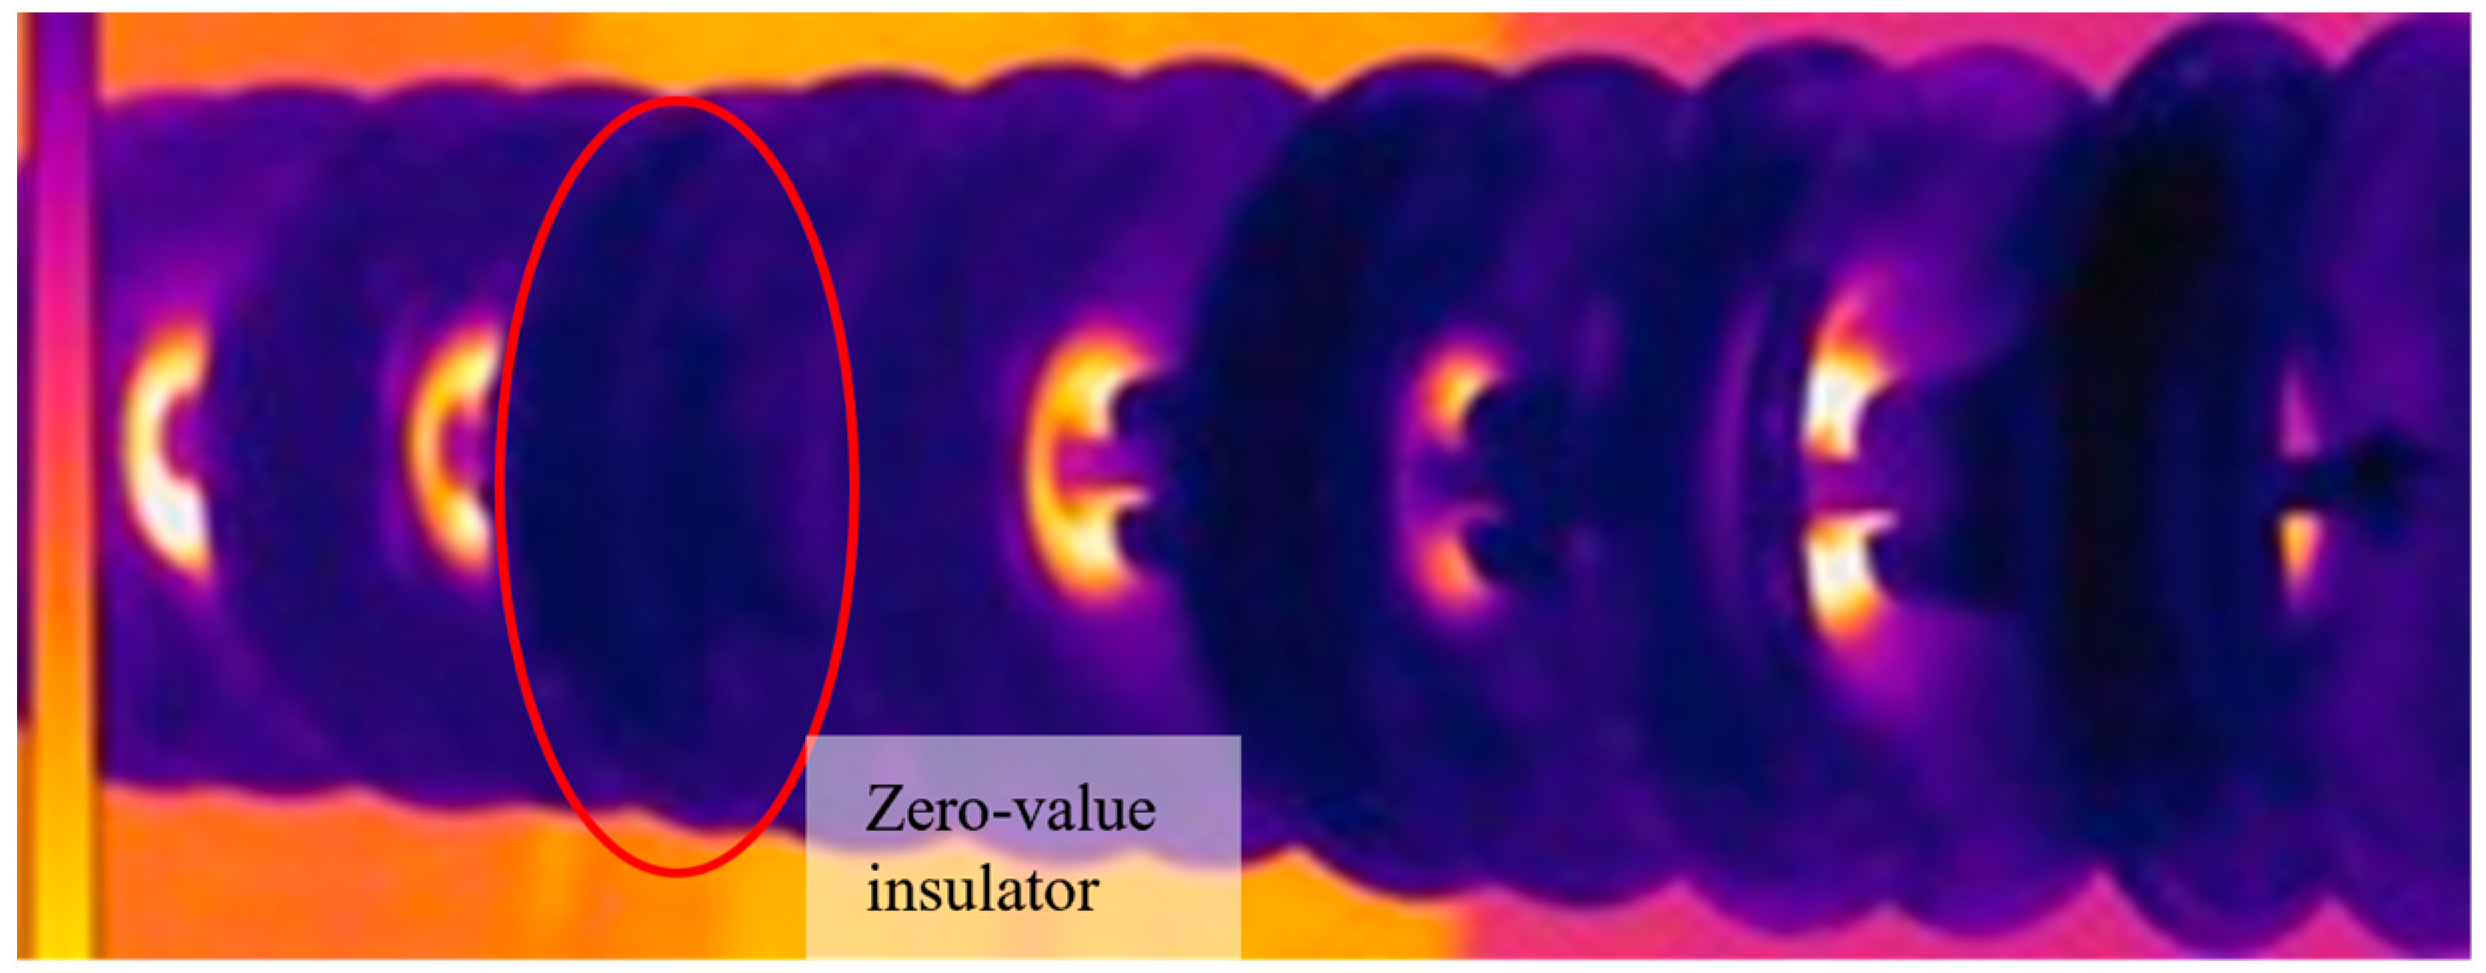
For defective insulators, the insulation performance at the defect sites deteriorates, which will cause changes in leakage current or abnormal dielectric loss, resulting in a local temperature rise or drop. By capturing and analyzing temperature signals with infrared cameras, the type and severity of defects can be located and determined [45]. Typical infrared detection results are shown in Figure 4. Considering that the leakage current on the surface of zero-value insulators is negligible, their surface temperature rise shows a significant difference compared with normal insulators. As illustrated in Figure 4, rapid localization of zero-value insulators can be achieved through infrared detection.
Infrared detection enables long-distance operation without power outage, featuring high safety [33]; it can quickly scan the entire insulator string and directly present thermal images of temperature distribution, with distinct contrasts between defective and healthy areas. Suitable for large-scale transmission line inspection, it can improve detection efficiency when combined with equipment such as UAVs [17,46,47,48]; it is not affected by the electromagnetic environment of transmission lines, ensuring stable detection results [49]. It can identify various defect types, including zero-value insulators, partial discharge, carbide defects, interface debonding, contamination, and aging [18,21,49,50].
However, this method has significant inherent limitations: its detection results are highly susceptible to interference from environmental factors such as sunlight, wind, rain, and humidity, leading to temperature measurement distortion. More importantly, it can only perceive temperature changes on the surface or near-surface, and its detection capability for internal insulator defects without obvious thermal effects (e.g., micro-internal cracks and early aging) is extremely limited, resulting in “invisible” blind spots. In practical applications, high-resolution infrared equipment is costly, and the detected temperature anomalies are often difficult to accurately quantify in terms of the severity and specific location of defects, which is highly dependent on empirical interpretation or requires cross-validation with other technologies. Future research directions should focus on developing intelligent correction algorithms resistant to environmental interference, actively promoting the fused diagnosis of infrared thermography with multi-spectral technologies, such as ultraviolet (UV) and visible light, and combining artificial intelligence to improve the automatic identification and quantitative evaluation capabilities for complex defects.

2.4. Ultraviolet Detection Technology

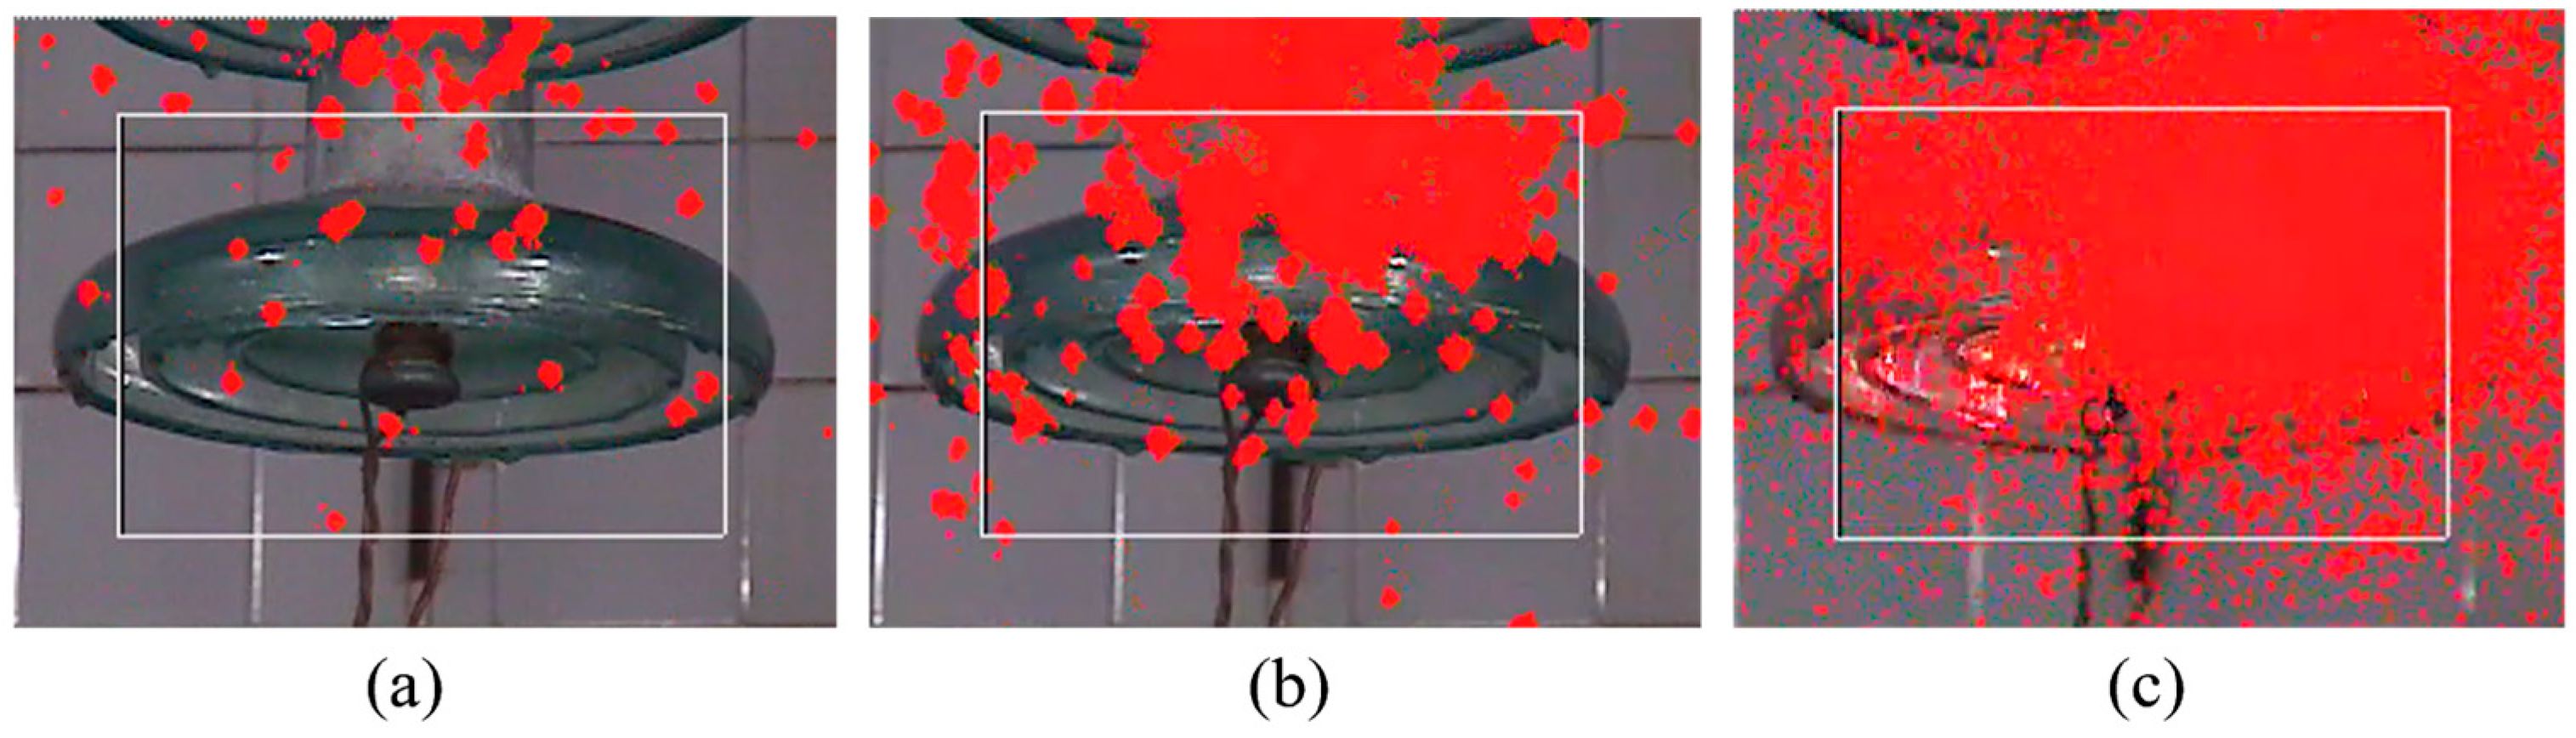
Abnormal corona discharges from insulation defects emit 200–280 nm “solar blind” ultraviolet signals; signal acquisition and analysis enables insulator defect assessment [51,52,53]. A typical UV detection result is shown in Figure 5. The white box marks the device’s focus area, and the red spots represent the ultraviolet signals from corona discharge, appearing as light spots. Normal conditions yield only sporadic spatial ionization, while corona discharge induces aggregated light spot formation. The ultraviolet (UV) detection enables long-distance detection, is not affected by natural light, and exhibits high detection stability [21,51]. It can capture early weak corona discharge and intuitively present the discharge location, realizing precursor identification of faults and defect localization [19,54]. Quantitative analysis of defect severity can be conducted through parameters such as photon count and light spot area [52,53,55].
This technology is mainly applied to the early identification and localization of partial discharge defects such as corona discharge and electric arcs on the surface of transmission line insulators. However, limited by the inherent limitations of the equipment, its detection is highly susceptible to severe interference from harsh weather conditions, such as rain, snow, and heavy fog, leading to signal shielding or attenuation. Essentially, it can only capture the luminescence phenomenon of surface discharge and is unable to identify internal insulator defects without discharge manifestations (e.g., internal cracks and moisture absorption). In practical applications, the detection results are highly dependent on parameters such as equipment gain and detection distance, and there is a lack of unified quantification standards among different devices, resulting in poor comparability. In addition, high-end UV imaging equipment is costly, and the processing of professional information such as light spots and photon counts requires a high operational threshold, which restricts its popularization. Future research directions may promote the establishment of a standardized calibration system for equipment parameters and discharge intensity, and explore its fused diagnosis with detection technologies such as infrared and ultrasonic to overcome the detection blind spots of a single technology.

2.5. Other Spectroscopic Detection Technologies

Spectroscopic detection technology refers to a category of techniques that realize qualitative/quantitative analysis of substances and structural characterization based on the “frequency–response intensity” correspondence (i.e., “spectrum”) generated when electromagnetic waves of different frequencies in the electromagnetic spectrum interact with matter. Infrared and ultraviolet detection are currently widely used as well as mature spectroscopic detection technologies in the field of insulator defects. Different spectroscopic detection technologies have their own focused application areas based on their principles. Other non-contact spectroscopic detection technologies are as follows.

2.5.1. Visible Spectrum

Visible spectrum imaging involves equipping UAVs with photographic equipment to directly capture high-resolution visible light images of the detected objects and identify surface defects through subsequent digital processing. This detection technology features convenient imaging and low cost, and can intuitively present defect states such as a missing part, damage, flashover, and contamination, making it suitable for online detection of transmission lines. However, it is susceptible to factors such as complex environmental backgrounds, weather, and light changes and faces great difficulty in identifying small-scale defects [56,57,58].

2.5.2. Hyperspectral Imaging (HSI)

HSI can image target areas across hundreds of continuous wavelength bands, covering the ultraviolet to infrared regions and provides absorption and reflection characteristics at different wavelengths, thereby realizing defect grade classification and quantitative evaluation. This detection technology can capture micro-defect features and has significant potential in analyzing the contamination and aging states of insulator surfaces [59,60,61]. However, in practical applications, the massive spectral data acquired often exhibit high dimensionality and redundancy, making processing and analysis extremely complex. Such data are vulnerable to interference from changes in on-site lighting conditions, weather, and observation angles. Moreover, the “spectral fingerprint” databases for insulators of different materials and models are scarce, and labeled samples required for model training are difficult to obtain, resulting in poor algorithmic universality. In addition, high-spectral imaging equipment is costly, which limits its large-scale on-site application. Future research should focus on developing efficient data dimensionality reduction and feature extraction algorithms to reduce processing complexity and on establishing standardized insulator spectral feature databases to support model generalization. The miniaturization and cost reduction of equipment are the foundation for the large-scale application of this technology.

2.5.3. Terahertz (THz)

Terahertz detection technology (electromagnetic waves on the order of 1012 Hz, with wavelengths ranging from 30 μm to 3 mm, between infrared and microwave) possesses core advantages such as strong penetrability, non-ionization, sensitivity to polar molecules, and spectral fingerprinting, making it particularly suitable for detecting internal defects that are difficult to penetrate using traditional visual/infrared detection. However, the practical application of this technology still faces numerous challenges: the equipment is extremely expensive, and the system is complex, which severely restricts its on-site popularization. Moreover, the detection signals are vulnerable to interference from the complex electromagnetic environment of high-voltage transmission line sites, resulting in insufficient detection stability. For microscopic defects below 0.1 mm, its detection accuracy and reliability decrease significantly, posing a risk of missing detections of tiny defects [62,63,64,65]. Future applications should first focus on developing detection algorithms and shielding technologies resistant to strong electromagnetic interference to expand its application scenarios; second, the research and development of miniaturization and cost reduction of core detection components should be prioritized.

2.5.4. X-Ray Imaging

X-rays are electromagnetic waves with extremely short wavelengths and high energy. Utilizing the differences in linear attenuation coefficients between the insulator body and defects (such as bubbles, cracks, and metal corrosion), the intensity of the transmitted rays forms grayscale differences. By collecting multi-angle projection data through X-ray sources and detectors, non-destructive and quantitative identification of internal and surface defects of insulators is realized [66,67]. This is currently one of the few methods capable of directly penetrating and visualizing the internal insulation condition. However, it should be noted that this technology is only sensitive to defects of a certain size (usually millimeter-scale) and ineffective for early-stage and microscopic degradation; the equipment is extremely expensive, bulky, and requires radiation protection, resulting in poor on-site mobility and almost no applicability for live-line inspection. Moreover, it poses radiation safety risks, imposing strict restrictions on operators and the environment. Therefore, future research should focus on developing low-dose, high-resolution, and lightweight X-ray detection equipment.

2.5.5. Laser-Induced Breakdown Spectroscopy (LIBS)

A high-energy laser is focused on the surface/internal of insulators to ionize local substances and form plasma, which emits characteristic spectra when cooling. A spectrometer is used to capture spectral signals, the defect type is qualitatively identified, and the element content is quantitatively analyzed based on the wavelength and intensity of characteristic spectral lines of different elements. Therefore, LIBS has outstanding advantages in the quantitative detection and composition analysis of insulation surface contamination [68,69]. However, the spectral parameters of this technology are prone to degradation in high-humidity and low-temperature environments, and it is difficult to analyze the spectra of complex pollutants [69,70,71].

2.6. Comparison and Prospects of Non-Contact Detection Technologies

Selecting appropriate detection technologies based on the operating environment of transmission lines, on-site conditions, and potential defect types of insulators is of great significance for the rapid identification and accurate localization of defects. The comparison of the characteristics of existing and emerging non-contact detection technologies is shown in Table 1. Limited by the inherent limitations of their technical implementation, it is difficult for a single detection technology to achieve full coverage of all types of defects in insulators under all operating conditions. Even in the applicable scenarios of a specific detection technology, its recognition rate and accuracy are not absolute. Therefore, considering the improvement in the reliability, accuracy, and comprehensiveness of insulator condition identification, the performance enhancement of a single detection technology, the synergy of multiple detection technologies, and the comprehensive evaluation of multi-source data will become a sustained research focus in the future.

3. Perspectives: AI-Driven Future Novel Detection Technology

Combined with the advantages of artificial intelligence (AI) technology, this chapter proposes three future novel detection technologies—deep learning, multi-dimensional comprehensive detection, and multi-source data-driven detection.

3.1. Empowerment of Deep Learning in Single-Modal Detection

With the development of AI technology, the emergence of deep learning has provided algorithmic support for improving the accuracy and efficiency of single detection technologies. Deep learning is an important algorithm in AI technology and a branch of machine learning. It takes raw data as input and automatically extracts features of different levels of abstraction (from low to high) from the raw data through multi-layer neural networks. In the field of non-contact detection of insulators in high-voltage transmission lines, deep learning mainly includes four learning technologies: Convolutional Neural Network (CNN), Long Short-Term Memory (LSTM), Autoencoder (AE), and Generative Adversarial Network (GAN) [72]. The adaptability comparison of the four learning models is as shown in Table 2.
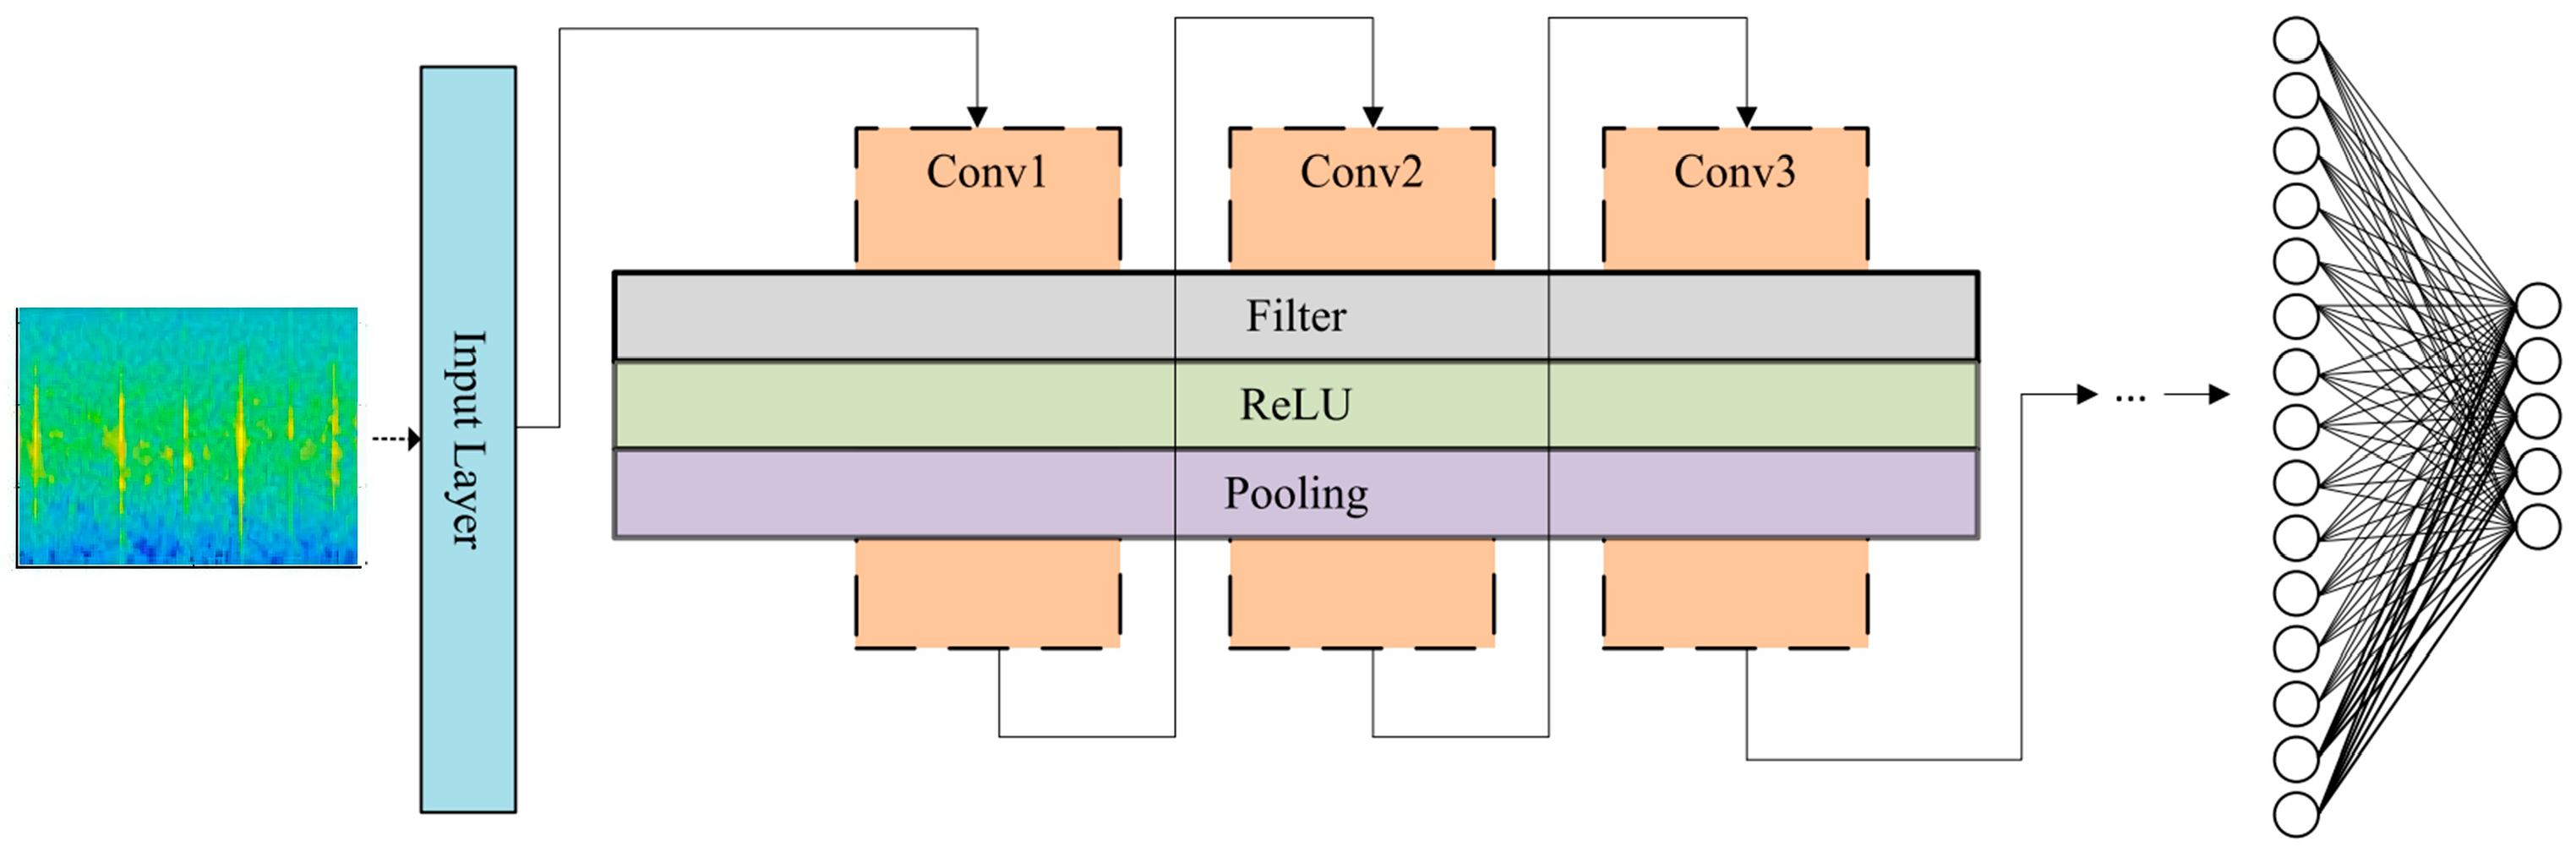
Ref. [34] focuses on ultrasonic-based partial discharge (PD) detection, addressing the low accuracy of traditional methods under on-site noise via three Convolutional Neural Network (CNN) models (single-stage CNN, two-stage CNN, and Bayesian-optimized CNN) for the detection and classification of four types of PD (arc discharge, corona discharge, surface discharge, and looseness) as well as healthy equipment status. The overall structure of the proposed CNN is shown in Figure 6. This structure takes an 86 × 86 × 3 spectrogram (derived from ultrasonic signals after preprocessing such as Short-Time Fourier Transform (STFT)) as input, and its core comprises an iterative feature extraction unit consisting of “input layer—convolutional layers (Conv1–Conv3)—filters—ReLU activation function—pooling layer”. Through multiple rounds of convolutional operations, the structure extracts features of the signal from simple to complex, introduces non-linearity via the ReLU activation function, and reduces dimensionality while preserving key information through the pooling layer. This provides screened effective features for the subsequent fully connected layer to output five categories of classification results (four types of partial discharge (PD) faults + one type of healthy state).
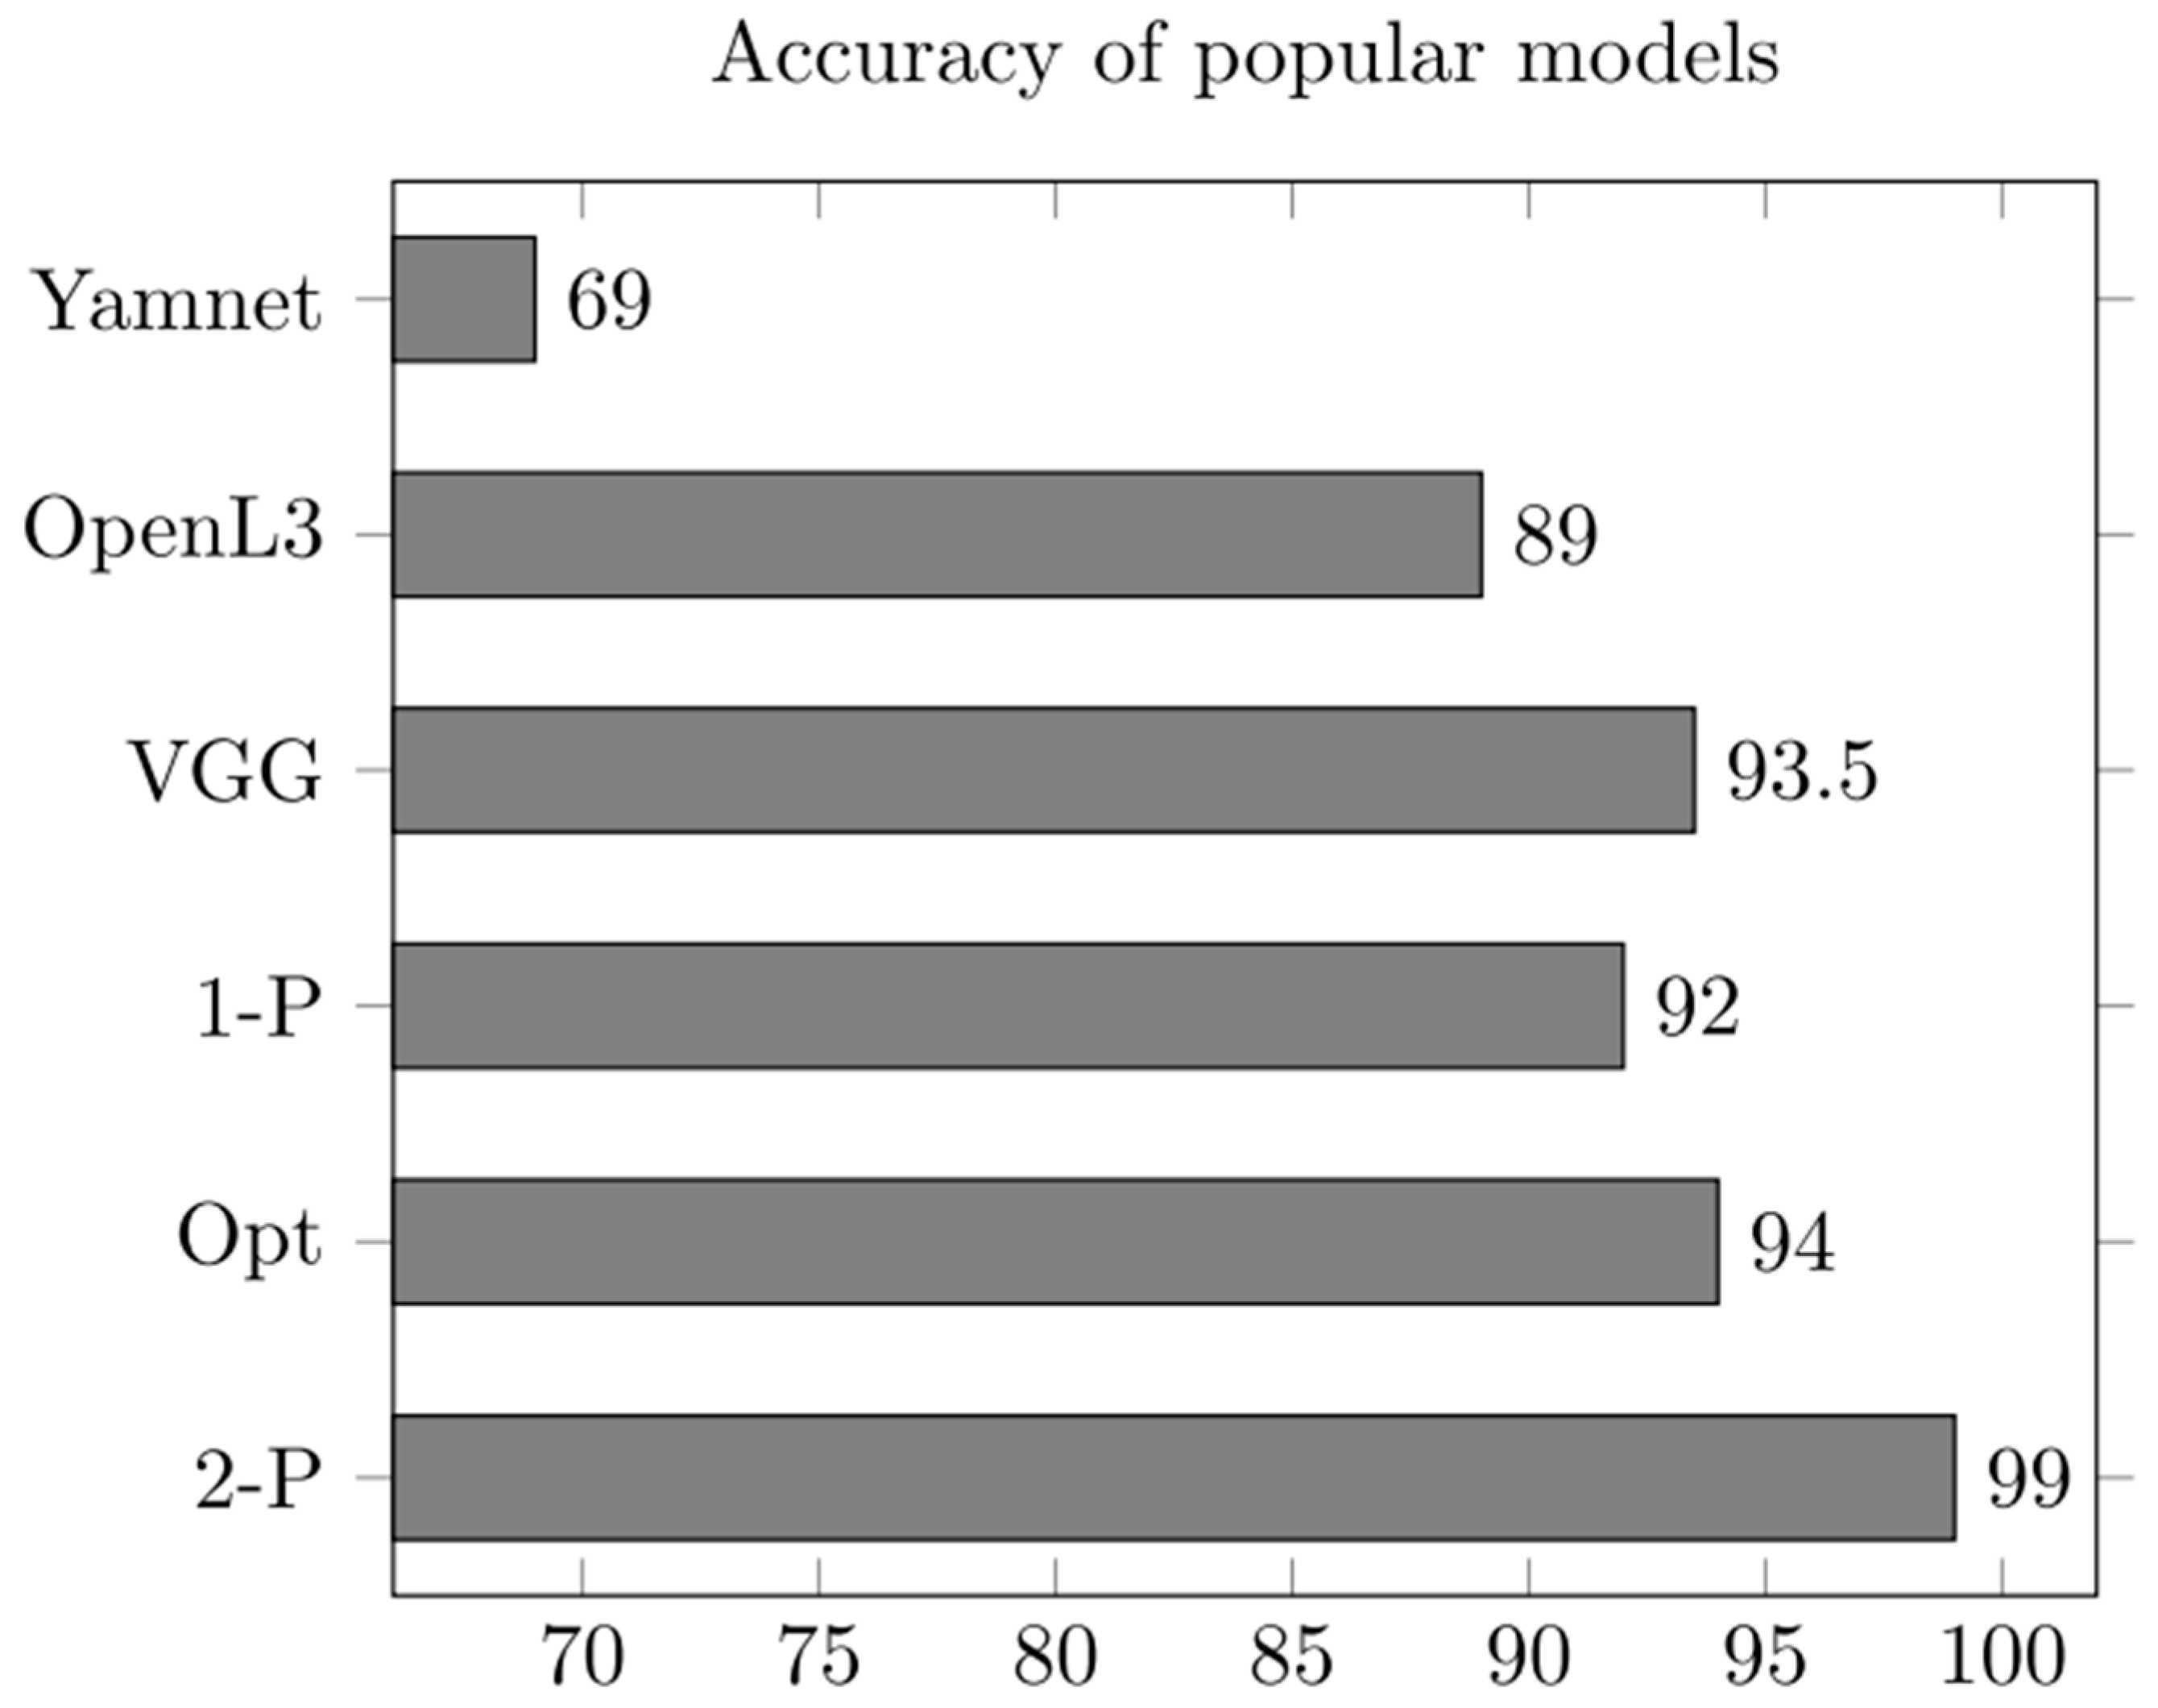
Based on 3556 noisy ultrasonic signal samples from actual on-site scenarios (the data were collected from different devices, locations, and times, ensuring the diversity of the samples), the accuracy rates of three CNN models were verified, and a comparison was made with the pre-trained models VGGish, OpenL3, and YamNet. The results demonstrate the superiority of the proposed CNN models under on-site noise environments. The overall accuracy exceeds 94%, and the validation accuracy of the two-stage CNN reaches 99.62%. The results are shown in Figure 7. However, this model is more suitable for device types, noise environments, and PD types similar to those of the experimental dataset. In scenarios involving extreme environments, new types of devices, or PD with extremely small sample sizes, the stability of the model needs to be further verified.
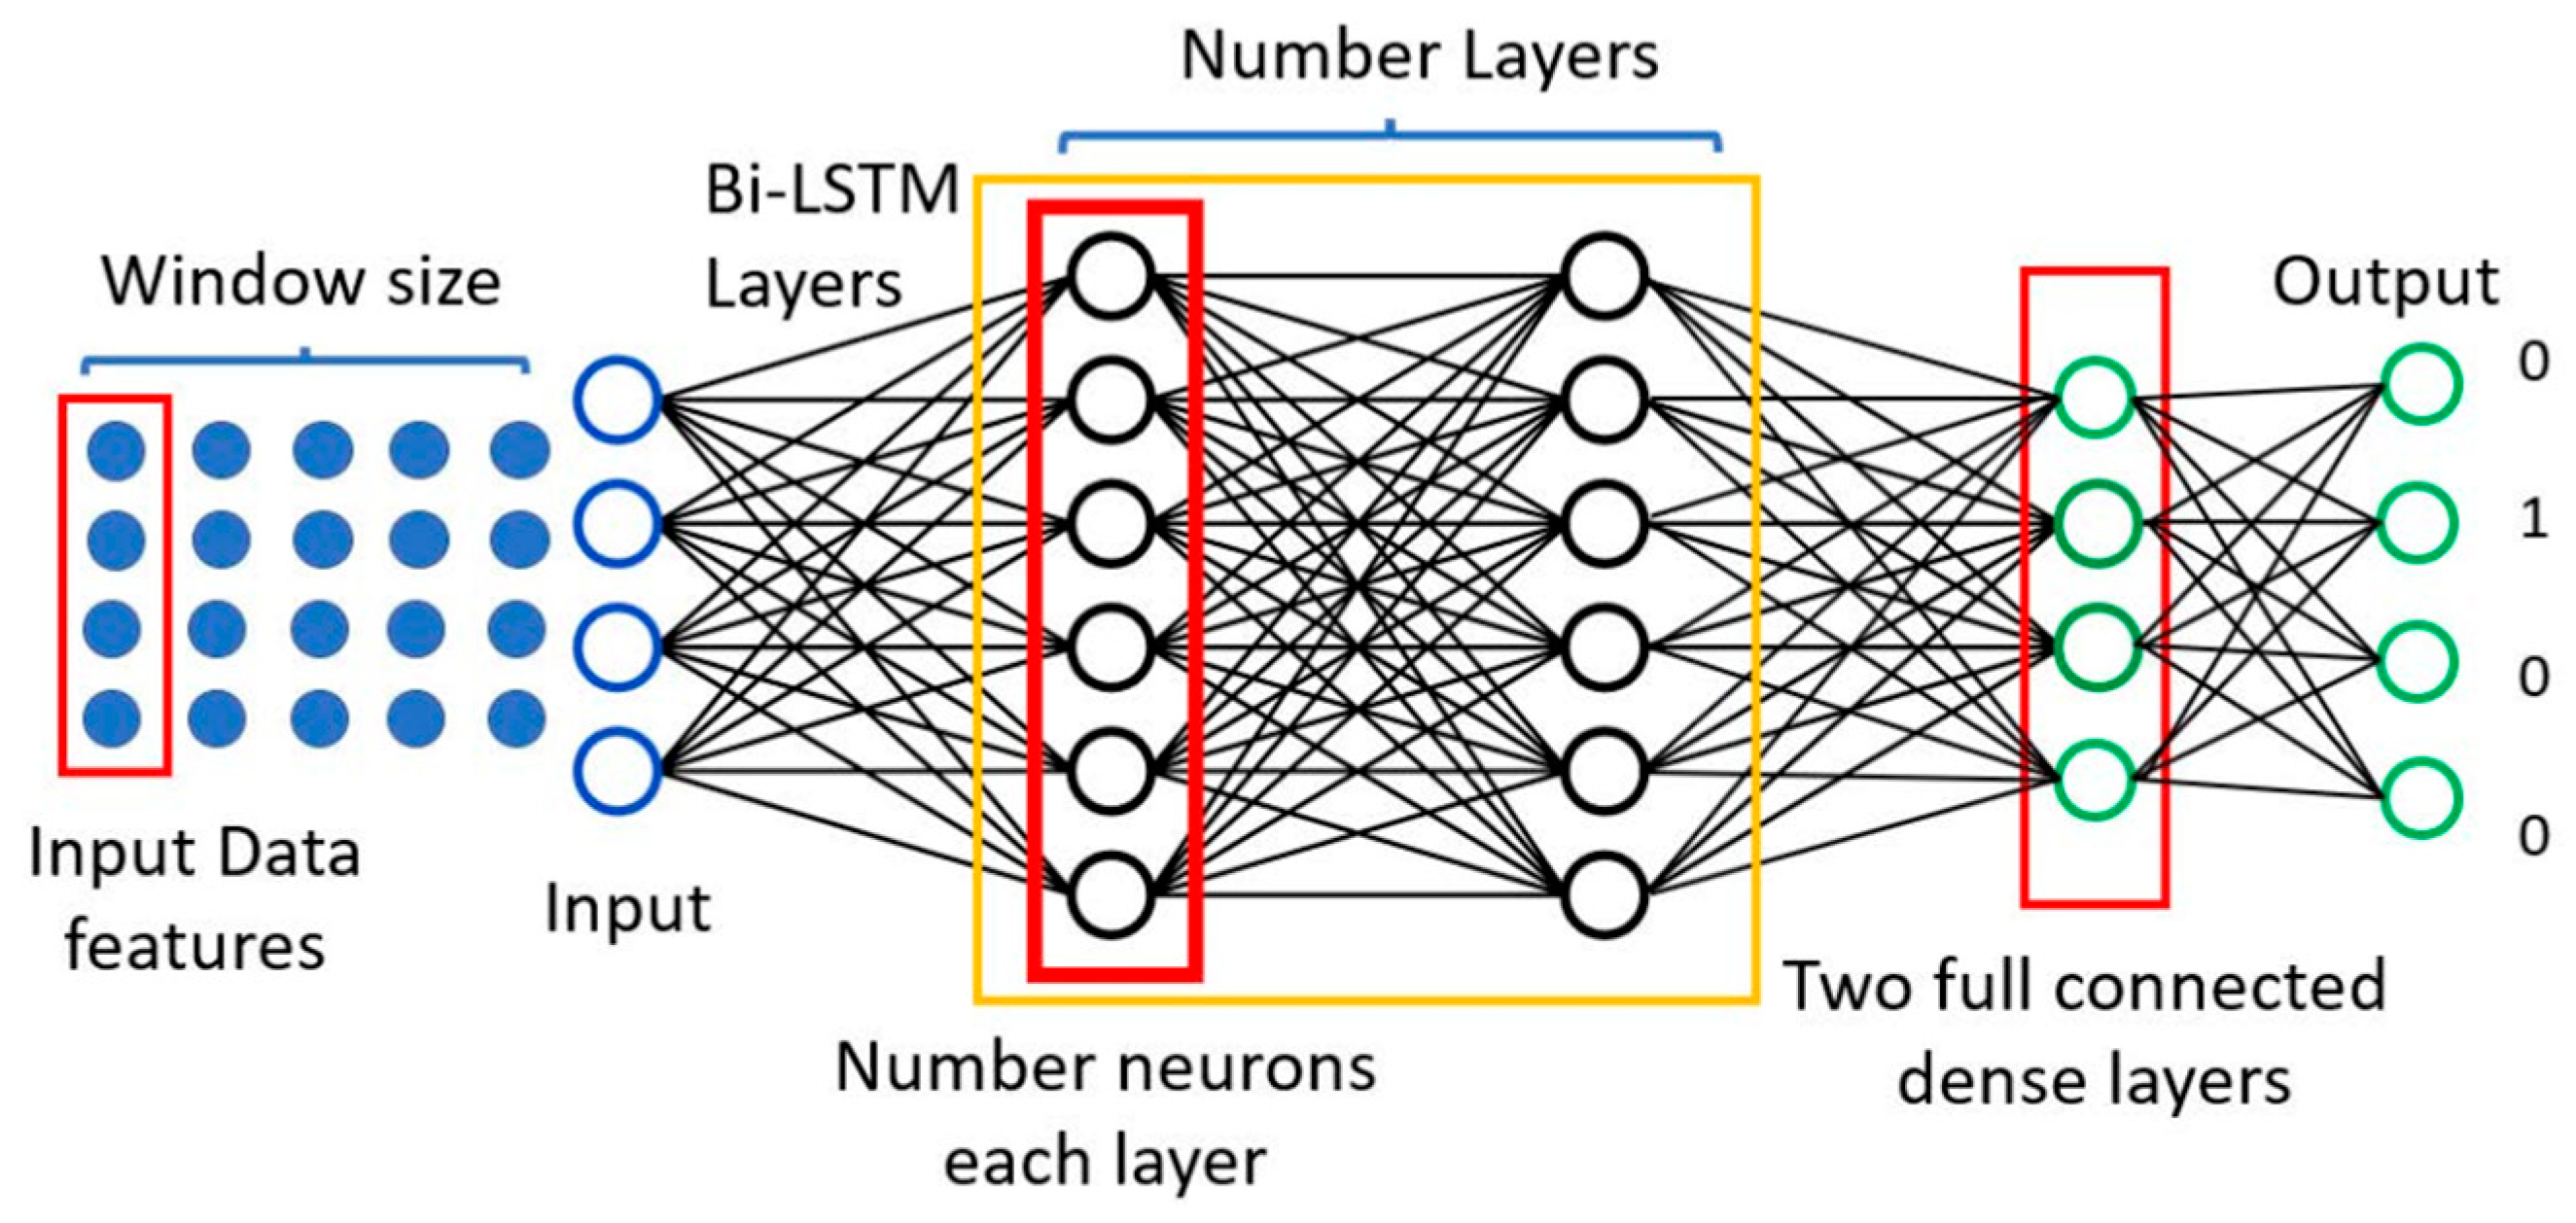
Ref. [73] proposed a deep learning model based on Bidirectional Long Short-Term Memory (Bi-LSTM). The model integrates environmental parameters (collected hourly) including temperature, humidity, dew point, rainfall, wind speed, wind direction, air pressure, and solar irradiance. Hyperparameter optimization was performed via grid search to determine the optimal model structure, which is shown in Figure 8. This model takes temporal weather parameter features as input, and its core includes a Bi-LSTM layer optimized via grid search (key hyperparameters include window size, number of hidden layers, and number of neurons per layer). It is followed by two fully connected dense layers: the SoftMax activation function is adopted in the output layer, while the ReLU activation function is used in all other layers, and a dropout layer is configured for each layer to avoid overfitting, ultimately achieving the classification output of insulator leakage current levels.
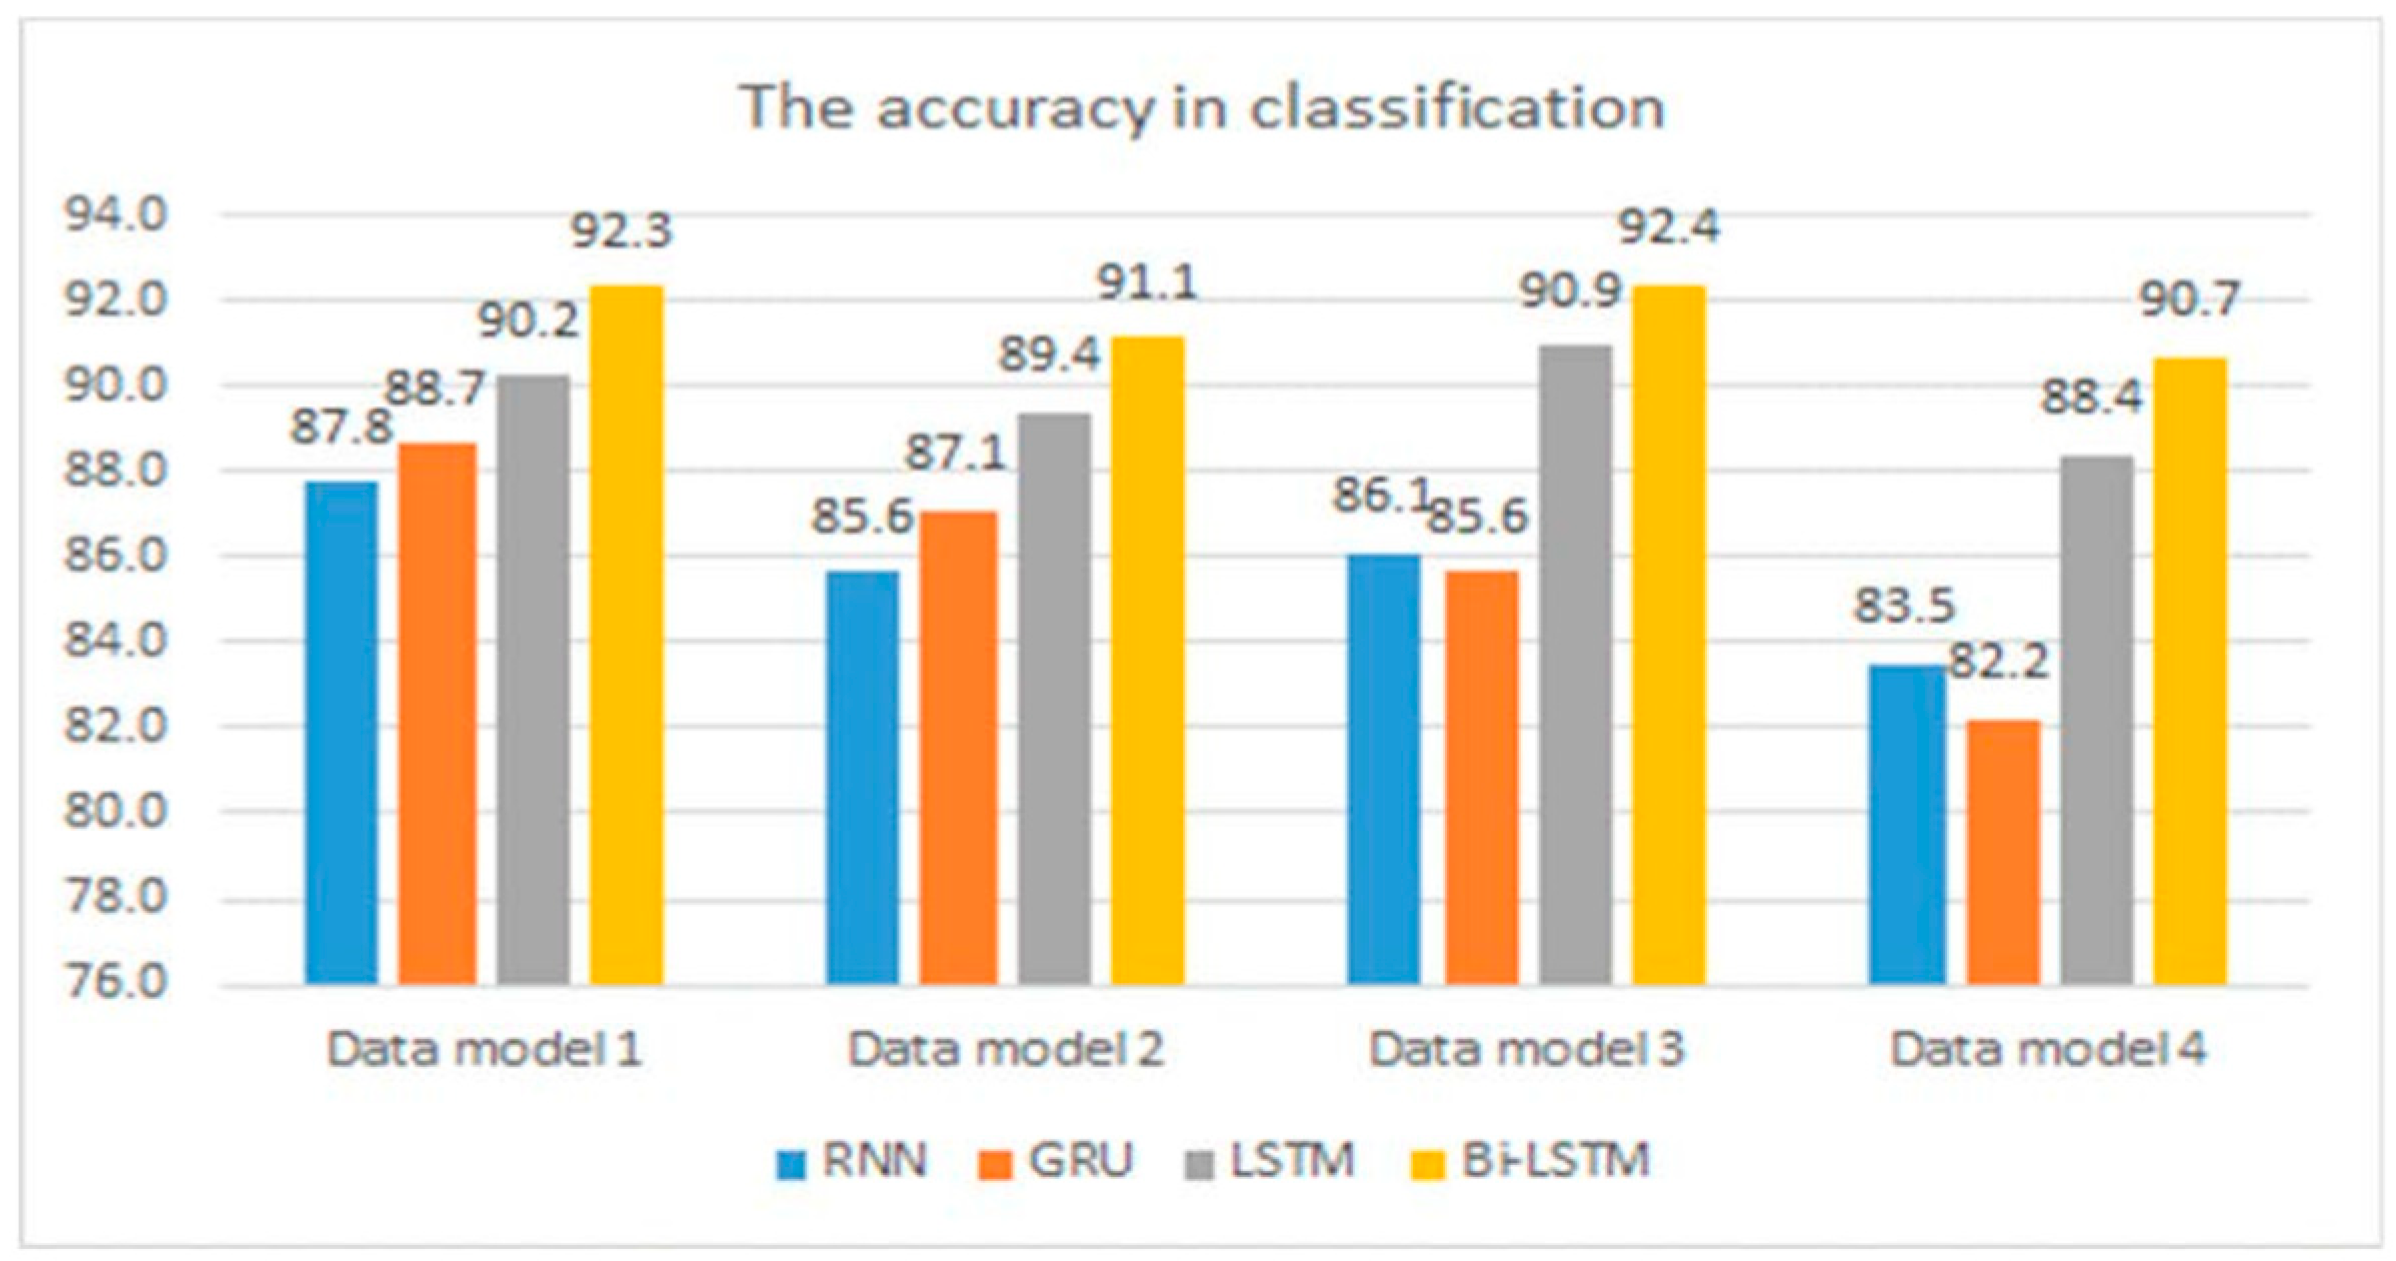
Based on data collection (with a duration of 14 months) of two types of insulators, HDPE and SR, on 15 kV/25 kV transmission lines in the coastal mountainous salt spray and strong wind environments, the authors verified the model and compared it with models such as RNN, LSTM, and GRU. The results show that the model has achieved significant error reduction and accuracy improvement on the training and validation data, as shown in Figure 9. However, the model in this study was trained individually for each type of insulator, which lacks versatility; its generalization ability across different regions and installation conditions (e.g., different heights and angles) has not been verified. These limitations determine that the results are more applicable to the monitoring of insulators with similar environments, materials, and voltage levels, and its cross-scenario applicability needs to be further verified.
Ref. [74] proposed a detection network based on a Deep Denoising Autoencoder (DDAE) to address the problems of insufficient defect samples and complex visual backgrounds in the surface defect detection of high-speed railway insulators. This network integrates the DDAE with a Deep Material Classifier (DMC) into a Deep Multi-task Neural Network (DMNN) architecture. It achieves feature reuse and collaborative training through shared convolutional layers and can complete the dual tasks of segmentation and defect detection without relying on defect samples. The DDAE is responsible for generating anomaly scores based on reconstruction errors.
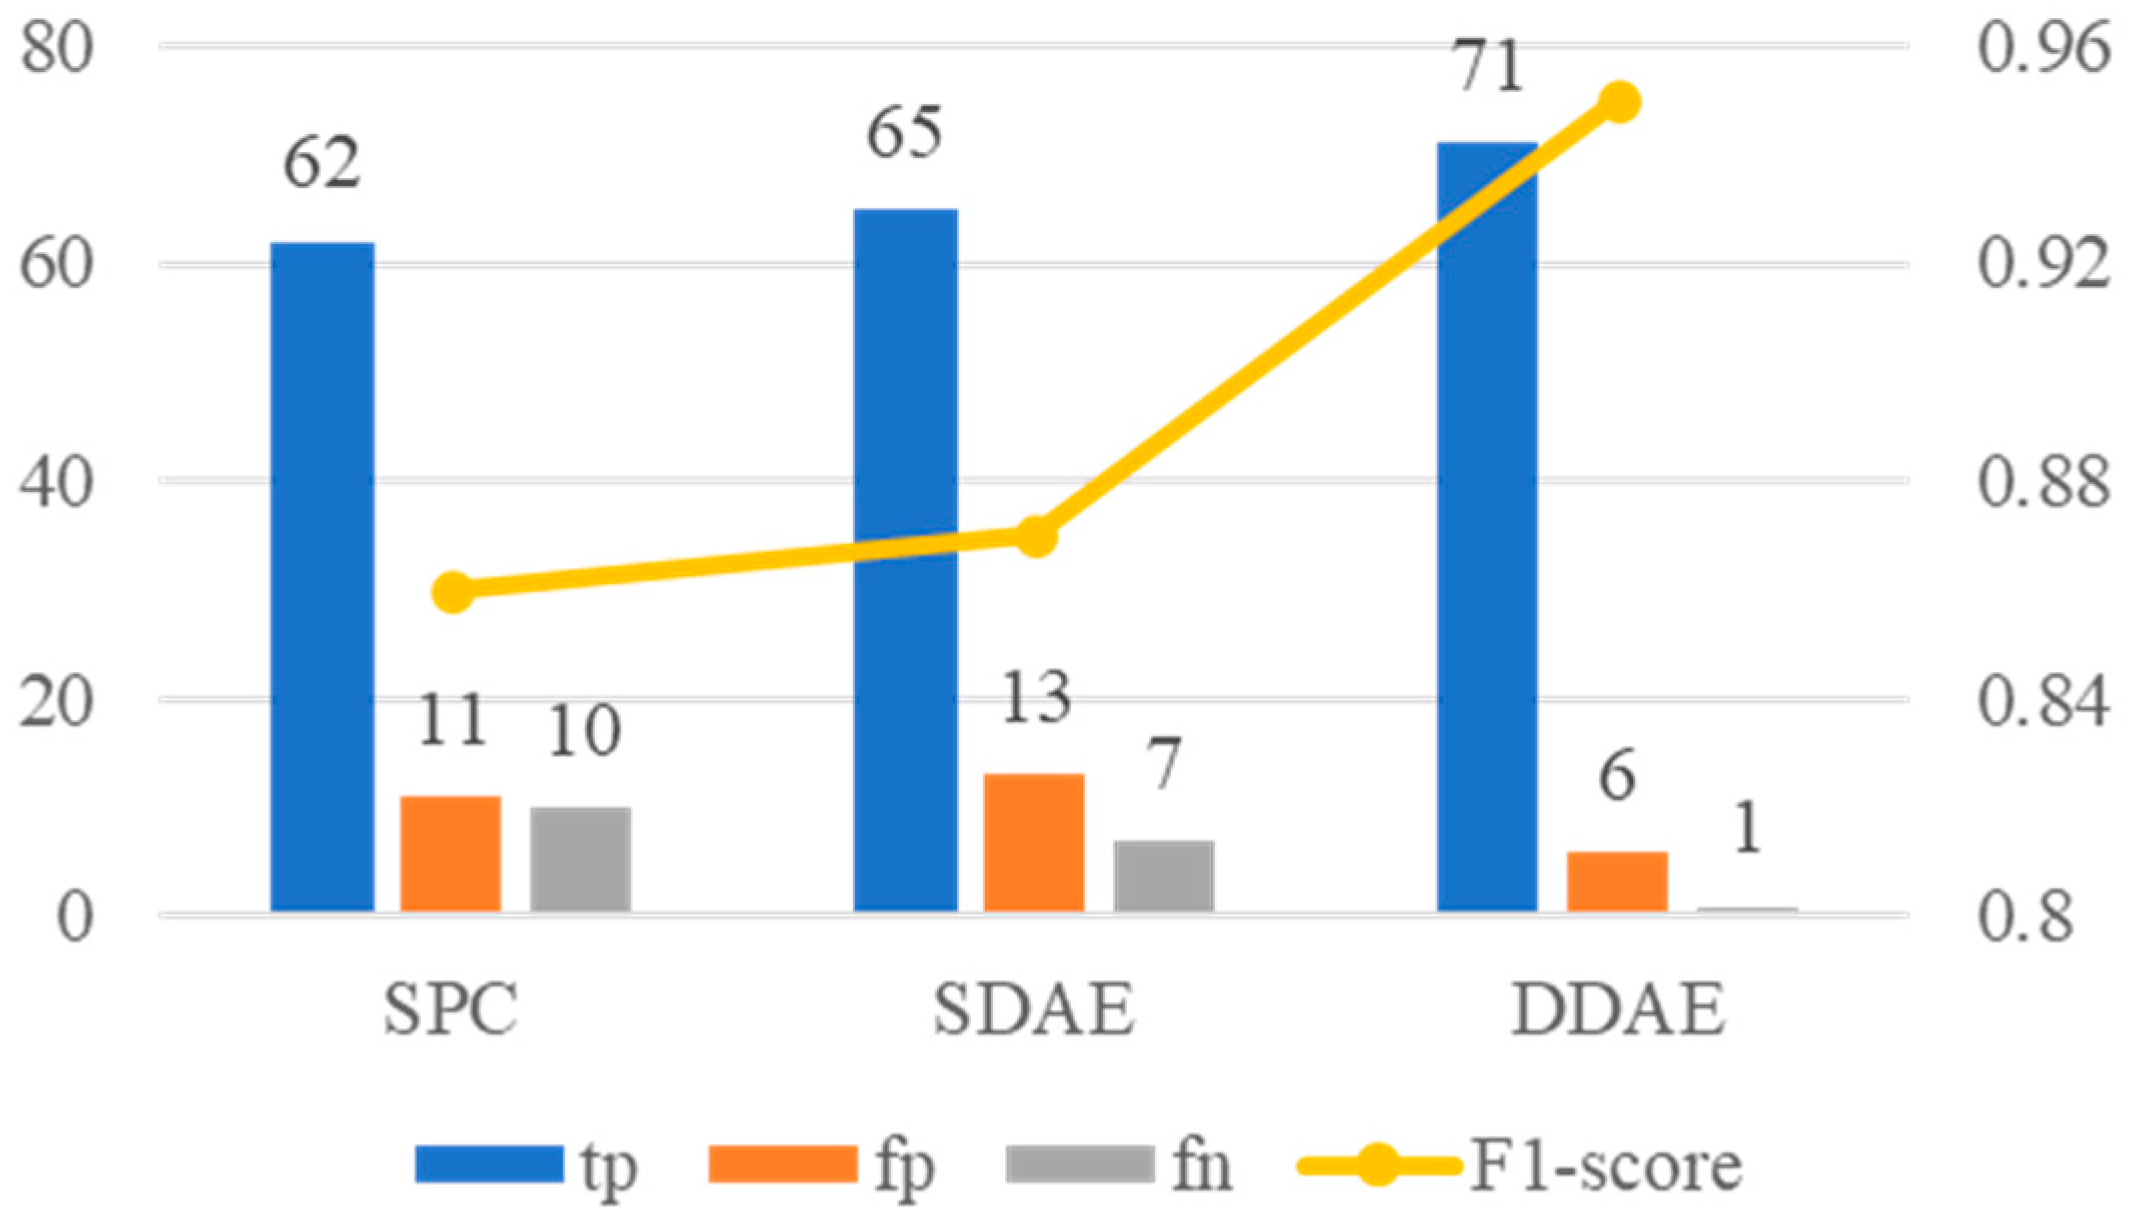
Based on 18,000 images captured by railway inspection vehicles, the authors selected 1000 images (localized via Faster R-CNN) as samples, including 72 defective sample images. By comparing with methods such as Sparse Coding (SPC) and Single-Task Denoising Autoencoder (SDAE), the authors verified the excellent detection performance of the DDAE model, as shown in Figure 10. Among these metrics, tp refers to the number of defective insulators correctly detected, fp refers to the number of normal insulators misjudged as defective ones, and fn refers to the number of defective insulators misjudged as normal ones. The evaluation metric, F1-score, is defined as follows. However, this model was only validated for two types of defects, namely contamination and damage, and was only verified on a single railway line. Its performance needs to be further verified for extreme environments, complex defects, or data collected by other equipment.
F 1 - score = 2 × tp 2 × tp + fn + fp
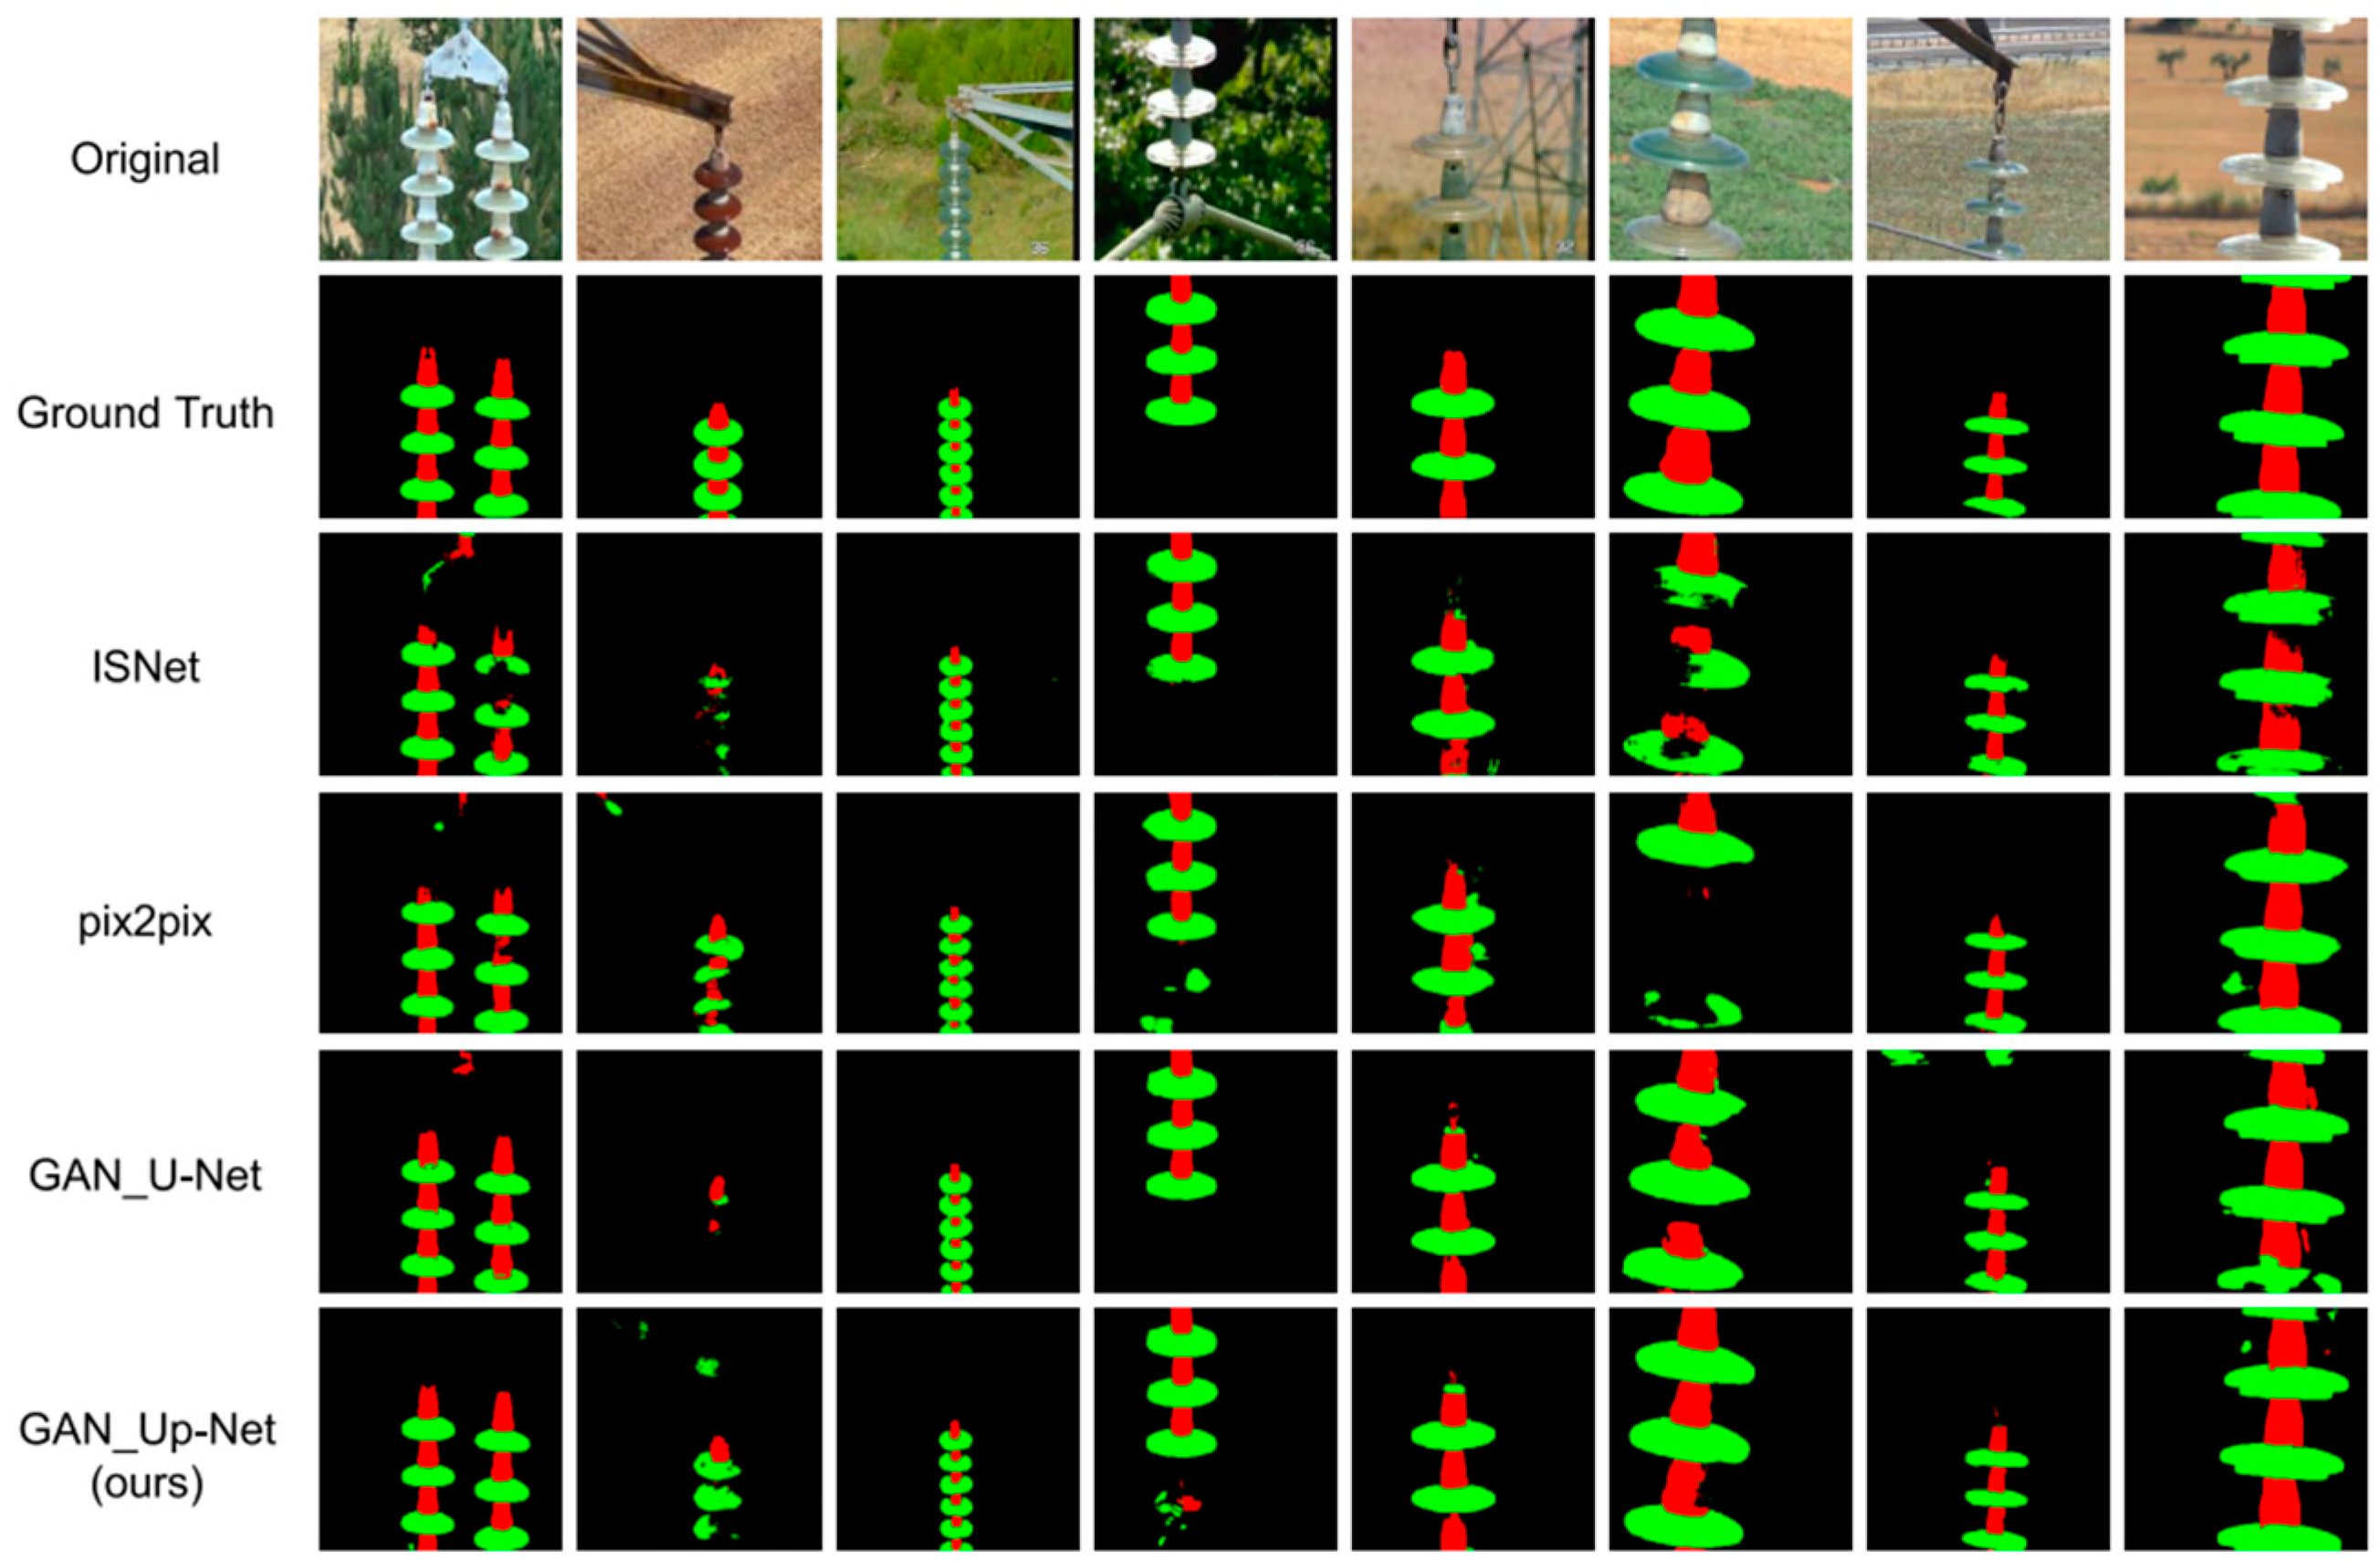
Focusing on the construction of an automatic identification and diagnosis system for insulator strings, ref. [75] drew on relevant research on Conditional Generative Adversarial Networks (cGANs) (e.g., the conditional GAN framework of pix2pix). They integrated the proposed improved fully convolutional network (Up-Net) into the GAN framework to form GAN_Up-Net, which, combined with data augmentation and transfer learning technologies, is applied to the semantic segmentation of insulator strings. This realizes accurate pixel-level classification of elements such as insulator caps and discs.
Based on a test set of 240 images, the authors verified this framework and compared it with other recognition frameworks, which confirmed the capability of GAN_Up-Net in improving the extraction accuracy of key parts of insulators in power aerial images. Seven typical cases are illustrated in Figure 11, including different insulation materials (porcelain and glass), various view angles, backgrounds, as well as shadows and reflections on insulator surfaces. It should be noted that the test images of this framework were only sourced from the aerial photography scenarios of high-voltage transmission lines, with fixed insulation material types (porcelain and glass), and lacked test cases under extreme lighting conditions (such as strong light, backlighting, and dusk) and severe weather conditions (such as image blurring caused by heavy rain and strong winds). Therefore, its stability and generalization ability need to be further verified in scenarios involving extreme environments, diverse material types, or resource-constrained deployment.
In [76,77,78,79,80,81], the authors have conducted corresponding research on the integration and processing of complex data such as images, sounds, and texts based on deep learning algorithms, demonstrating the powerful capabilities of deep learning algorithms in improving data acquisition rate, accuracy, and anti-interference performance. Meanwhile, it should be noted that single detection methods have their own limitations and can only provide limited feedback information. To comprehensively evaluate the defect status of transmission line insulators, integrating multiple detection technologies for joint identification and evaluation is a more reliable approach.

3.2. Collaborative Sensing in Multi-Dimensional Comprehensive Detection

It is worth noting that when a defect occurs, the signals it transmits outward are often multi-dimensional. For example, when a defect occurs inside the insulation and causes a partial discharge, it will simultaneously emit ultrasonic, optical, and electromagnetic characteristics, which has spawned the development of acoustic, optical, and electrical detection methods [16,32,82]. If two or more types of defect monitoring data are combined for comprehensive evaluation, it is expected to further improve detection accuracy and stability.
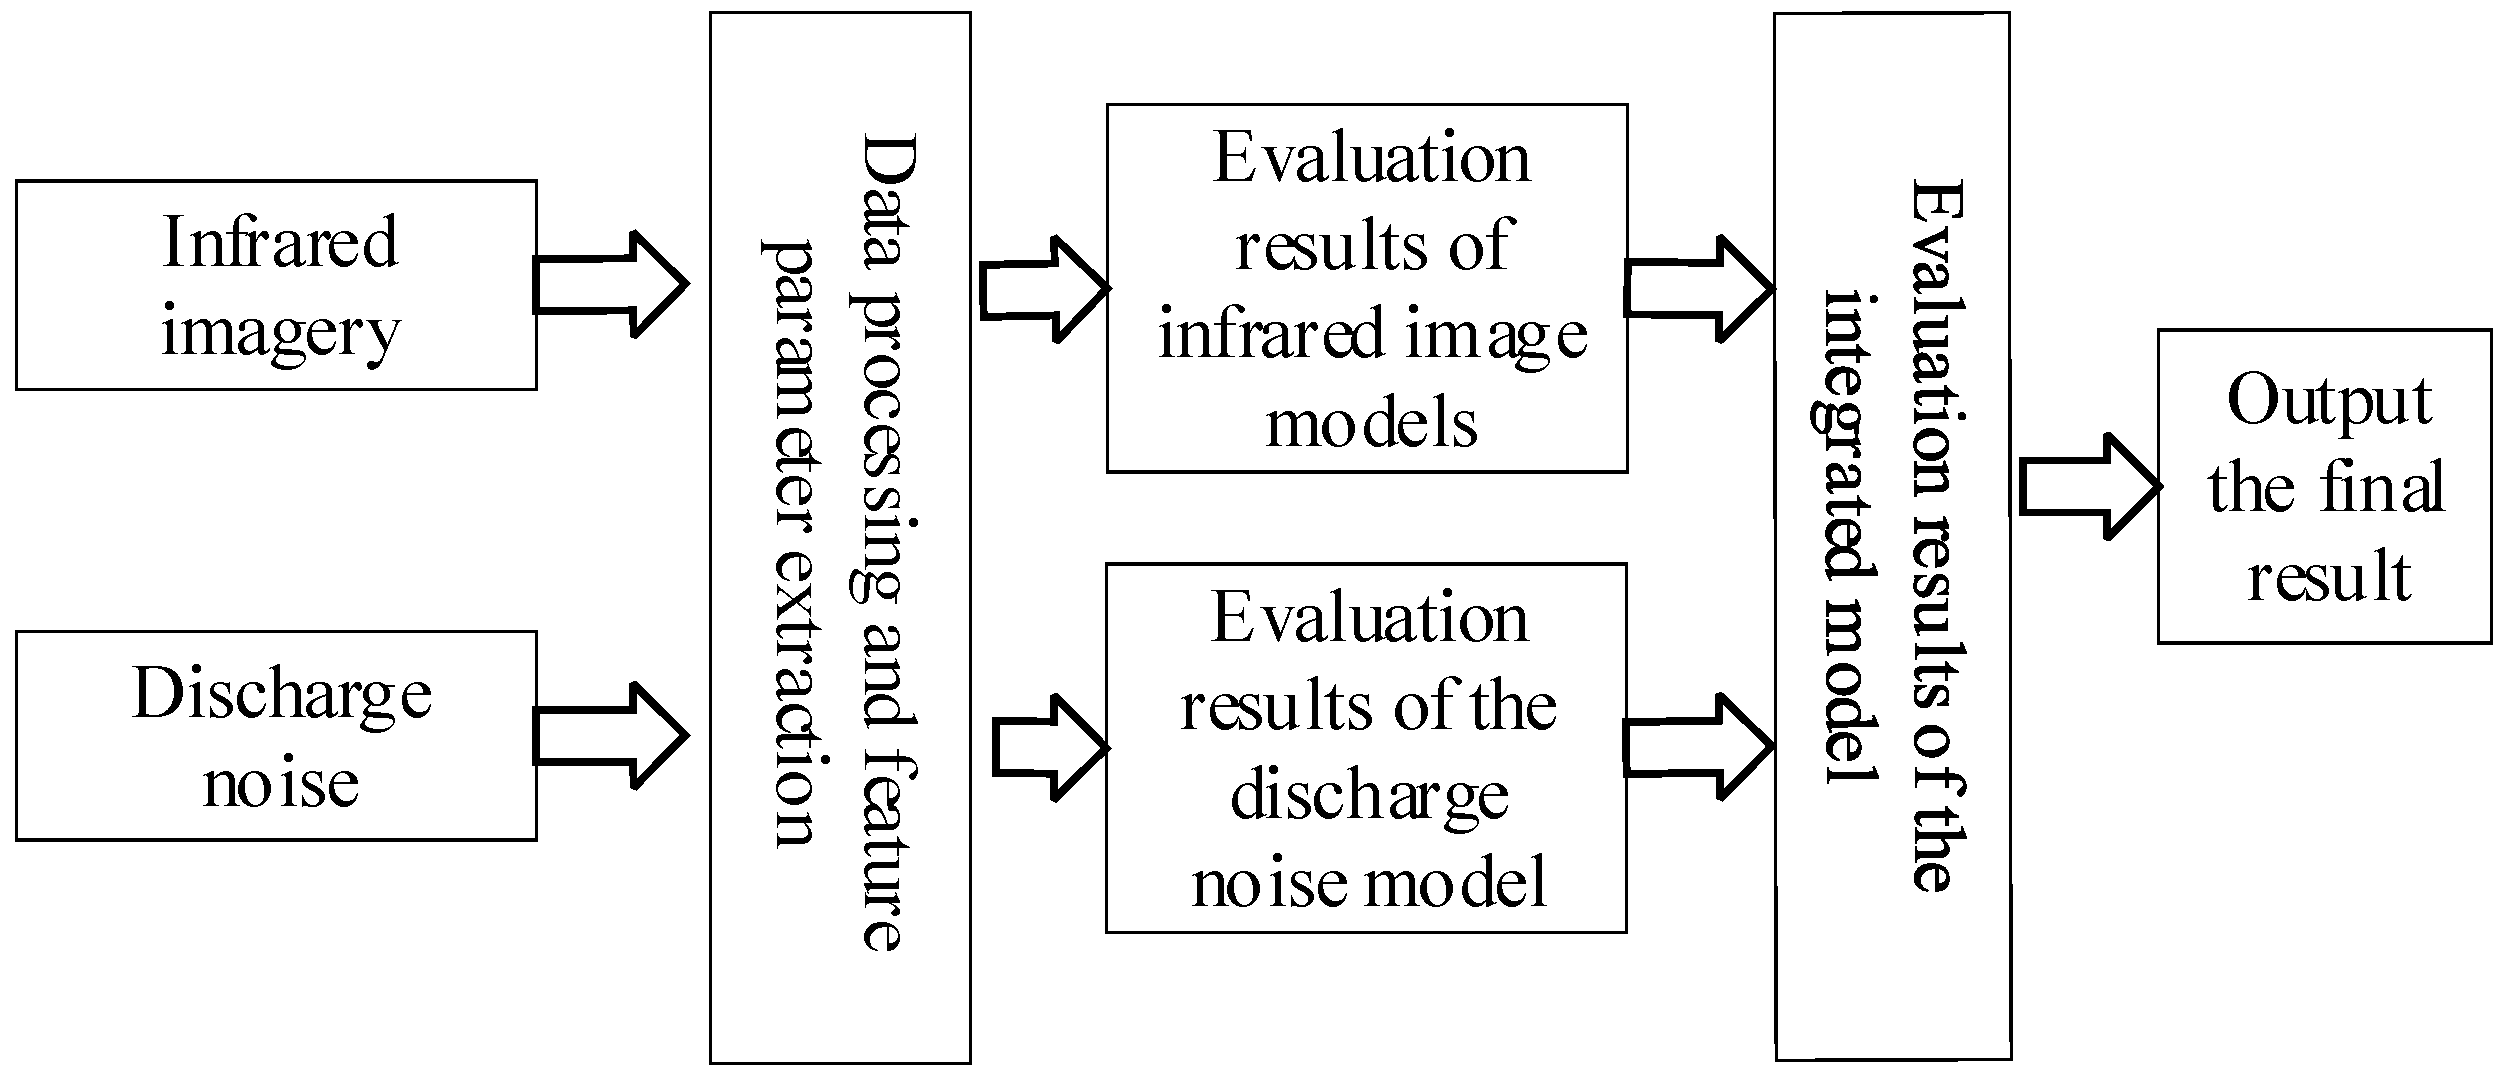
Ref. [83] comprehensively evaluated the surface contamination level of insulators based on the Dempster–Shafer (D-S) evidence theory, integrating infrared image data and discharge noise detection results. The evaluation fusion process is shown in Figure 12. This fusion evaluation model consists of four parts: a recognition framework, a basic probability assignment (BPA) function, a belief function, and a plausibility function.
The recognition framework θ is a set containing n elements, denoted as θ = A 1 , A 2 , , A n . The basic probability assignment function is the m-function, whose value reflects the degree of support for the elements in the subsets under the recognition framework θ. The m-function satisfies the relationship expressed in Equation (2):
m = 0 A θ m A = 1
The belief function Bel and plausibility function Pl derived from the m-function are shown in Equations (3) and (4):
B e l = 0 B e l θ = 1 B e l i = 1 n A i I 1 , 2 , , n , I 1 I + 1 B e l i I A i
P l A = 1 B e l A ¯
where |I| denotes the number of elements in set I and A ¯ represents the complement of set A.
The recognition framework θ in this paper consists of two subsets formed by the infrared image model and the discharge noise model, with corresponding m-functions denoted as m1 and m2. The elements of the two subsets are the evaluation recall rates of four contamination grades, namely A1, A2, A3, A4 (for the infrared image model) and B1, B2, B3, B4 (for the discharge noise model). The results fused via the D-S evidence theory are shown in Equations (5) and (6):
m A = 1 1 k A i B j = A m 1 A i m 2 B j , A θ , A 0 , A =
k = A i B j = m 1 A i m 2 B j
where m(A) denotes the fused m-function and k is the conflict coefficient, indicating the degree of conflict between pieces of evidence—the larger the k value, the greater the conflict.
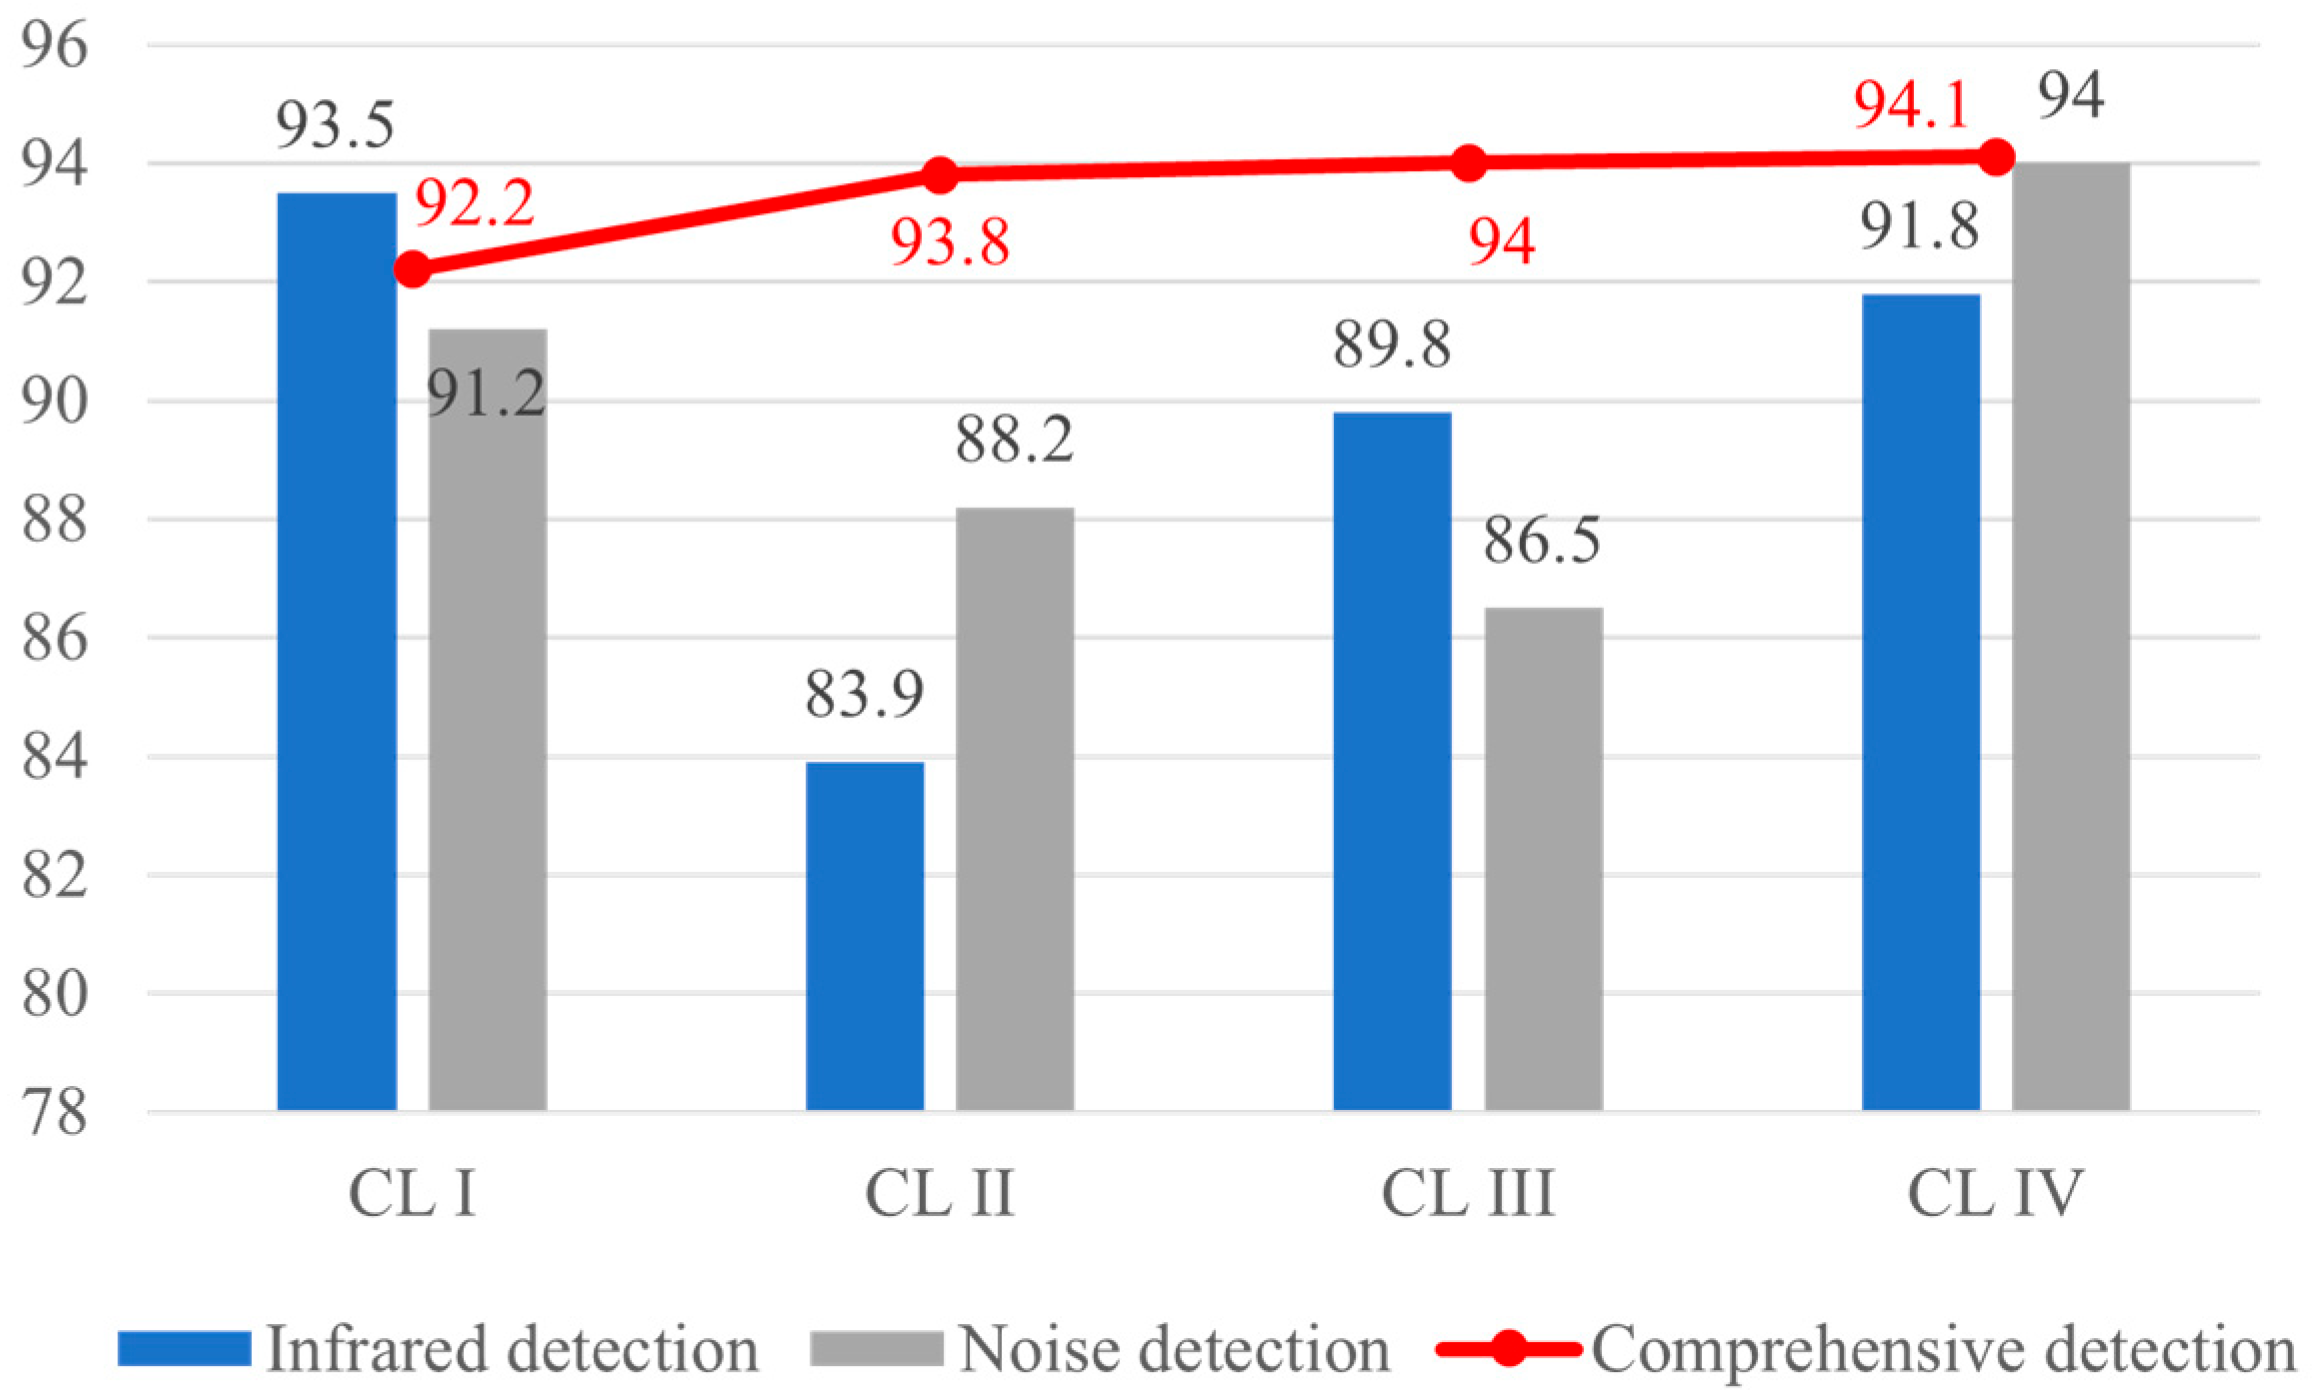
Infrared samples and discharge noise samples were collected synchronously through experiments. For each contamination level, 150 images were collected for each of the two sample types, with a total of four contamination levels (i.e., 1200 samples in total). For each contamination level, 100 samples were randomly selected as training samples, and the remaining 50 were used as test samples. The accuracy of insulator contamination degree assessment based on infrared images, discharge noise, and the comprehensive evaluation of the two detection methods is shown in Figure 13. Obviously, a single assessment method can achieve a high recognition rate in specific scenarios. For example, under contamination grades I and IV, the precision rates of both infrared and noise detection exceed 90%. However, the accuracy is not stable: under contamination grades II and III, the accuracy of infrared detection and noise detection can drop to as low as 83.9% and 86.5%, respectively. In contrast, the comprehensive assessment combining both detection methods can maintain the overall accuracy above 92.2%, leading to a significant improvement in the reliability of recognition accuracy.
Multi-dimensional detection can integrate multiple detection methods for complementary enhancement, effectively overcoming the operating condition limitations of single signals. For example, when infrared detection fails due to light interference at night, ultrasonic + electric field signals can be used to supplement defect recognition capability [16,34]; when the signal-to-noise ratio (SNR) of ultraviolet signals decreases in humid environments, spectral + visible light texture features can be used as alternatives to achieve contamination/aging defect detection [84,85], covering the detection needs under all-weather and complex environments. Combined with edge computing deployment [86,87] and integrated with 5G or even future 6G communication technologies [88], it is expected to construct an all-weather uninterrupted online insulator defect monitoring system adaptable to the complex environments of transmission lines.

3.3. Multi-Source Data-Driven State Insight and Prediction

The emergence of artificial intelligence (AI) technology has not only enhanced the accuracy and applicability of single detection methods but also enabled real-time online integration, analysis, and decision-making of large-scale data from different detection approaches. By integrating multi-source data such as historical operation and maintenance (O&M) records, meteorological data, and power grid load fluctuations, comprehensive monitoring and evaluation of the full-lifecycle operational state of insulators can be achieved.
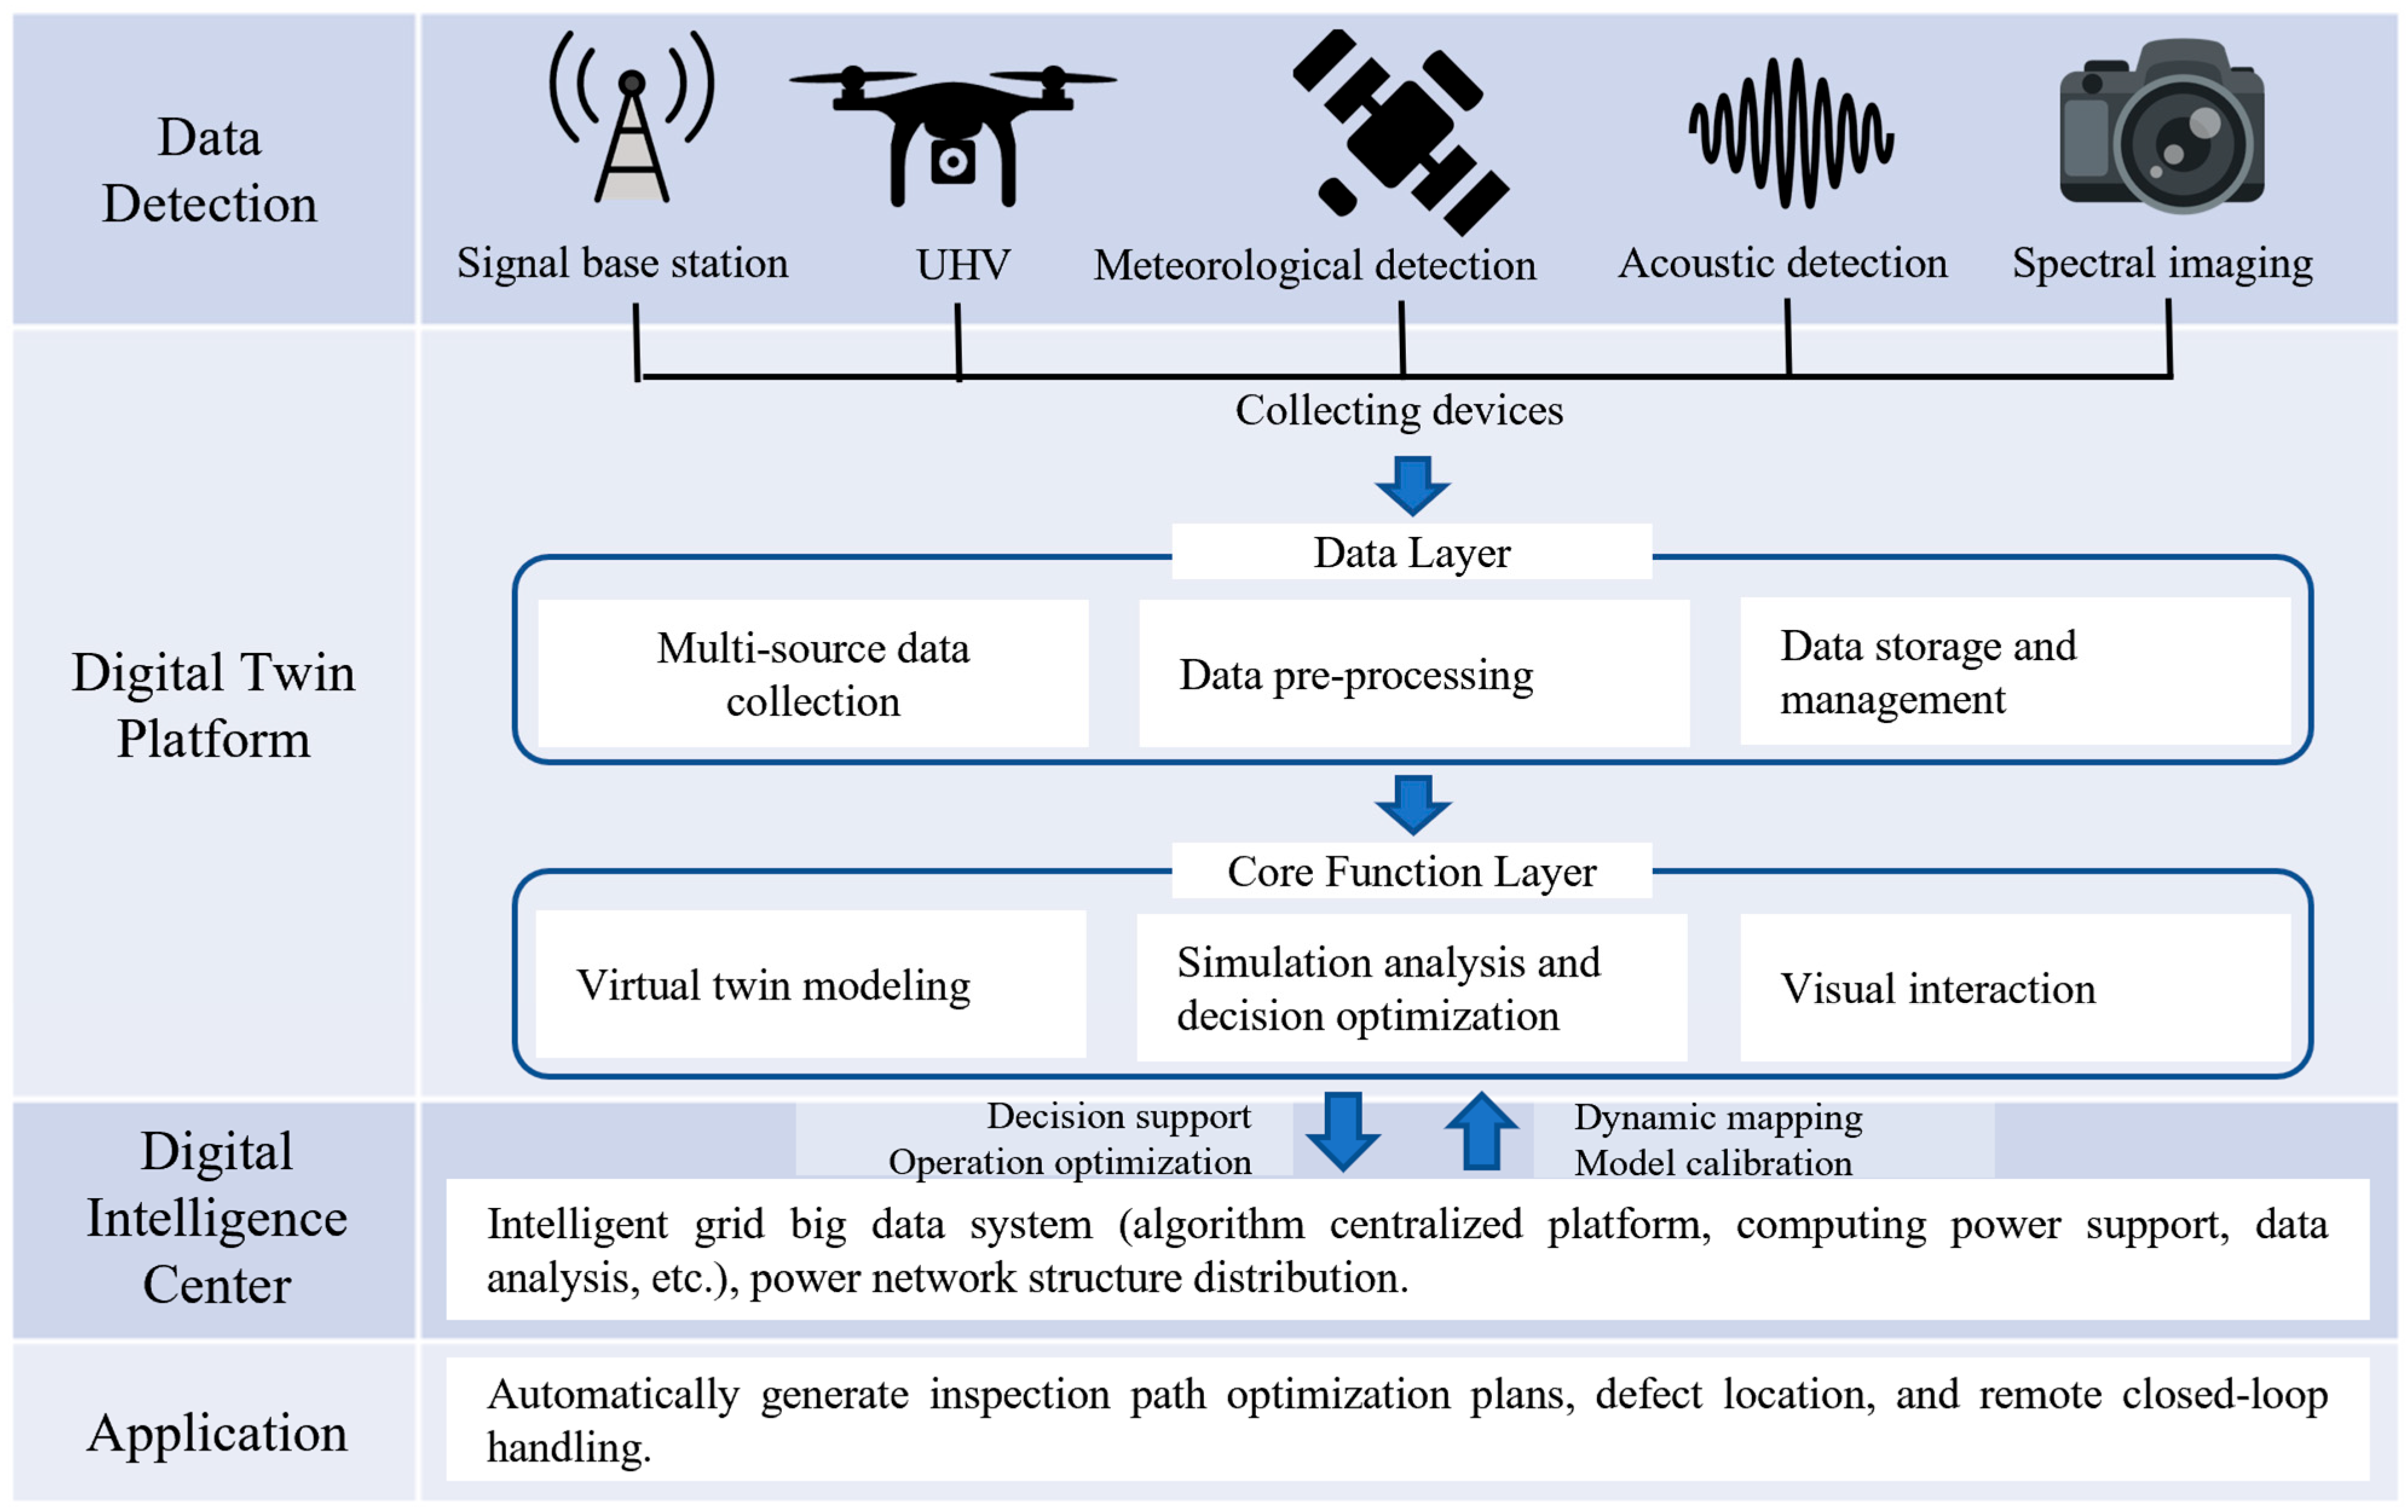
Currently, the construction of digital twins driven by multi-source data fusion has become relatively mature. Through the establishment of a data architecture, multi-source heterogeneous data in universal systems (e.g., real-time sensing data, environmental interaction data, etc.) are integrated to address issues of data silos and format differences. Digital twins construct virtual mapping models into which integrated data is dynamically injected, enabling visual simulation and process optimization of the data fusion process. This facilitates the establishment of a three-dimensional evaluation system covering accuracy, real-time performance, and reliability; quantifies the fusion effect; and ensures that data fusion adapts to the complex application scenarios of universal systems [89].
Currently, this technology has been applied and verified in numerous fields, such as mechanical manufacturing [90], architecture [91], building energy [92,93], nuclear power [94], and battery management [95]. In the field of non-contact detection of insulator defects on transmission lines, the conceptualization of and research on this technology have long been initiated—based on multi-source data acquisition, the equipment status, geographic environmental and operational data are acquired by means of UAVs (single UAV/swarm), sensors, and Beidou positioning terminals. After ultra-low latency transmission through 5G networks, a virtual–real mapping model with static high-fidelity simulation and dynamic data-driven characteristics is constructed. Subsequently, a variety of intelligent algorithms are integrated to optimize inspection routes and fault diagnosis. Relying on the multi-layer architecture of “edge devices—cloud infrastructure—platform—application”, the model is applied to practical scenarios, such as intelligent inspection and equipment health management, thus providing technical support for the full-lifecycle management of power grids [96,97,98]. As shown in Figure 14, the intelligence center provides real-time dynamic mapping and model calibration for the digital twin model, ensuring its accuracy, while the digital twin offers virtual validation solutions for the scheduling and decision-making of the intelligence center while assisting the power grid in achieving proactive operation and maintenance as well as resource optimization.
However, constrained by numerous objective factors including the spatiotemporal registration of multi-source data, difficulties in algorithm coordination, the lack of unified standards for data formats of different devices, computing power constraints, and high equipment costs, digital twin technology driven by multi-source data fusion is currently only confined to auxiliary detection and applications in local areas of power grids. Typical cases include constructing background environments to assist in the localization and recognition of detection targets [99], as well as the tentative verification of local detection [100]. With the in-depth construction of smart grids in the future, multi-source data-driven insight and prediction of insulator defect states are expected to usher in new transformations.

3.4. Comparison and Prospects of New-Type Detection Technologies

At present, three types of new AI-driven detection technologies are still hampered by critical drawbacks, namely, the lack of industry standards and insufficient technical collaboration, thus making it difficult to form synergy for large-scale applications. The single-modal empowerment of deep learning algorithms is restricted to development based on data proprietary to different research teams. Without unified open-source datasets for defective insulators and standardized evaluation criteria, cross-model comparison and collaboration become infeasible, and re-adaptation is required for cross-scenario applications. For integrated multi-dimensional detection, there is a lack of unified specifications for data formats, spatiotemporal scales, and resolutions of different sensors, which renders data registration and calibration intractable challenges. In addition, the collaboration strategies and interference shielding designs for multiple detection methods still need to be optimized. As for multi-source data-driven comprehensive evaluation, the industry is afflicted by a severe “data silo” issue: data such as historical operation and maintenance records, meteorological data, and power grid load are stored in a decentralized manner without unified fusion standards. This makes it impossible for digital twin models to obtain comprehensive and standardized data support, and the technology remains at the conceptual stage so far.
The advancement and implementation of these three technologies still need to overcome multiple hurdles in the future, including technical adaptation, cost control, and standard unification. The framework for comparing new detection technologies and their future optimization directions is shown in Table 3.

4. Challenges: Interference and Scale of UHV Engineering

The research on and application of new detection technologies not only empower single detection methods, improving the accuracy and reliability of insulator state detection, but also promote the gradual transition of detection intelligence from theoretical research to engineering practice. However, current detection technologies still face numerous challenges in the field of UHV transmission lines. UHV transmission lines refer to those with DC ±800 kV and above, as well as AC 1000 kV and above [101]. With the in-depth transformation of China’s energy structure and economic development, UHV power transmission has become a core infrastructure to address contradictions between energy supply and demand and support green and low-carbon development [102]. This chapter summarizes the current challenges in the insulation state detection of UHV transmission lines.

4.1. Challenge of Strong Electromagnetic Environment Interference on Transmission Lines

The electric field strength on the surface of UHV line conductors is extremely high (20–30 kV/cm for AC lines and 30–40 kV/cm for DC lines), approaching the air breakdown threshold (approximately 30 kV/cm). Therefore, even without faults, weak corona discharge occurs near UHV transmission lines: air molecules around the conductors are ionized, forming a blue, self-sustaining partial discharge phenomenon accompanied by a “hissing” sound and ozone generation. When electric field distortion (e.g., conductor burrs, insulator contamination) or environmental intensification (high humidity, ice, and snow) occurs, corona discharge transforms from “weak continuous discharge” to “strong pulse discharge”, which exacerbates electromagnetic radiation around the transmission lines [103,104,105,106]. Among them, electromagnetic interference (EMI) and audible noise pose significant challenges to signal recognition in insulator state detection of transmission lines [26,107,108].
The tolerance of detection sensors to electric fields is limited. The electric field detection sensors in [38], which generally have a higher tolerance to electric fields, have a tolerance range of 0.05–0.5 kV/cm, far lower than the electric field intensity on the surface of ultra-high voltage transmission lines. To address the increase in voltage level and the impact of electromagnetic interference, and to ensure the safety of equipment and personnel, a commonly adopted method is to increase the detection distance. However, an increase in detection distance is often accompanied by the attenuation of detection signals. Ref. [5] presents electric field simulations around an 80-insulator string of an 800 kV DC transmission line. The results indicate that at a distance of 300 mm, the electric field curve is clear, and the field perception is sensitive. At 800 mm, however, the electric field intensity decreases. As the distance increases further, for example to 1500 mm, the electric field is significantly weakened. Even at a distance of 300 mm, the electric field fluctuation caused by a zero-value insulator is weak compared to that of a full insulator string. Therefore, increasing the detection distance is hardly acceptable for such detection methods.
At the same time, UHV transmission lines have faced severe environmental noise problems since their construction. Power research institutions in countries such as China, the United States, Canada, Japan, and France have established large-scale EHV/UHV corona cages to study audible noise issues [109,110]. Although many studies on noise suppression for EHV/UHV transmission lines have been carried out worldwide, the noise is mainly controlled within the range of 50–60 dB(A) [111,112].
The strong electromagnetic interference and environmental noise from UHV transmission lines impose systematic constraints on existing non-contact detection technologies: the intense electromagnetic environment distorts ultrasonic, electric field, and partial spectral signals, obscuring defect features and degrading signal-to-noise ratios; increased detection distances (for safety) reduce sensitivity and localization accuracy for micro-defects across all technologies; and some technologies face fundamental issues, such as unstable electric field detection (due to probe proximity to high fields) and high false positives in infrared/ultraviolet detection (from confusing background corona with defect signals). Going forward, efforts should focus on developing miniature intelligent sensors with active anti-interference and adaptive filtering, building multi-technology diagnostic models (e.g., UV-infrared-ultrasonic) to enhance data stability and diagnostic reliability, and establishing a UHV baseline signal feature library to enable accurate defect feature extraction from noise.

4.2. Challenge of Large-Scale Intelligent Operation and Maintenance

In China, power resources are concentrated in remote western regions, while energy demand is centered in economically developed eastern areas. Energy projects such as the “West-to-East Power Transmission” have compelled UHV transmission lines to span remote high mountains, deserts, and other harsh uninhabited regions [113,114]. To enhance the stability of long-distance and large-capacity transmission in UHV projects, the integration of UHV transmission lines with smart grids has become increasingly in depth—UHV lines provide a broad platform for smart grid dispatching. Moreover, smart grids not only promote energy regulation of UHV transmission lines [115] but also offer technical support for the integration, analysis, and decision-making of large-scale detection data, enabling real-time monitoring, deployment, and control of power grids [116,117].
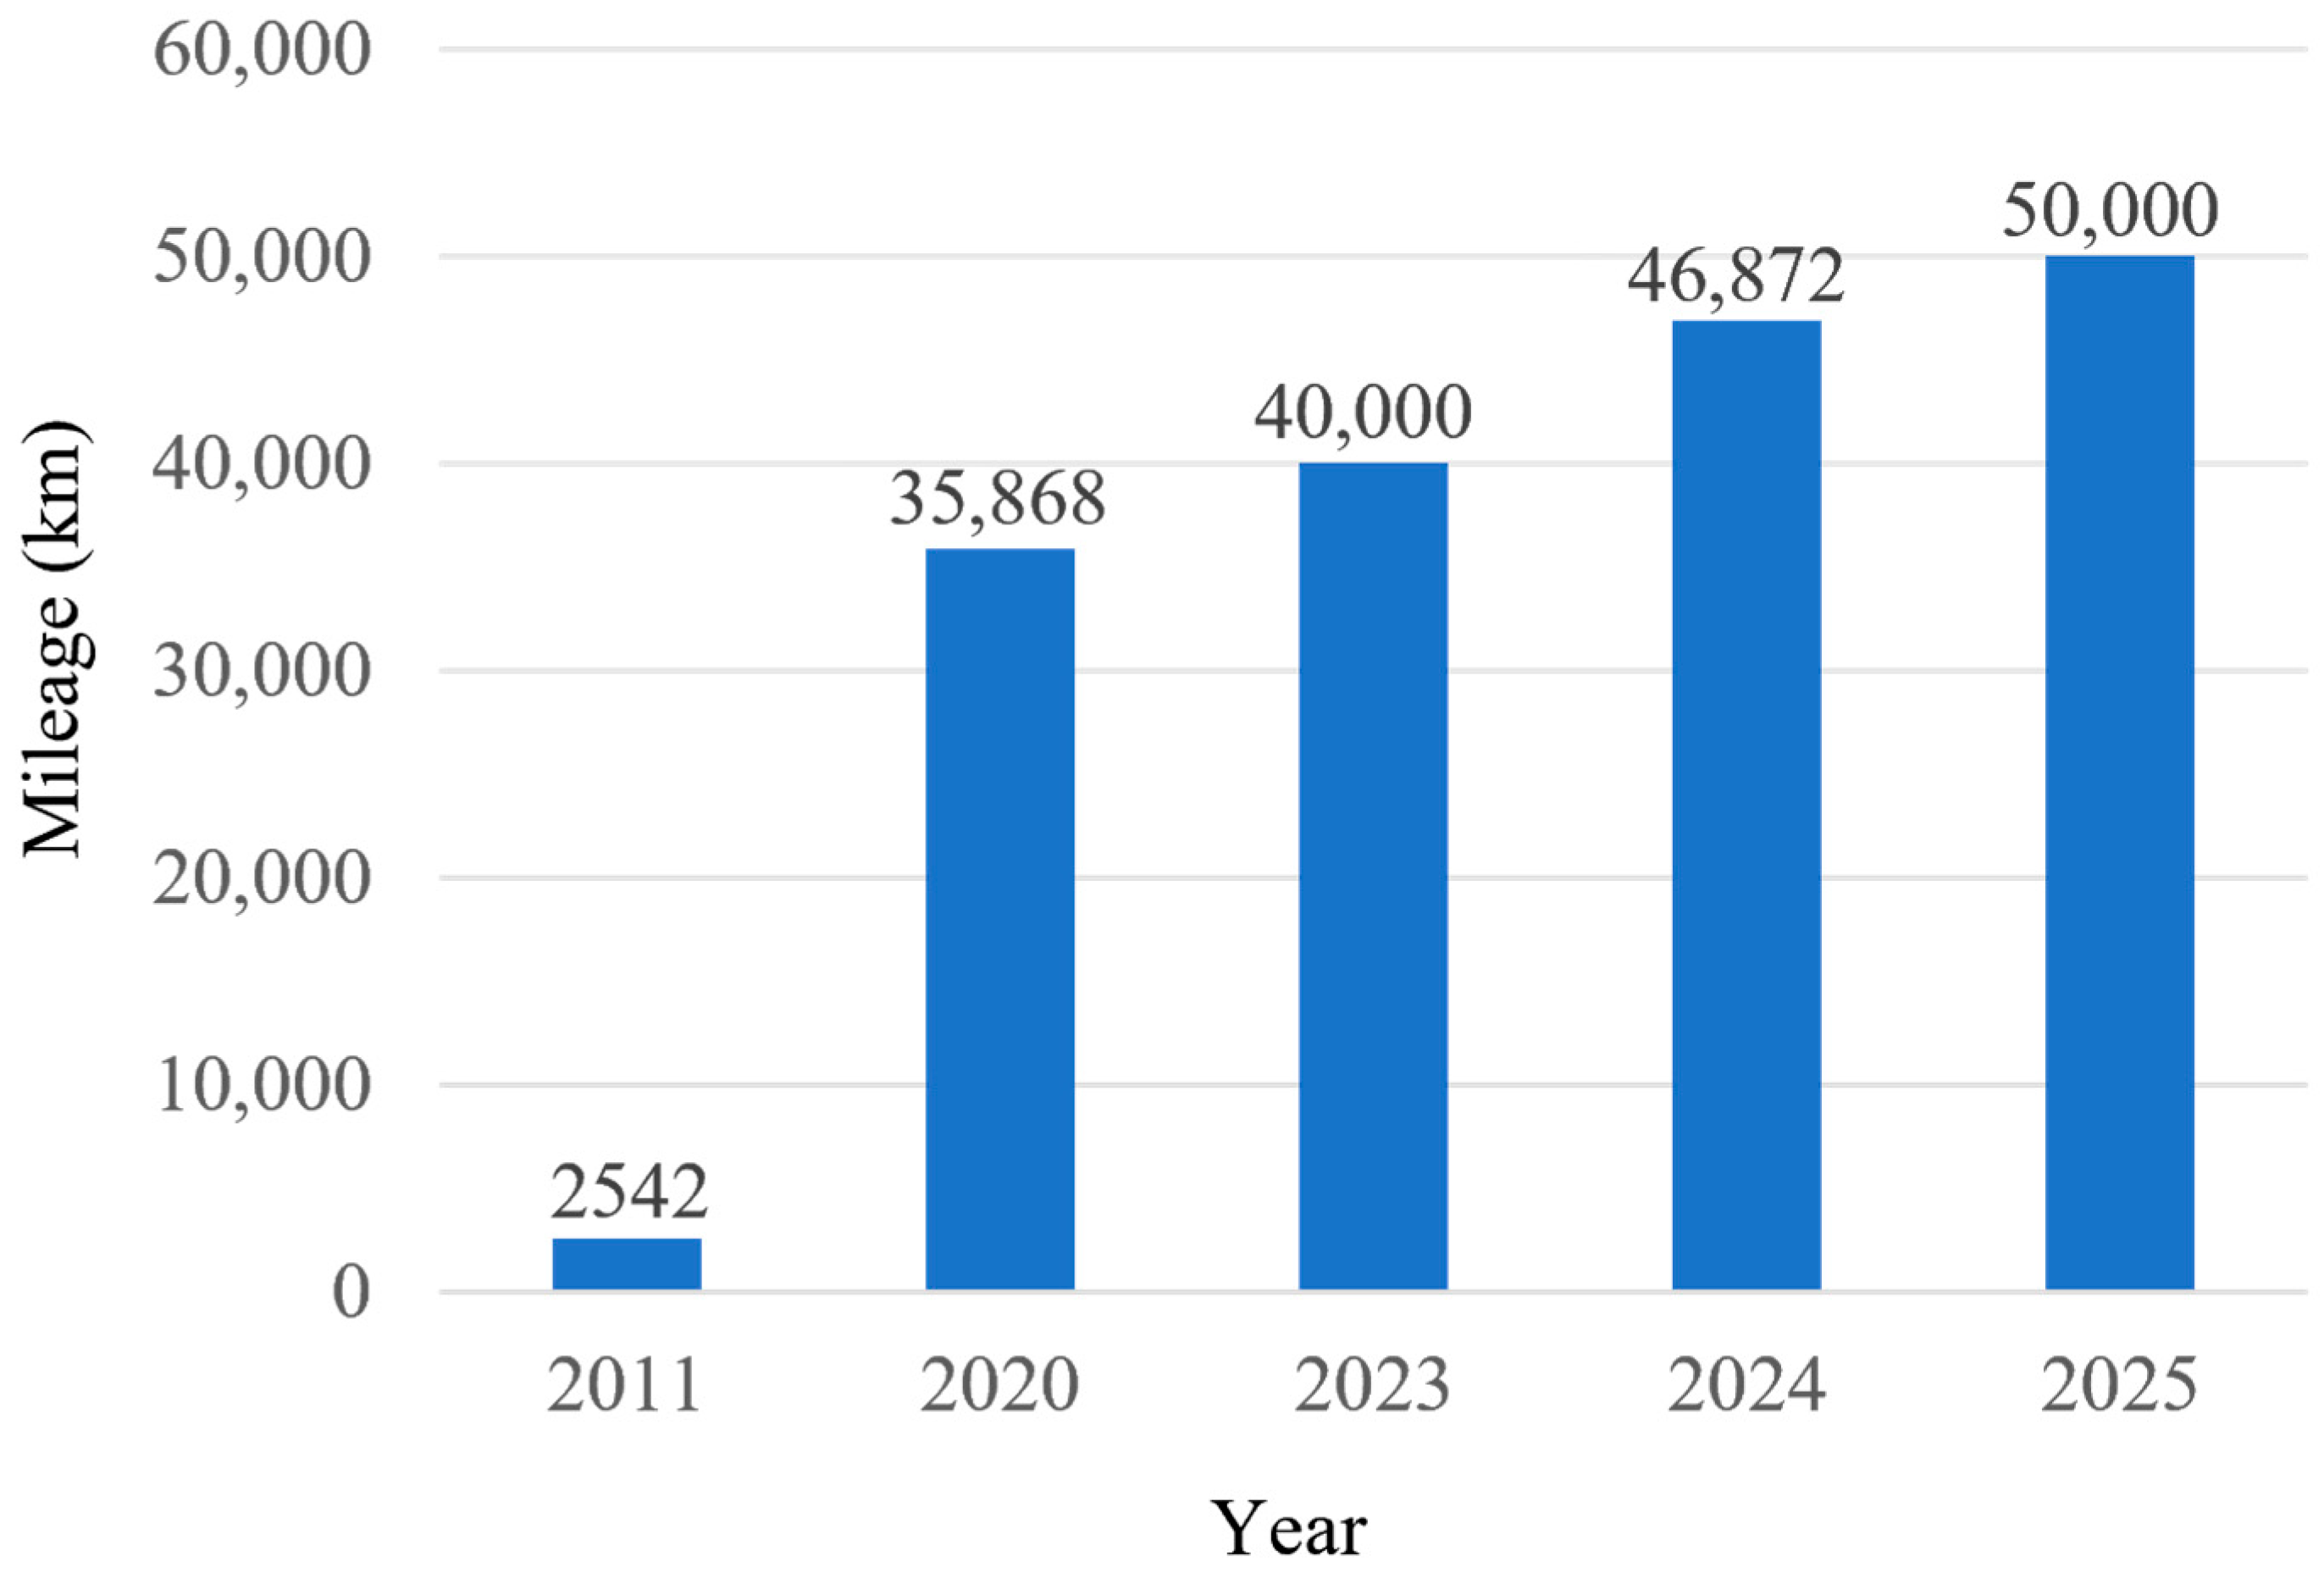
However, with the continuous growth of industrial energy demand, UHV transmission projects have also developed rapidly, leading to significant increases in both the distribution span of transmission lines and the scale of condition detection. In just 15 years, the construction mileage of China’s UHV transmission lines has increased from 2542 km in 2011 to 50,000 km at present. Especially in recent years, the annual average construction mileage has even exceeded 5000 km. The development scale of UHV transmission lines over the past 15 years is shown in Figure 15. Accompanying this is a substantial growth in the number of insulators: the demand for cap and pin insulators in a single string of EHV transmission lines (330–750 kV) is approximately 17–32 pieces, while that for UHV lines generally exceeds 50 pieces, and can even reach 80 pieces on some lines [5].
The large spans and dispersion of UHV transmission lines pose systematic constraints on non-contact insulator detection: the limited payload and endurance of UAVs make it hard to carry multiple detection devices simultaneously for comprehensive testing, creating an inherent conflict between detection coverage and depth [118,119,120]. In addition, the high computational load of high-precision detection algorithms conflicts with UAVs’ real-time processing and low-power requirements, and the complex, variable natural environment poses severe challenges to algorithm universality and robustness [86]. On the support side, communication blind zones cause interruptions in data transmission and real-time control [88]; the lack of unified industry technical standards and data specifications traps massive detection data in information silos, hindering the formation of a decision-supporting information database.
Thus, future research must move beyond standalone technology optimization to build an air–ground collaborative 3D intelligent inspection system: develop lightweight airborne platforms integrated with multi-sensor fusion, adopt edge computing for on-site data preprocessing to ease communication and endurance pressure, and establish a unified defect atlas database and diagnostic standards to lay the foundation for algorithm training, data interoperability, and large-scale intelligent decision-making.

4.3. Technological Prospects

Non-contact detection of insulator conditions for UHV transmission lines faces two core challenges: strong electromagnetic interference and large-scale operation and maintenance. These challenges have generated three rigid requirements for current detection technologies—signal reliability, detection efficiency improvement, and scale adaptability. To systematically address these challenges, we have integrated a variety of comprehensive schemes combining AI intelligent algorithms with multi-modal detection technologies. The comparison and analysis of four potential technical paths from multiple dimensions are shown in Table 4, including core architecture, algorithm function, and applicable scenario. It aims to provide technical routes for insulator condition detection of UHV transmission lines, as well as clarify the current application status and main challenges of each corresponding route.

5. Conclusions

This paper systematically summarizes the application status of non-contact detection technologies for the operational state of transmission line insulators, outlines the prospects of three emerging detection technologies driven by artificial intelligence (AI), and summarizes the challenges in the field of UHV transmission lines. The main conclusions are as follows:
  • Non-contact detection technologies are based on the principle that acoustic waves, electric fields, infrared/ultraviolet (IR/UV) radiation, and other spectral characteristics emitted by defective insulators undergo distortion under the action of external factors (e.g., voltage). Based on this, various detection methods, such as acoustic wave detection, electric field detection, IR/UV imaging detection, and spectral detection, have been developed. However, each detection method has its applicable scenarios, and a single technology cannot achieve full coverage of all defect types and operating conditions.
  • Driven by AI technology, deep learning has significantly improved the anti-interference capability, recognition accuracy, and efficiency of single detection technologies through single-modal empowerment. Multi-dimensional comprehensive detection relies on multi-technology collaborative sensing to break through the functional limitations of single technologies, enabling full coverage of all defect types and complex operating conditions. Multi-source data-driven technology combined with digital twin technology promotes the upgrade of detection from “defect recognition” to “full-lifecycle state prediction.” Among these, the application of deep learning has achieved relatively mature development, the real-time online application of multi-dimensional comprehensive detection needs to be gradually promoted, and the multi-source data-driven comprehensive detection requires further research.
  • The strong electromagnetic interference and large-scale development of UHV transmission lines pose two main challenges: (1) signal interference in strong electromagnetic environments, as well as signal attenuation and distortion caused by the increased safe detection distance; (2) in large-scale operation and maintenance (O&M), challenges include the balance between drone endurance and payload, insufficient algorithm generalization ability, limited data transmission and processing efficiency, etc. Additionally, the lack of unified industry standards has led to “data silos,” which restricts the large-scale application of detection technologies.
Currently, to promote the generalization and intelligent application of non-contact detection for transmission line insulators, several issues still need to be addressed:
  • Synchronization, registration, and calibration of multi-dimensional detection data for insulator operational states, as well as the development of corresponding efficient algorithms;
  • Exploration of technical collaboration strategies for the operation of multi-dimensional sensors, equipment maintenance, and interference shielding in complex environments;
  • Construction and optimization of multi-source data fusion-driven models for insulator operational state detection;
  • Improvement of the stability and efficiency of signal transmission, as well as the enhancement of computing power for corresponding intelligent systems;
  • Unified formulation and promotion of standards for multi-dimensional detection and multi-source data applications.

Author Contributions

Conceptualization, formal analysis, Z.Z. and D.Z.; methodology, resources, funding acquisition, Z.Z.; software, visualization, writing—original draft preparation, D.Z.; validation, data curation, investigation, D.Z., B.Y. and M.M.; writing—review and editing, project administration, Z.Z., X.J. and Y.L.; supervision, X.J. All authors have read and agreed to the published version of the manuscript.

Funding

This research is sponsored by Natural Science Foundation of Chongqing, China. (NO. CSTB2023NSCQ-LZX0021).

Data Availability Statement

No new data were created or analyzed in this study.

Conflicts of Interest

Authors Bo Yang and Minghui Ma are employed by the company State Grid Chongqing Electric Power Company, Chongqing, China. The remaining authors declare that the research was conducted in the absence of any commercial or financial relationships that could be construed as a potential conflict of interest.

References

  1. Pang, G.; Zhang, Z.; Hu, J.; Hu, Q.; Zheng, H.; Jiang, X. Analysis of failures and protective measures for core rods in composite long-rod insulators of transmission lines. Energies 2025, 18, 3138. [Google Scholar] [CrossRef]
  2. Qiao, X.; Ming, Y.; Xu, K.; Yi, N.; Sundararajan, R. Aging of polymeric insulators under various conditions and environments: Another look. Energies 2022, 15, 8809. [Google Scholar] [CrossRef]
  3. Kumar, C.; Ganguly, B.; Dey, D.; Chatterjee, S. Recent trends and open challenges in acoustic partial discharge signal denoising techniques: A review. Electr. Power Syst. Res. 2025, 248, 111931. [Google Scholar] [CrossRef]
  4. Anjum, S.; Jayaram, S.; El-Hag, A.; Jahromi, A.N. Detection and classification of defects in ceramic insulators using RF antenna. IEEE Trans. Dielectr. Electr. Insul. 2017, 24, 183–190. [Google Scholar] [CrossRef]
  5. Zhang, Z.; Zhang, H.; Jiang, X.; Zhou, C.; Liu, R.; Li, Y. Detection of zero-value insulators in ±800 kV DC porcelain strings based on spatial electric field variation. J. Electrostat. 2025, 138, 104206. [Google Scholar] [CrossRef]
  6. Liu, X.; Miao, X.; Jiang, H.; Chen, J. Data analysis in visual power line inspection: An in-depth review of deep learning for component detection and fault diagnosis. Annu. Rev. Control 2020, 50, 253–277. [Google Scholar] [CrossRef]
  7. Wang, R.; Zhang, M.; Jiang, Y.; Yang, Y. Prediction model of insulator contamination degree based on adaptive mutation particle swarm optimisation and general regression neural network. J. Eng. 2019, 2019, 1423–1428. [Google Scholar] [CrossRef]
  8. Alhassan, A.B.; Zhang, X.; Shen, H.; Xu, H. Power transmission line inspection robots: A review, trends and challenges for future research. Int. J. Electr. Power Energy Syst. 2020, 118, 105862. [Google Scholar] [CrossRef]
  9. Lin, X.; Chen, Z.; Liu, X.; Chu, K.; Morita, K.; Matsuoka, R.; Ito, S. Natural insulator contamination test results on various shed shapes in heavy industrial contamination areas. IEEE Trans. Electr. Insul. 1992, 27, 593–600. [Google Scholar] [CrossRef]
  10. Park, J.-Y.; Lee, J.-K.; Cho, B.-H.; Oh, K.-Y. An inspection robot for live-line suspension insulator strings in 345-kV power lines. IEEE Trans. Power Deliv. 2012, 27, 632–639. [Google Scholar] [CrossRef]
  11. Nguyen, V.N.; Jenssen, R.; Roverso, D. Intelligent monitoring and inspection of power line components powered by UAVs and deep learning. IEEE Power Energy Technol. Syst. J. 2019, 6, 11–21. [Google Scholar] [CrossRef]
  12. Liu, J.; Hu, M.; Dong, J.; Lu, X. Summary of insulator defect detection based on deep learning. Electr. Power Syst. Res. 2023, 224, 109688. [Google Scholar] [CrossRef]
  13. Zhou, M.; Wu, T.; Xia, Z.; He, B.; Kong, L.B.; Su, H. Research progress in deep learning for ceramics surface defect detection. Measurement 2025, 242, 115956. [Google Scholar] [CrossRef]
  14. Kumar, C.; Ganguly, B.; Dey, D.; Chatterjee, S. Wavelet-based convolutional neural network for denoising partial discharge signals extracted via acoustic emission sensors. IEEE Sens. Lett. 2024, 8, 1–4. [Google Scholar] [CrossRef]
  15. Zou, Z.; Qiu, H.; Wang, Z.; Liu, Z.; Kuang, C. An ultrasonic phased array method for detecting the internal defects in composite insulators by using the concave probe. IEEE Trans. Dielectr. Electr. Insul. 2025, 32, 541–550. [Google Scholar] [CrossRef]
  16. Xiang, Z.; Xing, A.; Li, W.; Zhang, K.; Dang, Q.; Hui, D.; Yang, L. Research on zero-value insulator detection method for transmission lines based on axial and radial electric field distortion characteristics. In Proceedings of the 7th International Conference on Energy Systems and Electrical Power (ICESEP), Wuhan, China, 20–22 June 2025; pp. 1163–1169. [Google Scholar]
  17. Pei, S.; Zhang, H.; Liu, Y.; Yang, R.; Hu, C.; Yang, W. An efficient method to extract the axial temperature curve from infrared image of porcelain insulator string. IEEE Trans. Power Deliv. 2024, 39, 2592–2602. [Google Scholar] [CrossRef]
  18. Jin, L.; Tian, Z.; Ai, J.; Zhang, Y.; Gao, K. Condition evaluation of the contaminated insulators by visible light images assisted with infrared information. IEEE Trans. Instrum. Meas. 2018, 67, 1349–1358. [Google Scholar] [CrossRef]
  19. Wang, S.; Lv, F.; Liu, Y. Estimation of discharge magnitude of composite insulator surface corona discharge based on ultraviolet imaging method. IEEE Trans. Dielectr. Electr. Insul. 2014, 21, 1697–1704. [Google Scholar] [CrossRef]
  20. Ai, J.Y.; Jin, L.J. Rod porcelain insulator filth state detection of catenary based on ultraviolet image. Trans. China Electrotech. Soc. 2016, 31, 112–118. [Google Scholar]
  21. Liu, Y.; Guo, Y.; Fan, Y.; Zhou, J.; Li, Z.; Xiao, S.; Zhang, X.; Wu, G. Research on optical imaging technology application in transmission line insulator monitoring: A review. IEEE Trans. Dielectr. Electr. Insul. 2024, 31, 3120–3132. [Google Scholar] [CrossRef]
  22. Reddy, S.A.; Kumari, M.S. A review of switching overvoltage modeling in UHV AC transmission lines. Electr. Power Syst. Res. 2024, 236, 110902. [Google Scholar] [CrossRef]
  23. Huang, D.; Shu, Y.; Ruan, J.; Hu, Y. Ultra high voltage transmission in China: Developments, current status and future prospects. Proc. IEEE 2009, 97, 555–583. [Google Scholar] [CrossRef]
  24. Jing, L.; Guo, X.; Nie, Y.; Su, S. Effects analysis of phase sequence arrangement on electromagnetic environment in 1000 kV same-tower double-circuit ultra-high voltage AC transmission lines. In Proceedings of the IEEE 2nd International Conference on Power Science and Technology (ICPST), Yunnan, China, 9–11 May 2024; pp. 321–325. [Google Scholar]
  25. Samy, M.M.; Radwan, R.M.; Akef, S. Calculation of electric fields underneath and on conductor surfaces of ultra high voltage transmission lines. In Proceedings of the IEEE International Conference on Environment and Electrical Engineering & IEEE Industrial and Commercial Power Systems Europe, Milan, Italy, 6–9 June 2017; pp. 1–8. [Google Scholar]
  26. Yang, Z.; He, D.; Ding, L. The optimization study for electromagnetic radiation with ultrahigh voltage transmission lines. IEEE Trans. Electromagn. Compat. 2022, 64, 1480–1492. [Google Scholar] [CrossRef]
  27. Du, B.X.; Li, Y.P.; Liu, Y. Hydrophobicity evaluation of silicone rubber insulator using DC discharge induced acoustic wave. IEEE Trans. Dielectr. Electr. Insul. 2013, 20, 1836–1844. [Google Scholar] [CrossRef]
  28. Chaudhuri, S.; Ghosh, S.; Dey, D.; Munshi, S.; Chatterjee, B.; Dalai, S. Denoising of partial discharge signal using a hybrid framework of total variation denoising-autoencoder. Measurement 2023, 223, 113674. [Google Scholar] [CrossRef]
  29. Boczar, T.; Borucki, S.; Cichoń, A.; Lorenc, M. Time-frequency analysis of the AE signals generated by PDs on bushing and stand-off insulators. Arch. Acoust. 2014, 31, 325–333. [Google Scholar]
  30. Al-geelani, N.A.; Piah, M.A.M.; Shaddad, R.Q. Characterization of acoustic signals due to surface discharges on HV glass insulators using wavelet radial basis function neural networks. Appl. Soft Comput. 2012, 12, 1239–1246. [Google Scholar] [CrossRef][Green Version]
  31. Nyamupangedengu, C.; Luhlanga, L.; Letlape, T. Acoustic and HF detection of defects on porcelain pin insulators. In Proceedings of the IEEE Power Engineering Society Conference and Exposition—Africa, Johannesburg, South Africa, 16–20 July 2007; pp. 1–5. [Google Scholar]
  32. Hao, Y.; Zheng, Y.; He, W.; Liang, X.; Zhang, Z.; Liu, L.; Yang, L.; Wang, G.; Gao, C.; Zhou, F. A measurement method of ultrasonic critical refraction longitudinal wave for thermal stress in GIS basin-type insulators. IEEE Trans. Instrum. Meas. 2022, 71, 1–9. [Google Scholar] [CrossRef]
  33. Lutfi, A.; El-Hag, A.; Shaban, K. Nonintrusive ultrasonic sensing and deep learning for outdoor ceramic insulator assessment. IEEE Trans. Dielectr. Electr. Insul. 2024, 31, 2993–3000. [Google Scholar] [CrossRef]
  34. Alshalawi, A.H.; Al-Ismail, F.S. Partial discharge detection based on ultrasound using optimized deep learning approach. IEEE Access 2024, 12, 5151–5162. [Google Scholar] [CrossRef]
  35. Ranachowski, P.; Rejmund, F.; Ranachowski, Z.; Jaroszewski, M.; Pospieszna, J.; Wieczorek, K. Acoustic investigations of long-rod insulators and their material properties. IEEE Trans. Dielectr. Electr. Insul. 2010, 17, 81–88. [Google Scholar] [CrossRef]
  36. Stefenon, S.F.; Freire, R.Z.; Meyer, L.H.; Corso, M.P.; Sartori, A.; Nied, A.; Klaar, A.C.R.; Yow, K.-C. Fault detection in insulators based on ultrasonic signal processing using a hybrid deep learning technique. IET Sci. Meas. Technol. 2020, 14, 953–961. [Google Scholar] [CrossRef]
  37. Wu, S.; Wang, L.; Song, B.; Gao, J. Live-line detection of deteriorated insulators on overhead transmission lines based on electric field distribution. IEEE Sens. J. 2024, 24, 1687–1695. [Google Scholar] [CrossRef]
  38. Zhou, F.; Chai, Z.; Diao, Y.; Long, Z. Research on measurement techniques for integrated optical waveguide-based electric field sensors. IEEE Access 2025, 13, 90983–90990. [Google Scholar] [CrossRef]
  39. Shen, X.; Jiang, X.; Cheng, Y.; MacAlpine, M. A novel method for live detection of faulty direct current insulators. IEEE Trans. Power Deliv. 2008, 23, 24–30. [Google Scholar] [CrossRef]
  40. Dai, C.; Yin, Y.; Zhou, G.; Miao, L.; Wu, J. Space charge behavior in ethylene propylene rubber under a 50-Hz AC electric field. IEEE Access 2019, 7, 171995–172003. [Google Scholar] [CrossRef]
  41. Zhou, Z.; He, Z.; Zhou, X. Research on non-contact detection method of deteriorated insulators based on magnetic field measurement. In Proceedings of the International Conference on Artificial Intelligence and Power Systems (AIPS 2024), Chengdu, China, 19–20 April 2024; pp. 552–558. [Google Scholar]
  42. Wang, P.; Li, K.; Geng, J.; Jia, B.; Zhang, Z.; Liu, J. Study on space electric field of 110 kV faulty porcelain suspension insulator. Electr. Meas. Instrum. 2020, 57, 93–98. [Google Scholar]
  43. Jiang, X.; Xia, Q.; Hu, Q.; Shu, L. Influence of deteriorated insulator on the electric field distribution of overhang string. Proc. CSEE 2010, 30, 118–124. [Google Scholar]
  44. Gao, S.; Jia, J.; Huang, X.; Liu, Y.; Zhang, B.; Zhang, Y.; Geng, J. Research on electric field detection of degraded insulators based on a sensitive detection method under complex operating conditions. Appl. Sci. 2022, 12, 5680. [Google Scholar] [CrossRef]
  45. Xia, C.; Ren, M.; Wang, B.; Dong, M.; Xu, G.; Xie, J.; Zhang, C. Infrared thermography-based diagnostics on power equipment: State-of-the-art. High Volt. 2021, 6, 387–407. [Google Scholar] [CrossRef]
  46. Zhai, Y.; Chen, R.; Yang, Q.; Li, X.; Zhao, Z. Insulator fault detection based on spatial morphological features of aerial images. IEEE Access 2018, 6, 35316–35326. [Google Scholar] [CrossRef]
  47. Shafique, U.; Alam, S.M.; Rashid, U.; Javed, W.; Anwaar, H.; Malik, S.Z.; Ahmad, T.; Imtiaz, U.; Nzanywayingoma, F. Infrared thermography-based insulator fault classification via unsupervised clustering and semi-supervised learning. IEEE Access 2024, 12, 180781–180791. [Google Scholar] [CrossRef]
  48. Liu, J.; Liu, C.; Wu, Y.; Xu, H.; Sun, Z. An improved method based on deep learning for insulator fault detection in diverse aerial images. Energies 2021, 14, 4365. [Google Scholar] [CrossRef]
  49. He, H.; Hu, Z.; Wang, B.; Luo, D.; Lee, W.J.; Li, J. A contactless zero-value insulators detection method based on infrared images matching. IEEE Access 2020, 8, 133882–133889. [Google Scholar] [CrossRef]
  50. Liu, L.; Guo, C.; Xiang, Y.; Tu, Y.; Mei, H.; Wang, L.; Xuan, F.-Z. Health monitoring of RTV silicone rubber coating on insulators based on multimode features of active infrared thermography. IEEE Trans. Instrum. Meas. 2022, 71, 1–9. [Google Scholar] [CrossRef]
  51. Zheng, W.; Jia, L.; Huang, F. Vacuum-ultraviolet photon detections. Iscience 2020, 23, 101145. [Google Scholar] [CrossRef] [PubMed]
  52. Li, Z.; Li, L.; Jiang, X.; Hu, J.; Zhang, Z.; Zhang, W. Effects of different factors on electrical equipment UV corona discharge detection. Energies 2016, 9, 369. [Google Scholar] [CrossRef]
  53. Lu, F.; Wang, S.; Li, H. Insulator pollution grade evaluation based on ultraviolet imaging and fuzzy logic inference. In Proceedings of the 2010 Asia-Pacific Power and Energy Engineering Conference (APPEEC 2010), Chengdu, China, 28–31 March 2010; pp. 1–4. [Google Scholar]
  54. Zhou, W.; Li, H.; Yi, X.; Tu, J.; Yu, J. A criterion for UV detection of AC corona inception in a rod-plane air gap. IEEE Trans. Dielect. Elect. Insul. 2011, 18, 232–237. [Google Scholar] [CrossRef]
  55. Davari, N.; Akbarizadeh, G.; Mashhour, E. Intelligent diagnosis of incipient fault in power distribution lines based on corona detection in UV-Visible videos. IEEE Trans. Power Deliv. 2021, 36, 3640–3648. [Google Scholar] [CrossRef]
  56. Hu, Z.; Zhai, B.; Zhao, Z.; Zhai, Y.; Wang, Q.; Yang, K. State-space-model-guided deep feature perception network for insulator defect detection in high-resolution aerial images. IEEE Trans. Geosci. Remote Sens. 2025, 63, 1–14. [Google Scholar] [CrossRef]
  57. Xin, L.; Jin, H.; Tu, Y.; Yuan, Z.; Lv, Z.; Wang, C. Defect detection and characterization of RTV silicone rubber coating on insulator based on visible spectrum image. IEEE Trans. Power Deliv. 2020, 35, 2734–2736. [Google Scholar] [CrossRef]
  58. Jiskani, S.M.; Hussain, T.; Sahito, A.A.; Shaikh, F.; Kumar, L. Improving insulators detection accuracy via image enhancement techniques: Case of indigenous aerial image dataset. IEEE Access 2024, 12, 145582–145589. [Google Scholar] [CrossRef]
  59. Zheng, Y.; Guo, H.; Ren, J.; Du, Y.; Jia, L. Pollution level detection of insulators based on hyperspectral imaging and transformer model. In Proceedings of the 8th IEEE Conference on Energy Internet and Energy System Integration (EI2 2024), Shenyang, China, 29 November–2 December 2024; pp. 2415–2420. [Google Scholar]
  60. Liu, Y.; Wu, G.; Guo, Y.; Xiao, S.; Fan, Y.; Gao, G.; Zhang, X. A new noncontact detection method for assessing the aging state of composite insulators. IEEE Trans. Ind. Inform. 2024, 20, 6802–6813. [Google Scholar] [CrossRef]
  61. Wu, G.; Fan, Y.; Guo, Y.; Xiao, S.; Liu, Y.; Gao, G.; Zhang, X. Aging mechanisms and evaluation methods of silicone rubber insulator sheds: A review. IEEE Trans. Dielectr. Electr. Insul. 2024, 31, 965–979. [Google Scholar] [CrossRef]
  62. Li, Y.; Xie, C.; Gou, B.; Yu, S.; Yang, C. Terahertz detection of interface defects within composite insulators using a gated recurrent neural network. IEEE Trans. Dielectr. Electr. Insul. 2024, 31, 704–712. [Google Scholar] [CrossRef]
  63. Cheng, L.; Wang, L.; Mei, H.; Guan, Z.; Zhang, F. Research of nondestructive methods to test defects hidden within composite insulators based on THz time-domain spectroscopy technology. IEEE Trans. Dielectr. Electr. Insul. 2016, 23, 2126–2133. [Google Scholar] [CrossRef]
  64. Mei, H.; Jiang, H.; Yin, F.; Wang, L.; Farzaneh, M. Terahertz imaging method for composite insulator defects based on edge detection algorithm. IEEE Trans. Instrum. Meas. 2021, 70, 1–10. [Google Scholar] [CrossRef]
  65. Guo, C.; Xu, W.; Cai, M.; Duan, S.; Fu, J.; Zhang, X. A review: Application of terahertz nondestructive testing technology in electrical insulation materials. IEEE Access 2022, 10, 121547–121560. [Google Scholar] [CrossRef]
  66. Göcsei, G.; Németh, B.; Berta, I. Brittle fracture of high voltage composite insulators-a new method in inspection and detection. In Proceedings of the 2014 IEEE Electrical Insulation Conference (EIC), Philadelphia, PA, USA, 8–11 June 2014; pp. 213–217. [Google Scholar]
  67. Zhang, G.; Yang, W.; Zhao, H.; Cai, M.; Huang, T.; Zeng, D.; Yang, X. Defect detection on operating insulation spacer of GIS based on 3D X-ray digital imaging technology. High Voltage Appar. 2022, 58, 230–236. (In Chinese) [Google Scholar]
  68. Wang, N.; Wang, X.; Chen, P.; Jia, Z.; Wang, L.; Huang, R.; Lv, Q. Metal contamination distribution detection in high voltage transmission line insulators by laser-induced breakdown spectroscopy (LIBS). Sensors 2018, 18, 2623. [Google Scholar] [CrossRef]
  69. Qian, Z.; Ke, C.; Xu, M.; Zhao, D.; Wen, Q.; Zhao, Y. Automated real-time classification of silicone rubber insulator contamination via optimized LIBS and machine learning fusion. IEEE Trans. Power Deliv. 2026, 41, 252–256. [Google Scholar] [CrossRef]
  70. Qin, X.; Zhang, F.; Chen, S.; Wang, T.; Hong, X.; Wang, X.; Jia, Z. Characterization of hygroscopic insulator contamination via laser-induced breakdown spectroscopy (LIBS). IEEE Trans. Plasma Sci. 2021, 49, 1166–1172. [Google Scholar] [CrossRef]
  71. Tian, L.; He, Y.; Deng, Y.; Liu, Z.; Wang, Q.; Wang, X. Influence of low temperatures on laser-induced breakdown spectroscopy of silicon rubber insulators. IEEE Trans. Dielectr. Electr. Insul. 2024, 31, 3133–3139. [Google Scholar] [CrossRef]
  72. Mantach, S.; Lutfi, A.; Moradi Tavasani, H.; Ashraf, A.; El-Hag, A.; Kordi, B. Deep learning in high voltage engineering: A literature review. Energies 2022, 15, 5005. [Google Scholar] [CrossRef]
  73. Yeh, C.-T.; Thanh, P.N.; Cho, M.-Y. Real-time leakage current classification of 15kV and 25kV distribution insulators based on bidirectional long short-term memory networks with deep learning machine. IEEE Access 2022, 10, 7128–7140. [Google Scholar] [CrossRef]
  74. Kang, G.; Gao, S.; Yu, L.; Zhang, D. Deep architecture for high-speed railway insulator surface defect detection: De-noising autoencoder with multitask learning. IEEE Trans. Instrum. Meas. 2019, 68, 2679–2690. [Google Scholar] [CrossRef]
  75. Sampedro, C.; Rodriguez-Vazquez, J.; Rodriguez-Ramos, A.; Carrio, A.; Campoy, P. Deep learning-based system for automatic recognition and diagnosis of electrical insulator strings. IEEE Access 2019, 7, 101283–101308. [Google Scholar] [CrossRef]
  76. Ozcanli, A.K.; Baysal, M. Islanding detection in microgrid using deep learning based on 1D CNN and CNN-LSTM networks. Sustain. Energy Grids Netw. 2022, 32, 100839. [Google Scholar] [CrossRef]
  77. Karan, S.; Yeh, H.-G. Fault classification in microgrids using deep learning. In Proceedings of the 2020 IEEE Green Energy and Smart Systems Conference (IGESSC 2020), Long Beach, CA, USA, 2–3 November 2020; pp. 1–7. [Google Scholar]
  78. Wu, J.; Jing, R.; Bai, Y.; Tian, Z.; Chen, W.; Zhang, S.; Yu, F.R.; Leung, V.C.M. Small insulator defects detection based on multiscale feature interaction transformer for UAV-assisted power IoVT. IEEE Internet Things J. 2024, 11, 23410–23427. [Google Scholar] [CrossRef]
  79. Shi, W.; Caballero, J.; Huszar, F.; Totz, J.; Aitken, A.P.; Bishop, R.; Rueckert, D.; Wang, Z. Real-time single image and video super-resolution using an efficient sub-pixel convolutional neural network. In Proceedings of the IEEE Conference on Computer Vision and Pattern Recognition (CVPR), Las Vegas, NV, USA, 27–30 June 2016; pp. 1874–1883. [Google Scholar]
  80. Liu, Y.; Lai, T.; Liu, J.; Li, Y.; Pei, S.; Yang, J. Insulator contamination diagnosis method based on deep learning convolutional neural network. In Proceedings of the 3rd Asia Energy and Electrical Engineering Symposium (AEEES) 2021, Chengdu, China, 26–29 March 2021; pp. 184–188. [Google Scholar]
  81. Zheng, H.; Cui, Y.; Yang, W.; Li, J.; Ji, L.; Ping, Y.; Hu, S.; Chen, X. An infrared image detection method of substation equipment combining iresgroup structure and centernet. IEEE Trans. Power Deliv. 2022, 37, 4757–4765. [Google Scholar] [CrossRef]
  82. Li, J.; Han, X.; Liu, Z.; Yao, X. A novel GIS partial discharge detection sensor with integrated optical and UHF methods. IEEE Trans. Power Deliv. 2018, 33, 2047–2049. [Google Scholar] [CrossRef]
  83. Ma, X. Assessment Method of Pollution Class of Insulators Based on Infrared Images and Discharge Noise. Master’s Thesis, Chongqing University, Chongqing, China, 2023. [Google Scholar]
  84. Chen, H.; Shi, X.; Qin, Y.; Wang, H.; Han, X.; Li, J. A novel composite sensor for partial discharge ultrasound and UHF measurement inside GIS. In Proceedings of the IEEE Conference on Electrical Insulation and Dielectric Phenomena (CEIDP), Manchester, UK, 14–17 September 2025; pp. 156–159. [Google Scholar]
  85. Zhang, Z.; Zhang, W.; Zhang, D.; Xiao, Y.; Deng, J.; Xia, G. Comparison of different characteristic parameters acquired by UV imager in detecting corona discharge. IEEE Trans. Dielectr. Electr. Insul. 2016, 23, 1597–1604. [Google Scholar] [CrossRef]
  86. Song, C.; Xu, W.; Han, G.; Zeng, P.; Wang, Z.; Yu, S. A cloud edge collaborative intelligence method of insulator string defect detection for power IIoT. IEEE Internet Things J. 2021, 8, 7510–7520. [Google Scholar] [CrossRef]
  87. Jin, L.; Ding, W.; Han, S.; Wang, J. A real-time edge inference method for insulator contamination detection with YOLOv11-ssL. IEEE Trans. Instrum. Meas. 2025, 74, 1–15. [Google Scholar] [CrossRef]
  88. Esenogho, E.; Djouani, K.; Kurien, A.M. Integrating artificial intelligence internet of things and 5G for next-generation smart grid: A survey of trends challenges and prospect. IEEE Access 2022, 10, 4794–4831. [Google Scholar] [CrossRef]
  89. Macías, A.; Muñoz, D.; Navarro, E.; González, P. Data fabric and digital twins: An integrated approach for data fusion design and evaluation of pervasive systems. Inf. Fusion 2024, 103, 102139. [Google Scholar] [CrossRef]
  90. Liu, Y.; Ren, Y.; Lin, Q.; Yu, W.; Pan, W.; Su, A.; Zhao, Y. A digital twin-based assembly model for multi-source variation fusion on vision transformer. J. Manuf. Syst. 2024, 76, 478–501. [Google Scholar] [CrossRef]
  91. Sefercik, U.G.; Aydin, I.; Nazar, M. Generation of precise 3D building models for digital twin projects using multi-source data fusion and integration into virtual tours. ISPRS Open J. Photogramm. Remote Sens. 2025, 18, 100108. [Google Scholar] [CrossRef]
  92. Hwang, J.; Kim, J.; Yoon, S. DT-BEMS: Digital twin-enabled building energy management system for information fusion and energy efficiency. Energy 2025, 326, 136162. [Google Scholar] [CrossRef]
  93. Song, Y.; Xia, M.; Chen, Q.; Chen, F. A data-model fusion dispatch strategy for the building energy flexibility based on the digital twin. Appl. Energy 2023, 332, 120496. [Google Scholar] [CrossRef]
  94. Do, Y.; Zebrowitz, M.; Stahl, J.; Zhang, F. iFANnpp: Nuclear power plant digital twin for robots and autonomous intelligence. Ann. Nucl. Energy 2026, 227, 111993. [Google Scholar] [CrossRef]
  95. Wu, B.; Widanage, W.D.; Yang, S.; Liu, X. Battery digital twins: Perspectives on the fusion of models, data and artificial intelligence for smart battery management systems. Energy AI 2020, 1, 100016. [Google Scholar] [CrossRef]
  96. Xu, M. Research on 5G UAV smart grid inspection technology based on digital twin. In Proceedings of the 7th IEEE International Conference on Cloud Computing and Intelligent Systems (CCIS), Xi’an, China, 7–8 November 2021; pp. 367–370. [Google Scholar]
  97. Wang, J.; Bai, H.; Wang, S.; Ru, Q.; Yang, Q.; Yuan, J.; Zhou, L. Intelligent inspection and application of UAV cluster in the distribution network route. In Proceedings of the 13th International Conference on Power, Energy and Electrical Engineering (CPEEE), Tokyo, Japan, 25–27 February 2023; pp. 450–454. [Google Scholar]
  98. Wang, J.; Ding, X.; Meng, F. Application of digital twin in power grid inspection. In Proceedings of the 2023 IEEE 12th International Conference on Communication Systems and Network Technologies (CSNT), Bhopal, India, 8–9 April 2023; pp. 297–303. [Google Scholar]
  99. Liu, Q.; Liu, Y.; Yan, Y.; Jiang, Q.; Jiang, X. Addressing domain shift in insulator defect data: A generalization framework for cross-domain detection of broken and self-blast insulator defect. IEEE Trans. Instrum. Meas. 2025, 74, 1–14. [Google Scholar] [CrossRef]
  100. Zeng, W.; Cai, Y.; You, J. Unmanned aerial vehicle inspection and status assessment technology for transmission lines based on digital twins. In Proceedings of the 2025 International Conference on Energy Technology and Electrical Engineering (ETEE), Shenyang, China, 15–17 August 2025; pp. 335–338. [Google Scholar]
  101. Medved, D.; Pavlík, M.; Zbojovský, J. Computer modeling of electromagnetic field around the 22 kV high voltage overhead lines. In Proceedings of the 2018 International IEEE Conference and Workshop in Óbuda on Electrical and Power Engineering (CANDO-EPE 2018), Budapest, Hungary, 20–21 November 2018; pp. 289–294. [Google Scholar]
  102. Li, P.; He, L.; Gan, L.; Xie, T.; Shen, H.; Wu, T. Review of research on the entry path and safety assessment of equipotential live working on EHV/UHV transmission lines. J. Electr. Power Sci. Technol. 2025, 1–18. (In Chinese) [Google Scholar]
  103. Xie, H.; Cui, X.; Wan, B.; Zhang, J. Statistical analysis of radio interference of 1000 kV UHV AC double-circuit transmission lines in foul weather. CSEE J. Power Energy Syst. 2016, 2, 47–55. [Google Scholar] [CrossRef]
  104. Wan, B.; Liu, X.; Liu, J.; Gan, Z.; He, W.; Chen, Q. Radio interference performances of large section AC conductors at high altitude location. In Proceedings of the 2021 IEEE 4th International Electrical and Energy Conference (CIEEC), Wuhan, China, 28–30 May 2021; pp. 1–4. [Google Scholar]
  105. Li, Q.; Rowland, S.M. The vibration characteristics of rain droplet on the surface of the overhead line conductors. In Proceedings of the 2018 IEEE 2nd International Electrical and Energy Conference (CIEEC), Beijing, China, 4–7 November 2018; pp. 633–636. [Google Scholar]
  106. He, W.; Wan, B.; Liu, Y.; Huang, S.; Zhang, J.; Liu, X.; Xu, J. Effect of rain intensity on radio interference of HVAC conductor bundles at high-altitude location. IEEE Trans. Electromagn. Compat. 2021, 63, 606–613. [Google Scholar] [CrossRef]
  107. Rajamani, P.; Aravind, K.A.; Rao, K.R.; Sandhya, K.; Nirgude, P. Experimental studies on radio interference of 1200 kV unipolar UHV DC transmission line. In Proceedings of the 2019 International Conference on High Voltage Engineering and Technology (ICHVET), Hyderabad, India, 7–8 February 2019; pp. 1–4. [Google Scholar]
  108. Liu, Y.; Zhou, L.; Liu, Y.; Yuan, H.; Ji, L.; Wang, Q. Analysis on the spectrum characteristic of corona current and its relationship with radio interference on UHVDC transmission line. IEEE Trans. Dielectr. Electr. Insul. 2016, 23, 3336–3345. [Google Scholar] [CrossRef]
  109. Nakano, Y.; Sunaga, Y. Availability of corona cage for predicting audible noise generated from HVDC transmission line. IEEE Trans. Power Deliv. 1989, 4, 1422–1431. [Google Scholar] [CrossRef]
  110. Cladt, J.; Gary, C. Predetermination of corona losses under rain: Experimental interpreting and checking of a method to calculate corona losses. IEEE Trans. Power Appar. Syst. 1970, PAS-89, 853–860. [Google Scholar] [CrossRef]
  111. GB 50790-2013; Code for Designing of ±800 kV DC Overhead Transmission Line. China Planning Press: Beijing, China, 2013. (In Chinese)
  112. GB 3096-2008; Environmental Quality Standards for Noise. China Environmental Science Press: Beijing, China, 2008. (In Chinese)
  113. Peng, C.; Xie, L.; Pei, X.; Dong, X.; Xie, P. Corona discharge characteristics and size optimization of large fittings for ultra-high voltage transmission lines up to 4800 m. IEEE Open J. Ind. Appl. 2025, 6, 799–808. [Google Scholar] [CrossRef]
  114. Xiu, L.; Du, Z.; Cai, H.; Yue, G.; He, J.; Lian, H. Analysis and computation of total electric field under UHVDC transmission lines with drizzle weather. IEEE Trans. Dielectr. Electr. Insul. 2024, 31, 980–987. [Google Scholar] [CrossRef]
  115. Nosratabadi, S.M.; Hooshmand, R.-A.; Gholipour, E. A comprehensive review on microgrid and virtual power plant concepts employed for distributed energy resources scheduling in power systems. Renew. Sustain. Energy Rev. 2017, 67, 341–363. [Google Scholar] [CrossRef]
  116. Alotaibi, I.; Abido, M.A.; Khalid, M.; Savkin, A.V. A comprehensive review of recent advances in smart grids: A sustainable future with renewable energy resources. Energies 2020, 13, 6269. [Google Scholar] [CrossRef]
  117. Arafat, M.Y.; Hossain, M.J.; Alam, M.M. Machine learning scopes on microgrid predictive maintenance: Potential frameworks, challenges, and prospects. Renew. Sustain. Energy Rev. 2024, 190, 114088. [Google Scholar] [CrossRef]
  118. Zhou, Z.; Zhang, C.; Xu, C.; Xiong, F.; Zhang, Y.; Umer, T. Energyefficient industrial internet of UAVs for power line inspection in smart grid. IEEE Trans. Ind. Inform. 2018, 14, 2705–2714. [Google Scholar] [CrossRef]
  119. Guo, H.; Liu, J. UAV-enhanced intelligent offloading for internet of things at the edge. IEEE Trans. Ind. Inform. 2020, 16, 2737–2746. [Google Scholar] [CrossRef]
  120. Samir, M.; Sharafeddine, S.; Assi, C.M.; Nguyen, T.M.; Ghrayeb, A. UAV trajectory planning for data collection from time-constrained IoT devices. IEEE Trans. Wirel. Commun. 2020, 19, 34–46. [Google Scholar] [CrossRef]
Figure 1. Common insulator faults: (a) electrical ablation, (b) surface cracks, (c) natural contamination accumulation, (d) porosity and fractures [1], (e) aging of composite insulating materials.
Energies 19 00636 g001
Figure 2. Waveform diagrams of noise signals and interference signals: (a) noise signal caused by insulation contamination, (b) interference signal of clean insulators.
Energies 19 00636 g002
Figure 3. Schematic of surface electric field detection [38] (licensed under CC BY-NC-ND 4.0).
Energies 19 00636 g003
Figure 4. Infrared detection for identifying zero-value insulators.
Energies 19 00636 g004
Figure 5. Ultraviolet detection under different discharge conditions: (a) no obvious discharge, (b) local corona discharge, (c) incipient flashover.
Energies 19 00636 g005
Figure 6. Overall structure of the CNN [34] (licensed under CC BY-NC-ND 4.0).
Energies 19 00636 g006
Figure 7. Test accuracy percentages of different models [34] (licensed under CC BY-NC-ND 4.0).
Energies 19 00636 g007
Figure 8. General structure of bidirectional long short-term memory network to classify the leakage current [73] (licensed under CC BY-NC-ND 4.0).
Energies 19 00636 g008
Figure 9. Accuracy comparison in classification between data modes and neural networks [73] (licensed under CC BY-NC-ND 4.0).
Energies 19 00636 g009
Figure 10. Comparison of three anomaly detection methods (data from [74]).
Energies 19 00636 g010
Figure 11. Comparison of test results of different frameworks [75] (licensed under CC BY-NC-ND 4.0).
Energies 19 00636 g011
Figure 12. Flow chart of assessment results integration by Ma [83].
Energies 19 00636 g012
Figure 13. Precision rates of single detection and multi-dimensional comprehensive detection (%) (data from [83]).
Energies 19 00636 g013
Figure 14. Logical view of digital twin-based intelligent detection for transmission lines.
Energies 19 00636 g014
Figure 15. Construction mileage of China’s UHV transmission lines in the past 15 years.
Energies 19 00636 g015
Table 1. Comparison of non-contact detection technologies.
Detection MethodSignal NatureAnti-Electromagnetic InterferenceDetection DistanceTechnology MaturityEquipment CostCore Applicable Scenarios
Acoustic WaveAcousticMedium<25 mPilot ApplicationMediumPartial discharge caused by defects; surface defects (cracks, contamination, etc.); insulation aging (auxiliary verification)
Electric FieldElectromagneticLow<1 mPilot ApplicationMediumUHV on-line inspection; detection of insulation performance degradation (zero-value, contaminated insulators, etc.)
InfraredOpticalHighUp to 100 mMature ApplicationMediumRapid inspection of abnormal temperature rise caused by insulator surface defects (large-scale inspection)
UltravioletOpticalHigh<50 mMature ApplicationMedium-HighEarly corona discharge identification and localization of defects (auxiliary)
Visible SpectrumOpticalHighUp to hundreds of metersMature ApplicationLowLow-cost on-line detection of surface defects (damage/contamination) (large-scale inspection)
Hyperspectral ImagingSpectralMediumCentimeter to meter scalePilot ApplicationHighQuantitative assessment of insulator contamination/aging levels
TerahertzSpectralMediumCentimeter scaleLaboratory StageHighDetection of internal core rod cracks/void defects in insulators
X-ray ImagingSpectralMediumCentimeter to meter scaleLaboratory StageHighDetection of internal insulation layer damage/metal corrosion
Laser-Induced Breakdown SpectroscopySpectralMediumCentimeter scalePilot ApplicationHighQuantitative detection of contamination elements on insulator surfaces
Table 2. Adaptability comparison of deep learning models.
Model TypeApplicable Data TypeCore AdvantagesLimitationsAdaptation to UHV Scenarios
Convolutional Neural Network (CNN)Images, PRPD patterns, grid-like signalsHigh efficiency in multi-scale feature extractionWeak in capturing temporal featuresImage denoising and defect localization under strong electromagnetic interference
Long Short-Term Memory (LSTM)Acoustic waves, discharge temporal signalsMining of dynamic temporal featuresHigh computational cost for long sequencesDistinction between corona discharge and defect signals
Autoencoder (AE)Low signal-to-noise ratio, small amount of labeled dataUnsupervised feature extraction, anomaly detectionWeak in fine-grained defect classificationRapid screening in large-scale operation and maintenance
Generative Adversarial Network (GAN)Scarce samples, cross-scenario dataSample generation, domain adaptive transferPoor training stabilityGeneralization across different insulator materials/voltage levels
Table 3. Comparison of frameworks for new-type detection technologies.
Evolution StageCore Technical ApproachTechnology MaturityCurrent BottlenecksFuture Optimization
Single-Modal EmpowermentDeep Learning Algorithm OptimizationRelatively mature, has entered the pilot research stagePoor generalization with small samples; difficult adaptation across materials and scenariosConstruct open-source dataset for transmission line insulator defects; develop lightweight edge computing models; optimize algorithm adaptability, generalization, and stability.
Multi-Dimensional Integrated DetectionMulti-Sensor Synchronous FusionStill in the stage of theoretical improvement and laboratory researchDifficult data registration; insufficient anti-interference shielding of sensors; urgent need to optimize algorithms and detection strategies; R&D of miniaturized and low-cost equipmentDevelop a highly efficient synchronous acquisition module; optimize multi-sensor anti-interference design.
Multi-Source Data-DrivenDigital Twin + Temporal Prediction ModelStill at the conceptual stageDifficult data synchronization and insufficient real-time performanceConstruct 5G + edge computing transmission architecture; establish full lifecycle database.
Table 4. Prospects of non-contact detection technology for insulators in UHV engineering.
SolutionCore ArchitectureRole of AI Intelligent AlgorithmsApplicable ScenariosCurrent Technology MaturityKey Challenges
Mobile Edge Intelligent InspectionUAV + visible light + infrared sensors, integrated with edge computing module to achieve “on-board real-time processing”Lightweight object detection models enable real-time identification and localization of insulation defects.Regular rapid inspection of large-scale lines, emergency defect investigation, complex terrain such as mountainous areasRelatively high: has entered the demonstration application phaseBalance of endurance, payload, and computing power; detection stability under complex weather conditions
Fixed Monitoring and Mobile Inspection CollaborationMulti-sensor fixed monitoring terminals deployed on towers, collaborating with UAV mobile inspection dataReal-time analysis of monitoring data, intelligently triggering UAVs for precise re-inspection of abnormal sectionsCritical crossing sections (e.g., river/railway crossings), heavy pollution/icing areas, regions with variable climateModerate; fixed monitoring technology is mature; collaboration mechanism is in pilot phase.Fusion analysis of multi-source heterogeneous data; processes and standards for collaborative operations
Multi-Modal Data Fusion DiagnosisUAV synchronously collects visible light, infrared, and ultraviolet images in a single mission.Visible light for shape inspection, infrared for heat detection, ultraviolet for corona measurement, improving diagnostic confidenceRefined diagnosis of suspected/reported defects, fault cause investigation, comprehensive evaluation of insulator conditionsModerate; multi-sensor is common, automatic fusion diagnosis algorithms are in R&D and verification phaseSynchronization and registration of massive data; generalization capability of fusion models
Fully Autonomous Swarm InspectionUAV swarm + robot collaboration: UAVs for aerial scanning; robots for close-range ground inspectionLarge model distillation lightweight technology empowers different platforms: autonomous path planning, target recognition, and task allocation.Ultra-long-distance fully autonomous unmanned inspection, full-area detection of large substations/converter stations, operations in signal-free areasLow; in key technology research and prototype verification phaseExtremely high system complexity; cross-platform collaborative control; long-distance energy supply
Disclaimer/Publisher’s Note: The statements, opinions and data contained in all publications are solely those of the individual author(s) and contributor(s) and not of MDPI and/or the editor(s). MDPI and/or the editor(s) disclaim responsibility for any injury to people or property resulting from any ideas, methods, instructions or products referred to in the content.