Article

Benchmarking Classical Metaheuristic Algorithms for Techno-Economic Optimisation of PV Battery Renewable Energy Systems

by
Sabelo N. Nhambe
1,
Peter M. Mashinini
1,* and
Bonginkosi A. Thango
2,*
1
Department of Mechanical and Industrial Engineering Technology, University of Johannesburg, Johannesburg 2092, South Africa
2
Department of Electrical and Electronic Engineering Technology, University of Johannesburg, Johannesburg 2092, South Africa
*
Authors to whom correspondence should be addressed.
Energies 2026, 19(18), 4445; https://doi.org/10.3390/en19184445 (registering DOI)
Submission received: 16 August 2026 / Revised: 11 September 2026 / Accepted: 16 September 2026 / Published: 19 September 2026

Abstract

Optimising grid-connected photovoltaic (PV)-battery renewable energy systems involves balancing economic performance, renewable energy use, and grid reliance. While HOMER Grid offers dependable optimisation, running multiple simulations for benchmarking algorithms is computationally costly. Surrogate-assisted optimisation presents a more efficient alternative for testing several algorithms under consistent conditions. This research evaluated six classic metaheuristics, Particle Swarm Optimisation (PSO), Genetic Algorithm (GA), Differential Evolution (DE), Grey Wolf Optimiser (GWO), Whale Optimisation Algorithm (WOA), and Stochastic Fractal Search Algorithm (SFSA), to find the most cost-effective techno-economic sizing of a PV battery system. Using a dataset of 272 core HOMER Grid cases, with 258 cases used for extended economic indicators, a distance-weighted k-nearest neighbour surrogate model was developed. All algorithms ran with the same population sizes, iteration limits, and independent repetitions. Their performance was assessed through solution quality, convergence behaviour, runtime, Friedman ranking, and Holm-adjusted Wilcoxon tests. The best design included a 7.799 kW PV array, 23 batteries, and a 2.560 kW converter, with a levelised cost of energy (LCOE) of R0.6149/kWh, a net present cost (NPC) of R52,401.45, a renewable fraction of 97.25%, and annual grid energy purchases of 216.26 kWh. Differential Evolution (DE) delivered the top average performance; SFSA was statistically comparable to DE (Holm-adjusted p = 0.999945), and PSO showed the fastest convergence with consistently near-optimal results. Overall, DE, SFSA, and PSO proved highly robust and effective, establishing a useful reference point for evaluating alternative surrogate-assisted PV battery optimisation approaches.

1. Introduction

Electricity generation, primarily relying on coal, gas, and oil, is a major contributor to global warming. These carbon-based fuels emit greenhouse gases into the atmosphere [1,2]. Renewable energy technologies offer a sustainable energy supply option that can significantly reduce fossil fuel use in electricity generation [2,3,4]. Interest in hybrid renewable energy systems (HRES), particularly photovoltaic (PV) and wind energy, has intensified in recent years in pursuit of a reliable and sustainable electricity supply, driven by growing energy demand due to urbanisation and industrialisation. The deployment of HRES is continuously growing [5,6]. These technologies offer off-grid electrification solutions, especially in remote areas and villages [7]. HRES are used for a variety of goals, including ensuring energy security, diversifying economies and energy sources, meeting rising energy demand, and promoting social and environmental welfare [8]. The selection and sizing of HRES components are designed to be cost-effective while meeting the environmental and geographical requirements [9]. When selecting the optimal configuration of an HRES, it is essential to consider multiple criteria, including economic, technical, and environmental performance [5]. The Hybrid Optimisation Model for Electric Renewable (HOMER) 1.1 software is widely used for designing and selecting cost-effective HRES because it efficiently performs optimisation and sensitivity analyses when assessing alternative system configurations [10,11]. HOMER is a cost-optimisation software; as a result, the optimal system is selected based on economic performance, with the configuration achieving the lowest LCOE or NPC chosen as the optimal system. While the LCOE and NPC are important economic indicators, the software does not account for the system’s environmental or thermodynamic aspects. Some systems, while having lower LCOE, may have higher Renewable Fractions (RF) and emissions, especially since HRES systems are often coupled with fossil fuel systems for stability [5]. In optimisation, metaheuristic algorithms have gained significant interest [12,13]. They are more popular for solving optimisation problems due to their simplicity and robust results, and are used across diverse fields such as engineering, business, transportation, and social sciences [14]. Metaheuristics are optimisation techniques that solve difficult problems by mimicking natural processes and iteratively refining candidate solutions [15]. Many of these algorithms are inspired by nature, including well-known methods like Genetic Algorithm (GA), Particle Swarm Optimisation (PSO), and Ant Colony Optimisation (ACO). However, not all evolutionary algorithms are purely nature-inspired; for example, Differential Evolution (DE) shares terminology with genetic algorithms but is generally not considered to be derived from nature [16]. While HOMER determines the best system configurations, running HOMER simulations multiple times during metaheuristic optimisation can be resource-intensive because each candidate solution requires a full hourly energy balance simulation. This computational load becomes particularly substantial when numerous algorithms and repeated optimisation runs are necessary.
To overcome this limitation, the study presents a surrogate-assisted optimisation framework using HOMER Grid-based techno-economic data. A validated local surrogate model replaces multiple HOMER simulations, allowing various classical metaheuristic algorithms to explore the same design space with consistent optimisation conditions. The proposed framework provides a consistent basis for comparing the algorithms by assessing their convergence behaviour, optimisation performance, computational efficiency, robustness, and statistical significance. This ensures that the benchmarking process is both fair and reproducible. This study compares six well-known classical metaheuristic algorithms to identify the most effective approach for optimising a grid-connected PV battery renewable energy system. The algorithms are evaluated using a composite fitness function that simultaneously reduces the LCOE, NPC, and electricity purchased from the grid while maximising the renewable energy use. Friedman ranking and Holm-adjusted Wilcoxon tests are used to provide objective evidence of each algorithm’s performance, establishing a solid baseline for future comparisons with new and hybrid optimisation methods.

1.1. Related Work

Metaheuristic algorithms provide effective search mechanisms; however, their population-based nature requires many objective evaluations, which become problematic when each evaluation requires a detailed simulation of an energy system over a long operating horizon. Zhang et al. [17] acknowledged that HRES design requires lifecycle simulation, which can be computationally costly.
Surrogate-assisted models have emerged as an attractive solution for addressing this issue. Surrogate models replace repeated simulations by training machine learning models on previously evaluated solutions, which are then used to approximate the objective function. In existing literature on surrogate-assisted evolutionary optimisation algorithms, the surrogate directly replaces expensive objective evaluations by approximating an aggregated single objective and/or classifying candidate solutions according to dominance relationships. This allows the algorithm to perform several inexpensive evaluations while reserving computationally costly simulations for selected validation.
Many studies have applied this concept, especially in energy systems problems. Srithapon et al. [18] developed a surrogate-assisted multi-objective framework for a distribution network comprising PV, a battery energy storage system, and electric vehicles. The surrogate used deep learning techniques to avoid repeated deterministic load flow calculations, while multi-objective DE performed the optimisation. The surrogate model adopted in this study reduced computational burden while retaining overall effective optimisation performance. Another author, Kaewdornhan et al. [19], used a deep neural network (DNN) surrogate model to develop a framework for multiple microgrid energy management. The surrogate model in their study reduced the computational cost of repeated power flow calculations. The studies by Srithapon et al. [18] and Kaewdornhan et al. [19] demonstrated the applicability of surrogate-assisted optimisation in renewable energy systems and more broadly to power system problems where high evaluation costs are prohibitive.
Zhang et al. [17] developed a surrogate-assisted multimodal multi-objective evolutionary algorithm (SaMMEA) for HRES using a Gaussian process (GP) surrogate model. This approach was motivated by the computational cost of long-term simulations and included model updating during evolutionary search. This study reported that the surrogate uncertainty tends to influence the search direction, which further demonstrates the importance of maintaining an accurate surrogate model for the optimal optimisation of the performance of metaheuristic optimisation algorithms. In recent years, surrogate-assisted optimisation has been extended to experimental and real-time energy management environments. Islam et al. [20] integrated surrogate-assisted optimisation with power-hardware-in-the-loop and smart grid systems, using physical replay to ensure that generated surrogate solutions remained physically feasible. Their study recorded a substantial reduction in the number of true value evaluations while maintaining stable optimisation behaviour. The study highlighted an important consideration in surrogate-assisted optimisation problems by demonstrating the balance between computational efficiency and the physical validity of surrogate predictions.
Several machine learning models have been used as surrogates. These include, but are not limited to, Gaussian Processes, radial basis functions (RBF), neural networks, random forests, and other regression approaches. Zhang et al. recognised machine learning models such as polynomial regression, RBF, neural networks, and GP as well-established surrogate approaches; however, they selected GP because of its high prediction accuracy and its ability to quantify prediction uncertainty, which is useful for guiding evolutionary searches. Other studies have argued that surrogate model performance is problem-dependent. Zhang et al. [21], for example, investigated surrogate-assisted DE for wave energy converter optimisation and compared neural network models with GP and RBF models. Their framework used surrogate predictions to reduce the computational cost of hydrodynamic calculations and employed model selection procedures to guide the optimisation process. Khoshgoftar Manesh et al. [22] further emphasised the importance of selecting the correct surrogate. The authors systematically compared linear regression, ridge regression, random forest, and gradient boosting for modelling six performance indicators of a steam thermal power plant. Gradient boosting provided the strongest predictive performance, with a reported coefficient of determination (R2) of 0.9912, and was subsequently integrated with the Non-dominated Sorting Genetic Algorithm third generation (NSGA-III), Multi-Objective Multi-Verse Optimiser (MOMVO), and Multi-Objective Grasshopper Optimisation Algorithm (MOGOA) for multi-objective optimisation. The resulting nonlinear economic and environmental responses showed that gradient boosting outperformed random forest, while all linear models lacked the representational capacity for more complex relationships. These findings indicate that surrogate selection should be based on the characteristics of the optimisation problem rather than assuming that one modelling technique is universally optimal. In a low-dimensional PV battery sizing problem, a local non-parametric model can provide an attractive alternative to more computationally intensive global models, particularly when the available simulation dataset is relatively small, and candidate solutions are expected to remain within the observed design domain.

1.2. Research Gap and Positioning of the Present Study

The reviewed articles reveal three key observations. First, HRES sizing optimisation problems are nonlinear and often involve multiple conflicting and/or competing techno-economic objectives. This makes metaheuristic optimisation algorithms highly attractive for solving nonlinear problems. Furthermore, the reviewed literature highlights the high computational cost of repeated simulations, which further strengthens the case for adopting surrogate-assisted models to reduce computational cost. Lastly, the performance of metaheuristic optimisation algorithms and surrogate models depends on the problem being solved; hence, algorithmic superiority cannot be inferred from isolated comparisons. A key gap exists in the literature, especially as regards the controlled benchmarking of classical algorithms for the surrogate-assisted techno-economic sizing of grid-connected PV battery energy systems. Most studies introduce improved algorithms, including hybrid algorithms with surrogate-assisted models, to demonstrate performance against a limited set of competitors. Furthermore, many existing surrogate-assisted studies address multi-objective Pareto-front generation, whereas the relative performance of classical PSO, GA, DE, GWO, WOA, and SFSA on a common techno-economic PV battery optimisation landscape has not been systematically established. Zhang et al. [1] specifically note that much of the HRES literature focuses on obtaining well-distributed Pareto fronts, with comparatively less attention paid to decision-space diversity and computational considerations. The present study addresses this gap by establishing a controlled benchmark in which six classical metaheuristic algorithms, including PSO, GA, DE, GWO, WOA, and SFSA, optimise the same surrogate-derived techno-economic landscape for a grid-connected PV battery system. The framework uses HOMER Grid simulation outputs as the underlying data source and a distance-weighted k-nearest neighbour surrogate to avoid repeatedly executing the computationally expensive simulation during optimisation. The six algorithms use identical population sizes, iteration limits, independent repetitions, design variables, and evaluation criteria, so performance differences can be attributed primarily to the algorithms’ search characteristics rather than unequal computational resources. The study further evaluates convergence, final fitness, runtime, robustness, nearest-observed validation, and non-parametric statistical differences. The methodological framework is consistent with the manuscript’s stated objective of establishing a reproducible classical benchmark for subsequent comparison with newer and hybrid optimisation approaches. Table 1 summarises the positioning of the proposed work and existing work in the literature.

1.3. Research Contributions of the Proposed Study

The main contributions of this study are summarised as follows:
This study develops a surrogate-assisted optimisation framework for benchmarking metaheuristic optimisation algorithms using techno-economic data derived from HOMER Grid, without repeating computational simulations;
This study uses six classical metaheuristic algorithms under similar optimisation settings to ensure a fair optimisation performance of each algorithm;
The proposed framework defines a composite multi-objective fitness function that simultaneously considers multiple conflicting factors to search for the most balanced system configuration among various feasible options;
The evaluation of performance in this study incorporates several validation steps, including statistical analyses such as Friedman ranking and Holm-adjusted Wilcoxon signed-rank tests, as well as the nearest-observed validation.

1.4. Novelty of the Proposed Study

Unlike most existing studies that repeatedly run HOMER simulations or test algorithms across different datasets and configurations, this research presents a unified benchmarking framework. In this setup, all algorithms are evaluated within the same validated design space under consistent computational conditions. The key innovation of this study is its methodology, which creates a solid foundation for the future optimisation of HRES through advanced computational intelligence techniques. The novel aspects of this study can be summarised as follows:
This study presents a novel techno-economic optimisation of a grid-connected PV battery renewable energy system using surrogate modelling with systematic benchmarking of classical metaheuristic algorithms;
The study also introduces a multi-objective composite fitness function that simultaneously optimises lifecycle cost, electricity cost, renewable energy use, and grid dependence, instead of concentrating on just one economic factor. This approach offers a more accurate depiction of the engineering design needs for grid-connected renewable energy systems;
This study uses nearest-observed validation to validate the metaheuristic-recommended solutions. This proves that the metaheuristic-recommended solutions correspond closely to the HOMER Grid feasible solutions. This validation step is not often incorporated in surrogate-assisted optimisation studies. Incorporating this step in this study enhanced confidence in the recommended system configuration;
The proposed framework of this study combines optimisation results with statistical validation using Friedman ranking and Holm-adjusted Wilcoxon signed-rank tests to provide subjective, defensible algorithm rankings. The strongest classical optimisers identified in this study can be used as a reproducible benchmark for future comparisons with recent and hybrid metaheuristic algorithms.

2. Theoretical Background

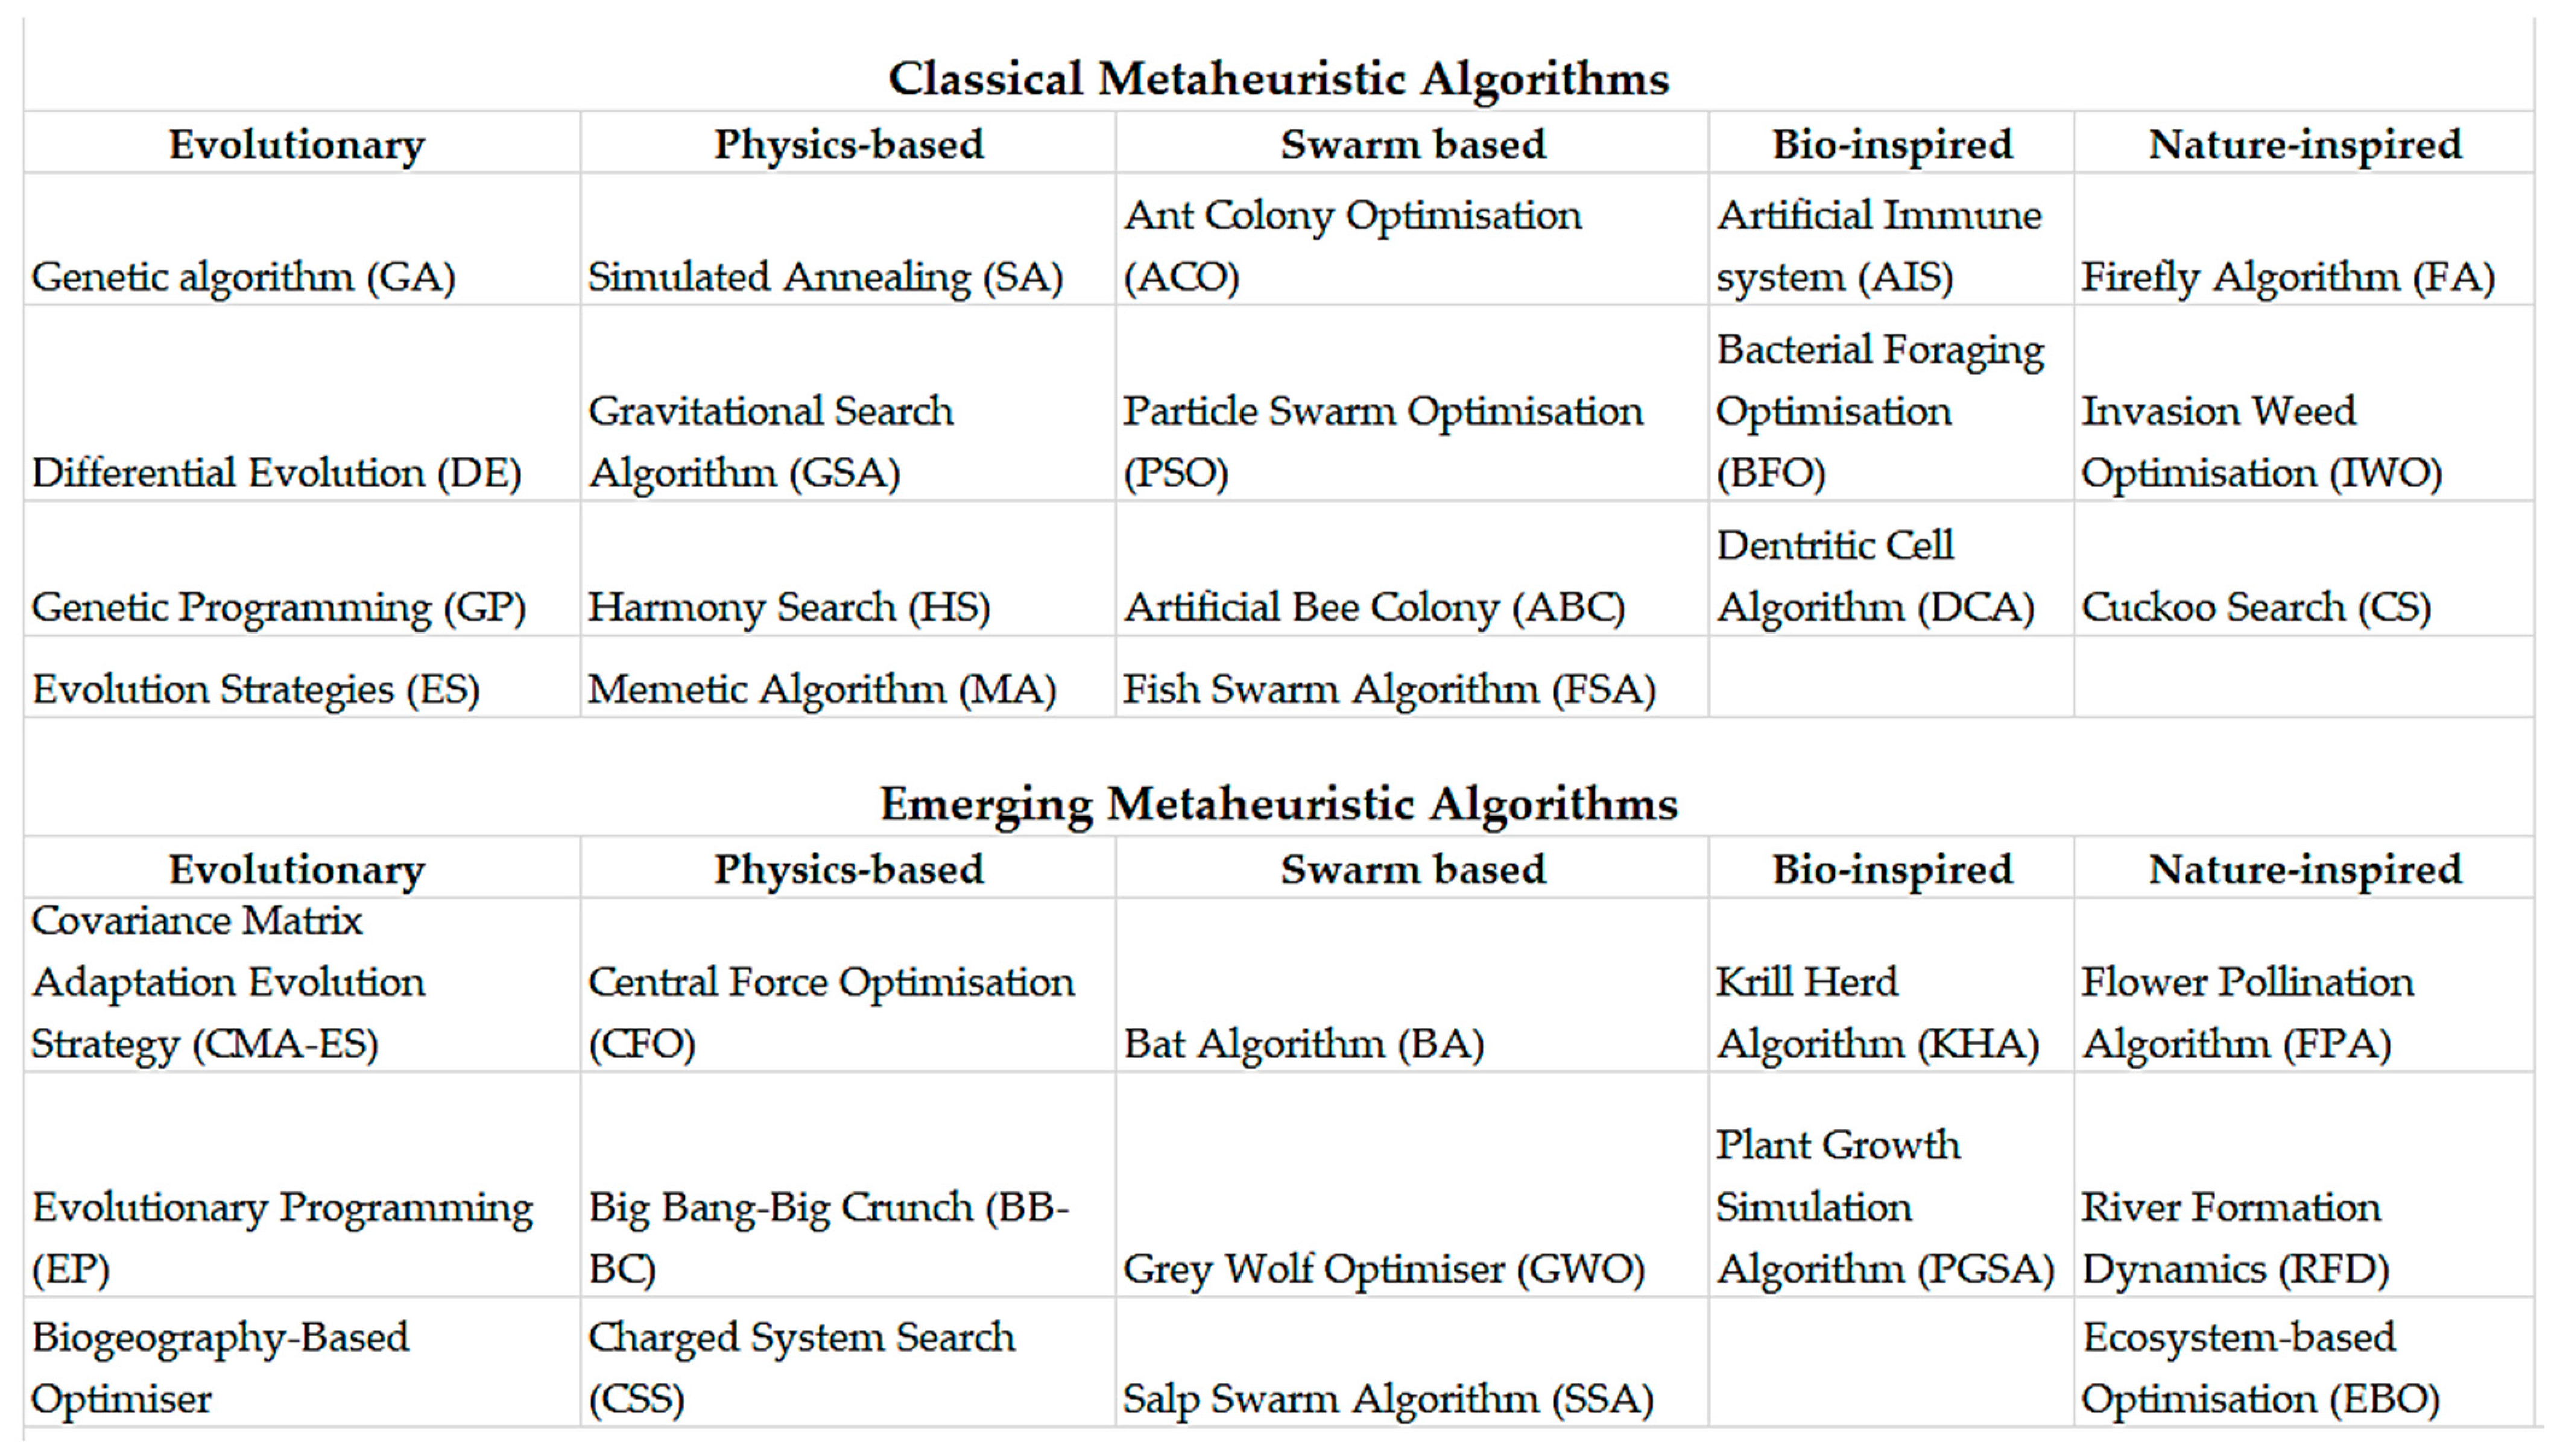
Metaheuristic algorithms are optimisation methods designed to find suitable solutions for a wide variety of problems. They differ from other techniques in several key ways [12]. First, they are derivative-free, meaning they do not rely on calculating derivatives in the search space, unlike gradient-based methods. This simplifies these algorithms, enhances their flexibility, and improves their ability to avoid getting stuck in local optima, making them effective for difficult problems [12,24]. Additionally, their stochastic nature involves starting the search with random initial conditions, which helps prevent premature convergence and enables more efficient exploration of the search space [12]. The metaheuristic is an iterative algorithm that guides and adjusts hierarchical heuristics by incorporating key variations to explore and modify the objective function. It uses adapted learning strategies to create memory problems and find reliable approximate solutions through analytical methods for designing memory content [25]. Metaheuristics are employed to address optimisation challenges by exploring optimal solutions for specific problems. This exploration often involves multiple agents working together as a system that evolves solutions through a set of rules or mathematical formulas over several iterations. The process continues until a solution satisfies a predefined criterion. The resulting solution, considered near-optimal, is referred to as optimal, and the system is regarded as having achieved a converged state [14]. Figure 1 represents the categories of different metaheuristic algorithms.
Many metaheuristic algorithms have been effectively applied to solve challenging problems. Aside from very large problem sizes, their advantage lies in delivering the best results in the shortest time. Metaheuristics are methods for identifying optimal solutions with minimal computational effort. Essentially, they consist of advanced techniques designed to enhance the efficiency of heuristic processes [26]. In contrast, metaheuristic algorithms are optimisation methods inspired by nature, known for their robustness and adaptability when tackling complex, high-dimensional challenges. Unlike deterministic approaches, they do not rely on gradient information and can avoid getting trapped in local optima, making them well-suited for non-convex, discrete, and combinatorial problems typical in renewable energy systems. Commonly, three main types of optimisation problems are encountered: combinatorial (discrete) problems, continuous (continuous variable) problems, and mixed problems [27].

State-of-the-Art Hybrid Renewable Energy Systems Optimisation

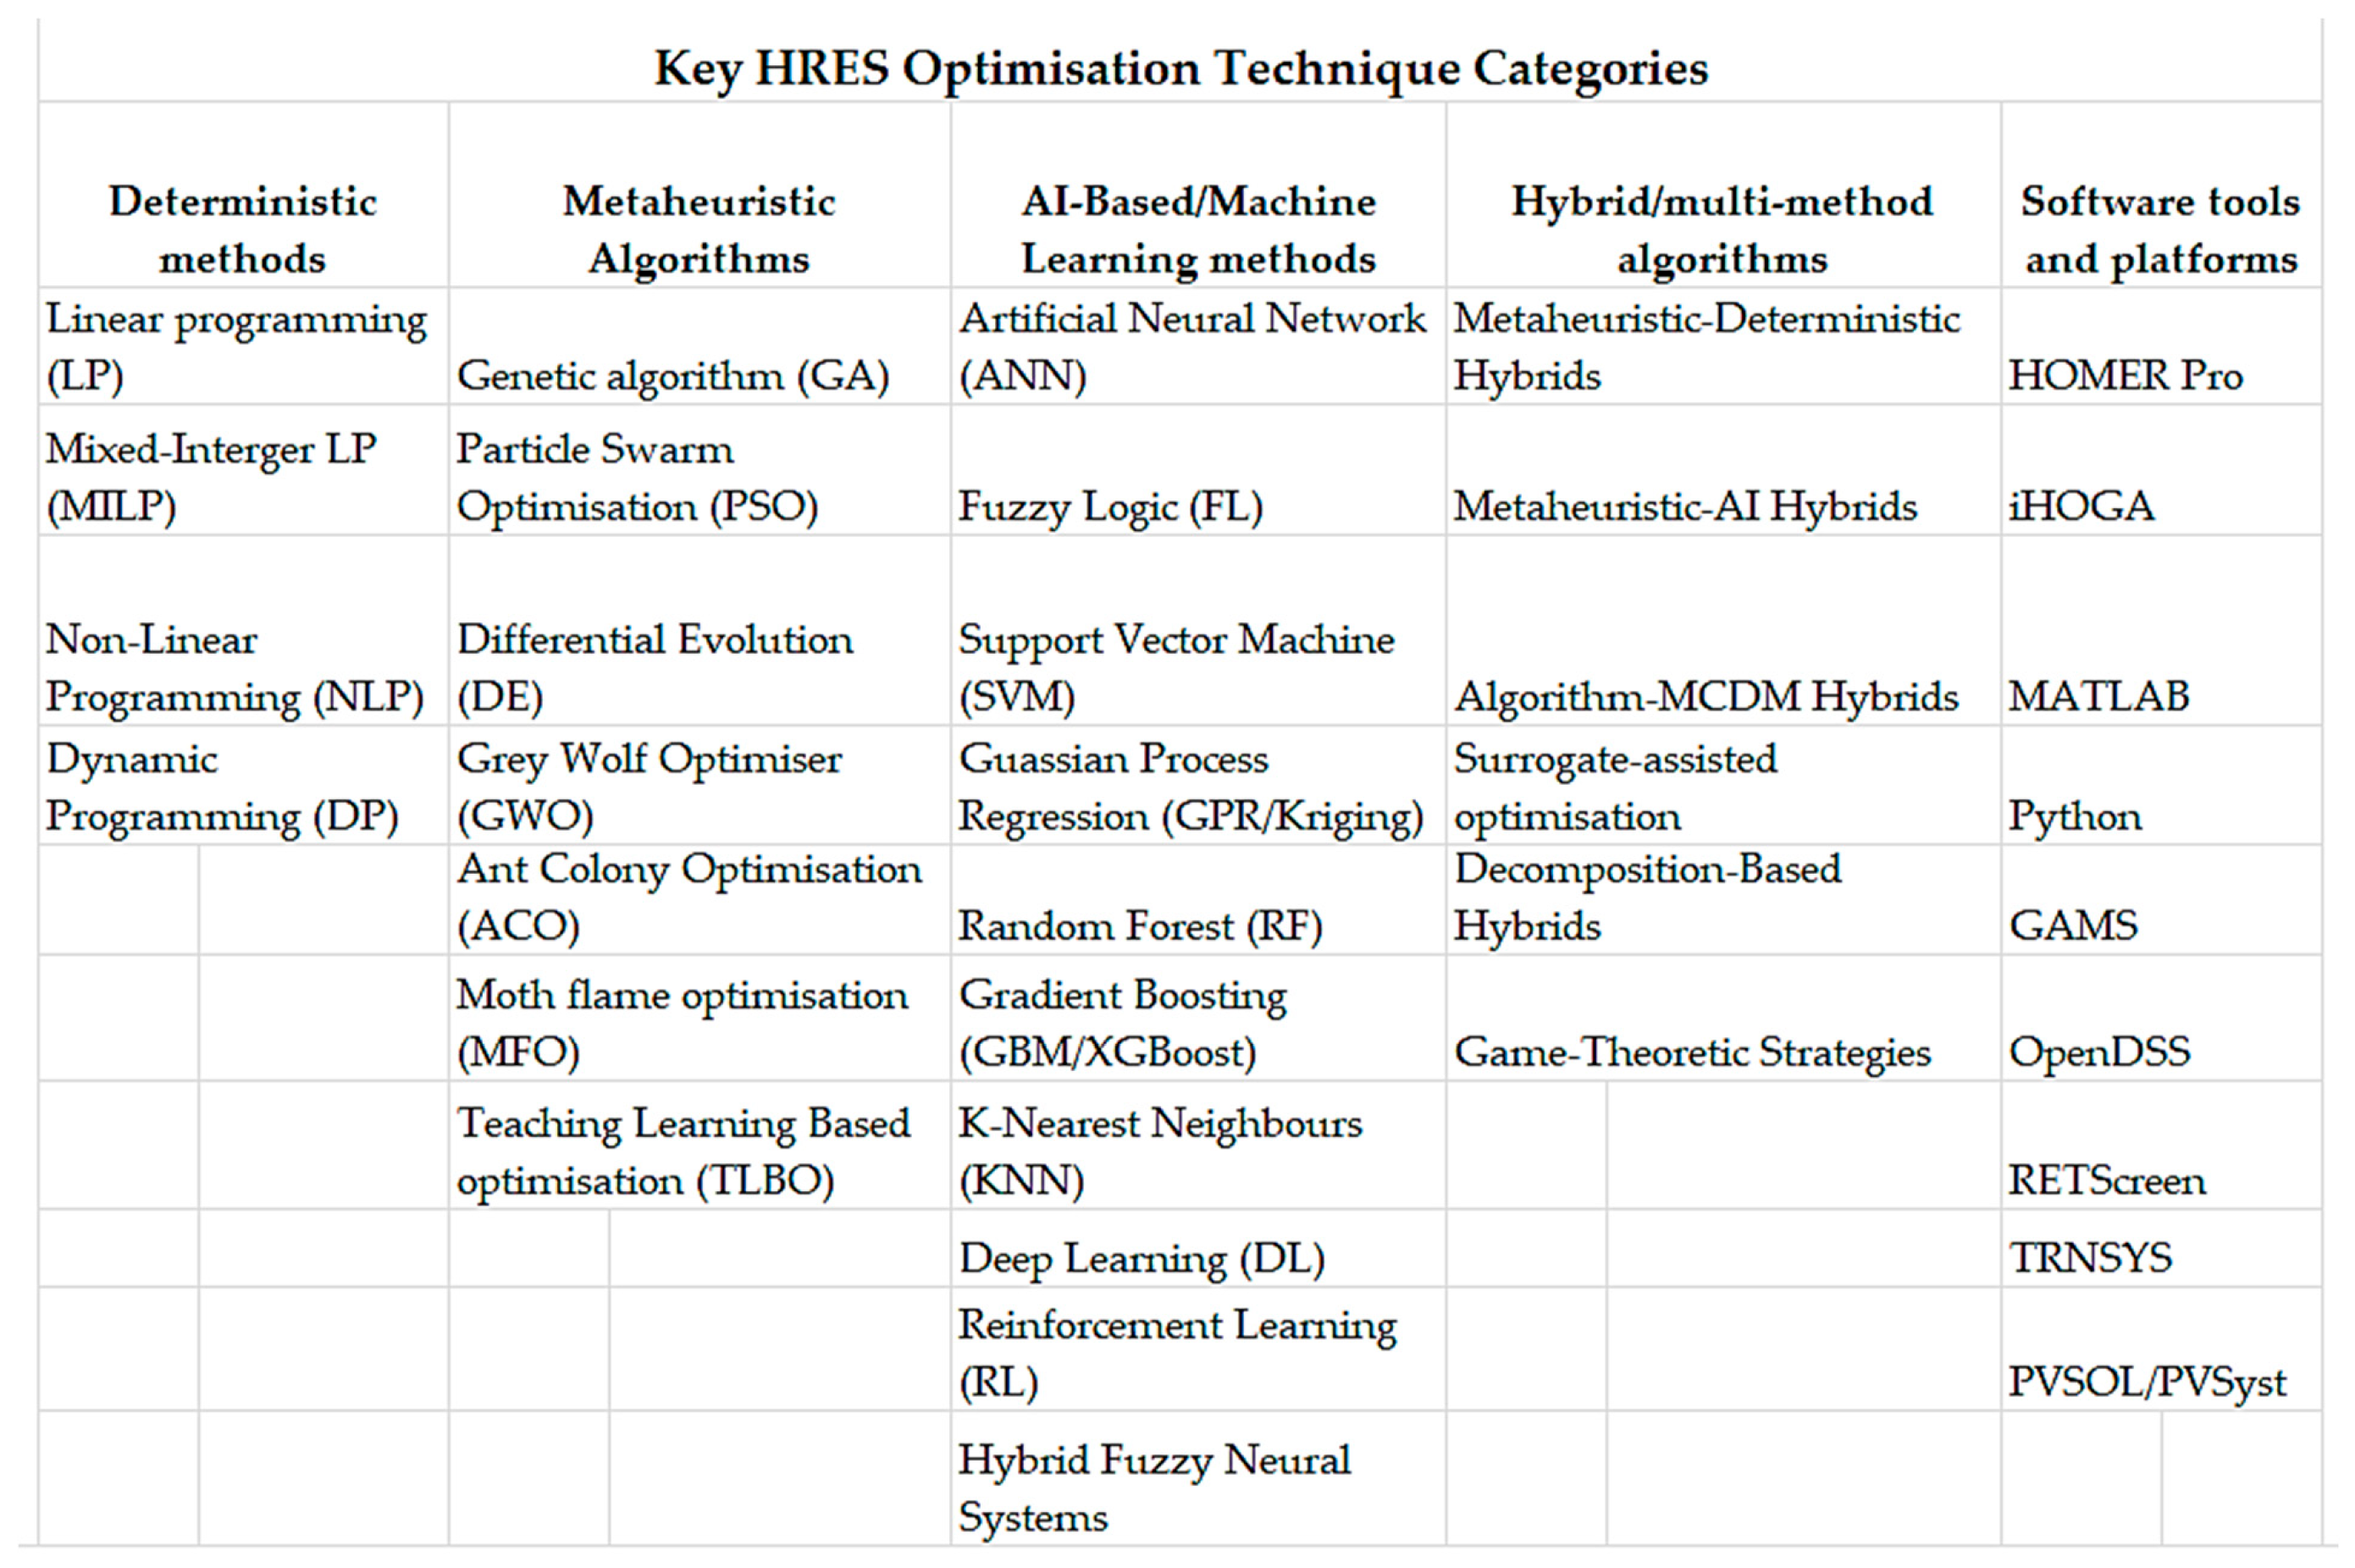
Traditional optimisation techniques such as Linear Programming (LP), Mixed-Integer Linear Programming (MILP), Nonlinear Programming (NLP), and Dynamic Programming (DP) have been used extensively in energy systems problems. These approaches work well when the problem is clearly defined and mathematically structured. For example, MILP is commonly used for unit commitment and economic dispatch because it can handle both continuous and discrete variables. Nonetheless, they face notable challenges when addressing large-scale, nonlinear, multimodal, or multi-objective issues, especially under the uncertainty and intermittency typical of renewable energy sources. These methods are often sensitive to initial conditions and depend on assumptions such as convexity and differentiability, which may not always reflect real-world complexities [27]. Optimisation is essential for boosting the sustainability and efficiency of renewable energy sources. It improves resource use, increases system reliability, and reduces economic and environmental costs. The existing HRES optimisation techniques reported in the literature are presented in Figure 2. Metaheuristic algorithms have become popular in renewable energy research because they effectively address complex, nonlinear, and multi-objective problems. These algorithms are especially valuable in situations where traditional methods fail to find optimal solutions amid uncertainty, such as in hybrid system sizing, real-time energy management, and maximum power point tracking (MPPT) [27]. Key categories of HRES optimisation techniques are presented in Figure 2.
Optimising HRESs is often complex due to the intermittency of renewable energy sources. Recently, artificial intelligence (AI) and surrogate modelling techniques have been integrated into the optimisation processes of HRESs. Machine learning (ML) models, including artificial neural networks (ANNs), random forests, Gaussian process regression, support vector regression, and k-nearest neighbours, among others, are increasingly used to optimise energy systems [28,29]. These models replace repeated simulations with accurate surrogate models. These models can find and evaluate candidate solutions with less computational cost while retaining high prediction accuracy. Recently, surrogate-assisted metaheuristic algorithms have emerged as an important research direction for the optimisation of HRES [28]. Although advanced efforts have been made in this area, a research gap still exists. Many studies report only the final optimal solution, without analysing convergence behaviour, computational efficiency, robustness, repeatability, or statistical significance. There is a growing need for standardised benchmarking frameworks to evaluate the performance of optimisation algorithms under consistent conditions and enable statistical validation. These frameworks would provide objective, reliable evidence of the performance of these algorithms and could facilitate fair comparisons among classical, hybrid, and newly developed metaheuristic algorithms [29]. Table 2 represents the existing optimisation techniques and their application in HRES.
This study aims to address limitations identified in the literature by developing a surrogate-assisted benchmarking framework for optimising hybrid renewable energy systems. Six classical metaheuristic algorithms are evaluated under the same computational conditions using the HOMER Grid-derived dataset. Unlike studies in the literature, the proposed study incorporates a multi-objective fitness function, nearest-observed validation, and non-parametric statistical analyses using the Friedman ranking and the Holm-adjusted Wilcoxon signed-rank test. The methodology adopted in this study aims to establish a reproducible benchmark for evaluating classical metaheuristic optimisation algorithms.

3. Methodology

3.1. HOMER Grid Optimisation Methodology

This section describes the methodological framework adopted in this study to optimise a grid-connected PV battery renewable energy system using HOMER Grid. The simulations were carried out using HOMER Grid version 1.11.4.

3.2. Study Location

This study investigates the techno-economic feasibility of a grid-connected PV battery system for a small household in Soweto, Johannesburg, South Africa. The coordinates of the study location are 26°14′9″ S, 27°51′2″ E, approximately 20 kilometres southwest of central Johannesburg. Soweto is home to over 1.5 million residents in the Gauteng province. The utility company has often reported electricity theft or meter tampering by Soweto residents, leading it to cut off electricity to most parts of the township. Most Soweto residents cannot afford electricity because of high tariffs set by the City of Johannesburg Metropolitan Municipality. Soweto was selected for the study because of its experience with load-shedding, low-income households’ inability to afford electricity, and a constrained grid driven by high electricity demand from both residential and industrial zones.

3.3. Load Profile Characteristics

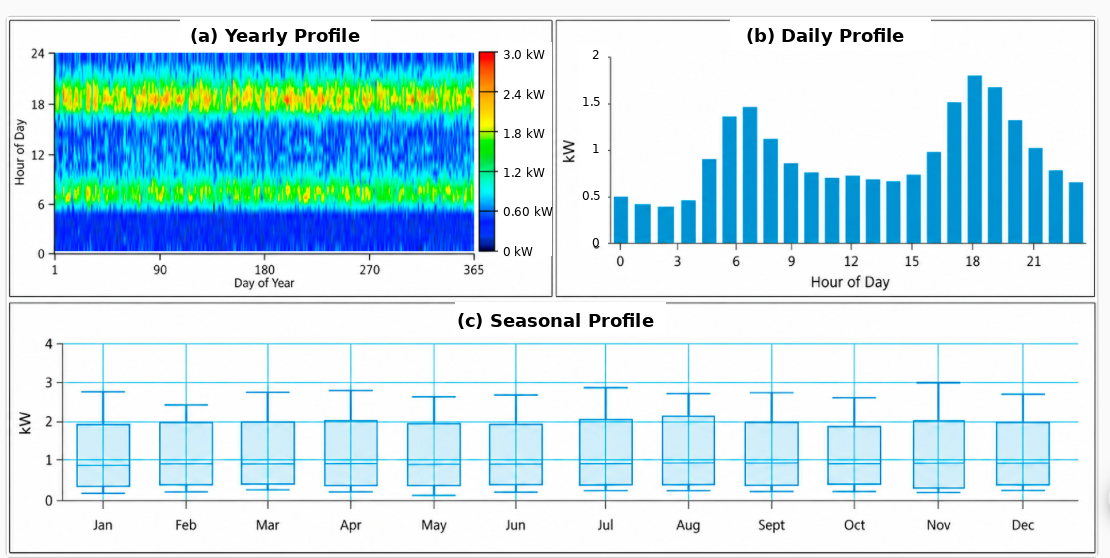
This study aimed to design a cost-effective, sustainable energy solution for a household in Soweto by proposing a grid-connected PV battery renewable energy system. The system design’s main objective was to minimise grid dependence and promote renewable energy utilisation to improve energy reliability and affordability. The system is made of the following key components: PV panels, lithium-ion batteries, and a power converter. Correctly sizing these components is crucial to designing a cost-effective, reliable system that meets load demand. Figure 3 presents the household demand characteristics, including the yearly, daily, and seasonal profiles. The residential load profile was derived from measured electricity consumption data collected from a single household in Soweto, Johannesburg, over a representative period. The hourly load profile was processed and imported into HOMER Grid as a custom time series electrical load. The household has an average demand of 21.58 kWh/day, with a peak demand of 2.98 kW, resulting in an annual demand of 7876.7 kWh. Figure 1 shows that energy consumption is high in the early morning and again in the early evening. The figure at the bottom shows seasonal variation in load demand, revealing relatively stable electricity consumption throughout the year. These profiles inform component sizing and grid backup requirements to ensure energy reliability and support a cost-effective system design.

3.4. Local Resources

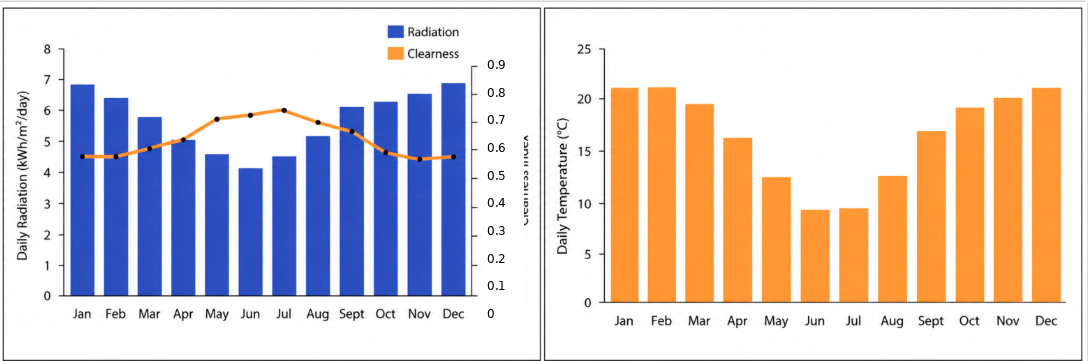
Solar radiation, the clearness index, and temperature are key environmental variables that HOMER needs to simulate grid-connected PV RES. For this study, these variables were sourced from NASA’s Global Solar Atlas. Daily solar radiation and the clearness index are key indicators of atmospheric clarity. The clearness index is higher under sunny, clear-sky conditions and lower when the sky is cloudy or overcast. Figure 4 presents the local solar resources. The figure reveals stronger solar radiation during late spring and summer months, particularly between October and January. Solar radiation decreases during winter months, reaching a minimum during June. High temperatures are recorded during spring and summer months between September and April. This thermal information is used to include a temperature derating factor for the PV panels.

3.5. Proposed System Architecture, Simulation, and Optimisation Strategy

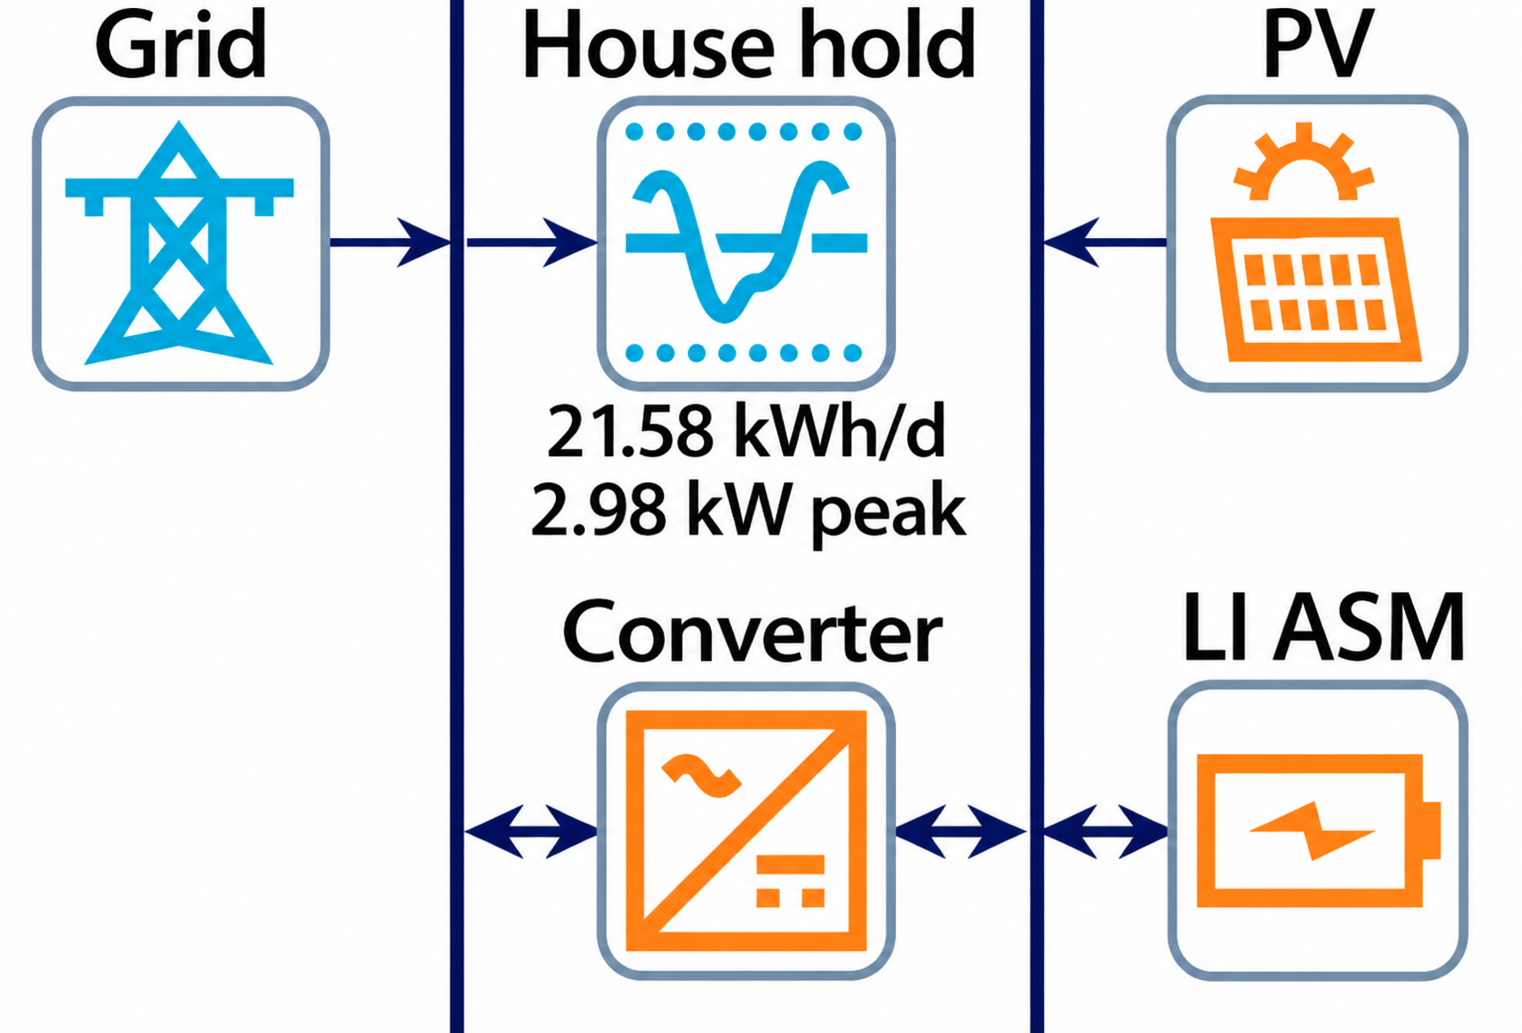
The proposed system consists of solar photovoltaic (PV) panels and a lithium-ion battery storage (LI-ASM) unit tied to the RSA national grid, as shown in Figure 5. The converter converts the energy generated by the PV array from direct current (DC) to alternating current (AC). The battery unit stores excess energy to ensure a continuous energy supply during peak demand, at night, and on cloudy days. The details of the modelled system configuration are presented below:
PV capacity—7 kW flat-plate modules;
Storage—23 kWh lithium-ion batteries;
Converter efficiency—95%;
Load profile—Daily peak of 2.98 kW, average load of 21.58 kWh/day.
The proposed system uses a load-following dispatch strategy. The solar energy from the PV panels serves as the primary energy source for the household, while the battery unit serves as a backup when PV generation is insufficient. The battery recharges during periods of excess production. Grid electricity is used only when the PV battery system produces insufficient energy to meet the household’s needs, helping the end user save on grid electricity purchases. This study prohibits grid exports; hence, excess electricity is curtailed. The following economic factors are considered:
Project lifetime—25 years;
Real discount rate—5.88%;
Inflation rate—2%;
CO2 emission cost—modelled using a comparative baseline scenario.
The HOMER Grid optimisation algorithm simulated all feasible combinations of photovoltaic capacity, lithium-ion storage, and converter ratings. The software’s embedded optimisation algorithm simulated hundreds of system configurations to identify the most cost-effective configuration. HOMER Grid is a cost-only optimisation software. For this reason, the performance of the cost-effective system design was evaluated using economic metrics such as NPC and LCOE.

3.6. Economic Analysis

The economic viability of the proposed system is evaluated using the NPC and LCOE. These two economic indicators provide insight into the long-term cost-effectiveness of the chosen system architecture over the project’s lifespan.

3.6.1. Levelised Cost of Energy

The Levelised Cost of Energy (LCOE) is the average cost per kWh of usable energy the system generates. The built-in HOME equation divides the annual cost of electricity generation by the total usable electricity output. The LCOE is calculated as
L C O E = C a n n , t o t E p r i m + E d e f + E g r i d , s a l e s
where Cann,tot is the total annualised cost, Eprim is the primary load served, Edef is the deferrable load served, and Egrid,sales is the energy sold to the grid.

3.6.2. Net Present Cost (NPC)

The net present cost (NPC) is the sum of expenditure over the system’s lifespan minus the present value of income earned during that period. HOMER considers expenses such as capital costs, replacement costs, grid power purchases, and operation and maintenance costs when calculating NPC. The NPC is calculated by simply adding the total discounted cash flows for each year of the project’s life cycle.
C N P C = C a n n , t o t C R F ( i , R p r o j )
where CNPC is the net present cost, Cann,tot is the total annualised cost, i is the real discount rate, and Rproj is the project lifetime. In this study, the project lifecycle is set at 25 years. The annual present value is determined using the capital recovery factor (CRF). The annual present value is the sum of equal cash flows over the system’s lifespan. The capital recovery factor’s equation is
C R F ( i , N ) = i ( 1 + i ) N ( 1 + i ) N 1
where N is the project lifetime in years.

3.7. Pipeline Architecture

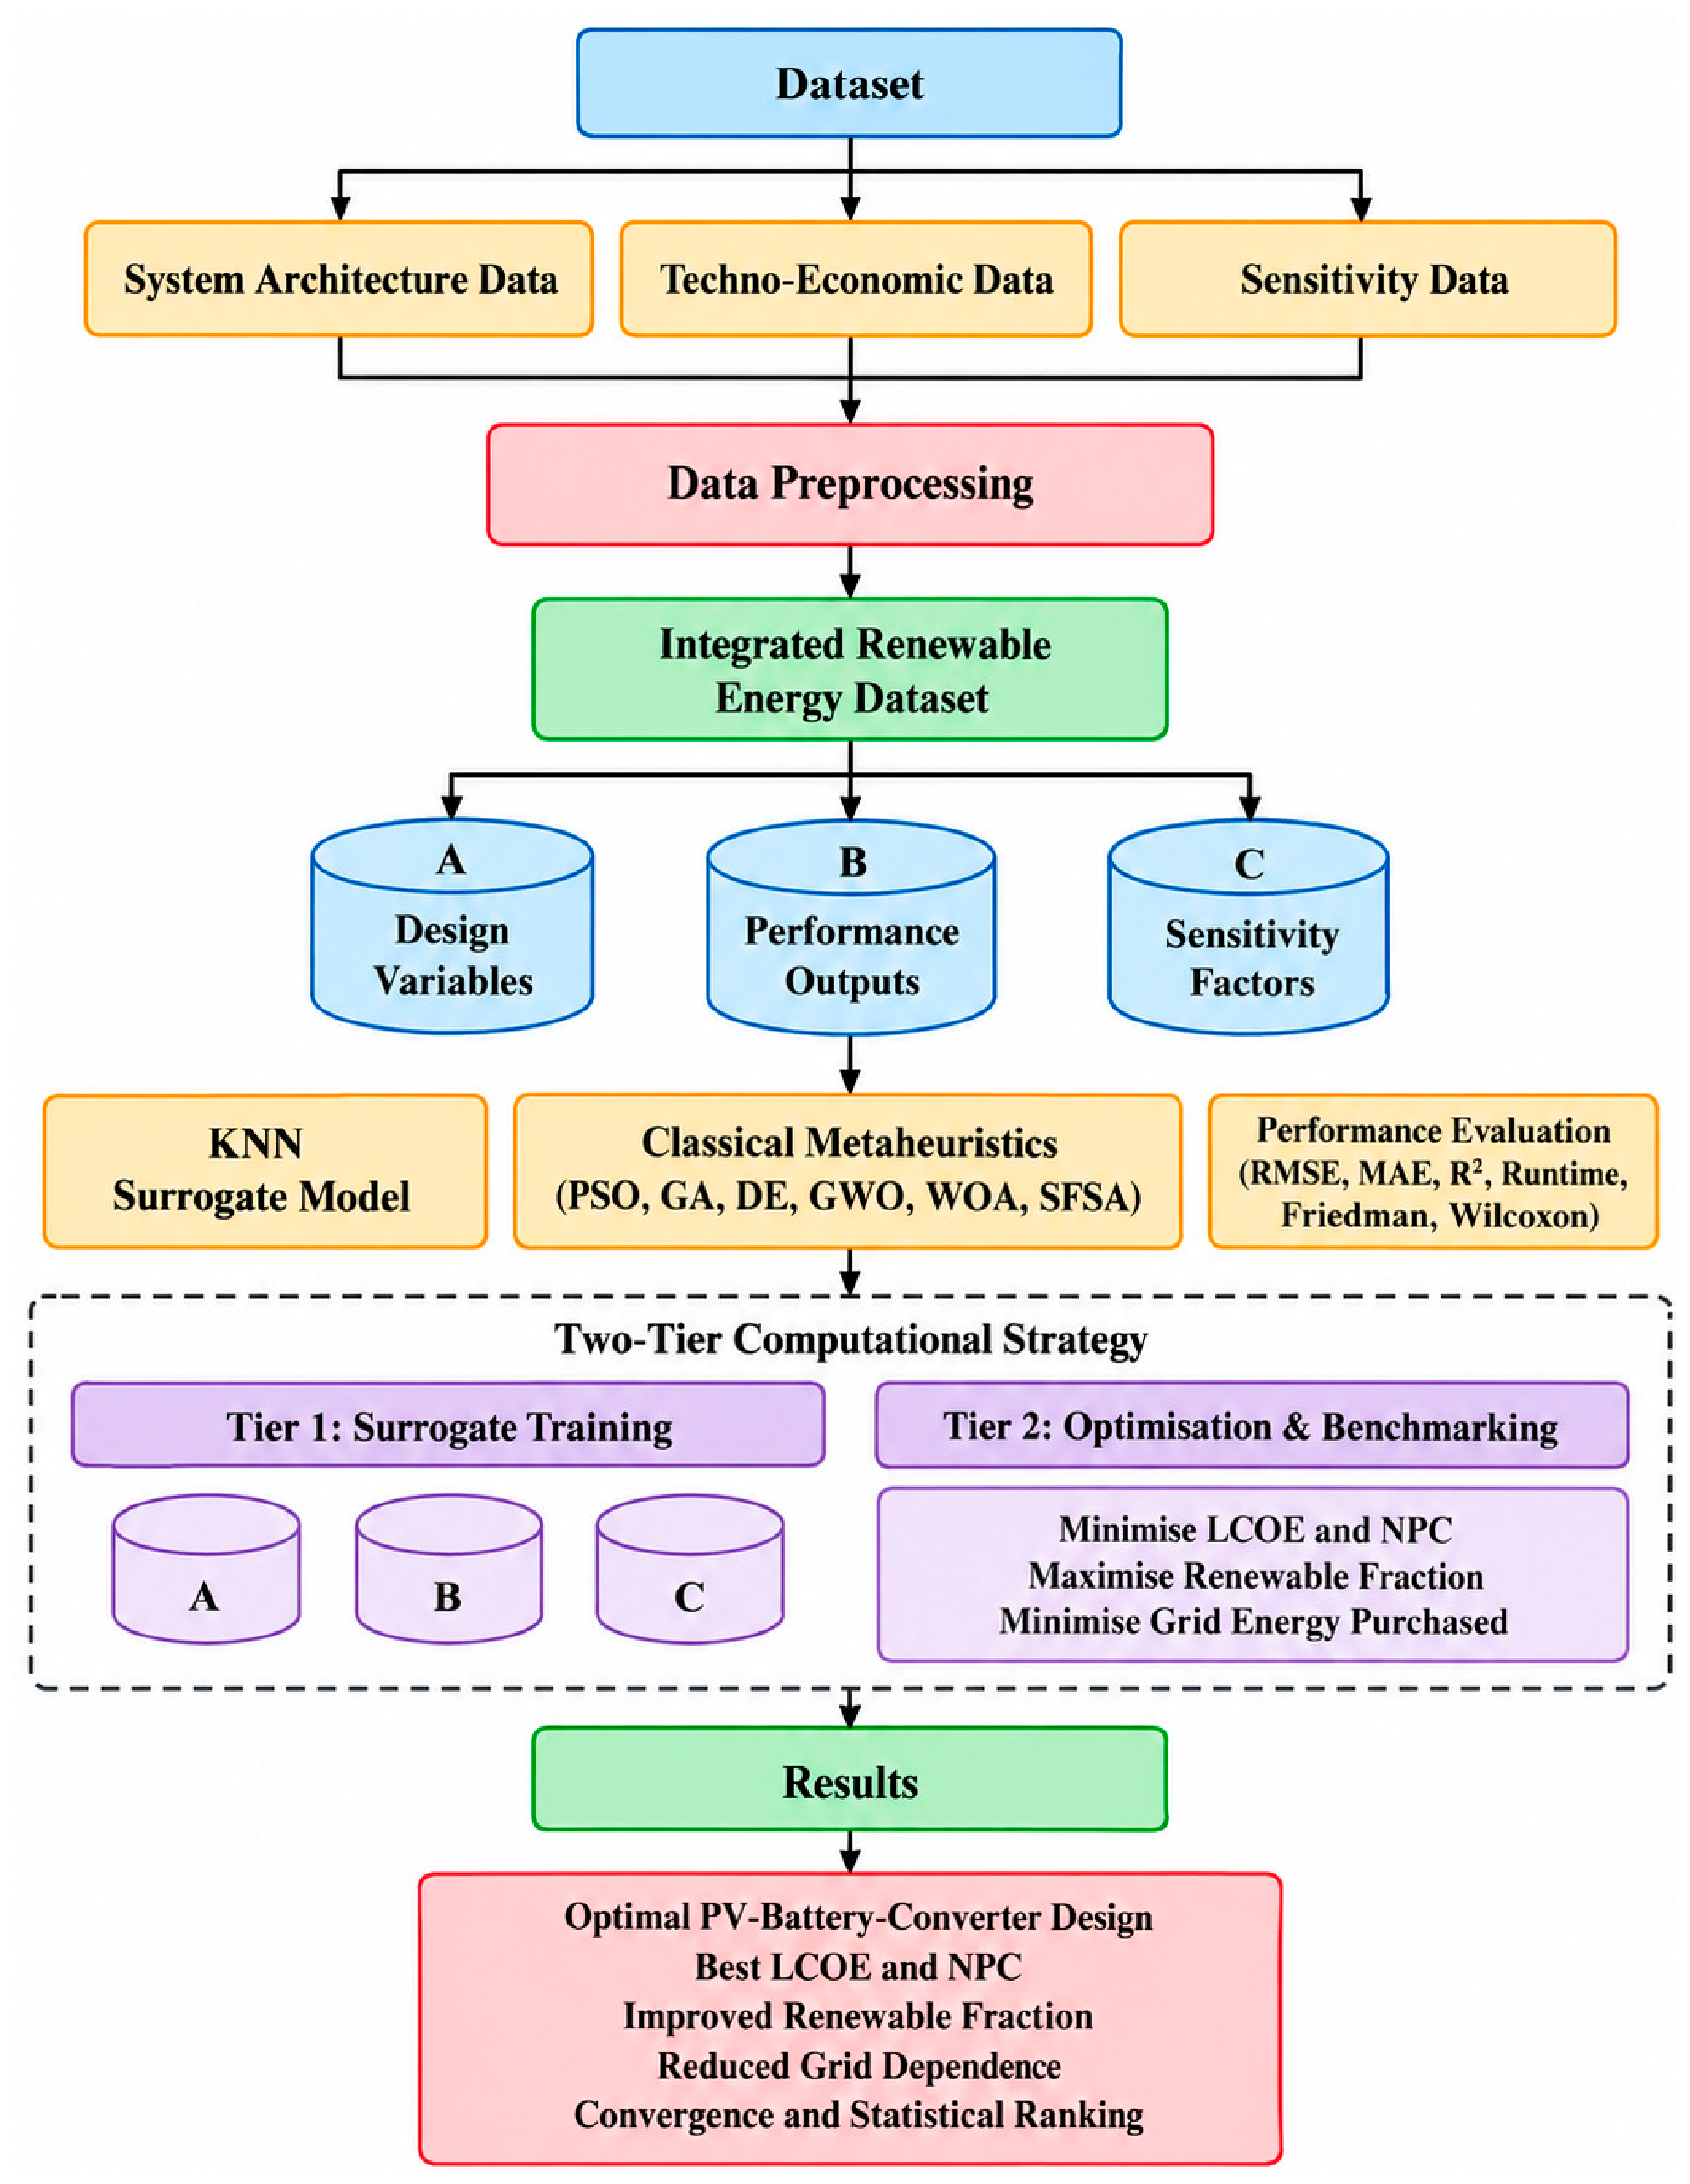
This study benchmarks six classical metaheuristic algorithms (PSO, GA, DE, GWO, WOA, and SFSA) using a surrogate-assisted optimisation framework to optimise a grid-connected PV battery renewable energy system in a techno-economic context. HOMER Grid-derived optimisation and sensitivity results are used to benchmark the metaheuristic algorithms. The dataset obtained from HOMER was then integrated with a renewable energy database containing architectural variables and techno-economic performance indicators. To avoid repeatedly running HOMER simulations during optimisation, this study adopted a distance-weighted k-nearest neighbours surrogate model. The model was trained to estimate multiple performance outputs from candidate system configurations. All six metaheuristic algorithms searched the same surrogate design space with identical optimisation settings. The performance of each algorithm was evaluated using convergence behaviour, solution quality, computational runtime, robustness, nearest-observed validation, and non-parametric tests. The proposed methodology of the study is presented in Figure 6.

3.8. Dataset Description and Preprocessing

In this study, a metered electricity consumption dataset of residential household load profiles was modelled in HOMER Grid to simulate the techno-economic optimisation of grid-connected PV battery RES. HOMER Grid generated 294 feasible optimisation candidate configurations and 16 sensitivity cases. The quality of the dataset was audited before the surrogate development. Duplicate records were identified by comparing all exported variables, resulting in 22 records being removed, reducing the dataset from 294 to 272 unique records as presented in Table 3. The grid-connected renewable energy system included PV panels, lithium batteries (LI-ASM), and a converter. The output variables during model development were LCOE, NPC, CAPEX, operating cost, renewable fraction, grid energy purchases, IRR, and simple payback.
Further auditing separated structural non-applicable blanks from missing extended economic fields. From 294 raw rows, 22 exact duplicates were removed, leaving 272 unique cases with complete core optimisation outputs. Of these cases, 14 lacked IRR and simple-payback values, yielding a 258-case extended economic subset. The 500 raw blank cells were concentrated in component-specific and economic fields rather than randomly distributed. Core optimisation and surrogate benchmarking therefore use 272 cases; the 258-case subset is used only where IRR or payback is required. A Kolmogorov–Smirnov audit found no significant distributional shift for the principal design and objective variables (all p ≥ 0.8489).
These blank fields were treated as non-applicable entries generated by HOMER export instead of random missing measurements. For example, a system with a blank battery unit was treated as if it had zero batteries. However, system configurations with no PV were not included in the surrogate training because this study specifically benchmarks PV battery system sizing within the PV-supported design domain. After removing duplicates, system configurations without PV numbered 14, which were subsequently removed, resulting in reducing the dataset from 272 to 258 cases. This distributional change is explicitly acknowledged as a consequence of restricting the modelling dataset to the PV-supported design class, rather than as evidence of arbitrary deletion based on optimisation performance. Accordingly, the 258 retained cases constitute the HOMER-supported surrogate optimisation domain used in the subsequent distance-weighted kNN modelling and metaheuristic benchmarking. This distinction is important because the objective of the data preparation was not to create an unbiased sample of all possible grid-connected configurations, but to construct a consistent training domain for the surrogate representation of the PV battery design problem. The revised benchmark restricts the surrogate search to the positive HOMER-supported local domain: PV 3.666667–22 kW, battery count 0–30 units, and converter 0.833333–5 kW. This correction prevents unsupported extrapolation below the observed PV and converter ranges.
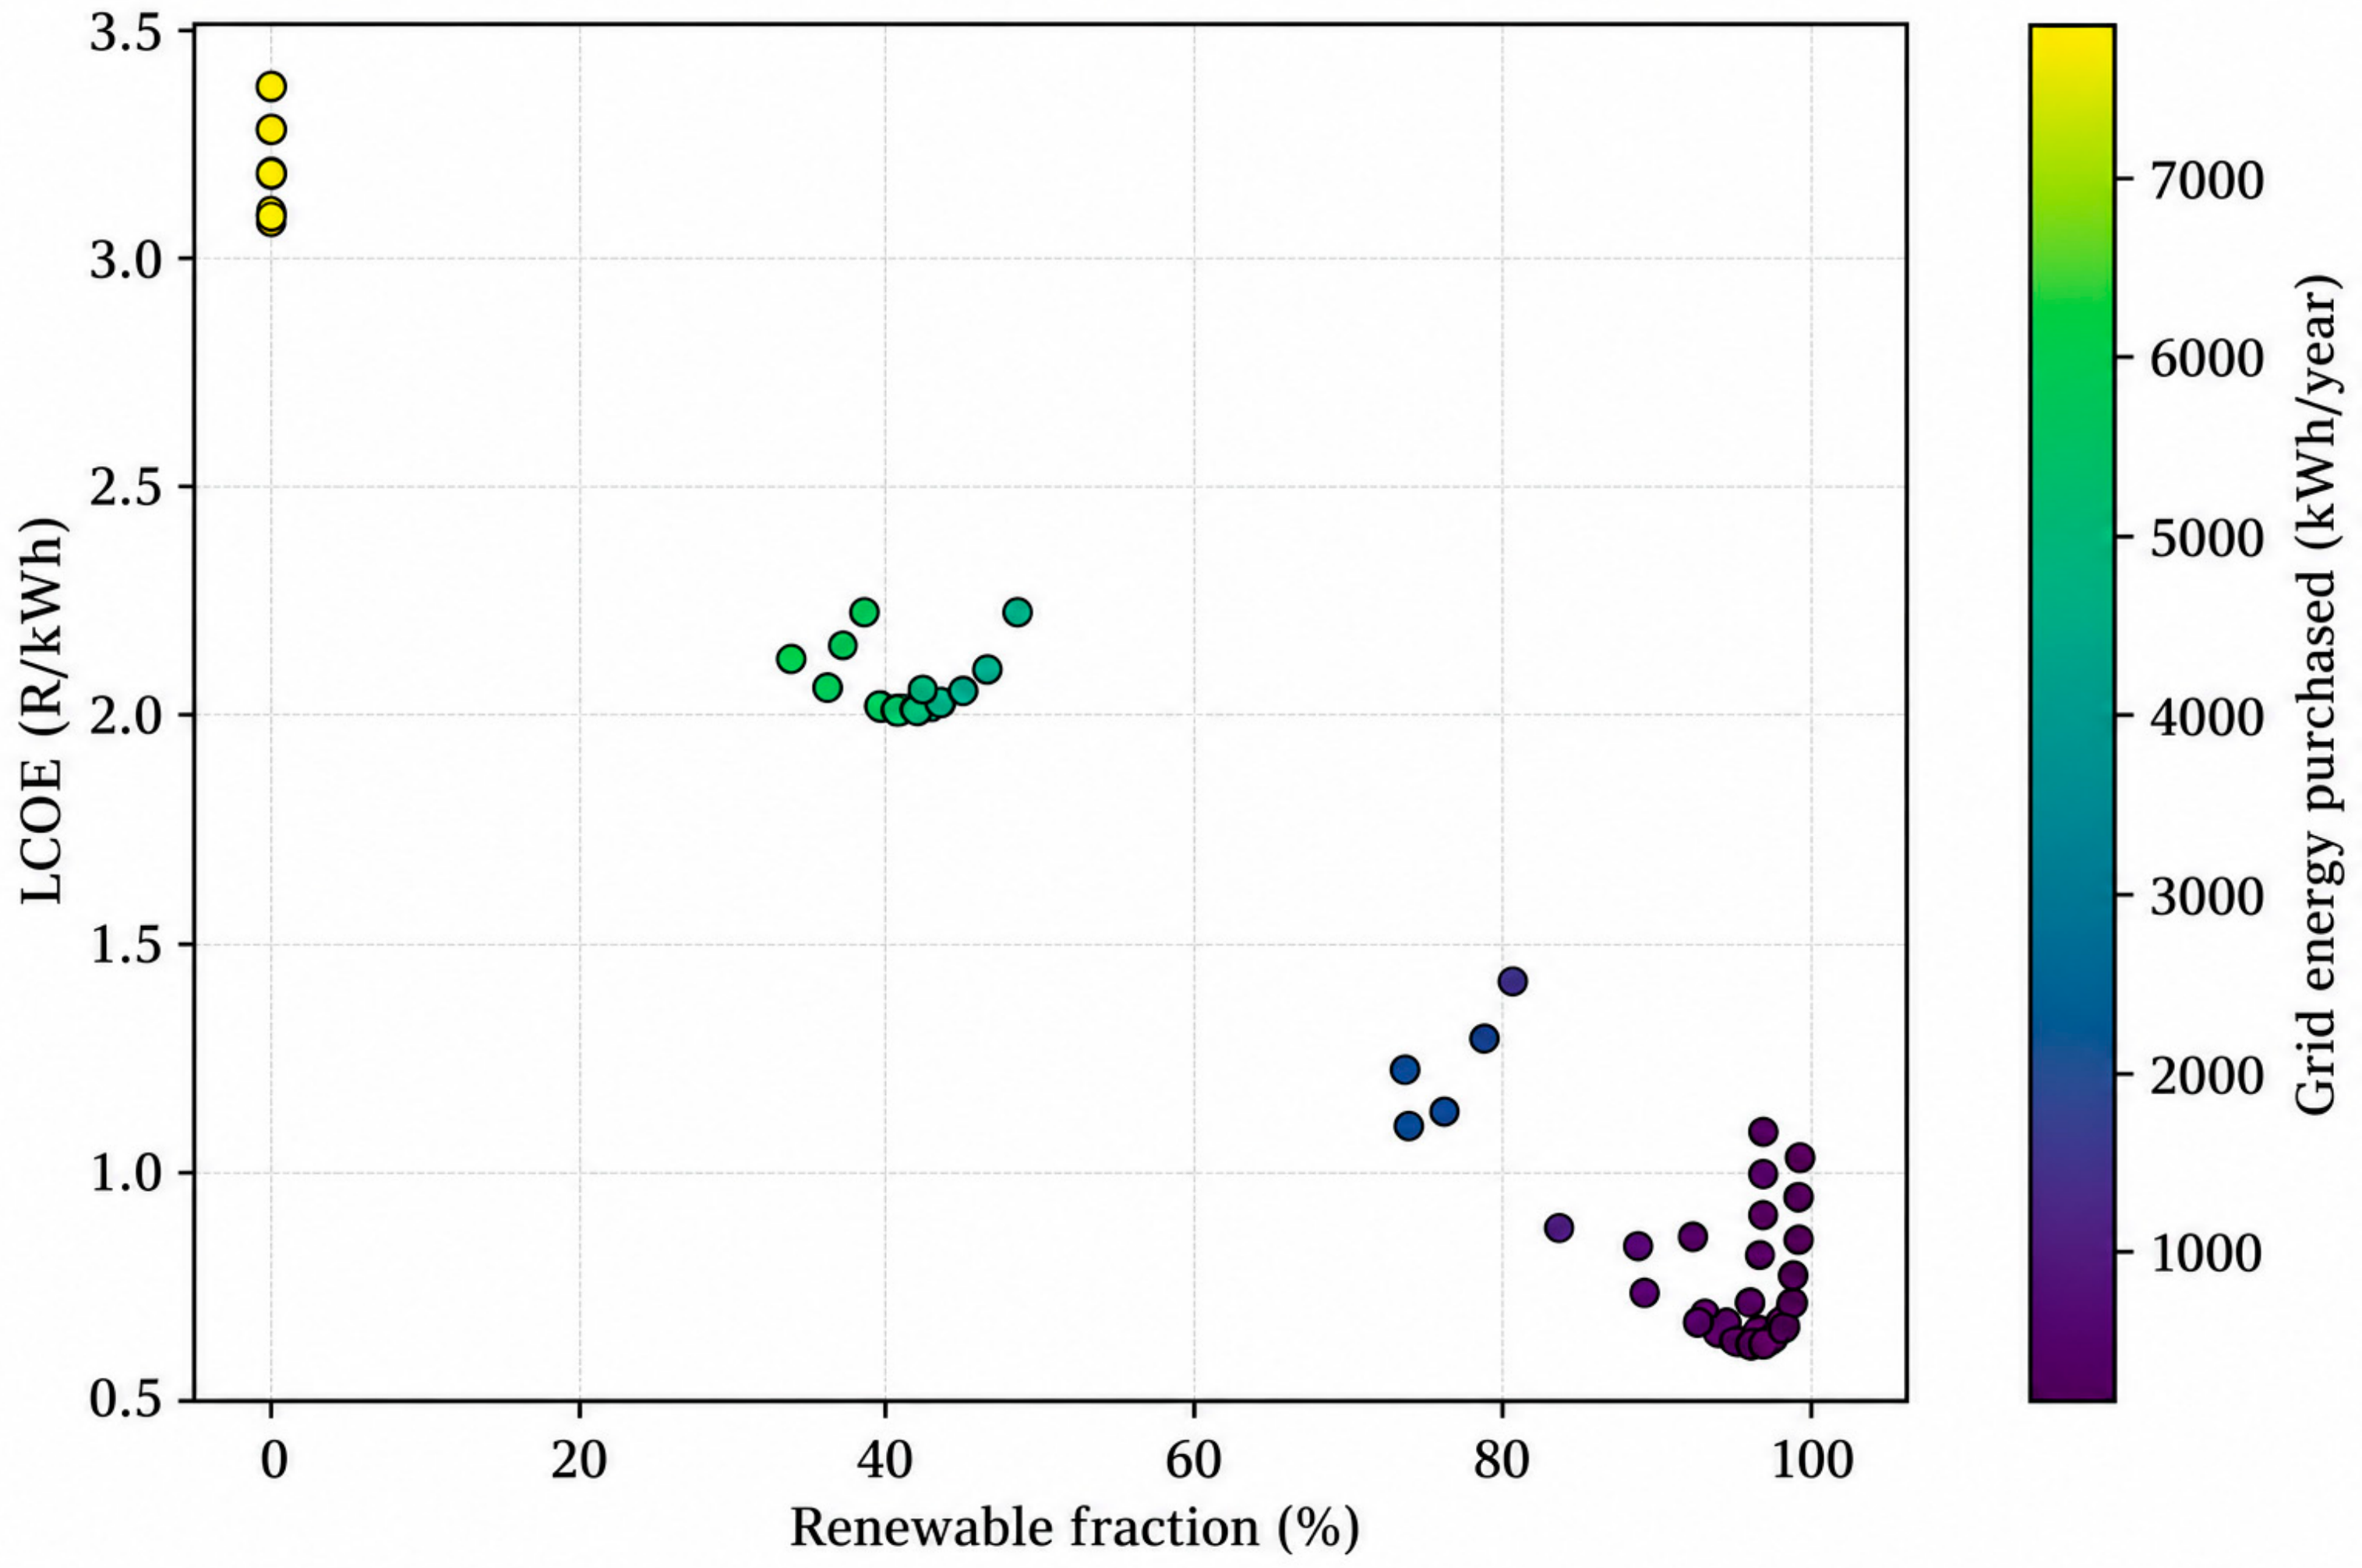
The observed techno-economic design space of the HOMER Grid-derived optimisation dataset is presented in Figure 7. The figure illustrates the relationship between the renewable energy fraction and LCOE, along with a colour scale for annual grid energy purchases. This visualisation aims to characterise the distribution of feasible candidate system configurations and examine interactions among the primary optimisation objectives before the development of the surrogate model. It shows the design landscape examined by the optimisation algorithms and demonstrates the wide range of techno-economic trade-offs existing within the dataset. This figure further confirms that the cleaned dataset sufficiently spans both low- and high-renewable operating regions, thereby providing adequate diversity for surrogate model training and for evaluating each metaheuristic optimisation algorithm’s performance.
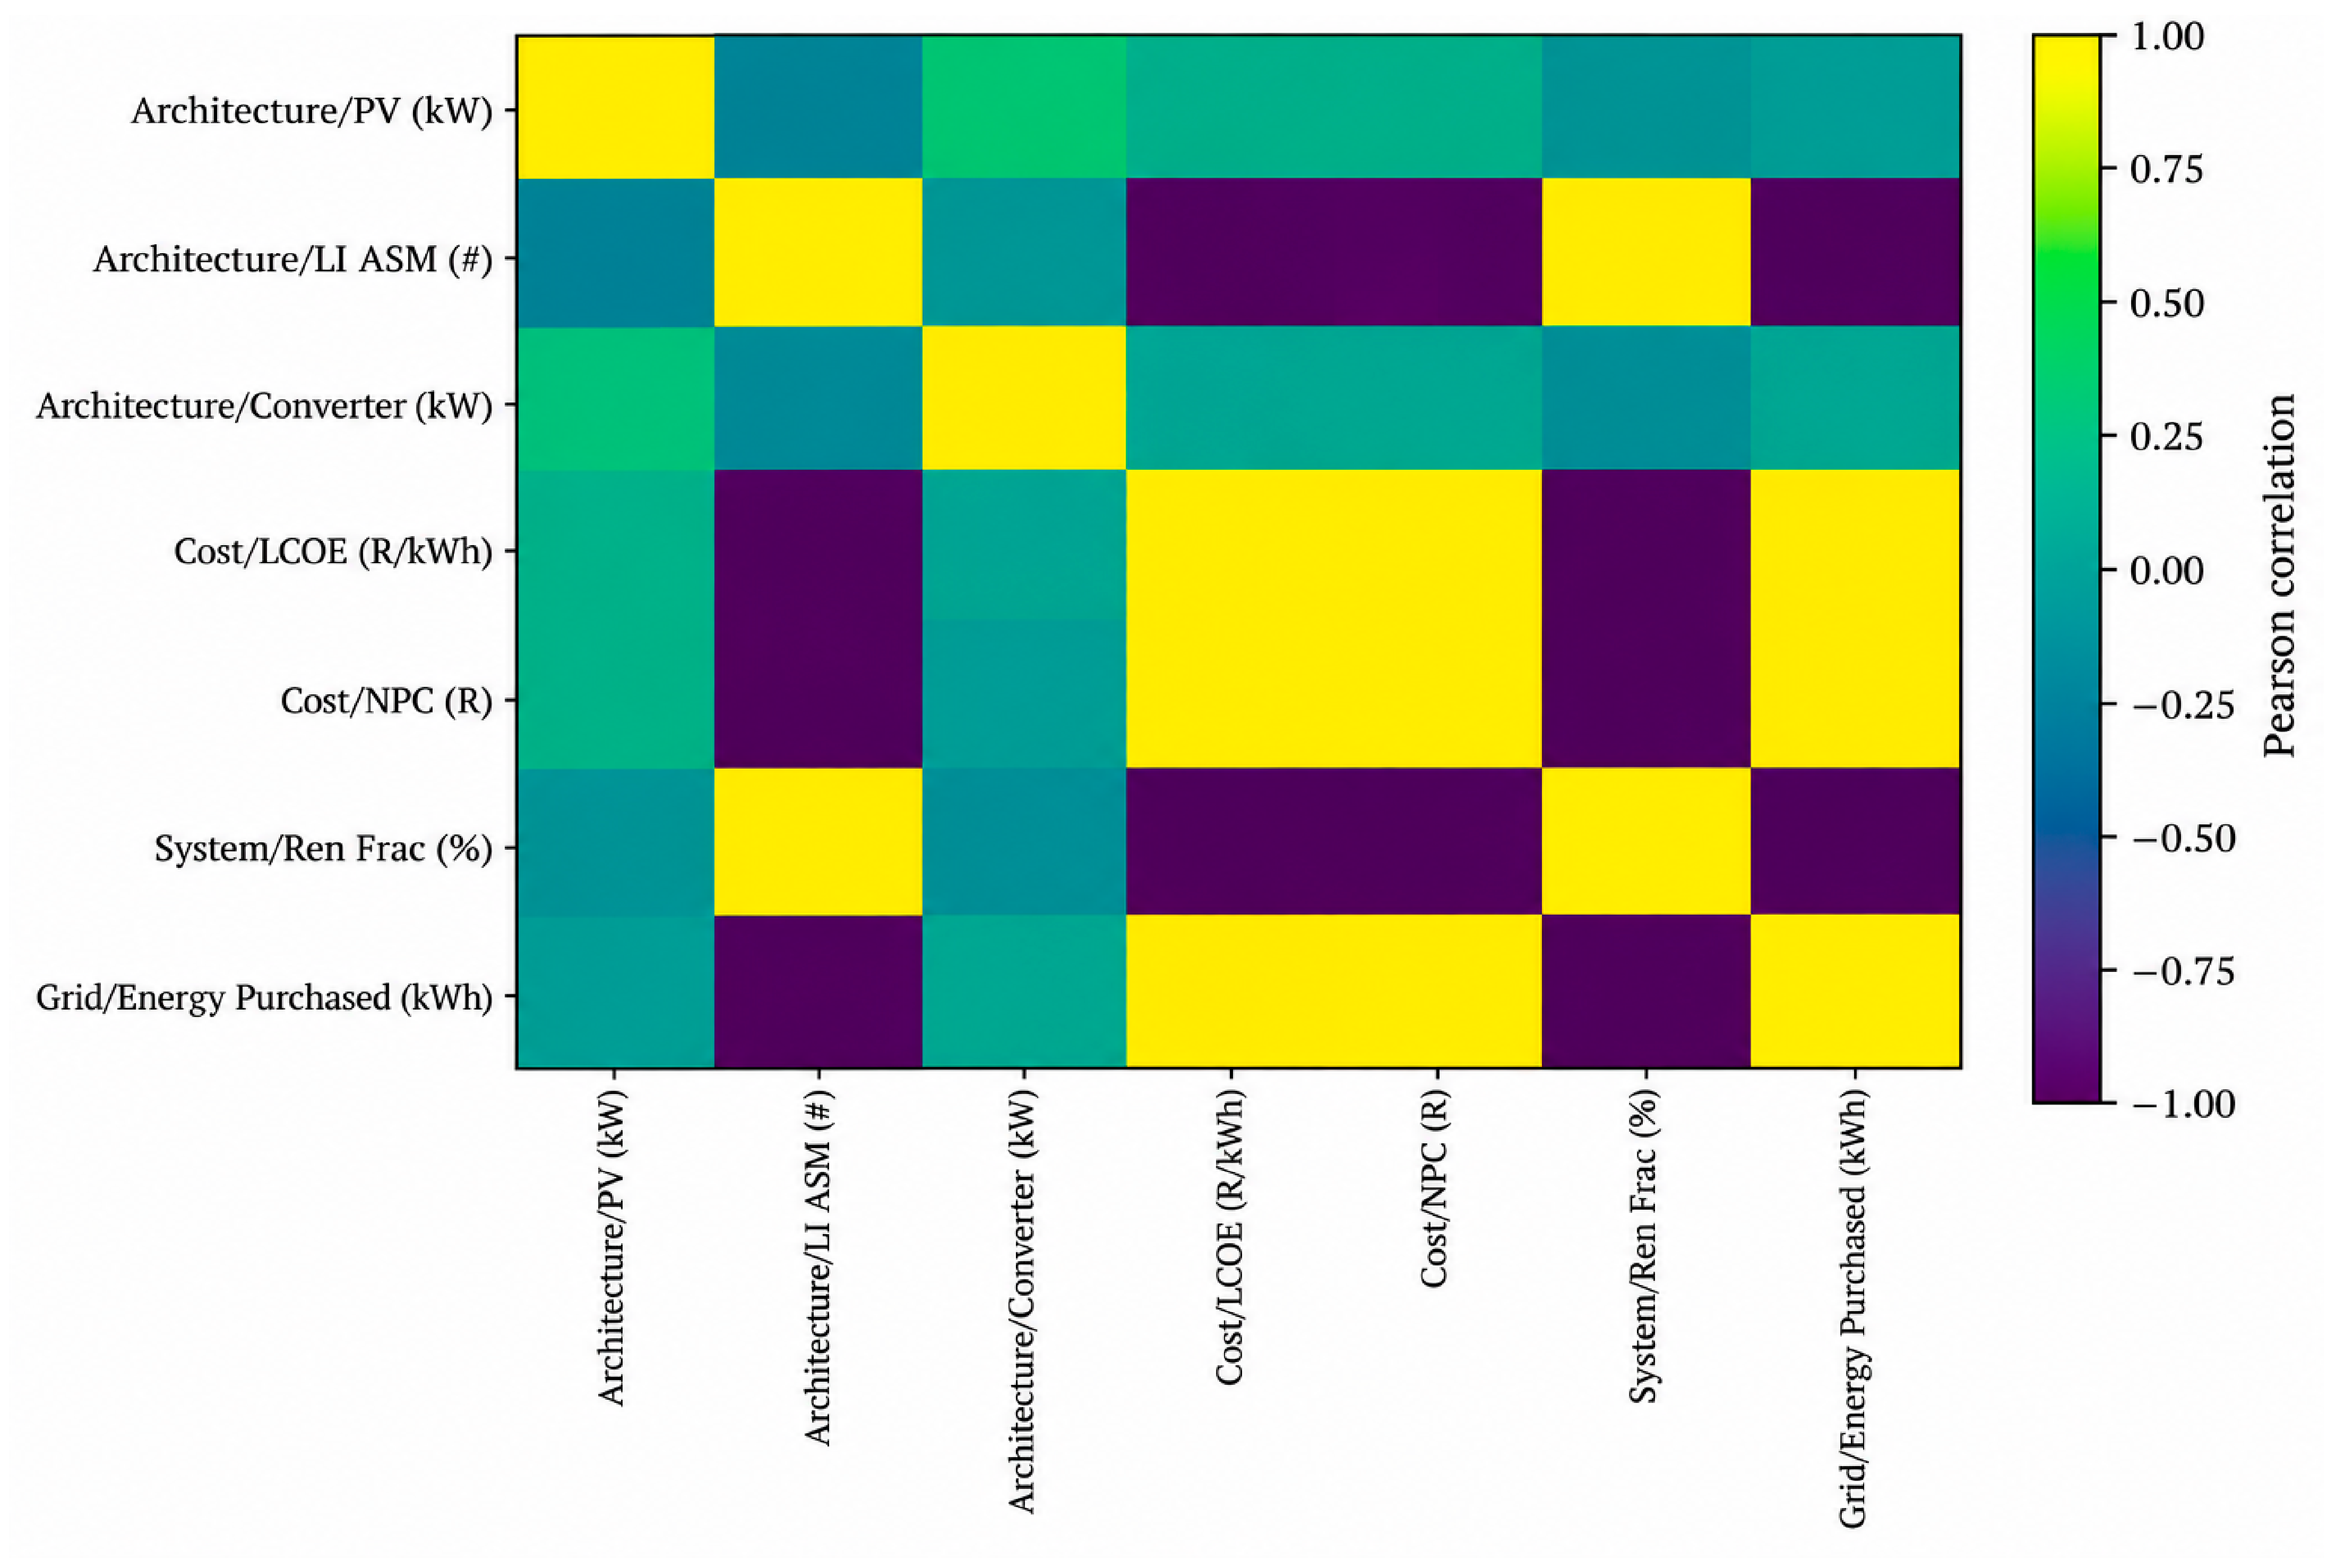
The Pearson correlation matrix of the design variables and techno-economic performance indicators from the HOMER Grid optimisation dataset is presented in Figure 8. This matrix quantifies the strength and direction of linear relationships between optimisation variables and their corresponding performance metrics. The correlation coefficient of a matrix ranges from −1 to +1, allowing the identification of both negative and positive linear relationships among variables. This analysis serves as a data structure initial assessment step that can highlight potential dependencies between the system design variables and techno-economic outputs. For the development of surrogate models, understanding these relationships is important, as it identifies influential variables, reveals potential multicollinearity, and provides an overview of the complexity of the optimisation landscape. Correlation analysis is an essential preliminary step in validating the suitability of the dataset used for surrogate-assisted optimisation and benchmarking of the selected metaheuristic algorithms.

3.9. Mathematical Formulation and Computational Methodology

3.9.1. Problem Formulation

This section outlines the techno-economic optimisation problem explored in the study. It specifies the decision variables, defines the objective functions and constraints, and illustrates how the mathematical model integrates with the HOMER Grid simulation and the surrogate-assisted metaheuristic framework. The formulation aligns with the study’s design; the optimisers focus on PV capacity, lithium-ion battery quantity, and converter capacity, while a local distance-weighted k-nearest neighbour (kNN) surrogate predicts the HOMER Grid performance indicators. This study’s optimisation problem is a constrained techno-economic sizing problem for a grid-connected PV battery RES. The problem is formulated as a multi-objective problem in which competing technical and economic criteria are combined into a scalar fitness measure for metaheuristic searching.
Decision Variables
The optimisation problem was formulated using three decision variables: PV capacity, battery units, and converter capacity, as Tabulated in Table 4. Battery count was rounded to the nearest integer during optimisation to ensure practical system configurations. The objectives are adapted from HOMER Grid-derived outputs, including the LCOE, NPC, annual grid energy purchased, and RF. The design vector is expressed as
x = [ P P V , N b a t , P c o n v ] T
where PPV is the photovoltaic capacity, Nbat is the number of lithium-ion battery units, and Pconv is the converter capacity. Table 5 shows the common search bounds applied to all six algorithms.
Mathematical Representation of System Performance
For a specific system configuration, the original HOMER Grid model produces techno-economic responses. In this study, eight decision outputs were retained during surrogate model development. The techno-economic response vector is represented as
y ^ ( x ) = L C O E x , N P C x , R F x , E g r i d x , C A P E X x , O P E X x , I R R x , P B ( x ) T
The optimisation uses the HOMER Grid cases as a reference for the design landscape, whereas the distance-weighted KNN model estimates y ^ ( x ) . With k = 8 neighbours, the predicted output for candidates is defined by
y ^ ( x ) = j = 1 k w j x · y j j = 1 k w j x
where
w j ( x ) = 1 d j x + ε
This formulation is used to interpret the optimisation results. The validated surrogate representation of the completed HOMER Grid space solves the mathematical optimisation problem instead of the metaheuristic claiming to reproduce the full hourly HOMER energy balance engine.
Objective Function
This study aimed to minimise LCOE, NPC, and grid electricity purchases while maximising RF. The governing formulas for the objective functions can be expressed as follows:
Objective   1 NPC :   f N P C x = C a n n , t o t ( x ) C R F ( i , N )
Objective   2 LCOE :   f L C O E x = C a n n , t o t ( x ) E s e r v e d ( x )
Objective   3 Electricity   grid   f E   g r i d x = t = 1 T P g r i d ( t ) t
Objective   4 RF :   f R F x = 100 R F ( x ) 100
Composite Fitness Function
Table 6 presents the structure of the fitness function used for the classical metaheuristic comparisons. The fitness function was designed to simultaneously minimise the LCOE, NPC, and annual grid energy purchases while maximising the renewable energy utilisation. Each component was assigned a weighting factor. Additionally, penalty functions were added to discourage solutions that failed to satisfy predefined engineering requirements. The function was designed to avoid candidate solutions with a renewable fraction below 95% and grid energy purchases exceeding 500 kWh/year. The weighted multi-objective criteria adopted in this study provide a balanced evaluation between economic performance, renewable energy utilisation, and utility grid dependence. The weighted multi-function objective adopted in this study enables the metaheuristic optimisation algorithms to identify practically feasible and economically attractive system configurations.
The weighted composite objective used for algorithm comparison is therefore
F x = 0.4 f L C O E x + 0.25 f N P C x + 0.2 f E , g r i d x + 0.15 100 R F ( x ) 100 + P R F ( x ) + P g r i d ( x )
This study seeks to reduce dependence on the grid while minimising cost. The assigned weights reflect the priority given to each decision variable. The system’s economic performance is prioritised, as the study aims to reduce cost, especially electricity cost per kWh, which affects the overall lifecycle cost over a 25-year period. Accordingly, the LCOE is assigned 40%, the NPC 25%, grid purchases 20%, and renewable energy utilisation 15%. The 95% RF threshold was adopted to promote high renewable energy utilisation, whereas the 500 kWh/year threshold was adopted to limit residual dependence on grid electricity. These weights were assigned to each decision variable to provide a complementary balance between economic cost, renewable energy penetration and grid dependence within the adopted PV battery case study. These weights and thresholds are the authors’ choice rather than universal values. The authors assigned the weights based on the analysis they aim to achieve. The weights sum to unity and reflect the study’s prioritisation of LCOE, NPC, grid dependence, and renewable fraction improvement. The penalty functions are expressed as follows:
P R F ( x ) = λ · R F m a x 0 , 95 R F ( x ) 95
P g r i d ( x ) = λ · E g r i d , m a x 0 , E g r i d x 500 500
The composite fitness function consists of renewable energy and electricity grid penalties. The renewable fraction and grid energy terms ensure the optimisation accounts for economic efficiency, renewable energy use, and reduced reliance on grid electricity. The optimisation is subject to both design space constraints and performance constraints. The complete problem can therefore be written as
minimize F(x), subject to 0 ≤ PPV ≤ 22 kW, 0 ≤ Nbat ≤ 30, 0 ≤ Pconv ≤ 5 kW, RF ≥ 95%, Egrid(x) ≤ 500 kWh/year.
The first three constraints define the component search space used consistently by PSO, GA, DE, GWO, WOA and SFSA. The latter two are engineering performance requirements. In addition, the underlying HOMER Grid model enforces the system feasibility conditions associated with the simulated PV, storage, converter, load and grid configuration. These include the requirement that household demand is served according to the modelled dispatch logic, and that component operation remains within the feasible configurations represented in the HOMER Grid dataset. The present surrogate-assisted optimiser does not independently reconstruct all hourly physical constraints; instead, it interpolates among completed feasible HOMER cases.

3.9.2. Surrogate Model Development

A local distance-weighted k-nearest neighbour (DW-kNN) surrogate was evaluated using five-fold shuffled cross-validation (seed 20260908). Standardisation was fitted independently within each training fold before transforming its validation fold, preventing preprocessing leakage. A sweep from k = 3 to 15 selected k = 3, which achieved the highest mean cross-output R2 of 0.968912. R2, RMSE, MAE and MAPE were computed for the eight techno-economic outputs. The predictive performance of the selected DW-kNN surrogate was evaluated across the eight techno-economic outputs using five-fold cross-validation. Table 7 summarises the resulting R 2 , RMSE, MAE, and MAPE values for each predicted output.
To strengthen the selection and validation of the surrogate model, the predictive performance of the DW-kNN model was compared with four alternative regression approaches: random forest, Gaussian process, radial basis function (RBF), and gradient boosting. As shown in Table 8, random forest achieved the highest mean R 2 across the four core techno-economic outputs (0.996453), followed by Gaussian process (0.995453), RBF (0.992653), and gradient boosting (0.989954). Although these models achieved higher overall predictive accuracy, DW-kNN was retained as the local interpolation model for the optimisation benchmark because the revised search domain was restricted to the HOMER-supported design space, thereby maintaining predictions within the neighbourhood of observed system configurations. The number of neighbours was subsequently determined through a systematic hyperparameter analysis. Table 9 presents the cross-validation results for the evaluated k values, with k = 3 producing the highest mean R 2 of 0.968912 and therefore being selected for the final DW-kNN surrogate. The progressive reduction in predictive performance at larger k values indicates that increasing the neighbourhood size introduced excessive smoothing of the local techno-economic response surface.
Random forest achieved the highest mean R2 (0.996453), followed by Gaussian process (0.995453), RBF (0.992653), and gradient boosting (0.989954). The selected k = 3 DW-kNN was retained as the local benchmark because the optimisation was explicitly restricted to interpolation within the HOMER-supported design domain. The comparison confirms that surrogate choice is problem-dependent and can influence optimisation outcomes. The available dataset for this study favours a local non-parametric approximation; hence, DW-kNN was selected as the preferred regression model. The design space dimensionality is low, with only three decision variables, while the dataset sample size is relatively small. Training highly parameterised global learning models requires large datasets. Furthermore, the optimisation variables include the battery count units along with continuous PV and converter variables. This consequently imposes a highly restrictive global functional form, which may not be desirable. In this study, the optimisation of candidate system designs is determined by nearby observed HOMER configurations, so the surrogate maintains the local structure of the HOMER Grid design landscape without assuming an analytical relationship between component sizing and techno-economic performance. This is relevant to this study because the aim is not to reinvent a universal physical model of a PV battery system, but instead to build a computationally efficient approximation of the HOMER-generated response surface for surrogate-assisted optimisation. For this reason, the selection of KNN should be treated as a problem-specific modelling choice instead of claiming that KNN is universally superior to other surrogate methods.
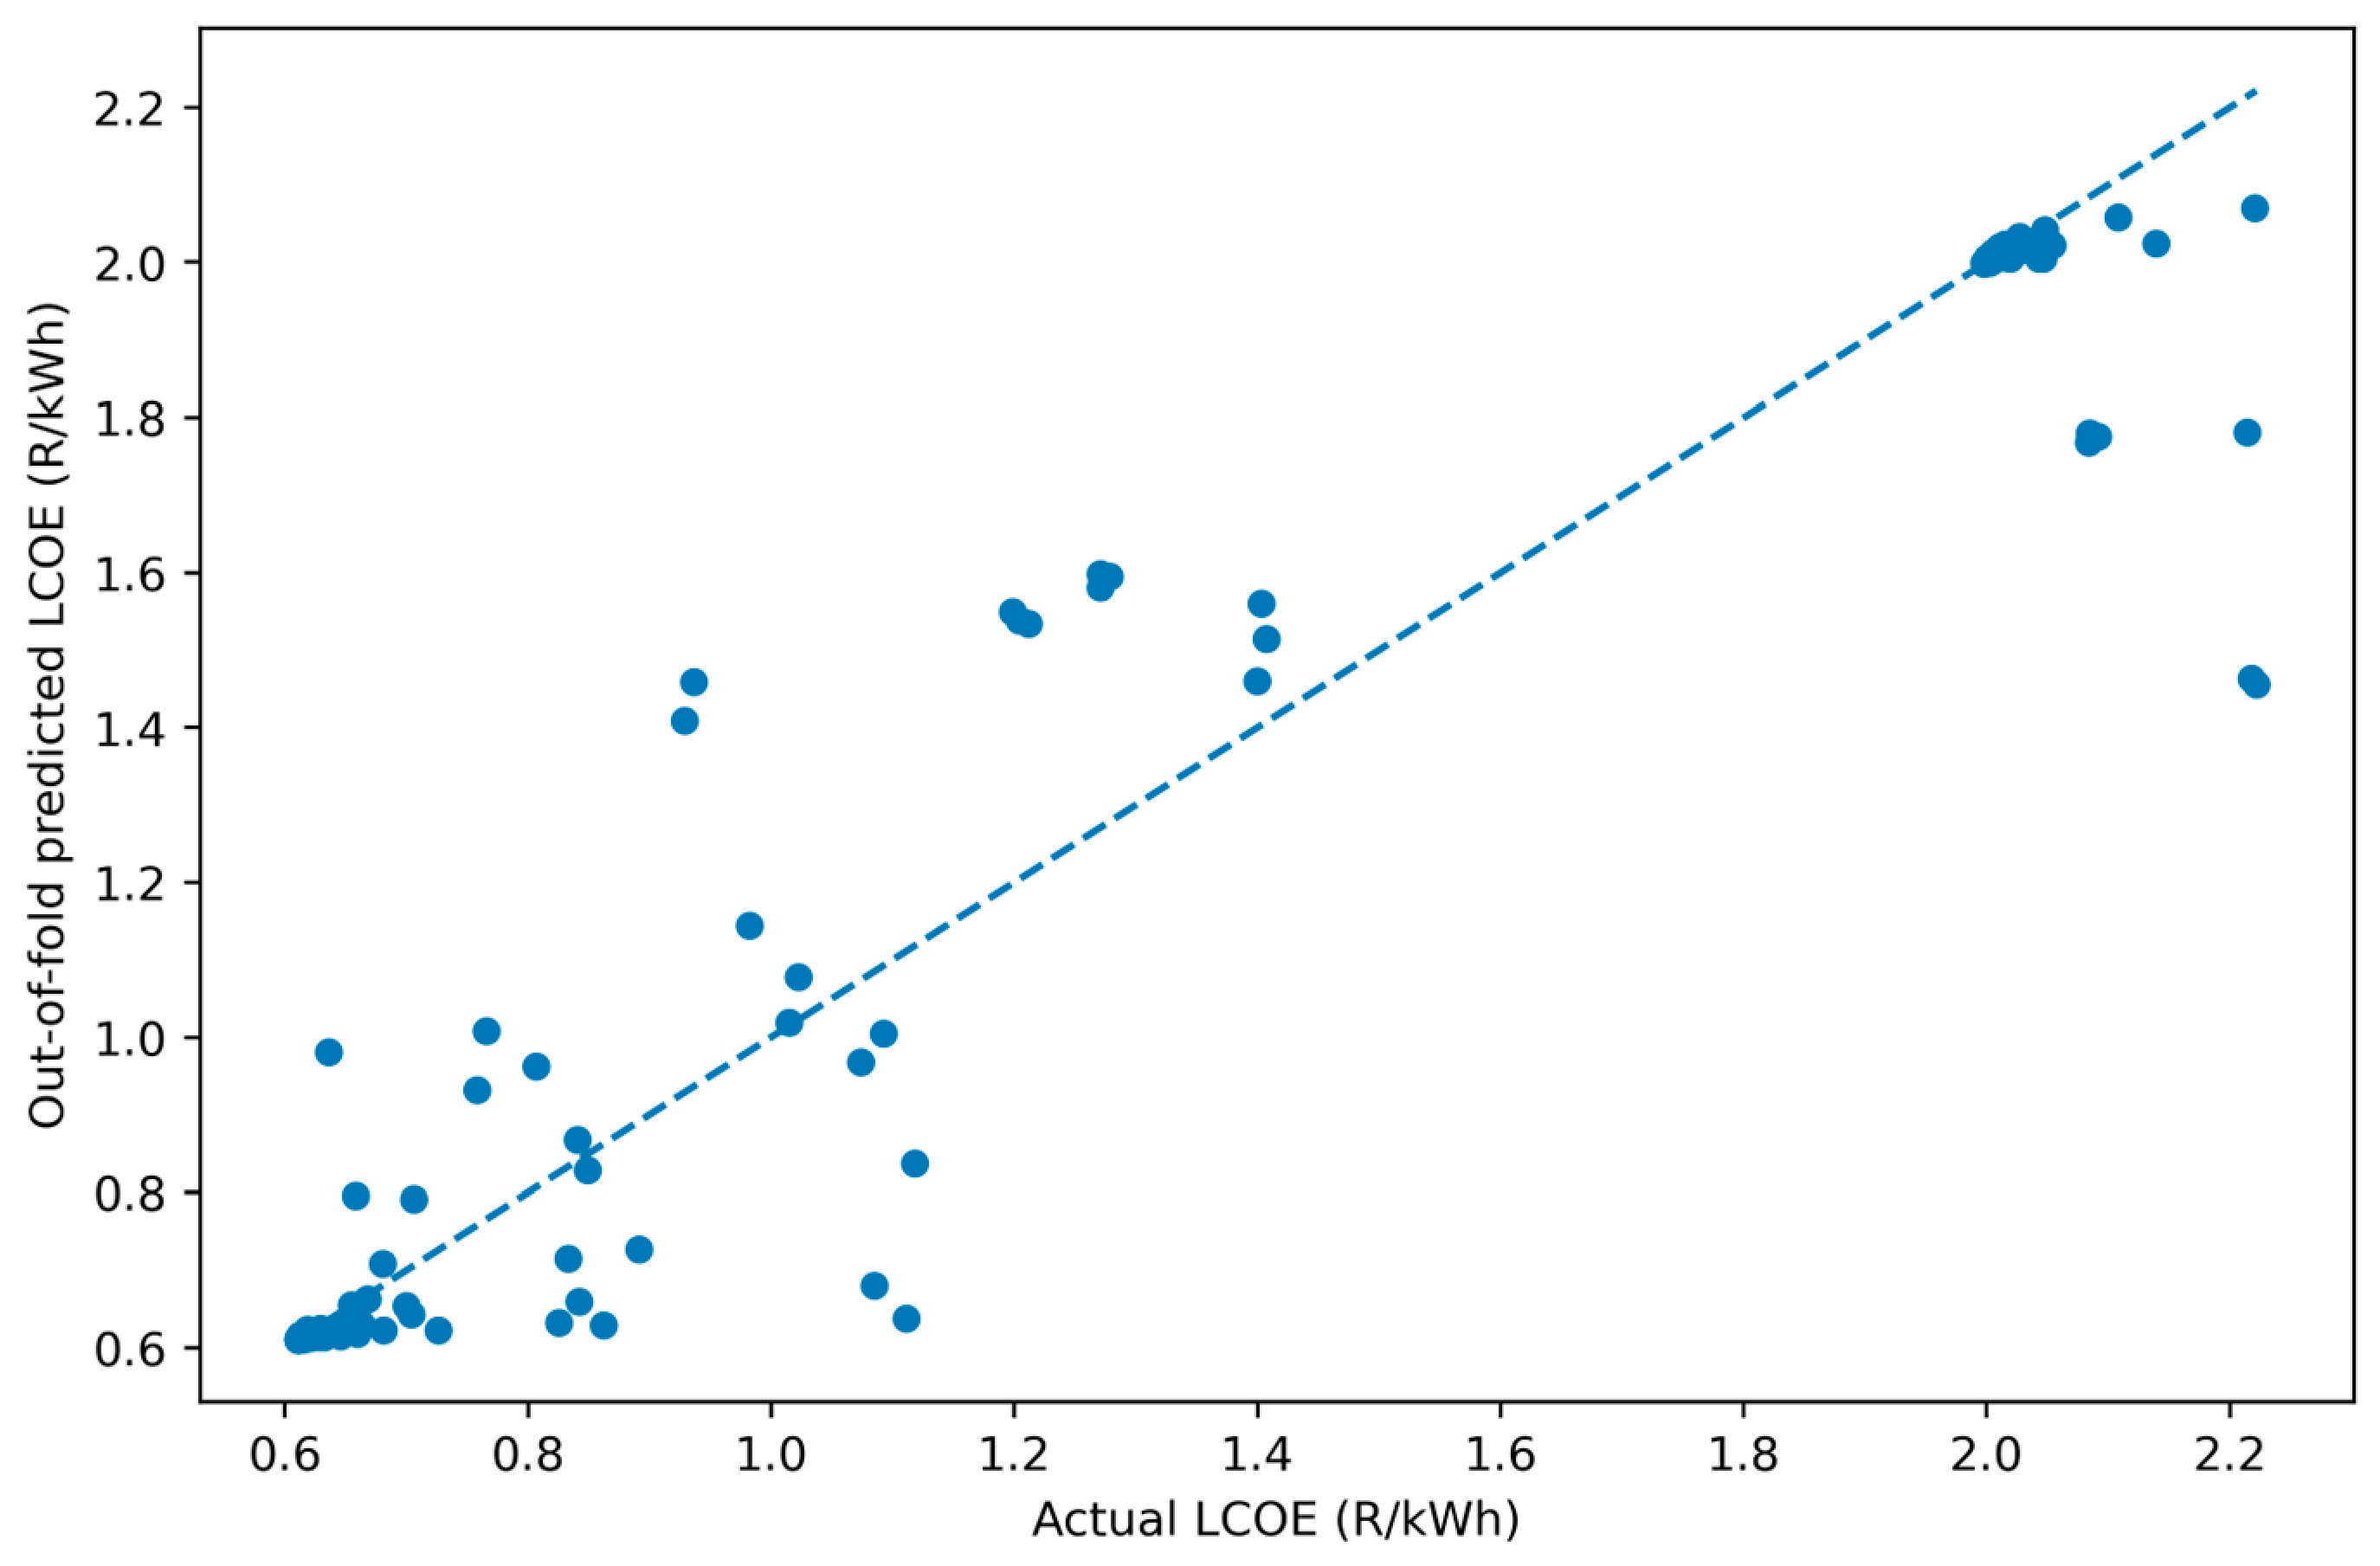
The surrogate model was evaluated by predicting the LCOE as presented in Figure 9. The values obtained from the HOMER Grid optimisation and the surrogate-predicted LCOE values are compared in the scatter plot. The dotted diagonal line in Figure 9 represents the line of best fit between the predicted and actual values. This can be used as a reference for evaluating prediction accuracy. This validation procedure was performed to evaluate the surrogate’s ability to reproduce the techno-economic trend of the original simulation model while retaining strong generalisation performance on the unseen data. The scatter plot revealed a close agreement between the predicted and actual values, implying that the surrogate successfully captured the relationship between the system design variables and the LCOE. This validation procedure allows the metaheuristic algorithms to assess candidate solutions fast while maintaining the characteristics of the original design space.

3.9.3. Classical Metaheuristic Algorithms

Table 10 displays the parameter settings and fairness controls used for all six classical metaheuristic algorithms in this study. This study employs an equal population size of 30 individuals, 100 iterations, and 30 independent runs across all the algorithms. To ensure an objective and unbiased comparison, all algorithms were run under similar computational conditions. This approach minimises performance differences due to varying computational resources, so the results genuinely reflect each algorithm’s search capabilities rather than implementation differences. Under these settings, each population member is evaluated once per iteration, corresponding to 3030 objective-function evaluations per run, including the initial population. Specific control parameters such as the inertia weight and acceleration coefficients for PSO, the crossover and mutation operators for GA, the mutation factor and crossover rate for DE, and the control parameters for GWO, WOA, and SFSA were chosen based on widely accepted values from existing literature. This standardised setup provides a consistent basis for evaluating convergence, optimisation accuracy, computational efficiency, robustness, and statistical performance across different optimisation techniques.
3.9.4. Statistical Performance Evaluation

Algorithm performance was evaluated using convergence curves, final fitness values, computational runtime, robustness, and nearest-observed validation. Friedman rank analysis was used to identify overall performance differences, while Holm-adjusted Wilcoxon signed-rank tests determined statistically significant pairwise differences.

4. Results and Discussion

4.1. Observed Best HOMER Grid Design

The summary of the results for the optimal system configuration identified by HOMER Grid is presented in Table 11. The system consists of a 7.799 kW PV array, 23 lithium-ion battery units, and a 2.560 kW converter, achieving an LCOE of R0.6149/kWh and an NPC of R52,401.45. This configuration represents a balanced compromise between economic performance, renewable energy use, and grid dependency. The LCOE and NPC demonstrate that the system can deliver electricity at a low lifecycle cost while maintaining relatively low capital investment. The economic viability of the system is further demonstrated by the low capital expenditure and annual operating cost of R38,697.39 and R1266.62, respectively.
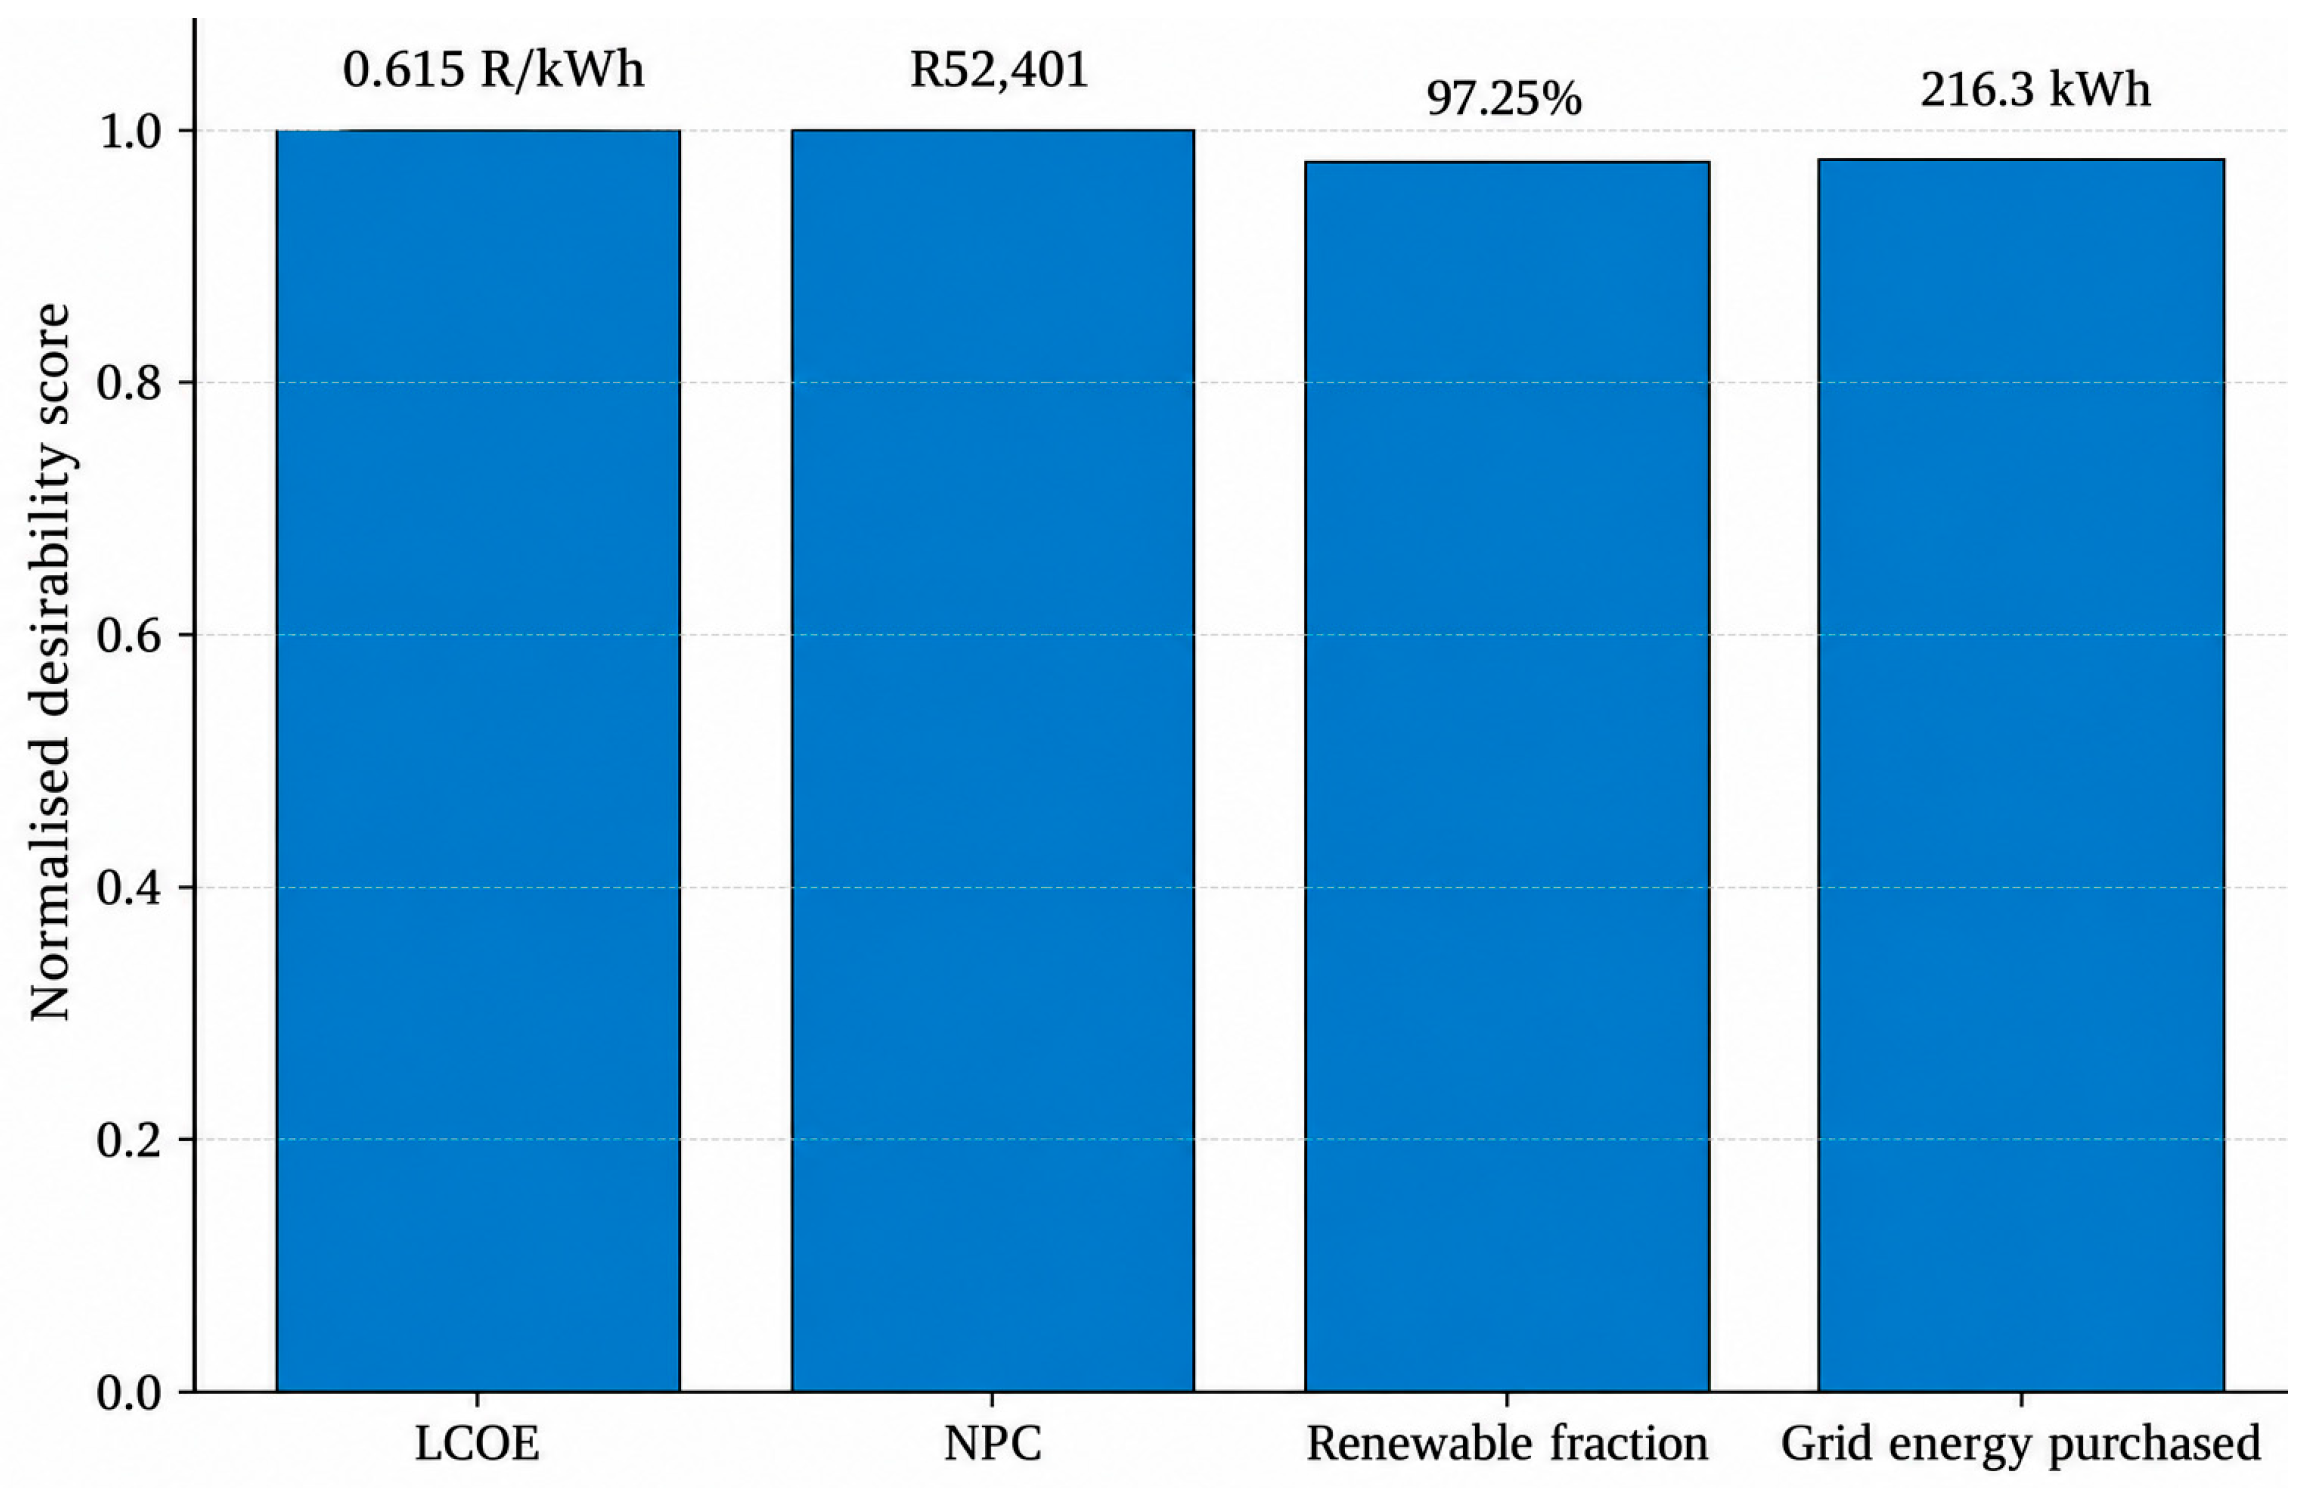
Household energy demand is nearly supplied by PV electricity, as evidenced by a renewable energy fraction of 97.25%, limiting grid purchases to 216.26 kWh/year. The proposed system configuration reduces dependence on the utility grid while maintaining electricity supply reliability. The findings in this study highlight the importance of correctly sizing the PV battery renewable energy system to maximise renewable energy utilisation and minimise grid imports. The financial attractiveness was further demonstrated by the system’s IRR of 59.95% and the simple payback of 1.67 years. The short, simple payback period means that the initial capital investment can be recovered in under 2 years. The 0.010748 composite fitness value is the minimum objective value in the optimisation dataset. The composite fitness value highlights the effectiveness of the selected system configuration’s ability to balance trade-offs between minimising LCOE, NPC, and grid energy purchases while maximising renewable energy utilisation. Figure 10 represents the principal optimisation objectives used to develop the composite fitness function. In this study, the composite function used the LCOE, NPC, renewable energy fraction, and grid energy purchases. The normalised desirability score indicated high uniformity across all objectives, proving that the system is consistent across all optimisation criteria. The proposed multi-objective framework is effective, as proven by the balanced performance depicted in Figure 10.

4.2. HOMER Sensitivity Dataset Analysis

The study evaluated the system performance under varying economic conditions. The sensitivity results are presented in Table 12. The sensitivity analysis results indicate that the optimal system remains stable despite fluctuations in economic parameters. The economic indicators, such as LCOE, NPC, IRR, and simple payback, showed greater variability because they are directly affected by the discount rate and inflation rate. The behaviour of the economic indicators is expected, since the discount and inflation rates directly influence them, even though the physical system configuration remains unchanged. Consequently, the sensitivity results reveal that the proposed optimisation framework generates technically stable designs under varying financial conditions while appropriately reflecting uncertainty in long-term economic conditions.
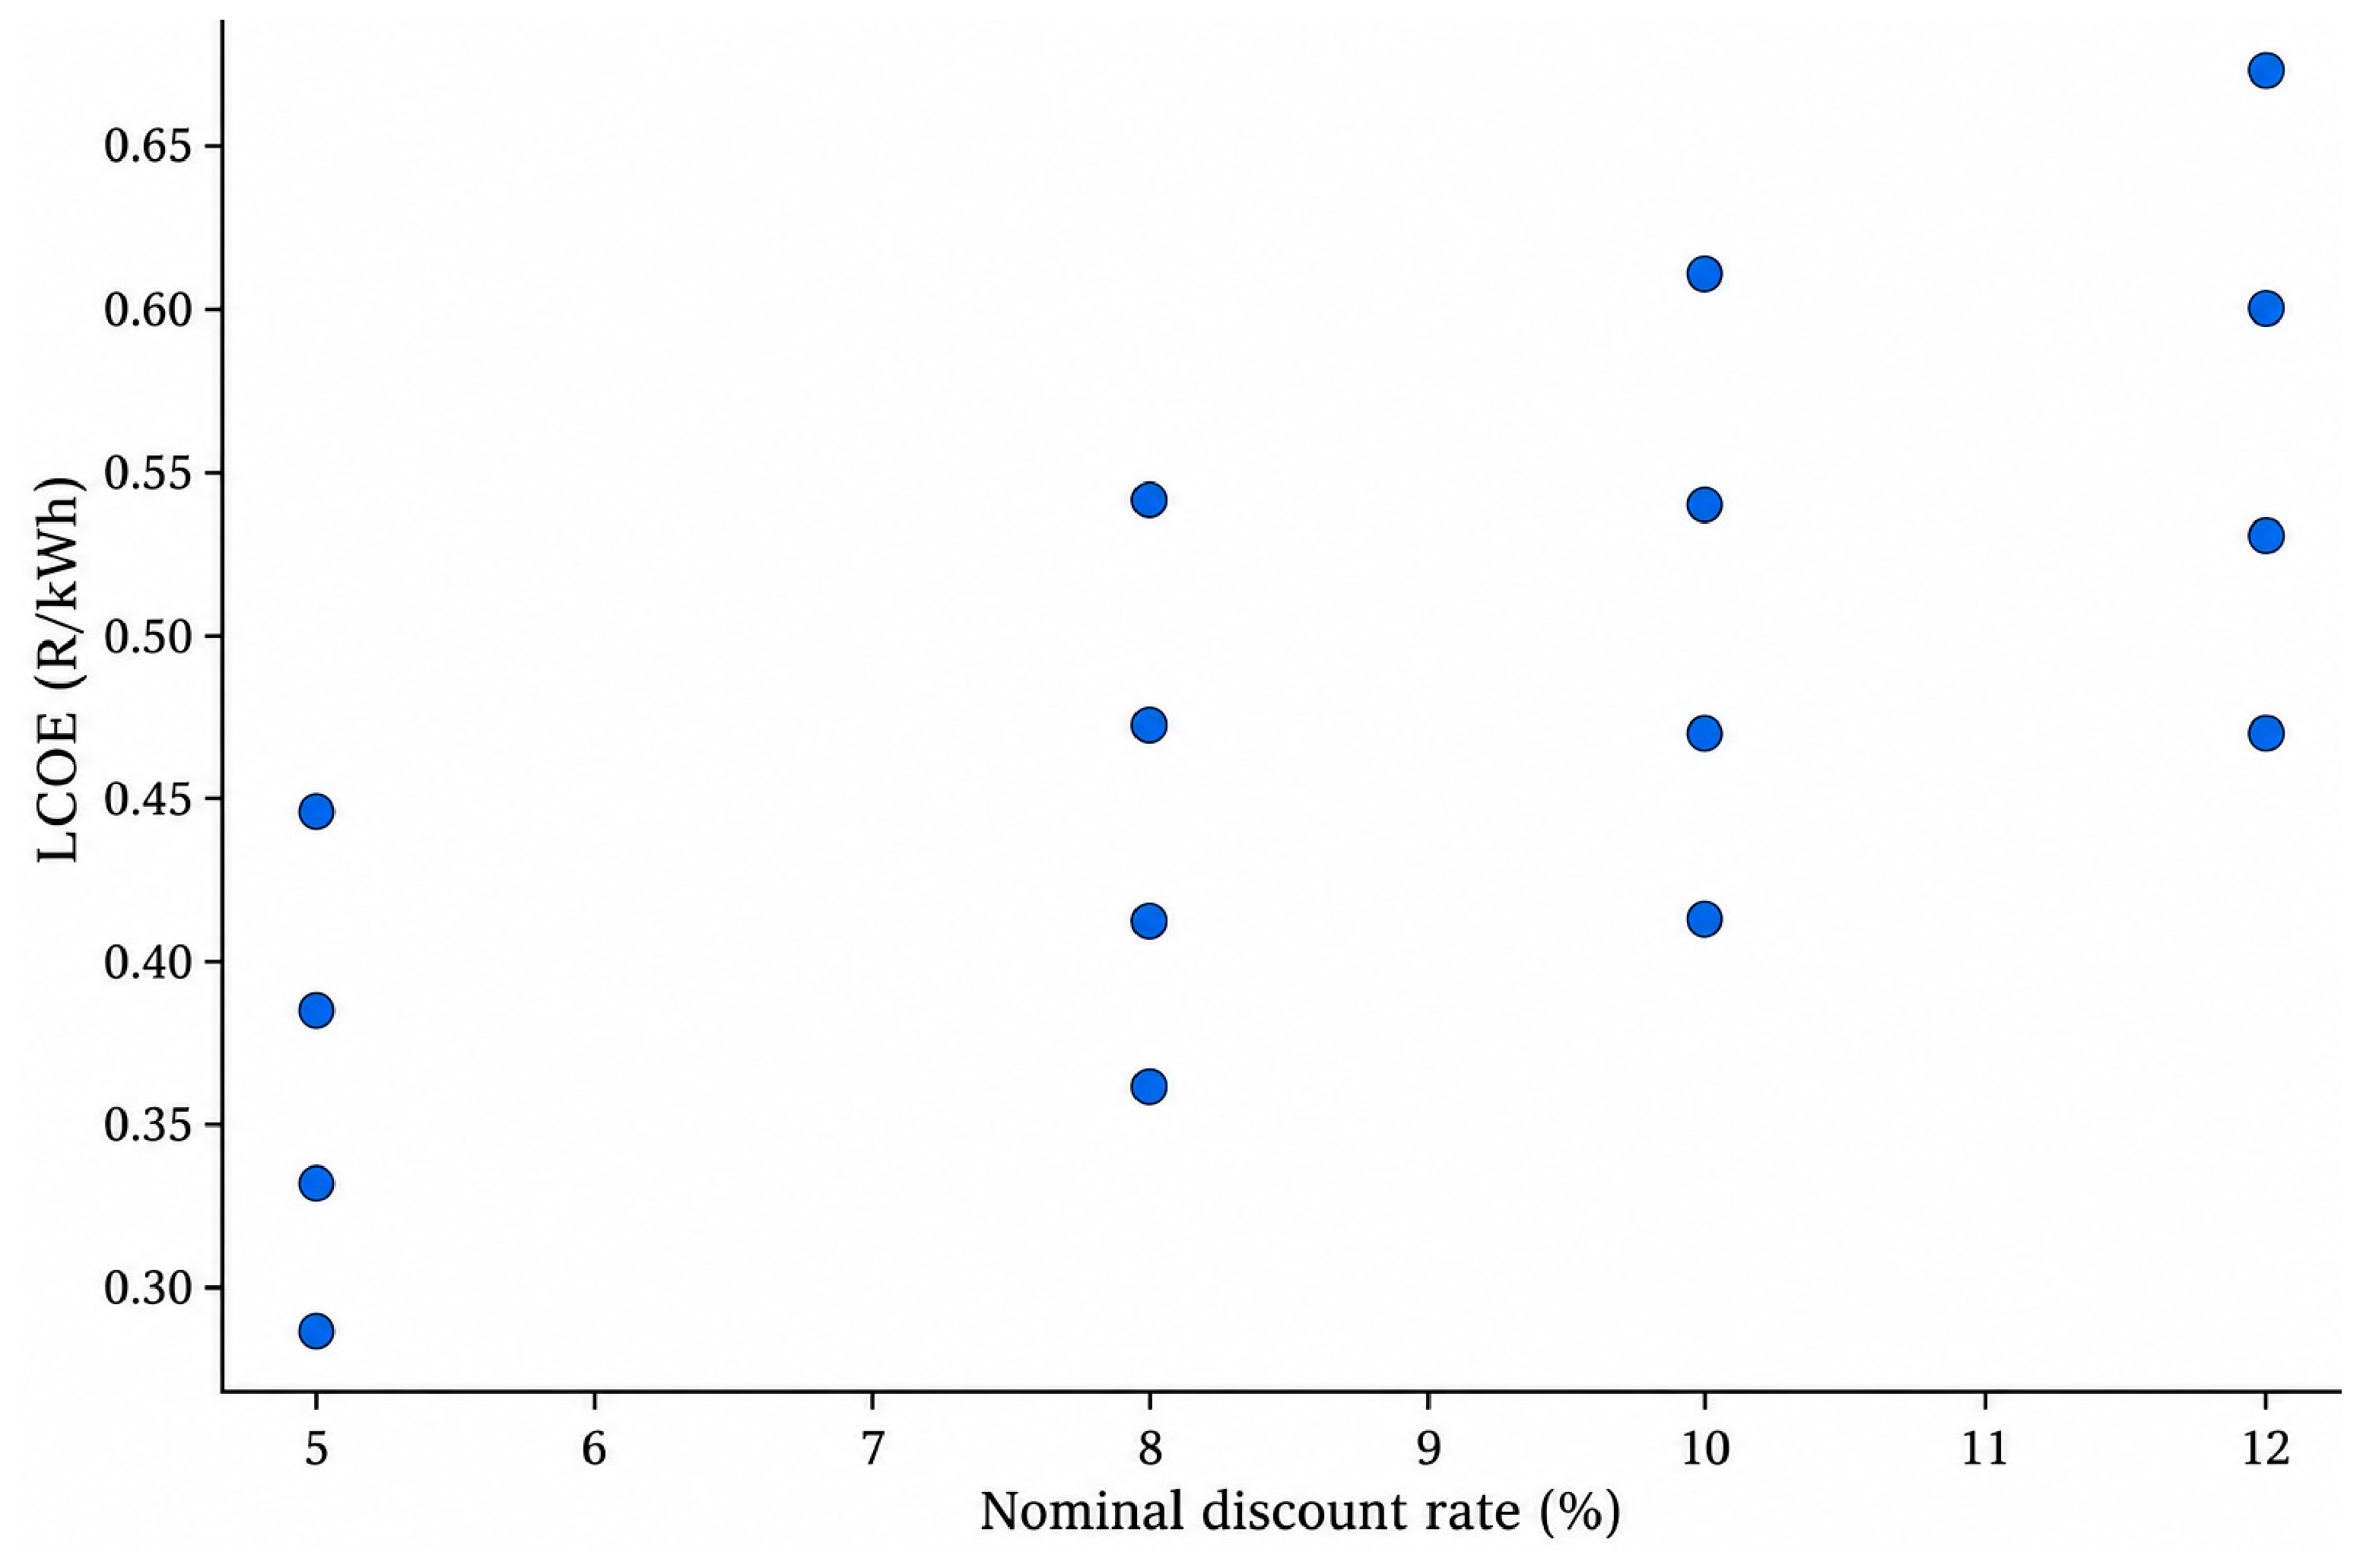
Figure 11 reflects the relationship between the nominal discount rate and LCOE. It is observed that a higher discount rate yields high LCOE values. The present value of lifecycle costs increases under high financial conditions, further confirming that the economic assumptions significantly affect the cost competitiveness of renewable energy systems. These observations emphasise the significance of incorporating financial uncertainty into techno-economic optimisation.
The revised analysis additionally evaluates objective weight sensitivity, iteration-budget stability, NFE, median/IQR and final solution feasibility. The NFE per run is 3030 at 100 iterations, 6030 at 200 iterations and 15,030 at 500 iterations. At 500 iterations, DE, PSO and SFSA all reach the same best-observed fitness. Table 13, Table 14, Table 15 tabulates the objective-weight sensitivity of algorithm ranking (10 independent runs per scenario), Iteration budget and objective function evaluation stability analysis and Robust descriptive statistics, feasibility rates, and numerical near-optimality at 100 iterations respectively.
Table 13. Objective-weight sensitivity of algorithm ranking (10 independent runs per scenario).
Mean FitnessRankAlgorithmWeight Scenario
0.0051741PSOEconomic-heavy
0.0051742SFSAEconomic-heavy
0.0051763DEEconomic-heavy
0.0051784WOAEconomic-heavy
0.0051795GWOEconomic-heavy
0.0051896GAEconomic-heavy
0.0171711DERenewable/grid-heavy
0.0171712SFSARenewable/grid-heavy
0.0171793WOARenewable/grid-heavy
0.0171894GWORenewable/grid-heavy
0.0173225GARenewable/grid-heavy
0.0174536PSORenewable/grid-heavy
0.0143481SFSAEqual weights
0.0143482DEEqual weights
0.0143493PSOEqual weights
0.0143774WOAEqual weights
0.0145125GWOEqual weights
0.0146706GAEqual weights
Table 14. Iteration budget and objective function evaluation stability analysis.
RankMedian FitnessMean FitnessAlgorithmNFE/RunIterations
10.0107480.010748DE3030100
20.0107480.010748SFSA3030100
30.0107480.010748PSO3030100
40.0107540.010760WOA3030100
50.0107710.010829GWO3030100
60.0108050.010835GA3030100
10.0107480.010748DE6030200
20.0107480.010748PSO6030200
30.0107480.010748SFSA6030200
40.0107500.010750WOA6030200
50.0107580.010773GWO6030200
60.0107810.010790GA6030200
10.0107480.010748DE15,030500
10.0107480.010748PSO15,030500
10.0107480.010748SFSA15,030500
40.0107490.010749WOA15,030500
50.0107520.010765GWO15,030500
60.0107690.010772GA15,030500
Table 15. Robust descriptive statistics, feasibility rates, and numerical near-optimality at 100 iterations.
Within 1 × 10⁻⁶ (%)Grid Feasible (%)RF Feasible (%)IQRQ3Q1MedianMeanAlgorithm
100.00001001002.457 × 10−100.0107480.0107480.0107480.010748DE
6.66671001006.773 × 10−50.0108470.0107800.0108050.010835GA
0.0000001001002.027 × 10−40.0109650.0107620.0107710.010829GWO
100.00001001006.940 × 10−90.0107480.0107480.0107480.010748PSO
100.00001001002.271 × 10−120.0107480.0107480.0107480.010748SFSA
3.33331001006.586 × 10−60.0107580.0107510.0107540.010760WOA

4.3. Metaheuristic Algorithms Performance Analysis

The recomputed 100-iteration results are summarised in Table 16. DE achieved the lowest mean final fitness (0.010748466), followed extremely closely by SFSA (0.010748466) and PSO (0.010748478). PSO had the shortest mean runtime (0.0711 s). The differences among the leading methods are very small and budget-dependent; accordingly, the revised interpretation separates mean fitness ranking, statistical ranking and computational cost rather than claiming universal algorithm superiority.
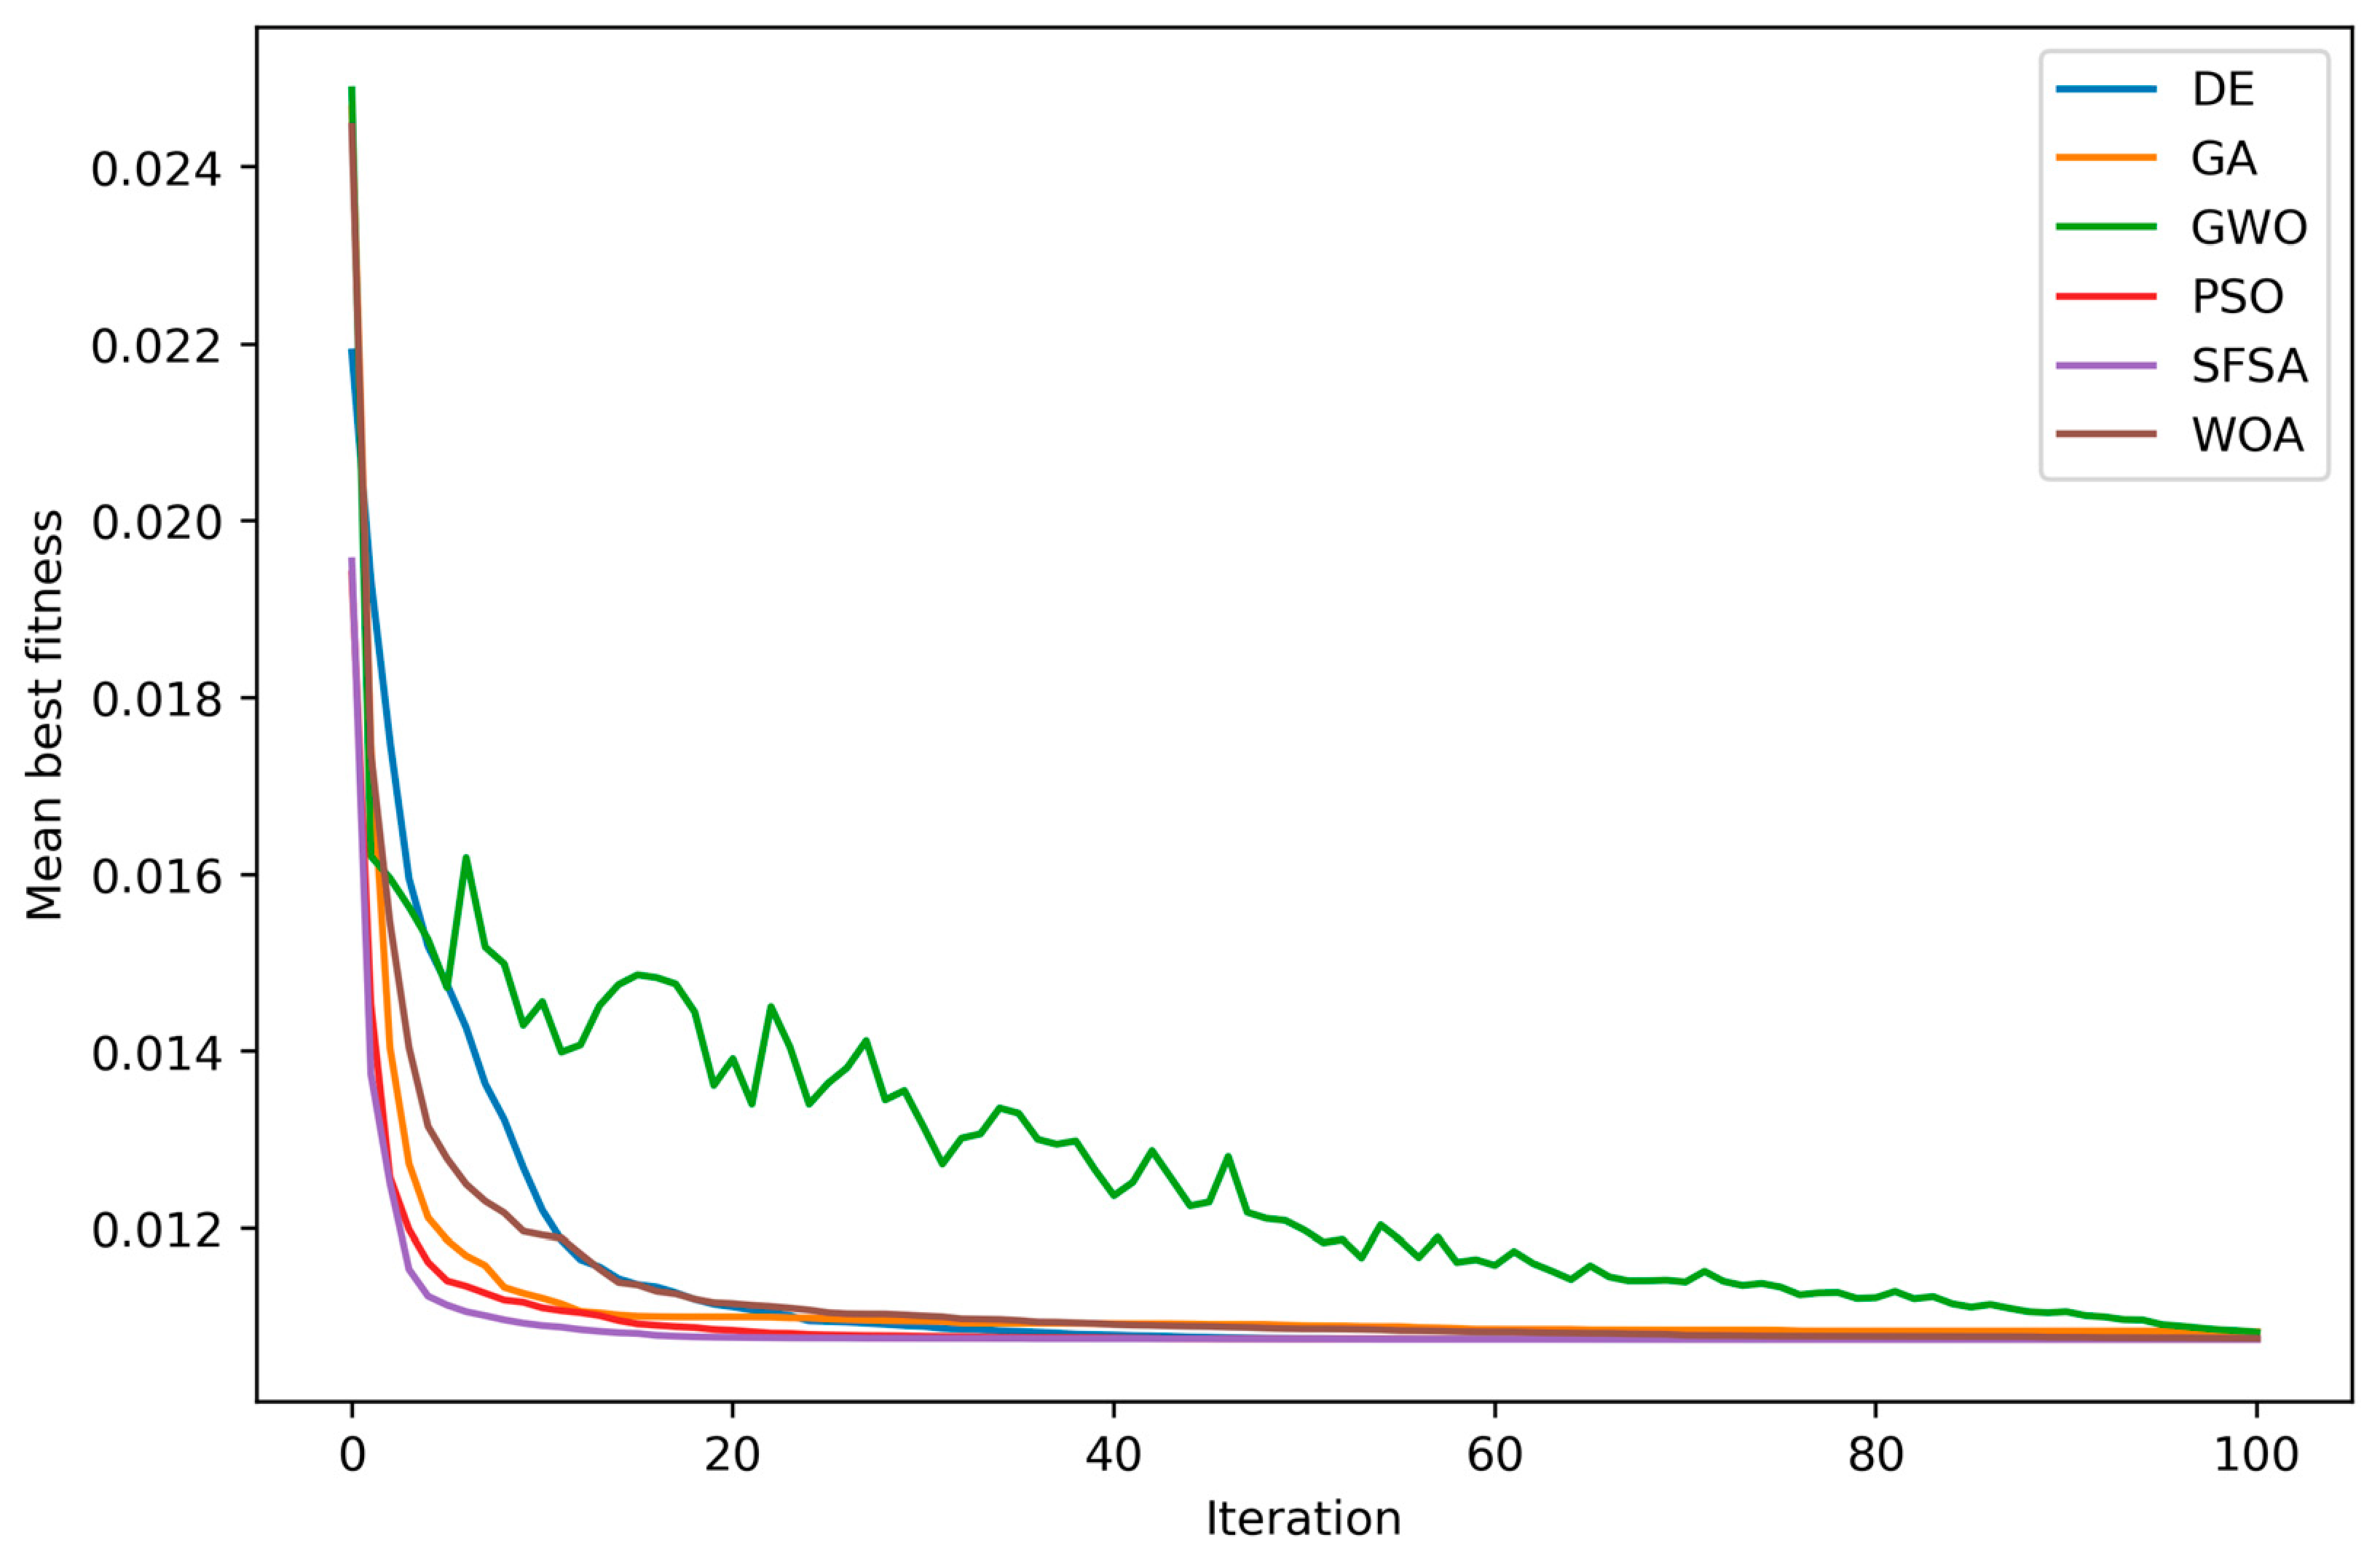
Figure 12 represents the mean convergence curve of each algorithm over 100 iterations. All the algorithms recorded a high mean best fitness value during the first few iterations, while the objective function reduced rapidly during the same period, reflecting the effective global exploration of the search space. However, their subsequent convergence patterns differ considerably. Both DE and PSO converged fast and stabilised near the optimum within the first 20 iterations, demonstrating the algorithm’s efficient exploitation of promising solution zones. SFSA showed a similar convergence trend; however, it required more iterations before stabilising. The convergence rate of GWO was slower, with improvements occurring gradually throughout the optimisation process. Both GA and WOA exhibited slower convergence rates and high fluctuations during the early stages of the iterations. These findings suggest that both DE and PSO have a stronger search efficiency and require fewer iterations to obtain high-quality solutions.
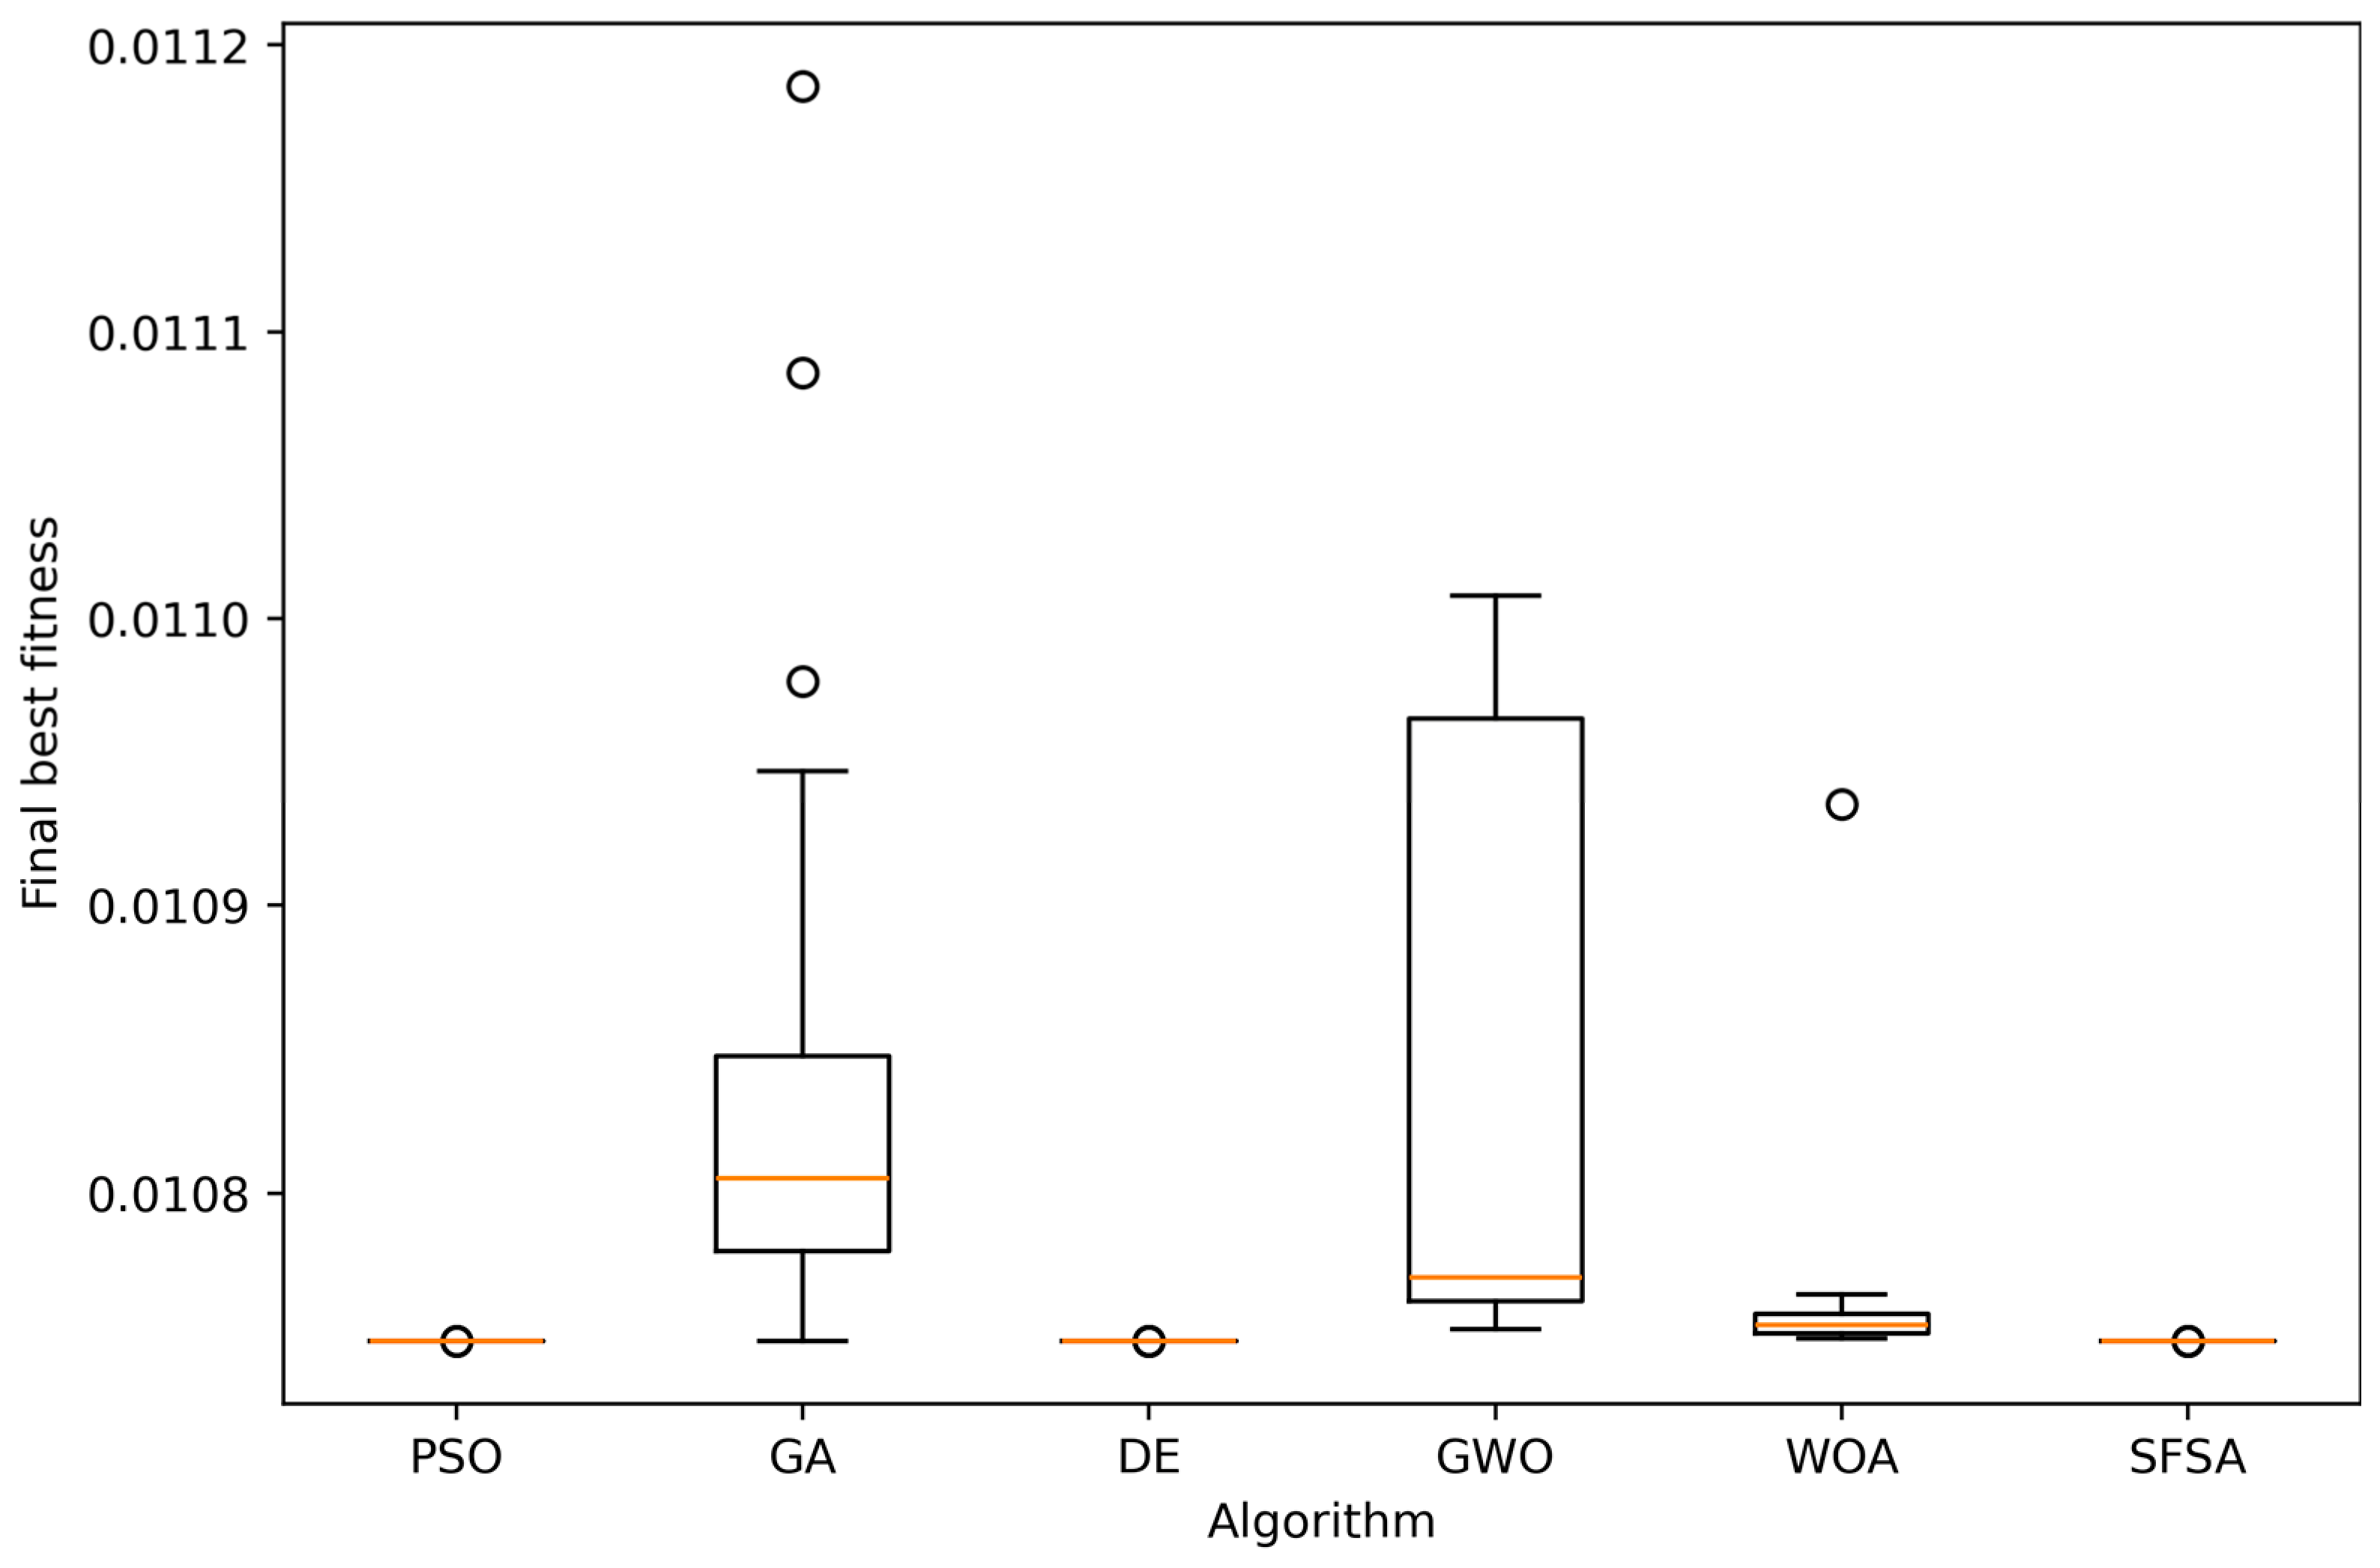
The final best fitness values depicted in Figure 13 represent the robustness of the optimisation algorithms. DE and PSO showed extremely narrow boxplots with little variation between independent runs. These results indicate that both DE and PSO algorithms exhibit high consistency in optimisation performance, and excellent repeatability. The SFSA boxplot was relatively smaller, confirming its robustness. In contrast, the widest distribution of final fitness values was achieved by GA. This means that the GA algorithm is greatly sensitive to random population initialisation and has a relatively higher probability of converging to suboptimal solutions. The best fitness of WOA and GWO was moderate. The variation depicted by both algorithms was acceptable; however, it may be less reliable than that of the top-ranked algorithms.
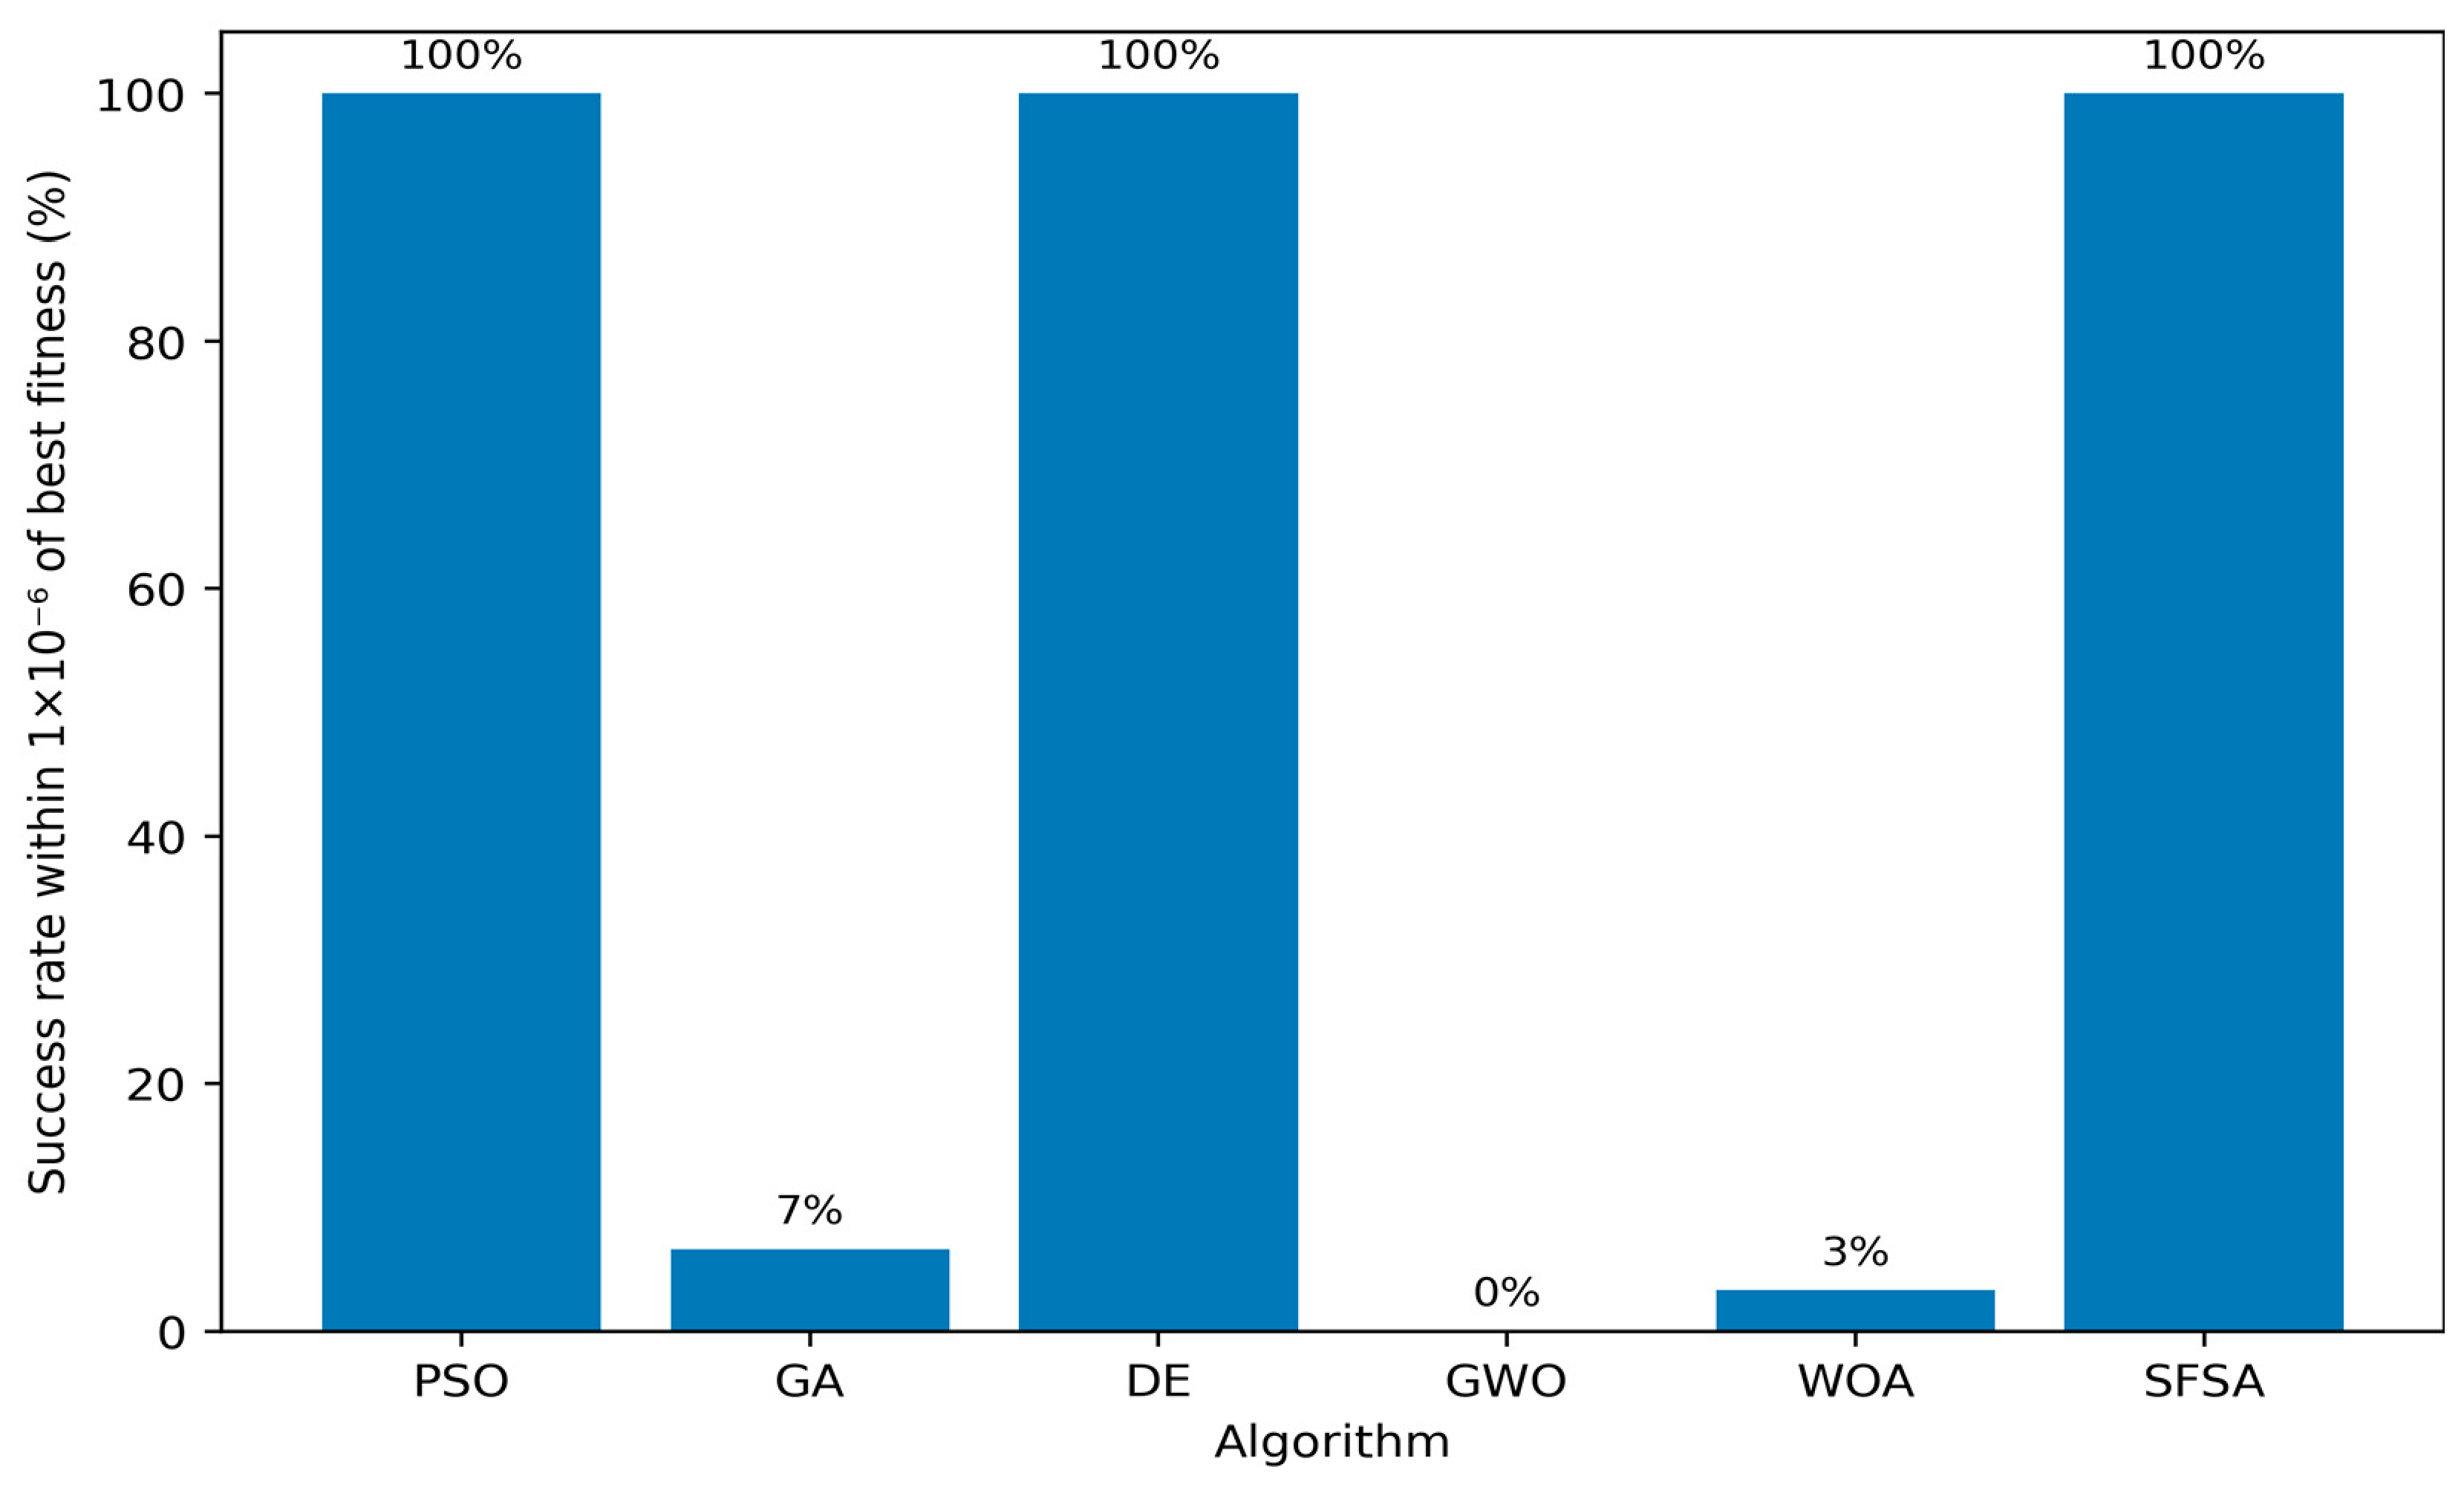
Using the numerical tolerance of 1 × 10⁻⁶ above the best-observed fitness, DE, PSO and SFSA each achieved 100% success in the recomputed primary benchmark. WOA achieved 3.33%, GA 6.67%, and GWO 0%. The tolerance is a stringent numerical repeatability criterion only; it is not an engineering tolerance or proof of global optimality. The 1 × 10 6 tolerance was intentionally selected as a stringent numerical criterion because the near-optimality analysis aimed to evaluate the convergence reliability and repeatability of the six algorithms under evaluation, rather than defining an engineering tolerance. Because composite fitness is a normalised, dimensionless metric, the small absolute tolerance allows us to differentiate between runs that have nearly reached the same numerical minimum and those that are still measurably higher. The best observed fitness was 0.010748, which corresponds to approximately 0.0093% of the best fitness. This threshold represents a conservative numerical test of convergence. Therefore, it is not of independent physical or economic significance. Moreover, practical equivalence is evaluated using the underlying system sizing and techno-economic indicators. Figure 14 and Figure 15 illustrate the Near-optimal convergence reliability within 1 × 10⁻⁶ of the best final fitness and mean computational runtime of the six classical metaheuristic algorithms respectively.
Figure 14. Near-optimal convergence reliability within 1 × 10⁻⁶ of the best final fitness.
Energies 19 04445 g014
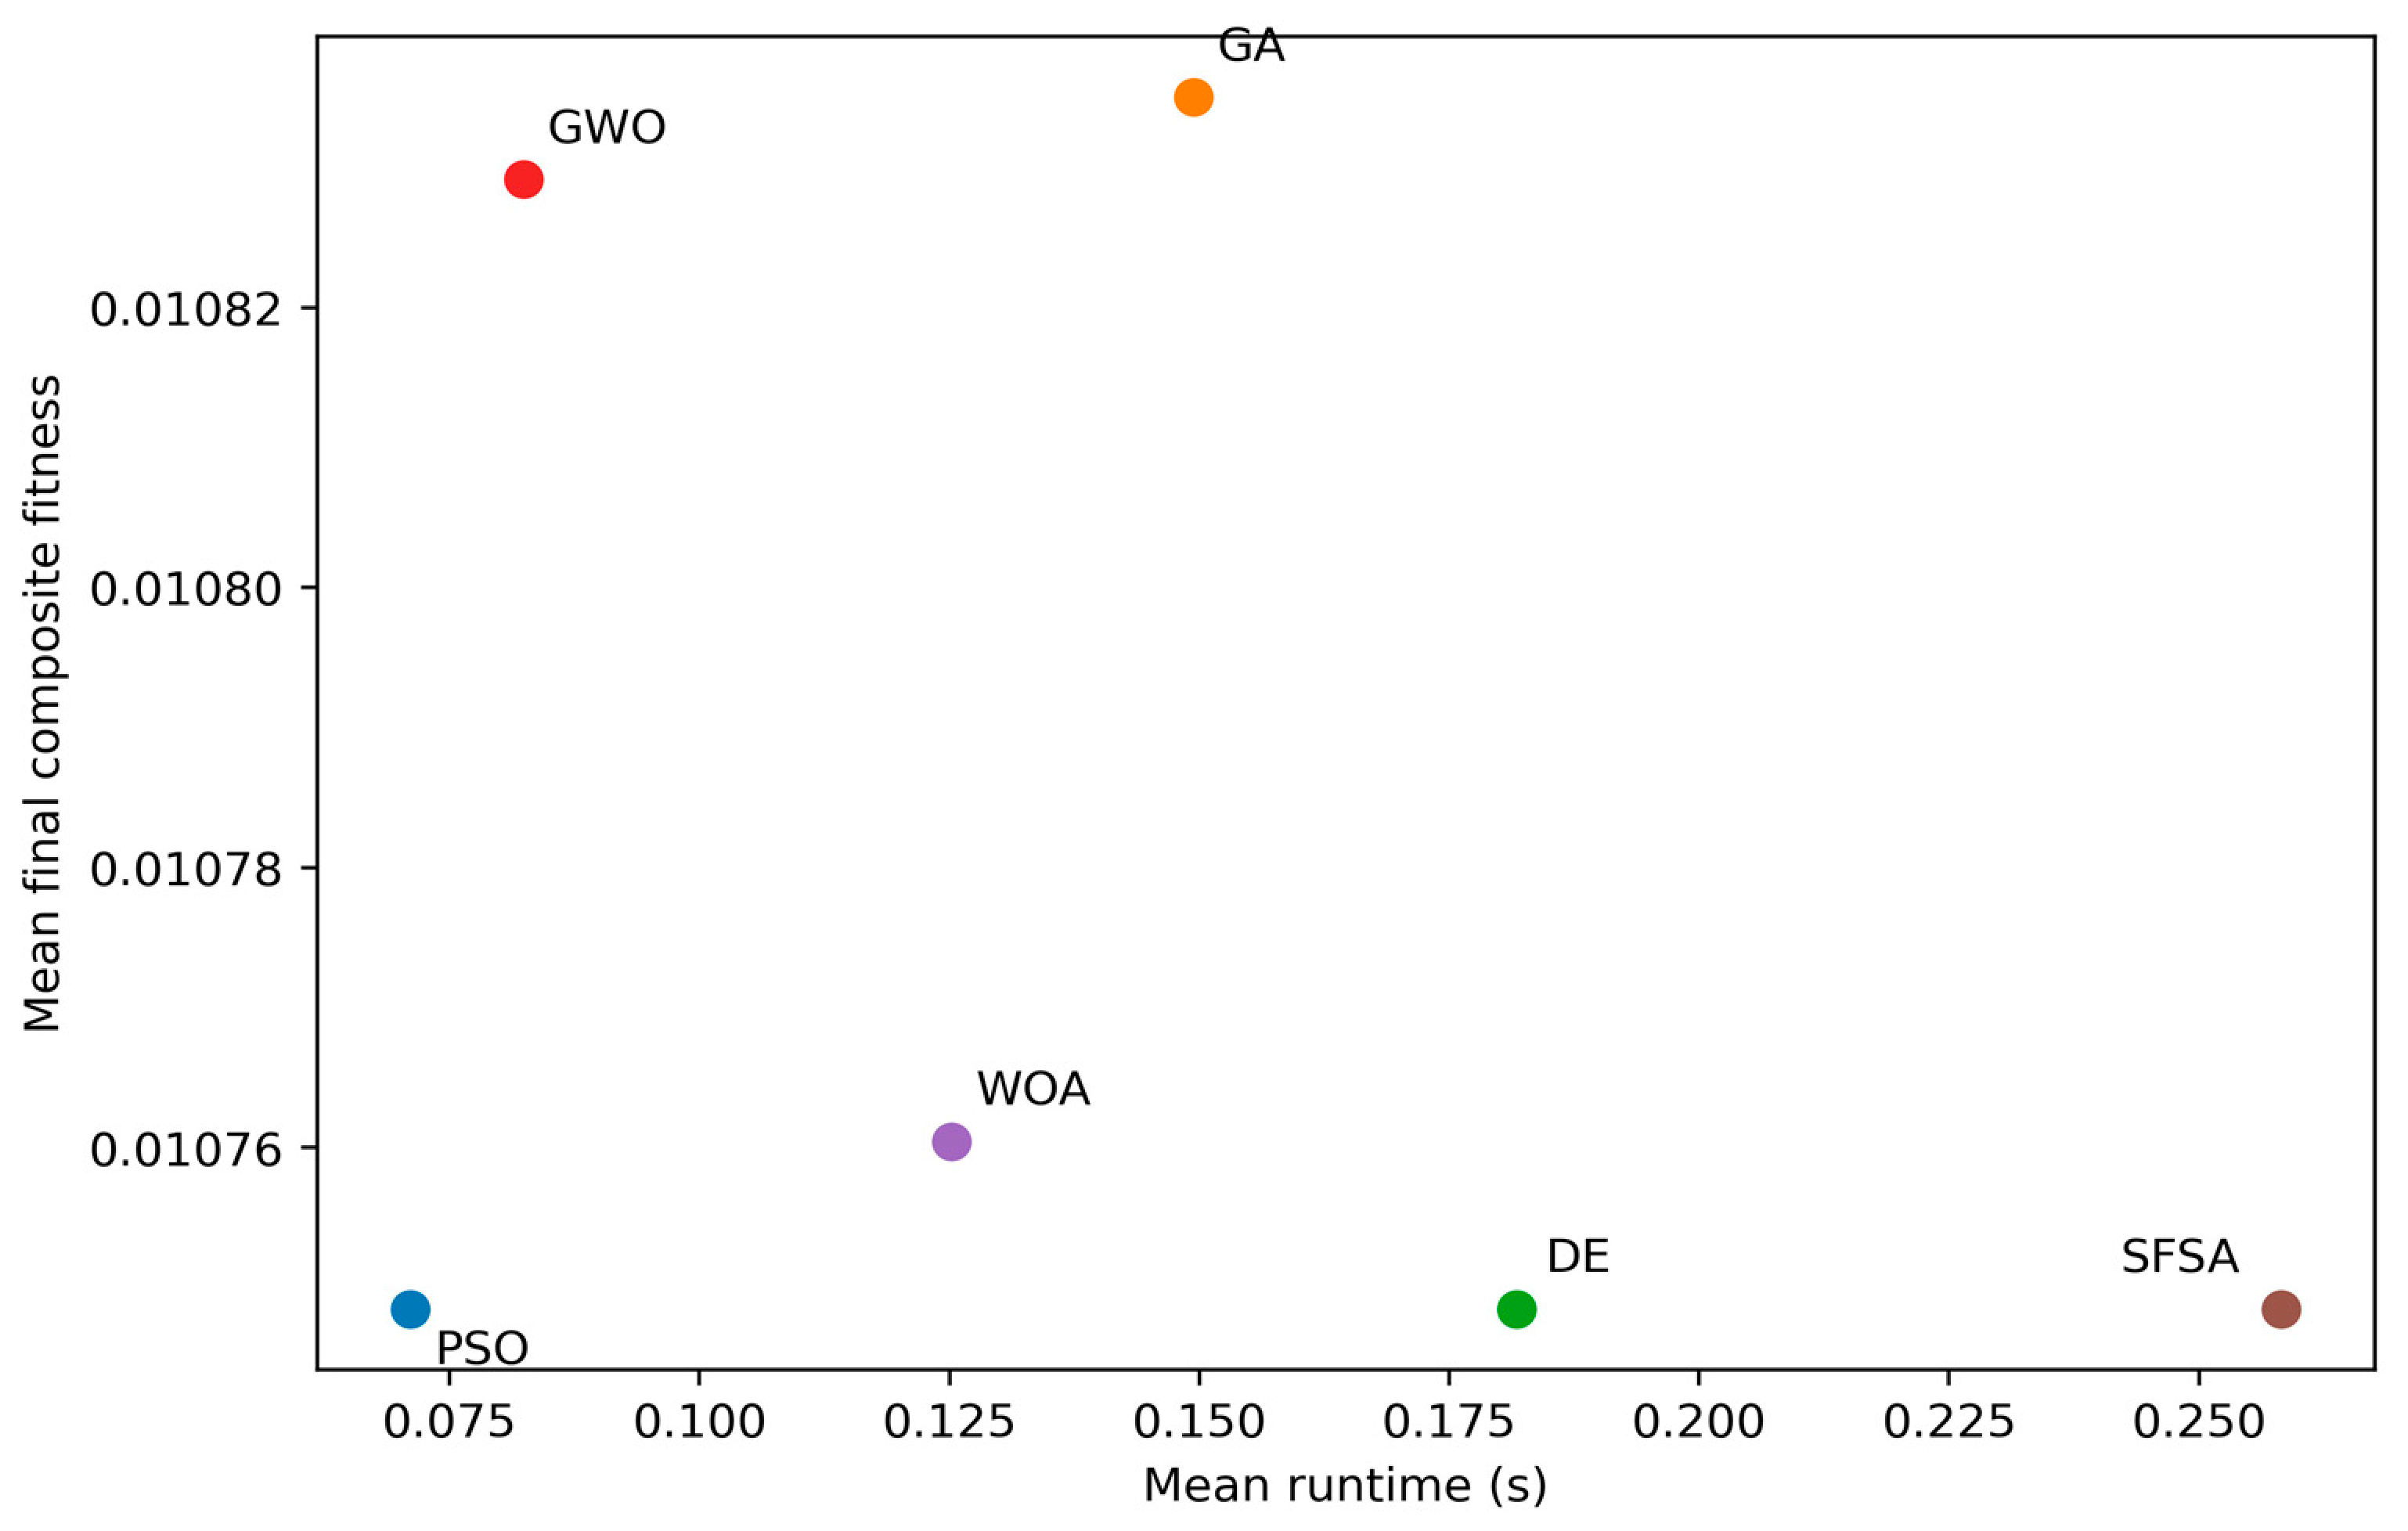
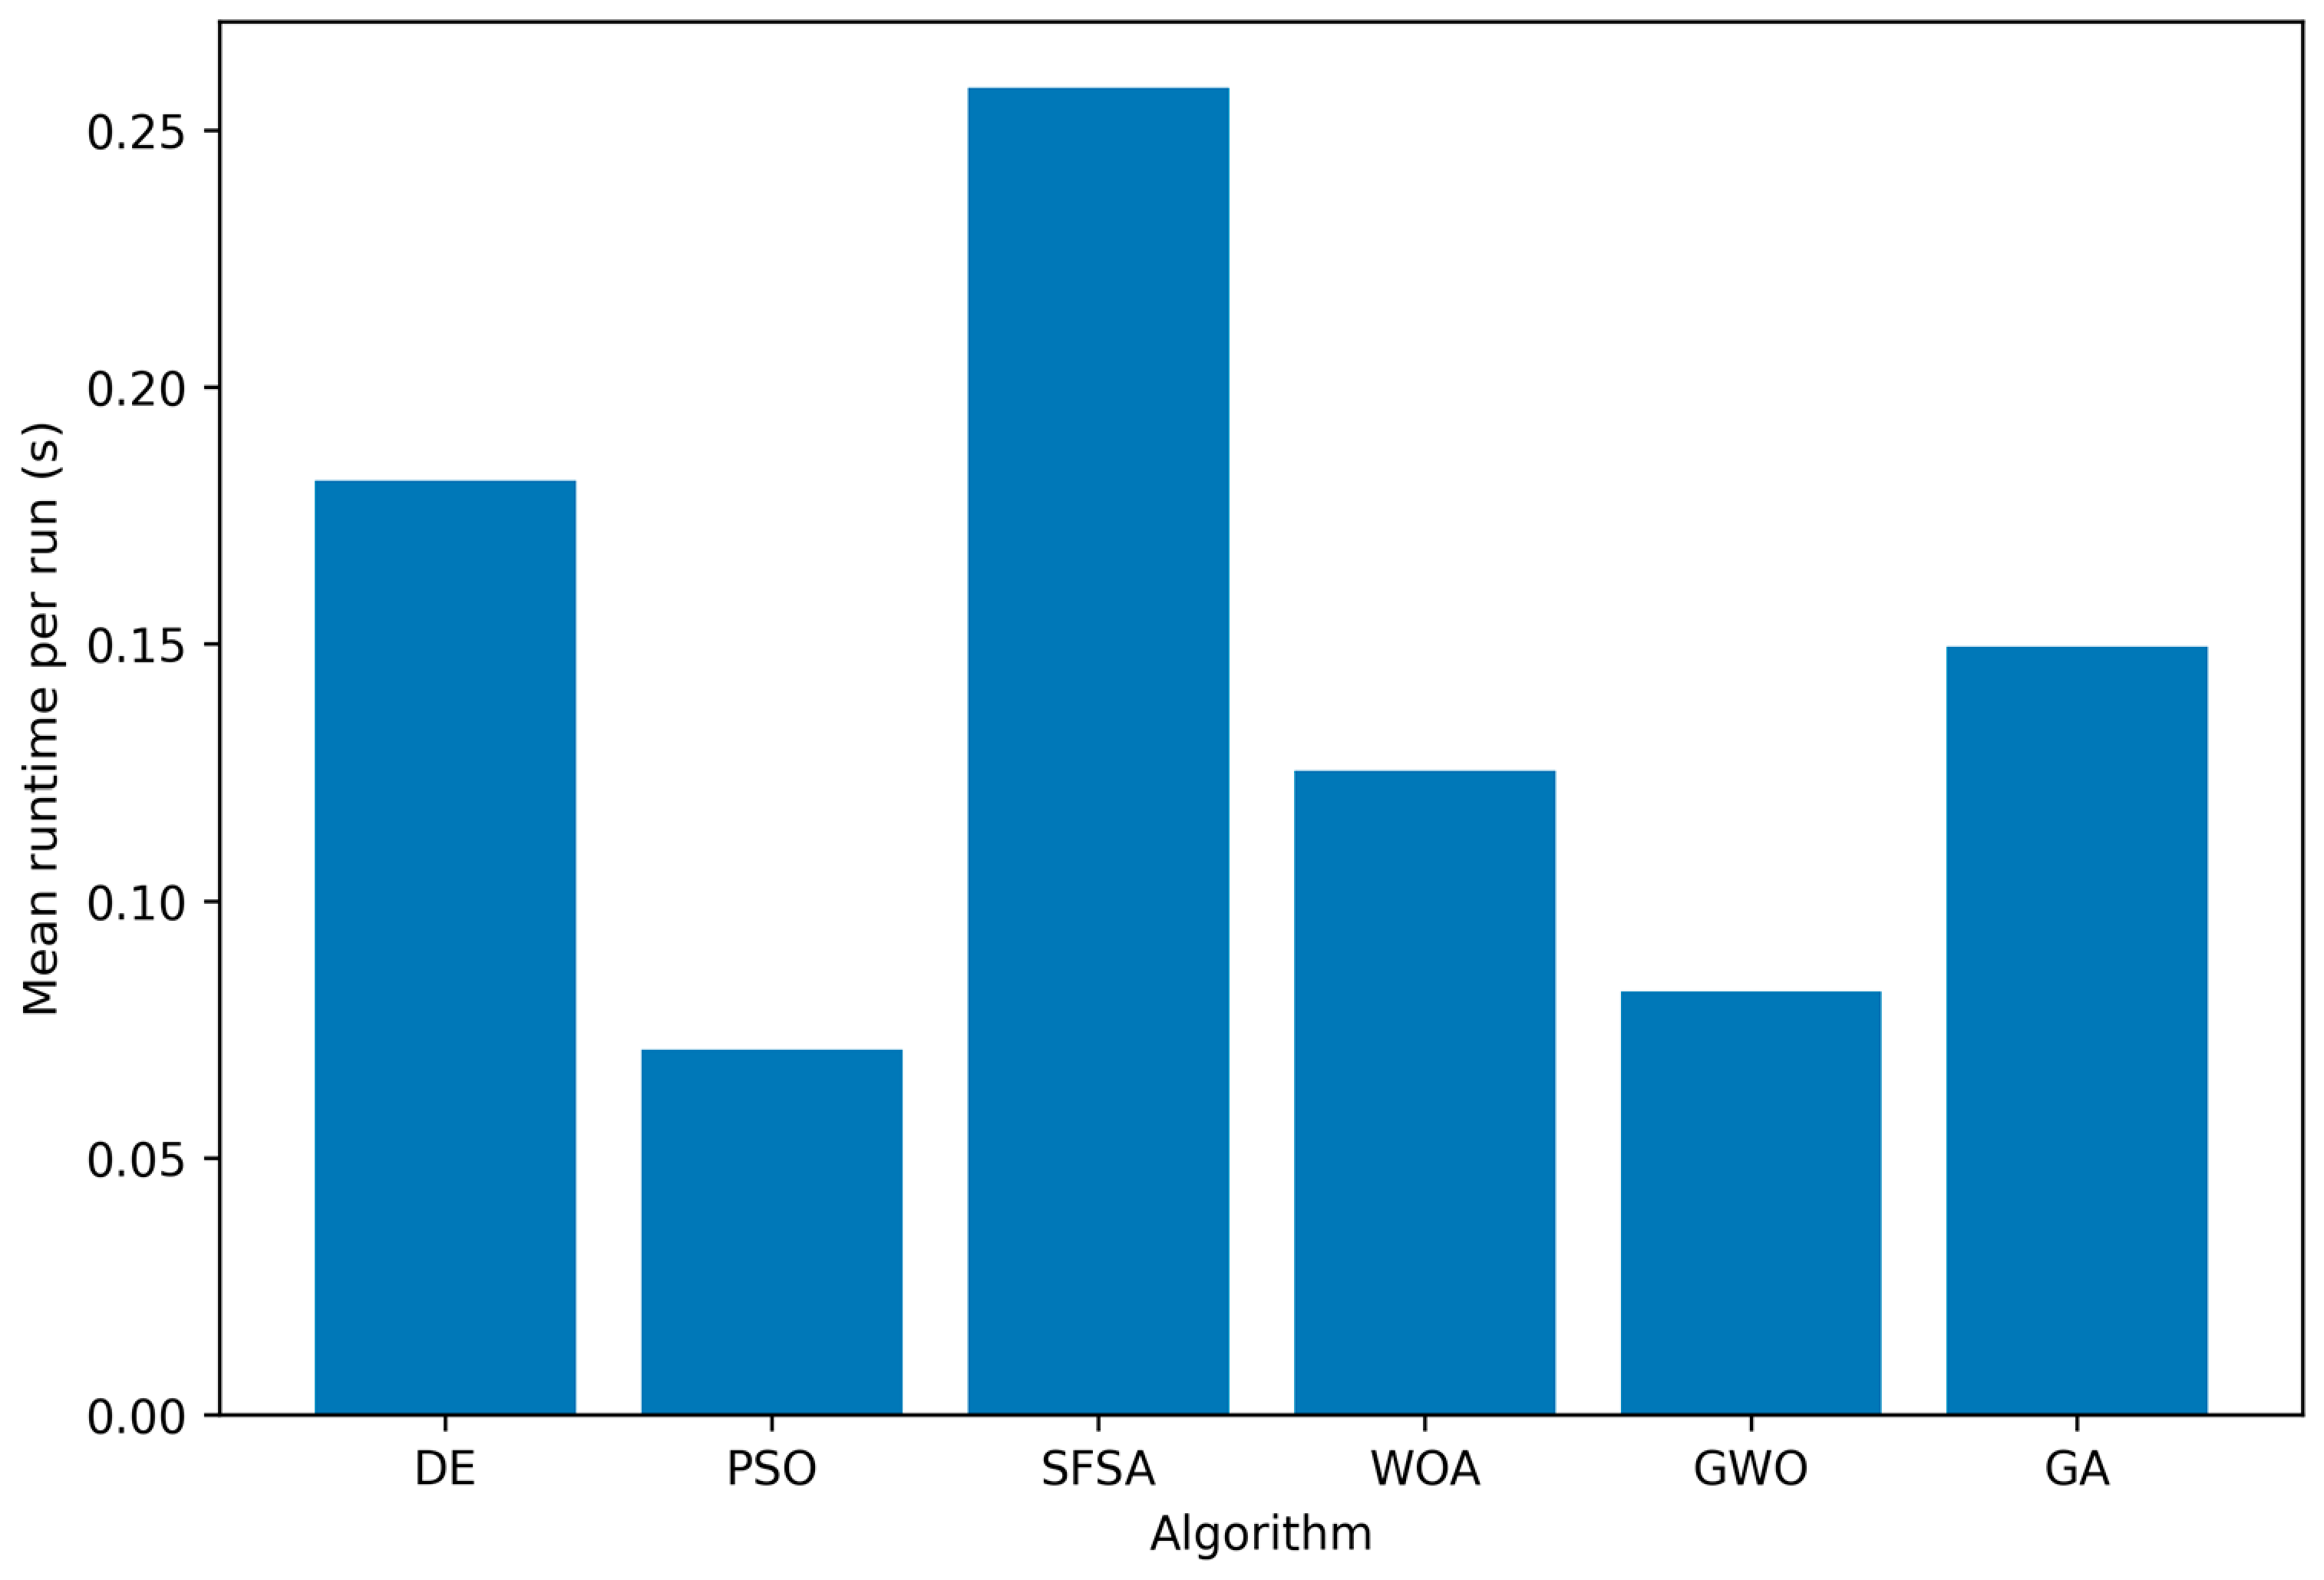
The recomputed mean runtime per 100-iteration run was approximately 0.071 s for PSO, 0.082 s for GWO, 0.125 s for WOA, 0.149 s for GA, 0.182 s for DE and 0.258 s for SFSA. Because all runs are sub-second in this offline sizing problem, these differences are interpreted only in relative computational terms.
Figure 15. Mean computational runtime of the six classical metaheuristic algorithms.
Energies 19 04445 g015
Figure 16 represents the fitness–runtime trade-off. Algorithms positioned in the lower left of the plot simultaneously achieved low fitness values and short execution times, representing a balance between solution quality and computational efficiency. PSO is well-suited to this region, as it combines short execution times with near-optimal performance. Even though DE requires a longer runtime, it achieved the lowest overall fitness, indicating superior optimisation performance among the evaluated algorithms. The optimisation quality of SFSA is considerably comparable; however, it incurred a high computational cost, whereas GA, GWO, and WOA either exhibit poor optimisation performances or less favourable runtime performances.

4.4. Nearest Observed Validation

The nearest observed validation evaluated whether the algorithms identified meaningful regions of the HOMER Grid design landscape. The surrogate-assisted optimisation model was validated using the nearest-observed validation procedure by comparing the surrogate model’s solutions with the closest design in the original optimisation dataset derived by HOMER Grid. The distance was calculated using scaled decision variables such as the PV capacity, battery unit count and converter capacity. This ensured that differences in variable magnitude did not disproportionately influence the nearest neighbour search. By identifying the nearest observed HOMER Grid design, the study verifies that the optimisation algorithms converge towards physically meaningful and practically achievable solutions. The overall comparison between the surrogate model and HOMER Grid-derived results is presented in Table 17.
The SFSA, DE, PSO, and GA results show that these algorithms converged exactly on the nearest observed HOMER Grid configuration. The convergence achieved by these algorithms highlights complete agreement between the surrogate predictions and the original optimisation dataset. These observations increase confidence in the surrogate-assisted optimisation framework, as they show that the algorithms are not exploiting unrealistic interpolation or extrapolation regions of the surrogate model. Although both WOA and GWO generated solutions with minor deviations from the HOMER Grid-derived optimum, their predicted system settings remained extremely close to the feasible HOMER Grid solution. The nearest observed validation of the developed framework shows the reliability of the surrogate model and demonstrates that the optimisation results remained grounded in viable, achievable renewable energy system design. Nearest-observed validation is a critical step in verifying the performance of the kNN surrogate model because it emphasises interpolation within the observed HOMER Grid design space. Furthermore, proximity between surrogate-predicted solutions and the nearest observed solution provides evidence that the resulting best-known solution is grounded in the available simulation data, rather than solely a surrogate extrapolation.

4.5. Statistical Ranking and Pairwise Comparison

The recomputed Friedman and Holm-adjusted Wilcoxon results are presented in Table 18 and Table 19. SFSA obtained the lowest mean Friedman rank (1.10), followed by DE (1.97) and PSO (2.97). The Friedman test was significant (χ2 = 135.79, p = 1.403 × 10⁻²⁷). Pairwise tests against DE were significant for PSO, GA, GWO and WOA after Holm adjustment, whereas SFSA was not significantly different from DE (Holm-adjusted p = 0.999945).
The observation in this study demonstrates that relying on only average optimisation results may lead to misleading conclusions. The statistical analysis indicates that DE, SFSA, and PSO are the most effective classical optimisation algorithms examined. However, DE achieved the best overall performance amongst the evaluated algorithms as it consistently attains the lowest mean fitness. SFSA delivers statistically comparable optimisation results, while PSO converges much more quickly and requires less computational effort.

5. Conclusions

This study benchmarked PSO, GA, DE, GWO, WOA and SFSA on a fixed HOMER Grid-derived PV battery sizing problem. The revised analysis restricts the search to the supported local domain, selects k = 3 by leakage-controlled cross-validation, compares alternative surrogate models, reports NFE, median/IQR, feasibility, objective weight sensitivity and 100/200/500-iteration stability, and corrects the statistical interpretation. DE achieved the lowest mean final fitness at the primary 100-iteration budget; SFSA was statistically indistinguishable from DE, while PSO provided the shortest runtime among the leading methods. At 500 iterations, DE, PSO and SFSA reached the same best-observed fitness. These conclusions are specific to the present three-variable HOMER-derived benchmark.

Author Contributions

Conceptualisation, B.A.T., P.M.M. and S.N.N.; methodology, S.N.N.; software, B.A.T., P.M.M. and S.N.N.; validation, S.N.N., P.M.M. and B.A.T.; formal analysis, S.N.N.; investigation, S.N.N.; resources, S.N.N.; data curation, S.N.N.; writing—original draft preparation, S.N.N.; writing—review and editing, B.A.T. and P.M.M.; visualisation, S.N.N.; supervision, B.A.T. and P.M.M. All authors have read and agreed to the published version of the manuscript.

Funding

This research received no external funding.

Data Availability Statement

The original contributions presented in this study are included in the article. Further inquiries can be directed to the corresponding authors.

Acknowledgments

The authors would like to acknowledge the Department of Mechanical Science and Department of Electrical and Electronic Engineering Technology at the University of Johannesburg for the academic support provided during this study.

Conflicts of Interest

The authors declare no conflicts of interest.

References

  1. Riayatsyah, T.M.I.; Geumpana, T.A.; Fattah, I.R.; Rizal, S.; Mahlia, T.I. Techno-economic analysis and optimisation of campus grid-connected hybrid renewable energy system using HOMER grid. Sustainability 2022, 14, 7735. [Google Scholar] [CrossRef] [Scilit]
  2. Kumba, H.; Akpan, J.; Twite, B.; Olanrewaju, O. Renewable energy adoption and integration in South Africa: An overview. In Proceedings of the 12th International Conference on Clean and Green Energy (ICCGE 2023), Xiamen, China, 25–27 May 2023; pp. 74–87. [Google Scholar] [CrossRef] [Scilit]
  3. Tiong, T.; Wong, K.I.; Wong, W.K.; Chew, I.M. Technoeconomic Analysis for Microgrid Renewable Energy with Battery and Hydrogen Storage. In Proceedings of the 2022 IEEE 12th Annual Computing and Communication Workshop and Conference (CCWC), Las Vegas, NV, USA, 26–29 January 2022; pp. 0829–0835. [Google Scholar] [CrossRef] [Scilit]
  4. Van Thanh, N. Sustainable Energy Source Selection for Industrial Complex in Vietnam: A Fuzzy MCDM Approach. IEEE Access 2022, 10, 50692–50701. [Google Scholar] [CrossRef] [Scilit]
  5. Nwajei, D.M.; Bahlouli, K. Selection of the Optimal Hybrid Renewable Energy System Using Exergy-based MCDM—A Case Study of Gonyeli. In Proceedings of the 2025 9th International Conference on Environment Friendly Energies and Applications (EFEA), Newcastle upon Tyne, UK, 4–5 December 2025; pp. 1–6. [Google Scholar] [CrossRef] [Scilit]
  6. Nurunnabi, M.; Roy, N.K. Grid connected hybrid power system design using HOMER. In Proceedings of the 2015 International Conference on Advances in Electrical Engineering (ICAEE), Dhaka, Bangladesh, 17–19 December 2015; pp. 18–21. [Google Scholar] [CrossRef] [Scilit]
  7. Tchintchui, B.P.P.; Raji, A.K. Techno-economic analysis of a renewable energy solution for an off-grid residence. In Proceedings of the 2019 International Conference on the Domestic Use of Energy (DUE), Wellington, South Africa, 25–27 March 2019; pp. 43–50. [Google Scholar]
  8. AlKassem, A.; Khan, Z.A.; Alkabi, M.; Alharbi, B.; Kazmi, S.A.A.; Al-Haddad, K. An Improved MCDM Model to Support Smart Energy Management System in Smart Grid Paradigm. IEEE Access 2025, 13, 102407–102420. [Google Scholar] [CrossRef] [Scilit]
  9. Maghami, M.R.; Lukose, J.; Thang, K.F.; Mutambara, A. Optimization of Hybrid Renewable Energy Systems for Rural Electrification: A Multi-Objective and Multi-Criteria Decision-Making Approach. In Proceedings of the TENCON 2025-2025 IEEE Region 10 Conference (TENCON), Kota Kinabalu, Malaysia, 27–30 October 2025; pp. 1842–1847. [Google Scholar] [CrossRef] [Scilit]
  10. Salehi, M.; Khanali, M.; Ghasemi-Mobtaker, H. Techno-economic analysis of renewable hybrid system microgrids for minimizing grid power outages in residential areas. Clean. Eng. Technol. 2025, 25, 100924. [Google Scholar] [CrossRef] [Scilit]
  11. Yazhini, K.; Aarthi, N. Optimal Sizing of Rural Microgrid using HOMER Pro Software. In Proceedings of the 2022 IEEE 7th International Conference on Recent Advances and Innovations in Engineering (ICRAIE), Mangalore, India, 1–3 December 2022; pp. 455–460. [Google Scholar] [CrossRef] [Scilit]
  12. Tomar, V.; Bansal, M.; Singh, P. Metaheuristic algorithms for optimization: A brief review. Eng. Proc. 2023, 59, 238. [Google Scholar] [CrossRef] [Scilit]
  13. Abdollahzadeh, B.; Gharehchopogh, F.S.; Mirjalili, S. African vultures optimization algorithm: A new nature-inspired metaheuristic algorithm for global optimization problems. Comput. Ind. Eng. 2021, 158, 107408. [Google Scholar] [CrossRef] [Scilit]
  14. Hussain, K.; Mohd Salleh, M.N.; Cheng, S.; Naseem, R. Metaheuristic research: A comprehensive survey. Artif. Intell. Rev. 2019, 52, 2191–2233. [Google Scholar] [CrossRef] [Scilit]
  15. Sutikno, T. Fuzzy optimization and metaheuristic algorithms. Babylon. J. Math. 2023, 2023, 59–65. [Google Scholar] [CrossRef] [Scilit]
  16. Wong, W.; Ming, C.I. A Review on Metaheuristic Algorithms: Recent Trends, Benchmarking and Applications. In Proceedings of the 2019 7th International Conference on Smart Computing & Communications (ICSCC), Sarawak, Malaysia, 28–30 June 2019; pp. 1–5. [Google Scholar] [CrossRef] [Scilit]
  17. Zhang, T.; Li, W.; Wang, R. Surrogated-assisted multimodal multi-objective optimization for hybrid renewable energy system. Complex Intell. Syst. 2023, 9, 4075–4087. [Google Scholar] [CrossRef] [Scilit]
  18. Srithapon, C.; Fuangfoo, P.; Ghosh, P.K.; Siritaratiwat, A.; Chatthaworn, R. Surrogate-Assisted Multi-Objective Probabilistic Optimal Power Flow for Distribution Network with Photovoltaic Generation and Electric Vehicles. IEEE Access 2021, 9, 34395–34414. [Google Scholar] [CrossRef] [Scilit]
  19. Kaewdornhan, N.; Srithapon, C.; Chatthaworn, R. Electric Distribution Network with Multi-Microgrids Management Using Surrogate-Assisted Deep Reinforcement Learning Optimization. IEEE Access 2022, 10, 130373–130396. [Google Scholar] [CrossRef] [Scilit]
  20. Islam, S.; Mostaghim, S.; Hartmann, M. Experimental evaluation of microgrid energy management using surrogate-assisted optimization on PHIL and smart grid systems. Algorithms 2026, 19, 454. [Google Scholar] [CrossRef] [Scilit]
  21. Zhang, Z.; Zhang, Z.; Lei, Z.; Xiong, R.; Cheng, J.; Gao, S. Surrogate-Assisted Differential Evolution for Wave Energy Converters Optimization. IEEE Trans. Emerg. Top. Comput. Intell. 2024, 1–5. [Google Scholar] [CrossRef] [Scilit]
  22. Manesh, M.H.K.; Mohammadi, L.; Rabeti, S.A.M. A gradient boosting surrogate-assisted multi-objective optimization framework for steam thermal power plants. Energy Rep. 2026, 15, 109059. [Google Scholar] [CrossRef] [Scilit]
  23. Reis, M.J.C.S. Symmetry-guided surrogate-assisted NSGA-II for multi-objective optimization of renewable energy systems. Symmetry 2025, 17, 1367. [Google Scholar] [CrossRef] [Scilit]
  24. Bouaouda, A.; Sayouti, Y. Hybrid meta-heuristic algorithms for optimal sizing of hybrid renewable energy system: A review of the state-of-the-art. Arch. Comput. Methods Eng. 2022, 29, 4049–4083. [Google Scholar] [CrossRef] [Scilit] [PubMed]
  25. Babatunde, O.M.; Olanrewaju, O. A Multi-Criteria Decision Analysis and Metaheuristic Optimization Framework for the Spatial Allocation of Hybrid Renewable Energy Systems in Power Grids. In Proceedings of the 2025 IEEE International Conference on Industrial Engineering and Engineering Management (IEEM), Melbourne, Australia, 7–10 December 2025; pp. 0709–0713. [Google Scholar] [CrossRef] [Scilit]
  26. Kareem, S.W.; Ali, K.W.H.; Askar, S.K.; Xoshaba, F.S.; Hawezi, R.S. Metaheuristic algorithms in optimization and its application: A review. J. Adv. Res. Electr. Eng. 2022, 6, 7–12. [Google Scholar] [CrossRef] [Scilit]
  27. Mohamed, A.R.; Abdelminaam, D.S.; Mahmoud, R.O. Leveraging Optimization and Meta-Heuristic Algorithms for Improved Sustainability and Efficiency of Renewable Energy Systems. In Proceedings of the 2025 International Mobile, Intelligent, and Ubiquitous Computing Conference (MIUCC), Cairo, Egypt, 17–18 September 2025; pp. 383–388. [Google Scholar] [CrossRef] [Scilit]
  28. Korovushkin, V.; Boichenko, S.; Artyukhov, A.; Ćwik, K.; Wróblewska, D.; Jankowski, G. Modern Optimization Technologies in Hybrid Renewable Energy Systems: A Systematic Review of Research Gaps and Prospects for Decisions. Energies 2025, 18, 4727. [Google Scholar] [CrossRef] [Scilit]
  29. Tahir, K.A. A Systematic Review and Evolutionary Analysis of the Optimization Techniques and Software Tools in Hybrid Microgrid Systems. Energies 2025, 18, 1770. [Google Scholar] [CrossRef] [Scilit]
  30. Li, L.; You, S.; Wang, X. Optimal design of standalone hybrid renewable energy systems with biochar production in remote rural areas: A case study. Energy Procedia 2019, 158, 688–693. [Google Scholar] [CrossRef] [Scilit]
  31. Shadoul, M.; Al Abri, R.; Yousef, H.; Al Shereiqi, A. Designing a Dispatch Engine for Hybrid Renewable Power Stations Using a Mixed-Integer Linear Programming Technique. Energies 2024, 17, 3281. [Google Scholar] [CrossRef] [Scilit]
  32. Ehrgott, M.; Köksalan, M.; Kadziński, M.; Deb, K. Fifty years of multi-objective optimization and decision-making: From mathematical programming to evolutionary computation. Eur. J. Oper. Res. 2026, 330, 1–25. [Google Scholar] [CrossRef] [Scilit]
Figure 1. The classification of metaheuristic algorithms. Adapted from [26].
Energies 19 04445 g001
Figure 2. HRES categorised optimisation techniques. Adapted from [28].
Energies 19 04445 g002
Figure 3. Annual load profile heat map (a), daily load profile (b) and seasonal profile (c).
Energies 19 04445 g003
Figure 4. Local resources of the study area: Annual daily radiation (left) and annual temperature (right).
Energies 19 04445 g004
Figure 5. Proposed system configuration.
Energies 19 04445 g005
Figure 6. Proposed methodological framework for surrogate-assisted techno-economic optimisation and classical metaheuristic benchmarking of the grid-connected PV battery renewable energy system.
Energies 19 04445 g006
Figure 7. Observed design space relationship between renewable fraction, LCOE, and grid energy purchased.
Energies 19 04445 g007
Figure 8. Correlation matrix of selected design variables and techno-economic outputs.
Energies 19 04445 g008
Figure 9. Out-of-fold surrogate prediction audit for LCOE.
Energies 19 04445 g009
Figure 10. Normalised techno-economic performance of the best overall surrogate design, with original metric values annotated.
Energies 19 04445 g010
Figure 11. Sensitivity of LCOE to nominal discount rate.
Energies 19 04445 g011
Figure 12. Mean convergence curves for PSO, GA, DE, GWO, WOA, and SFSA over 100 iterations.
Energies 19 04445 g012
Figure 13. Distribution of final composite fitness across 30 independent runs per algorithm.
Energies 19 04445 g013
Figure 16. Fitness–runtime trade-off across the six algorithms.
Energies 19 04445 g016
Table 1. Positioning of the proposed study.
ReferencesOptimisation AlgorithmApplication DomainMain ObjectivesSurrogate ModelMain Contribution
[17]SaMMEAHybrid renewable energy systemsMulti-objective economic, reliability and renewable-energy performanceGaussian Process (GP)Introduced surrogate-assisted multimodal multi-objective optimisation to reduce long-term simulation cost while preserving decision-space diversity.
[18]Multi-objective Differential EvolutionDistribution network with PV, BESS and EVsProbabilistic optimal power flow and technical performanceDeep-learning surrogateReplaced repeated computationally expensive power-flow evaluations with a surrogate model to reduce computational burden.
[19]Surrogate-assisted Deep Reinforcement LearningDistribution network with multiple microgridsEnergy management, power exchange and operational performanceDeep Neural NetworkCombined surrogate modelling and deep reinforcement learning to reduce repeated power system calculations.
[17]Differential EvolutionWave energy-converter array optimisationEnergy production and converter-layout optimisationNeural networkDeveloped surrogate-assisted DE to replace expensive hydrodynamic evaluations and accelerate convergence.
[22]NSGA-III, MOMVO and MOGOASteam thermal power plantEnergy, economic, environmental and exergy objectivesGradient boosting, RF, ridge and linear regressionCompared alternative machine learning surrogates and embedded them in multi-objective optimisation; gradient boosting provided the strongest predictive performance.
[23]Symmetry-Guided Surrogate-Assisted NSGA-IIHybrid solar–wind renewable energy systemsUnmet demand, energy surplus and costGP/RBFCombined symmetry-aware evolutionary operators with surrogate assistance to improve search diversity and reduce expensive evaluations.
This studyPSO, GA, DE, GWO, WOA and SFSAGrid-connected PV battery renewable energy systemLCOE, NPC, grid energy purchases and renewable fractionDistance-weighted kNNProvides a controlled benchmark of six classical metaheuristics on the same HOMER-derived surrogate landscape using identical computational conditions, repeated runs and statistical validation.
Table 2. Optimisation techniques’ strength and limitations.
CategoryRef.HRES ApplicationStrengthsLimitations
Classical
LP[30]Sizing and energy managementRobust, applicable for complex problems, Good global search spacePremature convergence, computationally costly
MILP[31]System sizingEfficient Pareto-front discoveryRequire post-processing
NLP[32]System component sizingExplains long-term degradation processesNo feature extraction or ML integration
Metaheuristic
GA[28]System sizing, energy managementRobust, applicable for complex problems, good global search spacePremature convergence, computationally costly
PSO[28]System sizing, energy managementFast convergence, few parametersPremature convergence to local optima, parameters are sensitive
GWO[28]System sizingGood balance of
exploration and exploitation, fewer
parameters.
Fluctuating performance
Artificial Intelligence
ANN[28]Forecasting RE resources, modelling HRES componentsGood for predictionA larger dataset is required
Fuzzy Logic[28]Decision-making under uncertaintyGood handling of uncertain informationRule-based design can be complex and subjective
Table 3. Dataset profile after initial audit.
DatasetRaw RowsRaw ColumnsDuplicate RowsMissing CellsUsable Rows After Filtering
Optimisation results2942822500272 core/258 extended
Sensitivity results16300016
Table 4. Decision variable bounds used by all algorithms.
Decision VariableLower BoundUpper BoundUnitImplementation Note
PV capacity 3.66666722kWcontinuous
Battery count 030unitsinteger after rounding
Converter capacity 0.8333335kWcontinuous
Table 5. Variable ranges used for techno-economic interpretation and design bounds.
VariableMinimumMaximumMeanStandard DeviationMissing After Cleaning
Architecture/PV (kW)3.66666722.00008.1424513.6888060
Architecture/LI ASM (#)030.000017.37609.6826150
Architecture/Converter (kW)0.8333335.0000002.6867140.7890960
Cost/LCOE (R/kWh)0.6107492.2215670.9756020.5801910
Cost/NPC (R)52,048.63189,324.2083,141.7349,444.490
Cost/CAPEX (R)12,643.3374,796.6535,758.4110,044.110
Cost/Operating cost (R/yr)950.31815,432.964379.4875013.3650
System/Ren Frac (%)34.124198.859783.503722.31690
Table 6. Fitness–function structure used for classical metaheuristic comparison.
Fitness TermWeight or ConditionDirection
Normalised LCOE0.40minimise
Normalised NPC0.25minimise
Normalised grid energy purchased0.20minimise
Renewable fraction shortfall term0.15minimise
Renewable fraction penaltyRF < 95%avoid
Grid purchase penaltyE_grid > 500 kWh/yearavoid
Table 7. Cross-validated surrogate prediction accuracy for the techno-economic outputs.
VariableMean R2Mean RMSEMean MAEMean MAPE (%)
Cost/CAPEX (R)0.9119842897.9371658.9545.086983
Cost/LCOE (R/kWh)0.9592040.1095390.0388383.370457
Cost/NPC (R)0.9592049334.9963309.7893.370457
Cost/Operating cost (R/yr)0.959144940.893374.20312.0776
Grid/Energy Purchased (kWh)0.958701331.003131.72726.5681
Project Economics/IRR (%)0.8729843.9998672.2936464.970846
Project Economics/Simple Payback (yr)0.8569510.2131990.1044764.582922
System/Ren Frac (%)0.9587014.2023081.6723672.572165
Table 8. Five-fold cross-validation comparison of alternative surrogate model forms.
ModelMean R2 Across Four Core Outputs
Random Forest0.996453
Gaussian Process0.995453
RBF0.992653
Gradient Boosting0.989954
kNN-3 (selected)0.968912
Table 9. DW-kNN hyperparameter selection under five-fold cross-validation.
kMean R2SD
30.9689120.016145
40.9669470.017268
50.9677930.017546
60.9662580.017380
70.9641370.018104
80.9615820.018209
90.9606750.018413
100.9559660.018391
Table 10. Algorithm parameters and fairness controls.
AlgorithmPopulationIterationsIndependent RunsMain Parameters
PSO3010030w = 0.729, c1 = 1.494, c2 = 1.494
GA3010030tournament = 3, elitism = 2, crossover = 0.85, mutation = 0.20
DE3010030DE/rand/1/bin, F = 0.70, CR = 0.90
GWO3010030Alpha–beta–delta leadership, a decreases from 2 to 0
WOA3010030encircling/spiral bubble net, a decreases from 2 to 0, b = 1
SFSA3010030diffusion plus rank-based update; Gaussian scale decreases over iterations
Table 11. Best observed design from the cleaned HOMER Grid-derived optimisation dataset.
Fitness TermObserved Best Value
Architecture/PV (kW)7.799321
Architecture/LI ASM (#)23.0000
Architecture/Converter (kW)2.559689
Cost/LCOE (R/kWh)0.614889
Cost/NPC (R)52,401.45
Cost/CAPEX (R)38,697.39
Cost/Operating cost (R/y)1266.622
System/Ren Frac (%)97.2544
Grid/Energy Purchased (kWh)216.261
Project Economics/IRR (%)59.9528
Project Economics/Simple Payback (y)1.667412
Computed fitness0.010748
Table 12. Summary of the sensitivity dataset used for economic context interpretation.
VariableMinimumMaximumMeanStandard Deviation
Sensitivity/Nominal Discount Rate (%)5.00000012.00008.7500002.670830
Sensitivity/Expected Inflation Rate (%)2.0000008.0000005.0000002.309401
Architecture/PV (kW)6.8216059.3712007.7873690.606860
Architecture/LI ASM (#)22.000023.000022.87500.341565
Architecture/Converter (kW)2.5169132.7413522.6250250.061615
Cost/LCOE (R/kWh)0.2851950.6800480.4728400.108243
Cost/NPC (R)49,363.8882,679.6961,519.208920.686
Cost/CAPEX (R)35,424.4042,579.6138,616.001677.438
Cost/Operating cost (R/y)1089.5151512.5891308.852100.063
System/Ren Frac (%)95.967797.929097.14660.499500
Grid/Energy Purchased (kWh)163.127317.614224.75539.3442
Project Economics/IRR (%)54.798864.743460.11462.341021
Project Economics/Simple Payback (y)1.5442071.8239551.6653010.065267
Table 16. Final performance summary of the six classical metaheuristic algorithms.
AlgorithmMean
Fitness
Fitness Std.Best FitnessWorst
Fitness
Mean Runtime (s)Mean LCOEMean NPC (R)Mean RF (%)Mean Grid Energy (kWh)Rank
DE0.0107484666.910 × 10−100.0107484650.0107484680.1817570.61488952,401.4597.2544216.2611
SFSA0.0107484662.962 × 10−90.0107484650.0107484820.2582340.61488952,401.4597.2544216.2612
PSO0.0107484782.206 × 10−80.0107484670.0107485830.0711030.61488952,401.4497.2544216.2623
WOA0.0107604693.323 × 10−50.0107492750.0109352560.1252510.61483552,396.8197.2470216.8444
GWO0.0108291619.893 × 10−50.0107524810.0110078710.0824190.61464752,380.8097.2155219.3245
GA0.0108350369.823 × 10−50.0107484660.0111856210.1494500.61447952,366.5397.1995220.5846
Table 17. Nearest observed validation of the metaheuristic-recommended designs.
AlgorithmScaled
Distance
Surrogate PVObserved PVSurrogate BatteriesObserved BatteriesSurrogate ConverterObserved ConverterSurrogate LCOEObserved LCOESurrogate RFObserved RF
SFSA4.004 × 10−127.7993217.79932123.000023.00002.5596892.5596890.6148890.61488997.254497.2544
DE1.807 × 10−97.7993217.79932123.000023.00002.5596892.5596890.6148890.61488997.254497.2544
PSO6.775 × 10−87.7993217.79932123.000023.00002.5596892.5596890.6148890.61488997.254497.2544
GA8.345 × 10−87.7993217.79932123.000023.00002.5596892.5596890.6148890.61488997.254497.2544
WOA0.0001067.7996727.79932123.000023.00002.5596892.5596890.6148750.61488997.252597.2544
GWO0.0009827.8028107.79932123.000023.00002.5596892.5596890.6147680.61488997.237297.2544
Table 18. Friedman rank analysis of final fitness across 30 independent runs.
AlgorithmMean Friedman RankFriedman Chi-SquareFriedman p-Value
SFSA1.100000135.7901.403 × 10−27
DE1.966667135.7901.403 × 10−27
PSO2.966667135.7901.403 × 10−27
WOA4.266667135.7901.403 × 10−27
GWO5.266667135.7901.403 × 10−27
GA5.433333135.7901.403 × 10−27
Table 19. Holm-adjusted Wilcoxon signed rank tests against DE.
ComparisonWilcoxon StatisticRaw p-ValueHolm-Adjusted p-ValueSignificant at 0.05
PSO vs. DE464.0001.863 × 10−94.65661 × 10−91
GA vs. DE465.0009.313 × 10−104.65661 × 10−91
GWO vs. DE465.0009.313 × 10−104.65661 × 10−91
WOA vs. DE465.0009.313 × 10−104.65661 × 10−91
SFSA vs. DE57.0009.999 × 10−10.9999450
Disclaimer/Publisher’s Note: The statements, opinions and data contained in all publications are solely those of the individual author(s) and contributor(s) and not of MDPI and/or the editor(s). MDPI and/or the editor(s) disclaim responsibility for any injury to people or property resulting from any ideas, methods, instructions or products referred to in the content.