Article

From Grid Burden to Grid Resource: A Monte Carlo Framework for Vehicle-to-Building-to-Grid Flexibility in a Regional Distribution Network

1
Research Center in Business and Economics (CICEE), Universidade Autónoma de Lisboa, 1169-023 Lisboa, Portugal
2
Higher Institute of Business and Tourism Sciences, 4050-180 Porto, Portugal
3
School of Engineering, Polytechnic Institute of Porto, 4249-015 Porto, Portugal
4
Centro de Inovação em Engenharia e Tecnologia Industrial School of Engineering (CIETI), Polytechnic Institute of Porto, 4249-015 Porto, Portugal
*
Author to whom correspondence should be addressed.
Energies 2026, 19(18), 4413; https://doi.org/10.3390/en19184413 (registering DOI)
Submission received: 28 August 2026 / Revised: 9 September 2026 / Accepted: 10 September 2026 / Published: 18 September 2026

Abstract

Grid-impact studies treat battery electric vehicles as loads, and ask when network capacity will be exhausted. This paper reverses the question: how much of the fleet must operate bidirectionally, and with what probability will an achievable participation rate suffice, for the network to remain within its limits? A conceptual framework adds a vehicle-to-grid and vehicle-to-building flexibility term to the balance between available and required power, nests the authors’ earlier deterministic model for twenty municipalities in Northern Portugal as its zero-flexibility special case, derives a closed-form break-even participation rate per municipality and year, and keeps the simultaneity assumption of that model explicit as a coincidence factor. Participation, location, plug-in and export parameters follow beta-PERT distributions calibrated on published trials and surveys, propagated by Monte Carlo simulation without new field data. The framework is an apparent-power balance per municipality, so its outputs are an upper bound on usable flexibility, not a feeder-level feasibility check. An enrolled vehicle provides about 11 kVA of peak relief, over nine tenths from not charging rather than exporting. Under worst-case simultaneity, observed participation rates, if in place from the outset, halve the 2028 shortfall probability but cannot prevent shortfall by 2030; under realistic coincidence the regional network is not constrained and only eight of twenty municipalities remain critical. The network balance is replicable wherever municipal substation data exist; behavioural parameters require local calibration.

1. Introduction

1.1. Background and Motivation

The electrification of road transport has moved from projection to observation. Battery electric vehicles (BEVs) reached one quarter of new passenger-car registrations in Europe in December 2025 [1], and Portugal, a small market by volume, has kept its BEV share above the European average since 2023 [2]. In 2024, 41,932 new BEVs were registered in the country, a 20% share of new passenger cars [3], and the monthly share had risen to 26% by January 2026 [4]. Two features of the Portuguese market are relevant for the present study. First, adoption has been steady rather than explosive: registrations have tracked the more moderate of the growth paths considered five years ago, rather than the accelerated ones. Second, the buyer base is unusual: in 2025, corporate purchasers accounted for 84% of new BEV registrations, and the BEV share among corporate registrations (25%) was well above that among private buyers (17%) [2]. A fleet that is largely company-owned is parked at company premises during working hours, which matters for any assessment of vehicle-to-building (V2B) potential.

1.2. Literature Gap

Most studies of the impact of electric vehicles on distribution networks share a common structure: the fleet is projected, each vehicle is assigned a charging load, and the resulting demand is compared with network capacity to identify the year and location at which reinforcement becomes necessary [5,6,7,8]. In an earlier study, the authors applied this logic to the distribution network serving twenty municipalities in the Ave, Tâmega and Sousa regions of Northern Portugal [9]. Three deterministic BEV growth scenarios were built from national sales and fleet statistics, the regional fleet was allocated to municipalities by population share, each vehicle was assigned the contracted power of a 7.4 kW home charging point, and the resulting demand was compared with the available power of each municipality’s consumer substations during peak and off-peak hours. A Monte Carlo simulation, in which yearly sales followed a beta-PERT distribution, showed that under the most ambitious national target the aggregate peak-hour headroom of the region would be exhausted with a probability of about one third by 2027 and near certainty by 2028, with individual municipalities turning negative from 2026.
That study, like most of its kind, treated every BEV as a load. The bidirectional capability of electric vehicles inverts the question. If part of the fleet can export power to buildings (V2B) or to the grid (V2G) during the hours in which the network is constrained, the same vehicles that create the peak can help to relieve it. The Special Issue to which this paper is submitted frames this as vehicle-to-building-to-grid (V2B2G) energy management, and identifies its central difficulty: the availability of vehicles for energy exchange is uncertain, because it depends on mobility patterns, on plug-in behaviour and on the willingness of owners to enrol [10,11]. Quantifying how much of this uncertain flexibility a specific distribution network would need, and how likely it is that an achievable participation rate provides it, is the question addressed here. The hosting-capacity literature [12,13,14,15] answers the related question of how many vehicles a feeder tolerates under assumed charging behaviour (Section 2.3); the present framework inverts it: the network is fixed, the fleet is projected, and the participation rate required to keep the network within its limits is the output, with its own probability distribution.

1.3. Contribution and Structure

The contribution of this paper is a conceptual framework, applied to the network of the earlier study, with five designed elements and a sixth that emerged from the application. First, a flexibility-adjusted impact metric is defined that adds a bidirectional term to the conventional balance between available and required power; the earlier deterministic model is recovered exactly as its zero-flexibility special case. Second, a closed-form break-even participation rate is derived: the minimum share of the fleet that must be enrolled in a bidirectional programme for the expected impact in a given municipality and year to return to zero. Third, the location of vehicles during the peak period is modelled from the home–workplace commuting pattern already used to characterise consumption, so that V2B and V2G windows map onto the network’s substations. Fourth, the behavioural and technical parameters of the bidirectional term are treated as beta-PERT random variables, calibrated on published trial and survey evidence, and propagated through the same Monte Carlo engine as before, yielding the probability that a given participation target suffices and stating the number of years by which network reinforcement could be deferred. Fifth, the framework is positioned as the stochastic scenario layer of a regional distribution-grid digital twin, with an explicit update rule by which expert priors are replaced by charger and building telemetry as it becomes available. A new sixth element emerged from the application, and is treated as a result in its own right: by keeping the simultaneity assumption of the earlier study explicit as a coincidence factor, the framework separates the part of a projected shortfall that managed charging removes from the part that requires export, storage or reinforcement, and reports both the worst-case planning bound and the expected case.
No new field data are required: the network description, the fleet trajectories and the representative-vehicle consumption model are those of the earlier study, and the new parameters are drawn from the literature. This is deliberate. The framework is meant to be replicable by distribution operators and municipalities that hold a network description of the kind published in the earlier study but no bidirectional-charging telemetry of their own, which is the situation of most European regions today.
The remainder of the paper is organised as follows. Section 2 reviews bidirectional charging technology, the evidence on participation and vehicle availability, the treatment of uncertainty in EV grid-integration studies, and the role of buildings, stationary storage and digital twins. Section 3 sets out the framework: the baseline model, the fleet-location model, the export and rebound terms, the flexibility-adjusted impact, the break-even participation rate, the stochastic formulation and the digital-twin positioning. Section 4 applies the framework to the twenty municipalities. Section 5 discusses the results and their limitations, and Section 6 concludes the paper.

2. Background

2.1. Bidirectional Charging: V2G, V2B and V2B2G

Bidirectional charging allows an electric vehicle to discharge its battery through the charging interface. When the receiving system is the public network, the arrangement is called vehicle-to-grid (V2G); when the vehicle supplies a building behind its meter, it is called vehicle-to-building (V2B), of which vehicle-to-home (V2H) is the residential case. The combination, in which vehicles parked at buildings serve the building first and the grid second, while the building itself exchanges energy with the network, is referred to as vehicle-to-building-to-grid (V2B2G) [10]. From the perspective of a distribution substation, the two channels differ in one respect that matters for modelling: V2G export appears as generation on the feeder, whereas V2B export appears as a reduction in the building’s demand, and, unless feed-in from the building is permitted, it cannot exceed the building’s own load at that moment.
The technology has matured considerably since the early demonstrations reviewed by Sovacool et al. [11]. Bidirectional DC chargers based on the CHAdeMO protocol have been deployed in domestic trials for several years, and the ISO 15118-20 standard now provides a bidirectional power-transfer framework for the Combined Charging System used by most European vehicles [16]. The largest domestic trial to date, Project Sciurus, in the United Kingdom, installed 320 bidirectional units in private homes and monitored them for more than a year; its final report documents both the value that can be captured by aggregating domestic V2G units for tariff optimisation and grid services and the obstacles that remain, notably a hardware and installation premium of the order of GBP 3700 over a one-way smart charger at the time of the trial, and a recruitment ceiling set by the number of compatible vehicles [17]. Reviews of European V2G projects reach similar conclusions: the business case depends on high plug-in rates and on stacking several revenue streams [18,19].
For a distribution-network study, the practical consequence is that bidirectional operation should not be assumed to be available from the whole fleet, nor from a fixed fraction of it, but from a share that is uncertain and that depends on hardware compatibility, on contract design and on user behaviour. This is the share modelled as the participation rate in Section 3.

2.2. Participation, Plug-In Behaviour and Vehicle Location

The willingness of EV owners to enrol in managed-charging or V2G programmes has been studied through stated-preference surveys and discrete-choice experiments in several countries. Stated willingness is consistently high: in an Australian sample, three quarters of respondents said they would allow energy export from their vehicle if the option existed, and a similar share would accept control of charging time or speed [20]. Effective enrolment is much lower. A discrete-choice experiment with 1356 current BEV owners in the United States estimated the intrinsic enrolment rate, in the absence of any incentive, at 5.2% for supplier-managed charging and 10.4% for V2G, and validated the model against a California managed-charging programme that reached 10% enrolment with a monthly payment of USD 40 [21]. A recent system-level assessment therefore treats participation as the central uncertain variable of V2G, and explores a band from 1% to 30%, citing survey evidence of active participation intentions of 15–20% and conditional willingness above 30% [22,23]. The determinants of willingness are well documented: concern about battery degradation, loss of control over the vehicle, contractual complexity and the credibility of compensation [24,25], with private owners more cautious than lessees and high-mileage users less willing to commit [26]. In a market such as Portugal, where most new BEVs are registered by companies [2], enrolment decisions are taken for many vehicles at once, which argues for a wider upper tail of the participation distribution than household surveys alone would suggest.
Enrolment is a necessary, but not a sufficient, condition for availability. A vehicle contributes to the network only if it is parked at a location with a bidirectional charger and is plugged in when flexibility is needed. Large-scale trials show that uncontrolled EV users do not plug in every day: in the Electric Nation trial (673 participants, more than 140,000 sessions), the median charging frequency was three to four times per week, only about 15% of participants charged daily, and pure BEV users charged two to three times per week, plugging in mostly between 17:00 and 19:00 and leaving the vehicle connected for more than twelve hours, while drawing power for about one and a half hours [27]. Gonzalez Venegas et al. calibrated a probabilistic plug-in model on the same data and showed that ignoring this “non-systematic” behaviour overstates the flexibility of EV fleets by a factor of two to seven [28]. Enrolment in a bidirectional programme changes behaviour: in Project Sciurus, V2G participants had their vehicle plugged in for about 57% of the time before the 2020 lockdown and about 70% during it, compared with 30–40% for non-V2G users [17], and the upper end of the revenue range requires availability of roughly three quarters of the time [19].
Where vehicles are parked during the constrained hours determines whether the relevant channel is V2G or V2B. Analyses of national travel surveys converge on a simple picture for weekdays: at 17:00, only about 15% of vehicles are on the road, and at no time of day are fewer than three-quarters parked [29]; more than half of the fleet is at home at any hour, with a substantial share at workplaces around midday [30]; by 20:00, four fifths of vehicles have made their last trip home [31]; and household vehicles are parked for about 95% of the day [32]. Travel-diary profiles built specifically for V2G assessment in the Netherlands show the same shape [33]. Workplace charging, however, remains a minority channel: across nine European markets, 14% of EV drivers usually charge at work, with national values between 5% and 23% [34], and about one tenth of charging sessions take place at workplaces [35]. For the study region, the 2017 mobility survey of the Porto metropolitan area reports that the car accounts for 67.6% of trips, that work is the main trip purpose (30.3%), and that 71% of trips begin and end in the same municipality [36]; the last figure supports the intra-municipal allocation adopted in Section 3.

2.3. Uncertainty in EV Grid-Integration Studies

The treatment of uncertainty in the EV grid-integration literature ranges from deterministic scenario analysis, through sampling-based methods, to learning-based forecasting. Deterministic scenarios remain the most common approach in regional and national studies [5,37] and were the starting point of the earlier study [9]. Monte Carlo methods, in which uncertain inputs are sampled from assumed distributions and propagated through a deterministic model, are widely used for probabilistic load flow and for EV hosting-capacity assessment [38,39]; the beta-PERT distribution, defined by a minimum, a most likely, and a maximum value, is a convenient choice when the only available information about a parameter is expert or literature-based bounds, and it was the distribution used for yearly sales in the earlier Monte Carlo analysis. Agent-based models resolve individual vehicles, and are the natural vehicle for behavioural sub-models such as the plug-in decision [28,40]. Learning-based methods are increasingly applied to short-term forecasting of charging demand and of aggregate plug-in availability for ancillary-service participation [41,42].
A parallel strand of work quantifies the hosting capacity of distribution networks for electric vehicles: the number or share of vehicles a feeder can accommodate before voltage, thermal or unbalance limits are violated, evaluated by deterministic or probabilistic power flow under assumed charging profiles [12,13]. Recent contributions distinguish controlled from uncontrolled charging and use dynamic thermal ratings to extend the limit [14], or express hosting capacity as a probability of limit violation [15]. Hosting-capacity studies and the present framework are complementary: the former resolve the physics of individual feeders under a given behavioural scenario, whereas the framework proposed here operates at the municipal balance level, treats participation itself as the uncertain decision variable, and returns the participation required, in closed form, rather than the vehicles tolerated.
The present framework belongs to the sampling-based family. Its distinguishing feature is not the sampling method, but what is sampled: alongside the fleet trajectory, the behavioural and technical parameters that govern bidirectional availability are treated as random variables, and the outputs are formulated as probabilities that decision-relevant thresholds are crossed, rather than as expected values alone. Because the underlying model is a per-municipality power balance, the simulation is inexpensive and can be re-run whenever a parameter distribution is updated, which is the property exploited in the digital-twin positioning of Section 3.9.

2.4. Buildings, Stationary Storage and Digital Twins

Buildings are the natural hosts of daytime vehicle flexibility. Workplace car parks concentrate vehicles during the morning and midday hours in which commercial and industrial loads peak, and the same premises increasingly host photovoltaic generation and, in some cases, stationary storage. Second-life EV batteries have been identified as a cost-effective option for such stationary storage [43,44], and the earlier study already suggested them as a means of adding buffer capacity to the distribution network [9]. In the framework below, stationary storage in buildings enters as a sensitivity term with the same power-and-energy structure as the vehicle export term.
Digital twins of distribution networks are virtual representations that combine a network model with measured state and with scenario or forecasting capabilities to support operational and planning decisions [45,46,47]. Published applications range from the real-time monitoring of medium-voltage conditions from low-voltage measurements at a single transformer [48] and state-estimation-based control of distributed resources in telemetry-sparse feeders [49] to the digitalisation of entire low-voltage distribution areas [50]. Their multi-dimensional character, in the sense used by the Special Issue, refers to the combination of physical, temporal and behavioural dimensions. Most published twins emphasise the physical and operational layers; the scenario layer, which asks what the network state would be under uncertain future adoption and behaviour, is comparatively underdeveloped. The framework presented here is proposed as such a layer.

2.5. Relation to the Earlier Study

To make the reuse and the novelty explicit: the network description (installed power and consumed power per municipality in peak and off-peak hours, Table A1 of [9]), the three national BEV fleet trajectories, the population-based allocation to municipalities, the representative vehicle (a market-share weighted composite of the Nissan Leaf, Tesla Model 3 and Renault Zoe) and its daily energy consumption on a combination of a 48 km intercity route and a 30 km urban commute, and the per-vehicle contracted power of 10.35 kVA are all taken from the earlier study. Everything from Section 3.2 onward is new: the location model, the participation and export terms, the building cap, the rebound term, the flexibility-adjusted impact, the break-even participation rate, the deferral metric, the parameter distributions and the update rule.

3. Framework

3.1. Sets, Indices and Baseline Quantities

Table 1 lists the notation inherited from the earlier study. Municipalities are indexed by m M with | M | = 20 , years by t T = { 2021 , , 2030 } , tariff periods by τ { P , O } (peak, off-peak) and deterministic sales scenarios by s { 1 , 2 , 3 } .
The baseline required power and baseline impact of the earlier study are
R m , t 0 = c τ n m , t S c h
I m , t , τ 0 = A m , τ R m , t 0
where c τ ( 0 , 1 ] is a coincidence factor. The earlier study assumed c τ = 1 , that is, all vehicles charging simultaneously at contracted power in both periods, as a deliberate worst case [9]. Keeping c τ explicit serves two purposes: with c τ = 1 , the framework reproduces the earlier tables exactly, and coincidence can be treated as an uncertain input in the stochastic formulation of Section 3.8. A negative impact denotes a shortfall of available power.
The representative vehicle’s battery capacity is the market-share weighted average of the three models,
C = k ω k C k = 0.422 40 + 0.352 74 + 0.226 41 52.2 kWh
and, following the 20–80% operating window adopted in the earlier study to preserve battery life, its net usable capacity is 0.6 C 31.3 kWh.

3.2. Fleet State and Location Model

At any instant, a BEV is in one of three states: parked at home ( H ), parked at a workplace or other non-residential building ( W ), or driving or otherwise unplugged ( D ). Let ϕ l , τ denote the expected fraction of the fleet in state l { H , W , D } during period τ , with
ϕ H , τ + ϕ W , τ + ϕ D , τ = 1 τ
Two remarks fix the interpretation of these shares. First, the consumption model of the earlier study is built on a home–workplace commute (a 30 km round trip completed in 0.6 h of driving) combined with an intercity route, so the fleet is, by construction, a commuting fleet: it is at buildings during working hours and at home overnight. Second, the peak period of the Portuguese low-voltage tariff cycle is not a single block but two, one in the late morning and one in the early evening, totalling four to five hours [51]. The shares ϕ l , P are therefore time-weighted averages over both blocks: during the morning block most commuter vehicles are at workplaces, during the evening block most are at home, and the averages take intermediate values. Their numerical ranges are set from the travel-survey evidence of Section 2.2 and treated as uncertain (Section 3.8).
Not every parked vehicle can export. Let β l , τ be the probability that an enrolled vehicle is in state l and connected to a bidirectional charger during period τ :
β l , τ = ϕ l , τ γ l , l { H , W }
where γ l 0 , 1 is the plug-in rate which is conditional on being parked at l . A bidirectional charger is assumed to exist at the home of every enrolled vehicle, so γ H reflects plug-in behaviour alone; γ W , additionally, reflects the availability of bidirectional charging at the workplace, which the evidence of Section 2.2 shows to be limited.
Home-parked vehicles load the substations of the municipality of residence, whereas workplace-parked vehicles may be in a different municipality. Let Ω = Ω m m be a row-stochastic origin–destination matrix whose entry is the share of residents of m who work in m . The fleet physically present in m during τ is
n ~ m , t , τ = ϕ H , τ n m , t + ϕ W , τ m Ω m m n m , t + ϕ D , τ n m , t
Equation (6) is the general form of the location model, in which the fleet parked at buildings in a municipality is drawn from the resident fleets of all municipalities according to commuting flows. The application adopts the simplification Ω = I , that is, residents work in their municipality of residence, so that the fleet at buildings in m is ϕ W , τ n m , t ; the assumption is supported by the 71% share of intra-municipal trips reported for the Porto metropolitan area [36] and is listed among the limitations in Section 5.6. The regional aggregate is invariant to Ω because each row sums to one, so the simplification affects only the distribution of V2B export between municipalities, not its total. Section 4.6 tests it directly by replacing Ω = I with a matrix in which 29% of each municipality’s resident fleet works in other municipalities; no municipal impact changes by more than 10 kVA.

3.3. Participation and Managed Charging

Let π 0 , 1 be the participation rate: the share of the BEV fleet enrolled in a bidirectional programme, that is, equipped with a bidirectional charger and under contract with an aggregator or the distribution operator. Two effects are attributed to enrolment. The first is load shifting: enrolled vehicles do not charge during the peak period, their charging being deferred to the off-peak; managed charging is a prerequisite of any bidirectional contract, and it is the lever that trials have shown to be most readily accepted [21,27]. The second is export: enrolled vehicles that are plugged in during the peak discharge to the building ( W ) or to the grid ( H ). Non-enrolled vehicles behave as in the earlier study. The required charging power during the peak therefore becomes
R m , t , P π = c P 1 π n m , t S c h
In the headline analysis, π is held constant across years, so that the results answer the question “if this participation rate held, what would the network state be?”; a participation rate that ramps up over the decade is examined as a sensitivity in Section 4. Because a constant rate credits the network with full participation from the first year, the headline results are an upper bound on the mid-decade benefit of flexibility, and should not be read as a trajectory; the ramp sensitivity of Section 4.6 quantifies the difference.

3.4. Per-Vehicle Export Capability

The power an enrolled vehicle can export is bounded by the rating of its charger and by the energy it can spare over a peak period of duration D P hours. With a usable state-of-charge margin δ , defined as the fraction of C released for export while preserving both the operating window and a mobility reserve e r e s ,
E x = δ C , 0 δ δ m a x = 0.6 e r e s C
Two choices of the reserve are natural, and both follow from the earlier study’s consumption tables: the weighted daily need, e r e s = e d a y = 8.776 kWh, gives δ m a x 0.43 ; the weighted long-route round trip, e r e s 15.1 kWh, gives δ m a x 0.31 . The latter, more conservative value is used as the upper bound of δ .
The sustained export power at location l is then
P l e f f = m i n P l d i s , E x D P
where P l d i s is the discharge rating of the charger (kW). For a single-phase 7.4 kW unit, δ = 0.2 and D P = 4.5 h, the energy term gives 0.2 52.2 / 4.5 2.3 kW, well below the charger rating: the energy constraint, not the charger, binds. This is a structural result of the framework, and it explains a feature of all subsequent results, namely that the load-shifting effect of enrolment, worth S c h = 10.35 kVA per vehicle, dominates the export effect, worth P e f f per vehicle. Export power is converted to apparent power through the charger power factor, S l e f f = P l e f f / c o s φ l , with c o s φ l 1 for modern bidirectional units.
The binding constraint depends on how the tariff defines the peak. Equation (9) makes sustained export inversely proportional to D P while the energy exported over the period, δ C , is fixed: for δ = 0.2 and C = 52.2 kWh, a three-hour peak gives 3.5 kW and a two-hour peak 5.2 kW, and the charger rating becomes binding only for peaks shorter than about 1.4 h. A tariff with a short, sharp peak therefore extracts more power from each enrolled vehicle but not more energy, and the ordering of load shifting over export, which is a comparison of S c h with P e f f , is preserved for any peak longer than about one hour. Larger batteries raise δ C , proportionally: at 65 kWh, the sustained export over a 4.5 h peak is 2.9 kW, rather than 2.3 kW (Section 4.6).

3.5. Aggregate Flexibility: V2G, V2B and Stationary Storage

The V2G contribution of municipality m during the peak is the export of enrolled vehicles parked and plugged in at home,
F m , t , P G = π n m , t β H , P S H e f f
The V2B contribution is the export of enrolled vehicles parked and plugged in at buildings. From the substation’s perspective, this is a reduction of the buildings’ draw, and, if buildings are not permitted to feed into the network, it cannot exceed the non-residential load of the municipality during the peak:
F m , t , P B = m i n π n ~ m , t , P W γ W S W e f f , σ m L m , P
where n ~ m , t , P W = ϕ W , P m Ω m m n m , t is the fleet parked at buildings in m , from Equation (6), and σ m 0 , 1 is the non-residential share of the municipality’s peak consumption. If feed-in from buildings is allowed, the cap is dropped, and Equation (11) takes the form of Equation (10).
The cap is written at municipal rather than building level because the network data of the earlier study are aggregated at that level: L m , P is the sum of the loads of all consumer substations in m , and export from a vehicle offsets load only behind the substation to which its building is connected. The exact constraint is therefore a sum of building-level caps, b m i n x b , L b , where x b is the export available at building b and L b is its load; since b m i n x b , L b m i n b x b , b L b , the municipal cap of Equation (11) is an upper bound on the V2B contribution, and the flexibility it yields is, correspondingly, an upper bound. In the application, the municipal cap never binds: at the median of the 2030 trials, the V2B export of the region is about 1100 kVA against a non-residential peak load of about 339,000 kVA, a ratio of 0.3% that does not exceed 0.4% in any municipality (Section 4.6). Even if building-level load mismatches left only a fraction of that export usable, the change in the flexibility value of a fleet vehicle would be below 0.01 kVA, against a load-shifting value of 10.35 kVA. The building-level formulation becomes relevant only when workplace bidirectional charging is widespread and building-level load data are available.
Stationary storage installed in buildings, for instance second-life vehicle batteries, is included as a sensitivity with the same power-and-energy structure. With aggregate discharge rating S m B (kVA) and energy E m B (kWh),
F m , P S = m i n S m B , E m B D P
and the total peak flexibility of the municipality is
F m , t , P = F m , t , P G + F m , t , P B + F m , P S

3.6. Off-Peak Rebound

Energy exported during the peak must be recovered during the off-peak, with round-trip efficiency η . Per exporting vehicle, the recovered energy is P e f f D P / η ; spread over the off-peak duration D O = 24 D P , the additional off-peak apparent power, here called the rebound, is
G m , t , O = π n m , t β H , P + β W , P P e f f D P η D O c o s φ
The off-peak requirement has three components, which Equation (15) writes separately so that no energy is counted twice: the baseline charging of the non-enrolled vehicles, as in the earlier study; the daily driving demand of the enrolled vehicles, deferred from the peak by Equation (7) and served in the off-peak within their contracted power; and the recovery of the energy exported during the peak:
R m , t , O π = c O   1 π   n m , t   S c h + c O   π   n m , t   S c h + G m , t , O
The first two terms sum to the off-peak baseline of the earlier study, because that model already counted every vehicle at contracted power in both periods; the shifted driving demand, therefore, appears once, in the second term, and is not counted again in the third. Energy is conserved with a wide margin. At the most likely parameter values, an exporting enrolled vehicle must recover in the off-peak its daily need of 8.8 kWh plus 10.4 kWh of export divided by the round-trip efficiency, about 20.8 kWh in all; spread over the 19.5 h off-peak period, this is an average of 1.1 kW, against a contracted power of 10.35 kVA available for the whole period. The second term is thus a coincident-power bound, rather than an energy requirement, and it would absorb the export recovery as well; the rebound is, nevertheless, kept as an explicit third term, worth 0.26 kVA per enrolled vehicle at the most likely values, so that the energy cost of export is visible in the off-peak balance and the off-peak requirement remains an upper bound. There is no export term in the off-peak. Equation (14) uses the uncapped V2B export, and is thus slightly conservative when the cap of Equation (11) binds.

3.7. Flexibility-Adjusted Impact, Break-Even Participation and Deferral

Combining Equations (2), (7), (13) and (15), the flexibility-adjusted impacts are
I m , t , P π ; θ = A m , P c P 1 π n m , t S c h + F m , t , P
I m , t , O π ; θ = A m , O c O n m , t S c h G m , t , O
where θ collects the behavioural and technical parameters (Section 3.8). Setting π = 0 and F S = 0 recovers Equation (2), and the rebound of Equation (17) vanishes: the earlier model is, in substance, the zero-flexibility special case of the present one, the only notational difference being that its implicit simultaneity assumption is written here as c_τ=1. Regional aggregates are obtained by summation: I t , τ = m I m , t , τ .
When the V2B cap in Equation (11) is not binding, Equation (16) is affine in π ,
I m , t , P π = I m , t , P 0 + π n m , t c P S c h + β H , P S H e f f + β W , P S W e f f + F m , P S
The bracketed quantity, f P = c P S c h + β H , P S H e f f + β W , P S W e f f , is the flexibility value of one enrolled vehicle in kVA; its first term is the load-shifting value and the remaining two are the export value. Solving I m , t , P π * = 0 gives the break-even participation rate,
π m , t * = I m , t , P 0 F m , P S n m , t f P
with a direct interpretation: π m , t * 0 means that no flexibility is needed in municipality m in year t ; 0 < π m , t * 1 is the minimum participation rate that neutralises the deficit; and π m , t * > 1 means that bidirectional operation of the fleet cannot close the gap, and reinforcement or stationary storage, is unavoidable. When the cap binds, Equation (16) is concave and piecewise linear in π , but still increasing, and π * is obtained in closed form by testing the uncapped solution against the cap and, if it fails, solving the capped branch.
Because the fleet grows monotonically and the parameters are shared across years, the shortfall probability for a given π is non-decreasing in t . For a tolerated shortfall probability ε , the first critical year with and without flexibility, and the number of years of reinforcement deferred, are
t m c π = m i n t T : P r I m , t , P π < 0 > ε , Δ t m π = t m c π t m c 0
Δ t m is the quantity most directly usable by a distribution operator in investment planning.
Equations (16)–(20) are an apparent-power balance per municipality and tariff period, in the form of the earlier study. Their outputs are therefore an upper bound on usable flexibility, a theoretical power-and-energy balance, and not a physical guarantee of operational feasibility: a feeder-level power-flow study may find voltage-rise, protection, or phase-unbalance limits that the balance cannot see, and may find that part of the flexibility credited here is not usable behind a given substation. Two properties of the results bound the size of that gap. First, more than nine tenths of the flexibility value comes from enrolled vehicles not charging during the peak (Section 3.4), which lowers, rather than raises, the loading and the unbalance of low-voltage feeders, single-phase 7.4 kW charging being itself a principal source of unbalance on residential feeders. Second, the export that remains is small: about 2.3 kW sustained per exporting vehicle and, at the participation and plug-in rates of Section 4, about 1 kVA per enrolled vehicle and 0.1 kVA per fleet vehicle, an injection two orders of magnitude below the coincident charging load that the same vehicles would otherwise draw. The reverse flows credited by the balance are thus modest by construction, but their admissibility on individual feeders remains a question for the power-flow layer discussed in Section 3.9 and Section 5.6.

3.8. Stochastic Formulation and Monte Carlo Propagation

The uncertain input vector is
θ = N t , π , ϕ H , P , ϕ W , P , γ H , γ W , P d i s , δ , η , c P , c O , D P
Each component follows a beta-PERT distribution with minimum, most likely, and maximum values a j , b j , c j , consistent with the treatment of sales in the earlier study,
θ j P E R T a j , b j , c j , α 1 = 1 + 4 b j a j c j a j , α 2 = 1 + 4 c j b j c j a j
where α 1 , α 2 are the shape parameters of the underlying beta distribution on a j , c j . A parameter is fixed by setting a j = b j = c j . The location shares are drawn independently and ϕ W , P is truncated at 1 ϕ H , P to respect Equation (4). Yearly sales follow a beta-PERT distribution with the lower bound set to m i n S 2 , S 3 , the most likely value to S 3 and the upper bound to m a x 1.46 S 3 , S 2 , where S 2 and S 3 are the yearly sales of scenarios 2 and 3 of the earlier study and the factor 1.46 reproduces its upper uncertainty bound; the fleet is the cumulative sum. The minimum and maximum operators are needed because scenario 2 sales exceed scenario 3 sales in the last two years of the horizon. The coincidence factors c P and c O are fixed at unity in the planning-bound case and drawn from a beta-PERT distribution in the expected case (Section 4.7).
The model is evaluated for K draws θ k , with a single draw applied to all municipalities and years, so that the results are correlated across space and time as they should be. The outputs, per municipality, year and period, are the mean and dispersion of the impact and the shortfall probability:
μ ^ I = 1 K k I k , p ^ m , t , τ = 1 K k 1 I m , t , τ k < 0
together with the quantiles of the break-even participation rate and the probability that an achievable participation target π a c h is sufficient,
q ^ π * 0.5 , q ^ π * 0.95 , P ^ π m , t * π a c h
The last quantity is the headline output of the framework. It is the counterpart, for a network that has flexibility available, of the shortfall probability (there called the probability that the impact is negative) reported in the earlier study for a network that has none; the term shortfall probability is used throughout this paper. A rank-order sensitivity analysis (Spearman correlation between each θ j and the regional impact across draws) identifies the parameters that dominate the result.

3.9. Positioning as the Scenario Layer of a Distribution-Grid Digital Twin

The framework can be read as one layer of a regional distribution-grid digital twin. Define the twin as the tuple G , x t , θ , U , where G is the network description (topology, ratings and substation types), x t the state (fleet, loads), θ the parameter distributions and U an update operator. Section 3.1, Section 3.2, Section 3.3, Section 3.4, Section 3.5, Section 3.6, Section 3.7 and Section 3.8 define the scenario layer, the mapping G , x t , θ risk metrics of Equations (23) and (24).
The update operator replaces expert or literature priors by empirical quantiles as telemetry accumulates. For a parameter j with an observed sample { y j , i } from charger or building meters, for example the plug-in rate of enrolled vehicles at home is
a j , b j , c j q ^ y j 0.05 , q ^ y j 0.50 , q ^ y j 0.95
This keeps the simulation engine unchanged, while the twin becomes progressively data-driven. The interface with the other layers of a twin is simple to state. The physical layer supplies G : substation ratings and, as monitoring improves, measured loads L m , τ in place of the annual values used here. The operational layer supplies the samples of Equation (25) from charger and building meters and consumes the outputs of Equations (23) and (24), for instance as a trigger for enrolment campaigns or reinforcement studies when a municipality’s shortfall probability crosses ε . The computational cost of the scenario layer is negligible, relative to the rest of a twin: the model is a scalar balance per municipality and year, so the simulation can be re-run at every update of Equation (25) without special infrastructure. What the framework does not do, and what a power-flow layer would add, is resolve voltage and thermal conditions within each municipality. It also locates the contribution of big-data and learning-based methods within the framework: forecasters of the location shares ϕ and plug-in rates γ , trained on charger and building telemetry, would supply the samples in Equation (25) at finer temporal resolution than the two tariff periods used here, without altering the structure of Equations (16)–(20). The framework thus provides a bridge between the situation of most operators today, who have a network description and literature priors but no bidirectional telemetry, and the data-rich operation envisaged by the Special Issue.

4. Illustrative Application

4.1. Network and Fleet Data

The framework is applied to the distribution network serving the twenty municipalities of the Ave, Tâmega and Sousa regions studied in [9]. The network is described by the installed power of its consumer substations and by the power consumed in peak and off-peak hours in each municipality (Table A1 of the earlier study), which give an aggregate installed capacity of 1,443,943 kVA and available power of 765,973 kVA in peak hours and 969,357 kVA in off-peak hours. The three national BEV fleet trajectories of the earlier study are retained: scenario 1 (BEVs reaching one third of national sales in 2030), scenario 2 (sales growing at the 2020–2021 rate) and scenario 3 (BEVs reaching 20% of the national fleet in 2030, the target of the National Energy and Climate Plan [52]). The population shares ρ m , t are recovered from the published municipal impact tables of the earlier study by inverting Equation (2) with c τ = 1 ; the recovered shares reproduce the published 2030 impacts of all three scenarios to within 1 kVA and the regional fleets of 58,477, 68,214 and 114,463 vehicles exactly. Non-residential shares of peak consumption σ m were not available at municipal resolution, and a uniform value of 0.5 is used; as shown in Section 4.6, this parameter has no influence on the results at the workplace plug-in rates supported by the evidence.

4.2. Parameterisation

Table 2a,b list the beta-PERT parameters of the behavioural and technical inputs (Equation (21)) and the evidence on which they rest (Section 2.2). The participation rate takes its most likely value from observed enrolment in real programmes, rather than from stated intentions. The location shares are time-weighted over the two blocks of the Portuguese peak period, as discussed in Section 3.2. The home plug-in rate refers to enrolled vehicles and is anchored on the availability observed among V2G participants in Project Sciurus; the workplace rate is anchored on the share of European drivers who usually charge at work. The usable margin δ is bounded above by the long-route reserve of Equation (8). Coincidence factors are fixed at unity in the headline analysis, which is the planning bound of the earlier study, and drawn from a distribution representing uncontrolled-charging diversity in the expected case of Section 4.7. Yearly sales follow the specification of the earlier study, so that the fleet uncertainty of the two papers is identical. All behavioural priors are transferred from trials and surveys conducted outside Portugal; the only local evidence is the mobility survey behind the location shares. Section 4.6 shows which of the transferred parameters matter and Section 5.6 discusses what the transfer implies.
The workplace plug-in rate deserves a comment, because the evidence behind it measures a different quantity from the one the model needs. The share of European drivers who usually charge at work (14%, with national values between 5% and 23%) and the share of sessions at workplaces (about 10%) reflect the scarcity of workplace charging today, not the behaviour of drivers who have a bidirectional charger at their workplace; the latter has not been observed at scale, and Project Sciurus suggests that enrolled users, once equipped, keep their vehicles plugged in for most of the time they are parked. The range in Table 2a should therefore be read as describing the workplace channel as it exists, and Section 4.6 reports a sensitivity with γ W between 0.5 and 0.7, to describe it as it might become.

4.3. Simulation Set-Up

The model was evaluated for K = 2000 trials driven by a fixed pseudo-random sequence (seed 20260826), so that every figure in this section can be regenerated exactly. The headline case holds the participation rate constant across years, and is therefore an upper bound on mid-decade benefits (Section 3.3). Achievable participation targets were set at π a c h { 0.10 , 0.20 , 0.30 } and the tolerated shortfall probability at ε = 0.05 . A control run with 10,000 trials and an independent seed changed the regional shortfall probabilities by at most 0.5 percentage points and the municipal median break-even rates by less than 0.005, confirming that sampling error is immaterial at the reported precision. The companion workbook, in which every quantity is a spreadsheet formula, is provided as Supplementary Material.
At the most likely parameter values of Table 2a,b, the per-vehicle quantities of Section 3.4, Section 3.5 and Section 3.6 are as follows. The sustained export power is P e f f = 2.3 kW (median 2.3 kW across trials), against a charger rating of 7.4 kW: the energy constraint binds in every trial. The probability that an enrolled vehicle is at home and plugged in during the peak is β H , P = 0.385 , and at a building with a bidirectional charger β W , P = 0.038 . The flexibility value of one enrolled vehicle is therefore f P 11.3 kVA, of which 10.35 kVA (92%) is the load-shifting term and about 0.9 kVA the export term; the off-peak rebound is 0.26 kVA per enrolled vehicle. In 2030, at the median of the trials, enrolment removes about 134,000 kVA of coincident charging load from the regional peak and adds about 12,000 kVA of export.

4.4. Regional Results

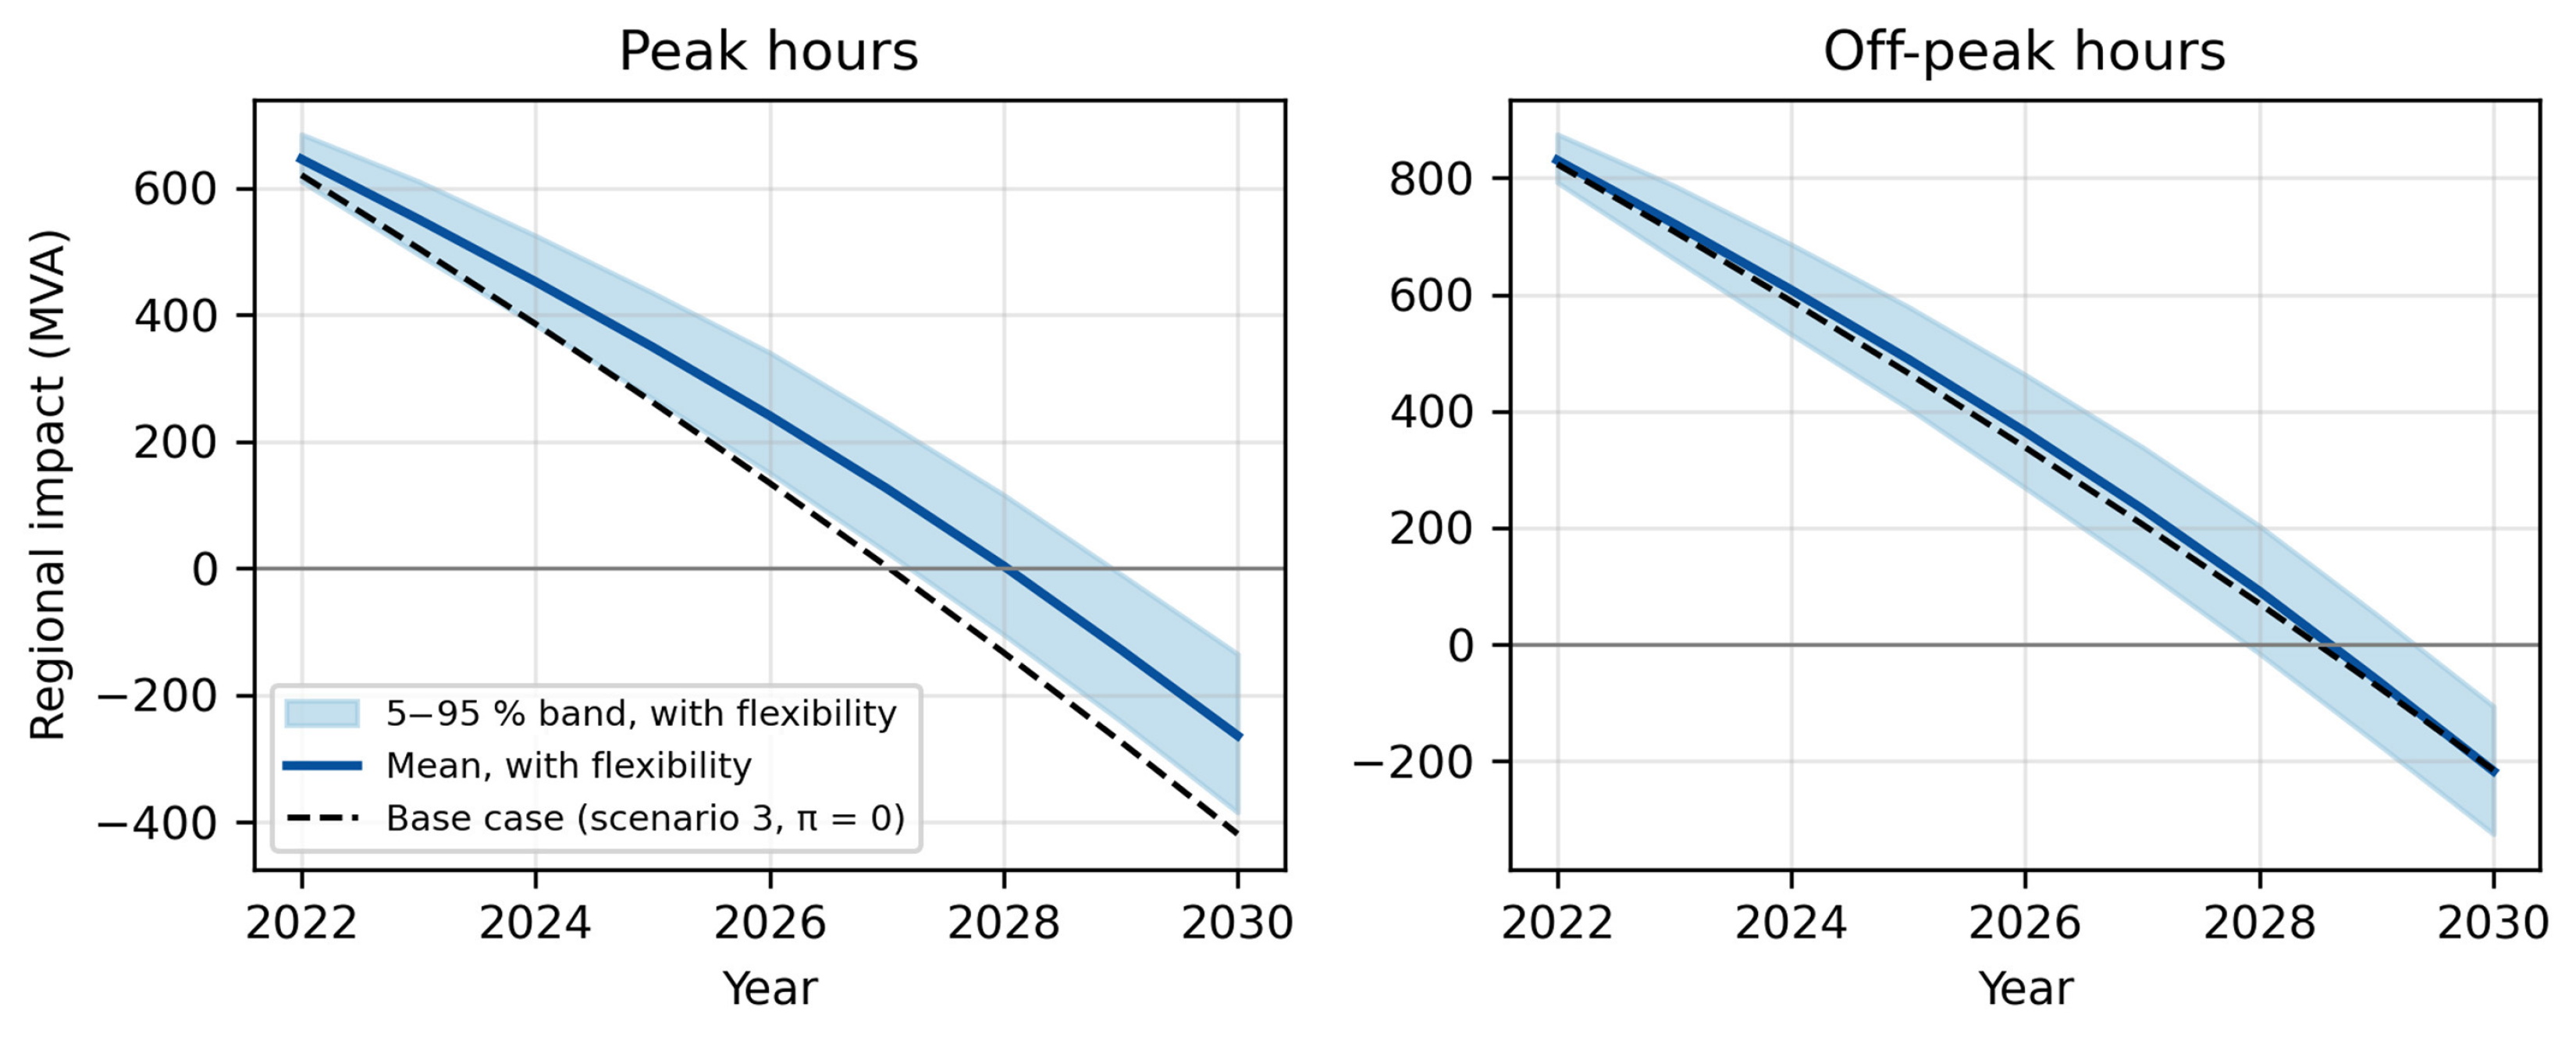
Table 3 gives the regional statistics by year for peak and off-peak hours, following the format of the corresponding table in the earlier study, and Figure 1 plots them. Three rows describe the peak period without flexibility: the deterministic scenario-3 base case, the mean under the stochastic fleet, and the shortfall probability under the stochastic fleet, which reproduces the earlier result (0.1%, 32.6%, 94.8% and 100% for 2026–2029 against 0.3%, 34.7%, 95.9% and 100% in the earlier study; the small differences arise from the random sequence and from the bounds guard described in Section 3.8). The remaining rows describe the network with the bidirectional flexibility of Table 2a,b, under the planning-bound assumption c τ = 1 .
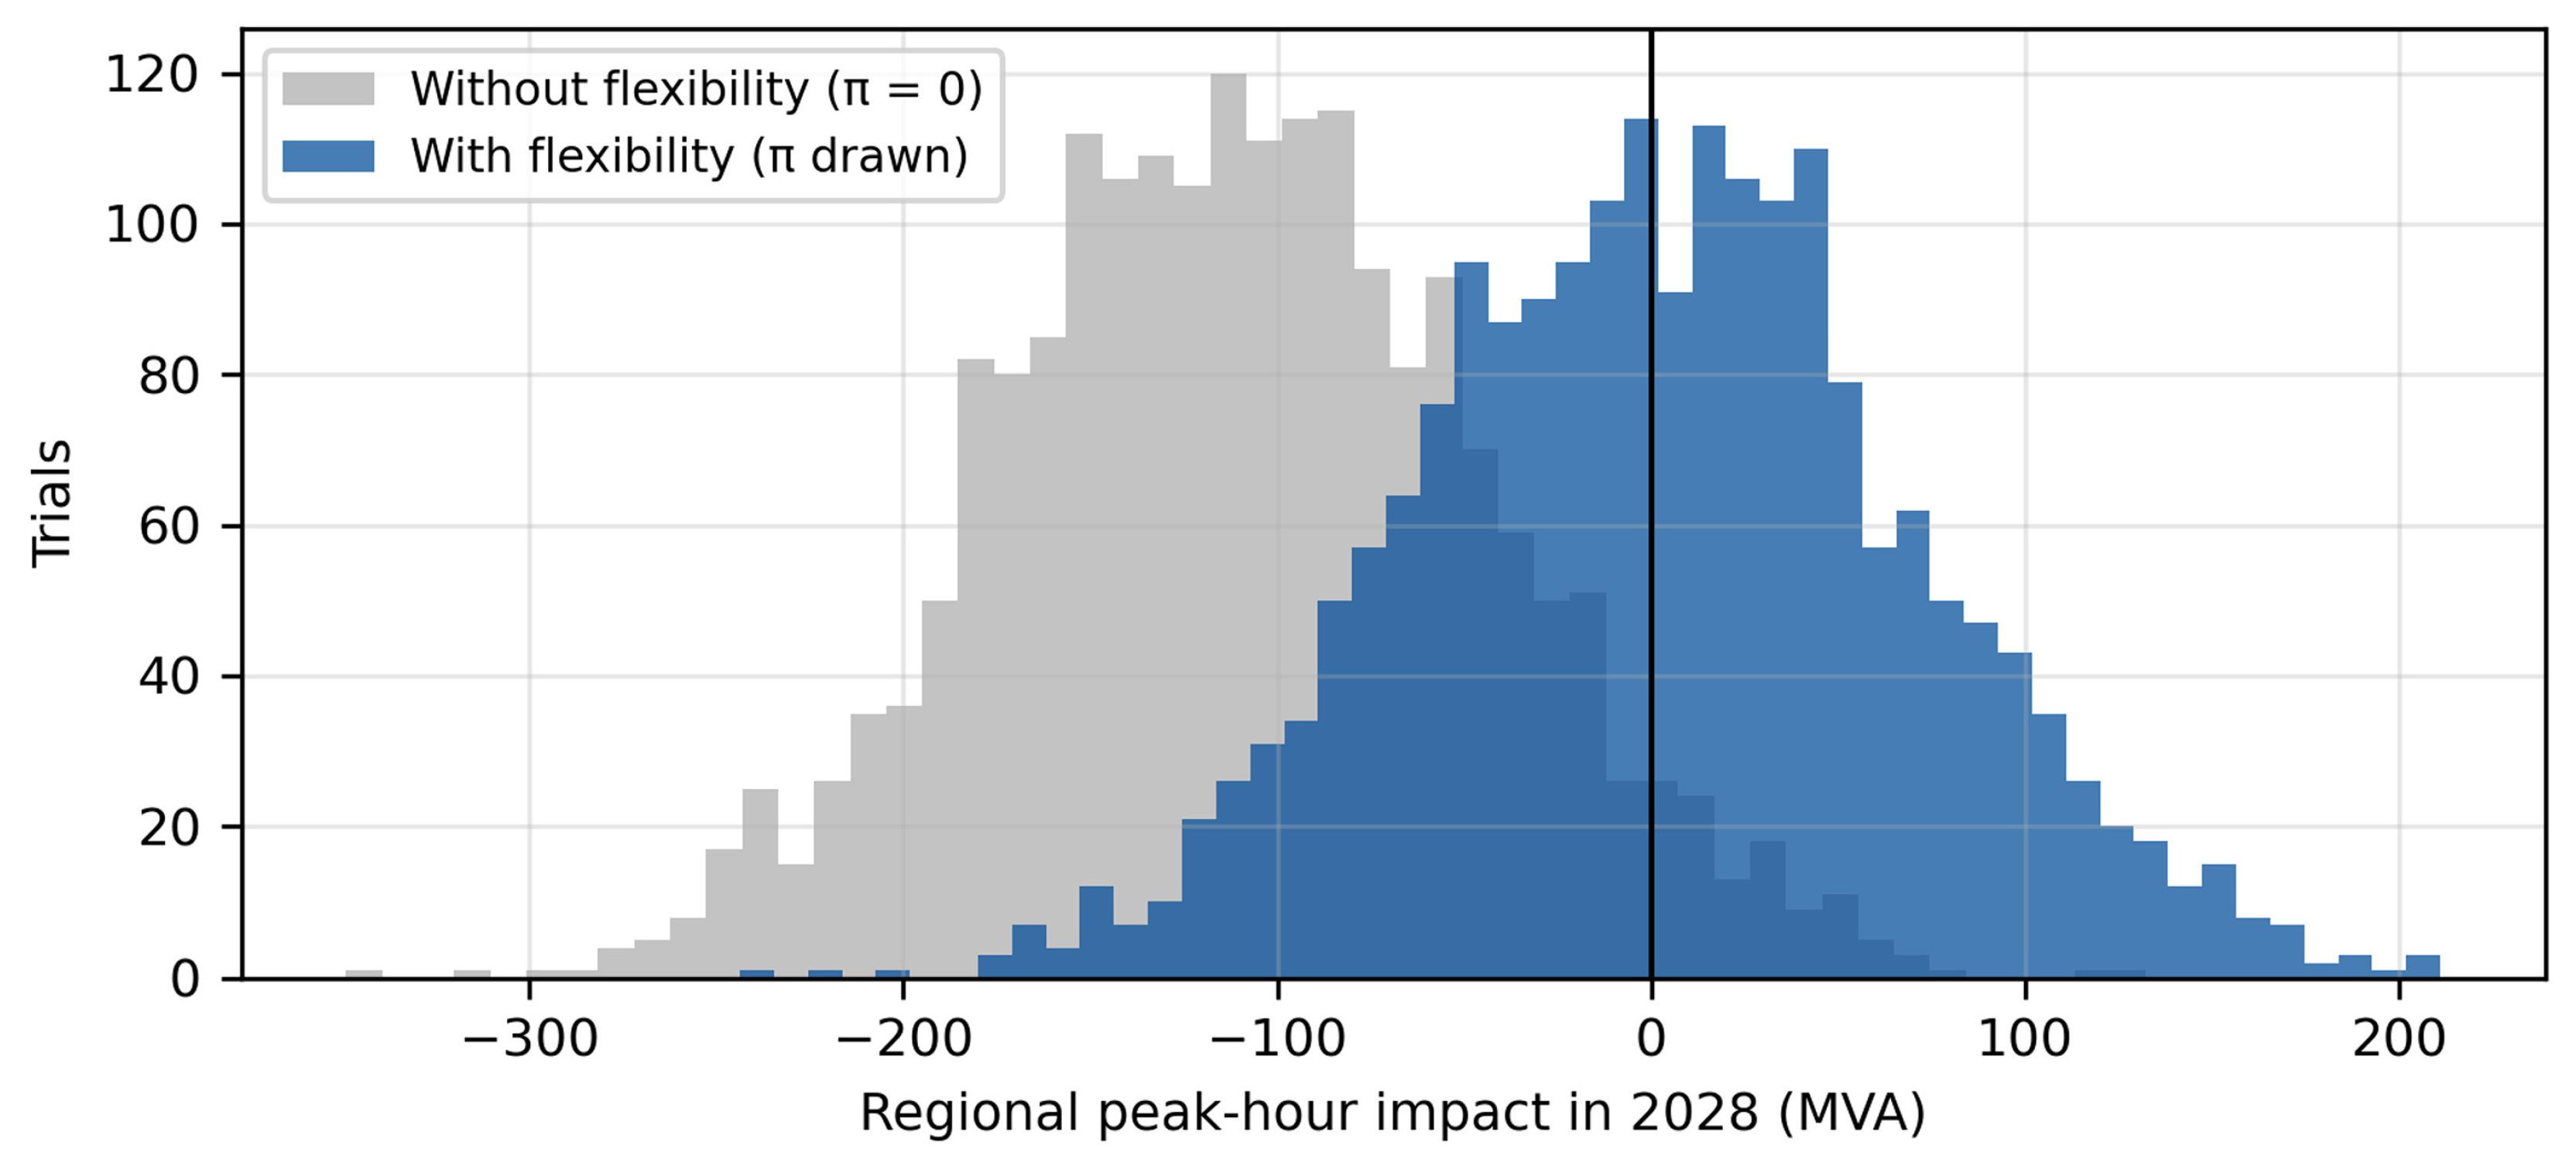
Flexibility at the participation rates of Table 2a shifts the aggregate peak-hour trajectory upward by roughly 105,000 kVA in 2024 and 150,000 kVA in 2030, but does not change its slope, because the fleet keeps growing and only about one vehicle in ten is enrolled. The consequence is a postponement, rather than an elimination of the regional shortfall under the planning bound: the shortfall probability falls from 32.6% to 2.1% in 2027 and from 94.8% to 48.4% in 2028, but is 96.2% in 2029 and 100% in 2030, with or without flexibility. The expected 2030 deficit is reduced from about 417,000 kVA to about 264,000 kVA, a reduction of 37%. Figure 2 shows the 2028 distributions, the year in which flexibility makes the largest difference. These figures credit the network with the full participation rate from 2024; if enrolment builds up linearly over the decade instead, the 2027 and 2028 shortfall probabilities are 9.8% and 70.7% (Section 4.6), so the mid-decade relief is smaller and the 2030 position is unchanged.
In the off-peak period, the rebound of Equation (14) is negligible: it adds about 1.5% to the off-peak requirement in 2030 and leaves the shortfall probabilities essentially unchanged (7.8% in 2028, 81.3% in 2029, 99.9% in 2030). Off-peak criticality in 2029–2030 is therefore a consequence of the fleet itself under the worst-case coincidence assumption, not of bidirectional operation, and it disappears in the expected case of Section 4.7.
The regional break-even participation rate of Equation (19), evaluated on the aggregate, is negative until 2027 (no flexibility required at the regional level), 0.11 in 2028, 0.23 in 2029, and 0.32 in 2030, at the median of the trials. The most likely participation rate of 0.10 is thus sufficient at the aggregate level until 2028 and insufficient thereafter, which is the pattern visible in Table 3.

4.5. Municipal Results

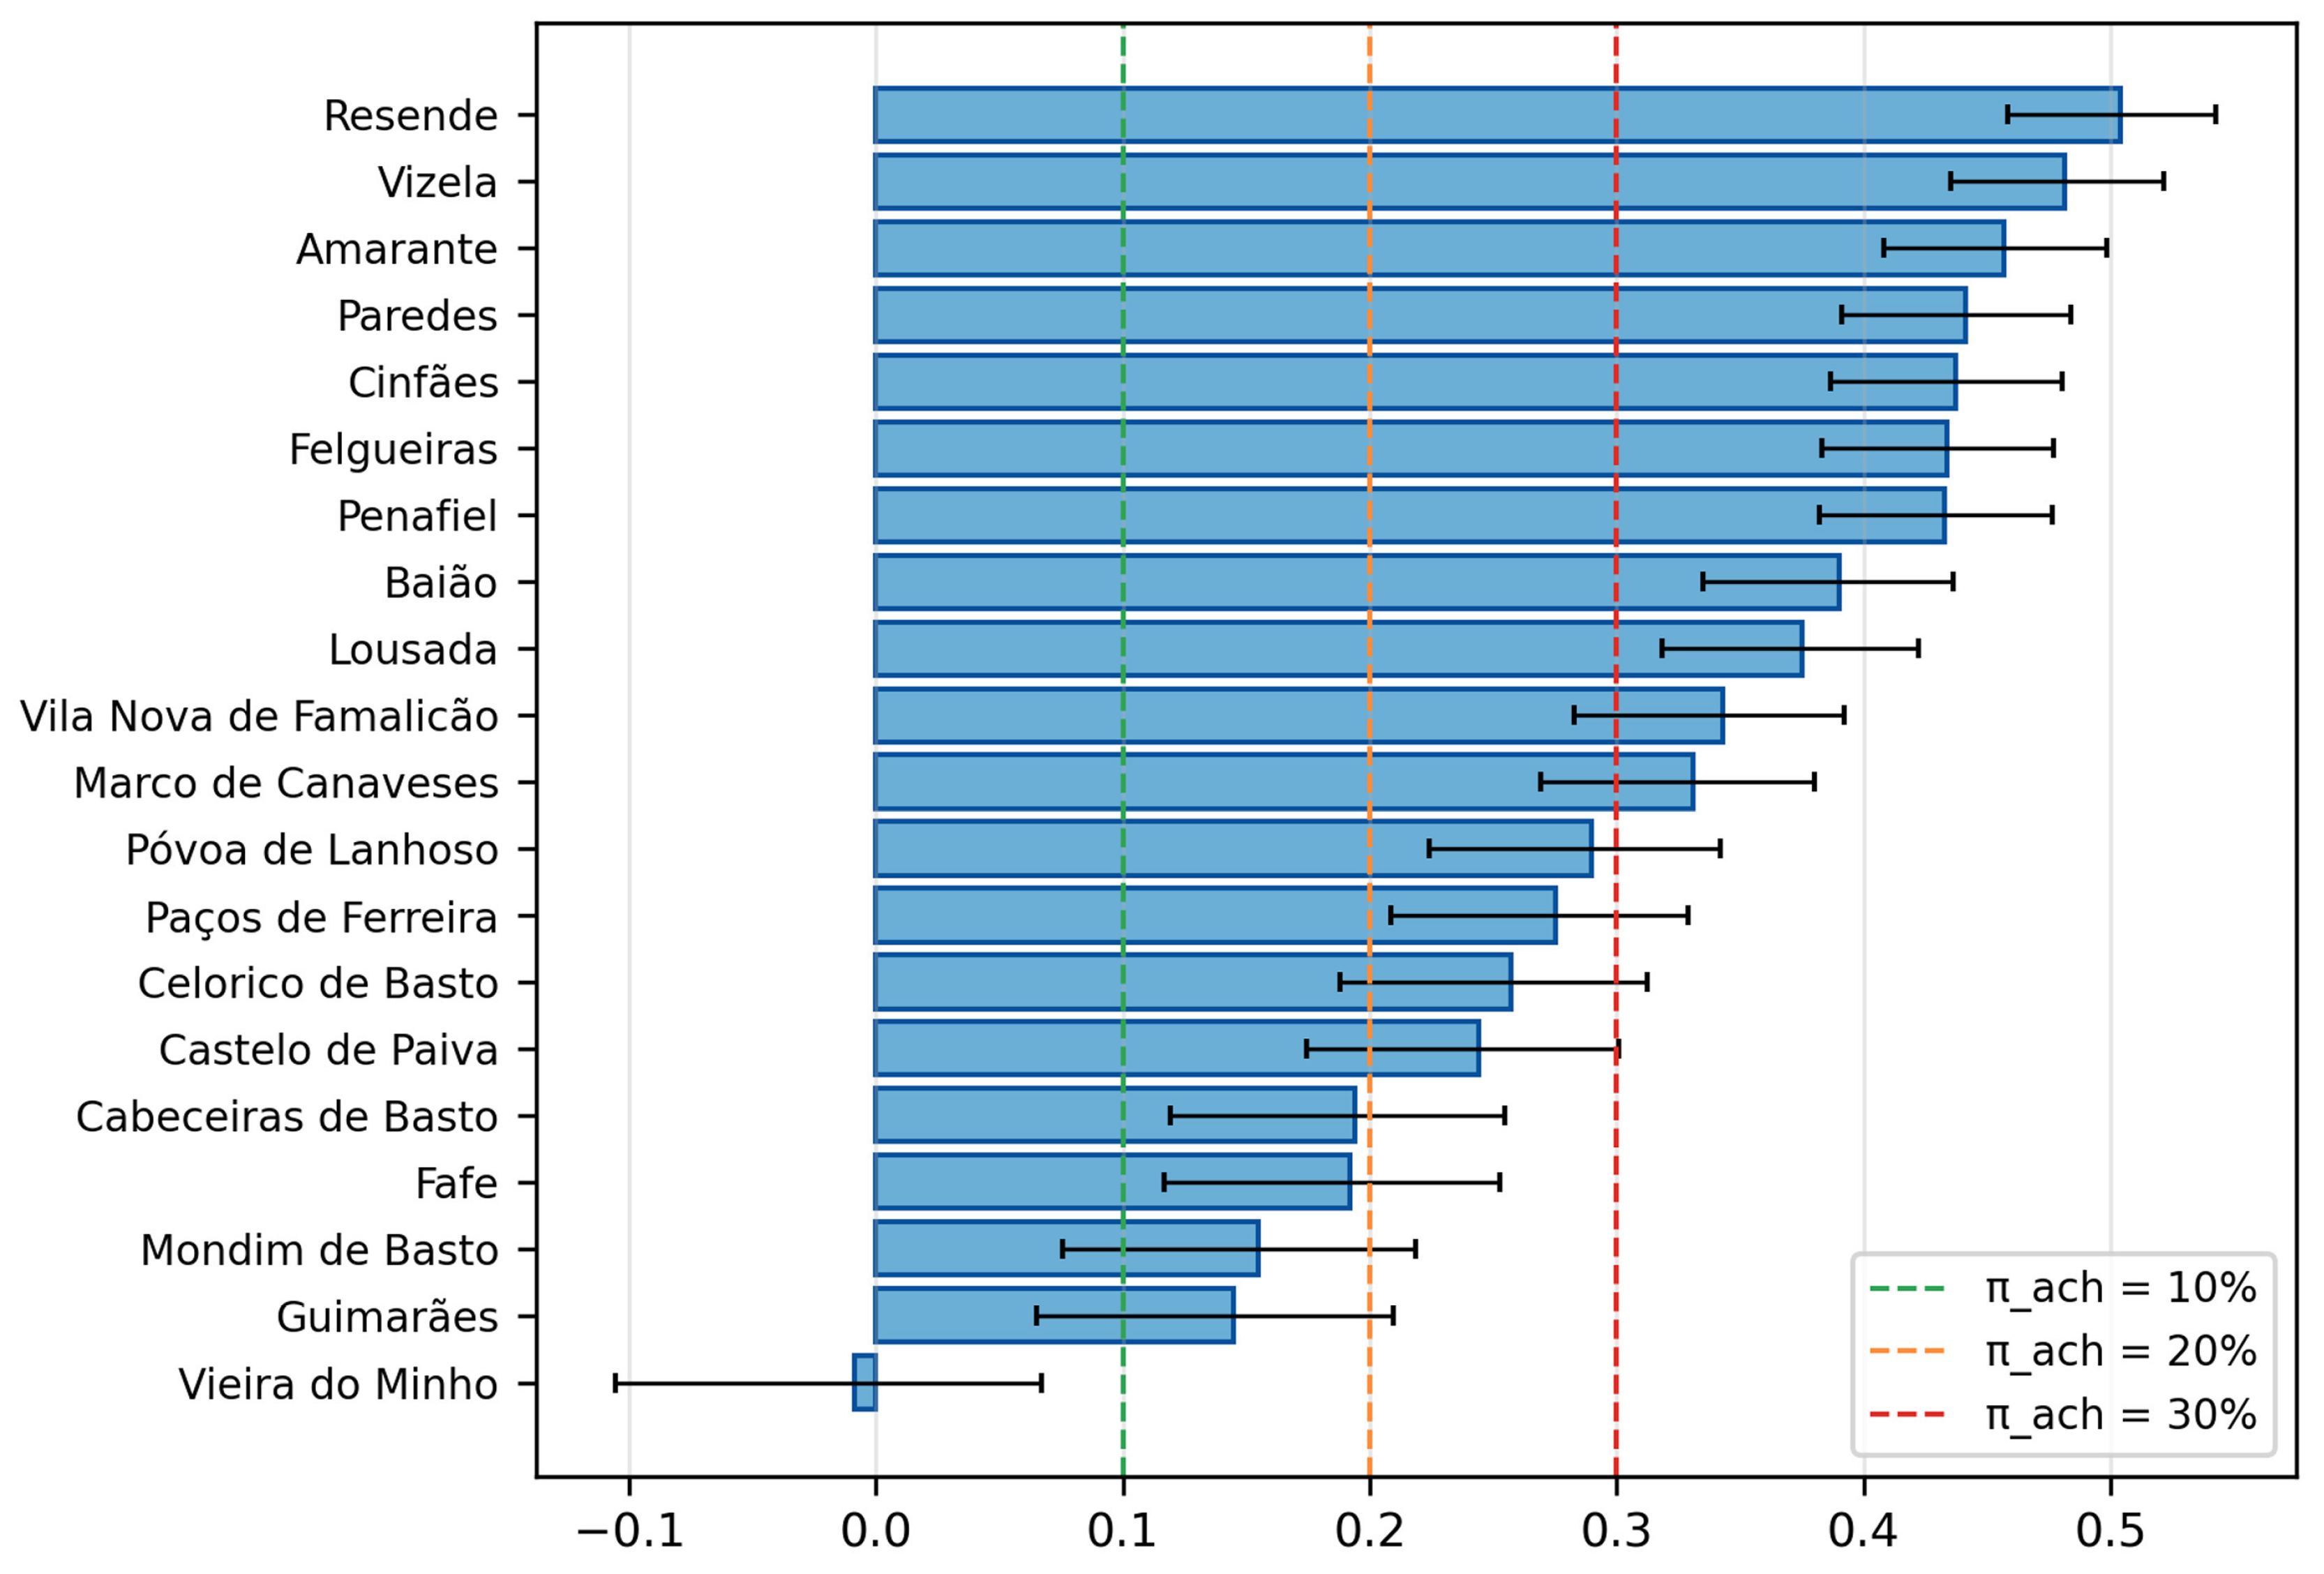
The aggregate hides large differences among municipalities, as it did in the earlier study. Table 4 reports the median and 95th percentile of the break-even participation rate in each municipality for 2026–2030, and Figure 3 displays the 2030 values against the three achievable targets.
Three groups emerge. In the Ave municipalities with the largest headroom relative to their fleet (Vieira do Minho, Guimarães, Mondim de Basto, Fafe, and Cabeceiras de Basto), the median break-even rate in 2030 lies between −0.01 and 0.19, and a 20% participation target is sufficient with probability 56–100% (Table 5). In an intermediate group (Castelo de Paiva, Celorico de Basto, Póvoa de Lanhoso, and Paços de Ferreira), the 2030 median lies between 0.24 and 0.29 and a 30% target is sufficient with probability 63–95%. In the Tâmega and Sousa municipalities that were already critical from 2026 in the earlier study (Vizela, Amarante, Paredes, Cinfães, Felgueiras, Penafiel, Baião, and Lousada), together with Vila Nova de Famalicão and Marco de Canaveses, the 2030 median lies between 0.33 and 0.50, and none of the three targets is sufficient in more than one trial in five. In no municipality and no year does the median break-even rate exceed one: the fleet is, in principle, large enough to neutralise its own peak impact everywhere, but only at participation rates well above those observed in current programmes.
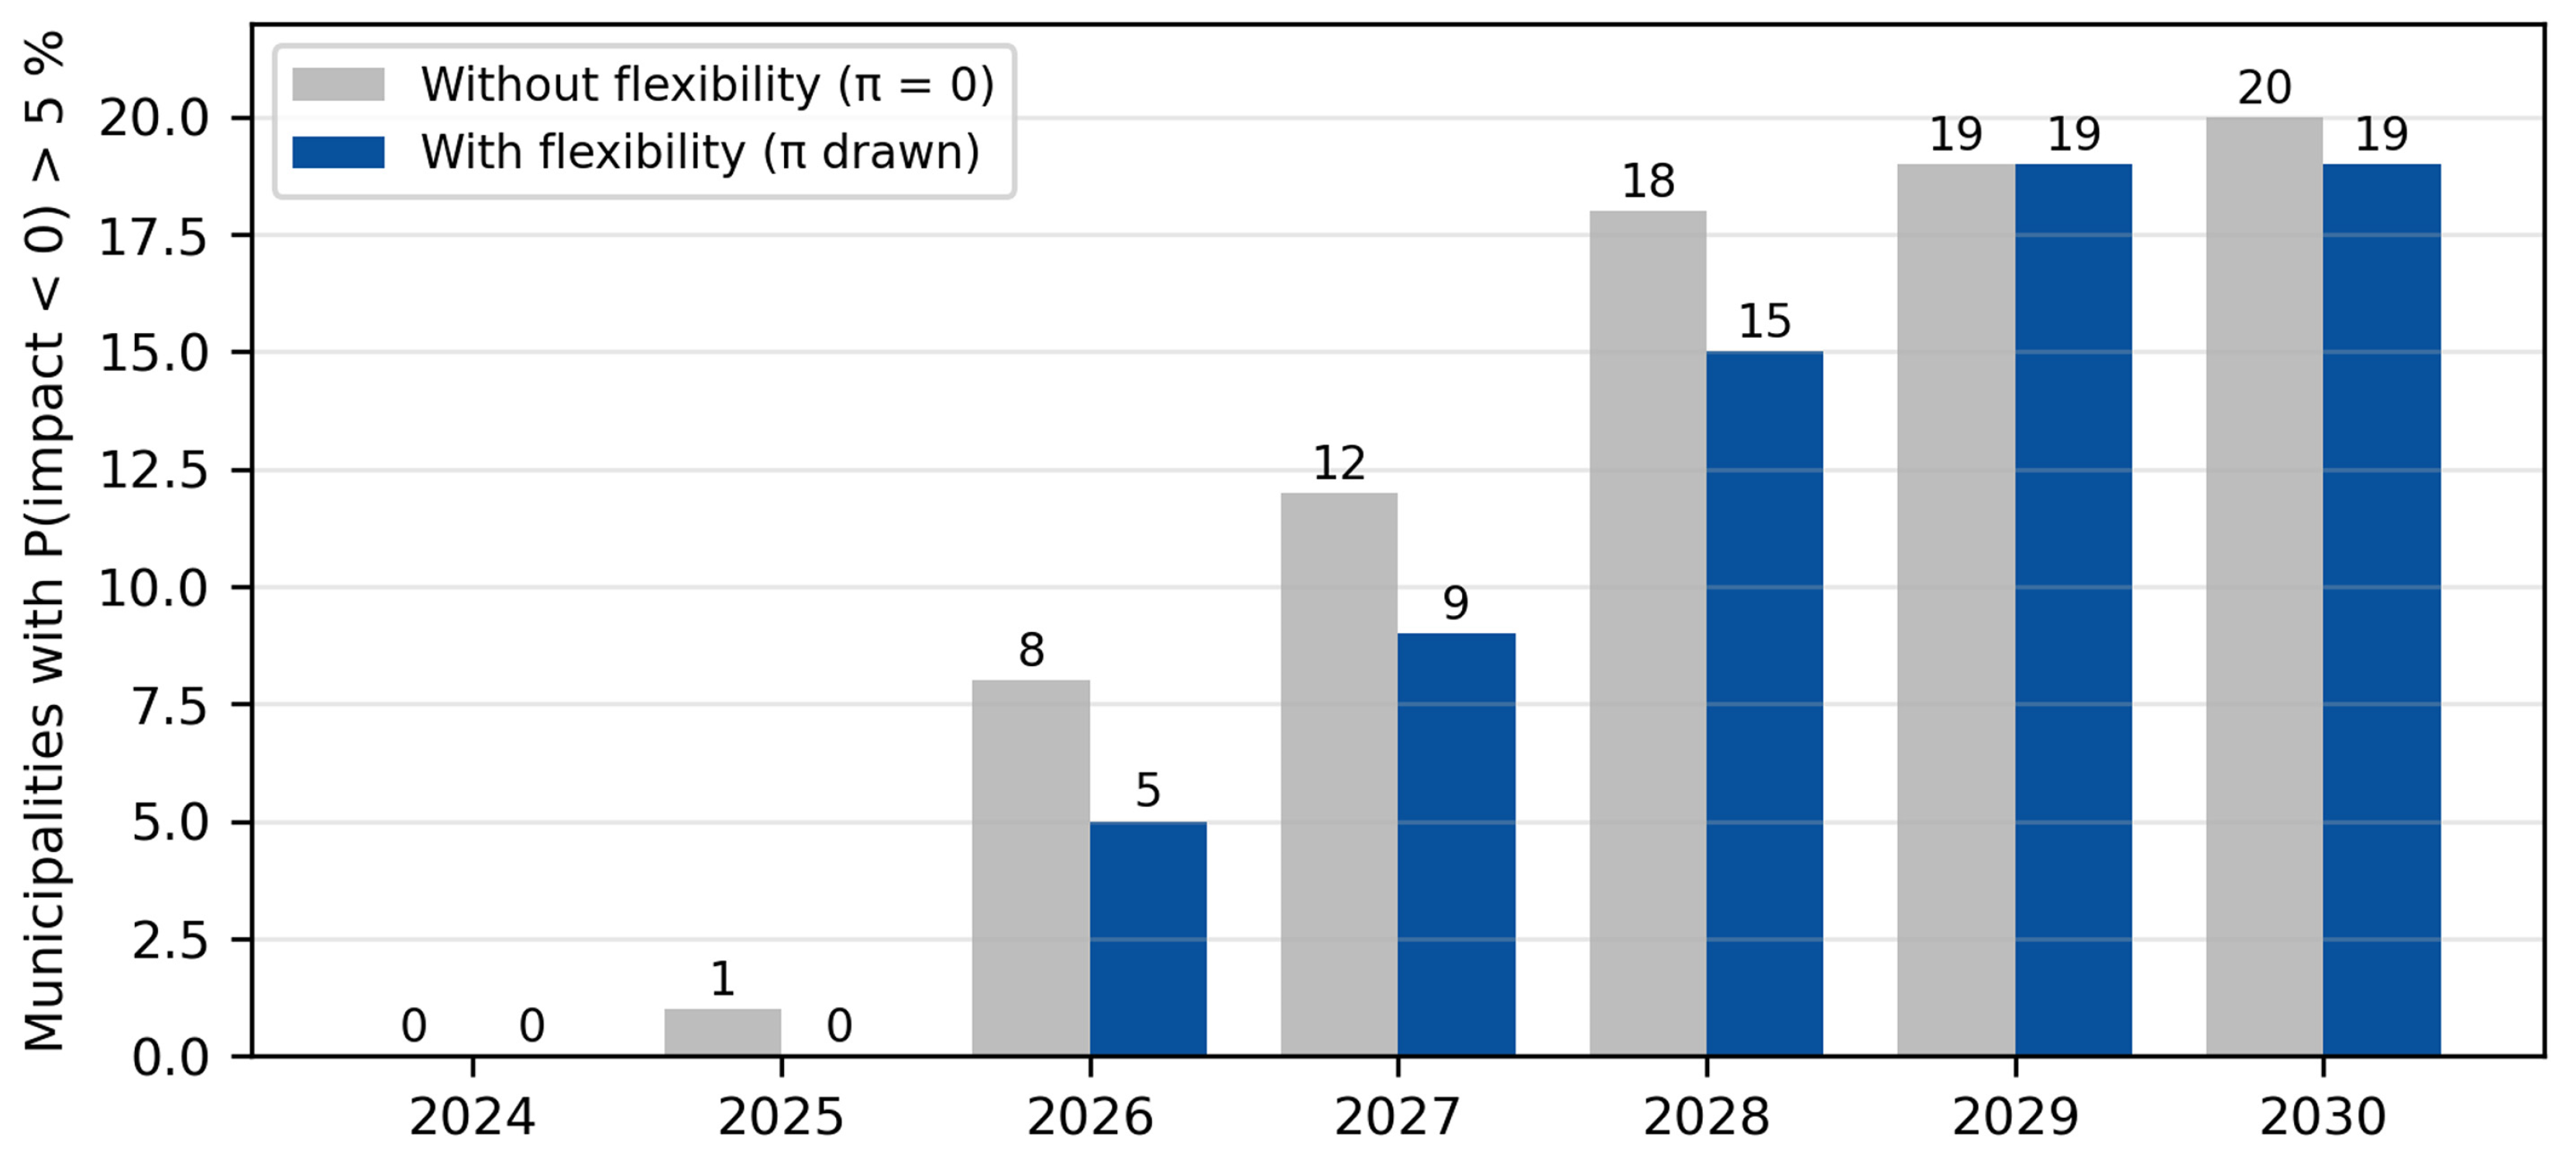
The deferral metric summarises the municipal picture in the units of an investment plan. Bidirectional flexibility at the participation rates of Table 2a defers the first critical year by one year in eleven municipalities and by none in the other nine; the mean deferral is 0.55 years, and no municipality gains more than a year. The six municipalities in which the first critical year is 2026 without flexibility (Vizela, Amarante, Paredes, Cinfães, Felgueiras, and Penafiel) remain critical in 2026 or 2027 with it. Figure 4 gives the corresponding counts by year, the counterpart of Figure 5 of the earlier study: the number of municipalities whose shortfall probability exceeds 5% is reduced from 8 to 5 in 2026, from 12 to 9 in 2027, and from 18 to 15 in 2028, and is unchanged, at 19, in 2029–2030.

4.6. Sensitivity Analysis

4.6.1. Rank Correlation of the Inputs

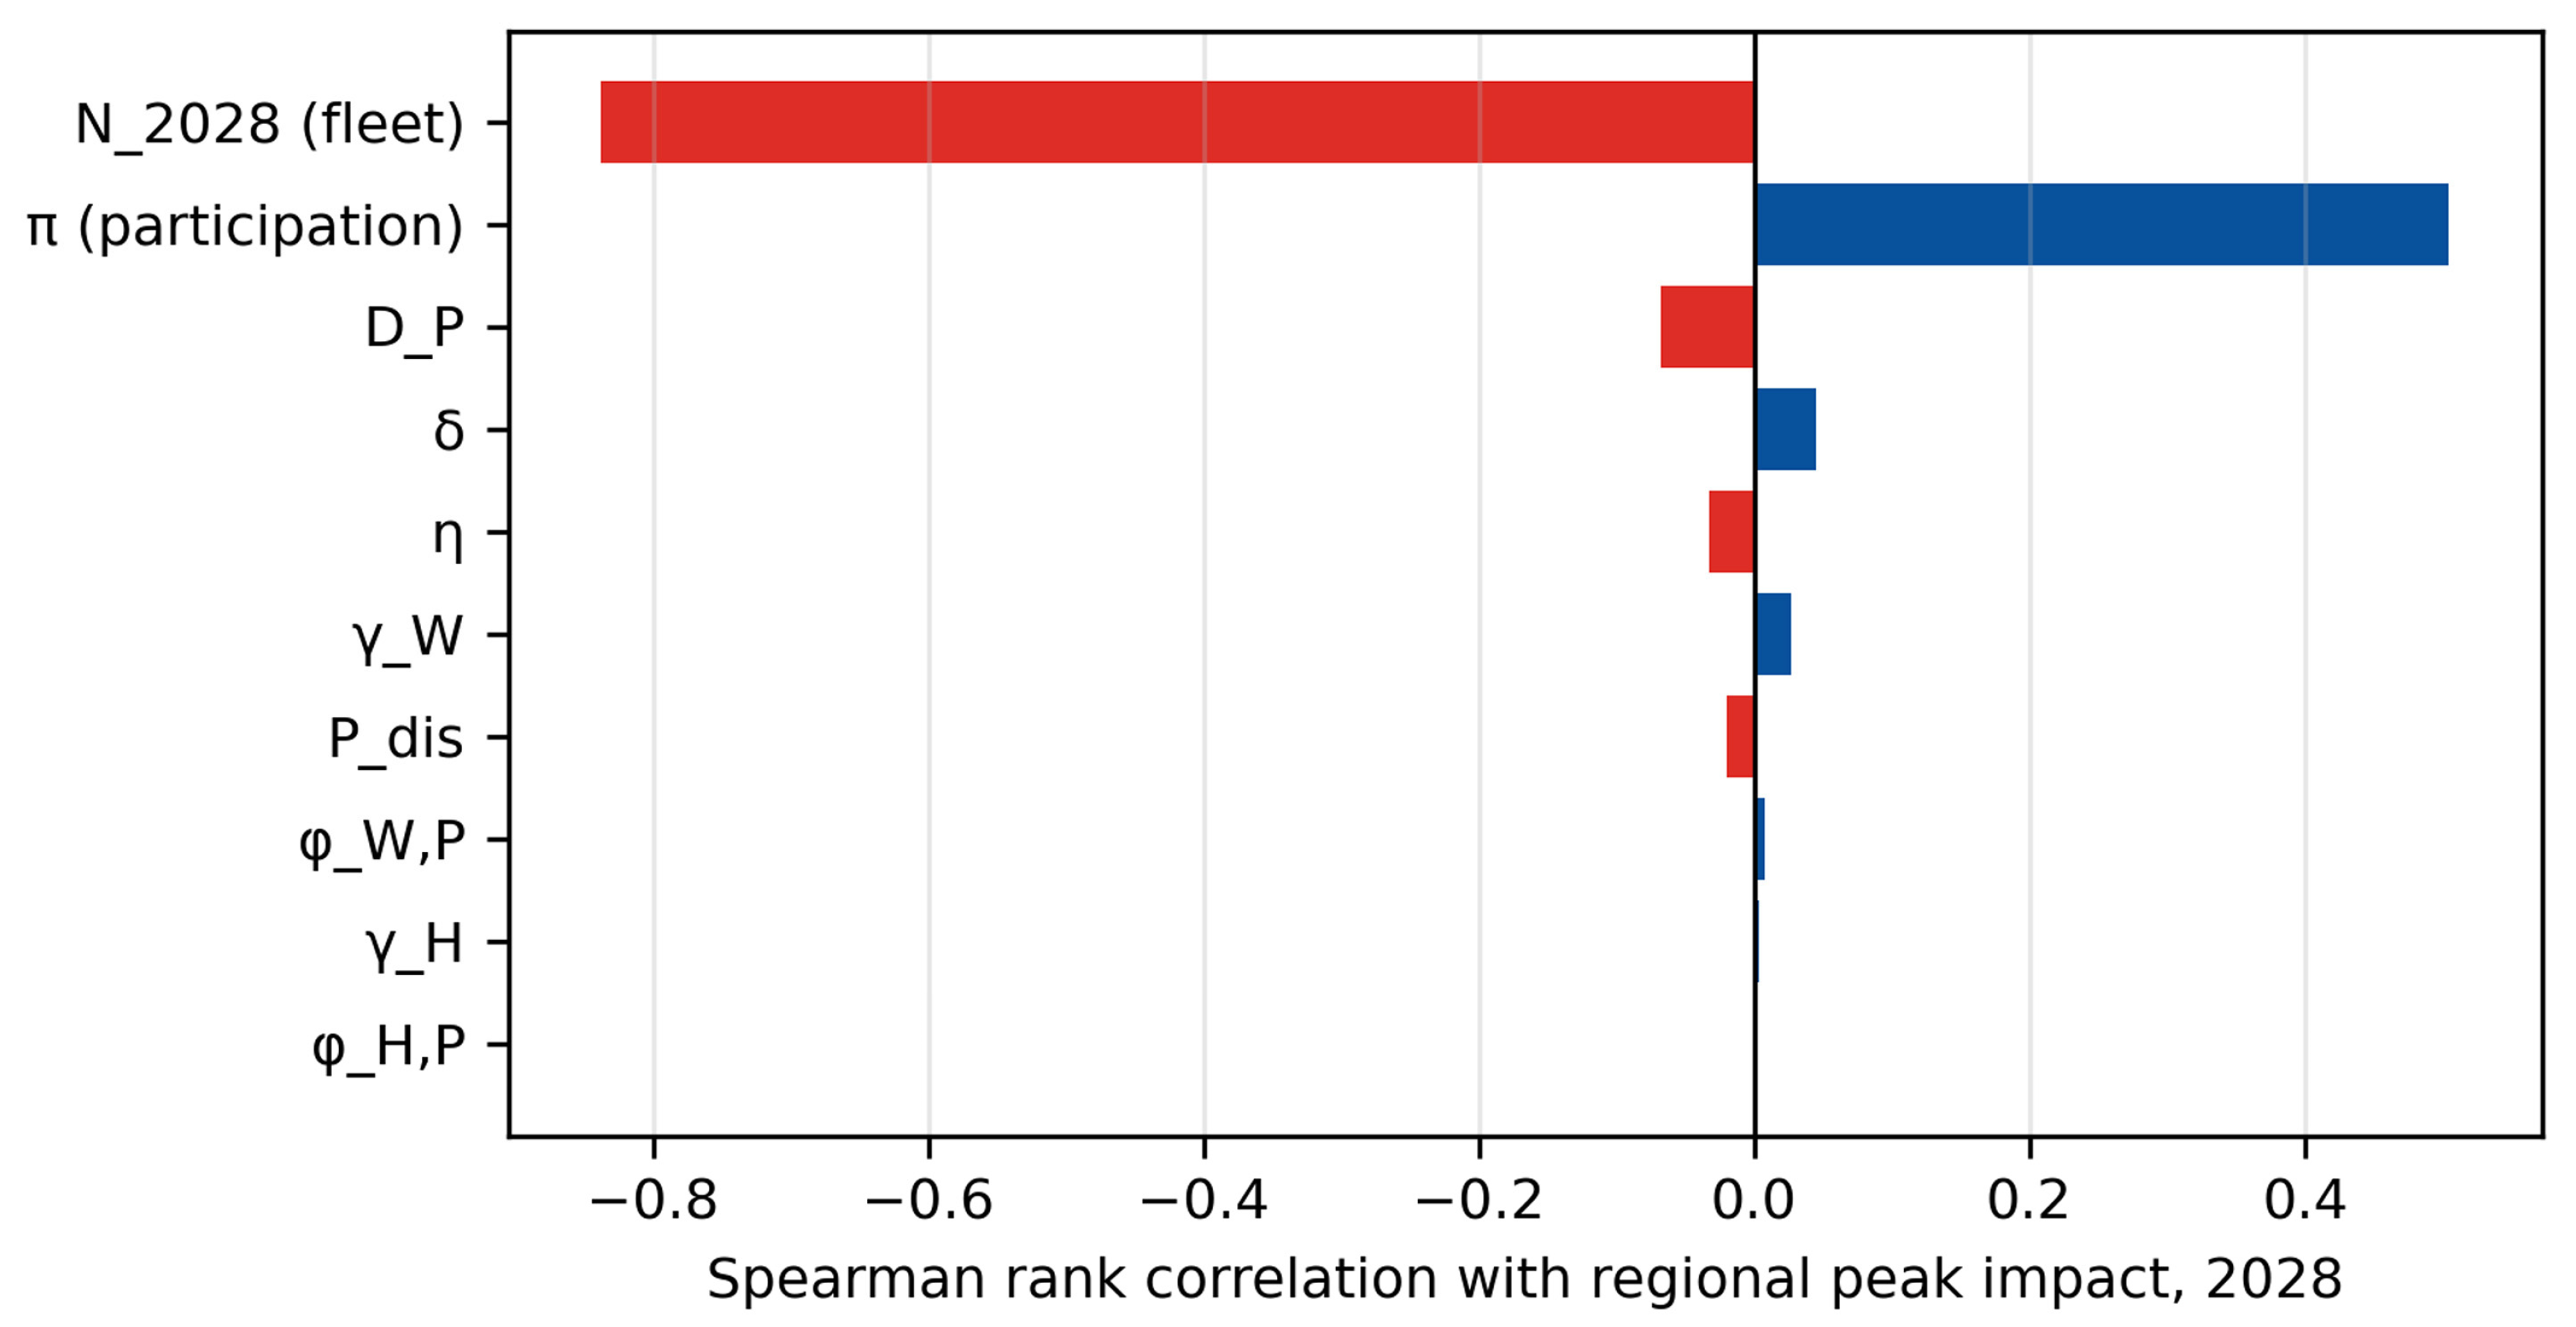
Figure 5 ranks the uncertain inputs by their Spearman rank correlation with the regional peak impact in 2028, across the 2000 trials. Two inputs account for almost all the variance: the national fleet (correlation −0.84) and the participation rate (+0.50). The remaining inputs, including all the location shares and plug-in rates, have correlations below 0.07 in absolute value. This is a direct consequence of Section 3.4: because the energy constraint binds, the export term is small, and the parameters that govern it, however uncertain, cannot move the result. The practical implication is that the parameters worth measuring first, in the sense of Section 3.9, are the enrolment rate and the fleet trajectory, not the finer details of vehicle location or export power.

4.6.2. Structural and Parametric Sensitivities

Table 6 reports the structural and parametric sensitivities under the planning bound. Removing the V2B cap (σ = 1) changes nothing, because at the workplace plug-in rates of Table 2a the V2B export never approaches the non-residential load of any municipality; the cap is a safeguard for a future in which workplace bidirectional charging is common, not a constraint today. The same conclusion holds when that future is simulated directly: with γ W drawn between 0.5 and 0.7, as if every enrolled vehicle parked at a building had a bidirectional charger and used it, the 2028 shortfall probability moves from 48.4% to 47.3% and the expected 2030 deficit by about 3500 kVA, because the export of a vehicle parked at a building is worth the same 2.3 kW as at home and the location shares of Table 2a already place a quarter of the fleet at buildings. Raising the representative battery capacity to 65 kWh, closer to the current European average, raises sustained export from 2.3 kW to 2.9 kW and has an effect of the same small size. Letting the participation rate ramp linearly from zero in 2024 to its drawn value in 2030 leaves the 2030 results unchanged, as it must, but removes most of the mid-decade benefit: the 2028 shortfall probability rises from 48% to 71%. Doubling the participation distribution (most likely 0.20, maximum 0.40) reduces the 2028 shortfall probability to 9% and the expected 2030 deficit to about 134,000 kVA, but still leaves nineteen municipalities critical in 2030. Two further variants isolate assumptions of the export and location models. Setting the discharge rating to zero, so that enrolled vehicles shift their charging but do not export, raises the 2028 shortfall probability from 48.4% to 53.6%, deepens the expected 2030 deficit by about 13,000 kVA, and adds two critical municipalities in 2026 and one in 2027: this is the entire contribution of bidirectional export to peak relief, and the rest of the headline result is managed charging. Replacing Ω = I by an origin–destination matrix in which 29% of each municipality’s resident fleet works in other municipalities, distributed among these areas in proportion to their peak load, leaves every regional statistic unchanged, as Section 3.2 anticipates, and changes no municipal median impact in 2030 by more than 9 kVA (0.01% of available power) and no municipal shortfall probability by more than 0.05 percentage points. The coincidence-factor rows of Table 6 are discussed in Section 4.7.

4.6.3. Stationary Storage: An Upper Bound

Table 7 quantifies the stationary storage that would neutralise the 2030 peak deficit in the municipalities where a 20% participation target is insufficient, evaluated as the residual deficit at π = 0.20 under the planning bound (Equation (12) with F S set equal to the residual). The figures are an upper bound, for three reasons. The model is a balance over the whole peak period, so it sizes storage to supply the residual deficit at constant power for the full period, whereas a dispatch that discharged only during the constrained hours of each block would need less energy; storage is assumed to carry the entire residual alone, without further load shifting or export; and the coincidence factor is one. Under the expected case of Section 4.7, the regional residual is zero and the municipal residuals are small. With that qualification, fifteen municipalities have a median break-even rate above 0.20 in 2030; their residual deficits sum to about 175,000 kVA at the median and 239,000 kVA at the 95th percentile, and over a 4.5 h peak this corresponds to roughly 790 MWh of storage energy, equivalent to the full capacity of about 15,000 representative-vehicle batteries. Recharging that energy over the 19.5 h off-peak period would add about 40 MW to the off-peak load, which is small relative to the off-peak headroom of the region in every year but the last two under the planning bound, and in every year under the expected case. Second-life batteries in buildings could supply part of this volume, but its magnitude indicates that, under the fleet trajectory of scenario 3 and worst-case simultaneity, network reinforcement in the Sousa and Tâmega cluster cannot be avoided by flexibility alone.

4.7. The Coincidence Factor: Planning Bound and Expected Case

The earlier study assumed, deliberately, that every vehicle draws its contracted power simultaneously in both periods ( c τ = 1 ), because a distribution operator without control over charging must plan against that bound. Two rows of Table 6 relax the assumption in the peak period only: a coincidence factor of 0.6, which is still above the values usually reported for uncontrolled home charging [14,28,38], removes the regional shortfall entirely and reduces the number of critical municipalities in 2030 from nineteen to eight; at 0.3, no municipality is critical. Because the earlier study’s result depends so strongly on this assumption, the expected case is presented here with the same standing as the planning bound, rather than as a sensitivity.
In the expected case, both coincidence factors are drawn from a beta-PERT distribution with minimum 0.4, a most likely value 0.6, and maximum 0.8 (Table 2b), a range that spans the diversity of uncontrolled home charging reported in the literature and leaves room for the higher coincidence that a single-tariff evening peak can produce; all other inputs are those of Table 2a,b. Table 8 gives the results.
Under the expected case, the regional network is not constrained during the decade. Without any flexibility, the peak-hour shortfall probability is 4.9% in 2029 and 28.9% in 2030; with flexibility at observed participation rates it is 0.4% and 5.9%, and the off-peak shortfall probability is nil throughout. The municipal picture changes accordingly: the number of municipalities whose shortfall probability exceeds 5% rises from one in 2027 to fifteen in 2030 without flexibility, and from none in 2027 to eleven in 2030 with it, against nineteen in both cases under the planning bound. The break-even participation rate in 2030 is at or below 0.10 in thirteen municipalities, and at or below 0.20 in nineteen; the eight municipalities of the Sousa and Tâmega cluster that remain critical (Vizela, Amarante, Paredes, Cinfães, Felgueiras, Penafiel, Resende and Baião, with Lousada marginal) have median break-even rates between 0.01 and 0.22, all within the range of current programmes, and their shortfall probabilities with flexibility in 2030 lie between 19% and 81%. Flexibility defers reinforcement by one year in thirteen municipalities in the expected case, against eleven under the planning bound.

4.8. Corporate and Private Segments

Section 1 noted that corporate purchasers accounted for 84% of new BEV registrations in Portugal in 2025 [2]. A two-segment version of the model tests what this composition implies. The fleet of each municipality is split into a corporate share κ and a private share 1 κ ; the private segment keeps the parameters of Table 2a, while the corporate segment has a higher participation rate, π c PERT(0.10, 0.25, 0.50), reflecting batch enrolment decisions and centrally managed charging, and a higher share at buildings during the peak, ϕ W , P c PERT(0.30, 0.45, 0.60), with the home share reduced by the same amount. The corporate share of the fleet is lower than its share of new registrations, because fleets turn over faster and part of the stock predates the corporate surge; it is drawn as κ PERT(0.50, 0.65, 0.80). Flexibility and rebound are computed for each segment with Equations (10)–(15) and summed; the fleet-wide effective participation rate is κ π c + 1 κ π .
The effective participation rate has a median of 0.21 (5–95th percentiles 0.14–0.30), twice the single-population value. Table 9 compares the segmented and single-population results under both coincidence cases, together with the scenario-1 fleet of Section 4.9. Under the planning bound, segmentation reduces the 2028 regional shortfall probability from 48% to 10% and the expected 2030 deficit from 264,000 to 146,000 kVA, and doubles the total deferral across the twenty municipalities from 11 to 24 years, but still leaves nineteen municipalities critical in 2030. Under the expected case, segmentation brings the 2030 regional shortfall probability below 1% and the number of critical municipalities in 2030 from eleven to eight. The corporate composition of the fleet is, therefore, the single behavioural factor that most improves the outlook, and it acts through participation and managed charging, rather than through V2B export, for the reason established in Section 4.6.

4.9. Observed Adoption Path

Section 5.4 shows that registrations since 2021 have tracked scenario 1 of the earlier study, rather than scenario 3. The last two rows of Table 9, therefore, evaluate the framework on the scenario-1 fleet with the behavioural uncertainty of Table 2a. Under the planning bound, the regional shortfall probability is zero in every year, and three municipalities are critical in 2030 without flexibility, as in the earlier study, and two with it; under the expected case, no municipality is critical. If adoption continues on its observed path, the network of the twenty municipalities is not constrained by passenger BEVs within the decade under any of the assumptions examined, and the results for scenario 3 describe the consequences of a policy-driven acceleration, rather than a forecast.

5. Discussion

5.1. Load Shifting First, Export Second

The most robust result of the application is structural, rather than numerical: of the 11.3 kVA of flexibility value that enrolment brings to the peak (Equation (18)), more than nine tenths come from the vehicle not charging and less than one tenth from the vehicle discharging, because the energy the vehicle can spare, not the charger, limits sustained export to about 2.3 kW over a four-and-a-half-hour peak (Section 3.4). The rank-correlation analysis of Section 4.6 says the same thing from the other side: none of the parameters that govern export, whether the location shares, the plug-in rates, the charger rating, the usable margin, or the efficiency, has a measurable influence on the regional result, whereas the participation rate and the fleet size explain almost all of its variance.
Two consequences follow. The first concerns programme design. For a distribution network whose constraint is the coincident evening and late-morning peak, the priority is to enrol vehicles in managed charging; bidirectional capability adds value, but it is a second-order increment whose cost, still several thousand euros per unit at the time of the largest domestic trial [17], must be justified by services other than peak relief, such as tariff arbitrage, frequency response, or building self-consumption. Table 6 puts a figure on the increment: with export removed altogether, the 2028 regional shortfall probability rises by five percentage points and the expected 2030 deficit by about 13,000 kVA, or 5%. For peak relief alone, therefore, an operator has no case for financing bidirectional hardware; the case rests on the other services, on the larger batteries and shorter peaks discussed below, and on the observation that a bidirectional contract raises the plug-in rate of enrolled vehicles [17], which benefits managed charging as well. This is consistent with the observation that participants value operational flexibility and recurring payments in managed charging and monetary compensation in V2G [21]. The second consequence concerns measurement. If a distribution operator or a municipality wishes to reduce the uncertainty of an assessment of this kind, the parameters worth measuring first are the enrolment rate and the fleet trajectory; refining the estimates of vehicle location and plug-in behaviour, however interesting in themselves, would not change the answer.
This ordering may weaken as batteries grow: the sustained export of a 75 kWh vehicle would be about 3.5 kW, rather than 2.3 kW, but Section 4.6 shows that at 65 kWh the regional shortfall probability moves by about one percentage point, and the export term would remain a third of the load-shifting term.

5.2. Municipal Heterogeneity and Reinforcement Planning

The earlier study found that the aggregate result concealed municipalities in very different positions, and the present one confirms it in terms of participation rates. In 2030, a 20% participation rate is sufficient with high probability in the Ave municipalities whose substations have the largest headroom relative to their fleet, is marginal in an intermediate group, and is insufficient in the Sousa and Tâmega municipalities that were already critical from 2026 in the earlier study. No municipality has a break-even rate above one, so the fleet is, in principle, large enough to neutralise its own peak everywhere; but the rates required in the critical cluster, between a third and a half of the fleet, are three to five times the enrolment observed in real programmes.
The deferral metric of Equation (20) translates this into planning terms. Under the planning bound, bidirectional flexibility at the participation rates supported by current evidence buys one year in eleven municipalities and none in the other nine; under the expected case, one year in thirteen. That is not negligible for an operator sequencing investments across the twenty municipalities, but it is not a substitute for reinforcement in the critical cluster, where the first critical year remains 2026 or 2027, under the planning bound. The stationary-storage bound of Table 7, about 790 MWh to close the residual 2030 gap at a 20% participation rate under worst-case simultaneity, makes the same point in a different unit: second-life batteries in buildings can contribute, but a volume equivalent to some fifteen thousand vehicle batteries is not a near-term option for a region of this size.
Table 10 translates the results into recommended actions by municipality cluster, with the quantities from Section 4.5 and Section 4.7 that justify them. The clusters are defined by the 2030 median break-even rate under the planning bound and by the shortfall probability with flexibility under the expected case. Marco de Canaveses and Vila Nova de Famalicão, which Section 4.5 grouped with the critical municipalities on the planning-bound criterion alone, are placed in the intermediate group here because their expected-case shortfall probabilities (7% and 9%) are close to the tolerance, and their break-even rates lie at the boundary between the two groups.
A full cost comparison between flexibility and reinforcement is outside the scope of the study, because reinforcement costs are specific to the assets of each municipality and are held by the operator. An order of magnitude for the flexibility side can, however, be given from the evidence used to calibrate the participation rate. The managed-charging programme validated in [21] reached 10% enrolment with a payment of USD 40 per month; at that rate, enrolling 20% of the scenario-3 regional fleet in 2030 (about 23,000 vehicles) would cost of the order of EUR 10 million per year in participant payments, before hardware. Whether that compares favourably with reinforcement depends on the deferral it buys: one year in most municipalities under either coincidence case, and avoidance of reinforcement altogether in the Ave and intermediate groups under the expected case. The comparison is, therefore, favourable where the network is close to its limits and unfavourable where it is far beyond them, which is the pattern of Table 10, and it should be carried out municipality by municipality, with the operator’s own reinforcement costs.

5.3. Simultaneity and Energy: What the Coincidence Factor Separates

The earlier study assumed that every vehicle draws its contracted power at the same time in both tariff periods, and it said so [9]. Keeping that assumption explicit as a coincidence factor allows the present framework to separate two questions that were answered jointly before, and Section 4.7 shows that the separation matters more than any other element of the analysis. Under the planning bound, the projected shortfall is partly a matter of simultaneity and partly a matter of energy; under the expected case, in which coincidence takes the values observed for uncontrolled charging, the regional network is not constrained during the decade, the critical cluster shrinks from nineteen municipalities to eight, and the remaining deficits are within reach of participation rates already observed.
This does not make the earlier result wrong, and it does not make the planning bound obsolete. A distribution operator that has no control over when vehicles charge has to plan against the bound, and the earlier study was explicit in its adoption of the worst case because consumer cooperation could not be guaranteed. What the present framework adds is a way of pricing that cooperation. The difference between the planning-bound and expected-case trajectories of Table 3 and Table 8 is the value of vehicles not charging simultaneously; managed charging is the instrument that converts the one into the other, and the participation rate is the variable that measures how much of the conversion has been secured. Equation (7) makes this concrete, since enrolled vehicles are removed from the coincident load by construction. Read in isolation, the planning-bound results would understate the value of flexibility; read in isolation, the expected-case results would understate the risk an operator without control over charging carries. Both are reported, for that reason.

5.4. Observed Adoption Since 2021 and the Status of Scenario 3

Section 4.9 showed that registrations since 2021 have tracked scenario 1 of the earlier study, rather than scenario 3. This has two implications for the reading of the present results. First, the scenario-3 results of Section 4 should be understood as the policy-target case: they describe what the network would face if adoption accelerated to meet the national target, and they retain their value as the case an operator must be prepared for, but they are not a forecast. Re-running the framework on a trajectory calibrated to observed registrations is a matter of changing one input, and is left to the operator, who holds the current data. Second, the composition of the observed fleet differs from what the earlier study could anticipate: corporate purchasers accounted for 84% of new BEV registrations in 2025, with a BEV share among corporate registrations of 25% against 17% among private buyers [2]. Company vehicles are parked at company premises during the morning peak block, they are procured and contracted in batches, and their charging is more readily managed centrally than that of private vehicles. The two-segment model of Section 4.8 quantifies the implication (Table 9), and the gain it finds comes through enrolment and managed charging, rather than through V2B export. The natural first movers in the region are therefore not households, but employers with fleets and car parks, and the corporate segment is where a stated-preference study of participation (Section 5.6) should begin.

5.5. Implications for Actors

For the distribution operator, the framework offers three things that the earlier study did not: a break-even participation rate per municipality and year, which can be compared with enrolment as it is observed; a deferral metric in years, which can be entered directly into an investment sequence; and an ordering of the uncertainties, which says where measurement effort pays. The update rule of Equation (25) turns the first of these into a monitoring instrument: as enrolment and plug-in telemetry accumulate, the priors of Table 2 are replaced, and the break-even tables are regenerated without changing the model.
For aggregators and energy suppliers, the results indicate that the product with the largest network value in a constrained region is managed charging with an availability commitment, and that bidirectional capability should be marketed on other value streams. The plug-in rate of enrolled vehicles, which trials show to be raised substantially by a contract [17], is the behavioural variable most directly under their influence.
For building owners and employers, the V2B channel is currently small because bidirectional workplace charging is rare, not because vehicles are absent from buildings during the peak; the location shares of Table 2 place a quarter of the fleet at buildings during the peak blocks. The cap of Equation (11) never binds at present rates, which means that the non-residential load of every municipality could absorb far more vehicle export than is available. Workplace bidirectional charging, coupled with building photovoltaics, is therefore the channel with the largest unexploited headroom, and the corporate composition of the fleet makes it accessible.
For the regulator, two settings determine how much of the flexibility described here can be realised: the definition of the tariff periods, which fixes D P and the interpretation of the location shares, and the treatment of export from vehicles and buildings, which determines whether the cap of Equation (11) applies. The framework makes both explicit, so that their effect can be quantified [51,54].

5.6. Limitations and Further Work

The limitations of the framework fall into four groups. The first is inherited from the earlier study, and was discussed there: the representative vehicle is a composite of three models whose market shares have changed; the daily energy need is derived from two representative routes; the regional fleet is allocated by population share, which ignores differences in purchasing power and in the spatial distribution of corporate fleets; and the network is described by an apparent-power balance per municipality, without power flow. The last point deserves emphasis in the present context: bidirectional export at low voltage raises voltage-rise and protection questions that a kVA balance cannot see, and the different building types of the consumer substations (pole-mounted, high-cabin and low-cabin stations) will respond differently to reverse flows. The results of Section 4 should, accordingly, be read as an upper bound on usable flexibility (Section 3.7), not as a demonstration that the credited load shifting and export are admissible on every feeder. A power-flow study on representative feeders of each substation type, of the kind performed with tools such as OpenDSS in the hosting-capacity literature [12,13,15], is the natural next step; it requires feeder topologies, conductor data and phase allocations that are held by the operator and were not available for this study, and it is the layer in which the modest reverse injections quantified in Section 3.7 would be checked against voltage-rise, protection and unbalance limits. The intra-municipal allocation of Section 3.2 belongs to the same group; Section 4.6 shows its effect to be below 10 kVA in any municipality.
The second group concerns the temporal resolution. Two tariff periods are coarse. The peak is modelled as a single block of four to five hours with time-weighted location shares, whereas, in reality, the morning and evening blocks have different fleet locations, different building loads and different export potential. An hourly formulation would change little in the structure of Equations (16)–(20), but would allow the V2B and V2G channels to be separated by block, which is where the corporate-fleet question of Section 5.4 would be resolved.
The third group concerns the behavioural parameters. The priors of Table 2 are drawn from trials and surveys in the United Kingdom, the United States, the Netherlands and other European markets; no Portuguese trial of bidirectional charging with published enrolment or availability figures was found, and the mobility survey used to support the location model covers the Porto metropolitan area, rather than the study region. The rank-correlation analysis shows that most of these parameters do not affect the result, which limits the damage; but the participation rate does, and a stated-preference study of BEV owners and fleet managers in the region, distinguishing private from corporate vehicles, would be the most valuable single piece of new evidence. The authors intend to pursue this. The participation rate is also held constant across years in the headline case; the ramp sensitivity shows that the mid-decade benefit depends on how fast enrolment builds, which is itself a question for such a study. Three considerations bound the consequences of transferring priors from other markets. The location shares and plug-in rates, which are the parameters most likely to differ between markets, have rank correlations with the result below 0.07 in absolute value, so an error of the size of the difference between markets would not change the conclusions. The participation rate, which does matter, is drawn from a range whose lower end is the intrinsic enrolment measured among United States owners and whose upper end exceeds the enrolment reached with payment in the programme that validated that measure [21], so that the Portuguese value is more likely to lie within the range than outside it, and the corporate composition of the Portuguese fleet argues, if anything, for a higher value (Section 4.8). The update rule of Equation (25) is the mechanism by which these priors are replaced by local telemetry as it accumulates, without altering the model. What the transfer cannot guarantee is the shape of the distributions within their ranges, and the shortfall probabilities of Section 4 should be read with that qualification.
The two-segment model of Section 4.8 is a first approximation: the corporate share of the fleet, the corporate participation rate, and the corporate location profile are all drawn from assumed ranges, rather than observed ones, and a corporate fleet is not homogeneous, since pool vehicles, assigned company cars and light commercial vehicles behave differently.
The fourth group concerns what is outside the model: prices and markets, battery degradation costs, plug-in hybrids, public fast charging, and the regulatory status of vehicle and building export in Portugal. Public fast charging deserves a specific note. The model assigns every vehicle a home charging point, as the earlier study did; vehicles that charge mainly at public fast chargers do not add to the coincident residential load and are absent from the bidirectional pool, so their omission is conservative for the peak balance of the municipalities, but overstates the fleet available for flexibility, and a growing fast-charging network shifts load from the low-voltage feeders modelled here to medium-voltage connections that are outside the scope of the study. None of these changes the network balance, but all of them condition the participation rate, and a fuller treatment would model π as an outcome of contract design, rather than as an exogenous distribution.
Battery degradation deserves a specific note, because it is the cost most often cited by owners who decline to enrol [24,25], and the model does not price it. Its order of magnitude follows from the export quantities of Section 4.3. An enrolled vehicle exports about 10.4 kWh on each peak in which it is plugged in and, at the plug-in and location rates of Table 2a, does so on about two fifths of the roughly 250 working days of a year, some 1100 kWh per year. With a pack cost of EUR 120 per kWh and a cycle life of 2000 equivalent full cycles, illustrative values for current lithium-ion packs, the wear cost of that throughput is about EUR 0.06 per kWh, or EUR 65 per vehicle and year, against the USD 480 per year that secured 10% enrolment in the programme used to calibrate the participation rate [21]. Two implications follow. Priced explicitly, degradation would reduce the net compensation of an enrolled owner by roughly one seventh and, within a discrete-choice model of enrolment such as that of [21], would lower the participation rate accordingly; the priors of Table 2a are drawn from observed enrolment, rather than from stated intentions, and therefore already embody the owners’ own, and usually larger, perception of that cost. And because more than nine tenths of the flexibility value comes from not charging, which adds no cycling, the result for a fleet that shifts its charging but declines to export is bounded by the managed-charging-only row of Table 6. A participation model in which the rate responds to compensation net of degradation is the natural extension, and belongs to the stated-preference study proposed above.
Against these limitations stands the property that motivated the study: the framework runs on a network description of the kind that most distribution operators hold on public fleet statistics, and on literature priors, and it reproduces the deterministic model it extends as a special case. It can be replicated in any region with the equivalent of Table A1 of the earlier study, and its outputs improve as local telemetry is fed into Equation (25).


6. Conclusions

This paper reversed the question asked by the authors’ earlier assessment of the impact of battery electric vehicles on the distribution network of twenty municipalities in Northern Portugal. Instead of asking when the growing fleet would exhaust the network’s capacity, it asked how much of the fleet would have to operate bidirectionally, and with what probability an achievable participation rate would suffice, for the network to remain within its limits.
To answer this, a conceptual framework was proposed that adds a bidirectional flexibility term to the conventional balance between available and required power, nests the earlier deterministic model as its zero-flexibility special case, derives the break-even participation rate of each municipality and year in closed form, and propagates behavioural, technical and fleet uncertainty through a Monte Carlo simulation whose outputs are shortfall probabilities and years of reinforcement deferred; the simultaneity assumption of the earlier study is kept explicit as a coincidence factor, so that a worst-case planning bound and an expected case are reported side by side. No new field data were required. The framework is an apparent-power balance per municipality: its results are an upper bound on usable flexibility, to be confirmed at feeder level by power-flow analysis, not a guarantee of operational feasibility.
Applied to the twenty municipalities under the national 2030 target scenario, the framework yields five results. First, an enrolled vehicle is worth about 11 kVA of peak relief, of which more than nine tenths come from not charging during the peak and less than one tenth from exporting, because the energy the vehicle can spare, not the charger, limits sustained export; participation and fleet size, consequently, explain almost all of the variance in the outcome, and the parameters that describe vehicle location, export power, battery capacity, and workplace plug-in explain almost none; managed charging alone secures all but five percentage points of the 2028 relief, so the case for bidirectional hardware rests on services other than peak relief. Second, under the planning bound of perfect simultaneity, bidirectional flexibility at the participation rates observed in real programmes reduces the regional shortfall probability from 33% to 2% in 2027 and from 95% to 48% in 2028, but cannot prevent it from 2029 onward, and does so on the assumption that enrolment is in place from the first year, a gradual build-up leaving a 2028 shortfall probability of 71%; the break-even participation rate in 2030 ranges from below zero to one half across municipalities, and reinforcement in the Sousa and Tâmega cluster is deferred by at most one year. Third, under the expected case, in which coincidence takes the values observed for uncontrolled charging, the regional network is not constrained during the decade, the critical cluster shrinks from nineteen municipalities to eight, and participation rates already observed suffice in the remaining twelve; the difference between the two cases is the value of managed charging. Fourth, the corporate composition of the Portuguese fleet, represented by a two-segment model, doubles the effective participation rate and the years of reinforcement deferred, and does so through enrolment and managed charging, rather than through vehicle-to-building export. Fifth, on the adoption path actually observed since 2021, which has tracked the moderate scenario of the earlier study, the network is not constrained by passenger BEVs within the decade under any of the assumptions examined.
For distribution operators, the framework provides a break-even participation rate and a deferral metric that can be entered directly into investment planning, a cluster-level table of recommended actions, an ordering of uncertainties that says where to measure first, and an update rule by which literature priors are replaced by telemetry as it accumulates. It is proposed as the scenario layer of a regional distribution-grid digital twin. Its network balance can be replicated in any region for which a municipal description of installed and consumed substation power is available; its behavioural parameters require local calibration, and the ordering of uncertainties indicates that the enrolment rate, particularly among corporate fleets, is the first parameter to calibrate. Its main open questions, the response of low-voltage feeders to reverse flows, the hourly separation of the morning and evening peak blocks, and the participation behaviour of private- and corporate-vehicle owners in the region, define the authors’ next steps.

Supplementary Materials

The supplementary files for this article are openly available on Zenodo at https://doi.org/10.5281/zenodo.22141591. S1: Monte Carlo workbook (V2B2G_MonteCarlo.xlsx), in which every quantity is a spreadsheet formula, reproducing Table 3, Table 4, Table 5, Table 6, Table 7 and Table 8 and Figure 1, Figure 2, Figure 3, Figure 4 and Figure 5 (the expected case of Section 4.7 is obtained by editing the coincidence-factor rows of the Inputs sheet). S2: Python 3.12.3 scripts (Supplementary_python_scripts.zip) that reproduce the workbook to the last digit and implement the two-segment model and the sensitivity runs of Table 9.

Author Contributions

Conceptualization, J.M. and T.N.; methodology, J.M. and T.N.; validation, J.M. and T.N.; formal analysis, J.M. and T.N.; writing—original draft preparation, J.M. and T.N.; writing—review and editing, J.M. and T.N. All authors have read and agreed to the published version of the manuscript.

Funding

This research received no external funding.

Data Availability Statement

The network, fleet and consumption inputs are published in [1]. The Monte Carlo workbook and the Python scripts that reproduce all results are openly available on Zenodo at https://doi.org/10.5281/zenodo.22141591 (CC BY 4.0).

Conflicts of Interest

The authors declare no conflicts of interest.

References

  1. International Council on Clean Transportation (ICCT). European Market Monitor: Cars and Vans, January–December 2025. Available online: https://theicct.org/publication/european-market-monitor-cars-and-vans-2025/ (accessed on 2 August 2026).
  2. International Council on Clean Transportation (ICCT). European Market Monitor: Cars and Vans, November 2025. Available online: https://theicct.org/publication/european-market-monitor-cars-and-vans-nov-2025/ (accessed on 2 August 2026).
  3. Autovista24. Portugal Packs a Punch in the European EV Market. 26 March 2025. Available online: https://autovista24.autovistagroup.com/news/portugal-packs-a-punch-in-the-european-ev-market/ (accessed on 2 August 2026).
  4. Alinnea. Battery Electric Car Registrations in Europe Recorded a 19% Market Share in January. 17 March 2026. Available online: https://www.alinnea.org/news/battery-electric-car-registrations-in-europe-recorded-a-19-market-share-in-january/ (accessed on 2 August 2026).
  5. Muratori, M.; Alexander, M.; Arent, D.; Bazilian, M.; Cazzola, P.; Dede, E.M.; Farrell, J.; Gearhart, C.; Greene, D.; Jenn, A.; et al. The rise of electric vehicles—2020 status and future expectations. Prog. Energy 2021, 3, 022002. [Google Scholar] [CrossRef] [Scilit]
  6. Das, H.S.; Rahman, M.M.; Li, S.; Tan, C.W. Electric vehicles standards, charging infrastructure, and impact on grid integration: A technological review. Renew. Sustain. Energy Rev. 2020, 120, 109618. [Google Scholar] [CrossRef] [Scilit]
  7. Mancini, E.; Longo, M.; Yaici, W.; Zaninelli, D. Assessment of the Impact of Electric Vehicles on the Design and Effectiveness of Electric Distribution Grid with Distributed Generation. Appl. Sci. 2020, 10, 5125. [Google Scholar] [CrossRef] [Scilit]
  8. Awadallah, M.A.; Singh, B.N.; Venkatesh, B. Impact of EV Charger Load on Distribution Network Capacity: A Case Study in Toronto. Can. J. Electr. Comput. Eng. 2016, 39, 268–273. [Google Scholar] [CrossRef] [Scilit]
  9. Nogueira, T.; Magano, J.; Sousa, E.; Alves, G.R. The Impacts of Battery Electric Vehicles on the Power Grid: A Monte Carlo Method Approach. Energies 2021, 14, 8102. [Google Scholar] [CrossRef] [Scilit]
  10. Liu, Y.; Dong, B. Urban scale vehicle-to-building-to-grid integration leveraging human mobility modeling for enhanced grid flexibility. Build. Simul. 2025, 18, 3069–3095. [Google Scholar] [CrossRef] [Scilit]
  11. Sovacool, B.K.; Kester, J.; Noel, L.; Zarazua de Rubens, G. Actors, business models, and innovation activity systems for vehicle-to-grid (V2G) technology: A comprehensive review. Renew. Sustain. Energy Rev. 2020, 131, 109963. [Google Scholar] [CrossRef] [Scilit]
  12. Fatima, S.; Püvi, V.; Lehtonen, M.; Pourakbari-Kasmaei, M. A review of electric vehicle hosting capacity quantification and improvement techniques for distribution networks. IET Gener. Transm. Distrib. 2024, 18, 1095–1113. [Google Scholar] [CrossRef] [Scilit]
  13. Karmaker, A.K.; Prakash, K.; Siddique, M.N.I.; Hossain, M.A.; Pota, H. Electric vehicle hosting capacity analysis: Challenges and solutions. Renew. Sustain. Energy Rev. 2024, 189, 113916. [Google Scholar] [CrossRef] [Scilit]
  14. Zakaria, A.A.; Duan, C.; Djokic, S.Z. Hosting capacity of distribution networks for controlled and uncontrolled residential EV charging with static and dynamic thermal ratings of network components. IET Gener. Transm. Distrib. 2024, 18, 1283–1301. [Google Scholar] [CrossRef] [Scilit]
  15. Kim, T.-H.; Kim, D.; Moon, S.-I. Evaluation of Electric Vehicles Hosting Capacity Based on Interval Undervoltage Probability in a Distribution Network. IEEE Access 2021, 9, 140147–140155. [Google Scholar] [CrossRef] [Scilit]
  16. ISO 15118-20:2022; Road Vehicles—Vehicle to Grid Communication Interface—Part 20: 2nd Generation Network Layer and Application Layer Requirements. International Organization for Standardization: Geneva, Switzerland, 2022.
  17. Cenex. Project Sciurus Trial Insights: Findings from 300 Domestic V2G Units in 2020; Cenex: Loughborough, UK, 2021; Available online: https://www.cenex.co.uk/app/uploads/2021/05/Sciurus-Trial-Insights.pdf (accessed on 3 August 2026).
  18. Cenex. A Fresh Look at V2G Value Propositions; Cenex: Loughborough, UK, 2020. [Google Scholar]
  19. Project LEO. V2G Barriers and Opportunities; Project Local Energy Oxfordshire, University of Oxford: Oxford, UK, 2021; Available online: https://project-leo.co.uk/wp-content/uploads/2022/01/V2G-barriers-and-opportunities-211221-covered.pdf (accessed on 2 August 2026).
  20. Philip, T.; Whitehead, J. Consumer Willingness to Adopt Electric Vehicle Smart Charging: A Stated Preference Analysis. Transp. Res. Part D Transp. Environ. 2025, 146, 104867. [Google Scholar] [CrossRef] [Scilit]
  21. Hu, P.; Tarroja, B.; Dean, M.; Forrest, K.; Hittinger, E.; Jenn, A.; Helveston, J.P. Measuring electric vehicle owners’ willingness to participate in smart charging programs. Environ. Res. Lett. 2025, 20, 124067. [Google Scholar] [CrossRef] [Scilit]
  22. Jo, B.K. Evaluating vehicle-to-grid as a participation-dependent system flexibility resource: Evidence from charging profiles and policy scenarios. Sustain. Cities Soc. 2026, 148, 107642. [Google Scholar] [CrossRef] [Scilit]
  23. Park, K.; Jang, D.; Kim, S.; Lim, Y.; Lee, J. A grid-friendly electric vehicle infrastructure: The Korean approach. IEEE Power Energy Mag. 2023, 21, 66–74. [Google Scholar] [CrossRef] [Scilit]
  24. Geske, J.; Schumann, D. Willing to participate in vehicle-to-grid (V2G)? Why not! Energy Policy 2018, 120, 392–401. [Google Scholar] [CrossRef] [Scilit]
  25. Bakhuis, J.; Barbour, N.; Chappin, É.J.L. Exploring user willingness to adopt vehicle-to-grid (V2G): A statistical analysis of stated intentions. Energy Policy 2025, 203, 114619. [Google Scholar] [CrossRef] [Scilit]
  26. Hu, Y.; Bahamonde-Birke, F.J.; Ettema, D. Vehicle-to-grid, why not? An interview with battery electric vehicle users with various driving patterns in Utrecht, the Netherlands. Transp. Policy 2025, 164, 231–240. [Google Scholar] [CrossRef] [Scilit]
  27. EA Technology; Western Power Distribution. Electric Nation Customer Trial Final Report; EA Technology: Chester, UK, 2019; Available online: https://eatechnology.com/media/girhcnsc/electric-nation-customer-trial-report.pdf (accessed on 26 August 2026).
  28. Gonzalez Venegas, F.; Petit, M.; Perez, Y. Plug-in behavior of electric vehicles users: Insights from a large-scale trial and impacts for grid integration studies. eTransportation 2021, 10, 100131. [Google Scholar] [CrossRef] [Scilit]
  29. Pearre, N.S.; Kempton, W.; Guensler, R.L.; Elango, V.V. Electric vehicles: How much range is required for a day’s driving? Transp. Res. Part C Emerg. Technol. 2011, 19, 1171–1184. [Google Scholar] [CrossRef] [Scilit]
  30. Crozier, C.; Apostolopoulou, D.; McCulloch, M. Numerical analysis of national travel data to assess the impact of UK fleet electrification. In Proceedings of the 2018 Power Systems Computation Conference (PSCC), Dublin, Ireland, 11–15 June 2018; pp. 1–7. [Google Scholar] [CrossRef] [Scilit]
  31. U.S. Department of Transportation, Federal Highway Administration. 2009 National Household Travel Survey. (Version V1). Available online: https://www.datalumos.org/datalumos/project/236966/version/V1/view (accessed on 4 August 2026).
  32. U.S. Department of Energy, Vehicle Technologies Office. FOTW #1356: Household Vehicles Were Parked 95% on a Typical Day in 2022. 19 August 2024. Available online: https://www.energy.gov/cmei/vehicles/articles/fotw-1356-august-19-2024-household-vehicles-were-parked-95-typical-day-2022 (accessed on 26 August 2026).
  33. Leu, S.; de Almeida Correia, G.H.; van Lint, H.; Leonhardt, A. Understanding Car Usage Patterns for V2G Integration: Insights from Dutch Travel Diaries. In Proceedings of the SciTePress Conference; SciTePress: Setúbal, Portugal, 2025. [Google Scholar] [CrossRef] [Scilit]
  34. Chargemap. European EV Driver Survey, March–April 2025. Available online: https://chargemap-blog.s3.amazonaws.com/uploads/2025/07/survey-chargemap-march-april-2025.pdf (accessed on 10 August 2026).
  35. McKinsey Center for Future Mobility. A New EV Survey: What Consumers Want in Charging. January 2024. Available online: https://www.mckinsey.com/features/mckinsey-center-for-future-mobility/our-insights/exploring-consumer-sentiment-on-electric-vehicle-charging (accessed on 2 August 2026).
  36. Instituto Nacional de Estatística (INE). Inquérito à Mobilidade nas Áreas Metropolitanas do Porto e de Lisboa 2017; INE: Lisboa, Portugal, 2018. Available online: https://www.ine.pt/xurl/pub/349495406 (accessed on 2 August 2026).
  37. Kühnbach, M.; Stute, J.; Gnann, T.; Wietschel, M.; Marwitz, S.; Klobasa, M. Impact of electric vehicles: Will German households pay less for electricity? Energy Strategy Rev. 2020, 32, 100568. [Google Scholar] [CrossRef] [Scilit]
  38. Hungbo, M.; Gu, M.; Meegahapola, L.; Littler, T.; Bu, S. Impact of electric vehicles on low-voltage residential distribution networks: A probabilistic analysis. IET Smart Grid 2023, 6, 536–548. [Google Scholar] [CrossRef] [Scilit]
  39. Dixit, M. Impact of optimal integration of renewable energy sources and electric vehicles in practical distribution feeder with uncertain load demand. Int. Trans. Electr. Energy Syst. 2020, 30, e12668. [Google Scholar] [CrossRef] [Scilit]
  40. van der Kam, M.; Peters, A.; van Sark, W.; Alkemade, F. Agent-Based Modelling of Charging Behaviour of Electric Vehicle Drivers. J. Artif. Soc. Soc. Simul. 2019, 22, 7. [Google Scholar] [CrossRef] [Scilit]
  41. Unterluggauer, T.; Rauma, K.; Järventausta, P.; Rehtanz, C. Short-term load forecasting at electric vehicle charging sites using a multivariate multi-step long short-term memory: A case study from Finland. IET Electr. Syst. Transp. 2021, 11, 405–419. [Google Scholar] [CrossRef] [Scilit]
  42. Graham, J.; Teng, F. Vehicle-to-grid plug-in forecasting for participation in ancillary services markets. In Proceedings of the 2023 IEEE Belgrade Powertech, Belgrade, Serbia, 25–29 June 2023; pp. 1–6. [Google Scholar] [CrossRef] [Scilit]
  43. Faessler, B. Stationary, Second Use Battery Energy Storage Systems and Their Applications: A Research Review. Energies 2021, 14, 2335. [Google Scholar] [CrossRef] [Scilit]
  44. Haram, M.H.S.M.; Lee, J.W.; Ramasamy, G.; Ngu, E.E.; Thiagarajah, S.P.; Lee, Y.H. Feasibility of utilising second life EV batteries: Applications, lifespan, economics, environmental impact, assessment, and challenges. Alex. Eng. J. 2021, 60, 4517–4536. [Google Scholar] [CrossRef] [Scilit]
  45. Jafari, M.; Kavousi-Fard, A.; Chen, T.; Karimi, M. A Review on Digital Twin Technology in Smart Grid, Transportation System and Smart City: Challenges and Future. IEEE Access 2023, 11, 17471–17484. [Google Scholar] [CrossRef] [Scilit]
  46. Zhou, M.; Yan, J.; Feng, D. Digital twin framework and its application to power grid online analysis. CSEE J. Power Energy Syst. 2019, 5, 391–398. [Google Scholar] [CrossRef] [Scilit]
  47. Sifat, M.M.H.; Das, S.K.; Choudhury, S.M. Design, development, and optimization of a conceptual framework of digital twin electric grid using systems engineering approach. Electr. Power Syst. Res. 2024, 226, 109958. [Google Scholar] [CrossRef] [Scilit]
  48. Moutis, P.; Alizadeh-Mousavi, O. Digital Twin of Distribution Power Transformer for Real-Time Monitoring of Medium Voltage from Low Voltage Measurements. IEEE Trans. Power Deliv. 2021, 36, 1952–1963. [Google Scholar] [CrossRef] [Scilit]
  49. Darbali-Zamora, R.; Johnson, J.; Summers, A.; Jones, C.B.; Hansen, C.; Showalter, C. State Estimation-Based Distributed Energy Resource Optimization for Distribution Voltage Regulation in Telemetry-Sparse Environments Using a Real-Time Digital Twin. Energies 2021, 14, 774. [Google Scholar] [CrossRef] [Scilit]
  50. Peng, Y.; Zhao, F.; Zhou, K.; Yu, X.; Jin, Q.; Li, R.; Shuai, Z. Review of Digital Twin Technology in Low-Voltage Distribution Area and the Implementation Path Based on the ‘6C’ Development Goals. Energies 2025, 18, 4459. [Google Scholar] [CrossRef] [Scilit]
  51. Entidade Reguladora dos Serviços Energéticos (ERSE). Preços Mercado Liberalizado. Available online: https://www.erse.pt/atividade/regulacao/tarifas-e-precos-eletricidade (accessed on 4 August 2026).
  52. Agência Portuguesa do Ambiente. PNEC 2030—Plano Nacional Energia e Clima 2021–2030; Agência Portuguesa do Ambiente: Lisboa, Portugal, 2014. Available online: https://apambiente.pt/clima/plano-nacional-de-energia-e-clima-pnec (accessed on 7 September 2026).
  53. Videgain, B.P.; Covrig, C.F. Vehicle-to-Grid and/or Vehicle-to-Home Round-Trip Efficiency; EUR 30603 EN; Publications Office of the European Union: Luxembourg, 2021; Available online: https://publications.jrc.ec.europa.eu/repository/bitstream/JRC123942/jrc123942_vehicle-to-grid_home_round-trip_efficiency.pdf?utm_source=chatgpt.com (accessed on 4 August 2026).
  54. Presidência do Conselho de Ministros. Decreto-Lei n.º 15/2022, de 14 de Janeiro. Diário da República, 1.ª Série, n. 9. 2022. Available online: https://diariodarepublica.pt/dr/detalhe/decreto-lei/15-2022-177634016 (accessed on 2 August 2026).
Figure 1. Regional impact by year: base case of the earlier study (scenario 3, no flexibility), mean and 5–95% band with bidirectional flexibility. Left: peak hours; right: off-peak hours.
Energies 19 04413 g001
Figure 2. Distribution of the regional peak-hour impact in 2028 across trials, without and with bidirectional flexibility.
Energies 19 04413 g002
Figure 3. Municipal break-even participation rate in 2030, peak hours: median and 5–95% range, with the three achievable targets.
Energies 19 04413 g003
Figure 4. Number of municipalities whose peak-hour shortfall probability exceeds 5%, with and without bidirectional flexibility, 2024–2030.
Energies 19 04413 g004
Figure 5. Rank correlation between each uncertain input and the regional peak-hour impact in 2028.
Energies 19 04413 g005
Table 1. Notation inherited from the earlier study [9].
SymbolMeaningSource in [9]
S m i n s t installed power of the consumer substations of municipality m (kVA)Table A1
L m , τ power consumed in period τ (kVA)Table A1
A m , τ = S m i n s t L m , τ available power in period τ (kVA)Table A1
N t s national BEV fleet in year t , scenario s Tables 5–7
ρ m , t share of the national population resident in m Section 2.1
n m , t s = ρ m , t N t s BEV fleet of municipality m Section 2.4
S c h = 10.35 kVAcontracted power per home charging point (7.4 kW wallbox)Section 2.2
e d a y = 8.776 kWhweighted daily energy need per BEVTable 4
ω k , C k market-share weight and battery capacity of model k Table 4
Table 2. (a) Beta-PERT parameters (minimum, most likely, maximum) of the behavioural inputs. (b) Beta-PERT parameters of the technical inputs and fleet trajectory.
(a)
ParameterSymbolMinModeMaxBasis
Participation rate π 0.050.100.25[17,21,22]
Share of fleet at home, peak (two-block) ϕ H , P 0.400.550.70[29,30,31,36]
Share of fleet at buildings, peak (two-block) ϕ W , P 0.150.250.35[30,33]
Plug-in rate at home, enrolled vehicle γ H 0.550.700.85[17,27,28]
Plug-in rate at buildings, bidirectional charger γ W 0.050.150.30see text *; [34,35]
(b)
ParameterSymbolMinModeMaxBasis
Charger discharge rating (kW) P d i s 3.77.411manufacturer ratings of bidirectional AC/DC units
Usable state-of-charge margin δ 0.100.200.31Equation (8), long-route reserve
Round-trip efficiency η 0.800.870.92charger and battery round trip [53]
Peak duration (h), two blocks D P 44.55[51]
Coincidence factors, planning bound c P , c O 111worst case of [9]
Coincidence factors, expected case (§4.7) c P , c O 0.40.60.8uncontrolled-charging diversity [14,28,38]
National BEV sales 2022–2030 N t min(S2, S3)S3max(1.46·S3, S2)Section 3.8; [9]
* For γ W , the range describes the workplace channel as it exists today; a sensitivity with higher values is reported in Section 4.6.
Table 3. Regional impact (available minus required power, kVA) in peak and off-peak hours, 2024–2030, without and with bidirectional flexibility. Negative values denote a shortfall.
Statistic2024202520262027202820292030
Peak hours
Base case, scenario 3, π = 0 (kVA)385,244261,857134,3722678−133,320−273,753−418,721
Mean, stochastic fleet, π = 0 (kVA)405,712287,324162,93831,173−109,265−260,515−416,758
P(impact < 0), π = 00.0%0.0%0.1%32.6%94.8%100.0%100.0%
Mean, with flexibility (kVA)452,056348,931240,592125,8133439−128,349−264,470
Standard deviation (kVA)43,24050,35856,61361,95166,83770,82875,096
5th percentile (kVA)383,270267,859150,32925,342−104,663−241,272−384,789
95th percentile (kVA)524,577434,456340,150230,121115,696−9523−135,608
P(impact < 0), with flexibility0.0%0.0%0.0%2.1%48.4%96.2%100.0%
Off-peak hours
Base case, scenario 3, π = 0 (kVA)588,628465,241337,756206,06270,064−70,369−215,337
Mean, with flexibility (kVA)608,019489,278364,518232,35891,500−60,202−216,912
Standard deviation (kVA)46,57753,37359,02363,13965,61966,26567,008
5th percentile (kVA)531,938405,294268,539129,916−15,395−168,553−323,938
95th percentile (kVA)685,904579,167462,422338,498203,19551,386−106,016
P(impact < 0), with flexibility0.0%0.0%0.0%0.0%7.8%81.3%99.9%
Note. Negative values denote a shortfall.
Table 4. Break-even participation rate π m , t * in peak hours, 2026–2030: median (95th percentile) across trials.
Municipality20262027202820292030
Castelo de Paiva−0.37 (−0.20)−0.15 (−0.02)0.02 (0.11)0.15 (0.22)0.24 (0.30)
Cabeceiras de Basto−0.46 (−0.28)−0.23 (−0.09)−0.05 (0.05)0.09 (0.17)0.19 (0.25)
Celorico de Basto−0.36 (−0.19)−0.14 (−0.01)0.03 (0.12)0.16 (0.23)0.26 (0.31)
Fafe−0.49 (−0.30)−0.24 (−0.10)−0.06 (0.04)0.08 (0.16)0.19 (0.25)
Guimarães−0.58 (−0.38)−0.32 (−0.17)−0.12 (−0.01)0.03 (0.11)0.14 (0.21)
Póvoa de Lanhoso−0.30 (−0.14)−0.09 (0.03)0.07 (0.16)0.20 (0.26)0.29 (0.34)
Vieira do Minho−0.83 (−0.60)−0.53 (−0.36)−0.31 (−0.18)−0.14 (−0.04)−0.01 (0.07)
Vila Nova de Famalicão−0.21 (−0.07)−0.01 (0.10)0.14 (0.22)0.25 (0.32)0.34 (0.39)
Vizela0.05 (0.17)0.21 (0.30)0.33 (0.39)0.41 (0.46)0.48 (0.52)
Amarante0.04 (0.15)0.19 (0.28)0.30 (0.37)0.39 (0.44)0.46 (0.50)
Baião−0.08 (0.05)0.09 (0.19)0.22 (0.29)0.32 (0.37)0.39 (0.44)
Felgueiras−0.03 (0.10)0.14 (0.24)0.27 (0.34)0.36 (0.42)0.43 (0.48)
Lousada−0.15 (−0.01)0.04 (0.14)0.18 (0.26)0.29 (0.35)0.38 (0.42)
Marco de Canaveses−0.23 (−0.08)−0.03 (0.09)0.12 (0.21)0.24 (0.31)0.33 (0.38)
Paços de Ferreira−0.36 (−0.19)−0.13 (−0.00)0.04 (0.13)0.17 (0.25)0.28 (0.33)
Paredes−0.01 (0.11)0.15 (0.25)0.28 (0.35)0.37 (0.42)0.44 (0.48)
Penafiel−0.03 (0.10)0.14 (0.23)0.26 (0.34)0.36 (0.41)0.43 (0.48)
Mondim de Basto−0.52 (−0.33)−0.28 (−0.13)−0.09 (0.01)0.05 (0.13)0.15 (0.22)
Cinfães0.01 (0.13)0.17 (0.26)0.28 (0.35)0.37 (0.42)0.44 (0.48)
Resende0.14 (0.24)0.27 (0.35)0.37 (0.43)0.45 (0.49)0.50 (0.54)
Note. Values at or below zero indicate that no flexibility is needed; values above one would indicate that bidirectional operation cannot close the gap (none occur).
Table 5. Probability that an achievable participation target suffices in 2030, first critical year (shortfall probability above 5%) without and with flexibility, and years of reinforcement deferred (Equation (20)). A first critical year of 2024 would read “≤2024”.
MunicipalityP(π* ≤ 10%)P(π* ≤ 20%)P(π* ≤ 30%)First Critical Year, π = 0First Critical Year, with FlexibilityΔt (Years)
Castelo de Paiva0%14%95%202820280
Cabeceiras de Basto3%56%100%202820291
Celorico de Basto0%8%89%202820280
Fafe3%58%100%202820291
Guimarães17%92%100%202920290
Póvoa de Lanhoso0%2%63%202720281
Vieira do Minho99%100%100%2030>20301
Vila Nova de Famalicão0%0%12%202720281
Vizela0%0%0%202620260
Amarante0%0%0%202620260
Baião0%0%1%202620271
Felgueiras0%0%0%202620271
Lousada0%0%2%202720270
Marco de Canaveses0%0%20%202720281
Paços de Ferreira0%4%77%202820280
Paredes0%0%0%202620260
Penafiel0%0%0%202620271
Mondim de Basto12%88%100%202820291
Cinfães0%0%0%202620260
Resende0%0%0%202520261
Note. A first critical year of 2024 would read “≤2024”.
Table 6. Structural and parametric sensitivities under the planning bound: regional peak-hour statistics and municipal counts under alternative assumptions.
VariantMean Regional Peak Impact 2028 (kVA)Mean Regional Peak Impact 2030 (kVA)P(Impact < 0), 2027/2028/2029Municipalities Critical in 2030Median Regional π* 2030
Headline (c_P = 1, V2B cap on, constant π)3439−264,4702.1%/48.4%/96.2%190.32
Coincidence factor c_P = 0.6 (peak only)312,391153,0300.0%/0.0%/0.0%8−0.07
Coincidence factor c_P = 0.3 (peak only)544,106466,1550.0%/0.0%/0.0%0−0.88
V2B cap removed (σ = 1)3439−264,4702.1%/48.4%/96.2%190.32
π ramping linearly from 0 (2024) to π (2030)−34,129−264,4709.8%/70.7%/98.4%190.32
Higher participation π ~ PERT(0.10, 0.20, 0.40)99,780−134,2890.1%/8.6%/57.9%190.32
Workplace plug-in rate γ_W ~ PERT(0.50, 0.60, 0.70)6001−261,0071.7%/47.3%/95.8%190.32
Battery capacity C ¯ = 65 kWh5855−261,2051.7%/47.2%/95.7%190.32
Managed charging only, no export (P_dis = 0)−6408−277,7763.0%/53.6%/97.4%190.35
Ω with 29% cross-municipal commuting3439−264,4702.1%/48.4%/96.2%190.32
Table 7. Upper bound of stationary storage required to neutralise the residual 2030 peak deficit at a 20% participation rate under the planning bound, municipalities with median π * > 0.20 .
MunicipalityMedian π* 2030Residual Deficit at π = 20%, 2030: Median (kVA)95th Percentile (kVA)Storage Energy for D_P = 4.5 h, Median (MWh)
Resende0.504010487418.0
Vizela0.4810,09212,43545.4
Amarante0.4618,59823,33783.7
Paredes0.4428,93536,783130.2
Cinfães0.445622717425.3
Felgueiras0.4318,87024,15684.9
Penafiel0.4323,16229,673104.2
Baião0.394708632821.2
Lousada0.3812,16916,71754.8
Vila Nova de Famalicão0.3427,77140,481125.0
Marco de Canaveses0.33963714,46943.4
Póvoa de Lanhoso0.292694467112.1
Paços de Ferreira0.28642112,02228.9
Celorico de Basto0.26150232376.8
Castelo de Paiva0.2492523014.2
Total (listed municipalities) 175,117238,657788.0
Table 8. Expected case ( c P , c O PERT(0.4, 0.6, 0.8)): regional impact statistics and municipal counts, 2024–2030, with and without bidirectional flexibility.
Statistic2024202520262027202820292030
Peak hours, without flexibility (π = 0): mean (kVA)549,565478,498403,766324,625240,273149,42555,564
Peak hours, without flexibility: shortfall probability0.0%0.0%0.0%0.0%0.2%4.9%28.9%
Peak hours, with flexibility: mean (kVA)579,011517,637453,106384,757311,883233,403152,331
Peak hours, with flexibility: 5th percentile (kVA)514,942440,998362,217277,270189,42291425−4832
Peak hours, with flexibility: shortfall probability0.0%0.0%0.0%0.0%0.0%0.4%5.9%
Off-peak hours, with flexibility: mean (kVA)751,748680,351605,206525,620440,835349,482255,117
Off-peak hours, with flexibility: shortfall probability0.0%0.0%0.0%0.0%0.0%0.0%0.3%
Municipalities with shortfall probability > 5%, without flexibility000171115
Municipalities with shortfall probability > 5%, with flexibility00002811
Table 9. Single-population and two-segment results under the planning bound and the expected case, and results for the scenario-1 fleet.
CaseRegional Shortfall Probability, Peak, 2028/2029/2030Mean Regional Peak Impact 2030 (kVA)Municipalities Critical in 2030, with FlexibilityTotal Years Deferred (20 Municipalities)
Planning bound (c = 1), single population (headline)48.4%/96.2%/100.0%−264,4701911
Planning bound (c = 1), corporate/private segments9.8%/63.3%/96.2%−146,2381924
Expected case (c~PERT(0.4, 0.6, 0.8)), single population0.0%/0.4%/5.9%152,3311113
Expected case, corporate/private segments0.0%/0.0%/0.9%225,769823
Scenario 1 fleet, planning bound (c = 1)0.0%/0.0%/0.0%238,68021
Scenario 1 fleet, expected case0.0%/0.0%/0.0%451,97400
Table 10. Recommended actions by municipality cluster.
Cluster (Municipalities)Break-Even π* 2030, Planning Bound (Median)Shortfall Probability 2030 with Flexibility, Expected CaseRecommended Action
Ave headroom group: Vieira do Minho, Guimarães, Mondim de Basto, Fafe, Cabeceiras de Basto−0.01 to 0.19≤1%Managed-charging programme with modest enrolment (≈10%) and existing tariff signals; no reinforcement for passenger BEVs within the decade.
Intermediate group: Castelo de Paiva, Celorico de Basto, Póvoa de Lanhoso, Paços de Ferreira, Marco de Canaveses, Vila Nova de Famalicão0.24 to 0.341% to 9%Managed-charging programme with an enrolment target of 20–30%; monitor enrolment against the break-even values of Table 4 and trigger a reinforcement study if it falls short.
Critical Sousa/Tâmega cluster: Lousada, Baião, Felgueiras, Penafiel, Cinfães, Paredes, Amarante, Vizela, Resende0.38 to 0.5019% to 81%Proceed with the reinforcement identified in the earlier study (conductor cross-section, parallel conductors, transformer capacity, substation building type); use managed charging and corporate-fleet enrolment to manage the interval before completion; prioritise workplace bidirectional charging where corporate car parks exist.
Disclaimer/Publisher’s Note: The statements, opinions and data contained in all publications are solely those of the individual author(s) and contributor(s) and not of MDPI and/or the editor(s). MDPI and/or the editor(s) disclaim responsibility for any injury to people or property resulting from any ideas, methods, instructions or products referred to in the content.