1. Introduction
In the face of the global climate crisis, reducing carbon emissions has become a central priority for achieving sustainable development. Scientific evidence shows that increasing concentrations of greenhouse gases are the primary driver of rising global temperatures, ecosystem instability, and extreme weather events. These climate changes pose threats not only to global biodiversity but also to human food security and public health. According to the Global Carbon Budget 2025 [
1], global fossil fuel carbon emissions reached 38.1 billion tonnes, highlighting a significant gap between current emissions and the substantial decarbonisation required to limit global warming to 1.5 °C under the Paris Agreement.
The transport sector shows a growing decarbonisation challenge, accounting for approximately 24% of global energy-related carbon dioxide (CO
2) emissions [
2]. While passenger vehicles can be decarbonised through electrification, maritime shipping, aviation, and heavy-duty land transport require fuels with significantly higher energy density. Methanol has a significantly higher energy density (5500–6100 Wh/kg) than lithium-ion batteries (150–300 Wh/kg), which enables it to meet the energy demand of long-distance transport. In addition, methanol eliminates the need for extreme storage conditions such as high pressure and cryogenic temperatures, and can be used in existing fossil engines with only minor modification [
3].
In China, coal-to-methanol is the primary methanol synthesis route [
4], and is a technologically mature process. However, the high carbon emissions from coal-based methanol production pose a significant challenge to achieving China’s ‘Dual Carbon’ goals. Therefore, it is necessary to take a shift to green methanol production. Synthesising methanol using biogas is regarded as a potential pathway for achieving net-zero carbon emissions. Biogas is primarily produced from organic feedstocks, including agricultural residues, livestock manure, and other biodegradable wastes through anaerobic digestion. As the carbon contained in these feedstocks originates primarily from atmospheric CO
2 captured by plants, its conversion to methanol and subsequent combustion can contribute to a closed-loop carbon cycle. Furthermore, utilising biogas from landfills and livestock operations can avoid methane emissions into the atmosphere, providing an additional greenhouse gas mitigation benefit [
5].
Currently, the most mature and industrialised method for biogas processing is reforming, which converts biogas into carbon monoxide (CO) and hydrogen (H
2). Yang et al. found that converting biogas into transportation fuels like methanol is a technically feasible and environmentally sustainable strategy [
6]. Wu et al. conducted a feasibility and cost-benefit analysis of methanol as a marine fuel. Their study indicates that, compared to heavy fuel oil, methanol can reduce particulate matter emissions by 95%. Furthermore, methanol internal combustion engine technology is relatively mature, and the cost of retrofitting existing fuel storage facilities is relatively low [
7]. George et al. found that by controlling the ratio of methane, steam, and CO to 3:2:1, a syngas with an H2-to-CO ratio close to 2:1 could be generated. Moreover, a 15% NiO/MgO catalyst was operated for 320 h at a pressure of 7 bar without any significant decrease in activity, while exhibiting extremely high selectivity. This approach to producing syngas with an H
2 to CO ratio close to 2:1 was called bi-reforming [
8].
Bi-reforming integrates traditional steam methane reforming and dry reforming of methane, which generates an ideal ratio of H
2, CO, and CO
2, thereby maximising the rate of methanol conversion. Nazanin et al. have conducted studies and experiments on the synthesis of methanol through the bi-reforming of biogas. Their research indicates that while steam reforming and dry reforming require additional steps to adjust the H
2 to CO ratio in the syngas, the bi-reforming of biogas can directly achieve the ideal ratio of H
2 to CO. The optimal operating conditions for bi-reforming are 1 atm and 900 °C, which prevents the production of solid carbon and prevents the issue of catalyst deactivation [
9]. The primary obstacle in the bi-reforming of biogas is catalyst deactivation caused by carbon deposition. Based on that, Mohanty et al. found that compared to other Ni-based catalysts, Ni–MgO–Al
2O
3 catalyst shows higher methane conversion at 700–800 °C [
10]. Bussche et al. built a kinetic model for both methanol synthesis and the water-gas shift reaction based on commercial catalysts, which can be used in methanol synthesis simulation [
11]. Luyben et al. transformed the equations and parameters of the kinetic model of methanol synthesis and made it compatible with the process simulator Aspen Plus [
12]. These two contributions together provided the kinetic basis adopted in some research.
The integration of renewable energy into methanol synthesis has been widely investigated, particularly through the use of renewable electricity and green H
2. Wang et al. introduced a biogas-to-methanol system using solar power, which was reported to achieve an integrated energy utilisation efficiency of 44.87%. However, compared with bi-reforming, the carbon in this configuration is released through combustion rather than being reformed from the biogas itself [
13]. Van Antwerpen et al. proposed an economic model of generating methanol by renewable energy, which included four stages: renewable electricity generation, water electrolysis for H
2 production, CO
2 capture and methanol synthesis [
14]. The work indicates that renewable intermittency, rather than the synthesis step itself, was the dominant constraint on plant utilisation. Rinaldi et al. designed a biogas-to-methanol system that could achieve thermal self-sufficiency and conducted an economic assessment of the proposed system [
15]. Bube et al. used thermodynamic analysis to determine the composition of the gas, and built a model to simulate methanol synthesis, finding that compared with only using biogas, adding H
2 before methanol synthesis can increase the rate of methanol production by 67% [
16]. Hernández et al. optimised the production of methanol from biogas via dry reforming, focusing on how biogas composition affected both economic and environmental performance [
17].
Despite numerous studies proving the feasibility and advantages of bi-reforming for methanol production, existing studies focused on reaction condition optimisation and catalyst development, while its application at an industrial scale remains underexplored. To address this research gap, this paper developed a biogas-to-methanol production system with a capacity of 10 tonnes of methanol per day, located in Shanghai, China, which hosts large-scale biogas treatment infrastructure. The system employed bi-reforming to convert biogas into syngas for subsequent methanol synthesis, with wind power integrated to supply the electricity and H2 required by the process. A comprehensive techno-economic assessment was conducted to evaluate the performance and economic viability of the proposed system. The novelty of this work lies in evaluating bi-reforming through a location-specific and industrial-scale system design that incorporates local conditions and existing green electricity policies. The findings provide quantitative insights into the techno-economic potential of biogas bi-reforming for green methanol production and its prospective deployment at an industrial scale.
The remainder of this paper is organised as follows:
Section 2 presents the system design and the modelling methodology, including the process simulation, the sizing of the offshore wind capacity, and the economic assessment framework.
Section 3 reports the technical and economic results, with a sensitivity analysis of the levelised cost of production.
Section 4 discusses the cost drivers and the limitations of this work, and
Section 5 draws the main conclusions.
2. Materials and Methods
2.1. Components of Biogas
In this study, the biogas was assumed to be sourced from a large-scale anaerobic digestion facility representative of the Shanghai Laogang Bio-energy Reutilization Centre in China, which processes urban biowaste. The raw biogas composition was assumed to be a mixture of 60% CH4 and 40% CO2 by volume, representing a typical composition of biogas derived from anaerobic digestion of urban organic waste in Shanghai, China.
2.2. Reaction of Bi-Reforming
Bi-reforming of methane is a chemical process that combines two traditional reforming methods, steam methane reforming and dry reforming of methane, into a single reactor. The reactions are shown below:
For methanol synthesis, the ratio of H
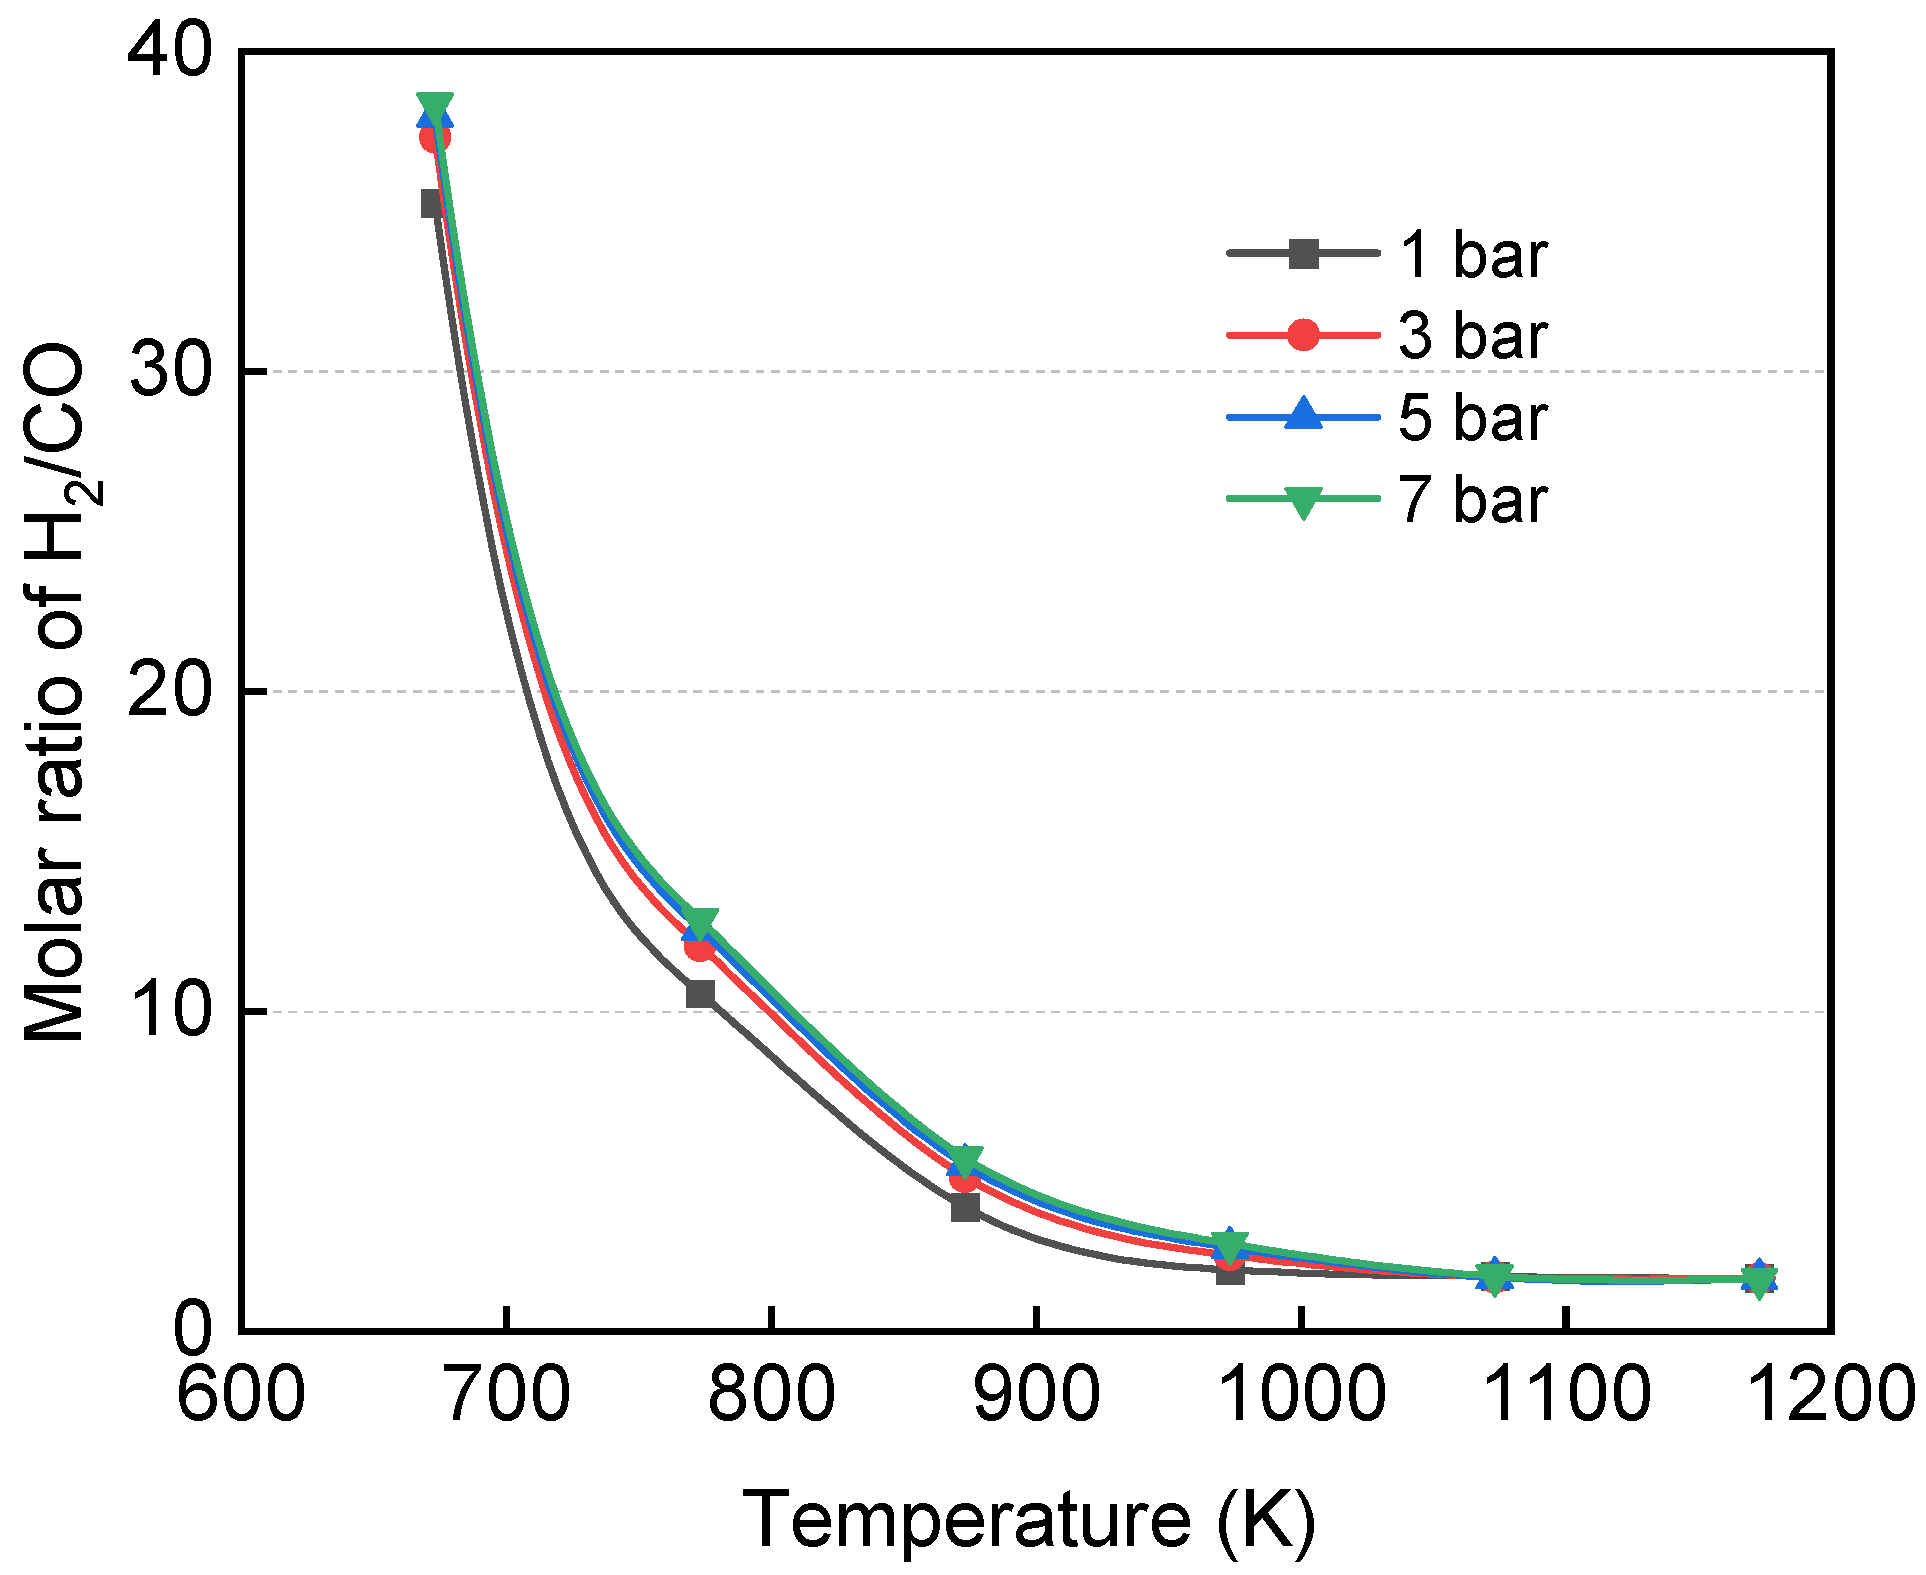
2 to CO needs to be approximately 2.0, as shown in Equation (4):
Bi-reforming offers a distinct advantage in producing syngas with a molar ratio of approximately 2.0, while steam methane reforming yields an excess of H2 and dry reforming produces a carbon-rich gas.
The thermodynamic equilibrium analysis of the bi-reforming process was conducted using the Gibbs free energy minimisation method. This approach determines the equilibrium composition of the system by identifying the state where the total Gibbs free energy of the mixture reaches its minimum value under constant temperature and pressure, independent of specific reaction kinetics. The total Gibbs free energy is expressed as the sum of the chemical potentials of all species present in the system:
: the total Gibbs free energy of the system
: the total number of chemical species considered in the system
: the number of moles of species i at equilibrium
: the chemical potential of species i
: the standard Gibbs free energy of formation of species i at temperature T
: the universal gas constant
: the absolute temperature of the system
: the activity of species i in the mixture
The advantage of using the Gibbs free energy minimisation method is that this method is good at predicting the thermodynamic threshold for solid carbon formation [
18]. Entesari et al. have proved the feasibility of this method by doing an experiment [
9]. The Aspen Plus flowsheet was modelled at the thermodynamic level, and its reliability was checked against the literature. Because the import molar ratio and throughput used here (CH
4:CO
2:H
2O = 6:4:5) differ from the experimental campaign of Entesari et al. [
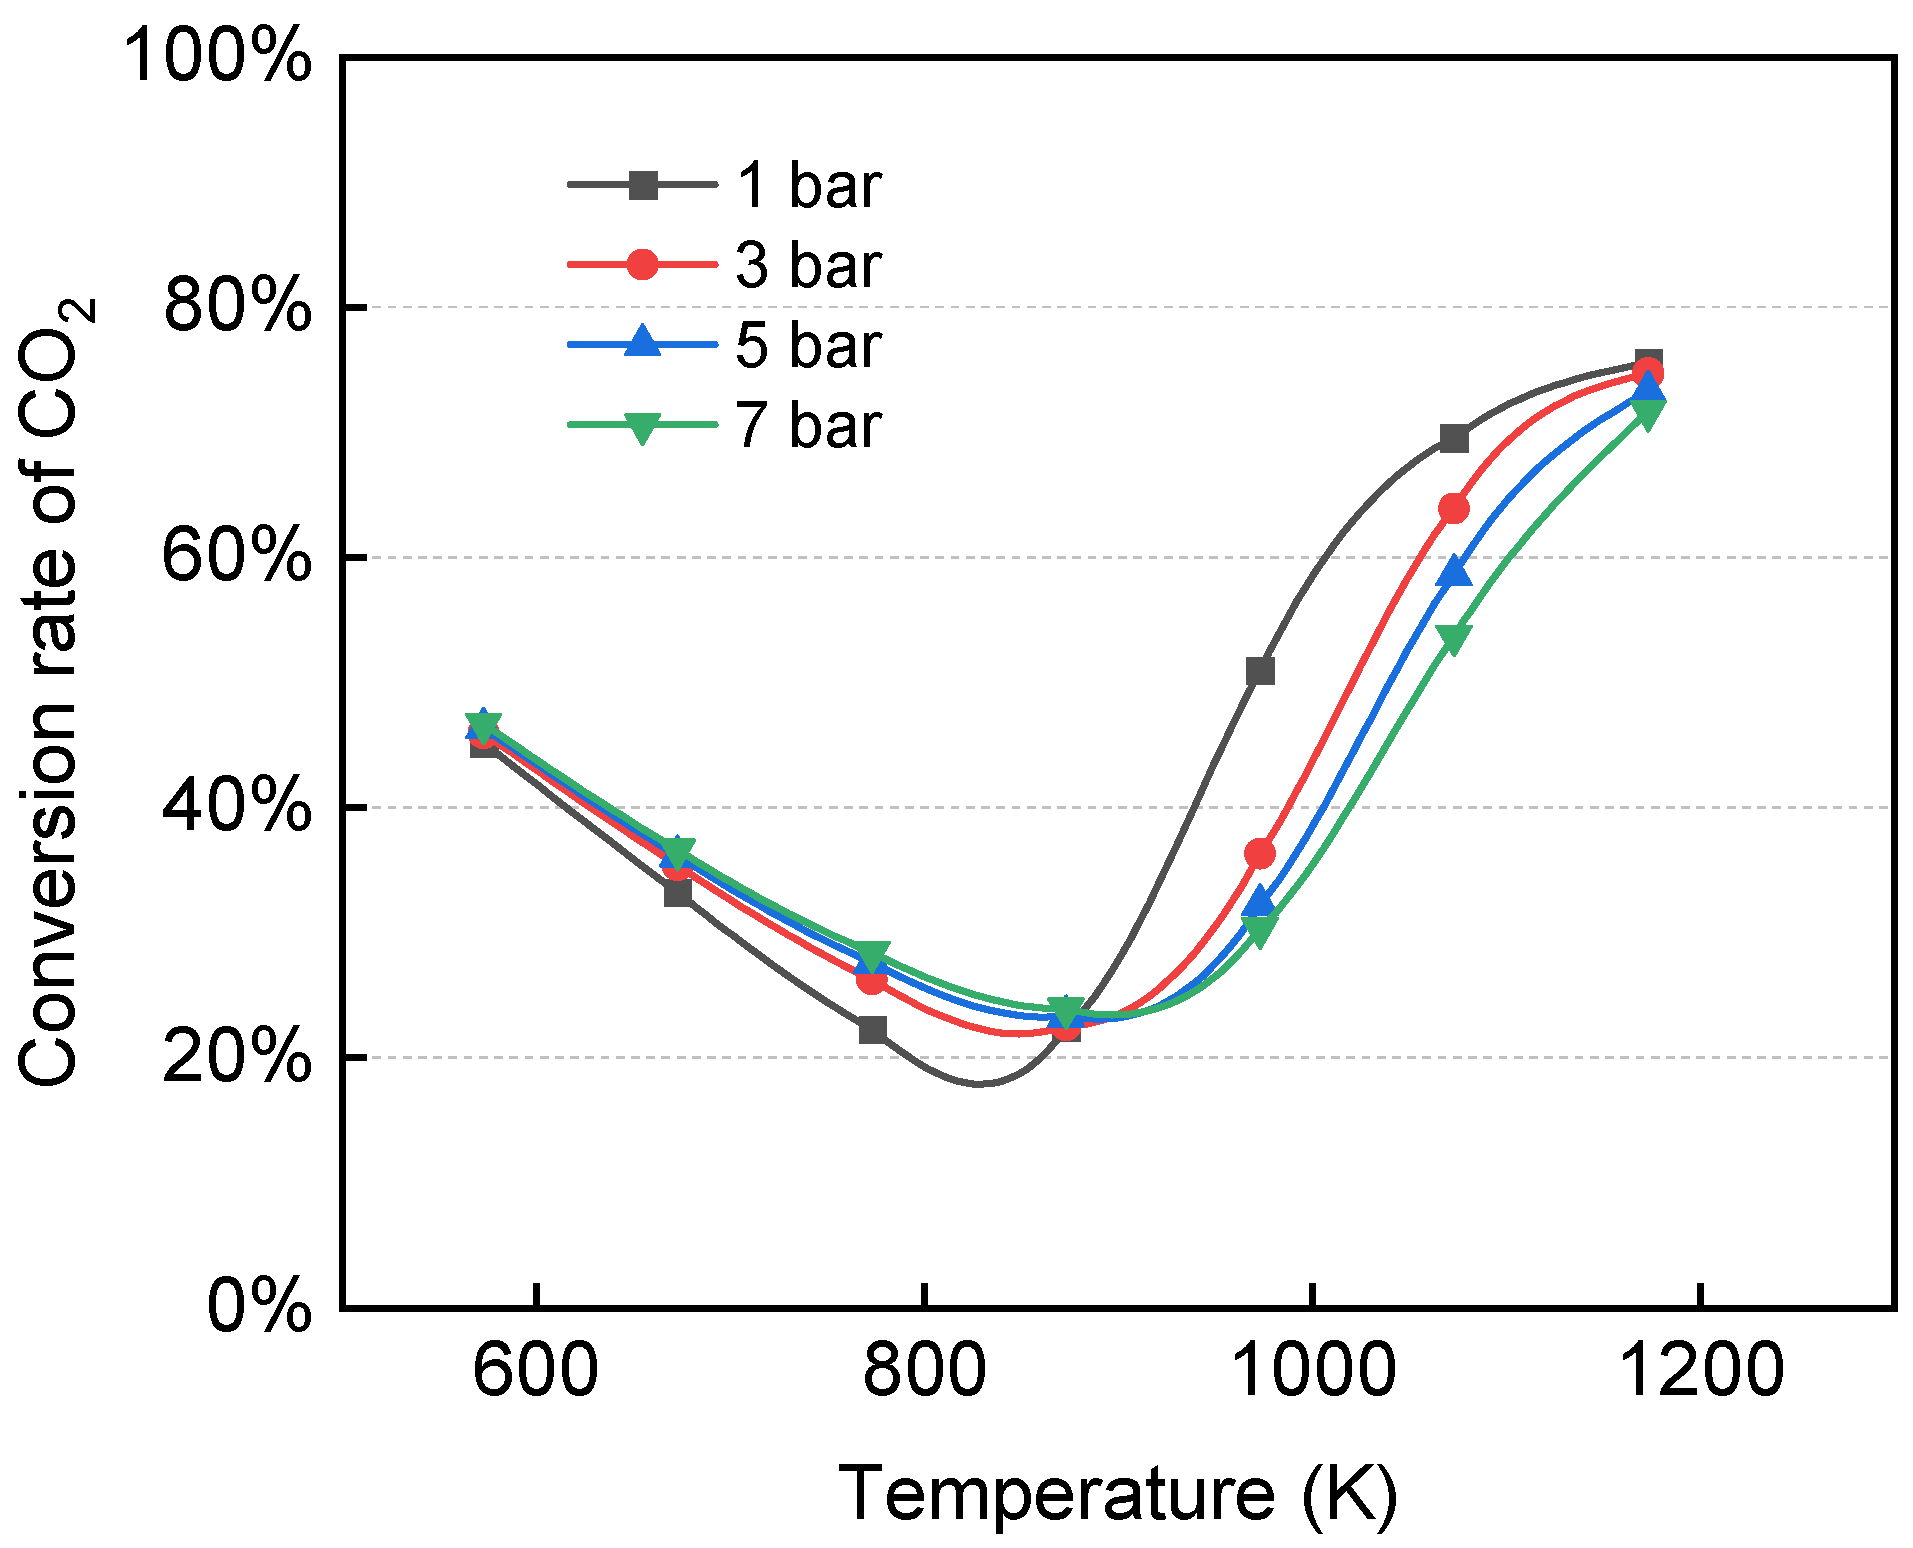
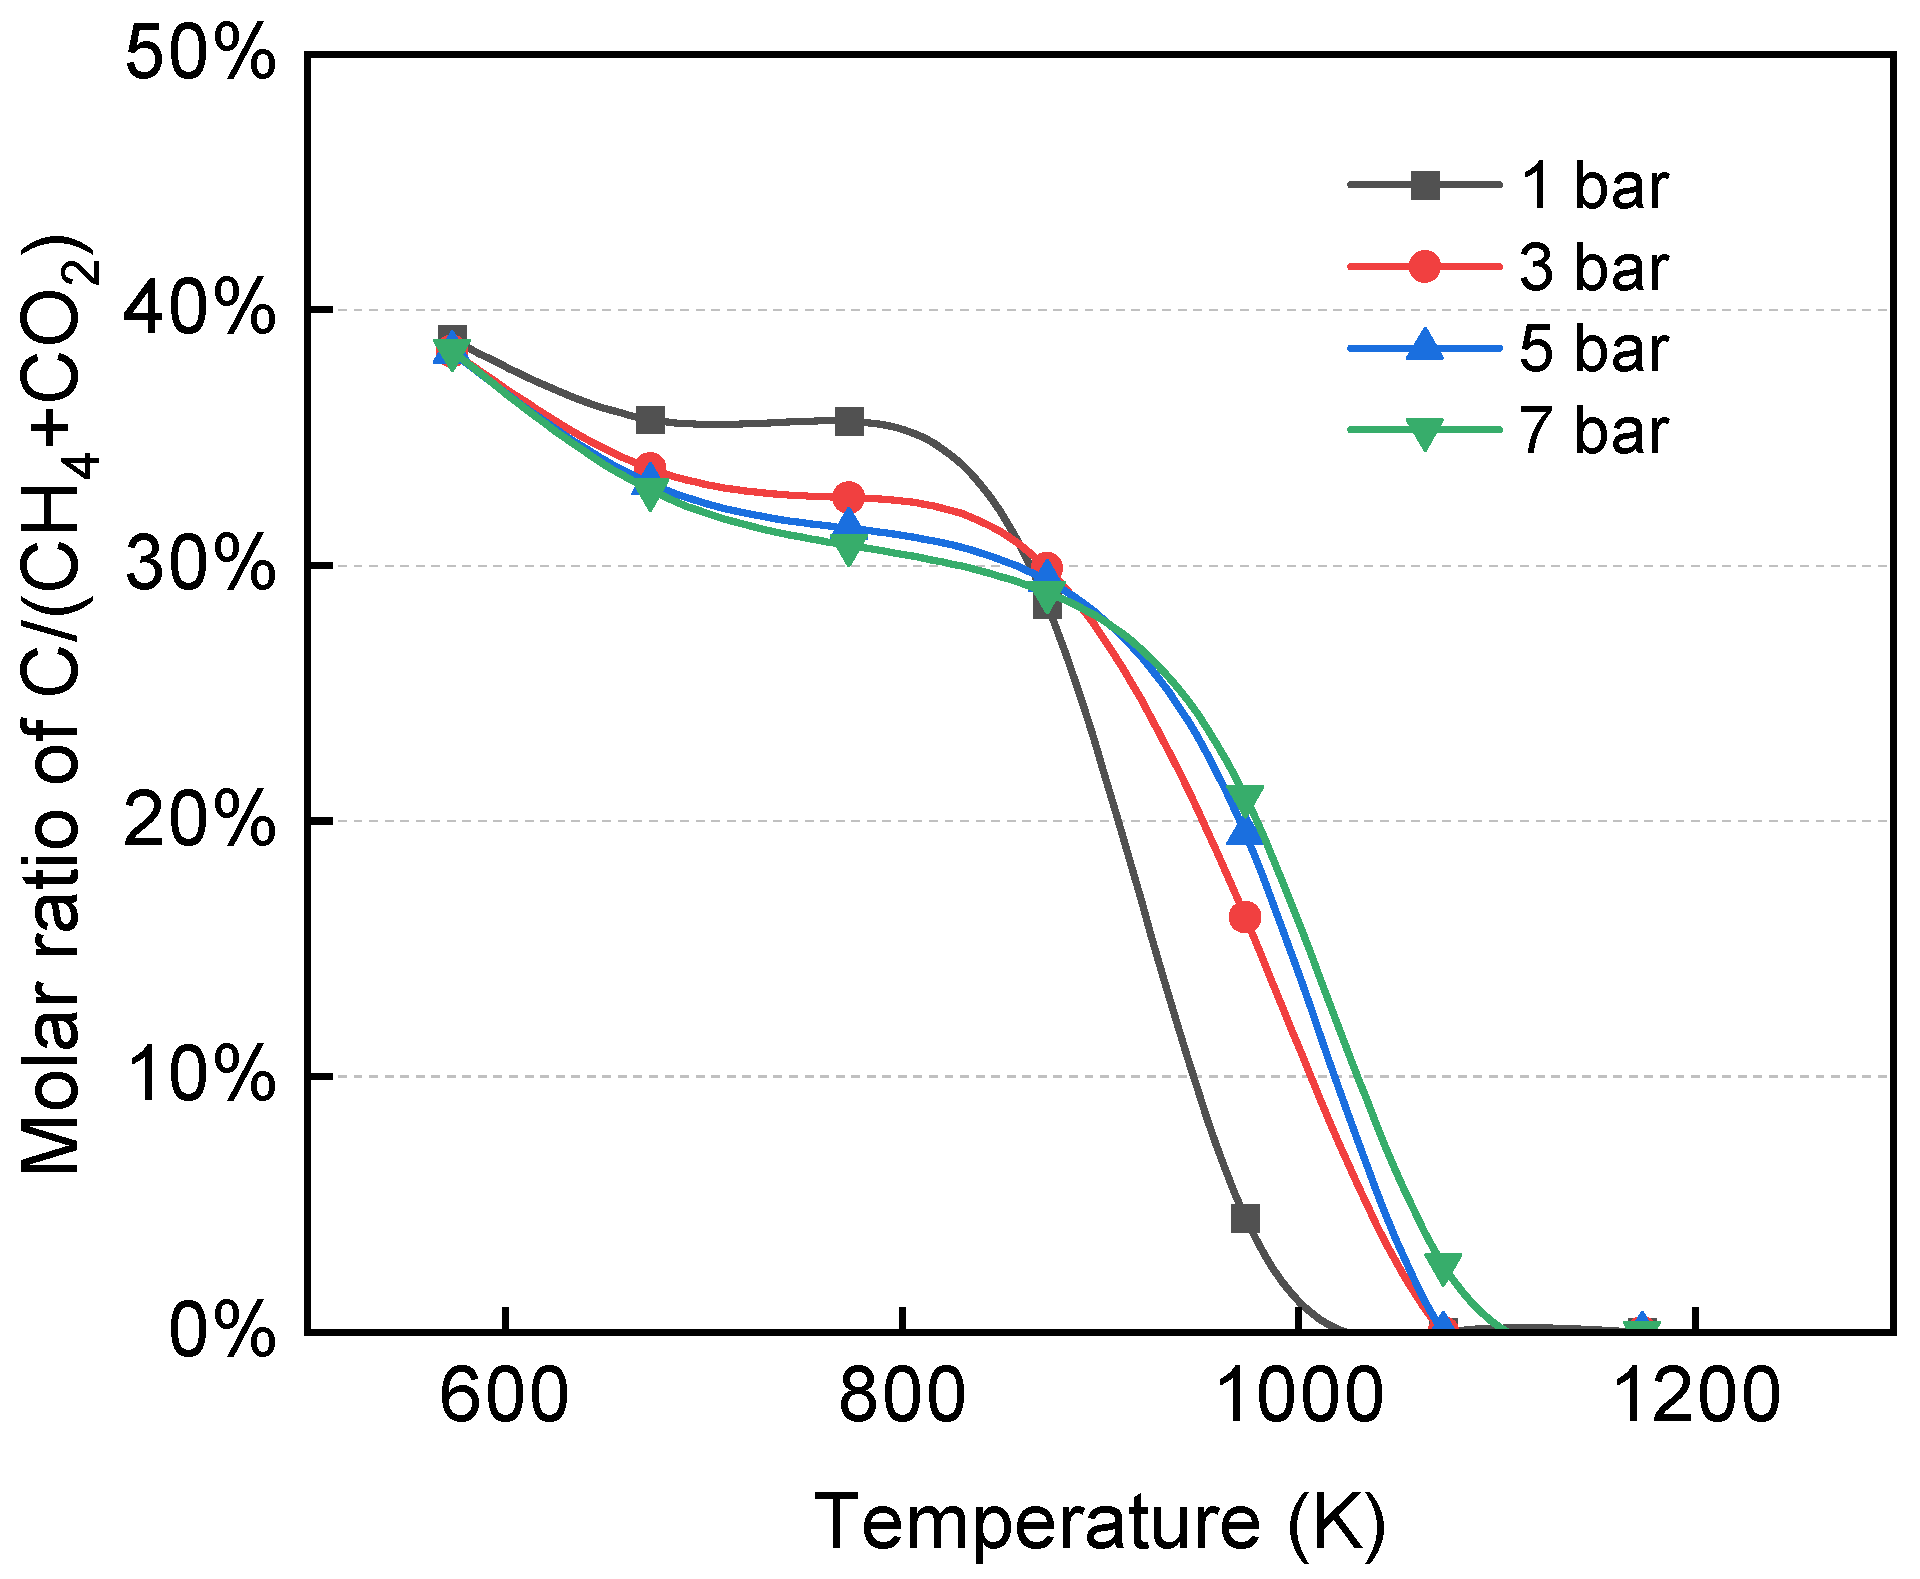
9], a direct point-by-point numerical validation is not applicable. Instead, the reformer model was benchmarked against reported equilibrium trends: the predicted sharp rise in CO
2 conversion above ~873 K and the suppression of solid-carbon formation above ~1073 K are consistent with the bi-reforming behaviour reported in Ref. [
9], confirming that the Gibbs equilibrium framework reliably captures the governing thermodynamics.
The expected products of bi-reforming are set as CH4, CO2, CO, H2, H2O, and solid carbon. The reaction conditions are set as 300–1000 °C, 1–15 bar.
2.3. Reactions of Methanol Synthesis
The syngas generated from the bi-reforming unit, after being compressed and blended with the external green H
2 stream, is fed into the methanol synthesis reactor. The synthesis process primarily involves three equilibrium reactions over a commercial catalyst: CO hydrogenation, CO
2 hydrogenation, and the reverse water-gas shift (RWGS) reaction, as expressed below:
Because methanol synthesis is highly exothermic and volume-contracting, the reactions are restricted by severe thermodynamic equilibrium at high temperatures. In industrial practice, operating under typical conditions (210–270 °C and 50–80 bar), the single-cycle carbon conversion rate of syngas to methanol is relatively low [
11,
12].
To accurately reflect commercial operating conditions and avoid overestimating the reactor’s transient performance, the single-pass conversion rate of the reactor in this simulation was constrained within a realistic range of 15% to 25% per pass [
11,
12]. The unreacted syngas is subsequently handled via a recycle loop to achieve a high overall plant efficiency.
2.4. Integration of Green Hydrogen
The ideal molar ratio of CH
4 to CO
2 in biogas is 3:1 to achieve the best results in terms of syngas composition. However, this ratio in reality is close to 6:4. To further enhance the carbon utilisation efficiency, an external green H
2 stream is integrated into the system downstream of the bi-reforming unit. The green H
2 is produced by wind power through electrolysis. This integration allows for the conversion of residual carbon into methanol, effectively decoupling the carbon-to-H
2 ratio from the raw biogas composition. The stoichiometric module (M), defined as (
−
)/(
), was employed as the key performance indicator to evaluate the quality of the syngas. A target value of 2.05 was maintained to ensure an optimal balance between carbon conversion efficiency and the prevention of catalyst deactivation via coking [
19].
2.5. Green Electricity
The electricity utilised in this system was defined as “green” in compliance with the Renewable Fuels of Non-Biological Origin (RFNBO) standards [
20]. Owing to the intermittent nature of wind energy, the system incorporates a dynamic grid-compensation strategy, whereby grid electricity is imported to make up the shortfall whenever offshore wind output falls below the demand of the electrolyser, compressors, and bi-reformer, and surplus wind power is exported to the grid when generation exceeds demand, to ensure operational continuity during low-wind periods. To maintain the net-zero carbon profile of the energy input, the system accounts for the purchase of Green Electricity Certificates to offset any grid-sourced power. In a regulatory context, this mechanism ensures that the carbon intensity of the electricity consumed remains zero on a net basis [
21].
2.6. Heat Integration
To enhance the overall energy efficiency of the green methanol facility and lower its operational expenditure, a systemic heat integration scheme was designed and integrated into the process flowsheet.
According to ref. [
8], the product of bi-reforming is defined as metgas. Since bi-reforming operates at elevated temperatures (modelled over a range of 300–1000 °C), the metgas stream exiting the reformer carries substantial thermal energy. It’s beneficial to reduce the temperature of the metgas before it enters the compressors. Therefore, to improve the overall energy efficiency of the process, a feed-effluent heat exchanger was integrated in the simulation using the HeatX block in Aspen Plus V14, whereby the thermal energy contained in the hot metgas stream was recovered and used to preheat the reformer feed. This heat integration strategy reduces the external heating utility required by the bi-reformer and lowers the overall energy demand of the process.
In commercial chemical practices, achieving an identical temperature between the hot and cold outlets is physically unfeasible, as it demands an infinite heat transfer area, which leads to prohibitive capital costs. Therefore, to reflect realistic engineering constraints, the HeatX block was simulated under a constrained Minimum Temperature Approach specification, defined as:
Thot − Tcold: the local temperature difference between the hot and cold fluids at any specific location inside the heat exchanger.
The heat transfer (
Q) is defined as:
: Heat transfer rate (W/(m2∙K))
: Heat transfer area
Logarithmic mean temperature difference
Temperature difference at End 1
Temperature difference at End 2
2.7. Simulation of the System
The steady-state simulation of the green methanol production facility was performed using Aspen Plus V14, which was validated with the experimental work by Entesari et al. [
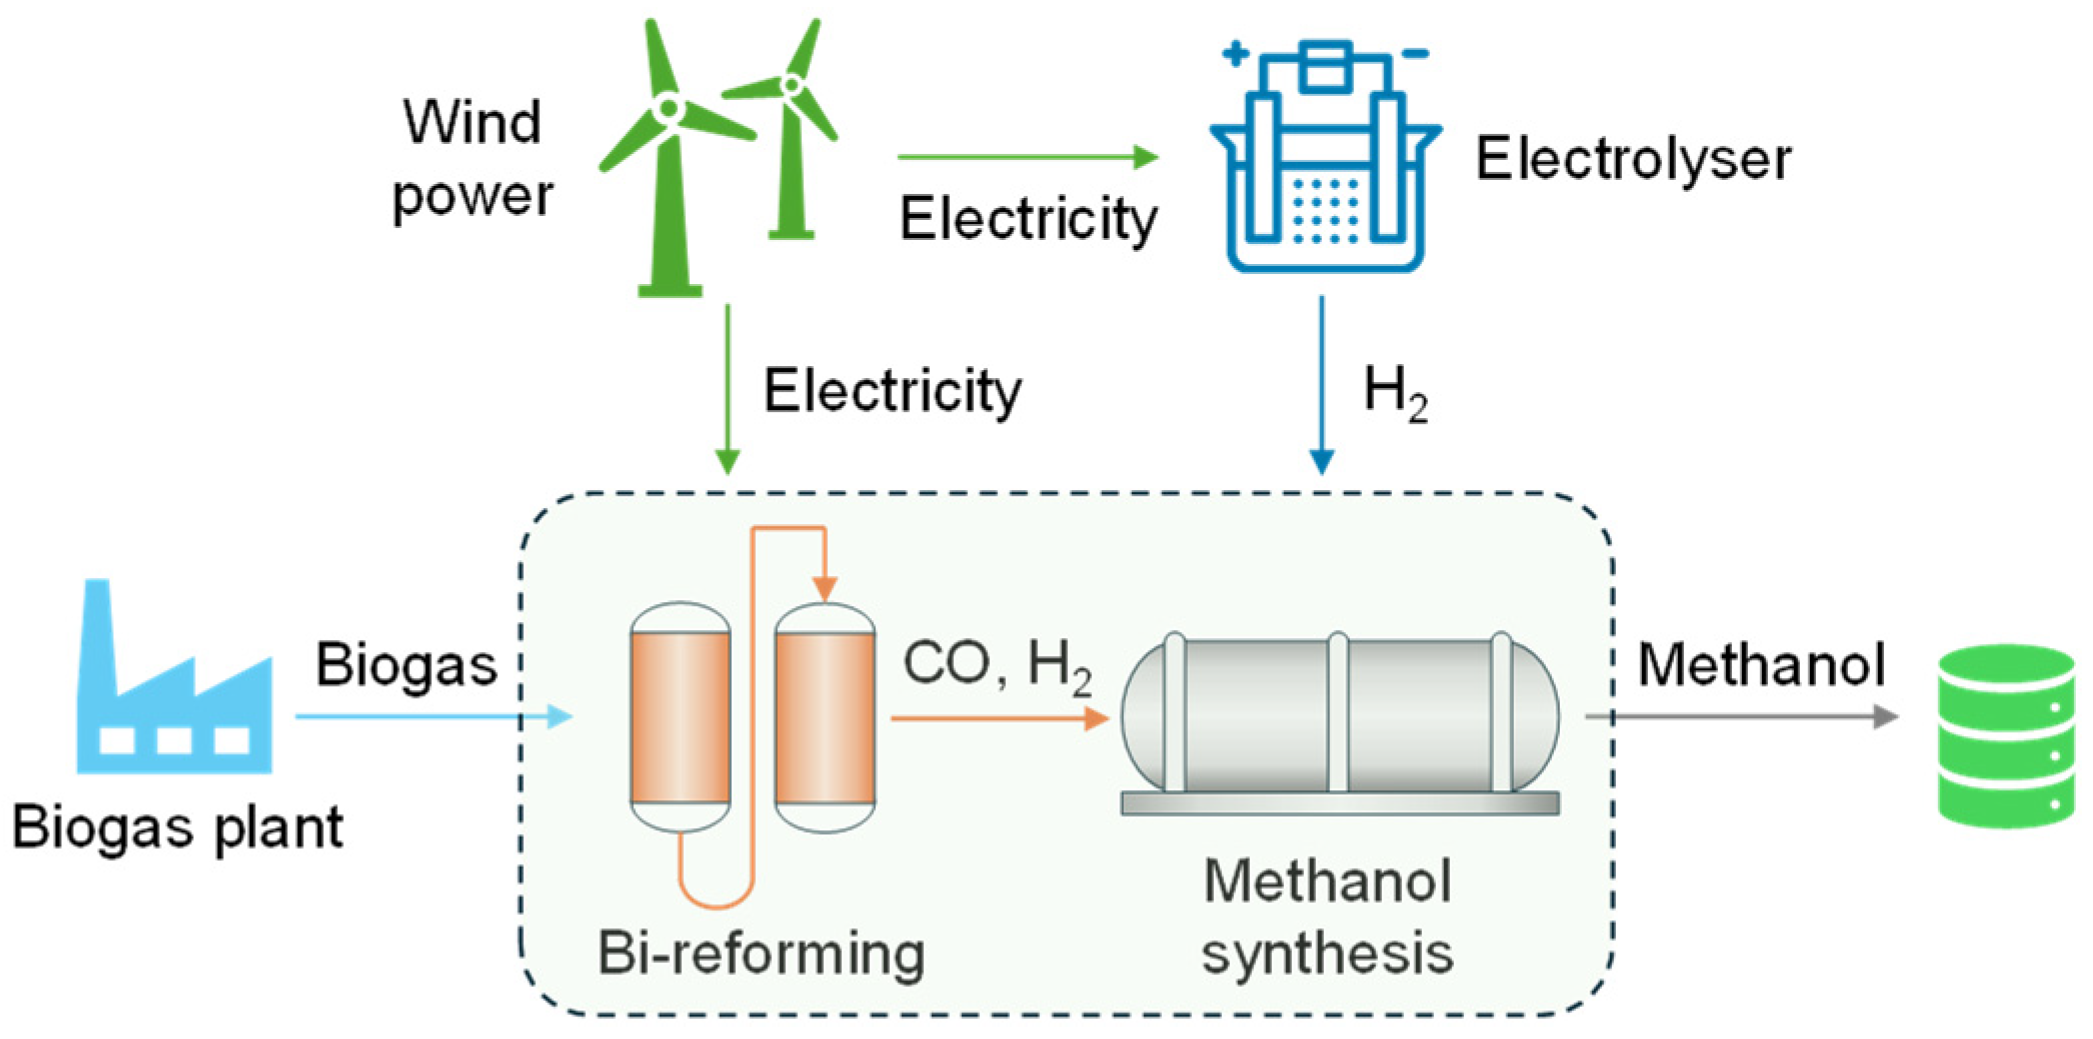
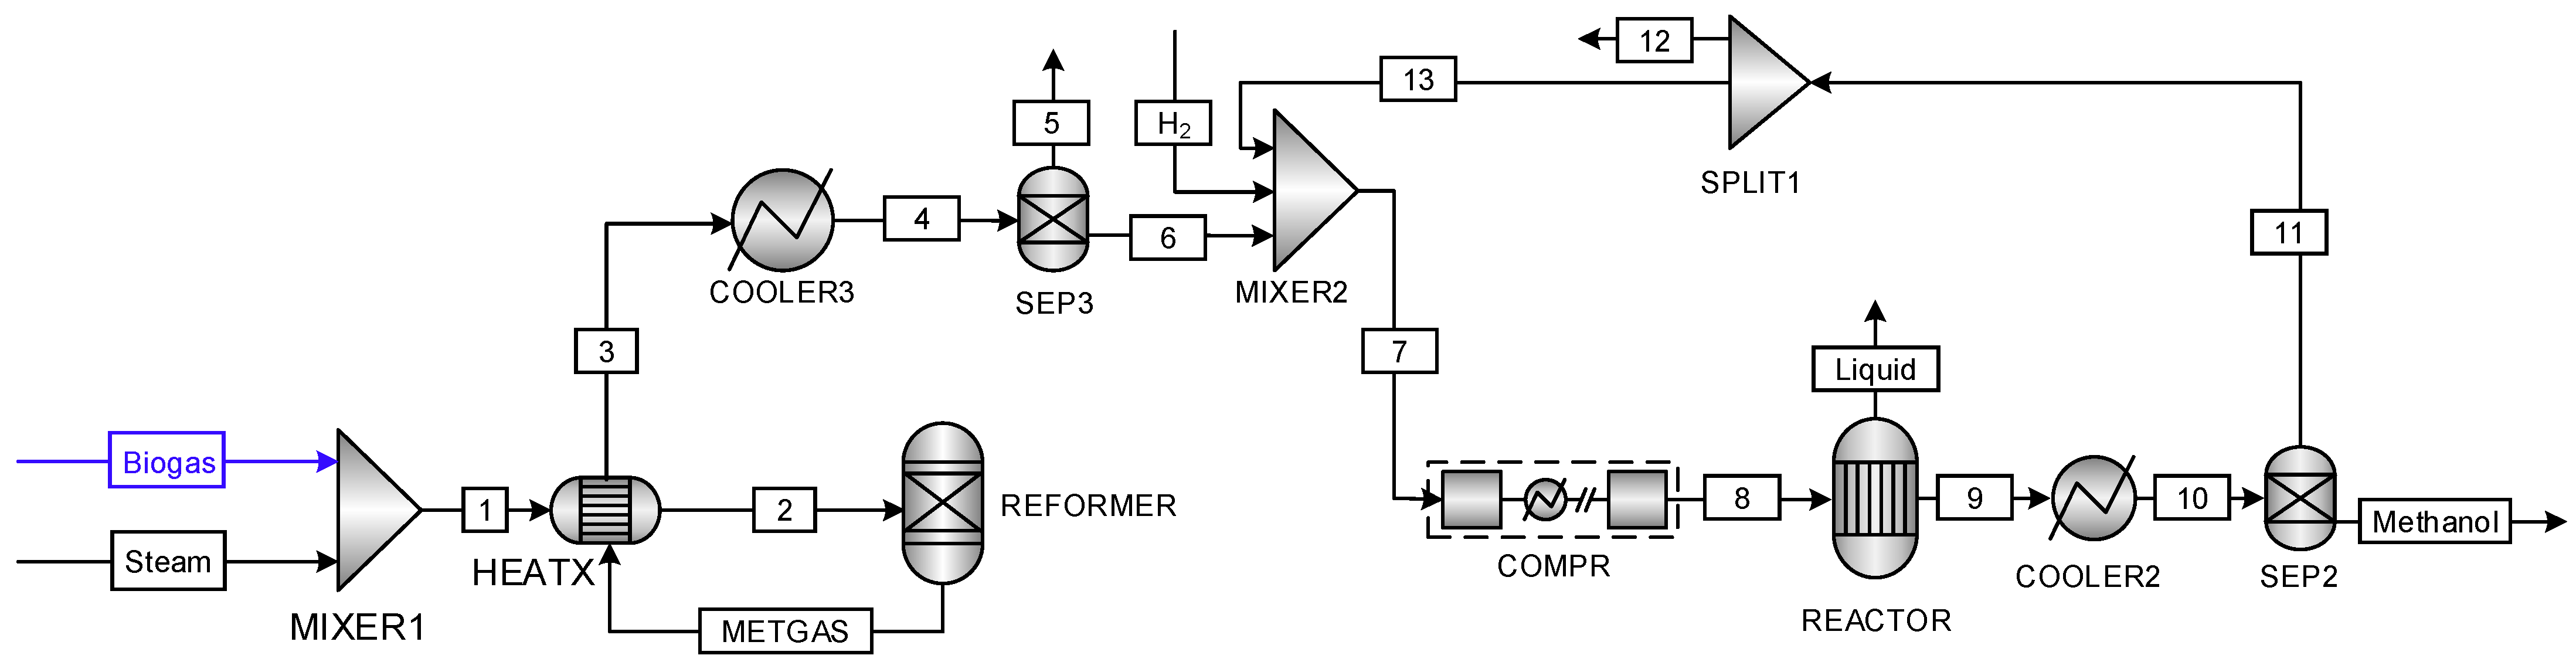
9]. The process flowsheet consists of two primary sections: the biogas bi-reforming unit and the closed-loop methanol synthesis system. The energy inputs of the plant are highly integrated with renewable wind power and grid supply, and the core simulation sequence is described below. The concept of the whole system and process flowsheet simulation in Aspen Plus is shown in
Figure 1 and
Figure 2, and operating conditions of each unit component are listed in
Table 1. The flowsheet is simulated in Aspen Plus V14 using the Soave–Redlich–Kwong (SRK) cubic equation of state as the global thermodynamic property method (no Henry components). SRK is selected because the streams mainly comprise light, weakly polar gases (CO
2, CO, CH
4, H
2) with methanol and water, spanning high-pressure methanol synthesis (80 bar) to low-temperature phase separation (40 °C). Cubic equations of state of the SRK type are well established for vapour–liquid equilibria and enthalpy prediction for such syngas–methanol systems, and the component binary interaction parameters are taken from the Aspen databank.
Bi-reforming: The bi-reforming reaction is simulated using the RGibbs reactor block in Aspen Plus; the operating conditions are varied over a temperature range of 300–1000 °C and a pressure range of 1–7 bar. The major products considered in the equilibrium calculations include CH
4, CO
2, CO, H
2, and H
2O. In addition, solid carbon (C) is included as a potential product to monitor coke formation across the operating range, given that carbon deposition is a known deactivation mechanism in reforming catalysts [
9]. Cooling the metgas stream prior to compression lowers the compressor inlet temperature, thereby reducing the specific compression work. This follows directly from isentropic compression theory, in which the work input per unit mass is linearly dependent on the absolute inlet temperature for a given pressure ratio and gas composition. Because of that, metgas is cooled by COOLER3 to 313 K, as the temperature of the inlet cooling water is set at 298 K.
Compression: The COMPR in
Figure 2 represents a multi-stage compressor with intercooling. There are four stages in the compressor; the pressure ratio per stage is determined by the outlet pressure. The outlet pressure is 80 bar, which is aligned with the typical pressure of methanol synthesis [
11,
12]. To minimise the mechanical power consumption of the compressor, the interstage coolers following the first three compression stages reduce the gas temperature to 313 K prior to each subsequent stage, consistent with the available cooling water supply temperature. The outlet of the fourth and final compression stage is cooled to 523 K, which is aligned with the typical temperature of methanol synthesis [
16]. In practice, compression processes in industrial compressors involve complex heat transfer and frictional effects that are difficult to characterise without detailed knowledge of the compressor geometry and internal flow conditions. However, for the purpose of simulation, the compression process can be simplified by using the isentropic method. In this simplified approach, each compression stage is modelled as an ideal adiabatic and reversible process, and the isentropic efficiency is modelled at 0.72 [
22].
Wind power integration: To satisfy green production standards, the electricity required to drive both the high-temperature electric heater and the high-pressure compressor is designed to be fully supplied by the designated wind turbines. Due to the intermittent nature of wind energy, electricity from the grid with Green Electricity Certificates is consumed to ensure the operation of these heavy electricity-consuming blocks while maintaining a net-zero carbon profile.
Recycle and purge configuration: The crude product exiting the reactor is cooled and routed into a high-pressure flash separator to separate the liquid crude methanol from the volatile unreacted gases. To prevent the accumulation of inert gases within the closed loop, a small purge fraction of 5% is continuously discharged, while the remaining 95% of the unreacted gas is recycled back to the reactor inlet using the Wegstein convergence method [
23,
24]. The purge fraction balances two competing effects: it must be large enough to prevent the accumulation of inerts (e.g., excess N
2) and non-condensable gases in the closed synthesis loop, but small enough to limit carbon/CO losses that reduce the overall carbon conversion. The selected value of 5% is within the typical range reported for commercial methanol synthesis loops [
9,
12].
2.8. Determining the Capacity of Wind Turbines
In this study, the data of wind speed is accessed from the NASA POWER database [
25]. The designated offshore wind turbines are conceptually sited in the Nanhui coastal area (approximately 121.9° E, 31.0° N), which falls within Shanghai’s designated offshore wind development zone and lies approximately 25 km from the Laogang Bioenergy Centre. The equation for calculating the required capacity of wind turbines is shown below:
To ensure compliance with the temporal correlation requirement of the RFNBO framework, which mandates that monthly renewable electricity generation must meet or exceed monthly plant electricity consumption, the wind turbine capacity is sized based on the minimum monthly capacity factor observed across the annual wind resource dataset for the proposed offshore site. The equation for calculating the minimum monthly capacity factor is shown below:
When the wind speed is between the cut-in speed and the cut-out speed, the power output is proportional to the cube of the wind speed. The method of calculating the power output for each hour is shown below:
: the actual power output of the wind turbine in time step i
: the rated power output of the wind turbine
: the hub-height wind speed in time step i
: the rated wind speed of the wind turbine
Due to wind shear, wind speed increases with height. In this study, power law is implemented to calculate the wind speed at hub height:
a measurement height
: the height of the hub
the wind speed at the height of the hub
: the measured wind speed at the measurement height
For the offshore wind turbines,
α = 0.11 is assumed, which reflects the low surface roughness of the marine boundary layer [
26].
2.9. Economic Assessment
2.9.1. Total Fixed Capital Expenditure Estimation
The capital expenditure (CAPEX) of the green methanol production facility is evaluated based on the Lang Factor Method [
27], a widely accepted factorial approach for preliminary techno-economic assessments. The estimation process converts the physical sizing parameters derived from the Aspen Plus steady-state simulation into direct financial metrics through the following two steps:
Firstly, the thermodynamic and hydrodynamic outputs from the Aspen Plus simulation are utilized to determine the size of core process units. The purchase equipment cost for major unit operations, including the multi-stage compressor, electric preheater, and heat exchanger, is estimated using the method adapted from G. Towler and R. Sinnott’s Chemical Engineering Design book [
28]:
the equipment-specific cost scaling exponent
The constants
,
and
are taken from the equipment cost tables in Towler and Sinnott’s handbooks [
28].
Because the cost correlations and equipment quotations used in this study are reported on different cost-year bases and in different currencies, all purchased equipment costs are first escalated to a common reference year and then converted into a single currency. In this study, all capital costs are reported on a 2026 basis in RMB. The escalation and conversion are expressed as [
28]:
Secondly, to account for the expenses required to transition separate equipment blocks into an operational industrial plant, the Lang factor is introduced. This factor comprehensively aggregates the costs associated with piping network installation, civil and structural engineering, site development, instrumentation and control systems, as well as contractor fees and contingencies. The total fixed capital investment (FCI) is calculated as:
Normally, the Lang factor is assigned a value between 3 and 5 [
27]. In this equation, FCI is the total fixed capital investment,
is the Lang factor, and
is the purchased equipment cost of major equipment item
i, summed over all n items.
2.9.2. Operating Expenditure Estimation
The total annual operating expenditure (OPEX) represents the recurring financial liquidity required to maintain the daily commercial operations of the green methanol facility. Normally, the OPEX structure is categorized into fixed OPEX and variable OPEX.
Fixed operating costs encompass expenses that remain independent of the plant’s production throughput or feedstock consumption rates. In this study, fixed operating costs include operating labour and labour-related benefits costs, maintenance and repair costs, local taxes, and insurance costs.
Given that the proposed green methanol facility is a highly automated, small-scale chemical processing plant, the staffing requirements are structurally minimised. The facility operations are conceptualised based on a continuous 24-h shift pattern tailored to the localised industrial context of Shanghai, China. The core operational workforce comprises four skilled chemical plant operators supporting a rotating shift schedule and one technical engineer for overall supervisory control, resulting in a total workforce of 5 employees. The baseline salary for an operator is set at 110,000 RMB/year, while the technical engineer salary is modelled at 200,000 RMB/year [
29]. To account for the labour-related benefits cost, a labour burden factor of 35% is implemented. This cost represents the statutory social securities and welfare benefits required under the regulations of Shanghai [
30]:
Number of employees/operators in staff category i
Annual base salary for staff category i
Beyond operating labour, maintenance and repairs cost and local taxes and insurance are estimated utilising standard empirical factor-based percentages linked directly to total FCI. To account for the cost of routine maintenance and repairs, the annual maintenance and repairs cost is modelled at 3% of the FCI [
28]. To account for local taxes and insurance, the local taxes and insurance cost is set at 1% of the FCI [
28].
Variable operating expenditures are fundamentally governed by the plant’s production throughput and are quantified directly based on the steady-state mass and energy balances extracted from the Aspen Plus process simulation.
In this study, the annual available operating hours are modelled at 8000 h. The biogas feedstock cost is treated as zero in the baseline case, as the facility is co-located with the anaerobic digestion infrastructure and the biogas is regarded as a by-product of urban biowaste treatment [
15]. The Green Electricity Certificates market in China experienced significant price volatility during 2024–2025, with traded prices ranging from below 1 RMB/MWh in late 2024 to approximately 5 RMB/MWh by late 2025 [
31]. While the price of Green Electricity Certificates is relatively low, the construction of a dedicated offshore wind farm remains necessary to satisfy the additionality criterion of the RFNBO framework, which requires that monthly renewable electricity generation must exceed the monthly electricity consumption [
32]. The price of industrial water is set at 6 RMB/m
3 according to the municipal water price in Shanghai. The price of catalyst for methanol synthesis is modelled as 92 RMB/kg, while its lifetime is set as 4 years [
15]. Biogas is priced at zero as the facility is co-located with the anaerobic-digestion plant and treats a by-product of urban waste [
15]. The alkaline-electrolyser efficiency of 67% is representative of current commercial alkaline systems [
33]. Operation at 8000 h/yr reflects the high on-stream availability expected of a continuous, grid-backed plant with no seasonal feedstock constraint. Electricity-export revenue is credited because the wind farm—sized to the lowest-wind month to meet RFNBO additionality—produces a surplus in other months, which is sold to the grid at the prevailing market price [
34].
2.9.3. Economic Assessment Assumptions
In this study, the discount rate is established at 8%, which is aligned with the benchmark macroeconomic definitions utilised in contemporary biogas-to-methanol pathways [
15]. The temporal boundary for the economic assessment of the commercial biogas-to-methanol refinery is established at a benchmark project lifetime of 25 years [
15].
The overall financial assumptions and boundary conditions are shown in
Table 2 below:
4. Discussion
As shown in
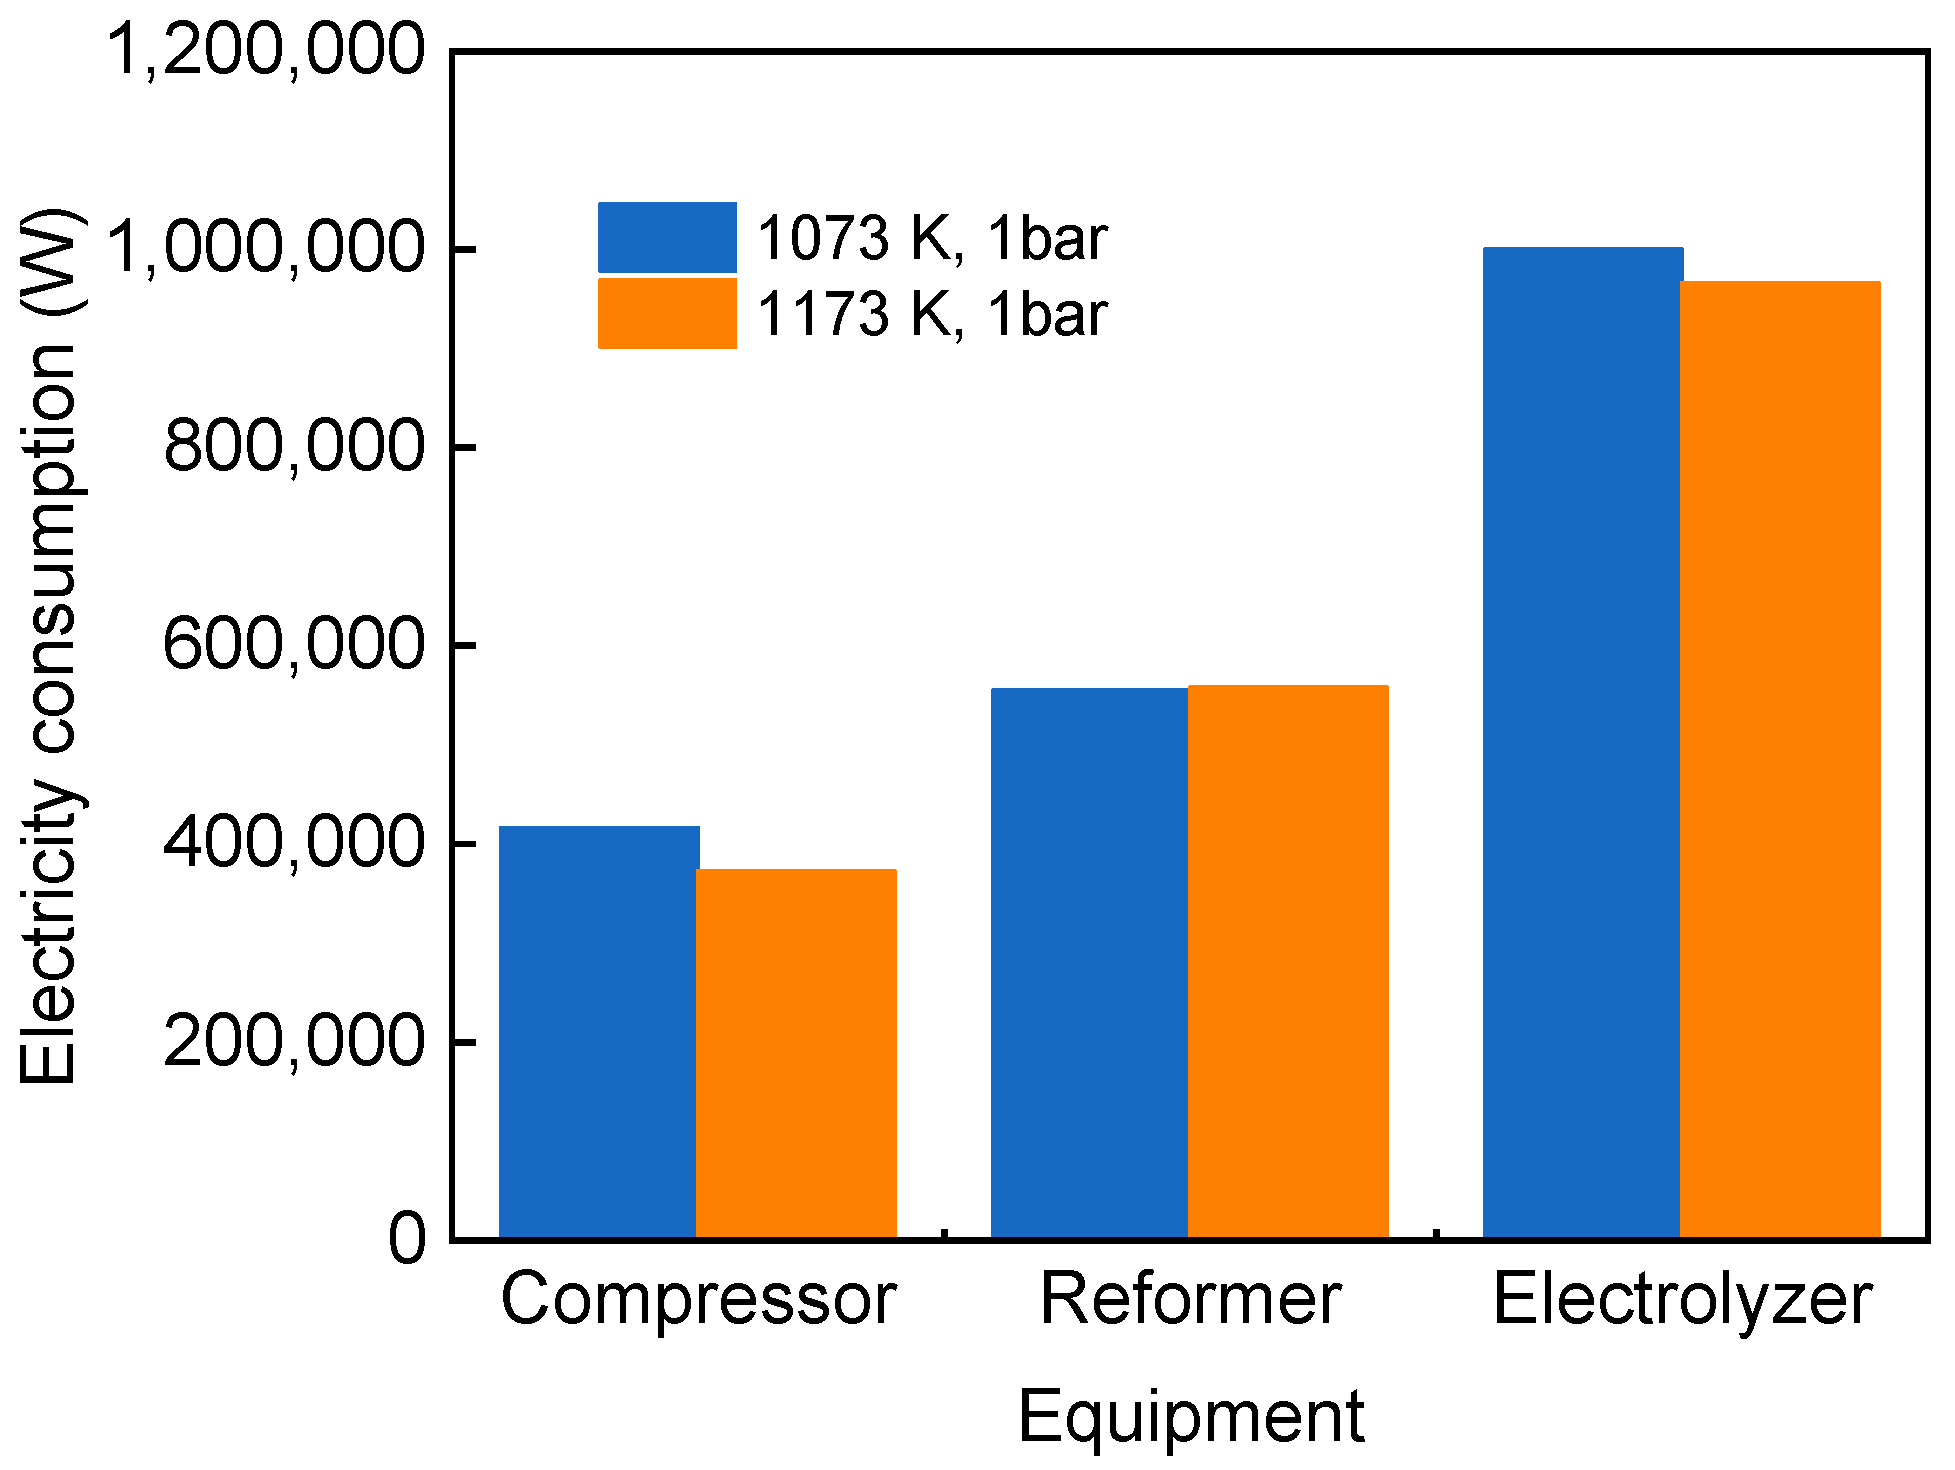
Figure 7, the electrolyser exhibits the highest electricity consumption throughout the entire process, owing to the large amount of H
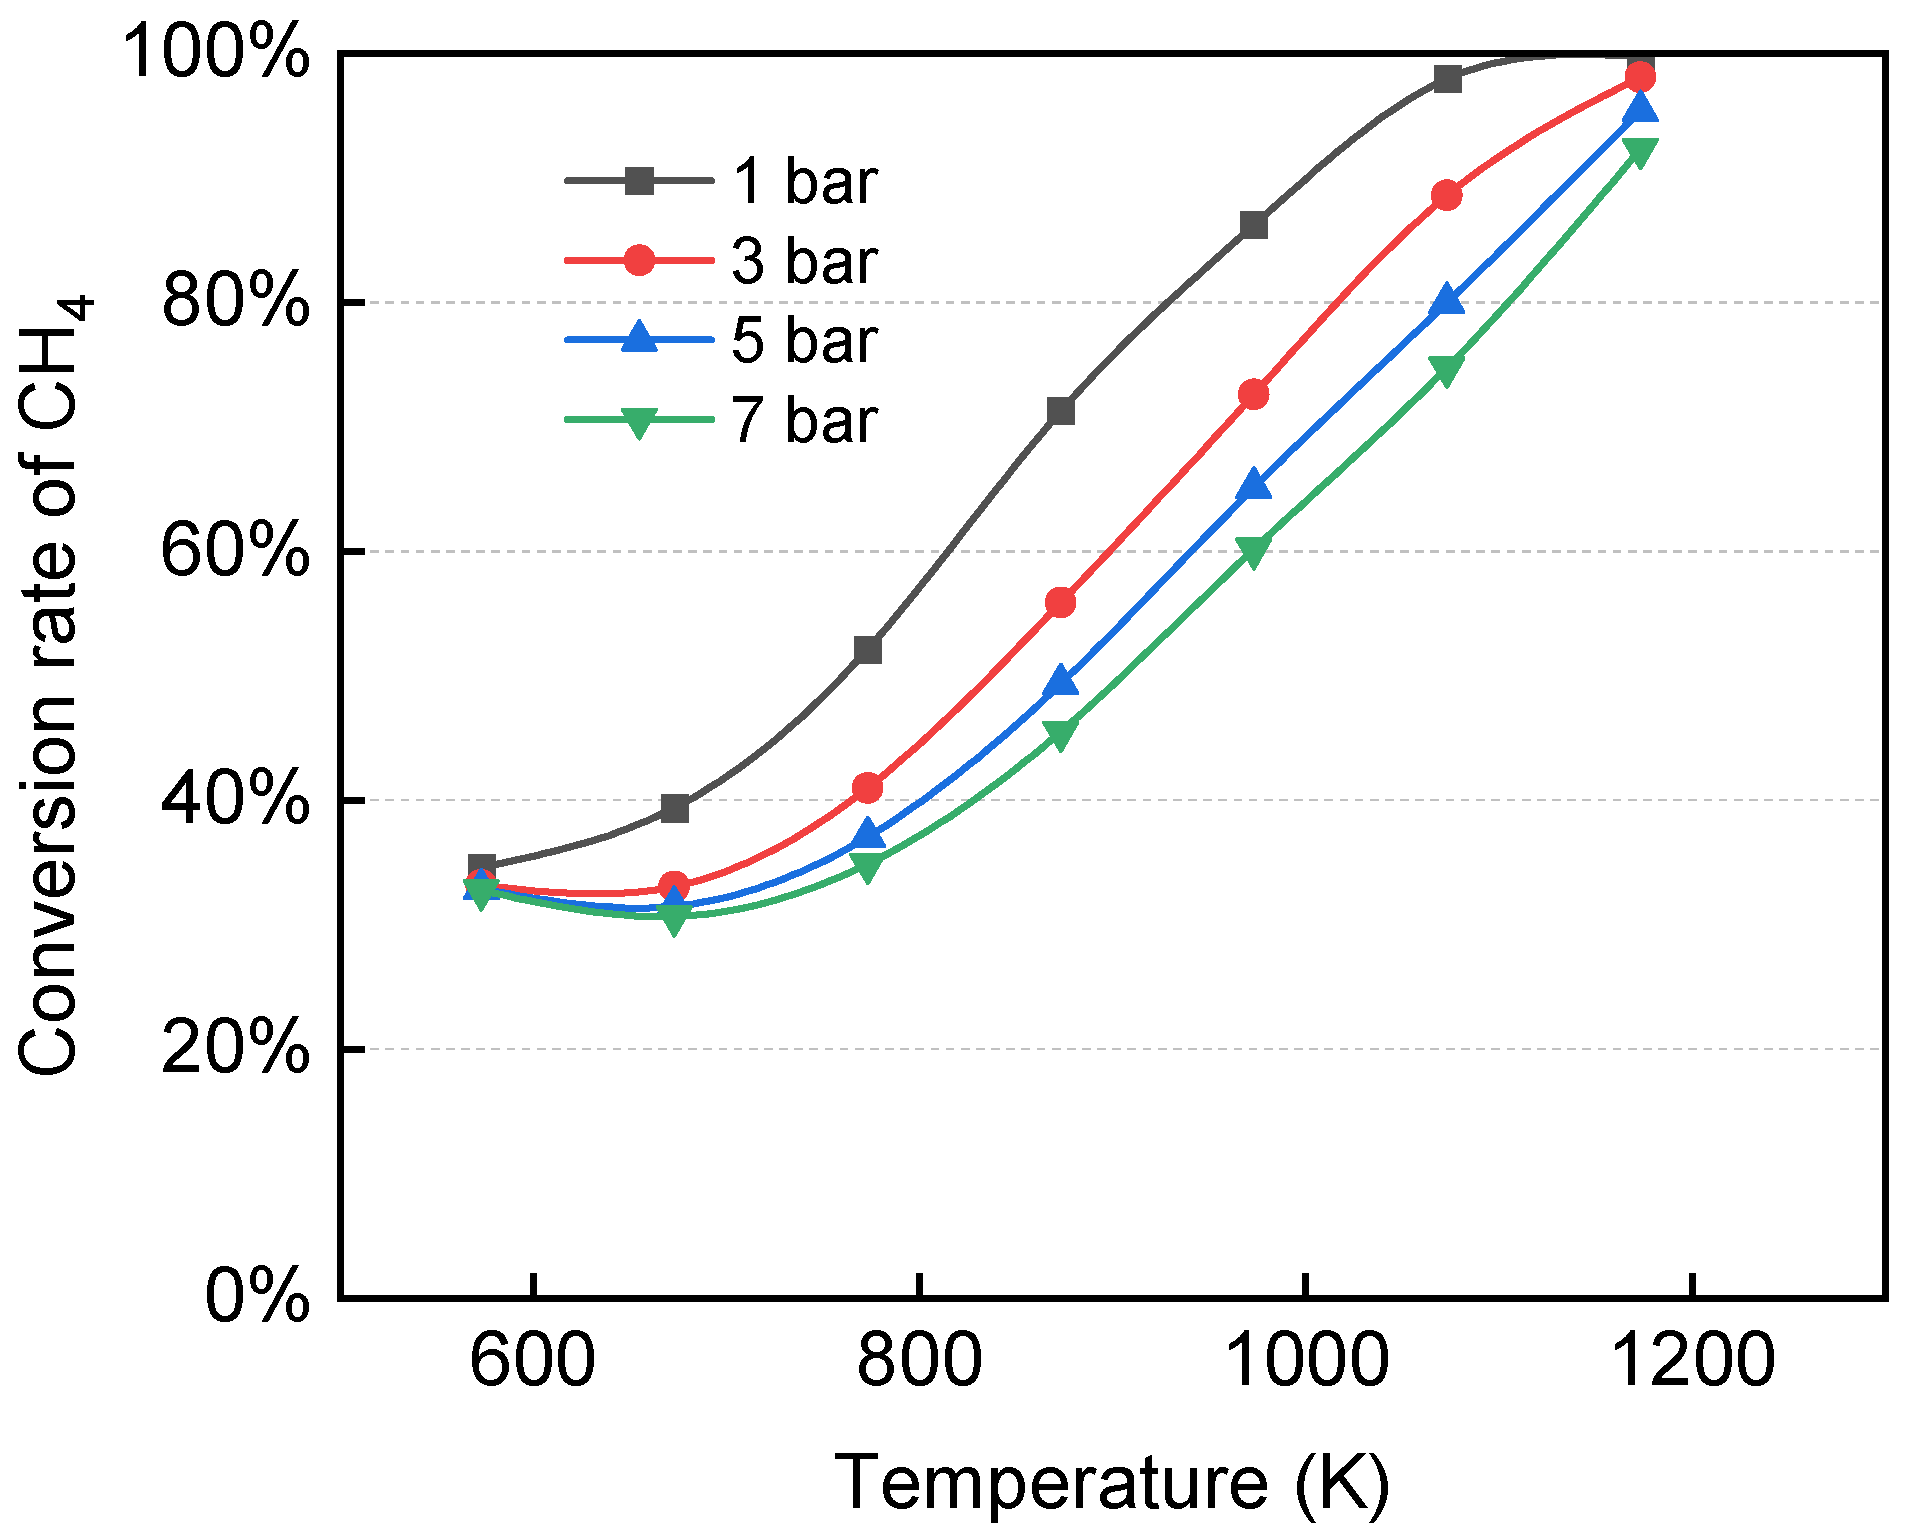
2 that must be supplied prior to methanol synthesis. In addition, although the electricity consumption of the reformer decreases slightly under the operating condition of 1073 K and 1 bar, the electricity consumption of both the compressor and the electrolyser increases considerably. Therefore, in the subsequent economic analysis, the operating condition of 1173 K and 1 bar will be adopted as the optimal case for calculation.
The total FCI was estimated at 122.7 million RMB. The FCI is dominated by two components: offshore wind turbine (42.8%) and multi-stage compressor (45.5%). The high compressor cost is because methanol synthesis must be carried out at a high pressure of 80 bar, which requires a compressor with very large power. Although electricity can be obtained from the grid through purchasing Green Electricity Certificates, the RFNBO requirements mandate that the green electricity produced each month must exceed the electricity consumed each month, resulting in the high offshore wind cost. Therefore, the wind turbine capacity is sized based on the month with the lowest wind resource in September. A part of the cost of wind turbines can be offset by exporting electricity to the grid.
The operating expenditure is dominated by capital-linked fixed costs rather than variable feedstock or utility costs. The sum of maintenance and repairs and local taxes and insurance costs accounts for over 60% of total cost, which reflects the capital-intensive nature of the integrated bi-reforming and offshore-wind-powered electrolysis system, where the high CAPEX propagates directly into fixed operating costs.
The largest part of variable cost is grid electricity purchase cost, mainly because of the periods of insufficient wind generation. Although the gross OPEX is high (7,908,336 RMB), the majority of it is offset by the electricity export revenue. This is because the wind turbine capacity was sized based on the month with the lowest wind availability, resulting in substantial surplus wind power during the other months.
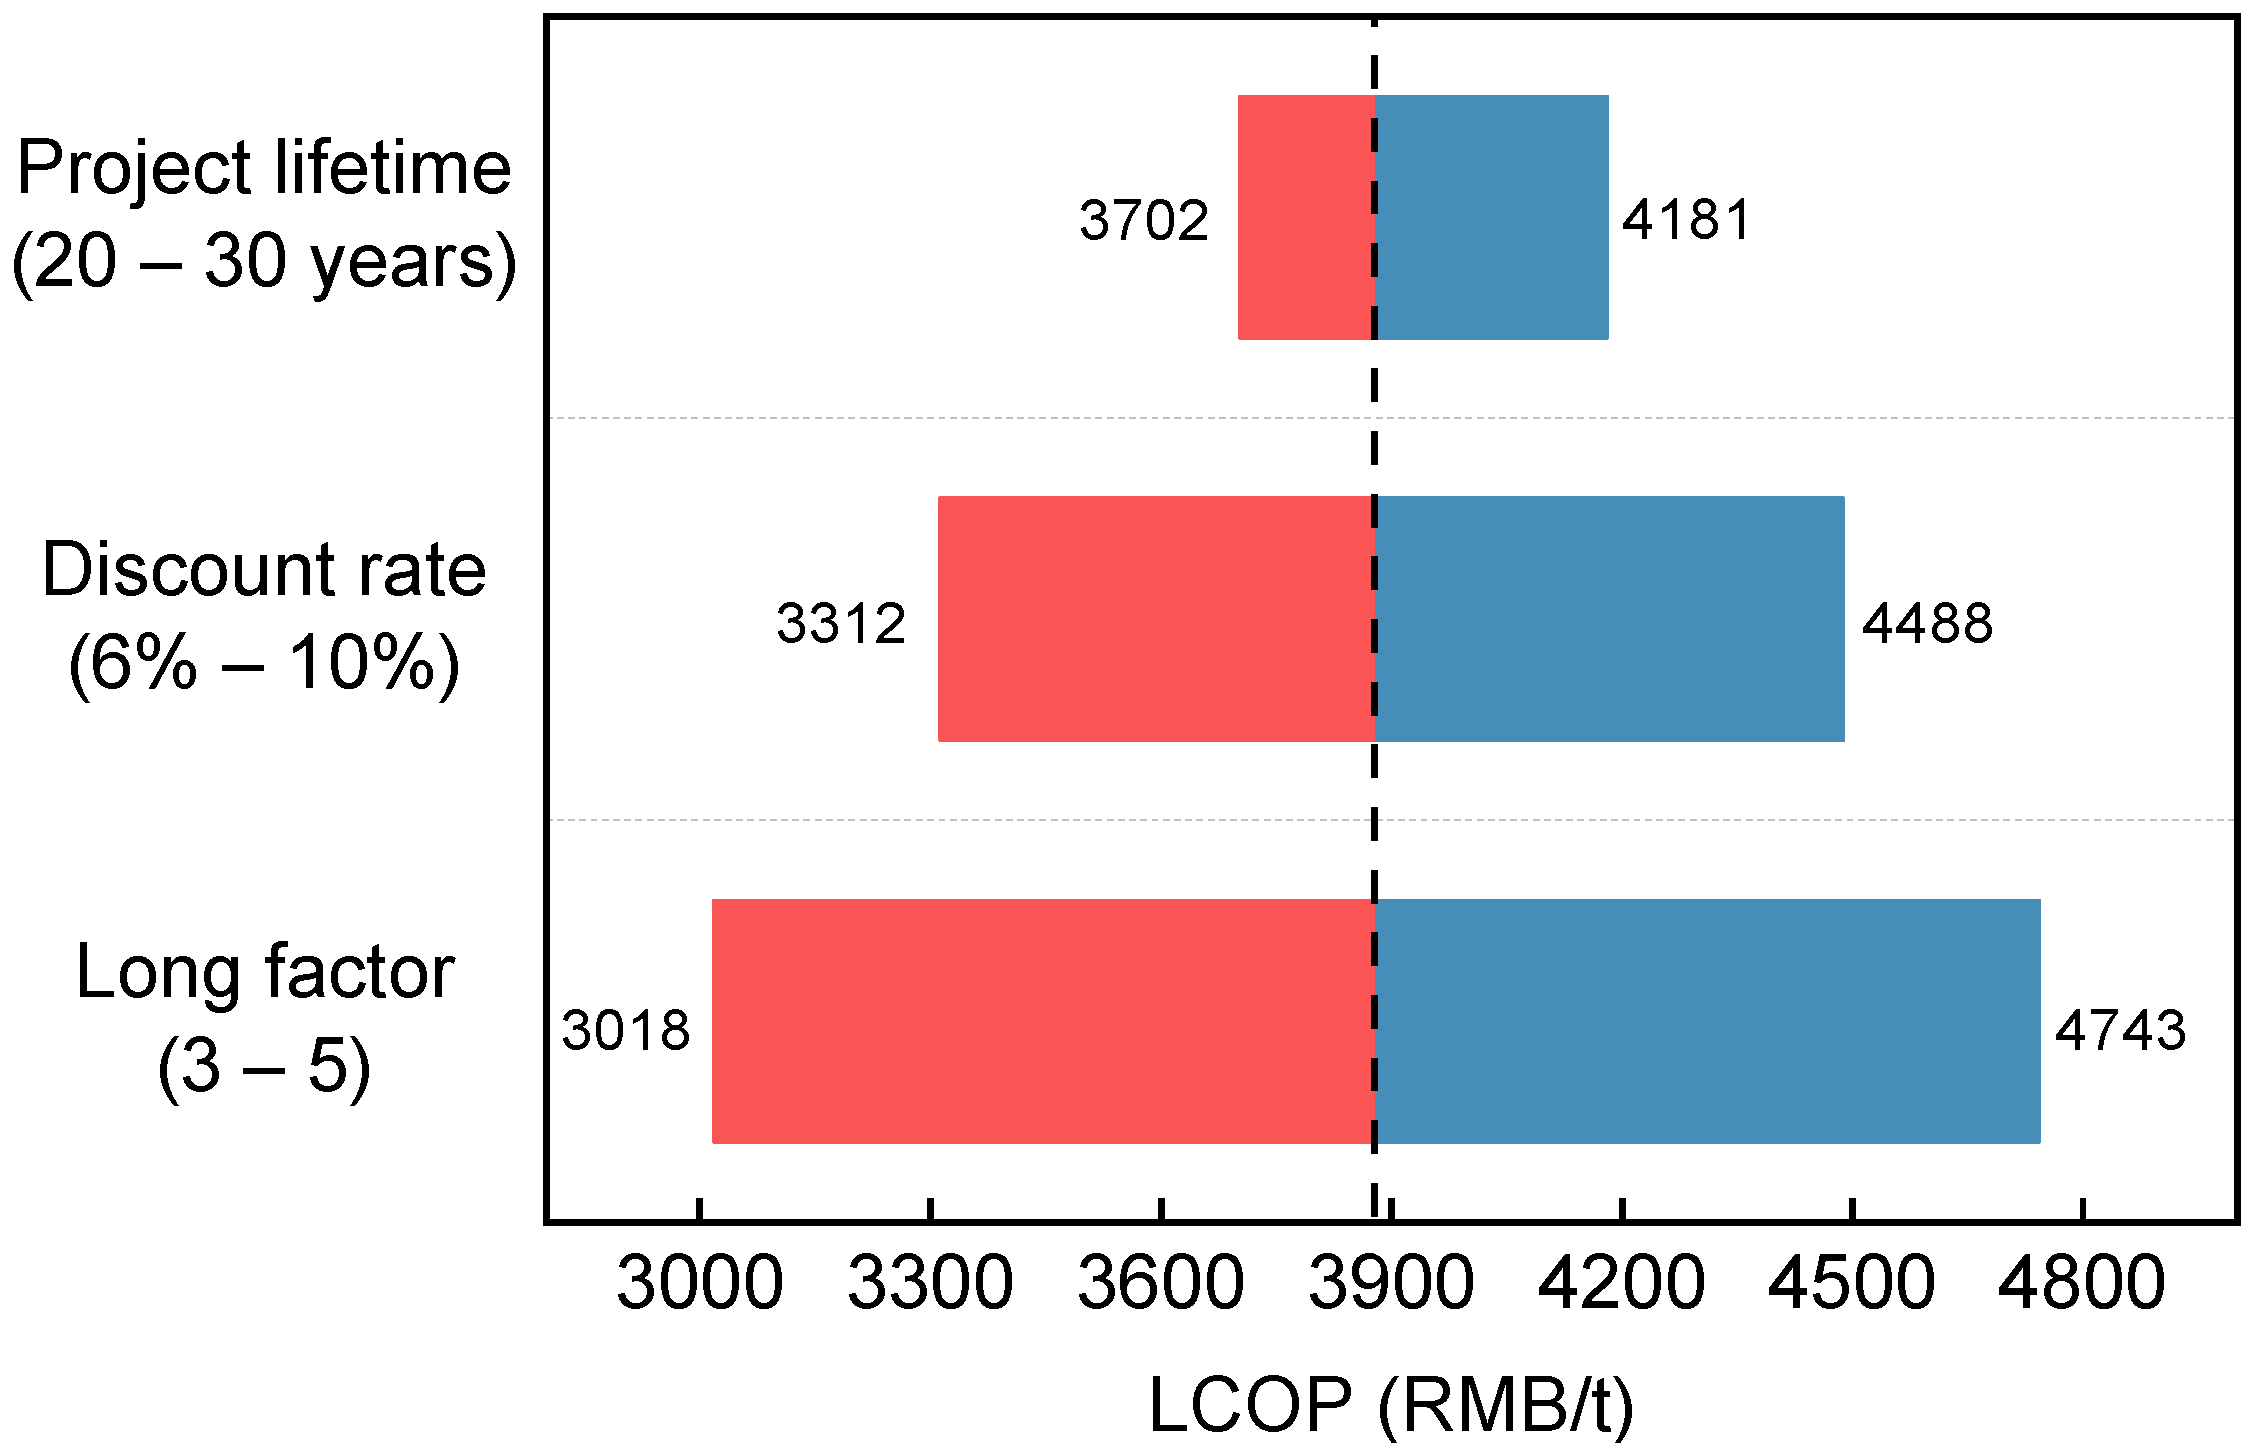
The Tornado diagram ranks the three parameters by their influence on the LCOP. The LCOP is most sensitive to the Lang factor, followed by the discount rate, while the project lifetime has a comparatively minor effect. This is mainly because the majority of LCOP is annualised CAPEX, and the Lang factor has a huge impact on CAPEX. LCOP of methanol reaches 4743 RMB/t when the Lang factor is 5, while the LCOP is 3018 RMB/t when the Lang factor is 3.
The plant is highly capital-intensive, and the compressor and the wind turbine represent the largest investment items. In July 2026, the price of conventional methanol was approximately 2441 RMB/t [
39], substantially lower than the production cost of the green methanol assessed in this study. This implies that the market must be willing to pay a green premium for the project’s green methanol to be profitable.
5. Conclusions
This study presented a system design based on bi-reforming and techno-economic assessment of a 10 tonnes/day green methanol plant located in Shanghai, China, addressing the limited research on the industrial application of bi-reforming.
The operating condition of 1173 K and 1 bar was identified as optimal on the basis of minimised total electricity consumption. The bi-reforming process achieved a methane conversion of 99.7% under the condition of 1173 K and 1 bar, with solid carbon formation fully suppressed above 1073 K. The carbon conversion rate reaches 96.9% under this optimal condition.
Economically, the total fixed capital investment is estimated at 122.7 million RMB, dominated by the multi-stage compressor (45.5%) and the offshore wind turbines (42.8%). The resulting LCOP is 3880 RMB/t, while 88.9% of it is contributed by CAPEX, confirming the capital-intensive nature of the plant. The LCOP is highly sensitive to the choice of Lang factor, varying between 3018 to 4743 RMB/t while the Lang factor varies from 3 to 5.
The LCOP exceeds the conventional methanol price of 2441 RMB/t, indicating that the project’s viability is contingent on accessing a premium green-methanol market, such as maritime shipping decarbonisation. The viability of green methanol depends on future policy.
The present assessment is techno-economic in scope, while a full life-cycle assessment quantifying the net greenhouse-gas benefit of this pathway and accounting for biogas pretreatment, methane leakage, and indirect emissions from grid electricity remains an avenue for future research.