Article

Integrated Techno-Economic, Environmental Screening, and Social Return on Investment Analysis of Community-Scale Sawdust–Polypropylene Co-Pyrolysis for Heavy-Metal Adsorbent Production in Rural Area, Thailand

by
Torpong Kreetachat
1,
Suphalerk Khaowdang
1,
Saksit Imman
1,
Nopparat Suriyachai
1,
Nathiya Kreetachat
1,
Kowit Suwannahong
2,
Sukanya Hongthong
3 and
Surachai Wongcharee
4,*
1
School of Energy and Environment, University of Phayao, Phayao 56000, Thailand
2
Faculty of Public Health, Burapha University, Chonburi 20131, Thailand
3
Faculty of Arts and Science, Chaiyaphum Rajabhat University, Chaiyaphum 3600, Thailand
4
Faculty of Engineering, Mahasarakham University, Khamriang, Mahasarakham 44150, Thailand
*
Author to whom correspondence should be addressed.
Energies 2026, 19(14), 3330; https://doi.org/10.3390/en19143330
Submission received: 23 May 2026 / Revised: 8 July 2026 / Accepted: 9 July 2026 / Published: 14 July 2026

Abstract

The co-pyrolysis of waste sawdust and non-recyclable polypropylene at 500 °C was investigated for low-cost adsorbent production and solid waste valorization in rural Thailand. Sustainability was evaluated through techno-economic analysis, gate-to-gate environmental screening, CO2 emission accounting, adsorption cost analysis, and social return on investment assessment. The sawdust–polypropylene biochar produced at 500 °C production system requires a total capital expenditure of 46,000 THB and achieves a unit production cost of 316 THB kg−1 at a 35% w/w biochar yield, 7–14 times lower than commercial granular-activated carbon and powdered-activated carbon. Based on a hypothetical community-scale deployment scenario, the estimated capital expenditure payback period under in-house granular-activated carbon substitution falls below six months. All annual techno-economic and SROI results presented in this study represent scenario-based screening estimates and should not be interpreted as demonstrated community-scale performance. Gate-to-gate environmental screening estimated gross production emissions of 8.771 kg CO2e kg−1 SPB-500. A consequential waste-diversion scenario incorporating carbon sequestration and avoided-disposal credits yielded a hybrid scenario-based net greenhouse-gas balance of +3.082 kg CO2e kg−1 SPB-500, supporting its potential application under the evaluated scenario of approximately 0.4–5.9 kg CO2e kg−1 relative to commercial-activated carbon benchmarks. Social return on investment analysis yields a base–case ratio of 1.39:1 (five-year total present value: 6,025,841 THB; minimum across sensitivity scenarios: 1.13:1), with water quality improvement (SDG 6; 46.1%) and health risk reduction (20.7%) jointly accounting for 66.8% of monetized outcomes, confirming investment justification from public health benefits alone. Quantifiable alignment is demonstrated across five UN Sustainable Development Goals. Collectively, these findings suggest that SPB-500 co-pyrolysis has the potential to be an economically accessible and socially beneficial waste-valorization technology under the evaluated scenario, supporting its potential application in decentralized heavy-metal remediation in resource-constrained communities.

1. Introduction

Global plastic production has exceeded 400 million tons per year, with polypropylene (PP) constituting approximately 20% of total output as one of the most widely consumed thermoplastics in packaging, consumer goods, and industrial applications [1,2]. Despite its prevalence, a substantial proportion of post-consumer PP waste falls outside formal recycling infrastructure, particularly in low- and middle-income countries, where inadequate collection systems result in open dumping, uncontrolled burning, and landfill disposal [3]. Such practices result in continuous soil and water pollution, release particulates, and direct emissions of greenhouse gases, which together impose negative health impacts on communities and act as a source of climate forcing [4,5]. This concern about the PP waste problem, both its scale and longevity, has led to greater efforts to explore thermochemical routes of valorization that both mitigate the waste and produce economically useful products.
Sawdust is one such lignocellulosic byproduct made up mainly of cellulose, hemicellulose, and lignin that serves as an additional yet challenging waste stream in wood-based processing industries [2,6]. As witnessed in rural and peri-urban parts of Southeast Asia, and particularly within the Chaiyaphum province of Thailand analyzed in this study, sawdust waste is produced in large volumes in both sawmills and furniture factories, which dispose of this waste through unregulated incineration due to lack of proper collection and energy recovery systems. The use of sawdust as a complement to PP wastes within a thermally driven process thus becomes highly strategic [7,8].
Pyrolysis, the thermal decomposition of carbonaceous feedstocks in the absence of oxygen at temperatures typically ranging from 300 to 700 °C, produces three principal co-products: biochar (a carbon-rich solid), bio-oil (a condensable liquid), and syngas (a non-condensable combustible gas) [9,10]. Co-pyrolysis of lignocellulosic biomass and plastic waste has attracted increasing research attention owing to reported thermochemical synergies during thermal degradation: hydrogen-rich volatile compounds released during PP decomposition enhance bio-oil quality and yield, whilst the lignocellulosic matrix of sawdust promotes stable carbonaceous biochar formation through its inherently high oxygen-to-carbon ratio and solid-phase carbon-retention capacity [8,11,12].These synergistic interactions, combined with the inherent feedstock flexibility of batch pyrolysis systems, render co-pyrolysis a technically promising route for integrated waste valorization at community scale [7,13].
Recent work by Jena, M.K. et al. (2026) further demonstrated the potential of biomass–plastic co-pyrolysis for sustainable carbonaceous material production and highlighted the need for integrated sustainability assessments beyond process performance alone [14]. Notwithstanding the growing experimental literature on biomass–plastic co-pyrolysis, rigorous process-level techno-economic analyses (TEAs) remain comparatively scarce, particularly for small- and community-scale systems intended for deployment in resource-constrained settings [15,16]. The majority of published TEA studies address large-scale centralized facilities that require substantial capital investment and well-developed feedstock logistics conditions that may not be achievable in rural or peri-urban communities with limited technical and financial capacity [17,18]. Fuel choice is an important issue during design as it influences the operating cost, greenhouse-gas emission, efficiency of energy conversion, control ability of the process, and local infrastructure. However, most community-scale research considers only one type of heating and provides insufficient information about the sustainability of a specific combination of fuels. This research evaluates the performance of an LPG-operated pyrolysis system as an example of a simple and easy-to-apply combination of fuels in rural Thailand [19,20]. This gap constitutes a material barrier to evidence-based technology deployment at the community scale.
In this research, we aim to perform a concise sustainability screening on an LPG-powered community-level system for pyrolyzing sawdust and polypropylene to produce SPB-500 adsorbent in Thailand’s rural areas. Although a plethora of research work on biomass-plastic co-polymerization is available, previous studies mainly focused on pyrolytic behavior, product yields, physiochemical properties, and the adsorbent efficacy of produced biochar. More recent works have also shed more light on the mechanisms of co-polymerization and product valorization process. However, studies that assess economic viability, environmental implications, GHG emissions, and the social impacts of such systems simultaneously are scarce, especially for small-scale, community-based implementations in developing countries [21,22]. In this context, the uniqueness of this current study is the combined use of techno-economic analysis (TEA), environmental assessment, GHG emission accounting, adsorption cost assessment, and Social return on investment (SROI) analysis to conduct an overall sustainability analysis of SPB-500 production [15,16,19,20,23,24].
The goals for this research are as follows: (1) to analyze production viability, capital costs, operating costs, per-unit cost of production, and payback period of SPB-500 production at a community scale, powered by LPG; (2) to determine gross production emissions and estimate net greenhouse-gas balance using gate-to-gate CO2 screening approach, which includes production emissions, carbon neutrality assumptions, and avoided emissions due to waste reduction; (3) to compare selected environmental impacts associated with SPB-500 production against those of commercial-grade adsorbents using screening metrics such as GWP100, cumulative energy demand, and factors of eutrophication/toxicity; and (4) to measure the social, environmental, and financial benefits of utilizing SPB-500 using scenario-based Social return on investment analysis. Previous experimental work demonstrated that SPB-500 exhibited excellent Cu2+ adsorption performance, including a maximum adsorption capacity of 126.1 mg g−1, rapid equilibrium, favorable Freundlich isotherm behavior, pseudo-second-order kinetics, and good regeneration stability. These experimentally validated adsorption results provide the technical basis for the production scenario, wastewater treatment capacity, and sustainability assessment (TEA, environmental assessment, and SROI) presented in this study [25].

2. Materials and Methods

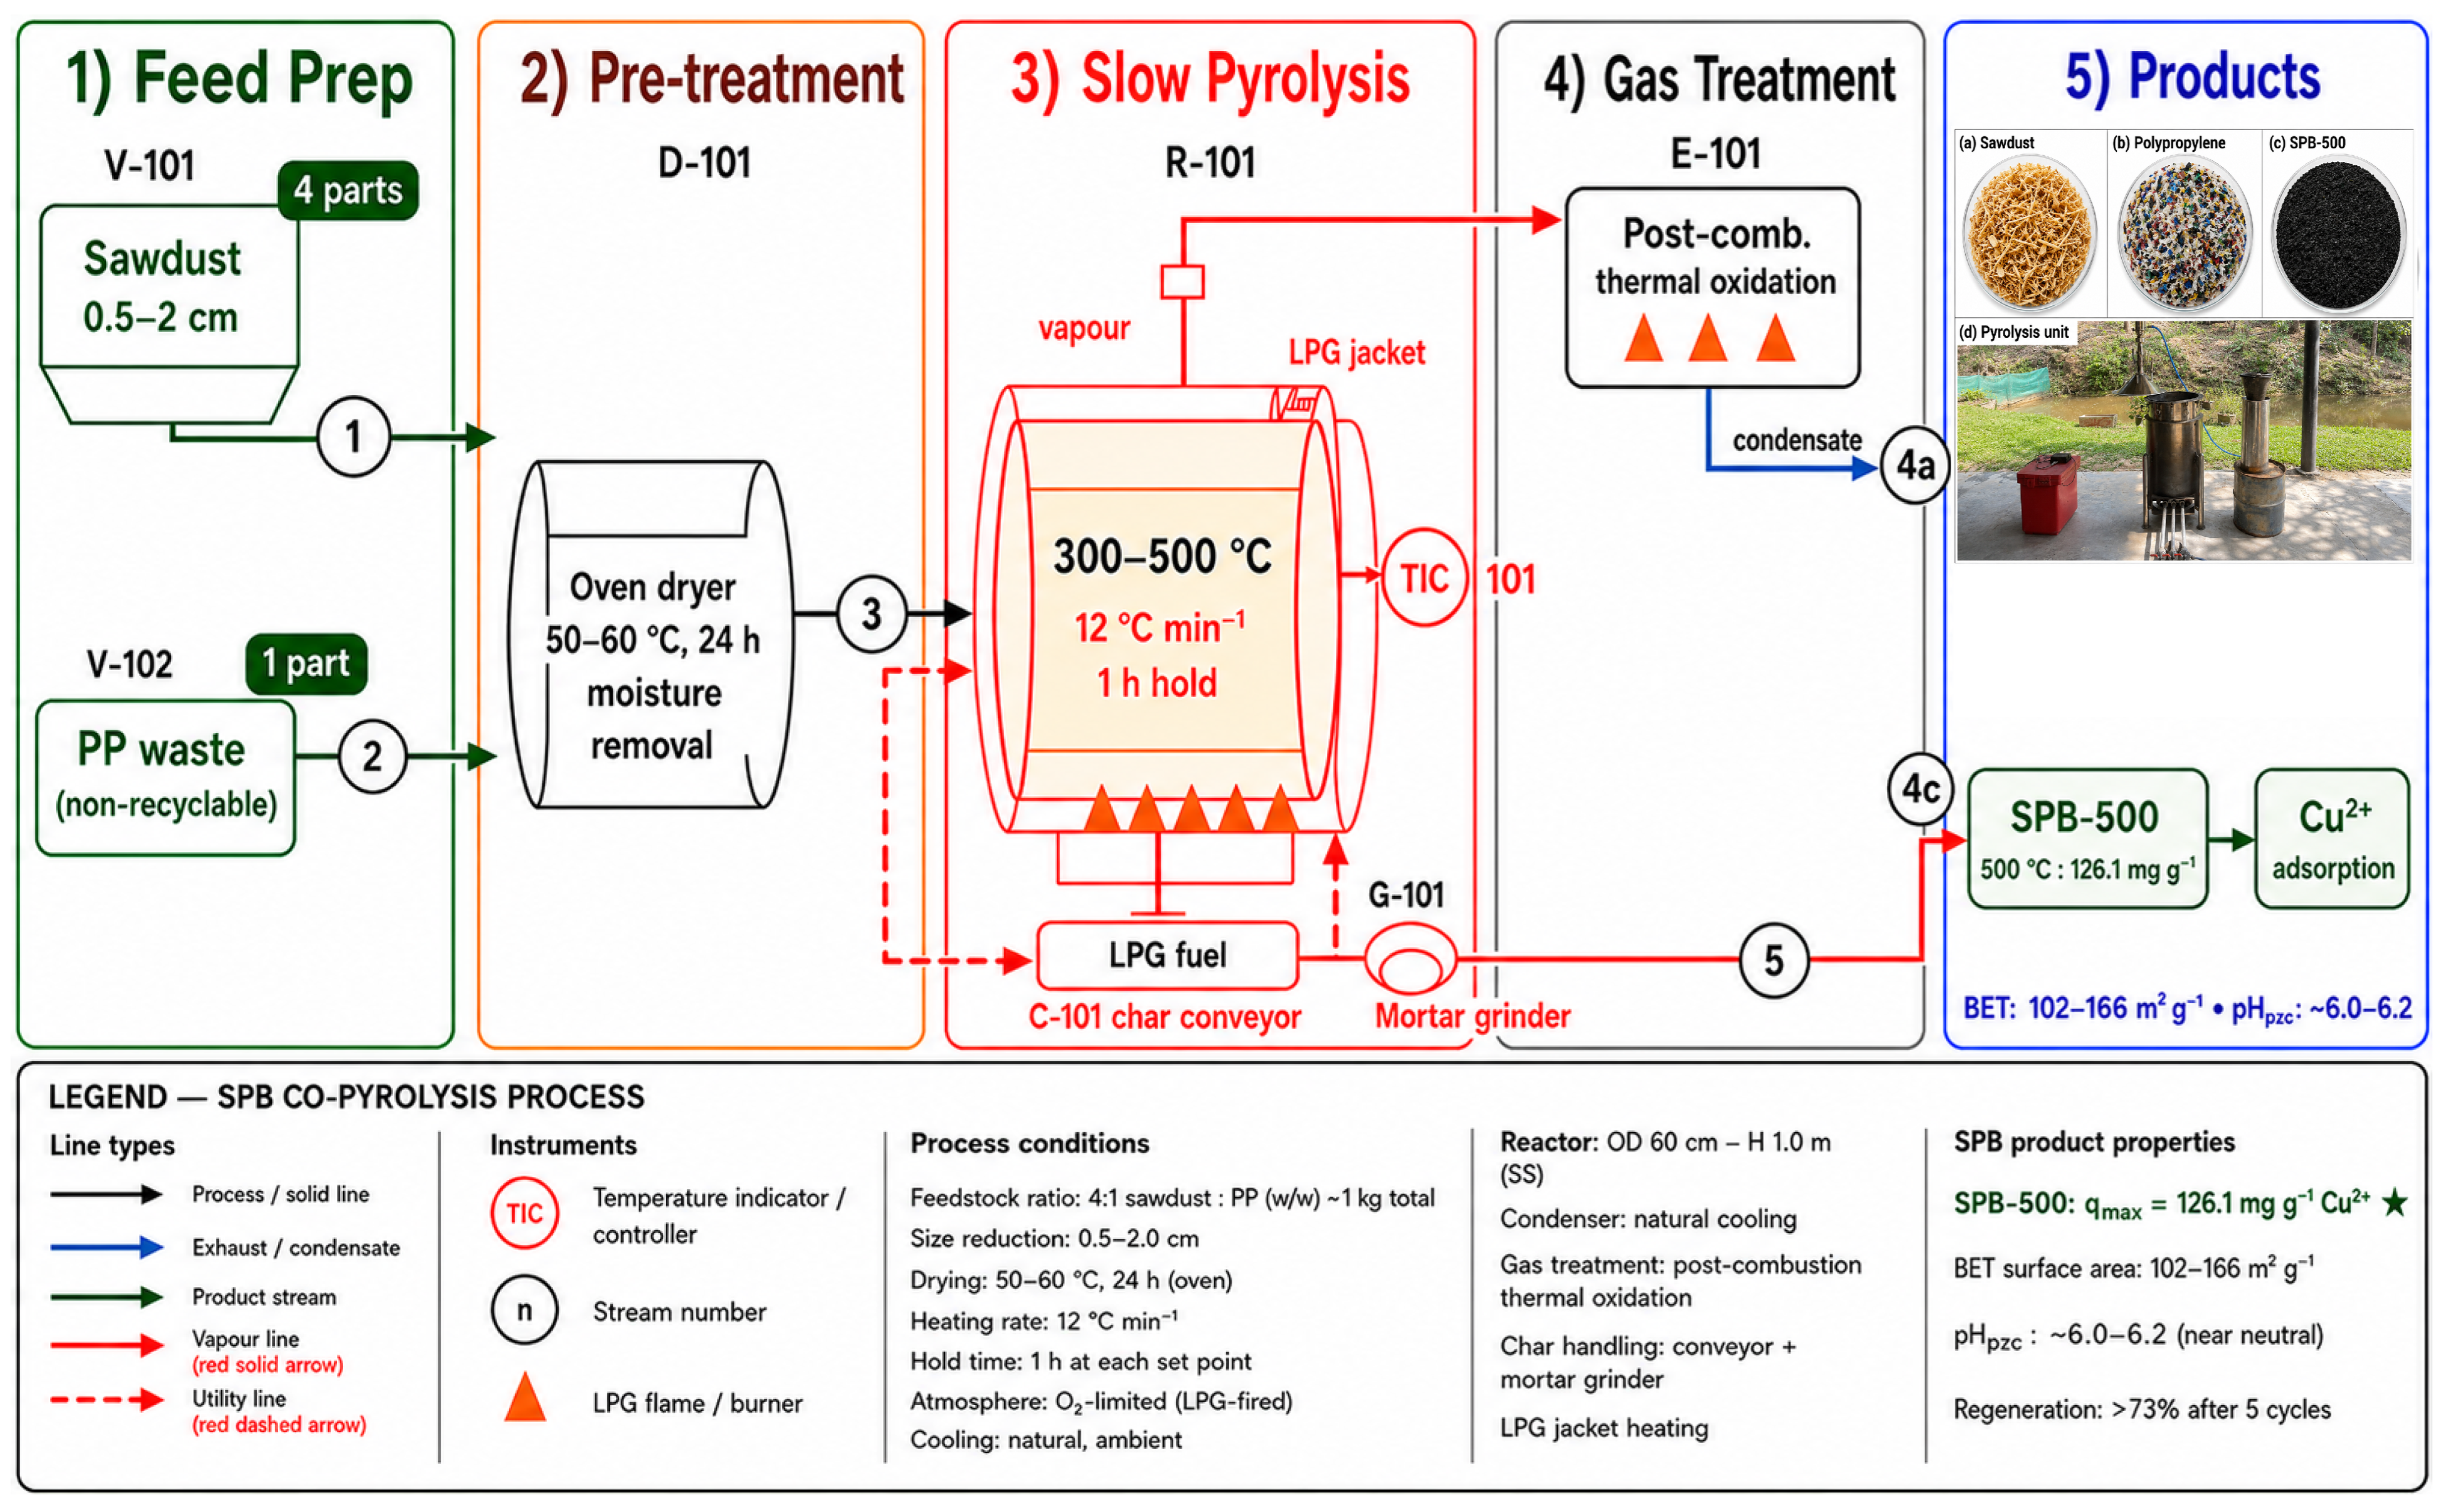
In this study, the adsorption effectiveness of SPB-500, including adsorption isotherms, kinetics, thermodynamics, pH effects, regeneration performance, and Cu2+ removal efficiency, has been comprehensively investigated in our previous study and is therefore not repeated here. The present work builds upon those experimentally validated adsorption results and focuses on the techno-economic, environmental screening, and SROI assessment of SPB-500 production and implementation [25,26]. The current research, however, focuses more on the sustainability issues that will arise from producing and utilizing SPB-500 technology in a community-level setting. The pyrolysis system processes (Figure 1) a mixed feedstock composed of sawdust and non-recyclable post-consumer polypropylene (PP) plastic waste at a weight ratio of 4:1, corresponding to a total daily feed input of 1 kg (800 g of sawdust and 200 g of PP waste). The pyrolysis reactor is operated under uniform conditions at a fixed temperature of 500 °C, which has been identified as suitable for producing high-quality biochar. All experimental, economic, and environmental assessments in this study were based exclusively on the LPG-fired configuration used during reactor operation; alternative heating fuels were not evaluated. The mass ratio of sawdust to polypropylene was established as 4:1 (w/w) based on synergy effects reported in the literature when pyrolyzing these waste materials together, as well as their availability in the geographical region where the experiment took place. Sawdust was used as a dominant feedstock to produce maximum biochar, whereas the purpose of including hydrogen-containing polypropylene was to enhance the carbonization process of sawdust. The pyrolysis temperature of 500 °C was selected considering previous works that have revealed better surface area, porosity, carbon, and adsorption abilities when compared to lower temperatures. Therefore, the aforementioned conditions were chosen considering the literature findings, the availability of feedstocks, and the desired characteristics of SPB-500.
This projection of a production capacity of 1200 kg SPB-500 yr−1 from the techno-economic analysis is a representation of a simplified economic scaling study and cannot be assumed as the proven production capacity of the reactor tested at a laboratory scale within this study. The feasibility analysis for reactor capacity, batch time cycle, drying capacity, labor capacity, equipment utilization, maintenance, and other parameters was outside the purview of this project. Therefore, the production capacity projected here needs to be taken as a tentative figure and confirmed by actual pilot-scale studies in the future.

2.1. Economic Analysis of SPB Production

An economic analysis was conducted to evaluate the production cost of the sawdust–polypropylene biochar (SPB) adsorbent and to benchmark its cost-effectiveness against commercially available adsorbents for heavy-metal removal. The analysis encompassed capital expenditure (CAPEX) for reactor fabrication, operating expenditure (OPEX) per production batch, and a simplified payback assessment at modest scale-up. All cost estimates are expressed in Thai Baht (THB) and United States Dollars (USD), using a reference exchange rate of 35.8 THB per USD (Bank of Thailand current rate 2024 average).

2.1.1. Capital Expenditure (CAPEX)

The capital cost of the SPB production system was estimated based on the locally fabricated but nevertheless continuous locally fabricated batch slow pyrolysis reactor described in Section 2.1. The reactor was designed as a laboratory-scale prototype for experimental validation and economic screening rather than as a fully engineered commercial system. Therefore, engineering parameters such as maximum reactor loading, effective working volume, batch cycle duration, daily throughput, burner efficiency, heat duty, and heat losses were beyond the scope of the present study and should be established through future pilot-scale engineering design and validation. The total estimated CAPEX is summarized in Table 1.

2.1.2. Operating Expenditure (OPEX) per Production Batch

The operating cost per batch was estimated based on the actual experimental conditions reported of 1 kg total feedstock (800 g sawdust and 200 g PP waste, 4:1 w/w), oven drying at 50–60 °C for 24 h, slow pyrolysis under LPG-fired heating at 12 °C min−1 to 300–500 °C with a 1 h hold period at each target temperature, followed by natural cooling. The resulting batch OPEX and cost per kilogram of SPB produced are presented in Table 2.

2.1.3. Simplified Payback Analysis

A simplified payback analysis was performed for a community-scale production case with an annual SPB-500 production rate of 1200 kg year−1 (100 kg month−1). This analysis was done using the experimental cost of SPB-500 production per-unit weight as described in Table 2 (316 THB kg−1 SPB-500) and resulted in an annual operational expenditure (OPEX) estimate of 379,200 THB year−1. Using a relatively conservative price of 40 USD kg−1 (~1432 THB kg−1), the annual revenue from production of SPB-500 was estimated to be about 1,718,400 THB year−1. This leads to an annual net operating profit of ~1,339,200 THB year−1 after accounting for the operational cost. Capital investment expenditure (CAPEX) necessary for the locally constructed SPB-500 production system was assumed at 46,000 THB (1286 USD). With this set of parameters, the simple payback period could be estimated through
Annual OPEX = Unit production cost × Annual production capacity
Annual revenue = Selling price × Annual production capacity
Annual operating surplus = Annual revenue − Annual OPEX
Payback period = CAPEX/Annual net operating surplus
It resulted in a payback period of ~0.034 year (≈0.4 months). This good performance can be largely credited to the use of waste materials in the SPB-500 synthesis as a low-cost raw material feedstock, low equipment investment compared to commercial GAC production facilities, and lack of any chemical treatments during the processing. Also, the estimated production cost of SPB-500 appears significantly lower than the current market prices of both commercial GAC and PAC. The comparison carried out in this paper regarding commercial GAC and PAC is mainly based on factors including production cost, price in the market, and environmentally related screening parameters. This does not imply that the two can be considered as substitutes to each other based on performance equivalence because there could be great variability in adsorption capacities, breakthrough characteristics, regeneration efficiency, life cycle, and performance in water treatment. An evaluation based on function units like cost or environment per pound of pollutant eliminated would be a better choice in future studies. It must be pointed out, however, that the above payback analysis constitutes only a preliminary screening-level economic evaluation made with respect to the current laboratory-scale production data and a hypothetical annual production volume. A detailed engineering-economic evaluation with consideration of reactor utilization and batching scheduling, labor efficiency and maintenance cost, raw material sourcing and equipment availability, process scale-up, etc., is recommended prior to commercial implementation.

2.2. Simplified Environmental Screening Assessment of SPB Production

2.2.1. Goal and Scope Definition

The goal of this environmental screening assessment is to evaluate the environmental performance of the SPB co-pyrolysis production system relative to commercially produced activated carbon using selected environmental indicators and literature-based benchmarking. The scope is gate-to-gate (as shown in Table 3), spanning from the point of feedstock receipt at the production site to the point of finished SPB adsorbent ready for use. End-of-life (EOL) stages including spent adsorbent regeneration and disposal and upstream background processes (feedstock cultivation, transportation to site) are excluded from the system boundary in this screening assessment, as site-specific inventory data for these stages were not available.

2.2.2. Life Cycle Inventory (LCI)

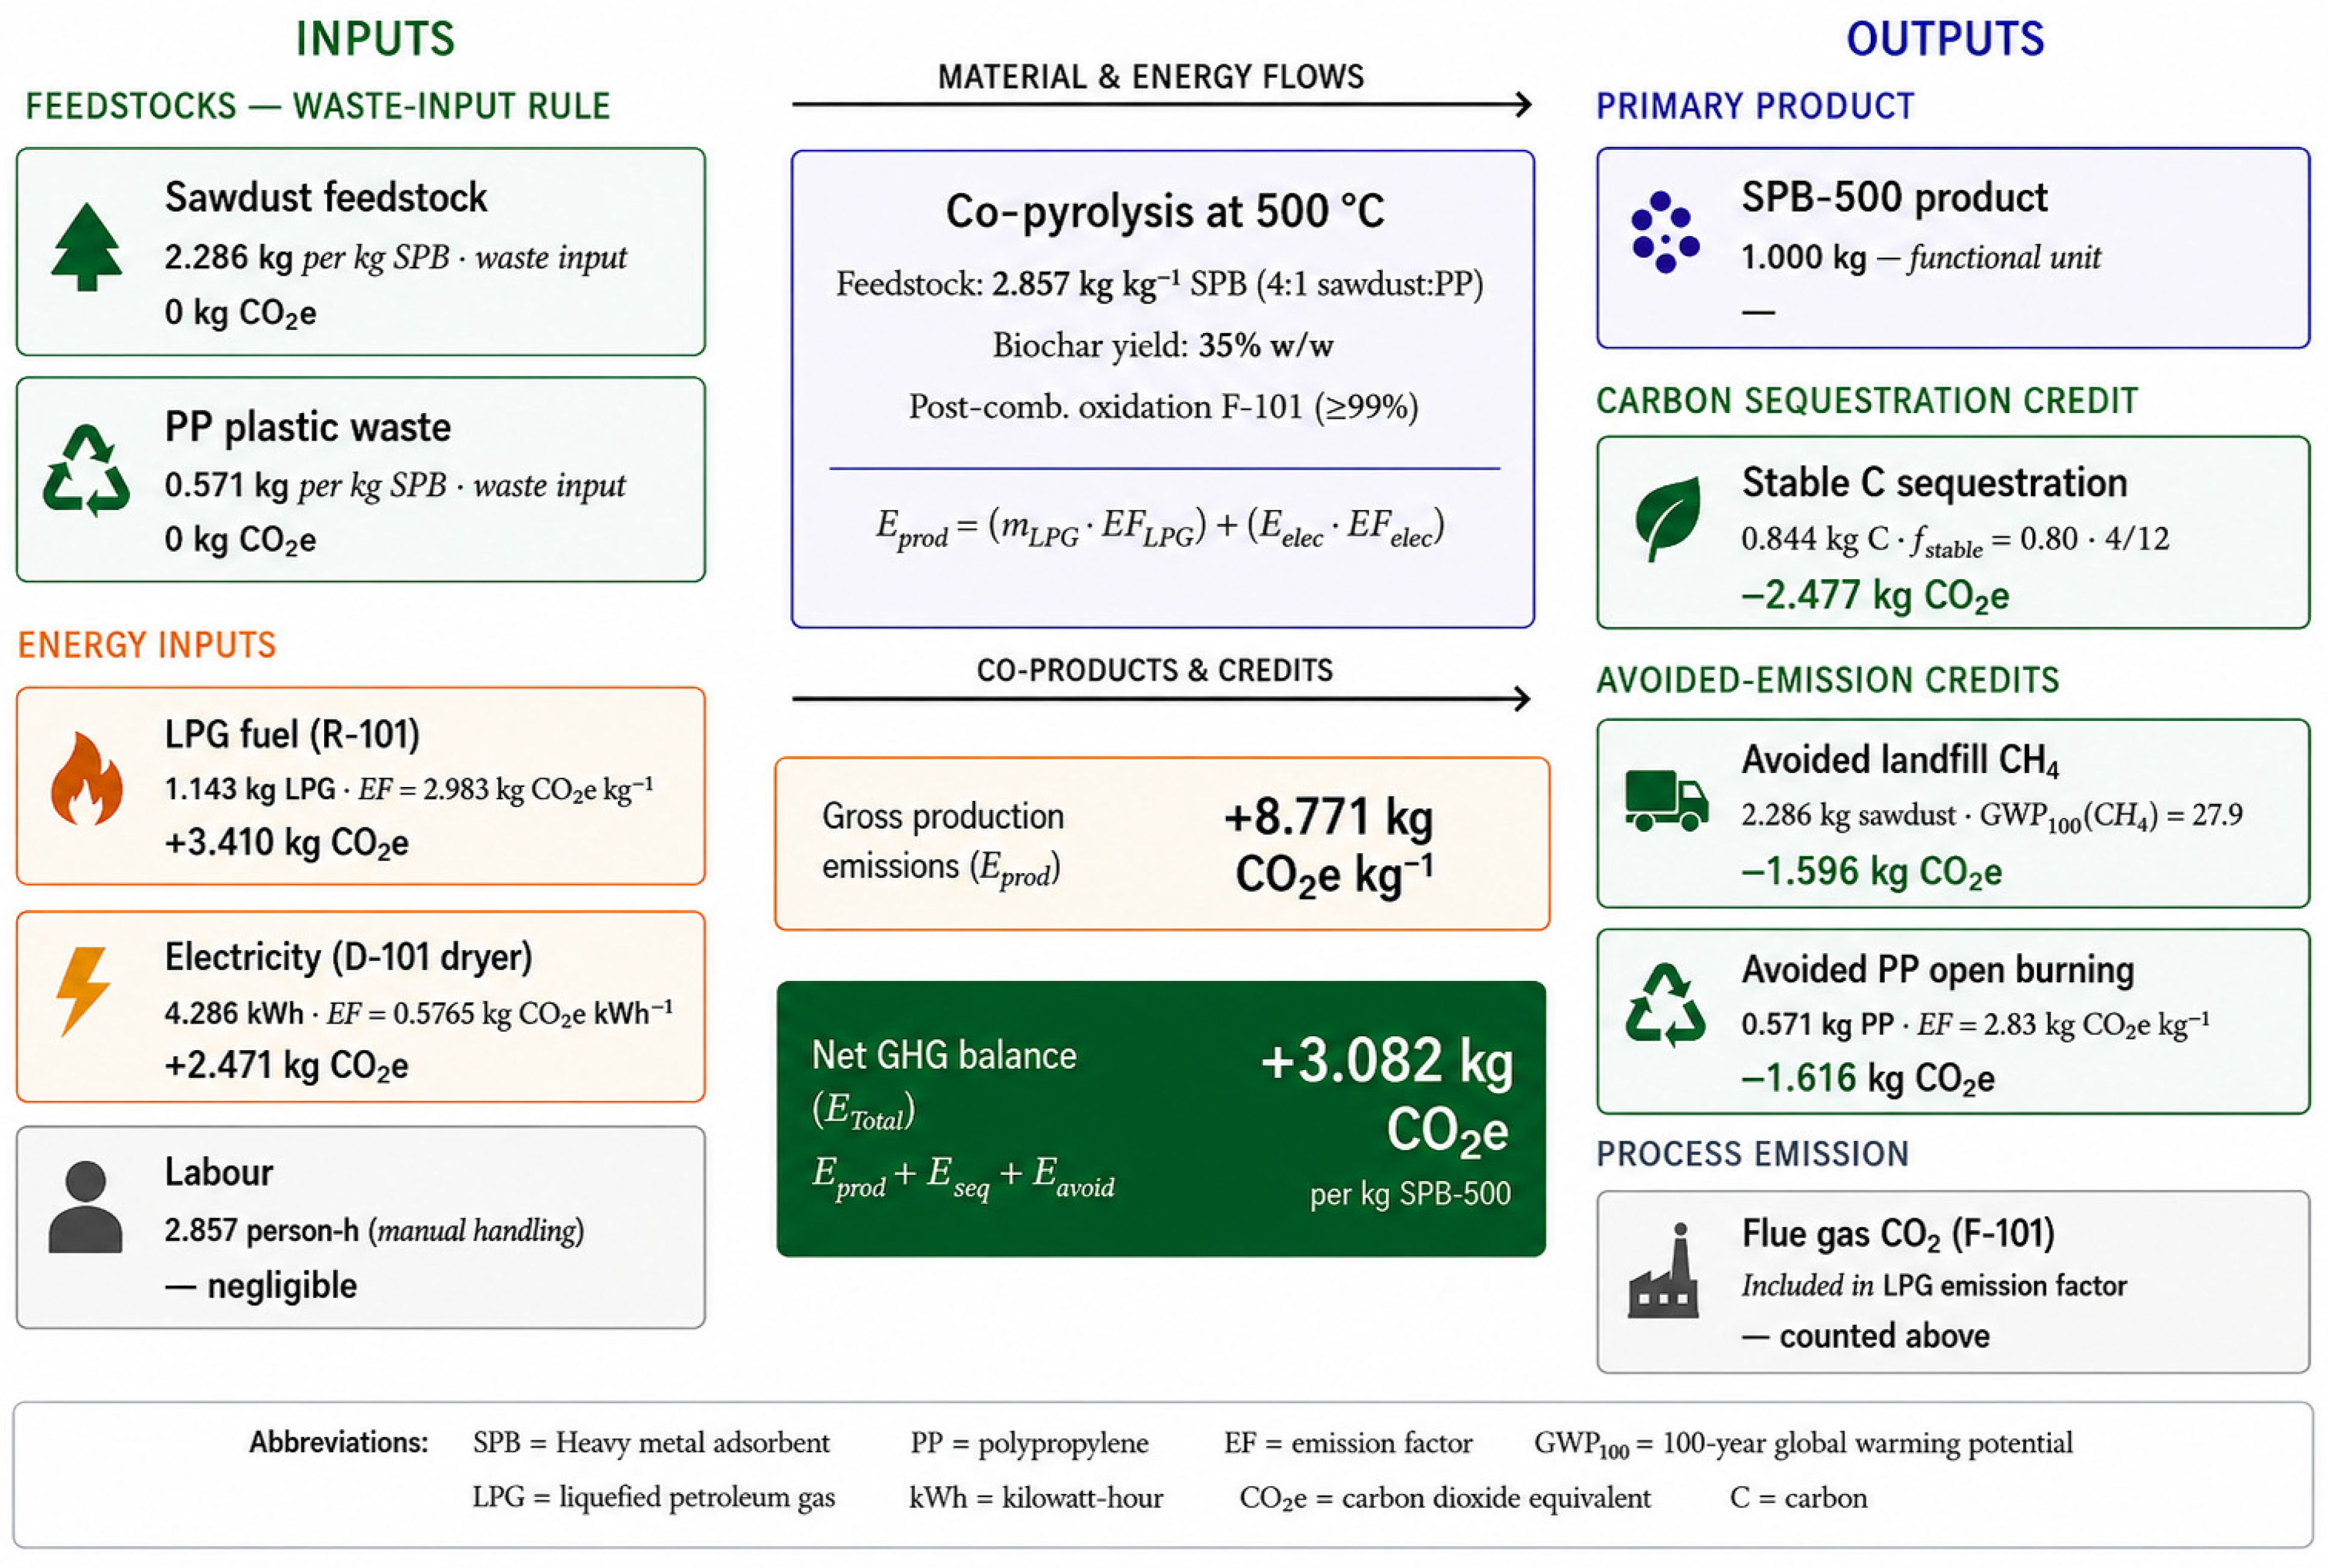
The life cycle inventory was constructed using primary process data derived from the co-pyrolysis system described in Section 2.1 and shown in Table 4, Table 5 and Table 6 and Figure 2, with supplementary cost and mass-balance information drawn from the accompanying economic analysis, and all inventory flows expressed per functional unit of 1 kg SPB-500 produced on the basis of a 35% w/w biochar yield at 500 °C. As tabulated in Table 4, Table 5 and Table 6, LCI per functional unit confirms gross gate-to-gate production emissions of +8.771 kg CO2e kg−1 SPB-500. A separate consequential waste-diversion scenario was subsequently evaluated to estimate the potential effects of carbon sequestration and avoided-disposal emissions on the overall greenhouse-gas balance and allocation assumptions.

2.3. CO2 Emission Assessment of SPB Co-Pyrolysis Production

A quantitative CO2 emission assessment was conducted for the production of SPB at 500 °C to characterize both the gross greenhouse-gas (GHG) emissions attributable to the production process and the net carbon balance when stable carbon sequestration within the biochar product and avoided emissions arising from waste stream diversion are evaluated separately as a consequential waste-diversion scenario and are not included in the attributional gate-to-gate system boundary. All emission calculations are expressed per kilogram of SPB produced as the functional unit, maintaining consistency with the environmental screening framework established in Section 2.2. Emission factors were sourced exclusively from internationally recognized and peer-reviewed databases, specifically the IPCC 2006 Guidelines for National Greenhouse-Gas Inventories, the IPCC Sixth Assessment Report (AR6, 2021) [29], and the Thailand Greenhouse-Gas Management Organization (TGO, 2022) [30] national grid emission factor. Primary process data from Section 2.1 are applied throughout all calculations. The emission factors and their respective sources adopted in this assessment are summarized in Table 7.
The total CO2 emission per kg SPB produced (Etotal) is calculated as the algebraic sum of direct production emissions (Eprod), stable carbon sequestration credits (Eseq), and avoided waste disposal emission credits (Eavoid):
Etotal = Eprod + Eseq + Eavoid
Eprod = (mLPG × EFLPG) + (Eelec × EFelec) + Epost
Eseq = −(C%SPB × mSPB × fstable × EFCseq)
Eavoid = −(msaw × EFsaw) − (mPP × EFPP)
where mLPG refers to the amount of LPG used per kg of SPB (kg LPG per kg SPB); Eelec refers to the electricity used per kg of SPB (kWh per kg SPB); C%SPB refers to the carbon content of the SPB product in a mass fraction determined by CHNS analysis (84.43%); mSPB = 1 kg per functional unit; fstable refers to the IBI carbon stability factor, which is 0.80; EFCseq refers to −3.667 kg CO2e per kg C; msaw refers to the amount of sawdust used per kg of SPB (kg per kg SPB); mPP refers to the amount of PP used per kg of SPB (kg per kg SPB); Epost represents the greenhouse-gas emissions associated with the post-combustion of pyrolysis vapors, gases, and bio-oil generated during the co-pyrolysis process.
The carbon balancing results depend on the following assumptions regarding the stability of carbon stored in biochar, the reduction in the emissions from landfills by diverting the sawdust waste stream, and the prevention of any emissions that might arise due to the open burning of polypropylene waste. Therefore, the credits earned are more appropriately viewed as scenario projections and not actual results. The gross production emissions (Eprod) represent attributional gate-to-gate emissions associated with SPB-500 production. In contrast, Eseq and Eavoid represent consequential credits associated with long-term carbon retention and hypothetical waste-diversion scenarios. Therefore, the reported hybrid scenario-based net greenhouse-gas balance should be interpreted as a hybrid screening indicator rather than a strictly attributional gate-to-gate LCA result. Furthermore, the carbon-retention credit reported in this study assumes environmentally sound end-of-life (EOL) management capable of preserving long-term carbon storage. No specific EOL pathway, such as regeneration, heavy-metal stabilization, landfill disposal, incineration, or beneficial reuse of spent Cu-loaded SPB-500, was explicitly modeled in this screening assessment. Consequently, the reported carbon-retention credit should be interpreted as a scenario-based estimate rather than a demonstrated environmental outcome. Future cradle-to-grave life cycle assessments should evaluate alternative EOL management strategies and their influence on carbon retention, heavy-metal stabilization, and overall environmental performance.

2.4. Social Return on Investment (SROI) Analysis

An SROI analysis was carried out according to the SROI Network principles to quantify the social, environmental, and economic co-benefits that are generated by the SPB project apart from its direct economic effects. The analysis adopts a forward-looking evaluative perspective applied to a community-scale deployment scenario in rural Chaiyaphum Province, with all values reported in THB and USD (35.8 THB USD−1; Bank of Thailand, 2024) [31] and discounted at 5% per annum over a five-year horizon. The SROI boundary encompasses one decentralized SPB production and water treatment facility (1200 kg SPB year−1; 10 m3 month−1) serving 50 rural households. Key assumptions include the following: (i) SPB-500 achieves up to approximately 90% heavy-metal removal under the experimental operating conditions (adsorbent dosage of 1 g per 100 mL and inlet Cu2+ concentrations up to 200 mg L−1); (ii) five regeneration cycles maintaining ≥73% removal efficiency; (iii) without the project, contaminated wastewater would be discharged to adjacent waterways; (iv) sawdust and PP waste would otherwise be openly burned and landfill-disposed, respectively; and (v) two full-time equivalent positions are generated over the operational period. Since the outcomes of SROI are based on various assumptions regarding attribution, deadweight, displacement, drop-off, and the monetization of proxy measures for the social value, sensitivity analyses have been undertaken to examine the validity of the computed SROI ratio under different assumptions. Therefore, the SROI numbers are not directly observed but are to be considered approximations of the SROI ratios. However, financial proxies and assumptions used in assessing deadweight, attribution, displacement, and drop-off effects were mainly sourced from academic literature, readily available economic information, and scenario-based analysis. The analysis did not consider any data gathered through social impact assessment or stakeholders’ opinions or even information from the local authorities. For this reason, the calculated SROI figures are expected to be scenario-based figures, but not actual social impacts.
For benchmarking, the main benchmark chosen for this study involves the use of commercial-activated carbon (GAC/PAC) as SPB-500 was designed specifically to be an affordable adsorbent meant to replace commercial adsorption products for the purpose of removing heavy metals. Thus, all economic and environmental comparisons will be made against commercially viable products. Furthermore, comparisons were made through the literature based on biomass pyrolysis and biomass-plastic pyrolysis biochar.

3. Results and Discussion

3.1. Capital Expenditure and Operating Expenditure and Production Cost per Kilogram

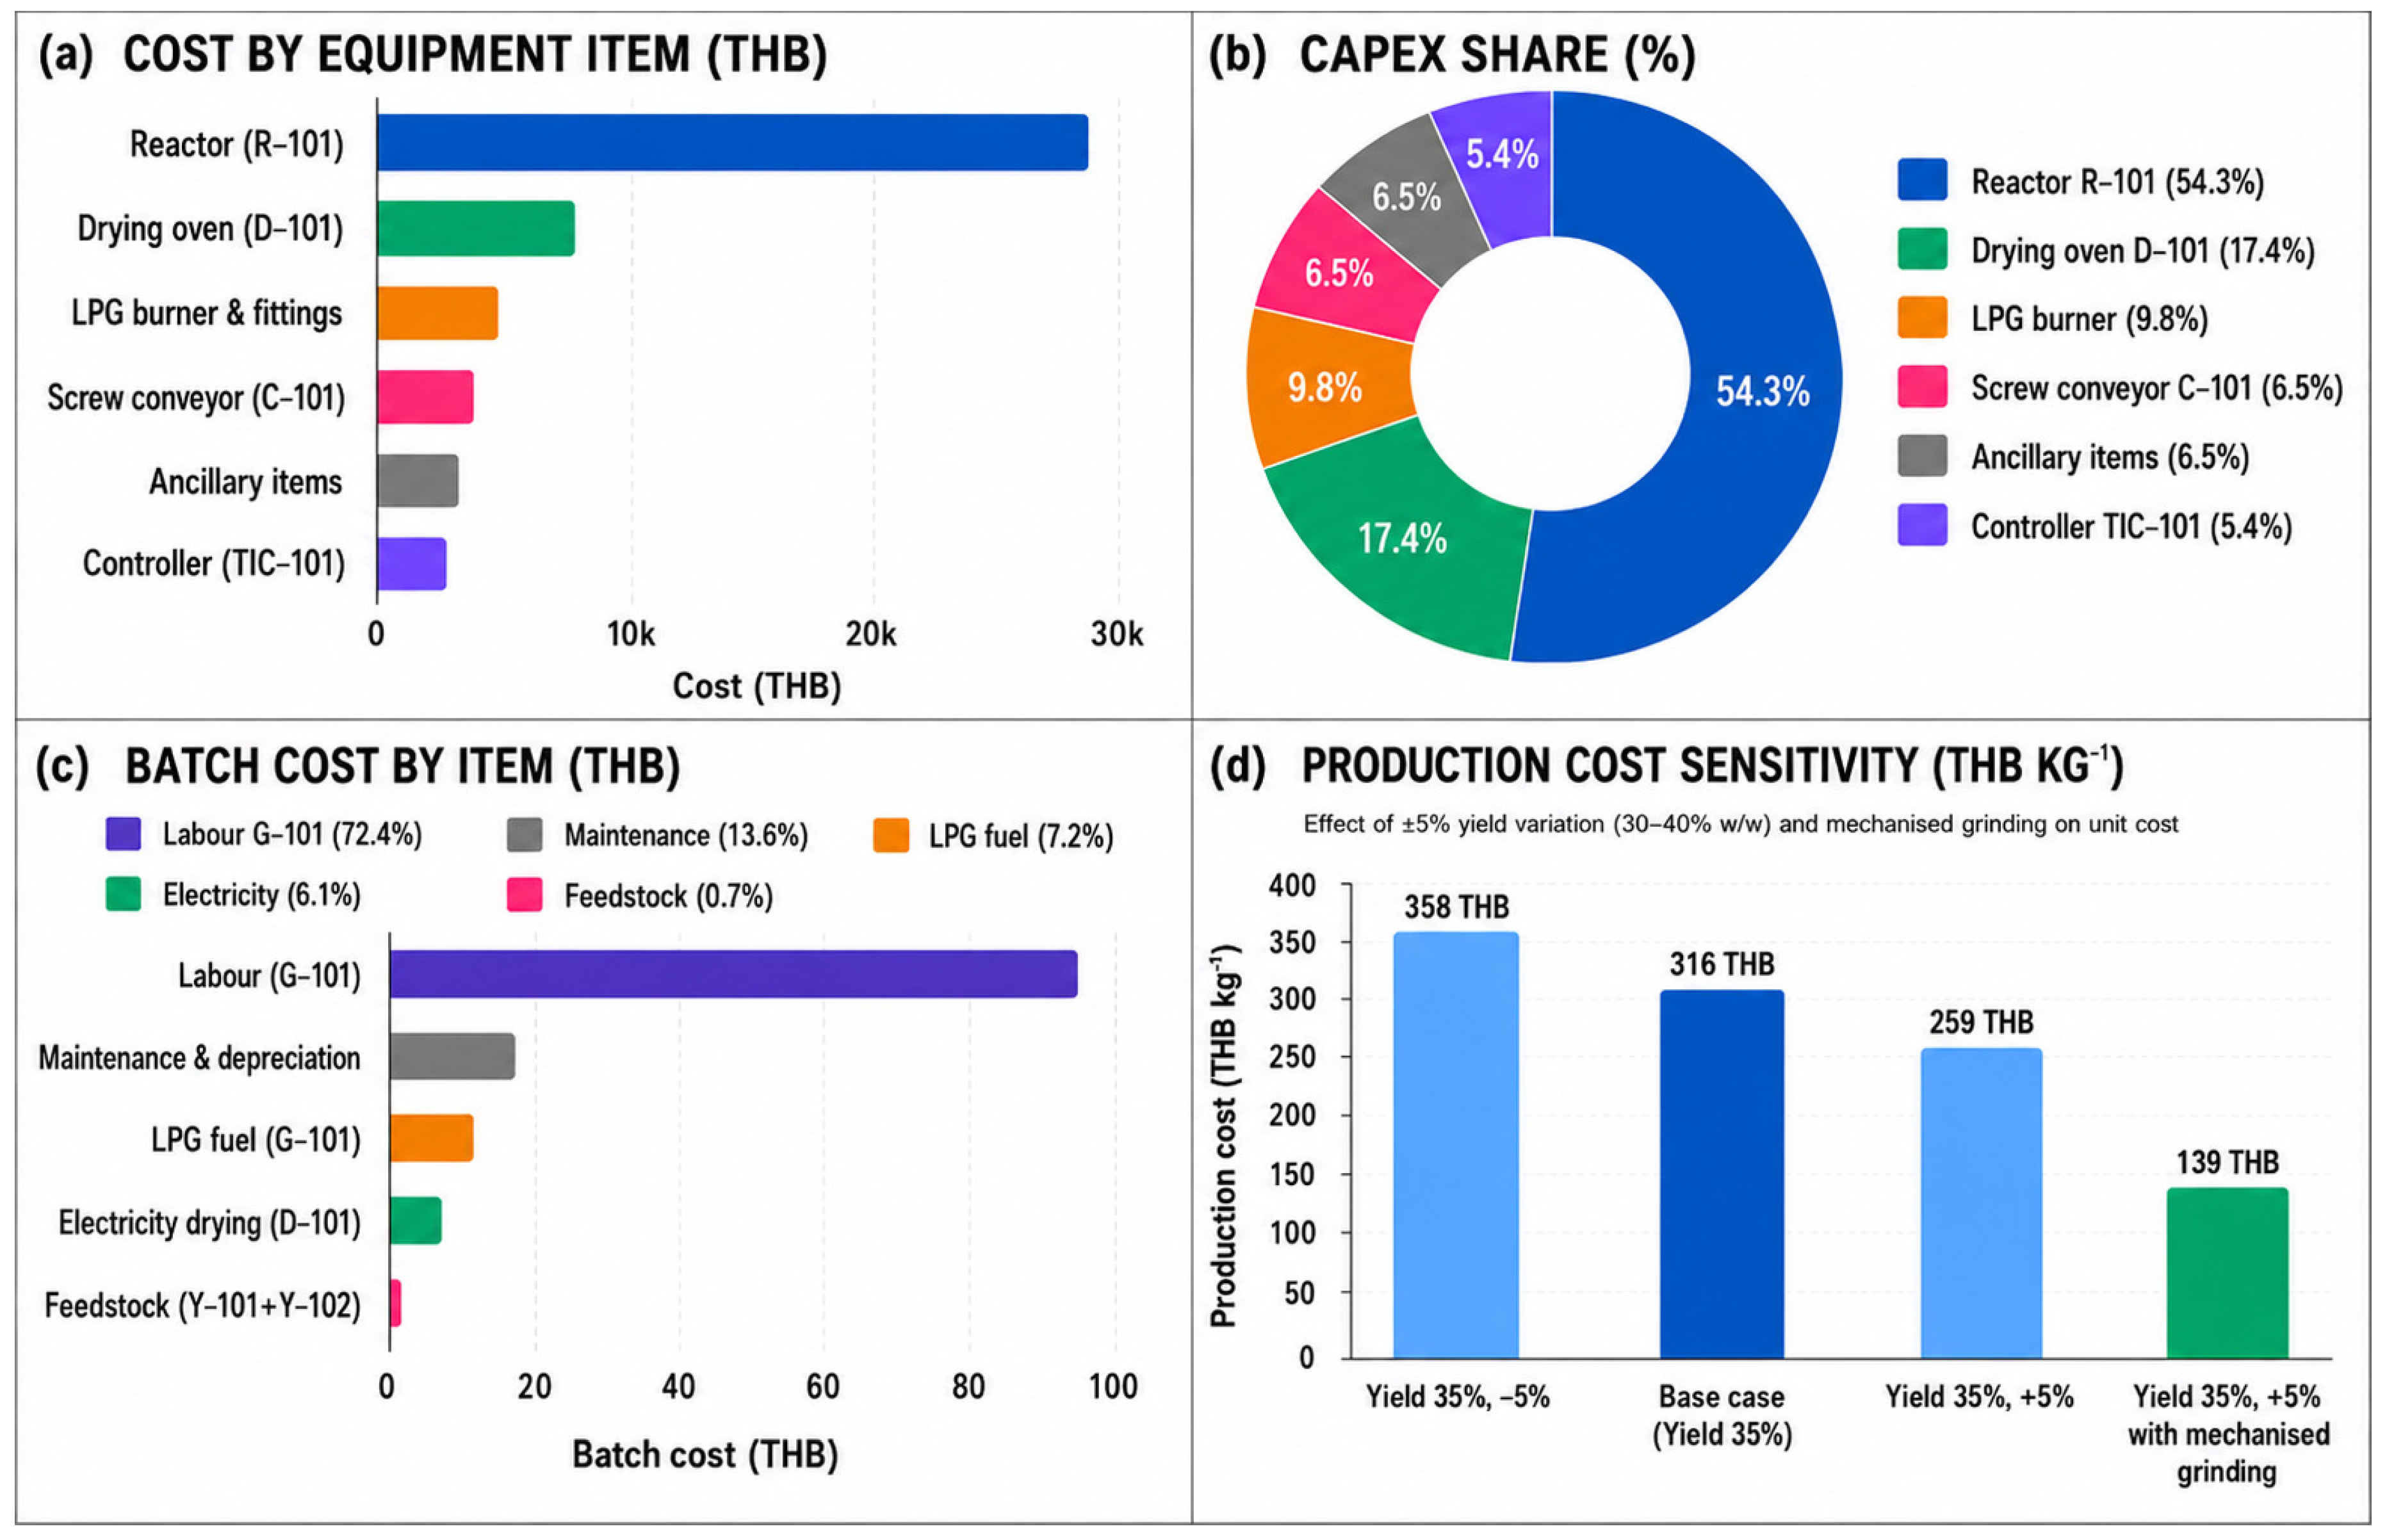
Capital expenditure (CAPEX) for the fabricated local SPB co-pyrolysis plant was 46,000 THB (1286 USD) in which the SS-based pyrolysis reactor was the highest component (54.3%) of the expense, followed by the drying unit, the LPG burner, and other components (Figure 3a,b). Capital costs were reduced by 15–400 folds when compared to existing industrial pyrolysis processes due to the application of locally available components coupled with LPG technology. When all other civil expenses have been considered, the estimate of CAPEX is not high even when taking into account the regulations (i.e., 60,000 THB, 1676 USD). Operating expenditure (OPEX) per batch was 110.55 THB (3.09 USD) for producing a biochar batch at 35%, resulting in a cost per kilogram of 316 THB/kg (8.8 USD/kg). Labor was the biggest OPEX (72.4%) followed by maintenance, LPG consumption, and electrical power consumption, whereas no expenses were considered for the cost of the raw materials due to their nature being waste materials (Figure 3c). With mechanization and automation for grinding process, cost could be reduced up to 130–160 THB/kg (3.6–4.5 USD/kg), with the utilization of syngas recycling as further potential for LPG substitution and OPEX saving. The sensitivity analysis considering the variation in yield of 5% produced a unit cost of production between 276 and 369 THB/kg (7.7–10.3 USD/kg).

3.2. Simple Payback Calculation, Circular Economy, and Waste-Valorization Benefits

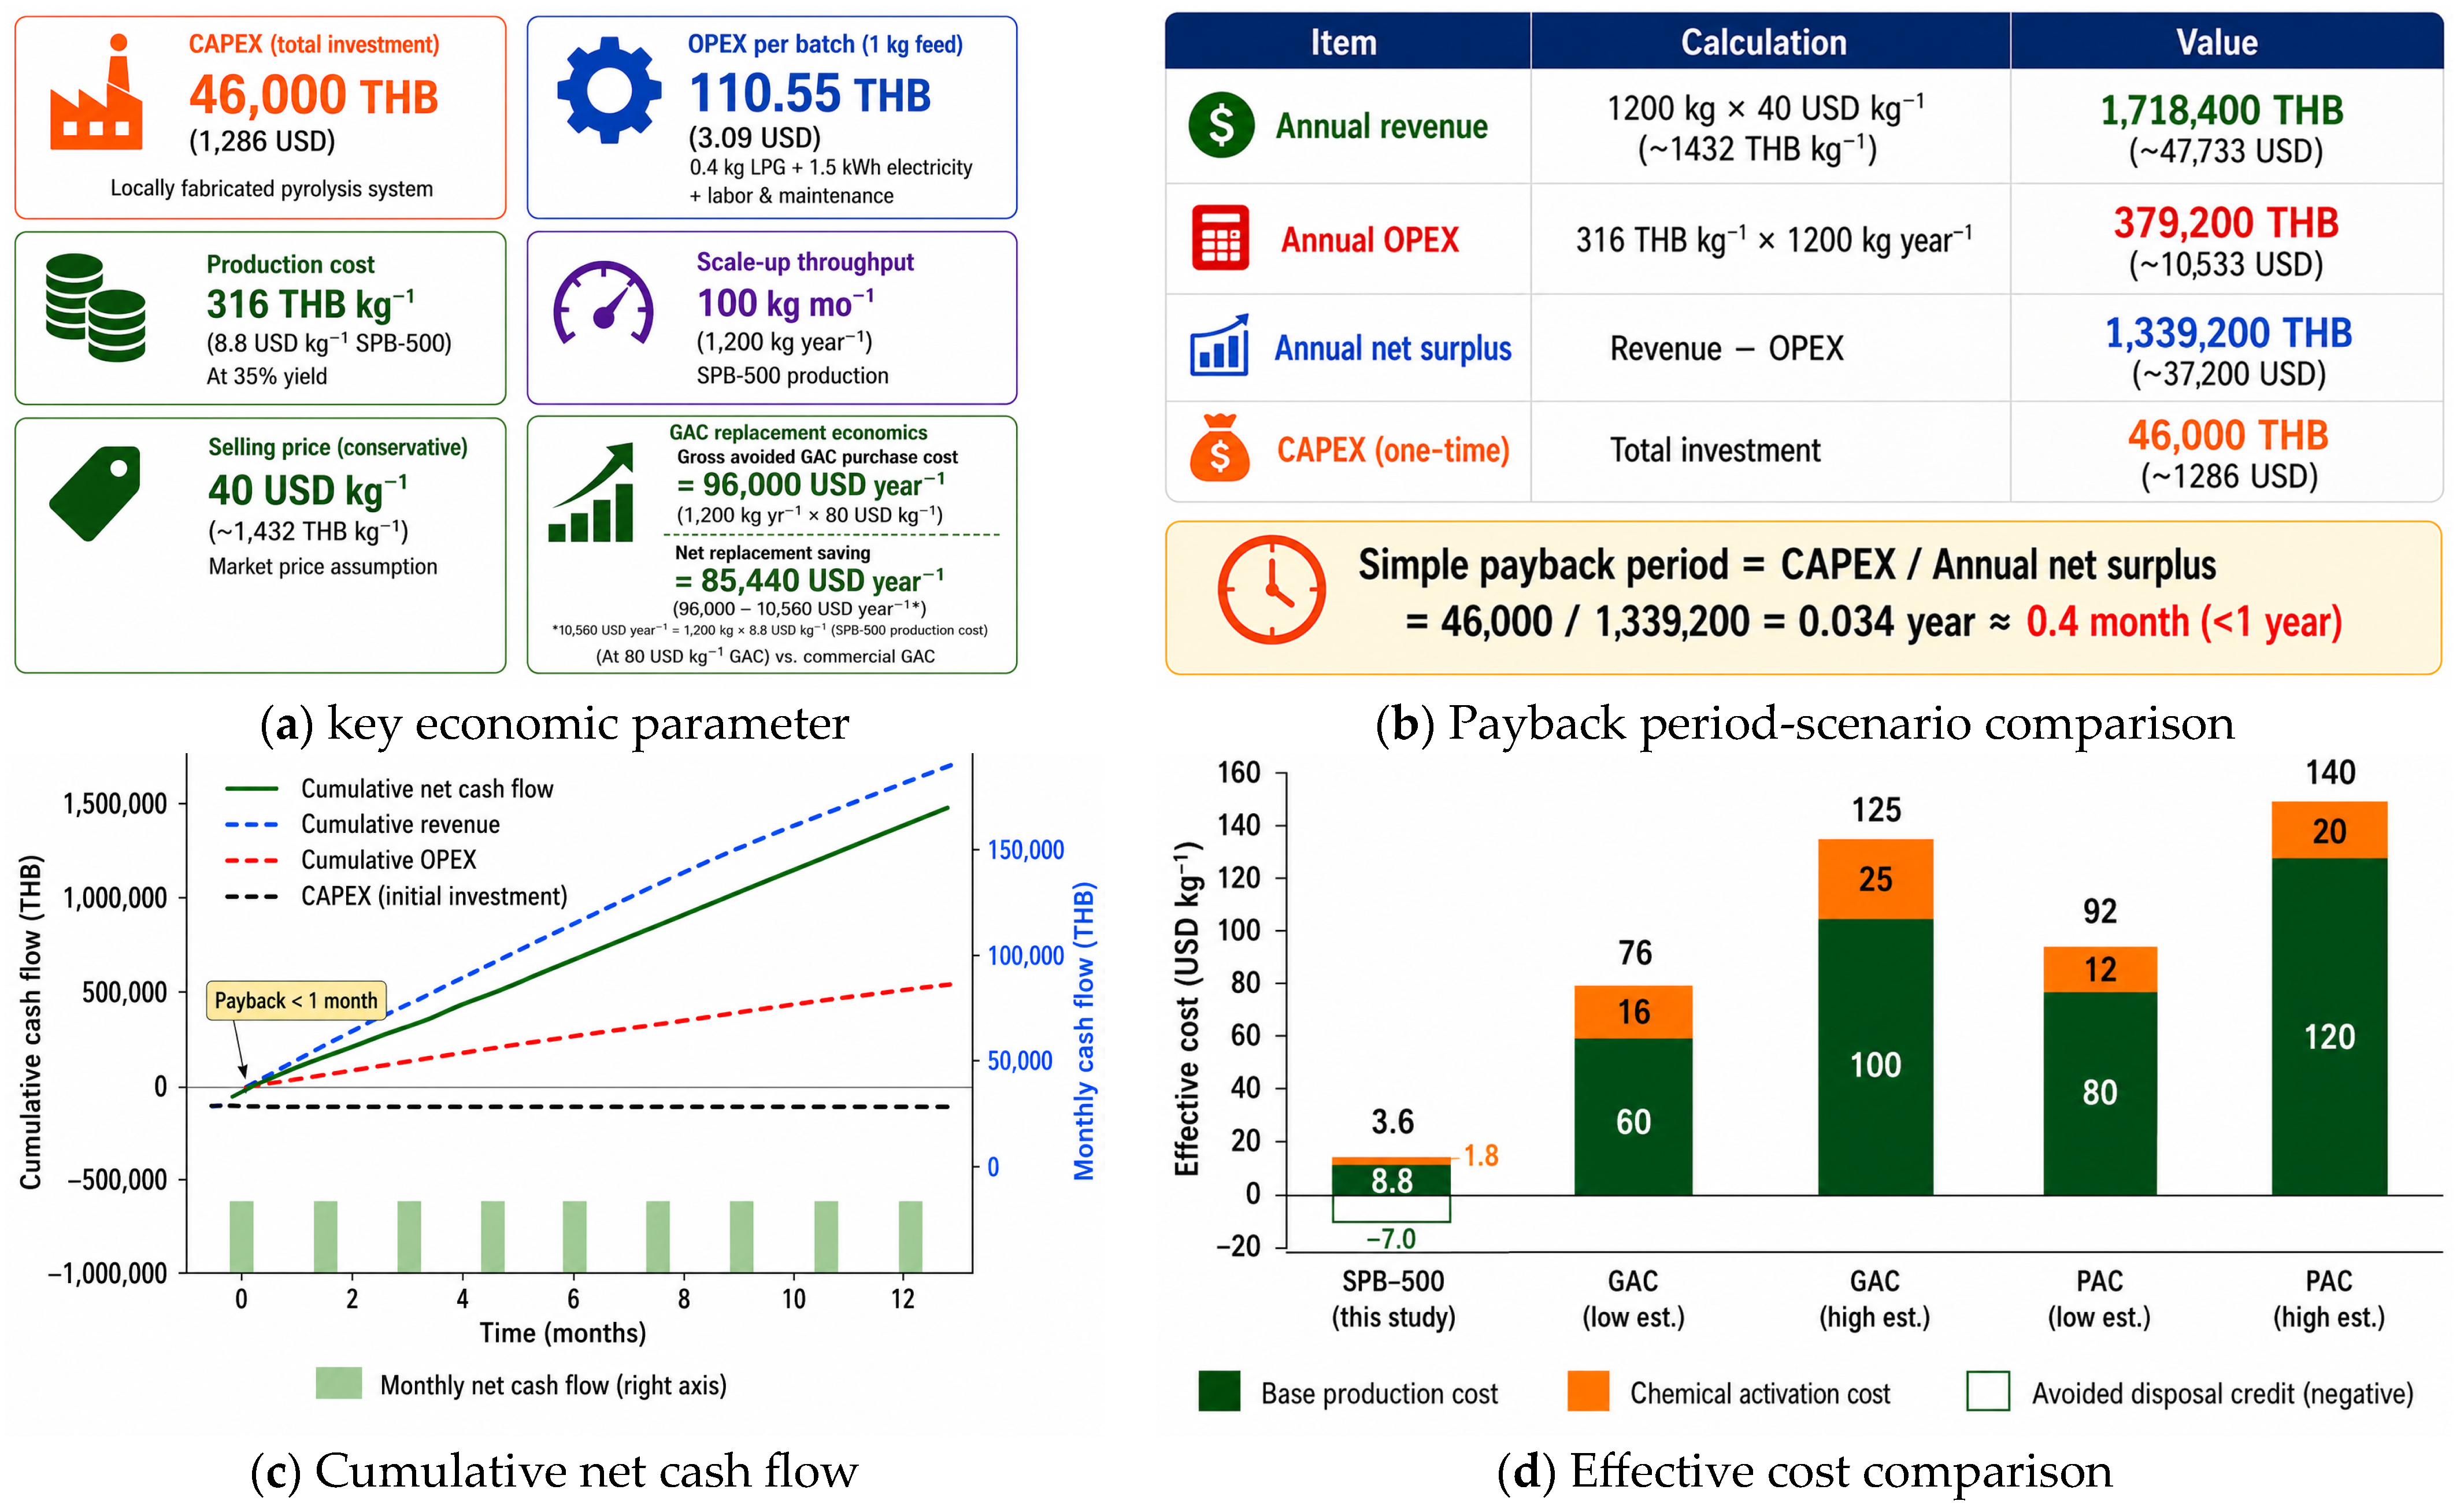
The economic feasibility of the proposed community-scale SPB-500 production plant was assessed based on the annual production capacity of 1200 kg (roughly 100 kg month−1). The main economic variables used in this study include CAPEX, OPEX, unit production cost, production capacity, selling price, and cost saving resulting from the reduced requirement for activated carbon. All these variables are briefly shown in Figure 4a. With respect to the calculated annual production cost of SPB-500 according to the results from the previous batch-scale experiment (316 THB kg−1 in Table 2), the annual amount of OPEX was estimated to be 379,200 THB year−1. According to a conservative estimation of the selling price of 40 USD kg−1 or about 1432 THB kg−1 for SPB-500 production, the projected annual income is expected to be 1,718,400 THB year−1. Thus, the annual net profit is estimated to be around 1,339,200 THB year−1. An extensive assessment of the annual economic parameters and payback period calculation is presented in Figure 4b. Considering the rather inexpensive CAPEX of about 46,000 THB for the locally developed pyrolysis reactor, the simple payback period can be assumed to be less than one year. This satisfactory performance is primarily due to the usage of cheap raw materials, less need for investment in the reactor, and the absence of chemical activation process in the commercial production of activated carbons. In addition, the cost of SPB-500 is notably cheaper compared to the prices of GAC and PAC available in the market. The relatively cost-effective production of SPB-500, GAC, and PAC are illustrated in Figure 4d. In order to conduct long-term financial feasibility of the proposed system, a cumulative cash flow analysis was performed for the first 12 months of operation. As seen from Figure 4c, the revenue grows gradually in time, whereas operating costs are rather low, leading to rapid positive cash flow and payback of the initial investment even within the first month. In other words, the obtained results show promise in terms of potential economic advantages of SPB-500 production in communities. Under the in-house use case, SPB-500 could replace commercial-grade granular-activated carbon (GAC) to some extent in applications for heavy-metal adsorption. Based on the annual adsorbent consumption rate of 1200 kg year−1 and considering a typical price of GAC at 80 USD kg−1, the total savings due to avoiding purchase of the adsorbent could amount to 96,000 USD year−1 gross. Nevertheless, with the expected production cost of SPB-500 of 8.8 USD kg−1, the annual production costs would be 10,560 USD year−1, thus leading to net savings of about 85,440 USD year−1.
It is important to stress here that this comparison is made based on cost per unit of mass production and not on adsorption efficiency per se. This implies that, since there might be variations in performance between SPB-500 and commercial-grade GAC, a one-to-one substitution cannot be performed without evaluating adsorption capacity, breakthrough curve performance during continuous flow, efficiency of regeneration, adsorbent lifetime, interaction with the matrix of real water, and costs per-unit mass of contaminants removed. However, it should be noted that this study only constitutes a preliminary economic assessment of the technology. Additional research should be done regarding scaling-up experiments with performance assessments and optimizations. In Figure 4d, therefore, the comparison should be interpreted as a preliminary economic and environmental benchmark rather than evidence of direct functional substitutability between SPB-500 and commercial-activated carbons.
It should be emphasized that the projected annual production capacity (1200 kg SPB-500 year−1), economic performance, and associated SROI results represent scenario-based screening estimates derived from a simplified community-scale deployment scenario. These results are intended to evaluate the potential feasibility of future implementation and should not be interpreted as experimentally demonstrated community-scale reactor performance.

3.3. Gross Gate-To-Gate Emissions

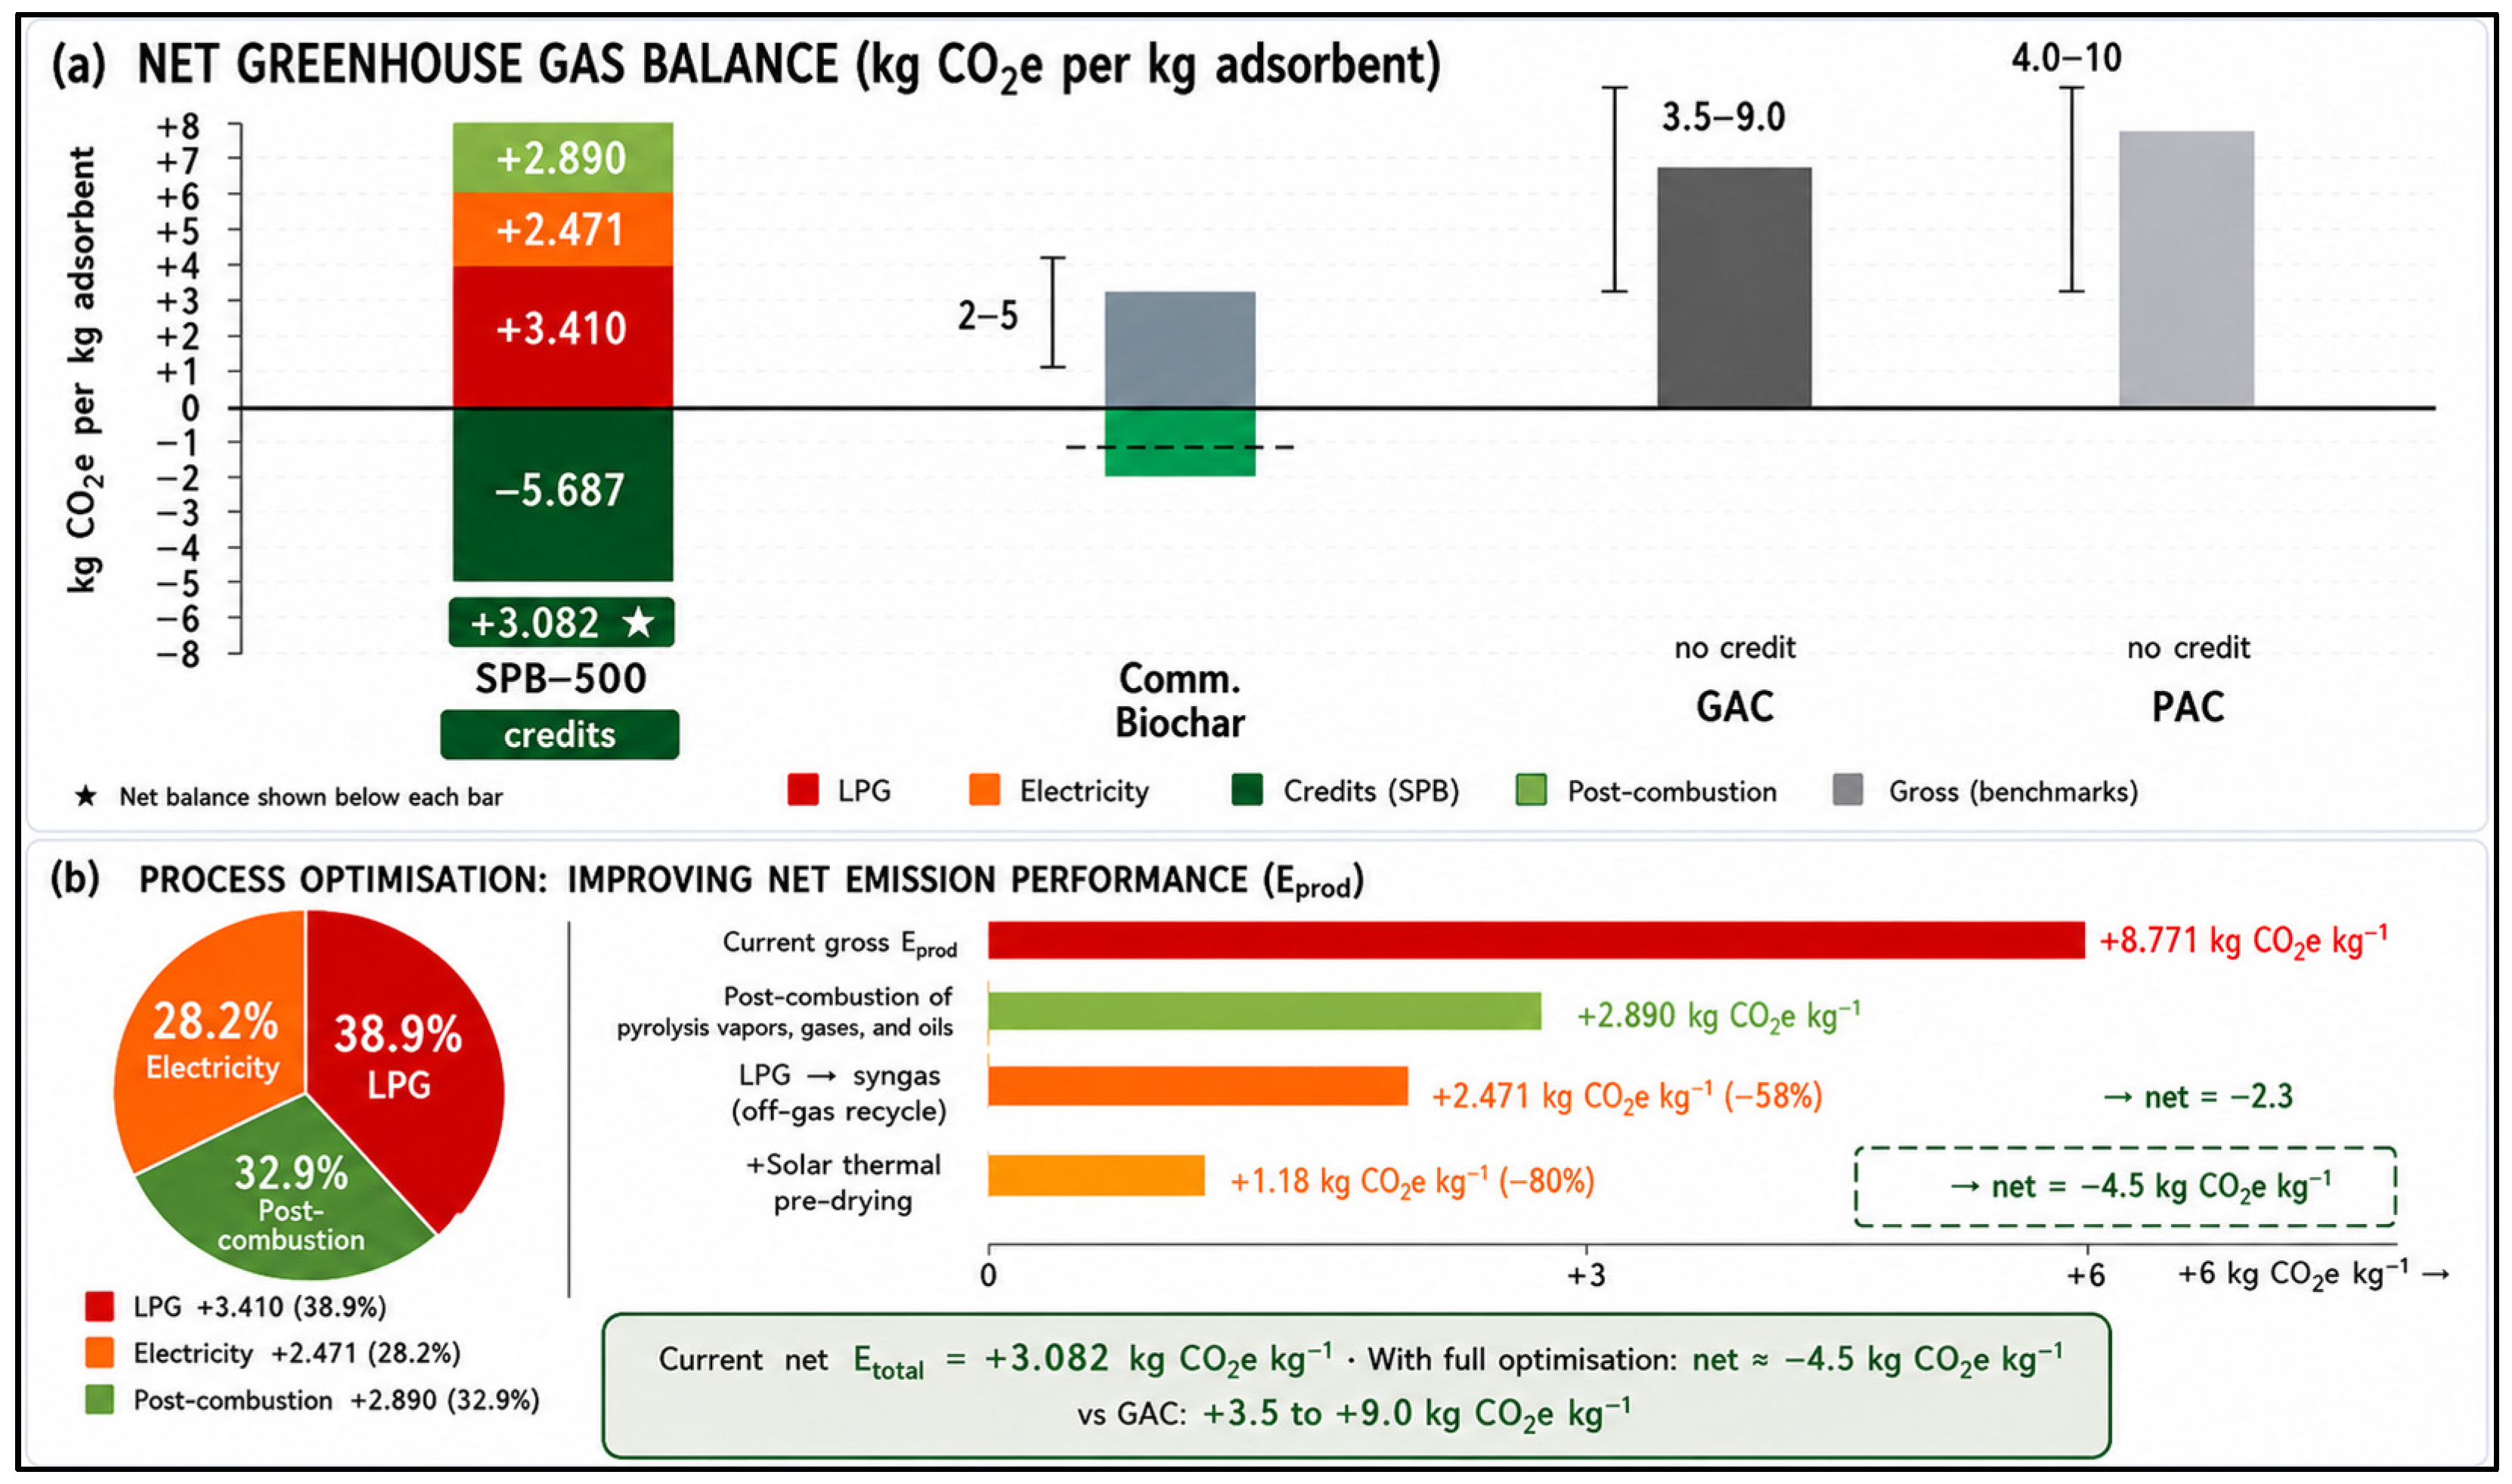
As shown in Table 8, SPB-500 demonstrated promising environmental performance relative to the literature-reported values for commercial-activated carbon. These comparisons should be interpreted as preliminary environmental benchmarks because differences in feedstock, production processes, adsorption performance, and system boundaries may influence the reported results. Gross attributional gate-to-gate greenhouse-gas emissions were estimated at +8.771 kg CO2e kg−1 SPB-500. These emissions originated from three sources: LPG combustion (+3.410 kg CO2e kg−1; 38.9%), electricity consumption during feedstock drying (+2.471 kg CO2e kg−1; 28.2%), and post-combustion of pyrolysis vapors, gases, and bio-oil (+2.890 kg CO2e kg−1; 32.9%). A separate consequential waste-diversion scenario was subsequently evaluated. When carbon sequestration and waste-diversion credits were considered, the resulting hybrid scenario-based net greenhouse-gas balance decreased to +3.082 kg CO2e kg−1 SPB-500. The comparatively low GWP100 was attributed to the lower thermal energy demand of LPG-fired pyrolysis at 500 °C relative to conventional high-temperature-activated carbon production. On a performance-normalized basis, the GWP100 of 0.047 g CO2e g−1 Cu2+ removed was within the lower range reported for commercial GAC. Net cumulative energy demand (CED) was approximately 57.6 MJ kg−1, substantially lower than reported GAC values due to the absence of chemical activation and the utilization of waste-derived feedstocks. Based on literature benchmarking, the SPB-500 production pathway is expected to exhibit lower eutrophication and human-toxicity burdens than commercial-activated carbon production; however, quantitative midpoint characterization was beyond the scope of the present study. Furthermore, the high carbon sequestration credit reflected the elevated stable carbon content of SPB-500 (84.43% C; H/Corg = 0.022), indicating the formation of a highly stable aromatic carbon matrix during co-pyrolysis at 500 °C.
Table 9 provides a broader environmental benchmarking of SPB-500 against four commercially available adsorbent types, covering GWP100, production energy demand, chemical activation requirements, and qualitative scores for eutrophication and toxicity potential. The comparison demonstrates that SPB-500 achieves a scenario-based greenhouse-gas assessment net GWP100 of +3.082 kg CO2e kg−1 when avoided waste emission credits are included, making it one of the most environmentally favorable adsorbent options. This compares favorably to GAC (3.5–9.0 kg CO2e kg−1), PAC (4.0–10.0 kg CO2e kg−1), and ion-exchange resin (12–25 kg CO2e kg−1). The absence of chemical activation reagents represents a particularly important advantage, as KOH and ZnCl2 activation of GAC generates substantial wastewater treatment burdens and contributes to freshwater eutrophication and ecotoxicity impacts that are entirely absent from the SPB process.

3.4. CO2 Emission Analysis for SPB-500 Production

The process input parameters underpinning the CO2 emission calculations are compiled in Table 10, with all values expressed per kilogram of SPB-500 produced as the functional unit.
The step-by-step CO2 emission calculation for SPB-500, presented in Table 11, is structured as the algebraic sum of gross production emissions and three credit streams.
Gross production-phase emissions arise exclusively from LPG combustion in unit R-101 (Step 1: 1.143 × 2.983 = +3.410 kg CO2e kg−1) and grid electricity consumption for oven drying in unit D-101 (Step 2: 4.286 × 0.5765 = +2.471 kg CO2e kg−1), totaling Eprod = +8.771 kg CO2e kg−1 SPB-500. The corresponding percentage contributions were 38.9% for LPG combustion, 28.2% for electricity use, and 32.9% for post-combustion emissions. Against this gross burden, three credit streams are applied: stable carbon sequestration in the biochar product (Step 3: 0.675 × 3.667 = −2.477 kg CO2e kg−1), avoided landfill methane emissions from sawdust diversion (Step 4: 2.286 × 0.698 = −1.596 kg CO2e kg−1; GWP100 (CH4) = 27.9, IPCC AR6), and avoided open-burning emissions from PP plastic diversion (Step 5: 0.571 × 2.830 = −1.616 kg CO2e kg−1; IPCC 2006 [28], Vol. 5, Annex 3). The three credit streams collectively yield a total credit of −5.687 kg CO2e kg−1, which does not exceed the gross production burden of +8.771 kg CO2e kg−1, resulting in a hybrid scenario-based net greenhouse-gas balance of Etotal = Eprod + Eseq + Eavoid = +3.082 kg CO2e kg−1 SPB-500, confirming that the production pathway is unambiguously net scenario-based greenhouse-gas assessment under the adopted gate-to-gate system boundary.
As illustrated in Figure 5a, the hybrid scenario-based net greenhouse-gas balance of SPB-500 (+3.082 kg CO2e kg−1) is less sharp than the scenario-based greenhouse-gas assessment profiles of commercial GAC (+3.5 to +9.0 kg CO2e kg−1), PAC (+4.0 to +10.0 kg CO2e kg−1), and commercial biochar (−0.5 to +3.0 kg CO2e kg−1), supporting its potential application under the evaluated scenario of approximately 0.4–5.9 kg CO2e kg−1 lower than reported values for commercial-activated carbon (3.5–9.0 kg CO2e kg−1). Notably, the gross production-phase GWP100 of SPB-500 (+8.771 kg CO2e kg−1; Figure 5b) already falls within or below the lower bound of the GAC literature range prior to credit application, reflecting the intrinsic thermal efficiency advantage of LPG-fired slow pyrolysis at 500 °C relative to industrial rotary kiln activation at 700–900 °C. The scenario-based greenhouse-gas assessment classification arises from three reinforcing mechanisms, each visible in the waterfall decomposition of Figure 5a. First, waste-input classification of both feedstocks under ISO 14044 Annex B eliminates all upstream production burdens and generates two avoided-emission credit landfill CH4 avoidance (−1.596 kg CO2e kg−1) and PP open-burning avoidance (−1.616 kg CO2e kg−1), which is a structural advantage unavailable to fossil-derived or virgin-biomass adsorbents. Second, the thermally stable aromatic carbon matrix formed during co-pyrolysis at 500 °C permanently sequesters 0.675 kg C kg−1 SPB over timescales exceeding 100 years (H/Corg) = 0.022; this is well below the IBI stability threshold of 0.4), contributing the largest individual credit of −2.477 kg CO2e kg−1. It needs to be recognized that the estimated GHG balance depends on assumptions related to the stability of carbon in biochar, reduced methane from landfills, and reduced emissions from open burning. Any changes in these values would have an impact on the scale of credits that could be gained, but it can be said with certainty that SPB-500 will always have significantly less carbon footprint compared to standard AC production. Third, the comparatively low pyrolysis temperature constrains gross energy consumption such that the SPB-500 gross GWP100 remains below the mid-range of GAC even before credit streams are applied (Figure 5b). Despite having selected LPG for being available, easy to operate, and commonly used in rural areas in Thailand, a comparative evaluation of other fuel sources for cooking, including biomass pellets and natural gas, was beyond the scope of this project.

3.5. Total Investment (Inputs), Outcomes, Indicators and Financial Proxies

The total amount of money required to implement the community-scale SPB-500 over the period of five years was estimated to be 4,342,000 THB. It includes capital investment, operating costs, manpower costs, R&M effort, and absorption-system infrastructure investment (Table 12).
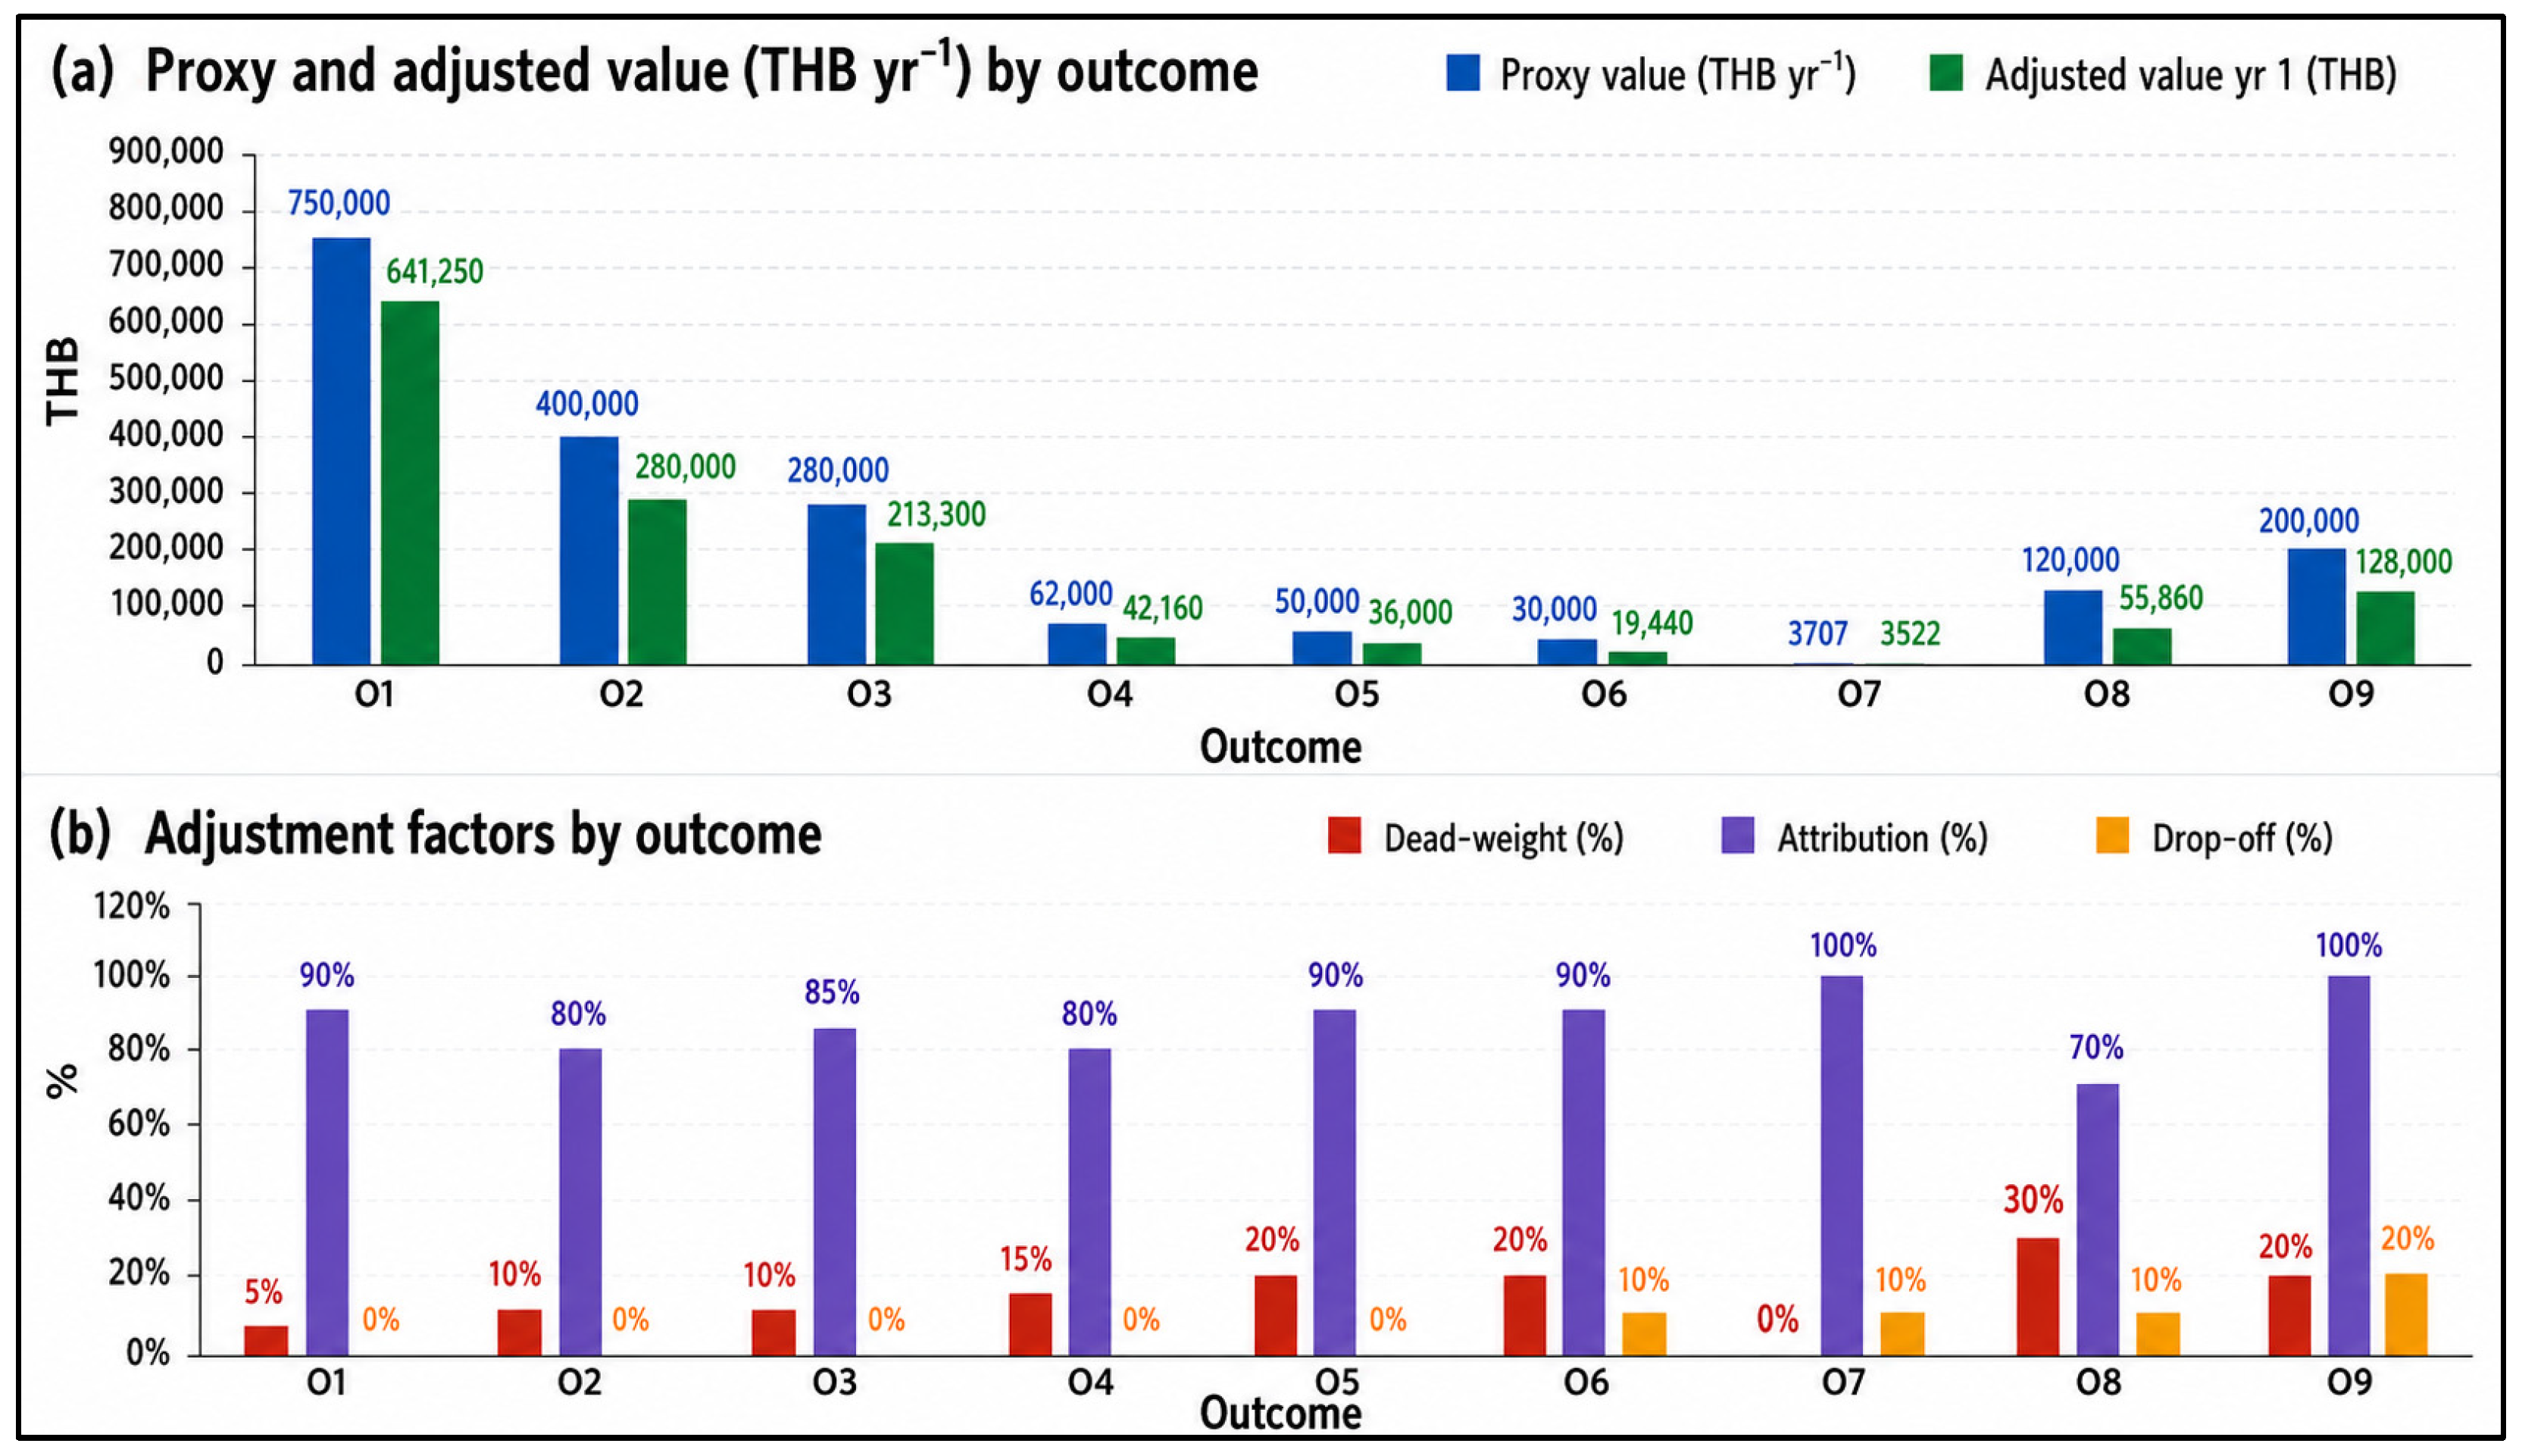
Manpower costs (1,920,000 THB; 44.2%) and operating costs (1,896,000 THB; 43.7%) comprised the largest shares of capital outlay, thus highlighting the importance of the workforce involved and manufacturing efforts to achieve SPB-500 community-scale implementation. SROI outcome framework is illustrated in Figure 6, while the indicators, financial proxies, and adjustment factors are summarized in Table 13. There were nine monetized outcomes (O1–O9) evaluated within four stakeholder-benefit categories: (i) public health and water quality improvement, (ii) environmental remediation and waste valorization, (iii) socioeconomic development, and (iv) institutional value creation. After deadweight, attribution, and drop-off adjustments, the highest Year-1 value was observed for water quality improvement (O1; 641,250 THB year−1), followed by the reduction in health risks (O2; 288,000 THB year−1) and diversion of sawdust (O3; 213,300 THB year−1).
Figure 6 shows that outcomes O1 and O2 contributed to about 65.13% of the adjusted Year-1 social value. Thus, water quality improvement and the improvement in public health can be viewed as the primary social value-generating activities. Other monetized outcomes included waste management, carbon sequestration, job creation, skill development, reduced compliance risk, and knowledge generation. The financial proxies were estimated based on the expenses avoided because of bottled water, health-related expenses avoided due to improved health, expense avoidance in waste management and the prevention of pollution, carbon credits, vocational training costs, compliance fines, and research cost equivalents. Deadweight rates were set at 0% for carbon sequestration and 30% for compliance-risk reduction in order to provide a conservative estimation of the social value. All the outcomes considered in Table 11 and Figure 6 provide the basis for the present value and SROI calculations discussed in Section 3.6 and Section 3.7.

3.6. Present Value of Outcomes

Each outcome value was discounted per annum over the five-year analysis period and adjusted using the deadweight, attribution, and drop-off factors specified in Table 13. The present value (PV) of each outcome is calculated as
PV ( O i ) = Adjusted   Year   1   Values   × [ t = 1 5 ( 1 d ) t ] ( 1 + 0.05 ) t
where d denotes the outcome-specific annual drop-off rate and t is the year index from one to five.
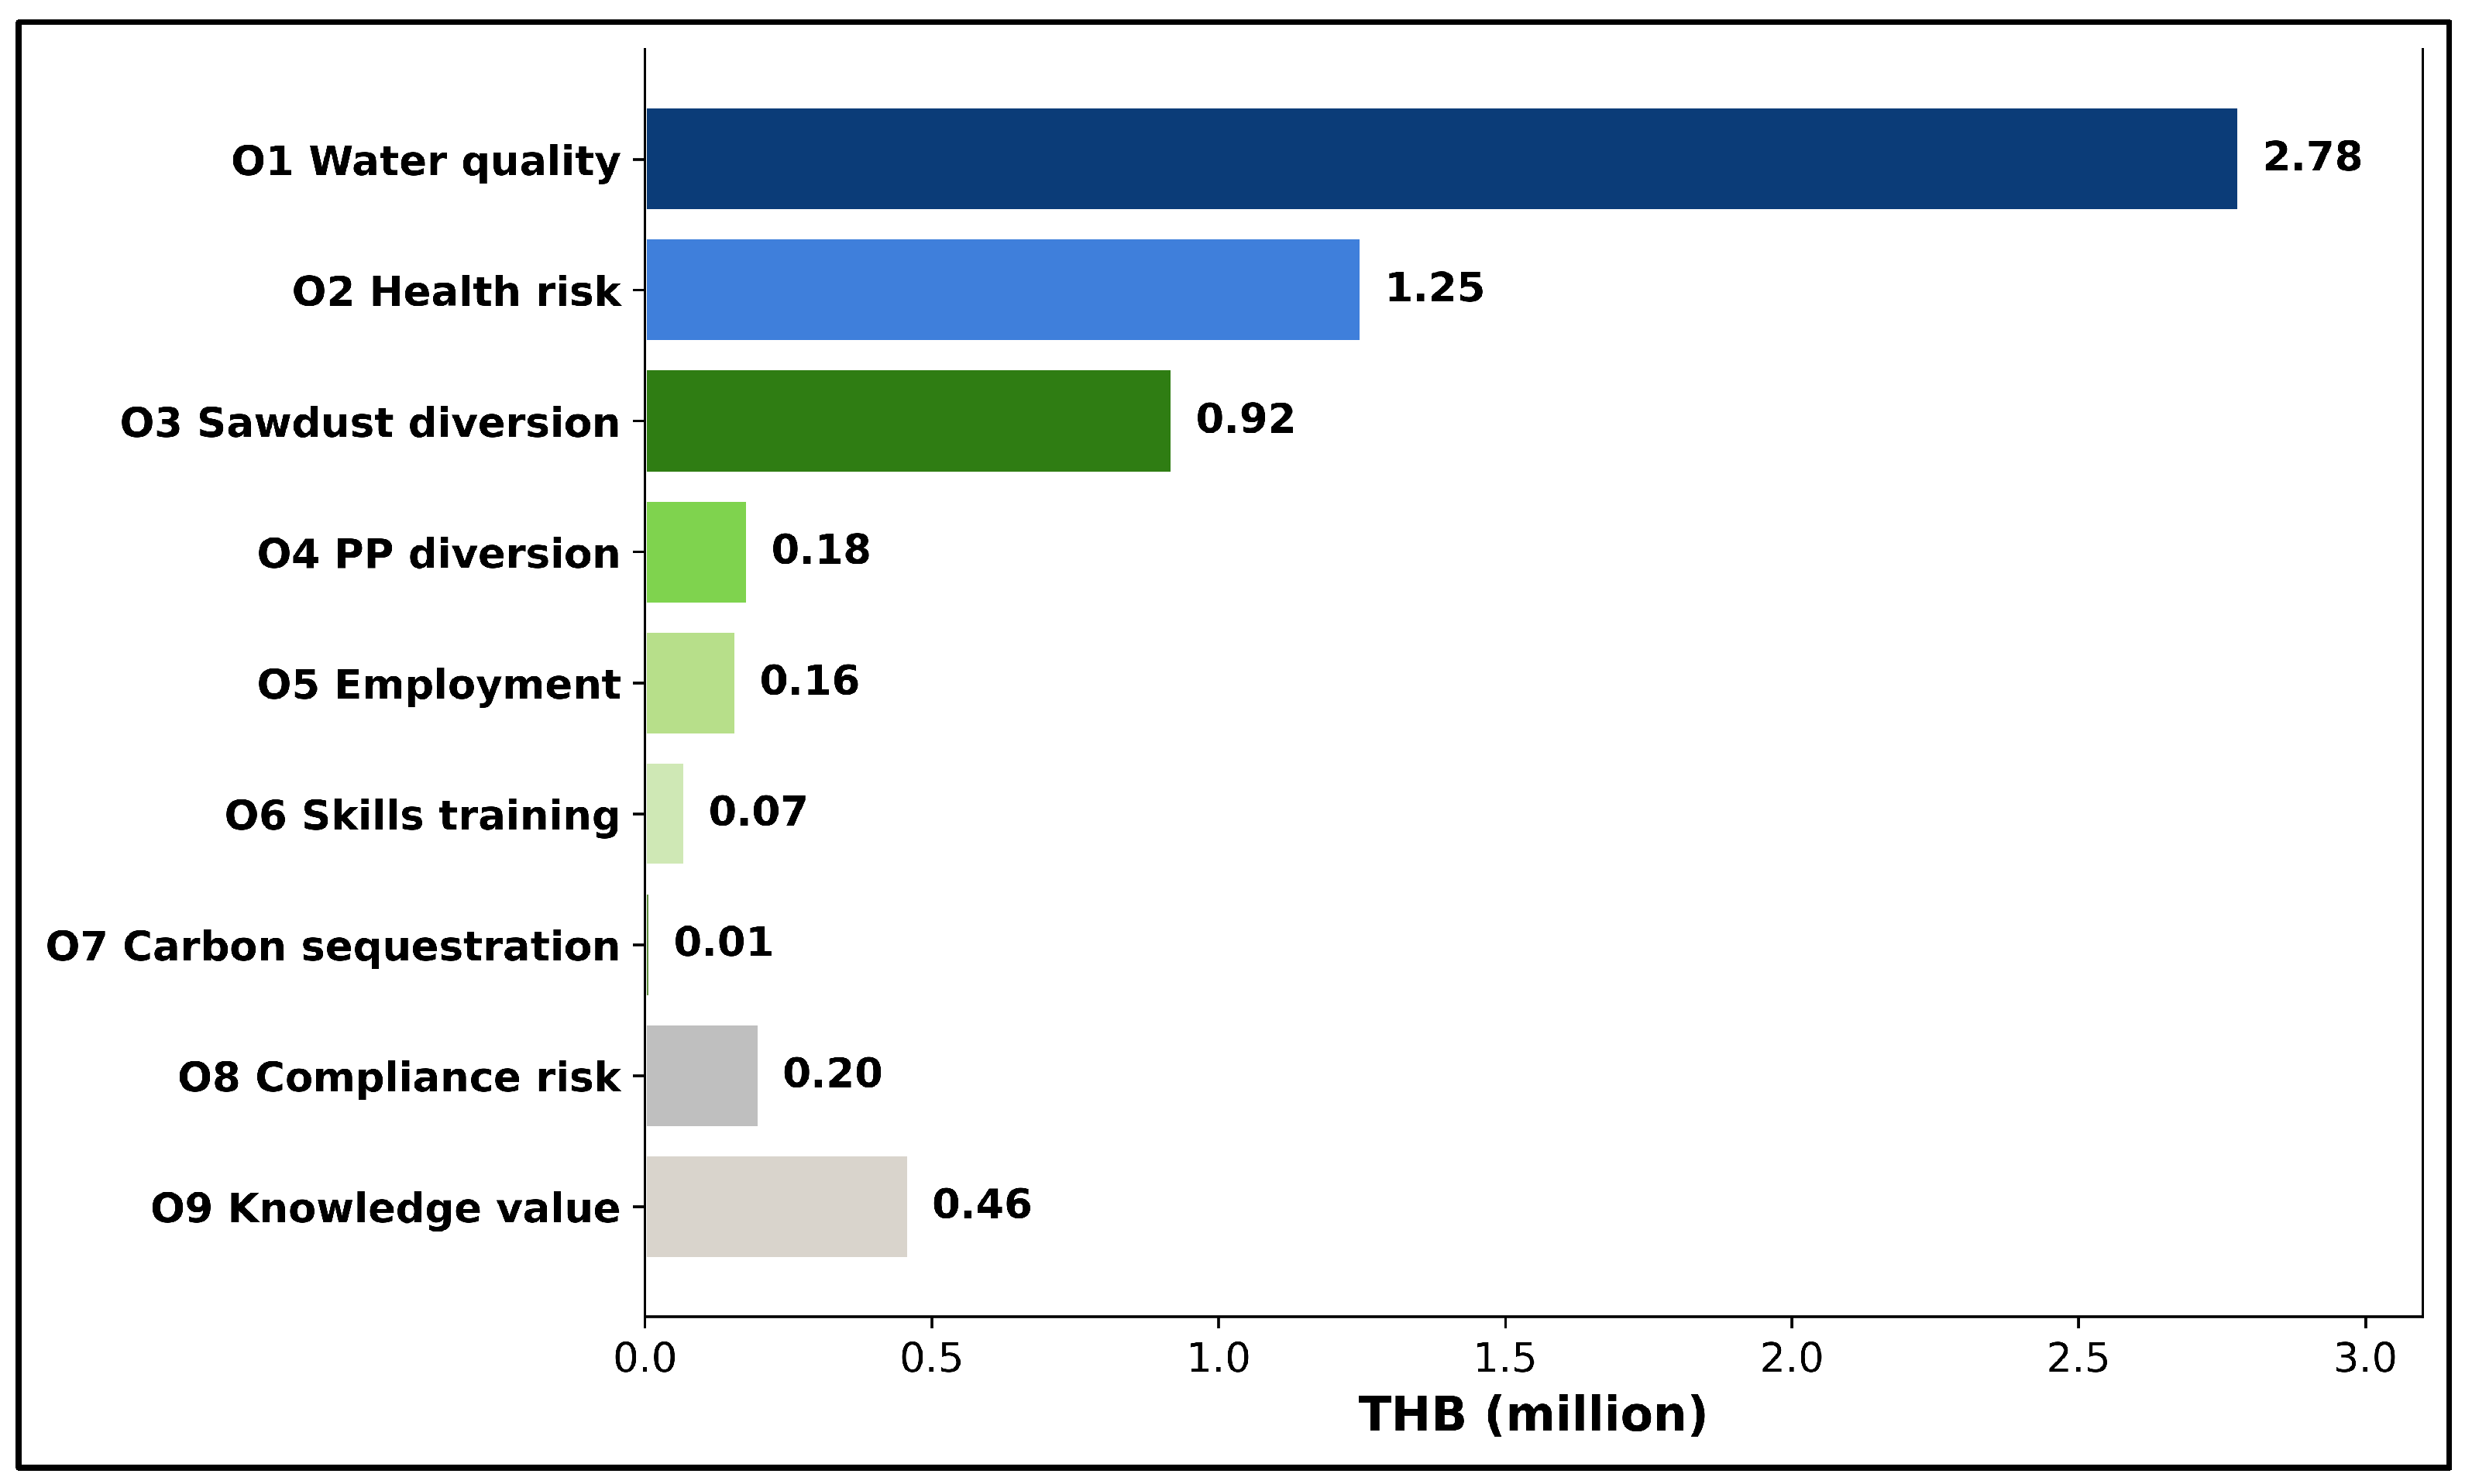
The outcomes O1–O9 can be summarized using Table 14 and Figure 7. In particular, the outcomes O1–O5 were expected to maintain the adjusted benefits throughout the entire five years’ period, hence being affected only by the annual discounting effect. Accordingly, benefits such as water quality improvements, health risk reductions, waste management benefits, and employment creation remained constant throughout the assessment period. In turn, the outcomes O6–O9 were expected to suffer from annual drop-off rates of 10%, 5%, 5%, and 20%, respectively. The total present value (PV) of the nine outcomes streams during the five-year assessment period at a discount rate of 5% was expected to equal 6,025,841 THB. With a revised total investment of 4,342,000 THB (Table 10), the base–case SROI would be 1.39:1, implying that for each 1 THB invested into a project, there would be generated a net gain of about 1.39 THB in terms of social, environmental, and economic value. Water quality improvement (O1) became the leading outcome of the project, with about 46.1% share of PV in the total one. It was followed by health risk reduction (O2; 20.7%) and sawdust diversion (O3; 15.3%). Overall, O1 and O2 were responsible for creating around 66.9% of social value generated by the project, which indicated that public health and water quality benefits played a significant role in the overall benefits of the proposed deployment framework. Environmental waste-diversion benefits (O3 and O4) were responsible for 18.4% of PV, whereas employment creation and skills development (O5 and O6) for 3.7%. Knowledge generation benefits (O9) became less relevant with the passage of time because of their annual drop-off rate of 20%. Together, carbon sequestration (O7) and compliance-risk reduction (O8) made up 3.5% of PV. In this regard, it should be acknowledged that the relatively small contribution of O7 is caused by the current undervaluation of carbon credits in the Thai voluntary carbon market and not because of some limitations in SPB-500′s ability to store carbon.

3.7. SROI Ratio, Sensitivity Analysis and SDGs

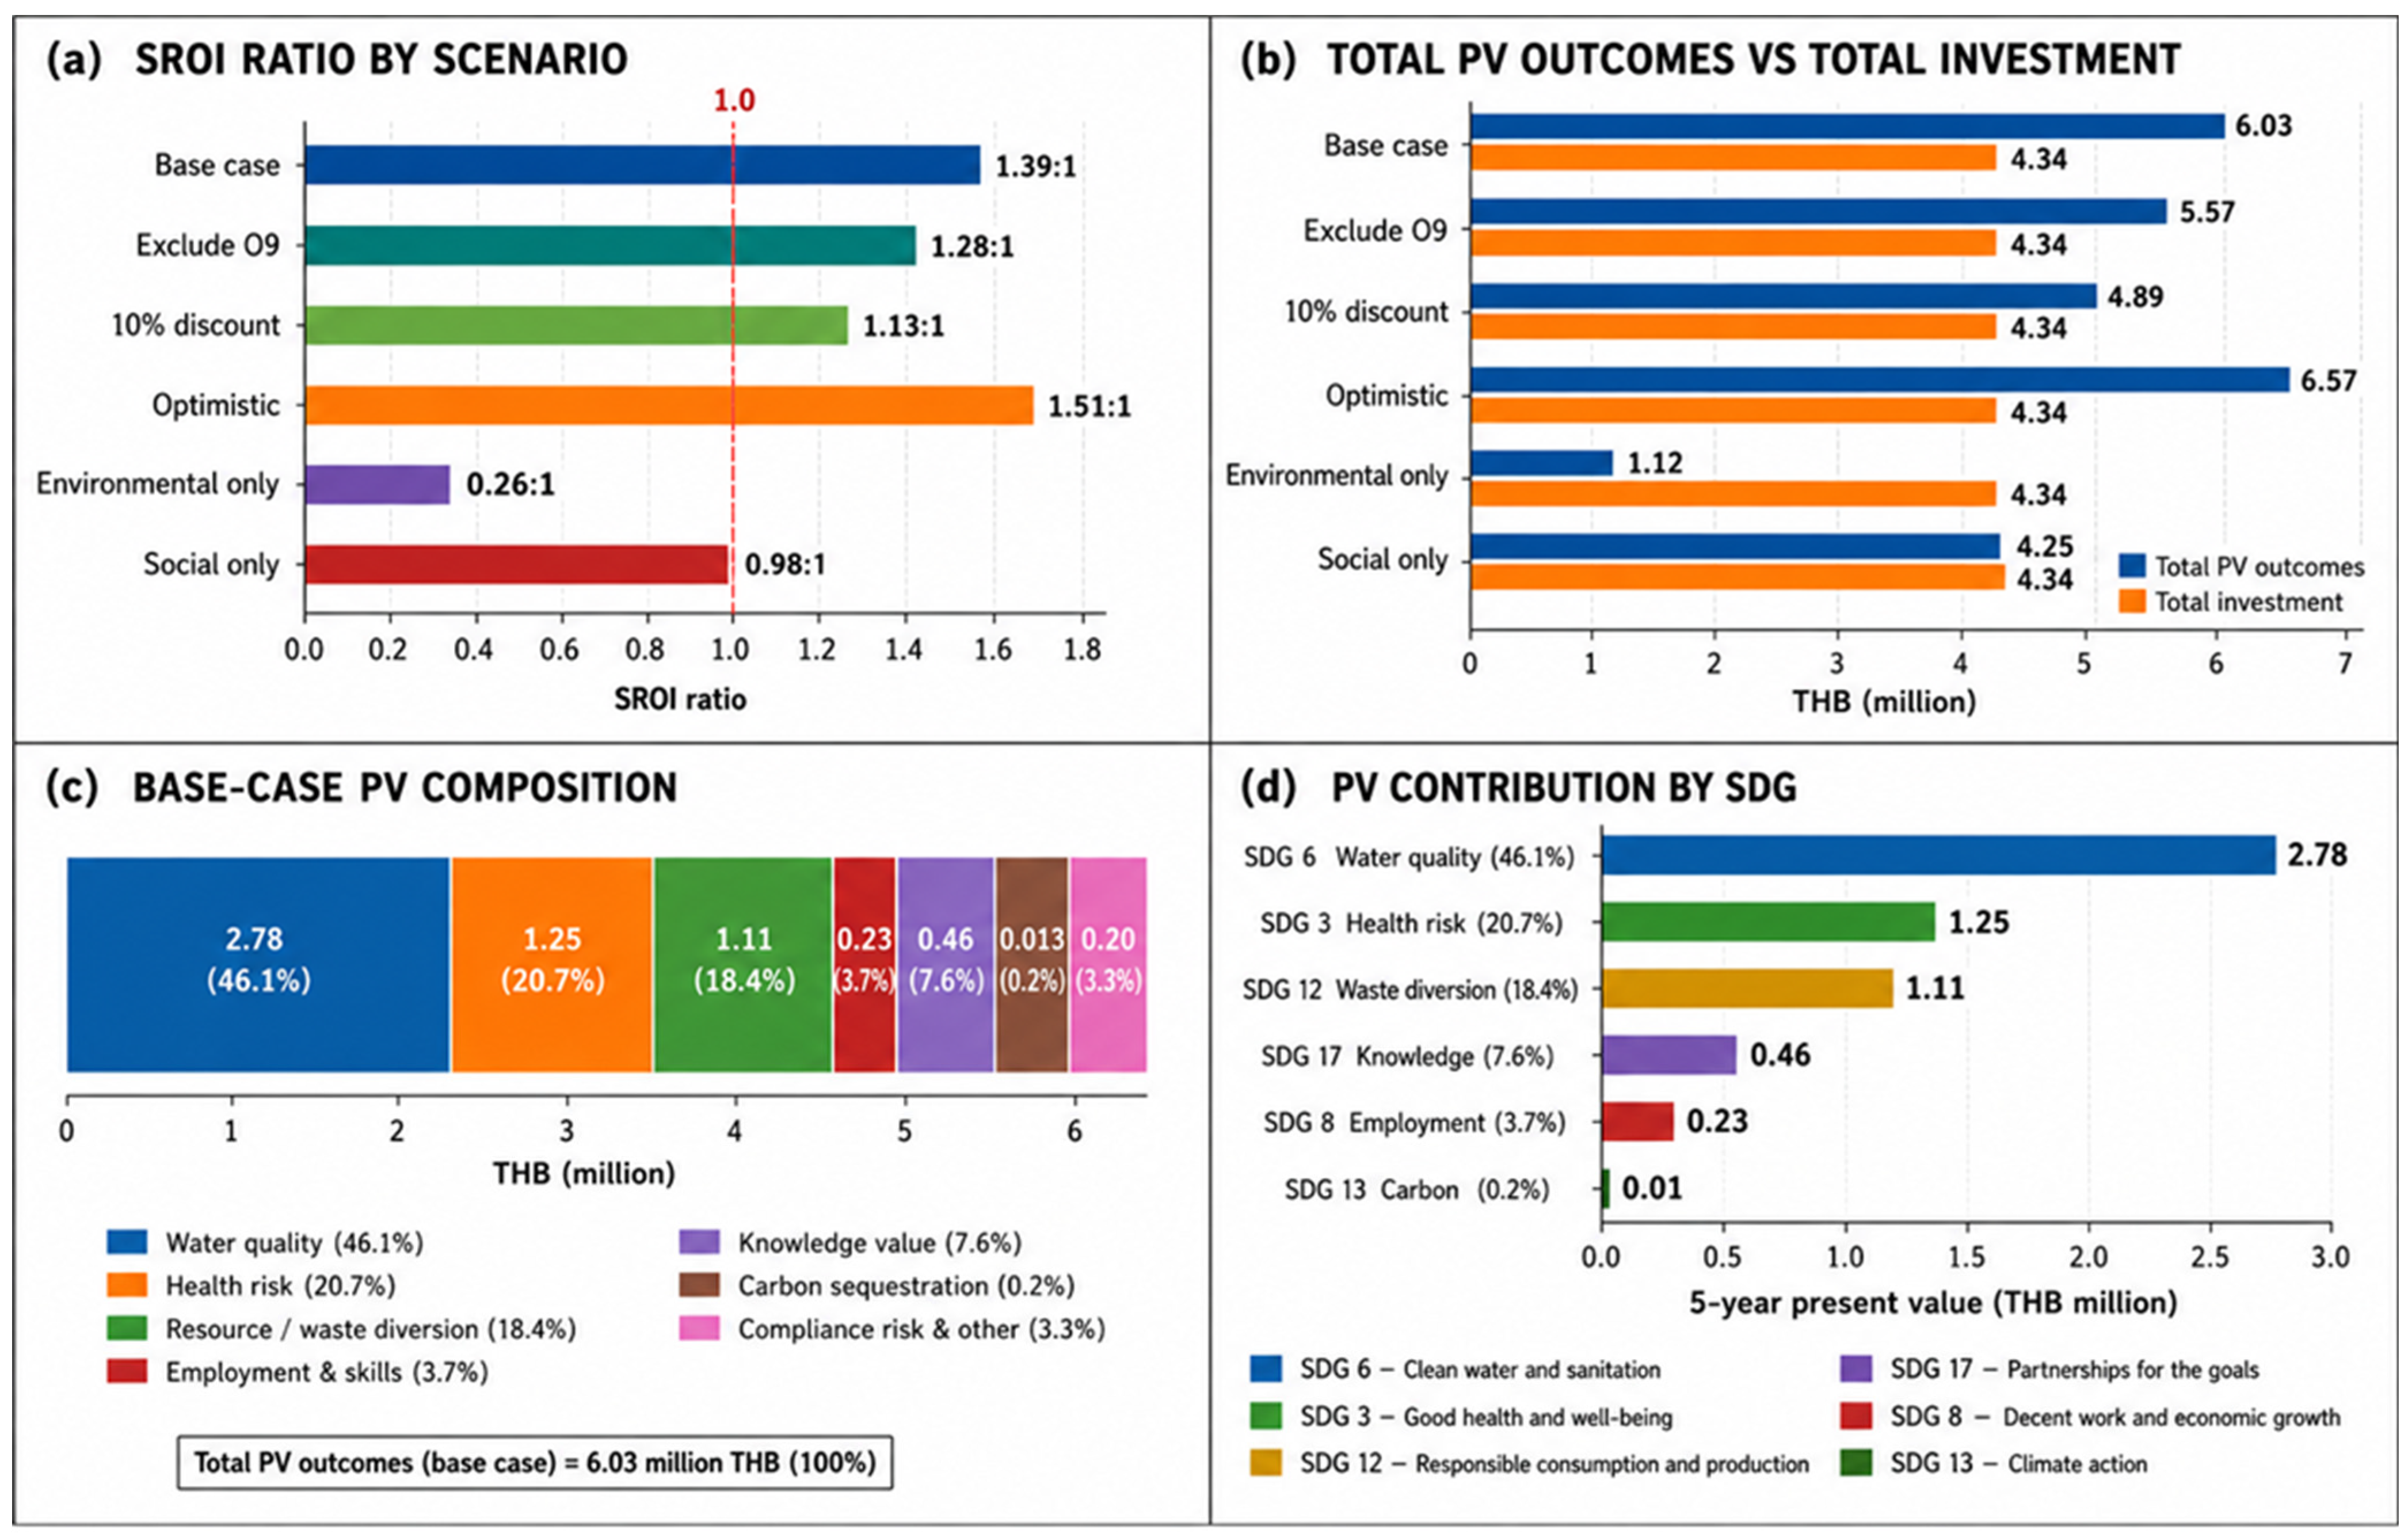
As seen in Table 15 and Figure 8a, the new base–case SROI ratio of 1.39:1 means that, in terms of social, environmental, and economic benefits, the community-scale implementation of SPB-500 will result in a benefit ratio of 1.39 THB for each 1 THB spent on the project. While it is smaller compared to the former estimate based on the old investment base, this number still exceeds one, which shows that the SROI is positive. Moreover, as is demonstrated by the sensitivity analysis results, the project’s investment case proves rather resilient with SROI ratios ranging between 1.13:1 and 1.51:1. These SROI figures depend on the proxies used and the assumptions about attribution, deadweight, displacement, and drop-off. They should thus be regarded as estimates, based on scenarios, rather than being seen as actual social impacts.
According to Figure 8b, the overall PV of all outcomes exceeded the overall investment in all cases analyzed, suggesting a positive social return throughout the evaluation period. In the revised case scenario, the overall five-year PV of all outcomes reached 6,025,841 THB against the overall investment of 4,342,000 THB, resulting in an SROI ratio of 1.39:1 in the base–case scenario. Even with conservative assumptions, the social return on investment remained positive (>1.0), providing further evidence that the deployment of SPB-500 at the community level would generate overall social and environmental value. Figure 8c presents the breakdown of the total PV of the base–case scenario. Improvements in water quality (O1) continued dominating the total PV (46.1%; 2.78 million THB), followed by reduction in health risks (O2) that contributed 20.7% of the total PV (1.25 million THB). Taken together, public health benefits (O1 and O2) provided 66.8% of the overall PV created by the deployment of SPB-500 in the community. Credit-adjusted net GHG balance under the evaluated scenario related to waste diversion and circular resource utilization (O3 + O4) accounted for 18.4% of the total social value created (1.11 million THB). In addition, further contributions were made to social value creation through knowledge generation (O9; 7.6%; 0.46 million THB), skill development and employment creation (O5 + O6; 3.7%; 0.23 million THB), reduction in compliance risks (O8; 3.3%; 0.20 million THB), and carbon sequestration (O7; 0.2%; 0.01 million THB). As evidenced by the findings, social value creation occurred in a variety of outcome categories instead of relying on one single category. However, improvements in water quality and public health clearly stood out as the main factors of social return. Carbon sequestration (O7) made the smallest contribution to the total PV in this case scenario. This finding can be attributed to the relatively low cost of carbon credits in Thailand as opposed to any limitations in the capacity of SPB-500 for carbon storage. Finally, Figure 8d provides information on the contribution of project benefits to the realization of the United Nations Sustainable Development Goals (UN SDGs). SDG 6 (clean water and sanitation) received the largest share (46.1%) of the total social value, followed by SDG 3 (good health and well-being) with 20.7% and SDG 12 (responsible consumption and production) with 18.4% as a result of environmental outcomes. Additional contribution to the achievement of UN SDGs was observed for SDG 17 (partnerships for the goals) with 7.6%, SDG 8 (decent work and economic growth) with 3.7%, and SDG 13 (climate action) with 0.2%. Despite the small monetary value of SDG 13, this can be mostly explained by the relatively low price of carbon credits in Thailand.

4. Conclusions

This study undertakes a holistic sustainability analysis of community-scale co-pyrolysis of sawdust and non-recyclable polypropylene for the production of SPB-500 adsorbent, by performing techno-economic analysis, environmental screening, greenhouse-gas emission calculation, and SROI evaluation within a single analytical framework. The results suggest that co-pyrolysis of sawdust and PP waste at 500 °C has the capability to address waste valorization, environmental protection, and socioeconomic benefits simultaneously. From the results of the techno-economic analysis, it can be concluded that the production of SPB-500 can be realized using a custom-designed LPG-fired pyrolysis unit with a relatively low initial capital cost of 46,000 THB (1286 USD) and an operational cost of 316 THB kg−1 (8.8 USD kg−1) at a biochar yield of about 35% (w/w). This level of production cost makes SPB-500 competitive compared to the market price of activated carbons due to its low cost. Moreover, the scenario-based techno-economic analysis indicates a short, estimated payback period under the assumed production capacity and selling price, suggesting favorable economic potential for future community-scale implementation. However, these results represent screening-level estimates and should be validated through pilot-scale operation and detailed financial analyses before commercialization. The environmental screening of SPB-500 shows the total gate-to-gate emissions of 8.771 kg CO2e per kg SPB-500 with the highest contribution from the LPG combustion stage. In addition, when taking into account the benefits of stable C sequestration and waste diversion in the consequential scenario analysis, the total carbon dioxide-equivalent emissions reduce to 3.082 kg CO2e per kg SPB-500. Compared to activated carbon production process, SPB-500 production has lower energy demand and less environmental impacts due to the avoidance of chemical activation. Social return on investment analysis gives a ratio of 1.39:1 and five-year NPV of 6.03 million THB. Therefore, it can be argued that social- and credit-adjusted net GHG balance under the evaluated scenario derived from this project outweighs the investment. Environmental health benefits are the largest monetized benefits and constitute more than half of the social value created. These SROI findings should be interpreted based on scenarios because they rely heavily on financial indicators from the literature rather than actual social impact figures obtained through direct engagement with stakeholders. All of the above-described techno-economic, environmental, and social results are associated with uncertainties based on the assumptions made concerning biochar yield, energy use, emission coefficients, the permanence of sequestered carbon, avoidance credits, adsorption dosage, regeneration efficiency, economic parameters such as market value, wage rate, and discount rate, as well as SROI as a social financial proxy. Even though a sensitivity analysis has been carried out for the SROI evaluation, a thorough multi-factorial uncertainty analysis has not yet been undertaken. The reported annual production capacity, techno-economic performance, and SROI outcomes are scenario-based screening estimates intended to evaluate the potential feasibility of community-scale implementation. Experimental validation through pilot-scale operation and detailed engineering design is required before commercial deployment.
In spite of the fact that this study focuses only on gate-to-gate environmental impacts and social valuation based on a five-year period, the conclusions made based on the findings clearly suggest that community-scale co-pyrolysis can be considered a promising approach to valorize problematic waste streams and turn them into value-added products. In particular, future research might be directed towards full-scale piloting, life cycle assessment, use of renewable energy, syngas utilization, and testing the adsorption capacity of SPB-500 under actual operation.

Author Contributions

Writing—review and editing, writing—original draft, software, methodology, formal analysis, data curation, conceptualization, supervision, project administration, investigation, funding acquisition, T.K.; software, methodology, formal analysis, data curation, S.K.; methodology, formal analysis, data curation, writing—review, S.I.; writing—review and editing, software, formal analysis, N.S.; methodology, formal analysis, data curation, N.K.; software, methodology, formal analysis, data curation, K.S.; software, methodology, formal analysis, data curation, conceptualization, S.H.; writing—review and editing, writing—original draft, software, methodology, formal analysis, data curation, conceptualization, supervision, project administration, investigation, funding acquisition, S.W. All authors have read and agreed to the published version of the manuscript.

Funding

This research received no external funding.

Data Availability Statement

Data is contained within the article. The original contributions presented in this study are included in the article. Further inquiries can be directed to the corresponding author.

Acknowledgments

The current research study has been made possible as this research project was financially supported by Mahasarakham University. The authors would like to express thanks to the University of Phayao (Fundamental Fund 2026 Grant No. 2300/2568) for providing access to laboratory facilities and technical equipment essential for experimental work. Special thanks are also extended to the academic and administrative staff for their valuable guidance and logistical support throughout the research process.

Conflicts of Interest

The authors declare no conflicts of interest.

Abbreviations

The following abbreviations are used in this manuscript:
CAPEXCapital Expenditure
CEDCumulative Energy Demand
CHNSCarbon, Hydrogen, Nitrogen, and Sulfur Analysis
EFCseqEmission Factor for Carbon Sequestration
EFelecElectricity Emission Factor
EFLPGLiquefied Petroleum Gas Emission Factor
EFPPEmission Factor for Polypropylene Open Burning
EFsawEmission Factor for Sawdust Landfill Decomposition
EOLEnd-of-Life
FEPFreshwater Eutrophication Potential
FTEFull-Time Equivalent
GACGranular-Activated Carbon
GHGGreenhouse Gas
GWP100Global Warming Potential (100-year time horizon)
HTPHuman-Toxicity Potential
IBIInternational Biochar Initiative
IPCCIntergovernmental Panel on Climate Change
LCALife Cycle Assessment
LCILife Cycle Inventory
LPGLiquefied Petroleum Gas
MJMegajoule
OPEXOperating Expenditure
PACPowdered-Activated Carbon
PCDPollution Control Department
PIDProportional–Integral–Derivative Controller
PPPolypropylene
PVPresent Value
SDGSustainable Development Goal
SPBSawdust–Polypropylene Biochar
SPB-500Sawdust–Polypropylene Biochar Produced at 500 °C
SROISocial Return on Investment
TEATechno-Economic Analysis
TGOThailand Greenhouse-Gas Management Organization
THBThai Baht
TIC-101Temperature Indicator Controller
UNUnited Nations
USDUnited States Dollar
WHOWorld Health Organization

References

  1. OECD. Global Plastics Outlook: Economic Drivers, Environmental Impacts and Policy Options; OECD Publishing: Paris, France, 2022. [Google Scholar]
  2. PlasticsEurope. Plastics—The Facts 2024. PlasticsEurope. 2024. Available online: https://plasticseurope.org/knowledge-hub/plastics-the-fast-facts-2024/ (accessed on 2 May 2026).
  3. OECD. Environment. Available online: https://www.oecd.org/environment/plastic-waste-to-almost-triple-by-2060.htm (accessed on 13 January 2026).
  4. Xayachak, T.; Haque, N.; Parthasarathy, R.; King, S.; Emami, N.; Lau, D.; Pramanik, B.K. Pyrolysis for plastic waste management: An engineering perspective. J. Environ. Chem. Eng. 2022, 10, 108865. [Google Scholar] [CrossRef]
  5. Chasioti, A.; Zabaniotou, A. An industrial perspective for sustainable polypropylene plastic waste management via catalytic pyrolysis—A technical report. Sustainability 2024, 16, 5852. [Google Scholar] [CrossRef]
  6. Oony-Iye, A.; Ebhodaghe, S.; Ogbeide, S. Modelling and simulation of mixed sawdust pyrolysis using Aspen Plus® software. Eur. J. Sustain. Dev. Res. 2025, 9. [Google Scholar] [CrossRef] [PubMed]
  7. Heriyani, O.; Djaeni, M.; Syaiful, S.; Putri, A.K. Perforated concave rectangular winglet pair vortex generators enhance the heat transfer of air flowing through heated tubes inside a channel. Results Eng. 2022, 16, 100705. [Google Scholar] [CrossRef]
  8. Hongthong, S.; Sangsida, W.; Wongcharee, S.; Chanthakhot, A.; Aungthitipan, P.; Suwannahong, K.; Kreetachat, T.; Rioyo, J. Enhanced biochar production via co-pyrolysis of biomass residual with plastic waste after recycling process. Int. J. Chem. Eng. 2024, 2024, 1176275. [Google Scholar] [CrossRef]
  9. Gu, C.; Zhao, H.; Xu, B.; Yang, J.; Zhang, J.; Du, M.; Liu, Y.; Tikhankin, D.; Yuan, Z. Cfd-dem simulation of distribution and agglomeration characteristics of bendable chain-like biomass particles in a fluidized bed reactor. Fuel 2023, 340, 127570. [Google Scholar] [CrossRef]
  10. Vo, T.A.; Tran, Q.K.; Ly, H.V.; Kwon, B.; Hwang, H.T.; Kim, J.; Kim, S.-S. Co-pyrolysis of lignocellulosic biomass and plastics: A comprehensive study on pyrolysis kinetics and characteristics. J. Anal. Appl. Pyrolysis 2022, 163, 105464. [Google Scholar] [CrossRef]
  11. Esso, S.B.E.; Xiong, Z.; Chaiwat, W.; Kamara, M.F.; Longfei, X.; Xu, J.; Ebako, J.; Jiang, L.; Su, S.; Hu, S.; et al. Review on synergistic effects during co-pyrolysis of biomass and plastic waste: Significance of operating conditions and interaction mechanism. Biomass Bioenergy 2022, 159, 106415. [Google Scholar] [CrossRef]
  12. Hu, Q.; Zhang, H.; Mao, Q.; Zhu, J.; Zhang, S.; Yang, H.; Chen, H. The effect of co-pyrolysis of bamboo waste and polypropylene on biomass deoxygenation and carbonization processes. Energy 2024, 291, 130339. [Google Scholar] [CrossRef]
  13. Alawa, B.; Choudhary, J.; Chakma, S. Discernment of synergism in co-pyrolysis of hdpe and pp waste plastics for production of pyro-oil: Mechanistic investigation with economic analysis and health risk assessment. Process Saf. Environ. Prot. 2023, 169, 107–131. [Google Scholar] [CrossRef]
  14. Jena, M.K.; Liang, R.; Dey, S.D.; Gao, W.; Prabakar, P.; Yin, Y.; Kamal, S.; Gangawane, K.M.; Sivagami, K.; Shakir, M.; et al. A comprehensive review on co-pyrolysis of biomass, plastics, and waste tires: Mechanistic insights, synergistic effects, and optimization strategies. J. Anal. Appl. Pyrolysis 2026, 197, 107829. [Google Scholar] [CrossRef]
  15. Yadav, G.; Singh, A.; Dutta, A.; Uekert, T.; DesVeaux, J.S.; Nicholson, S.R.; Tan, E.C.D.; Mukarakate, C.; Schaidle, J.A.; Wrasman, C.J.; et al. Techno-economic analysis and life cycle assessment for catalytic fast pyrolysis of mixed plastic waste. Energy Environ. Sci. 2023, 16, 3638–3653. [Google Scholar] [CrossRef]
  16. Inayat, A.; Ahmed, A.; Tariq, R.; Waris, A.; Jamil, F.; Ahmed, S.F.; Ghenai, C.; Park, Y.-K. Techno-economical evaluation of bio-oil production via biomass fast pyrolysis process: A review. Front. Energy Res. 2022, 9, 770355. [Google Scholar] [CrossRef]
  17. Kulas, D.G.; Zolghadr, A.; Chaudhari, U.S.; Shonnard, D.R. Economic and environmental analysis of plastics pyrolysis after secondary sortation of mixed plastic waste. J. Clean. Prod. 2023, 384, 135542. [Google Scholar] [CrossRef]
  18. Zabaniotou, A.; Vaskalis, I. Economic assessment of polypropylene waste (pp) pyrolysis in circular economy and industrial symbiosis. Energies 2023, 16, 593. [Google Scholar] [CrossRef]
  19. Hasan, M.M.; Rasul, M.G.; Jahirul, M.I.; Sattar, M.A. An aspen plus process simulation model for exploring the feasibility and profitability of pyrolysis process for plastic waste management. J. Environ. Manag. 2024, 355, 120557. [Google Scholar] [CrossRef] [PubMed]
  20. Nistor, M.-A.; Halip, L.; Muntean, S.G.; Kurunczi, L.; Costișor, O. Modeling and optimization of acid orange 7 adsorption process using magnetite/carbon nanocomposite. Sustain. Chem. Pharm. 2022, 29, 100778. [Google Scholar] [CrossRef]
  21. Liu, Y.; Yang, X.; Zhang, J.; Zhu, Z. Process simulation of preparing biochar by biomass pyrolysis via aspen plus and its economic evaluation. Waste Biomass Valorization 2022, 13, 2609–2622. [Google Scholar] [CrossRef]
  22. Jaroenkhasemmeesuk, C.; Tippayawong, N.; Shimpalee, S.; Ingham, D.B.; Pourkashanian, M. Improved simulation of lignocellulosic biomass pyrolysis plant using chemical kinetics in aspen plus® and comparison with experiments. Alex. Eng. J. 2023, 63, 199–209. [Google Scholar] [CrossRef]
  23. Khaowdang, S.; Suriyachai, N.; Imman, S.; Kreetachat, N.; Chuetor, S.; Wongcharee, S.; Suwannahong, K.; Nukunudompanich, M.; Kreetachat, T. Valorization of sugarcane bagasse in thailand: An economic analysis of ethanol and co-product recovery via organosolv fractionation. Sustainability 2025, 17, 7145. [Google Scholar] [CrossRef]
  24. Khaowdang, S.; Suriyachai, N.; Imman, S.; Kreetachat, T.; Chuetor, S.; Wongcharee, S.; Suwannahong, K. Comparative study on techno-economic analysis for various organosolv fractionation of bagasse in thailand. Appl. Sci. Eng. Prog. 2025, 18, 7794. [Google Scholar] [CrossRef]
  25. Kreetachat, T.; Imman, S.; Suriyachai, N.; Khaowdang, S.; Chanthakhot, A.; Janthakhot, A.; Wongcharee, S.; Sangsida, W.; Hongthong, S.; Suwannahong, K. Co-pyrolyzed sawdust–polypropylene biochar as a sustainable adsorbent for heavy-metal removal in wastewater. Appl. Water Sci. 2026, 16, 224. [Google Scholar] [CrossRef]
  26. Chanthakhot, A.; Aungthitipan, P.; Tansomros, P.; Maskhunthod, P.; Janthakot, A.; Hongthong, S.; Kreethachat, T.; Imman, S.; Wongcharee, S. Characterization of biochar produced from sawdust and polypropylene plastic waste composite via slow pyrolysis. In Proceedings of the 2024 Geoinformatics for Spatial-Infrastructure Development in Earth and Allied Sciences (GIS-IDEAS), Chiang Rai, Thailand, 11–13 December 2024; IEEE: Piscataway, NJ, USA, 2024; pp. 1–6. [Google Scholar]
  27. Roberts, K.G.; Gloy, B.A.; Joseph, S.; Scott, N.R.; Lehmann, J. Life cycle assessment of biochar systems: Estimating the energetic, economic, and climate change potential. Environ. Sci. Technol. 2010, 44, 827–833. [Google Scholar] [CrossRef] [PubMed]
  28. Wernet, G.; Bauer, C.; Steubing, B.; Reinhard, J.; Moreno-Ruiz, E.; Weidema, B. The ecoinvent database version 3 (part I): Overview and Methodology. Int. J. Life Cycle Assess. 2016, 21, 1218–1230. [Google Scholar] [CrossRef]
  29. Intergovernmental Panel on Climate Change (IPCC). Climate Change 2021—The Physical Science Basis: Working Group I Contribution to the Sixth Assessment Report of the Intergovernmental Panel On Climate Change; Cambridge University Press: Cambridge, UK, 2023. [Google Scholar] [CrossRef]
  30. Thailand Greenhouse Gas Management Organization (TGO). Emission Factor from Electricity Generation/Consumption for Greenhouse Gas Mitigation Projects and Activities; Greenhouse Gas Mitigation Mechanism: Bangkok, Thailand, 2022. Available online: https://ghgreduction.tgo.or.th/en/premium-t-ver-download/download/6966/3801/32.html (accessed on 15 May 2026).
  31. Bank of Thailand (BOT). Foreign Exchange Rates (Annual Average, 2024). Available online: https://www.bot.or.th (accessed on 19 May 2026).
  32. Alhashimi, H.A.; Aktas, C.B. Life cycle environmental and economic performance of biochar compared with activated carbon: A meta-analysis. Resour. Conserv. Recycl. 2017, 118, 13–26. [Google Scholar] [CrossRef]
  33. Bayer, P.; Heuer, E.; Karl, U.; Finkel, M. Economical and ecological comparison of granular activated carbon (gac) adsorber refill strategies. Water Res. 2005, 39, 1719–1728. [Google Scholar] [CrossRef] [PubMed]
  34. Yahya, M.A.; Al-Qodah, Z.; Ngah, C.W.Z. Agricultural bio-waste materials as potential sustainable precursors used for activated carbon production: A review. Renew. Sustain. Energy Rev. 2015, 46, 218–235. [Google Scholar] [CrossRef]
  35. Jin, R.; Gao, S.; Cheshmehzangi, A.; Aboagye-Nimo, E. A holistic review of off-site construction literature published between 2008 and 2018. J. Clean. Prod. 2018, 202, 1202–1219. [Google Scholar] [CrossRef]
  36. IPCC. 2006 IPCC Guidelines for National Greenhouse Gas Inventories; Eggleston, H.S., Buenida, L., Miwa, K., Ngara, T., Tanabe, K., Eds.; IGES: Hayama, Japan, 2006; Available online: https://www.ipcc-nggip.iges.or.jp/public/2006gl/ (accessed on 30 March 2026).
  37. Woolf, D.; Amonette, J.E.; Street-Perrott, F.A.; Lehmann, J.; Joseph, S. Sustainable biochar to mitigate global climate change. Nat. Commun. 2010, 1, 56. [Google Scholar] [CrossRef] [PubMed]
  38. Babel, S.; Kurniawan, T.A. Low-cost adsorbents for heavy metals uptake from contaminated water: A review. J. Hazard. Mater. 2003, 97, 219–243. [Google Scholar] [CrossRef] [PubMed]
  39. Hamilton, W.P.; Kim, M.; Thackston, E.L. Comparison of commercially available escherichia coli enumeration tests: Implications for attaining water quality standards. Water Res. 2005, 39, 4869–4878. [Google Scholar] [CrossRef] [PubMed]
  40. Fawer, M.; Concannon, M.; Rieber, W. Life cycle inventories for the production of sodium silicates. Int. J. Life Cycle Assess. 1999, 4, 207–212. [Google Scholar] [CrossRef]
  41. Rodriguez-Caballero, A.; Aymerich, I.; Marques, R.; Poch, M.; Pijuan, M. Minimizing N2O emissions and carbon footprint on a full-scale activated sludge sequencing batch reactor. Water Res. 2015, 71, 1–10. [Google Scholar] [CrossRef] [PubMed]
Figure 1. Co-pyrolysis system processes for SPB adsorbent production; (a) sawdust feedstock (S/W). (b) Polypropylene (PP) waste feedstock, (c) SPB-500 biochar adsorbent produced at 500 °C and (d) community-scale LPG-fired co-pyrolysis reactor. ★= scenario-based greenhouse-gas assessment under waste valorisation conditions. FEP and HTP are qualitative literature-based benchmarking indicators and do not represent quantified midpoint LCIA results.
Energies 19 03330 g001
Figure 2. LCI flow diagram for the production of 1 kg sawdust–polypropylene biochar (SPB-500) by co-pyrolysis at 500 °C (functional unit = 1 kg SPB-500).
Energies 19 03330 g002
Figure 3. Techno-economic analysis of the locally fabricated sawdust–polypropylene (SPB-500) co-pyrolysis production system.
Energies 19 03330 g003
Figure 4. Techno-economic evaluation of community-scale SPB-500 production: (a) key economic parameters; (b) annual economic summary and payback calculation; (c) cumulative cash flow profile during the first 12 months of operation; and (d) effective production cost comparison between SPB-500 and commercial adsorbents.
Energies 19 03330 g004
Figure 5. Net scenario-based greenhouse-gas assessment production of SPB-500 versus scenario-based greenhouse-gas assessment conventional adsorbents: step-by-step emission accounting and environmental hotspot analysis.
Energies 19 03330 g005
Figure 6. SROI outcome map for community-scale SPB-500 co-pyrolysis deployment: comparison of unadjusted proxy values and adjusted Year 1 social values (THB) across nine outcome streams (O1–O9), with corresponding SROI adjustment factors (deadweight, attribution, and drop-off).
Energies 19 03330 g006
Figure 7. Present value contribution of individual outcomes (O1–O9) over the five-year assessment period.
Energies 19 03330 g007
Figure 8. Social return on investment (SROI) assessment of community-scale SPB-500 deployment: (a) SROI ratio under different scenarios; (b) comparison of total present value outcomes and total investment; (c) composition of base–case present value outcomes; and (d) contribution of outcomes to the United Nations Sustainable Development Goals (SDGs).
Energies 19 03330 g008
Table 1. CAPEX for the locally fabricated SPB co-pyrolysis production system.
Equipment ItemSpecificationCost (THB)Cost (USD)
Stainless-steel reactor (R-101)OD 60 cm, H 1.0 m, locally fabricated25,000699
LPG burner and gas fittingsIndustrial grade, 15–20 kW4500126
Temperature controller (TIC-101)PID type, K-type thermocouple250070
Char screw conveyor (C-101)Manual/semi-automatic, stainless steel300084
Drying oven (D-101)50–100 °C, 50 L capacity8000223
Ancillary items (piping, safety, insulation)Valves, gauges, fittings300084
Total CAPEX 46,0001286
Note: Skilled labor: approximately 500 THB h−1. The reactor size values mentioned above refer only to the physical prototype used for testing purposes and cannot be used as proof of the reactor’s commercial design validation. Selection of a reactor load of 1 kg as a test operational variable did not imply that such a value necessarily represented the maximal reactor’s loading potential. Neither technical nor economical parameters, such as the effective working volume, thermal efficiency of the system, heat loads, cycle time analysis, equipment utilization, manufacturing schedule, and maintenance needs have been analyzed in this experiment.
Table 2. OPEX per production batch and cost per kilogram of SPB-500 produced.
Cost ItemQuantity Per BatchUnit CostBatch CostBatch Cost
(THB)(THB)(USD)
Sawdust feedstock (V-101)800 g0.5 per kg0.40.01
PP plastic waste feedstock (V-102)200 g2.0 per kg0.40.01
LPG fuel (R-101 burner)~0.4 kg LPG20.0 per kg80.22
Electricity for oven drying (D-101)1.5 kWh4.5 per kWh6.750.19
Labor—grinding and handling (G-101)1 h80 per h802.23
Maintenance and depreciation allowancePer batch150.42
Total batch OPEX110.553.09
Estimated SPB yield at 500 °C (~35% w/w) [27]350 g per batch
Production cost per kg SPB-500316 THB kg−1~8.8 USD kg−1
Table 3. System boundary definition for the SPB gate-to-gate environmental screening assessment.
StageIncluded in System BoundaryExcluded/Rationale
Feedstock acquisitionReceipt of sawdust and PP waste at production siteUpstream collection and transport: excluded waste-input allocation (ISO 14044) [28]
Pre-treatment (drying, size reduction)Electricity for oven drying (D-101); manual size reductionEquipment manufacturing: excluded outside gate-to-gate scope
Pyrolysis (R-101)LPG combustion for heating; process CO2, CO, CH4 emissions from thermal oxidationReactor fabrication embodied energy: excluded from screening scope
Post-combustion gas treatment (F-101)Thermal oxidation of pyrolysis vapors; flue gas CO2 emissionsDetailed gas-phase speciation: not available at this stage
Product collection and grinding (G-101)Manual labor; marble mortar grindingMachine-ground alternative: excluded manual process used
Product use phaseExcluded from gate-to-gate scopeFull use-phase LCA recommended in future work
End-of-life (spent SPB) Excluded from gate-to-gate scopeRegeneration cycle data available but EOL allocation beyond scope
Table 4. Inputs and outputs (gate-to-gate inventory).
Input/Output ItemQuantity per kg SPBEmission FactorUnitCO2e per kg SPB
Inputs
Sawdust feedstock2.2860 (waste-input rule)kg0
PP plastic waste feedstock0.5710 (waste-input rule)kg0
LPG fuel (R-101 burner)1.1432.983 kg CO2e kg−1 LPGkg LPG3.410
Electricity for drying (D-101)4.2860.5765 kg CO2e kWh−1kWh2.471
Post-combustion of pyrolysis vapors, gases, and oils0.788 kg C oxidized44/12 kg CO2 kg−1 Ckg C2.890
Labor (manual handling)2.857 person-hNot quantified
Outputs
SPB-500 product1kg
Gross gate-to-gate GHG emissions+8.771
Table 5. Consequential waste-diversion scenario (not included in gate-to-gate inventory).
Credit ItemQuantityAssumptionUnitCO2e Credit
Potential carbon-retention credit, conditional on safe EOL managementtotal carbon content in SPB-500, 0.844 kg C (CHNS analysis)Stability factor, 0.80 (IBI criterion), Stable carbon content = 0.675 kg Ckg CO2e−2.477 (0.675 × 44/12)
Avoided landfill CH4 from sawdust diversion2.286 kg sawdustAlternative disposal scenariokg CO2e−1.596
Avoided PP open burning0.571 kg PPAlternative disposal scenariokg CO2e−1.616
Total consequential credits−5.689
Table 6. Hybrid greenhouse-gas balance.
IndicatorValue
Gross gate-to-gate emissions+8.771 kg CO2e kg−1 SPB
Total consequential credits−5.689 kg CO2e kg−1 SPB
Net GHG balance (scenario-based), including conditional carbon-retention and waste-diversion credits+3.082 kg CO2e kg−1 SPB
Note: Gross gate-to-gate emissions represent the attributional life cycle inventory within the defined system boundary. Carbon sequestration and avoided-disposal credits are reported separately as a consequential waste-diversion scenario and are not included in the gate-to-gate inventory. Therefore, the hybrid scenario-based net greenhouse-gas balance should be interpreted as a hybrid scenario-based indicator rather than a strict attributional LCA result.
Table 7. Emission factors applied in the CO2 emission assessment.
Emission Source/ActivityUnitEmission FactorValueReference
LPG combustion (stationary)kg CO2e kg−1 LPGEFLPG2.983IPCC 2006, Vol.2, Tier 1 [29]
Thai grid electricitykg CO2e kWh−1EFelec0.5765TGO Thailand 2022 [30]
Landfill CH4 from sawdust decompositionkg CO2e kg−1 sawdustEFsaw0.698IPCC 2006, Vol.5; GWP100 (CH4) = 27.9 AR6 [29]
Open burning of PP plastic wastekg CO2e kg−1 PPEFPP2.83IPCC 2006, Vol.5, Annex 3 [29]
Carbon sequestration in stable biocharkg CO2e kg−1 C in biocharEFCseq−3.667Stoichiometric: 44/12 CO2:C ratio
Biochar carbon stability factor (fstable)Dimensionlessfstable0.80IBI criterion (H/Corg < 0.4)
Note: GWP100 of CH4 = 27.9 kg CO2e. LPG emission factor includes CO2 (2.921 kg kg−1) + CH4 (0.062 kg CO2e kg−1). Landfill CH4 factor: 0.025 kg CH4 kg−1 organic waste × GWP 27.9 = 0.698 kg CO2e kg−1. Carbon stability factor of 0.80 reflects the fraction of biochar carbon that persists in soil over >100 years under temperate conditions; H/Corg (0.022) calculated confirmed <0.4 for SPB-500 sample.
Table 8. Environmental screening results per kg SPB-500 produced, with comparison to GAC production.
Impact CategoryUnitSPB-500 (This Study)Commercial GAC (Literature)Comparison with GAC
Gross GWP100 (production only)kg CO2e kg−1+8.7713.5–9.0 [28,32]Within reported literature range
Net GWP100 (hybrid scenario-based)kg CO2e kg−1+3.0823.5–9.0 (no consequential credits) [29]Approximately 0.4–5.9 kg CO2e kg−1 lower
GWP100 per g Cu2+ removed (functional unit basis)g CO2e g−1 Cu2+ removed0.0470.044–0.113 [33]Within lower reported range
Cumulative Energy Demand (CED)MJ kg−157.650–120 [28,32]Lower to comparable
Freshwater Eutrophication Potential (FEP)QualitativeLow (no chemical activation reagents)Moderate (KOH/ZnCl2 activation) [34]Lower (qualitative benchmark)
Human-Toxicity Potential (HTP)QualitativeLow (LPG combustion with post-combustion control)Moderate (chemical activation and coal-derived emissions) [35]Lower (qualitative benchmark)
Land useQualitativeNegligible (waste-derived feedstocks)Low–moderate (biomass cultivation/mining) [29,36]Lower
Potential carbon-retention credit *kg CO2e kg−1−2.477Variable (−0.5 to −2.0) [37]Higher potential credit
Note: * Potential carbon-retention credit is a scenario-based estimate assuming long-term stable carbon storage under appropriate end-of-life management. It does not represent a verified carbon credit or actual CO2 removal.
Table 9. Comparative environmental benchmarking of SPB-500 versus commercial adsorbents for heavy-metal removal.
AdsorbentGWP (kg CO2e kg−1)Net GWP (with Credits)CED (MJ kg−1)Activation ChemicalsFEPHTP
SPB-500 (this study)+8.771 +3.082 ~57.6NoneLowLow
Commercial biochar (typ.) [28]2.0–5.0−0.5 to +2.020–60SometimesLow–mod.Low–mod.
GAC (granular-activated carbon) [32,38]3.5–9.03.5–9.0 (no credit)50–120Yes (KOH/ZnCl2)ModerateModerate
PAC (powdered-activated carbon) [39]4.0–10.04.0–10.060–130Yes (H3PO4)ModerateModerate
Synthetic zeolite [40]5.0–12.05.0–12.080–180N/ALowLow
Ion-exchange resin [41] 12–2512–25200–400N/A (synthetic)ModerateHigh
Note: ★ = scenario-based greenhouse-gas assessment under waste valorisation conditions. FEP and HTP are qualitative literature-based benchmarking indicators and do not represent quantified midpoint LCIA results.
Table 10. Process input parameters per kg SPB produced at each pyrolysis temperature.
ParameterSPB-500Source/Assumption
Biochar yield (% w/w of feedstock)35%Lit. slow pyrolysis, lignocellulosic-PP blends
Feedstock input per kg SPB (kg)2.857=1/yield fraction
Sawdust input per kg SPB (kg) [4:1 ratio]2.286=feedstock × 0.80
PP plastic input per kg SPB (kg) [4:1 ratio]0.571=feedstock × 0.20
LPG consumed per kg SPB (kg LPG)1.143=0.4 kg batch−1/yield fraction
Electricity for drying per kg SPB (kWh)4.286=1.5 kWh batch−1/yield fraction
Carbon content of SPB (wt.%, CHNS Table 2)84.43%Measured, CHNS analysis (LECO CHN628)
Stable C in biochar (kg per kg SPB)0.675=C% × 1 kg × fstable (0.80)
Table 11. Step-by-step CO2 emission calculation for SPB-500 (pyrolysis at 500 °C).
StepEmission Source or CreditCalculationValueUnitkg CO2e kg−1 SPB
GROSS EMISSIONS
1LPG combustion (R-101 burner)1.143 × 2.9831.143 kg LPG+3.410
2Grid electricity drying (D-101)4.286 × 0.57654.286 kWh+2.471
3Post-combustion of vapors/gases/oils0.788 × 3.6670.778kg C+2.890
Gross production emission (Eprod)Step 1 + Step 2 + Step 3 +8.771
CREDITS
3Stable C sequestration in biochar0.675 × (−3.667)0.675 kg C−2.477
4Avoided landfill CH4 sawdust2.286 × 0.6982.286 kg Sawdust−1.596
5Avoided open-burning PP plastic0.571 × 2.8300.571 kg PP−1.616
Total creditsStep 3 + Step 4 + Step 5 −5.687
NET CO2e balance (Etotal) Eprod + credits +3.082 (scenario-based greenhouse-gas assessment) ★
Note: ★ = scenario-based greenhouse-gas assessment under waste valorisation conditions. FEP and HTP are qualitative literature-based benchmarking indicators and do not represent quantified midpoint LCIA results.
Table 12. Total investment (inputs) over the 5-year SROI analysis period.
Input ItemYear 1 (THB)Years 2–5 p.a. (THB)5-Year Total (THB)ContributorInput Item
CAPEX reactor + equipment46,000046,000University/grantCAPEX reactor + equipment
Annual OPEX (production cost basis)379,200379,2001,896,000Project budgetAnnual OPEX (production cost basis)
Labor (2 FTE operators)384,000384,0001,920,000Local employmentLabor (2 FTE operators)
Research/monitoring costs120,00060,000360,000UniversityResearch/monitoring costs
Adsorption system (columns, plumbing)80,00010,000120,000Municipality/projectAdsorption system (columns, plumbing)
Total investment1,009,200833,2004,342,000Total investment
Table 13. Outcome map with indicators, financial proxies, and SROI adjustment factors.
OutcomeIndicatorFinancial ProxyProxy Value (THB yr−1)Dead-weightAttributionDrop-OffAdjusted Value yr 1 (THB)
O1: Improved water quality for 50 householdsImproved Cu2+ removal and wastewater quality under the experimental conditionsAvoided bottled-water expenditure (alternative water supply cost only)750,0005%90%0%641,250
O2: Reduced health risk Cu2+ exposureNumber of households with access to Cu2+ that improved Cu2+ removal and wastewater quality under the experimental conditionsAvoided healthcare costs associated with Cu-related illness (cost-of-illness approach)400,00010%80%0%288,000
O3: Diversion of sawdust from open burningTonnes of sawdust diverted per year (2.857 kg/kg SPB × 1200 kg/yr = 3.43 t/yr)Avoided air pollution cost: PM2.5 health impact + CO2e carbon price (35 USD t−1)280,00010%85%0%213,300
O4: Diversion of PP plastic from landfill/illegal dumpTonnes of PP diverted (0.571 kg/kg SPB × 1200 = 0.685 t/yr)Avoided landfill cost + avoided marine pollution cost (250 USD t−1 social cost)62,00015%80%0%42,160
O5: Local employment creation2 FTE jobs created for local operators/techniciansWell-being value of employment (Fujiwara et al. proxy: 25,000 THB/FTE/yr above wage)50,00020%90%0%36,000
O6: Skills and capacity buildingNumber of operators trained in pyrolysis and water treatmentValue of equivalent vocational training course (market rate)30,00020%90%10%19,440
O7: Carbon sequestration (stable C in biochar)kg CO2e sequestered per year: 0.675 kg C/kg SPB × 1200 × 3.667 = 2970 kg CO2e yr−1Carbon credit price: 35 USD t−1 CO2e (Thai voluntary carbon market estimate)37070%100%10%3522
O8: Reduced industry compliance risk (sawmill + PP supplier)Reduced regulatory fines/penalties for illegal waste disposalAverage environmental fine avoided (PCD Thailand, solid waste violation)120,00030%70%10%55,860
O9: Knowledge and research valuePeer-reviewed publication in high-impact journal; accessible dataEstimated grant equivalent and knowledge externality (bibliometric proxy)200,00020%100%20%128,000
Total 1,427,532
Table 14. Present value (PV) calculation of adjusted outcomes over the 5-year assessment period.
OutcomeAdj. Year 1 Value (THB)PV Year 1PV Year 2PV Year 3PV Year 4PV Year 5Total PV (THB)
O1—Water quality improvement641,250610,714581,632553,935527,557502,4362,776,274
O2—Health risk reduction288,000274,286261,224248,785236,938225,6551,246,888
O3—Sawdust diversion213,300203,143193,470184,257175,483167,127923,480
O4—PP waste diversion42,16040,15238,24036,41934,68533,033182,529
O5—Employment creation36,00034,28632,65331,09829,61728,207155,861
O6—Skill development *19,44018,51415,86013,58611,640997169,571
O7—Carbon sequestration *35223354287424632111180912,611
O8—Compliance-risk reduction *55,86053,20045,60039,08533,50128,715200,101
O9—Knowledge generation *128,000121,905104,49089,56376,76865,801458,527
Total1,427,5321,359,5531,276,0431,199,1911,128,3001,062,7546,025,841
Noted: * Drop-off applied according to Table 13 assumptions. Discount rate = 5% per annum.
Table 15. SROI ratio calculation and sensitivity analysis.
ScenarioTotal PV Outcomes (THB)Total Investment (THB)SROI Ratio
Base–case (all outcomes, 5% discount rate)6,025,8414,342,0001.39:1
Conservative (excluding O9: knowledge value)5,567,3144,342,0001.28:1
Conservative (10% discount rate)4,892,0004,342,0001.13:1
Optimistic (full O1 proxy value retained)6,570,0004,342,0001.51:1
Environmental outcomes only (O3 + O4 + O7)1,118,6204,342,0000.26:1
Social outcomes only (O1 + O2 + O5 + O6)4,248,5944,342,0000.98:1
Note: SROI = Total present value of outcomes ÷ total investment. Total investment was revised to 4,342,000 THB according to the updated operating costs assumptions presented in Table 10.
Disclaimer/Publisher’s Note: The statements, opinions and data contained in all publications are solely those of the individual author(s) and contributor(s) and not of MDPI and/or the editor(s). MDPI and/or the editor(s) disclaim responsibility for any injury to people or property resulting from any ideas, methods, instructions or products referred to in the content.