Article

Systematic Characterization and Global Sensitivity Analysis of Structural Responses for a Spar-Type FOWT Across Wind–Wave Misalignment


1
CNOOC Gas and Power Group Co., Ltd., Beijing 100028, China
2
CNOOC Key Laboratory of Liquefied Natural Gas and Low Carbon Technology, Beijing 100028, China
3
State Key Laboratory of Coastal and Offshore Engineering, School of Infrastructure Engineering, Dalian University of Technology, Dalian 116024, China
4
Institute of Earthquake Engineering, School of Infrastructure Engineering, Dalian University of Technology, Dalian 116024, China
*
Author to whom correspondence should be addressed.
Energies 2026, 19(11), 2707; https://doi.org/10.3390/en19112707
Submission received: 11 April 2026 / Revised: 20 May 2026 / Accepted: 1 June 2026 / Published: 4 June 2026

Abstract

Wind–wave misalignment is a pervasive environmental phenomenon that significantly affects the structural integrity of floating offshore wind turbines (FOWTs). For a Spar-type FOWT across the full 0°–90° misalignment range, this study systematically conducts dynamic response characterization and parameter sensitivity analysis, quantifying the directional modulation effects on five critical dynamic indicators, including tower-base Fore-Aft (F-A) and side-to-side (S-S) bending moments, maximum Von Mises stress, and fairlead tensions. Results demonstrate that wind–wave misalignment triggers a significant redistribution of structural energy, where side-to-side bending moments and fairlead tensions exhibit distinct peak characteristics at specific non-collinear headings. Rather than merely evaluating structural responses, this study emphasizes the sensitivity of environmental parameters to reveal a dominance-switching mechanism. As the misalignment angle increases, the governing factors of structural response dynamically shift from wind variables to wave variables. This research provides a rigorous mechanical explanation for complex response evolution and offers a scientific basis for the robust design of floating wind turbines in multi-directional sea states.

1. Introduction

With the global strategic shift toward deep-sea wind energy, floating offshore wind turbines (FOWTs) have become a focal point of maritime engineering [1]. Compared to fixed-bottom structures, FOWTs are characterized by their multi-degree-of-freedom motions and intricate aero-hydrodynamic couplings [2,3,4]. In real-world offshore sites, wind and wave excitations are inherently stochastic and multi-directional. Due to the diverse physical mechanisms of atmospheric and oceanic movements, wind–wave misalignment is a prevalent environmental condition rather than an occasional occurrence [5].
Wind–wave misalignment fundamentally alters the directional distribution of environmental loads on the tower and mooring system [6]. The traditional aligned assumption will significantly underestimate the extreme response of the side–side (S-S) tower and oblique mooring lines, introducing potential safety hazards to the structural design. Therefore, clarifying the influence mechanism of wind–wave misalignment on the dynamic response and uncertainty characteristics of Spar-type FOWTs is critical for the robust design and safe operation of deep-sea floating wind farms.
Despite the recognized significance of wind–wave misalignment in modulating dynamic behaviors [7,8], early design paradigms predominantly relied on collinear assumptions. However, this simplification has been increasingly challenged by empirical evidence; for instance, Shanahan et al. [9] demonstrated that misalignment angles can exceed 30° during hurricane events. Regarding fixed-bottom turbines, Trumars et al. [10] initially highlighted the adverse impacts of non-collinear loads on the structural integrity of monopile OWTs through operational data analysis. Furthermore, Guo et al. [11] reported that wind–wave misalignment could elevate peak tower-base bending moments by 28% under extreme conditions and induce asymmetric fatigue damage. These findings reveal that non-collinear loading breaks structural symmetry and activates high-order modal coupling, providing pivotal insights for the study of FOWTs.
FOWTs have transitioned from conceptual feasibility studies to commercial-scale deployment. Extensive research has been conducted on various substructure types, including Spar-buoy, barge, semi-submersible, and tension-leg platforms [12]. Notably, studies by Bachynski et al. [13] and Doubrawa et al. [14] have demonstrated that the structural loads and dynamic responses of Spar-type FOWTs exhibit a higher sensitivity to fluctuations in environmental conditions.
For Spar-type FOWTs, early studies mainly focused on the global six-degrees-of-freedom motions of the platform. Ali et al. [15] found that non-collinear environmental loads significantly amplify the pitch and sway motions, leading to the energy concentration of tower-base loads within the 0.03–0.06 Hz range and triggering resonant effects. Lyu et al. [16] analyzed 13 scenarios with angles ranging from 0° to 90° and revealed that non-collinear loads intensify pitch and sway motions, shifting the response energy toward the frequency region dominated by mooring system stiffness. Furthermore, Nguyen et al. [17] and Chen et al. [18] highlighted the synergistic effects of complex environmental factors such as wind–wave misalignment, wave age, and combined wave–current interactions, which considerably increase the complexity of structural responses.
To rigorously quantify the relative importance of the diverse stochastic variables involved in these complex coupled responses, sensitivity analysis has been extensively adopted as a robust evaluative framework [19]. Early efforts, such as those by Thapa et al. [20] and Shittu et al. [21], utilized finite element models to identify wind speed uncertainty as a primary driver for tower and jacket integrity. Similarly, Glišić et al. [22] underscored the preponderance of hydrodynamic parameters in governing the fatigue life of monopile foundations. Han et al. [23] and Velarde et al. [24] conducted a reliability-based sensitivity analysis on 5 MW monopile turbines, confirming that environmental stochasticity exerts the most profound influence on both ultimate deflections and fatigue load distributions.
Despite these advancements, a critical knowledge gap remains concerning the sensitivity evolution mechanisms of FOWTs under the full spectrum of wind–wave misalignment. While the aforementioned studies have established robust sensitivity analysis protocols for collinear or fixed-bottom configurations, the dynamic transition of sensitivity regimes—specifically, how governing parameters shift as the misalignment angle increases—has not been systematically quantified.
To fill the identified research gaps, this study systematically investigates the structural dynamic response and parameter sensitivity of a Spar-type FOWT under varied wind–wave misalignment angles. The remainder of this article is organized as follows: Section 2 establishes the fully coupled numerical model, environmental load cases, the Kriging surrogate model framework, and the global sensitivity calculation methodology. Section 3 analyzes the evolution of the structural dynamic responses across the full range of misalignment, presents the comprehensive results of the sensitivity analysis, and details the discovery of the shifting sensitivity mechanisms under different heading angles. Finally, Section 4 concludes the study with key findings and design recommendations.

2. Dynamic Model and Theoretical Basis

2.1. Spar-Type Offshore Wind Turbine Computational Model

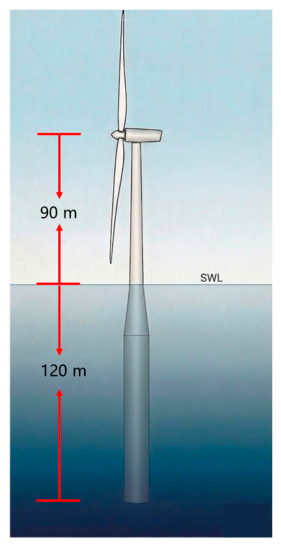
As depicted in Figure 1, the FOWT architecture considered herein consists of the NREL 5 MW reference wind turbine mounted upon the OC3-Hywind Spar-buoy substructure [25,26]. This utility-scale turbine utilizes a three-bladed, upwind configuration with variable speed and collective pitch-control capabilities, characterized by a 126 m rotor diameter and a hub elevation of 90 m above the still water level (SWL). The support platform, based on the OC3-Hywind design, is a deep-draft cylindrical buoy optimized for deep-water deployments (exceeding 300 m). Static stability is fundamentally maintained by the low-center-of-gravity principle, where heavy ballast integrated into the lower hull section provides a substantial restoring moment against environmental perturbations.
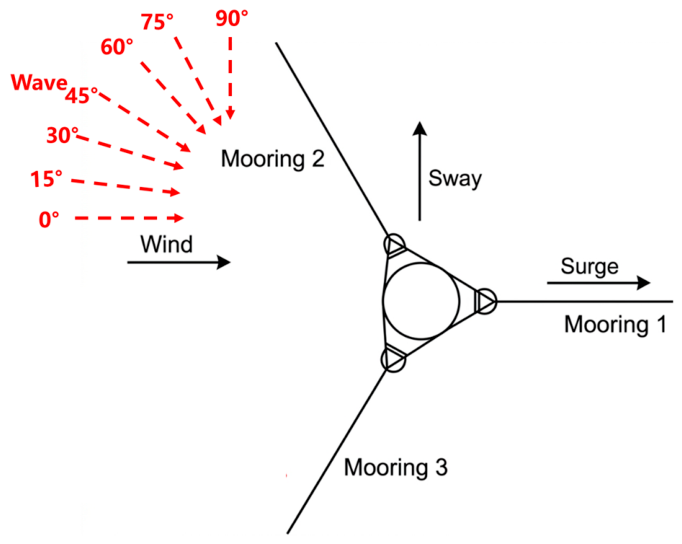
To ensure robust station-keeping and rotational stability, the platform is secured by a catenary mooring system consisting of three lines connected via Delta configurations, with an angular spacing of 120° between adjacent lines [27]. These fairleads are situated at a draft of 70 m below the SWL. The comprehensive structural properties and configuration parameters of the integrated FOWT system are summarized in Table 1, while the spatial layout of the mooring arrangement is illustrated in Figure 2.

2.2. Numerical Simulation Method and Tool

To simulate the complex time-domain dynamic responses of FOWTs, various high-fidelity numerical frameworks and commercial packages have been developed. This research utilizes OrcaFlex (v. 11.5b), a commercial software package developed by Orcina, which is extensively employed in both academia and the offshore industry due to its robust aero-servo-hydro-elastic coupling capabilities [28,29]. This software integrates aerodynamic and hydrodynamic loads, platform and mooring system dynamics, and wind turbine control strategies to numerically solve the governing equations of motion in the time domain. The fully coupled dynamic behavior of the FOWT system is achieved by solving the following equation [30,31]:
M ( p , v ˙ ) + C ( p , v ) + K ( p ) = F ( p , v , t )
where p , v , and v ˙ respectively represent the position, velocity, and acceleration of the FOWT system, and t represents the simulation time. In OrcaFlex, M ( p , v ˙ ) , C ( p , v ) , K ( p ) , and F ( p , v , t ) are not prescribed as constant global matrices but are evaluated internally at each time step according to the instantaneous system state and the user-defined model properties. Specifically, M ( p , v ˙ ) includes the structural mass, inertia properties, and hydrodynamic added mass; C ( p , v ) includes velocity-dependent damping and drag contributions; K ( p ) represents the position-dependent restoring and structural stiffness terms; and F ( p , v , t ) includes external loads such as wind, waves, currents, gravity, buoyancy, and other applied loads.

2.3. Environmental Load Cases and Simulation Settings

To investigate the synergistic effects of wind and waves on the Spar-type FOWT, a specific environmental condition is defined based on the Design Load Case 1.6a from the IEC 61400-3 standard [32]. The rationale for focusing on this single combination of environmental parameters is that this operational state typically induces the most critical extreme loads on the FOWT support structure, as demonstrated by Okpokparoro et al. [33]. Specifically, considering that the rotor thrust peaks near the rated wind speed, the incident wind is described by the Normal Turbulence Model with a mean velocity of 11.4 m/s, conforming to the Kaimal spectral model [16]. The stochastic sea state is characterized by the Severe Sea State model using the JONSWAP spectrum, with a significant wave height of 8.52 m and a peak period of 12.45 s. This severe hydrodynamic excitation is essential for evaluating the dynamic responses of the platform [33]. Additionally, to simulate a realistic offshore environment, a Normal Current Model with a constant surface current of 0.6 m/s is concurrently applied.
In this study, the incident wind direction is maintained constant along the positive x-axis (surge direction). This alignment reflects the operational logic of the turbine’s yaw-regulation system, which reorients the nacelle to ensure the rotor disk remains perpendicular to the prevailing wind for optimal energy extraction. Consequently, the x-axis is defined as the principal wind heading. According to the IEC 61400-3 standard [32], the wind-generated sea-surface current may be assumed to be aligned with the wind direction; therefore, the surface current is assumed to be collinear with the incident wind in this study. To investigate the effects of wind–wave misalignment, the wave incident angle is varied. Specifically, LC1–LC7 correspond to wave incidence angles of 0°, 15°, 30°, 45°, 60°, 75°, and 90°, respectively, while the other environmental parameters are kept constant: a wind velocity of 11.4 m/s, a significant wave height of 8.52 m, a peak period of 12.45 s, and a current speed of 0.6 m/s. Each time-domain simulation is executed for a total duration of 4200 s, with the initial 600 s discarded as startup transients to ensure that only the stationary dynamic responses are considered for subsequent analysis.

2.4. Kriging Surrogate Model

Fully coupled time-domain simulations of FOWTs are highly accurate but computationally expensive, making direct global sensitivity analysis practically prohibitive. To overcome this computational bottleneck, a Kriging surrogate model is constructed to approximate the high-fidelity physics-based simulations [34]. Since the accuracy of the surrogate model heavily depends on the space-filling quality of the training data, this section first introduces the Latin Hypercube Sampling (LHS) technique and the selected random variables, followed by the mathematical formulation of the Kriging methodology.

2.4.1. Latin Hypercube Sampling

To efficiently explore the multi-dimensional parameter space of the FOWT system with limited computational resources, the LHS method is employed [35]. LHS is a space-filling sampling method that can uniformly cover the entire value range of multi-dimensional input variables with a limited number of samples, which is superior to simple random sampling for surrogate model construction [36,37].
Specifically, the execution of LHS begins by partitioning the cumulative distribution function (CDF) of each input variable into N non-overlapping intervals of equal probability [38,39,40]. A value is then randomly selected from within each interval and transformed into a physical sample value using the inverse CDF. Finally, the N samples generated for each individual variable are randomly combined to assemble the required set of input vectors.

2.4.2. Selection of Random Variables

Based on the stochastic model defined in this study, five random variables are selected as the input space, as illustrated in Table 2. These variables focus exclusively on environmental excitations and provide a comprehensive basis for evaluating the sensitivity of the dynamic response. To isolate the physical mechanisms induced by wind and wave misalignment, the structural properties of the floating wind turbine are treated as a deterministic baseline. Rigorously characterizing material uncertainties requires advanced probabilistic models based on the Maximum Entropy principle to ensure the positive definite properties of random elasticity tensors, as established by the comprehensive studies of Guilleminot and Soize [41]. Therefore, maintaining a deterministic structural model ensures mathematical rigor while keeping the present research focused purely on environmental load variations.

2.4.3. Surrogate Model Construction

The Kriging model, one of the most widely adopted approaches for uncertainty analysis in offshore wind engineering, is selected as the surrogate modeling framework in this work, as it exhibits unparalleled performance in capturing the highly nonlinear mapping between multi-dimensional input variables and the structural dynamic responses of FOWT [44,45].
Kriging is an interpolation method based on spatial statistics, widely applied in fields such as geology, engineering, and environmental science, particularly for predicting unknown functions at irregular data points. The relationship between the output Y = ( y 1 , y 2 · · · y n ) and the experimental points x = ( x 1 , x 2 , · · · x n ) can be expressed by the following mathematical expression:
Y ^ ( x )   =   f ( x )   +   δ ( x )
where f ( x ) represents the trend function, as shown in Equation (3). The δ ( x ) denotes the residual between the true value and the approximate value.
f ( x ) = i = 1 n β i b i ( x )
β i denotes the coefficients; b i ( x ) denotes the basis functions.
Here, δ ( x ) represents the Gaussian process outlined in Equation (4):
C o v ( x i ,   x j ) = σ 2 R ( θ ,   x i ,   x j )
where R ( θ ,   x i ,   x j ) represents the correlation function with a super parameter θ .

2.5. Global Sensitivity Analysis Method

In this study, Sobol’ method [46] is adopted to perform global sensitivity analysis, which is the most widely used variance decomposition-based global sensitivity analysis approach in the field of uncertainty quantification for marine engineering systems [47,48]. It quantifies the importance of each variable by attributing the total output uncertainty to specific input fluctuations or their synergistic effects.
The methodology operates on the functional decomposition of the model’s total variance, V ( Y ) , into components of increasing dimensionality. Assuming the structural response is a function of k independent variables, Y = f ( X 1 , X 2 , , X k ) , the variance summation is expressed as:
V ( Y ) = i = 1 k V i + 1 i < j k k V i j + + V 1 , 2 , , k
where V i is the output variance caused by the individual variation in the input variable X i , and V i j is the interaction part caused by the joint variation of X i and X j , excluding their individual effects, and others.
Sobol’s method defines two principal indices: the first-order Sobol index, which quantifies the isolated contribution of an input variable X i to output uncertainty, and the total-effect Sobol index, which captures the overall contribution of X i , including all interaction effects with other variables. These indices are formally presented in Equations (6) and (7), respectively.
S i = V i V ( Y ) = V [ E ( Y | X i ) ] V ( Y )
S T i = E [ V ( Y | X ~ i ) ] V ( Y ) = 1 V [ E ( Y | X ~ i ) V ( Y )

3. Results and Discussion

3.1. Shear Force and Bending Moment at the Tower Base in the F-A Direction

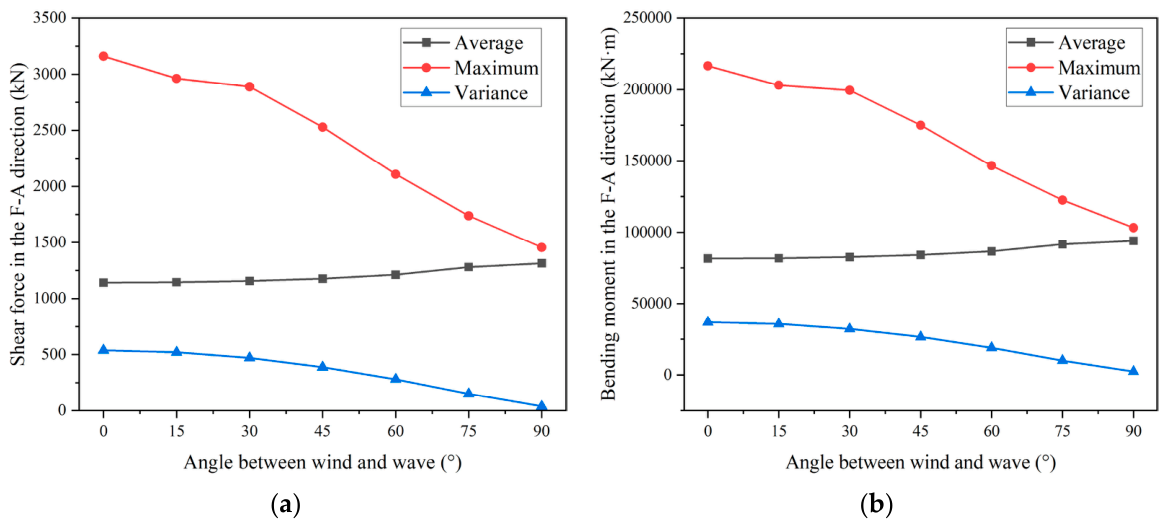
The dynamic load characteristics at the tower base are essential for evaluating the structural integrity of the FOWT system. Figure 3 illustrates the time-series responses of the tower-base shear force and bending moment in the front-aft (F-A) direction across various wind–wave misalignment angles. It is observed that both the shear force and bending moment exhibit prominent oscillations around a non-zero mean value; this mean offset is primarily attributed to the steady aerodynamic thrust and constant current loads.
As illustrated in Figure 3a, the three key statistical metrics (mean, maximum, and variance) of the tower-base shear force in the F-A direction exhibit distinctly differentiated variation trends with the increase in the wind–wave misalignment angle. Under the aligned wind–wave incidence condition (0° misalignment), the maximum shear force reaches 3160.95 kN, which represents the most severe extreme response across all investigated loading cases. As the wind–wave misalignment angle increases from 0° to 90°, the maximum shear force shows a continuous and monotonic decreasing trend, dropping to 1454.43 kN at 90° misalignment, corresponding to a total reduction of 53.97%. Meanwhile, the variance of the shear force, which quantifies the fluctuation amplitude of the dynamic response relative to its mean value, presents a remarkable attenuation with the rising misalignment angle: it decreases from 538.00 kN at 0° to 38.88 kN at 90°. This observation indicates that the excitation effect of hydrodynamic loads on the F-A shear force vibration is continuously weakened as the wave incidence direction deviates from the incoming wind direction. In stark contrast, the mean value of the shear force only exhibits a mild and steady upward trend over the full range of misalignment angles, rising gradually from 1142.12 kN at 0° to 1314.30 kN at 90°, with an overall fluctuation amplitude of less than 16%. This phenomenon demonstrates that the mean level of the F-A shear force is predominantly governed by the steady aerodynamic thrust from the rotor, while the variation in the wave incidence direction has a negligible influence on this statistical metric.
As depicted in Figure 3b, the statistical characteristics of the F-A bending moment at the tower base exhibit a highly consistent variation trend with those of the F-A shear force presented previously. Under the aligned wind–wave incidence condition (0° misalignment), the maximum bending moment reaches 216,587.40 kN·m, representing the ultimate extreme response across all investigated loading cases. With the increase in the wind–wave misalignment angle, the maximum bending moment shows a continuous monotonic decreasing trend, dropping to 103,143.61 kN·m at 90° misalignment, corresponding to a total reduction of 52.38%—an attenuation amplitude nearly identical to that of the maximum shear force. Similarly, the variance of the bending moment demonstrates a monotonic and significant downward trend, decreasing from 36,958.81 kN·m at 0° to 2485.99 kN·m at 90°. This further substantiates that the hydrodynamic excitation in the F-A direction weakens continuously as the wave heading deviates from the wind direction. Meanwhile, the mean value of the bending moment only presents a mild upward feature across the full range of loading cases, rising slowly from 81,506.65 kN·m at 0° to 93,970.40 kN·m at 90°, with a growth rate of merely 15.29%. This finding further confirms that the static offset of the F-A bending moment is also absolutely dominated by the aerodynamic overturning moment induced by the wind turbine rotor, and the variation in wave incidence direction has no significant impact on its mean level.
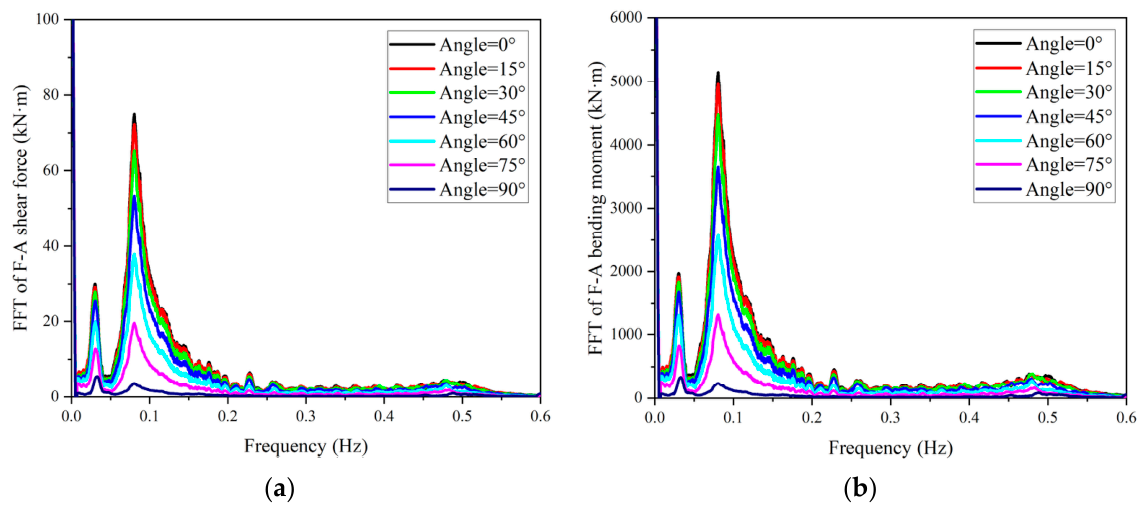
To further elucidate the energy distribution and excitation mechanisms of the tower-base loads, Power Spectral Density (PSD) analyses were performed for both the F-A shear force and bending moment [49]. As shown in Figure 4a,b, the spectral density at the wave-frequency (WF) peak undergoes a drastic reduction as the wind–wave misalignment angle increases from 0° to 90°. For the collinear case, the WF energy is most pronounced, reflecting the intense hydrodynamic impact when waves are directly aligned with the tower’s F-A direction. However, as the wave heading shifts towards 90°, the wave-induced spectral energy in the F-A direction is almost entirely suppressed. This spectral evolution provides a frequency-domain explanation for the variance attenuation observed in the statistical analysis, confirming that the reduction in dynamic tower-base loads is predominantly caused by the diminished wave-frequency excitation in the F-A direction. This finding further confirms that the 0° aligned wind–wave incidence is the most unfavorable working condition for the F-A direction tower-base load design, as it induces the strongest wave excitation in the F-A direction and the most severe dynamic response of the structure.

3.2. Shear Force and Bending Moment at the Tower Base in the S-S Direction

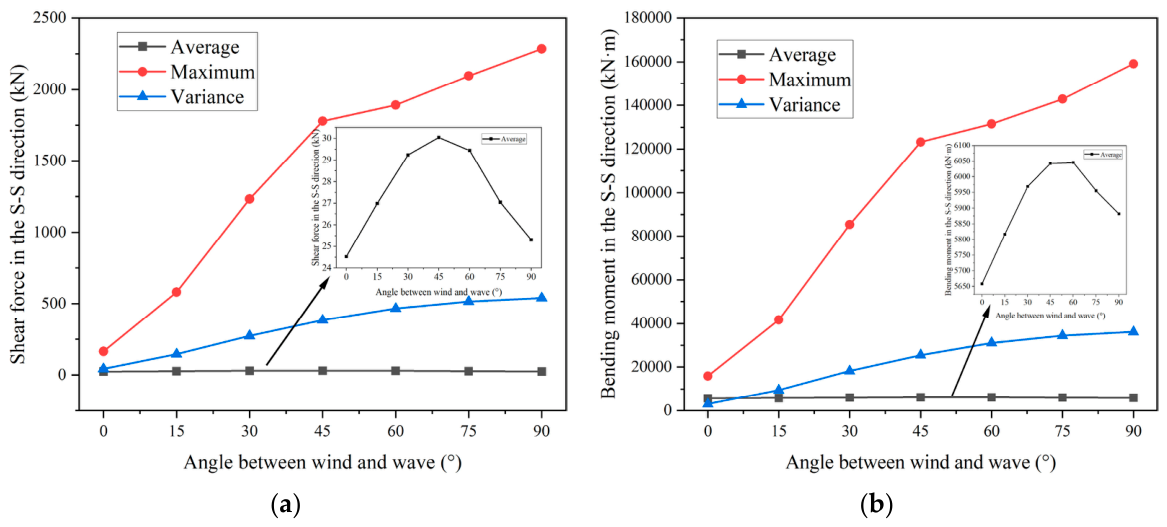
This section analyzes the statistical characteristics of S-S shear force and bending moment at the tower base under wind–wave misalignment angles ranging from 0° to 90°, whose response law shows a completely opposite trend to the F-A direction.
As shown in Figure 5a, the mean value of S-S shear force remains near zero across all cases, with only a minor non-monotonic fluctuation and an overall amplitude below 30 kN, indicating negligible contribution from steady aerodynamic loads. In contrast, the maximum value and variance of S-S shear force exhibit a continuous monotonic increase with rising misalignment angle: the maximum shear force surges from164.98 kN at 0° to 2285.24 kN at 90°, and the variance rises from 42.65 kN to 538.84 kN synchronously. This demonstrates that the dynamic response of S-S shear force is absolutely dominated by hydrodynamic loads, whose effective excitation component in the transverse direction increases with the misalignment angle.
The statistical characteristics of the S-S bending moment (Figure 5b) are highly consistent with those of the S-S shear force. The mean value of the bending moment stays within 5650~6100 kN·m across all cases, with only a mild non-monotonic fluctuation and an overall variation below 500 kN·m (negligible relative to the extreme response), confirming the minimal contribution of steady aerodynamic loads to the transverse static response. In contrast, the maximum bending moment surges from 15,869.08 kN·m at 0° to 159,071.36 kN·m at 90°, accompanied by a synchronous monotonic rise in variance, which verifies that the dynamic oscillation and extreme response of the S-S bending moment are fully dominated by wave excitation.
The opposite response law between S-S and F-A directions is essentially determined by the directional decomposition of wind and wave loads. For the S-S direction, steady aerodynamic loads have almost no effective transverse component, while the effective excitation of wave loads in the transverse direction increases continuously with the misalignment angle. Thus, 90° perpendicular wind–wave incidence is identified as the most unfavorable condition for the ultimate limit state design of S-S tower-base loads.
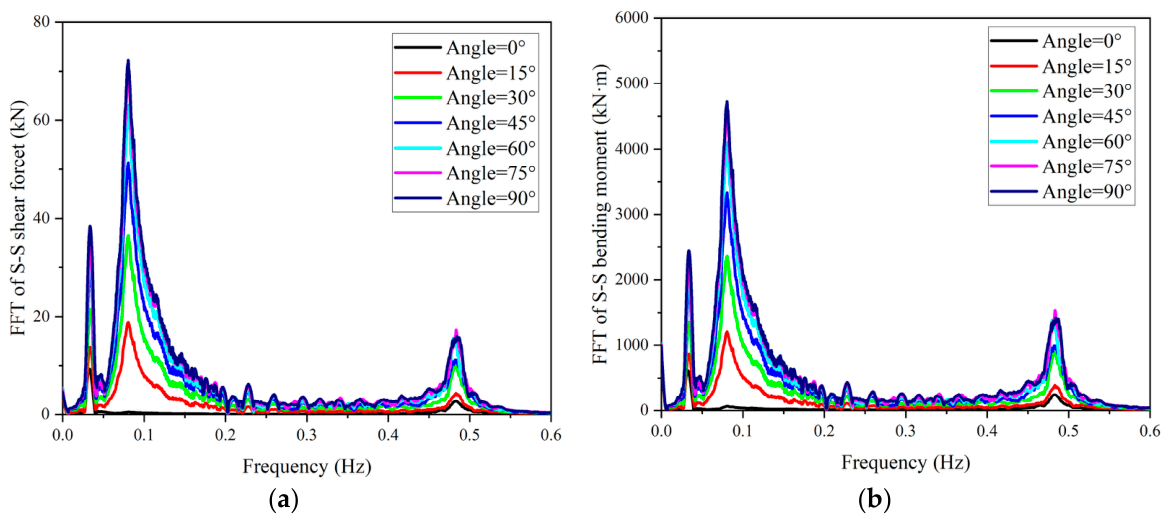
The spectral evolution of the S-S tower-base loads, as illustrated in Figure 6, presents a distinct contrast to the F-A direction. While the F-A energy diminishes with increasing misalignment, the spectral density in the S-S direction exhibits a pronounced amplification, particularly within the WF range. Under the collinear condition, the S-S spectral energy is virtually non-existent, confirming that the structural excitation at this stage is predominantly concentrated in the F-A direction. However, as the wave heading angle shifts toward 90°, the WF peak undergoes a significant escalation. This phenomenon is directly attributed to the increasing component of the hydrodynamic forces acting on the Spar platform in the S-S direction, which subsequently induces intensified bending and shearing at the tower base within the same plane.
These frequency domain results align well with the time-domain statistics. The negligible spectral contribution of the low-amplitude mean response further confirms the minimal effect of steady aerodynamic loads on transverse static response, while the WF peaks confirm that wave excitation controls the dynamic and extreme response of S-S tower-base loads, with a 90° perpendicular incidence being the most unfavorable design condition.

3.3. Maximum Von Mises Stress at the Tower Base

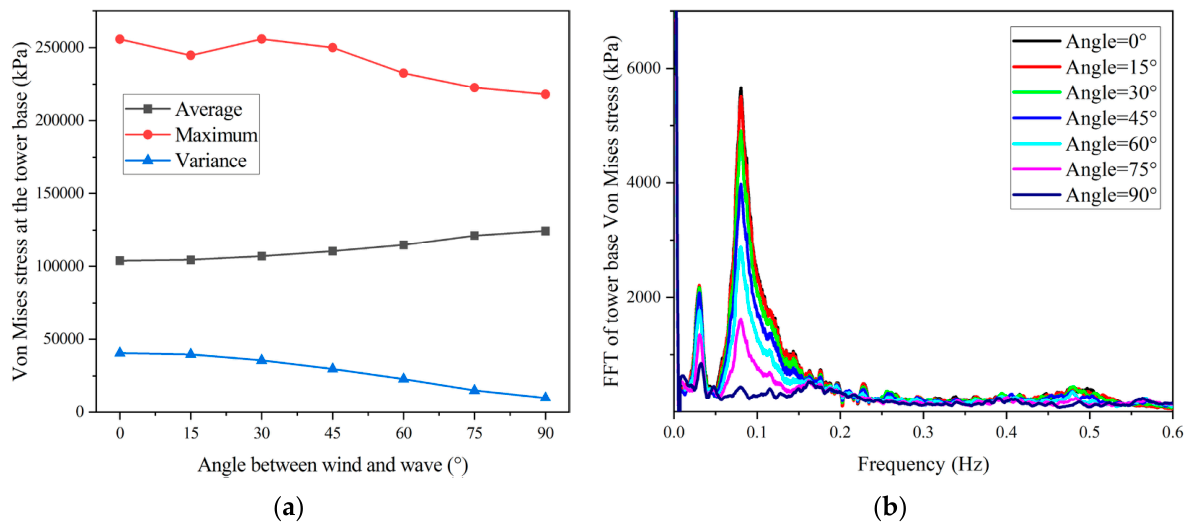
This section investigates the statistical and frequency-domain characteristics of the maximum Von Mises stress at the tower base, which is the core indicator for evaluating the ultimate limit state of the tower foundation structure under wind–wave misalignment angles ranging from 0° to 90°.
As illustrated in Figure 7a, the three statistical metrics of the maximum Von Mises stress exhibit distinct responses to the wind–wave misalignment. Specifically, the maximum values and the variances of the Von Mises stress demonstrate a consistent and monotonic decreasing trend as the wind–wave misalignment angle increases from 0° to 90°. This attenuation is primarily driven by the reduction in the wave-induced bending moments in the F-A direction, which significantly alleviates the dynamic stress fluctuations at the tower base.
Regarding the average response, the mean value of the maximum Von Mises stress exhibits a moderate upward progression, increasing by approximately 20% across the investigated load cases. Although the mean stress increases as the wave heading deviates from the wind direction, the magnitude of this growth remains secondary compared to the attenuation of the dynamic components. This suggests that, while the static stress offset is influenced by the varying wind–wave misalignment angles, the overall evolution of the stress peaks is more heavily dictated by the suppression of wave-induced dynamic oscillations. Consequently, the final maximum stress level is the result of a competing mechanism between the rising mean offset and the diminishing dynamic fluctuations.
The PSD shown in Figure 7b provides additional insight into stress oscillations. Consistent with the load spectra, the WF peak of the Von Mises stress undergoes a severe attenuation as the wave heading deviates from the F-A direction. This spectral evolution clarifies that the dynamic stress fluctuations are highly sensitive to wave-induced excitations in the F-A direction, where the reduction in hydrodynamic impact leads to a direct decline in the spectral energy of the structural stress.

3.4. Mooring Line Tensions at the Fairleads for Mooring 1 and Mooring 2

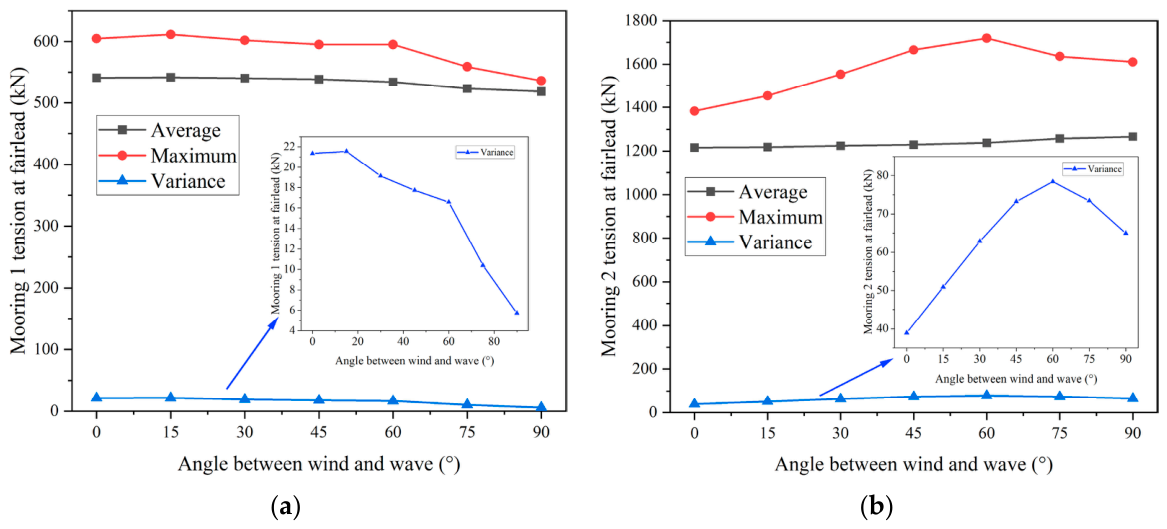
The mooring system provides the essential restoring force for the FOWT, and its tension characteristics are pivotal to the station-keeping stability. Figure 8 illustrates the statistical variations in the tensions at the fairleads for Mooring 1 and Mooring 2 across various wind–wave misalignment angles. Since Mooring 3 is arranged symmetrically with Mooring 2 and exhibits highly similar response trends, only the results for Mooring 2 are presented to avoid data redundancy.
As shown in Figure 8a, the tension of Mooring 1 exhibits distinct variation trends with the rising wind–wave misalignment angle. The mean tension maintains a relatively stable level, with a mild decrease from 540.84 kN at 0° aligned incidence to 518.39 kN at 90° perpendicular incidence and an overall fluctuation of less than 5%. This indicates that the static tension of Mooring 1 is dominated by the steady F-A aerodynamic thrust and is barely affected by the change in the wave incident direction. The maximum tension remains nearly constant at 600 kN within 0° to 60° misalignment, then decreases significantly to 535.83 kN at 90° incidence, with a total reduction of 10.7%. Meanwhile, the tension variance shows a continuous monotonic decreasing trend, dropping from 21.34 kN at 0° to 5.71 kN at 90°, demonstrating that the dynamic oscillation of the Mooring 1 tension is dominated by F-A wave excitation, whose effective component decreases continuously with the rising misalignment angle.
As depicted in Figure 8b, the mean tension of Mooring 2 maintains a stable level with a negligible mild increase across all cases, fluctuating within 1210~1270 kN, which further confirms that the static pre-tension of the mooring system is barely affected by wind–wave misalignment. The maximum tension shows a continuous increasing trend from 0° to 60° misalignment, reaching the peak value of 1720.17 kN at 60° incidence, and then decreases slightly to 1610.22 kN at 90° incidence, with an overall increase of 24.39% from 0° to 60°. The tension variance exhibits a non-monotonic trend of first rising and then falling, reaching the maximum value of 78.42 kN at 60° misalignment, which is nearly twice the value at 0° incidence. This indicates that the dynamic response of Mooring 2 is dominated by wave excitation, whose effective component reaches the maximum at 60° misalignment, inducing the most severe dynamic tension fluctuation.
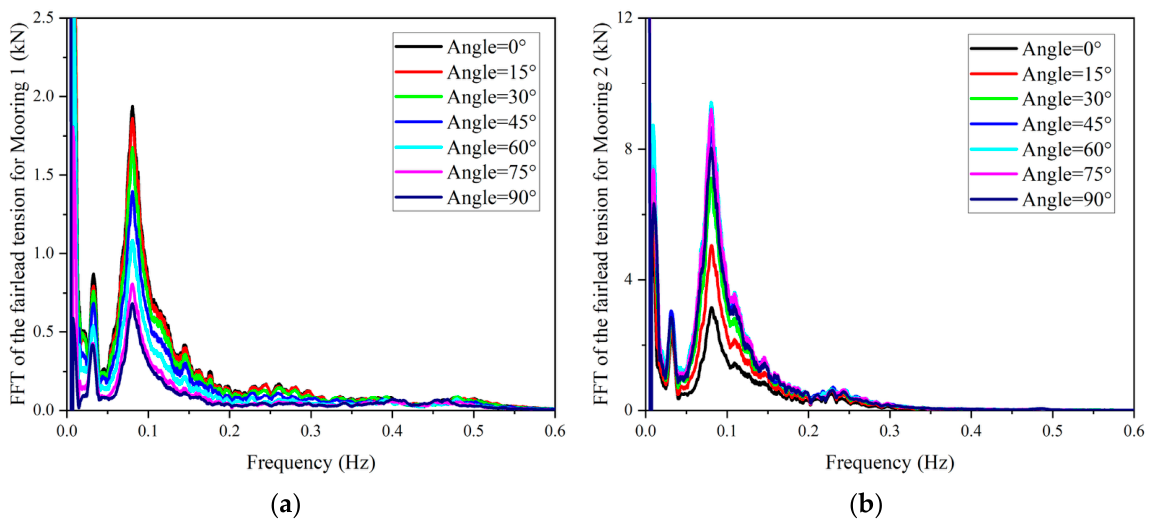
The frequency domain analysis via fast Fourier transform (FFT) further reveals the intrinsic excitation mechanism of wind–wave misalignment on the dynamic tension response of mooring lines, which is fully consistent with the time-domain statistical characteristics presented in the previous section.
As presented in Figure 9a, the spectral energy of Mooring 1 demonstrates a consistent attenuation across all characteristic frequency bands as the misalignment angle increases. The WF peak undergoes a significant reduction, mirroring the decline in wave-induced surge motions when the wave heading deviates from the F-A direction. Conversely, Mooring 2 (Figure 9b) displays a pronounced energy redistribution and amplification. In the collinear case, the tension spectrum is relatively low. However, as the misalignment angle increases toward 90°, the WF peak experiences a dramatic escalation. This intensification indicates that Mooring 2 becomes the primary component for resisting the lateral wave loads, leading to significantly enhanced dynamic tension fluctuations in the wave-frequency range. Interestingly, the spectral evolution of Mooring 2 exhibits a non-monotonic trend, with the peak WF energy occurring at 60°, which aligns with the maximum tension and variance identified in the preceding statistical analysis. This spectral behavior underscores the sensitivity of mooring tension to the multi-directional coupling of the floating system under misaligned environmental conditions.

3.5. Kinematic Interpretation of the Structural Responses

To substantiate the numerical observations, we cross-validated our structural load findings with the kinematic responses reported in the literature. Lyu et al. [16] investigated the OC3-Hywind SPAR-type platform under varying wind–wave misalignment angles. Their study revealed that, as the misalignment angle increases to ninety degrees, transverse motions like sway and roll become highly wave-dominated and reach peak amplitudes. This kinematic behavior provides a robust physical foundation for our observations in Section 3.2, directly explaining the significant surge in the tower-base side-to-side shear forces and bending moments.
Furthermore, this comparative analysis elucidates the fundamental mechanism behind the mooring tension variations. Lyu et al. [16] reported that, under non-collinear conditions, the combination of longitudinal wind thrust and lateral wave force drives the platform into a coupled planar drift involving both surge and sway. This diagonal drift trajectory geometrically alters the relative distances between the platform fairleads and their seabed anchors. As the platform drifts laterally, the mooring line opposing the transverse wave direction, particularly Mooring 2, experiences complex spatial stretching. This kinematic-to-structural causality perfectly validates the non-monotonic variation in the mooring line tensions observed in Section 3.4. Consequently, the structural load analyses in the present study are physically consistent with established motion-level mechanisms.

3.6. Sensitivity Analysis

3.6.1. Selection of Structural Responses

This section focuses on global sensitivity analysis, aiming to quantify the impact of parameter uncertainty on the dynamic response and structural safety of FOWT systems under different wind–wave incidence angles.
Five core response metrics are selected for the sensitivity analysis: the maximum F-A bending moment at the tower base, the maximum S-S bending moment at the tower base, the maximum Von Mises equivalent stress at the tower-base section, and the maximum fairlead tensions for Mooring 1 and Mooring 2. All selected responses are in strict alignment with the preceding dynamic response analysis and serve as the critical governing indicators for the ultimate limit state design and structural safety assessment of the FOWT system.
It should be noted that the F-A and S-S shear forces at the tower base, previously discussed in the dynamic analysis, are excluded from the subsequent sensitivity study. This is justified by the fact that the FOWT tower is a representative slender member subjected to combined axial compression and bending. Under ultimate limit states, the dominant failure modes—namely, material yielding and global/local buckling—are primarily governed by cross-sectional bending moments and the resulting Von Mises equivalent stresses.

3.6.2. Performance Validation of the Surrogate Model

The Kriging surrogate model is established to characterize the mapping relationship between the random variables and the peak values of each dynamic response obtained from full time-domain simulations. Specifically, six sets of independent random seeds are adopted for sample generation, with 150 sample points generated for each seed. In total, 150 × 6 runs of fully coupled aerodynamic–hydrodynamic–mooring numerical simulations are performed. The final sample dataset is determined by averaging the response results from the six groups so as to mitigate the bias caused by the stochasticity inherent in single-seed sampling. The final sample dataset is then randomly partitioned into a training set and a validation set at a ratio of 7:3, where 70% of the samples are used to fit the Kriging model and optimize its hyperparameters, while the remaining 30% of the samples serve as an independent hold-out dataset to verify the generalization performance and prediction accuracy of the trained model.
To quantitatively evaluate the predictive accuracy of the Kriging surrogate model, two widely recognized statistical metrics—the normalized root mean square error (NRMSE) and the coefficient of determination (R2)—are employed as performance indicators. These metrics serve as standard benchmarks in the field of metamodeling, providing a rigorous assessment of the model’s approximation capability. The mathematical formulations for these two metrics are defined as follows:
N R M S E = 1 n i = 1 n ( y i * y i ) 2 1 n i = 1 n y i
R 2 = 1 i = 1 n ( y i * y i ) 2 i = 1 n ( y i 1 n i = 1 n y i ) 2
where n is the number of samples in the validation set, and y i * and y i are the predicted and actual values, respectively.
Table 3 presents the verification results across all investigated heading angles. The R2 values for most responses consistently exceed 0.90, while the NRMSE values remain below 0.025. These metrics demonstrate that the Kriging-based surrogate models possess high fidelity in capturing the peak responses, providing a reliable foundation for the subsequent sensitivity analysis.

3.6.3. Sensitivity Analysis Results and Discussion

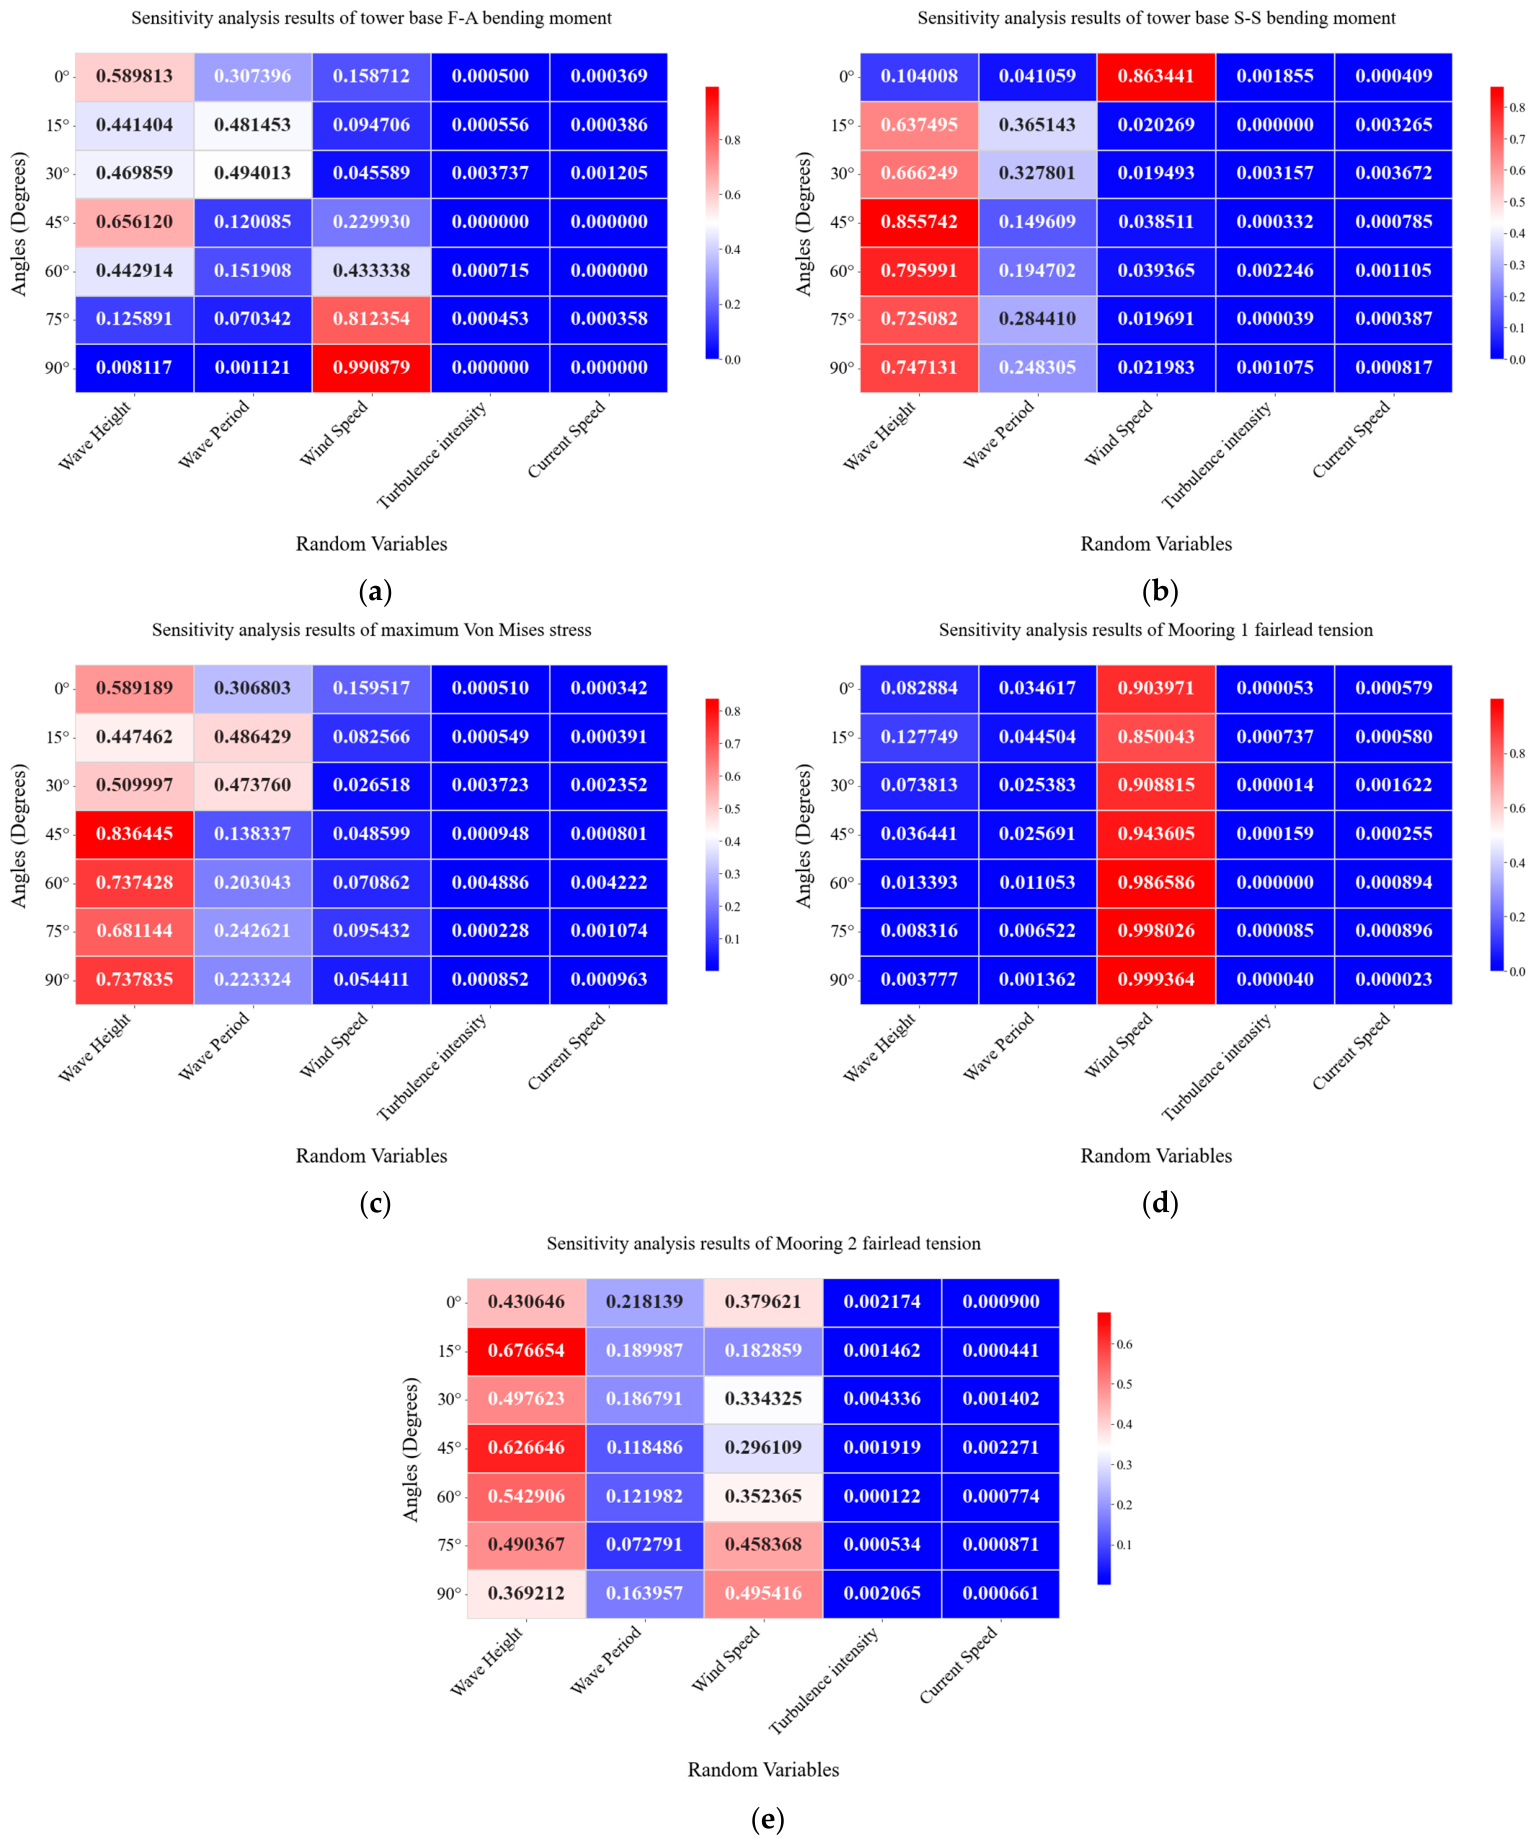
Figure 10 presents the sensitivity maps of the five investigated responses—tower-base F-A/S-S bending moments, maximum Von Mises stress, and fairlead tensions—across seven wind–wave misalignment angles. The color intensity and numerical values in the heatmaps indicate the magnitude of the sensitivity indices.
(1)
Tower-base F-A maximum bending moment
The dominant uncertainty source shows a significant transition with the increasing wind–wave misalignment angle. Under 0° aligned incidence, significant wave height is the most dominant variable with a first-order Sobol index of 0.589, while the sensitivity to mean wind speed rises continuously and rapidly as the misalignment angle increases, reaching 0.979 and becoming the absolute dominant variable at 90° perpendicular incidence. This transition is fully consistent with the conclusion revealed in Section 3.1: The extreme dynamic response of the F-A bending moment is dominated by wave excitation under aligned wind–wave conditions, while the effective wave excitation in the F-A direction decays continuously with the increasing misalignment angle, and the steady aerodynamic load becomes the absolute control factor of the response; thus, the uncertainty of wind speed gradually dominates.
(2)
Tower-base S-S maximum bending moment
The sensitivity characteristics of the S-S bending moment exhibit a completely opposite trend to the F-A direction. Mean wind speed is the dominant variable at 0° aligned incidence with a Sobol index of 0.863. Conversely, the sensitivity to wave-associated parameters rises sharply with the increasing misalignment angle, making wave actions the absolute dominant factor under misaligned conditions. This trend is in full agreement with the deterministic response analysis in Section 3.2: the S-S bending moment is extremely low and dominated by wind-induced small fluctuations under aligned conditions, whereas its dynamic response under misaligned conditions is governed by transverse wave excitation, making wave-associated uncertainties the core control factors at large misalignment angles.
(3)
Maximum Von Mises stress at the tower base
As the comprehensive strength control indicator of the tower, the maximum Von Mises stress is predominantly governed by wave-associated parameters across all working conditions. At 0° aligned incidence, wave actions already serve as the primary contributors to stress uncertainty, while the influence of wind speed remains relatively limited. As the misalignment angle increases, the absolute dominance of wave actions is further solidified. The Von Mises stress is determined by the coupling of F-A and S-S bending moments; as the misalignment angle grows, the wave-induced cross-wind responses become prominent, meaning that wave-associated uncertainties thoroughly dictate the total stress variations under misaligned conditions.
(4)
Maximum fairlead tension of Mooring 1
Mean wind speed absolutely dominates the tension response of the F-A-aligned Mooring Line 1 across all misalignment angles. This is fully matched with the conclusion in Section 3.5: the static pre-tension and dynamic response of the F-A-aligned mooring line are mainly controlled by the aerodynamic thrust of the wind turbine, and the contribution of F-A wave excitation to the tension response continuously weakens with the increasing misalignment angle, which further enhances the dominance of wind speed uncertainty.
(5)
Maximum fairlead tension of Mooring 2
The sensitivity of the obliquely arranged Mooring Line 2 shows a non-monotonic trend with the misalignment angle. Significant wave height becomes the dominant variable at medium misalignment angles, with its Sobol index reaching the peak of 0.718 at 45° incidence, while the mean wind speed regains dominance at a 90° incidence. This non-monotonic characteristic completely corresponds to the phenomenon in Section 3.5: The extreme tension value of Mooring Line 2 reaches the peak at 45°~60° misalignment, where the transverse wave excitation has the largest contribution to the dynamic tension; thus, the uncertainty of wave height becomes the core control factor.

4. Conclusions

This study systematically investigates the influence of wind–wave misalignment angles on the fully coupled dynamic response and global sensitivity characteristics of a Spar-type FOWT to clarify the directional dependence of structural safety control indicators and their dominant uncertainty sources under multi-directional marine environmental loads. The core conclusions are summarized as follows:
  • Wind–wave misalignment leads to diametrically opposite response laws for the F-A and S-S directions of the tower base. The extreme value of the F-A bending moment decreases monotonically with the increase in the misalignment angle, with the most unfavorable condition occurring at 0° aligned wind–wave incidence; meanwhile, the extreme S-S bending moment increases continuously with the rising misalignment angle, reaching the maximum at 90° perpendicular incidence. This directional energy redistribution significantly alters the extreme tension of obliquely arranged mooring lines, highlighting the necessity of assessing environmental parameter sensitivities under various headings.
  • The dominant uncertainty sources of the system’s core safety indicators show significant directional dependence with the change in the wind–wave misalignment angle. Specifically, the primary control factor of the F-A tower-base bending moment shifts from wave actions to mean wind speed as the misalignment angle increases. Conversely, the dynamic response in the S-S direction is absolutely dominated by wave-associated uncertainties under large misalignment angles.
  • The tension response of mooring lines shows distinct directional characteristics due to the difference in spatial arrangement. The extreme tension of the F-A-aligned mooring line decreases with the increase in the misalignment angle, and its uncertainty is dominated by mean wind speed across all conditions; meanwhile, the extreme tension of the oblique mooring line shows a non-monotonic trend with the misalignment angle, reaching the peak at 45°~60° incidence, and its uncertainty is most sensitive to significant wave height under medium misalignment angles.
This study reveals the coupling mechanism between the wind–wave misalignment, structural dynamic response, and uncertainty propagation of Spar-type floating wind turbine systems and provides targeted guidance based on environmental parameter sensitivities for the robust design and safe control of tower and mooring systems. However, the current investigation is limited to a single environmental combination of wind velocity and current speed. Future work will extend this analysis to a broader joint distribution of environmental states, focusing on the influence of wind–wave misalignment on the full-life cycle fatigue damage and extreme failure probability of FOWT structures under varied sea conditions.

Author Contributions

Conceptualization, T.C. and S.G.; methodology, T.C. and S.G.; validation, T.C., Y.B., and W.W.; formal analysis, T.C. and X.L.; data curation, Y.B.; writing—original draft preparation, T.C.; writing—review and editing, T.C. and S.G.; visualization, T.C. and W.W.; supervision, S.G.; project administration, T.C.; funding acquisition, X.L. All authors have read and agreed to the published version of the manuscript.

Funding

This research was funded by the National Natural Science Foundation of China (Grant No. 51939002).

Data Availability Statement

The training and testing datasets supporting the findings of this study are available from the corresponding author upon reasonable request. The data are not publicly available due to their proprietary nature.

Conflicts of Interest

Authors T.C. and Y.B. were employed by CNOOC Gas and Power Group Co., Ltd. The remaining authors declare that the research was conducted in the absence of any commercial or financial relationships that could be construed as a potential conflict of interest.

Abbreviations

The following abbreviations are used in this manuscript:
DistDistribution
F-AFront-aft
FFTFast Fourier transform
FOWTFloating offshore wind turbine
LCLoad case
LHSLatin hypercube sampling
NRMSENormalized root mean square error
PSDPower spectral density
S-SSide-side
SWLStill water level
WFWave-frequency

References

  1. von Jouanne, A.; Agamloh, E.; Yokochi, A. A review of offshore renewable energy for advancing the clean energy transition. Energies 2025, 18, 4798. [Google Scholar] [CrossRef]
  2. Phadnis, M.; Pao, L. Lyapunov-based framework for platform motion control of floating offshore wind turbines. Energies 2025, 18, 3969. [Google Scholar] [CrossRef]
  3. Koondhar, M.A.; Albsha, L.; Mahmoud, S.A.; Amin, L.G.; Mahariq, I. Comparative analysis of onshore, offshore, and floating wind turbines for renewable energy systems: A review. Ocean Eng. 2026, 343, 123243. [Google Scholar] [CrossRef]
  4. Schubel, P.J.; Crossley, R.J. Wind turbine blade design. Energies 2012, 5, 3425–3449. [Google Scholar] [CrossRef]
  5. Ngo, D.-V.; Kim, D.-H. Combined effects of wind-wave misalignment and scour on dynamic response of large-scale offshore wind turbines. Ocean Eng. 2026, 355, 125204. [Google Scholar] [CrossRef]
  6. Li, X.; Zhu, C.; Fan, Z.; Chen, X.; Tan, J. Effects of the yaw error and the wind-wave misalignment on the dynamic characteristics of the floating offshore wind turbine. Ocean Eng. 2020, 199, 106960. [Google Scholar] [CrossRef]
  7. Fitzgerald, B.; McAuliffe, J.; Baisthakur, S.; Sarkar, S. Enhancing the reliability of floating offshore wind turbine towers subjected to misaligned wind-wave loading using tuned mass damper inerters (TMDIs). Renew. Energy 2023, 211, 522–538. [Google Scholar] [CrossRef]
  8. Sullivan, P.P.; Edson, J.B.; Hristov, T.; McWilliams, J.C. Large-eddy simulations and observations of atmospheric marine boundary layers above nonequilibrium surface waves. J. Atmos. Sci. 2008, 65, 1225–1245. [Google Scholar] [CrossRef]
  9. Shanahan, T.; Fitzgerald, B. Wind-wave misalignment in Irish Waters and its impact on floating offshore wind turbines. Energies 2025, 18, 372. [Google Scholar] [CrossRef]
  10. Trumars, J.M.V.; Jonsson, J.O.; Bergdahl, L. The effect of wind and wave misalignment on the response of a wind turbine at Bockstigen. In Proceedings of the International Conference on Offshore Mechanics and Arctic Engineering, Hamburg, Germany, 4–9 June 2006; pp. 635–641. [Google Scholar]
  11. Guo, Z.; Hou, W.; Yao, H.; Liu, Y.; Zhang, Y. Dynamic responses of monopile offshore wind turbines under different wind-wave misalignment angles. Structures 2024, 69, 107454. [Google Scholar] [CrossRef]
  12. Zuo, H.; Bi, K.; Hao, H. A state-of-the-art review on the vibration mitigation of wind turbines. Renew. Sustain. Energy Rev. 2020, 121, 109710. [Google Scholar] [CrossRef]
  13. Bachynski, E.E.; Eliassen, L. The effects of coherent structures on the global response of floating offshore wind turbines. Wind Energy 2019, 22, 219–238. [Google Scholar] [CrossRef]
  14. Doubrawa, P.; Churchfield, M.J.; Godvik, M.; Sirnivas, S. Load response of a floating wind turbine to turbulent atmospheric flow. Appl. Energy 2019, 242, 1588–1599. [Google Scholar] [CrossRef]
  15. Ali, A.; Han, X.; Wang, S.; Shi, W.; Wu, S.; Zhang, Y.; Rehman, S.U. Current effects on the dynamic response of TetraSpar FOWT considering wind-wave misalignment. Ocean Eng. 2025, 341, 122513. [Google Scholar] [CrossRef]
  16. Lyu, G.; Zhang, H.; Li, J. Effects of incident wind/wave directions on dynamic response of a SPAR-type floating offshore wind turbine system. Acta Mech. Sin. 2019, 35, 954–963. [Google Scholar] [CrossRef]
  17. Nguyen, V.H.; Cao, V.-L.; Shen, L.; Park, S.G. Effect of wind-wave angle on the power production and wake characteristics of an offshore wind farm at various wave ages. Energy 2025, 334, 137382. [Google Scholar] [CrossRef]
  18. Chen, L.; Basu, B. Wave-current interaction effects on structural responses of floating offshore wind turbines. Wind Energy 2019, 22, 327–339. [Google Scholar] [CrossRef]
  19. Han, F.; Wang, W.; Han, X.; Shi, W.; Li, X. Investigation of sensitivity analysis of crucial dynamic characteristics of offshore wind turbine utilizing polynomial chaos expansion. ASME J. Offshore Mech. Arct. Eng. 2025, 147, 052004. [Google Scholar] [CrossRef]
  20. Thapa, M.; Missoum, S. Uncertainty quantification and global sensitivity analysis of composite wind turbine blades. Reliab. Eng. Syst. Saf. 2022, 222, 108345. [Google Scholar] [CrossRef]
  21. Shittu, A.A.; Mehmanparast, A.; Amirafshari, P.; Hart, P.; Kolios, A. Sensitivity analysis of design parameters for reliability assessment of offshore wind turbine jacket support structures. Int. J. Nav. Archit. Ocean Eng. 2022, 14, 100441. [Google Scholar] [CrossRef]
  22. Glišić, A.; Ferraz, G.; Schaumann, P. Sensitivity analysis of monopiles’ fatigue stresses to site conditions using Monte Carlo simulation. In Proceedings of the Twenty-Seventh International Ocean and Polar Engineering Conference, San Francisco, CA, USA, 25–30 June 2017; pp. 305–311. [Google Scholar]
  23. Han, F.; Wang, W.; Zheng, X.; Han, X.; Shi, W.; Li, X. Investigation of essential parameters for the design of offshore wind turbine based on structural reliability. Reliab. Eng. Syst. Saf. 2025, 245, 110601. [Google Scholar] [CrossRef]
  24. Velarde, J.; Kramhøft, C.; Sørensen, J.D. Global sensitivity analysis of offshore wind turbine foundation fatigue loads. Renew. Energy 2019, 140, 177–189. [Google Scholar] [CrossRef]
  25. Jonkman, J.; Musial, W. Offshore Code Comparison Collaboration (OC3) for IEA Task 23 Offshore Wind Technology and Deployment; Technical Report No. NREL/TP-5000-48191; National Renewable Energy Laboratory: Golden, CO, USA, 2010. [Google Scholar]
  26. Rahmdel, S.; Wang, B.; Han, C.; Kim, K.; Park, S. A parametric study of spar-type floating offshore wind turbines (FOWTs) by numerical and experimental investigations. Ships Offshore Struct. 2016, 11, 818–832. [Google Scholar] [CrossRef]
  27. Jonkman, J. Definition of the Floating System for Phase IV of OC3; Technical Report No. NREL/TP-500-47535; National Renewable Energy Laboratory: Golden, CO, USA, 2010. [Google Scholar]
  28. OrcaFlex User Manual. Available online: https://www.orcina.com/webhelp/OrcaFlex/Default.htm (accessed on 4 March 2026).
  29. OrcaFlex API User Manual. Available online: https://www.orcina.com/webhelp/OrcFxAPI/Default.htm (accessed on 4 March 2026).
  30. Sethuraman, L.; Venugopal, V. Hydrodynamic response of a stepped-spar floating wind turbine: Numerical modelling and tank testing. Renew. Energy 2013, 52, 160–174. [Google Scholar] [CrossRef]
  31. Yang, C.; Tzeng, Y.A.; Jhan, Y.T.; Cheng, C.; Yang, S. Typhoon eye-induced misalignment effects on the serviceability of floating offshore wind turbines: Insights Typhoon SOULIK. Energies 2025, 18, 490. [Google Scholar] [CrossRef]
  32. IEC 61400–3; Wind Energy Generation Systems–Part 3–1: Design Requirements for Fixed Offshore Wind Turbines. International Electrotechnical Commission: Geneva, Switzerland, 2019.
  33. Okpokparoro, S.; Sriramula, S. Uncertainty modeling in reliability analysis of floating wind turbine support structures. Renew. Energy 2021, 165, 88–108. [Google Scholar] [CrossRef]
  34. Yang, H.; Zhu, Y.; Lu, Q.; Zhang, J. Dynamic reliability based design optimization of the tripod sub-structure of offshore wind turbines. Renew. Energy 2015, 78, 16–25. [Google Scholar] [CrossRef]
  35. Liu, P.; Shang, D.; Liu, Q.; Yi, Z.; Wei, K. Kriging model for reliability analysis of the offshore steel trestle subjected to wave and current loads. J. Mar. Sci. Eng. 2022, 10, 25. [Google Scholar] [CrossRef]
  36. Huang, Y. A review of Monte Carlo and quasi-Monte Carlo sampling techniques. WIREs Comput. Stat. 2024, 16, e1637. [Google Scholar] [CrossRef]
  37. McKay, M.D.; Beckman, R.J.; Conover, W.J. A comparison of three methods for selecting values of input variables in the analysis of output from a computer code. Technometrics 1979, 21, 239–245. [Google Scholar]
  38. Donovan, D.; Burrage, K.; Burrage, P.; McCourt, T.A.; Thompson, B.; Yazici, E.S. Estimates of the coverage of parameter space by Latin Hypercube and Orthogonal Array-based sampling. Appl. Math. Model. 2018, 57, 553–564. [Google Scholar] [CrossRef]
  39. Helton, J.C.; Davis, F.J. Latin hypercube sampling and the propagation of uncertainty in analyses of complex systems. Reliab. Eng. Syst. Saf. 2003, 81, 23–69. [Google Scholar] [CrossRef]
  40. Olsson, A.; Sandberg, G.; Dahlblom, O. On latin hypercube sampling for structural reliability analysis. Struct. Saf. 2003, 25, 47–68. [Google Scholar] [CrossRef]
  41. Guilleminot, J.; Soize, C. On the statistical dependence for the components of random elasticity tensors exhibiting material symmetry properties. J. Elast. 2013, 111, 109–130. [Google Scholar] [CrossRef]
  42. Morató, A.; Sriramula, S.; Krishnan, N. Kriging models for aero-elastic simulations and reliability analysis of offshore wind turbine support structures. Ships Offshore Struct. 2018, 14, 545–558. [Google Scholar] [CrossRef]
  43. Sørensen, J.D.; Toft, H.S. Probabilistic design of wind turbines. Energies 2010, 3, 241–257. [Google Scholar] [CrossRef]
  44. Han, F.; Li, X.; Shi, W.; Wang, B.; Wang, W. Generic fully coupled framework for reliability assessment of offshore wind turbines under typical limit states. Eng. Struct. 2024, 304, 117692. [Google Scholar] [CrossRef]
  45. Kaymaz, I. Application of kriging method to structural reliability problems. Struct. Saf. 2005, 27, 133–151. [Google Scholar] [CrossRef]
  46. Sobol, I.M. Sensitivity estimates for nonlinear mathematical models. Math. Model. Comput. Exp. 1993, 1, 407–414. [Google Scholar]
  47. Hübler, C. Global sensitivity analysis for medium-dimensional structural engineering problems using stochastic collocation. Reliab. Eng. Syst. Saf. 2020, 195, 106749. [Google Scholar] [CrossRef]
  48. Mazetto, B.M.; Ritto, T.G. Uncertainty and global sensitivity analysis of wind turbines fatigue in non-ideal conditions. J. Vib. Eng. Technol. 2022, 10, 2391–2402. [Google Scholar] [CrossRef]
  49. Zhang, M.; Zhou, Z.; Xu, K.; Shi, Y.; Wu, Y.; Du, J. Investigation on dynamic responses’ characteristics and fatigue damage assessment for floating offshore wind turbine structures. Sustainability 2022, 14, 12444. [Google Scholar] [CrossRef]
Figure 1. Schematic of the Spar-type FOWT system.
Energies 19 02707 g001
Figure 2. Top view of the mooring system configuration and definitions of the wind–wave misalignment angles.
Energies 19 02707 g002
Figure 3. Statistical characteristics of tower-base loads in the F-A direction under different wind–wave misalignment angles. (a) Shear force at the tower base. (b) Bending moment at the tower base.
Energies 19 02707 g003
Figure 4. Power Spectral Density of tower-base loads in the F-A direction across different wind–wave misalignment angles. (a) Shear force at the tower base. (b) Bending moment at the tower base.
Energies 19 02707 g004
Figure 5. Statistical characteristics of tower-base loads in the S-S direction under different wind–wave misalignment angles. (a) Shear force at the tower base. (b) Bending moment at the tower base.
Energies 19 02707 g005
Figure 6. Power Spectral Density of tower-base loads in the S-S direction across different wind–wave misalignment angles. (a) Shear force at the tower base. (b) Bending moment at the tower base.
Energies 19 02707 g006
Figure 7. Statistical and spectral characteristics of the maximum Von Mises stress at the tower base under various wind–wave misalignment angles. (a) Statistical indicators. (b) Power Spectral Density.
Energies 19 02707 g007
Figure 8. Statistical characteristics of fairlead tensions for Mooring 1 and Mooring 2 under various wind–wave misalignment angles. (a) Fairlead tension of Mooring 1. (b) Fairlead tension of Mooring 2.
Energies 19 02707 g008
Figure 9. Power Spectral Density of fairlead tensions for Mooring 1 and Mooring 2 under various wind–wave misalignment angles. (a) Fairlead tension of Mooring 1. (b) Fairlead tension of Mooring 2.
Energies 19 02707 g009
Figure 10. Sensitivity analysis results of the structural responses across different wind–wave misalignment angles. (a) Tower-base F-A bending moment. (b) Tower-base S-S bending moment. (c) Maximum Von Mises stress. (d) Mooring 1 fairlead tension. (e) Mooring 2 fairlead tension.
Energies 19 02707 g010
Table 1. Properties of the FOWT.
PropertyDescription
Power production rating5 MW
Rotor diameter (hub diameter)126 m (3 m)
Hub height90 m
Cut-in, rated and cut-out wind speed3, 11.4, 25 m/s
Cut-in and rated rotor speed6.9, 12.1 rpm
Diameter and thickness at the base6.5, 0.027 m
Diameter and thickness at the top3.87, 0.019 m
Water depth and platform draft320 m, 120 m
Number of mooring lines3
Angle between adjacent lines120°
Table 2. Statistical parameters and probability distributions of the selected random variables.
ParameterDist.MeanCovRef.
Significant wave height (m)Normal8.520.05[33,42]
Peak spectral period (s)Normal12.450.05[33,42]
Wind speed (m/s)Normal11.40.05[16,33,42]
Turbulence intensity (%)Lognormal17.80.05[43]
Current speed (m/s)Normal0.60.05[33,42]
Table 3. Accuracy verification of the Kriging surrogate models for various structural responses under different wind–wave misalignment angles.
F-A Bending MomentS-S Bending MomentVon Mises StressMooring Line 1
Fairlead Tension
Mooring Line 2
Fairlead Tension
NRMSER2NRMSER2NRMSER2NRMSER2NRMSER2
0.014730.898970.021840.943400.014070.899450.004210.975690.008240.91092
15°0.013730.924840.020730.922430.012780.933000.004340.967750.009250.92645
30°0.011000.942760.011940.972340.010630.950790.003040.985740.007280.93965
45°0.008000.936790.015920.947640.014980.094750.006060.959290.009820.90248
60°0.011970.922210.017780.965900.012760.956640.003620.980570.011240.93350
75°0.007200.968440.012070.975690.009830.964840.006080.980640.007030.96415
90°0.007840.988920.017150.931570.017960.942880.005800.983970.010330.91123
Disclaimer/Publisher’s Note: The statements, opinions and data contained in all publications are solely those of the individual author(s) and contributor(s) and not of MDPI and/or the editor(s). MDPI and/or the editor(s) disclaim responsibility for any injury to people or property resulting from any ideas, methods, instructions or products referred to in the content.