


Abstract
Geopolitical conflicts continue to disrupt global energy supply chains, causing sharp changes in energy prices. These changes reshape the cost structure and efficiency levels of grain circulation. Based on panel data from 30 Chinese provinces covering 2011–2022, this study constructs a proxy for grain circulation efficiency using a resource misallocation framework and counterfactual decomposition. We employ panel threshold regression and double machine learning methods to systematically examine the nonlinear impact of energy price levels on grain circulation efficiency and to reveal regional differences. The findings are as follows: (1) Energy price levels exhibit a significant single-threshold effect. When energy prices remain within a low range, rising prices exert a positive technology push effect; beyond the threshold, a cost-squeeze suppression dominates. (2) The eastern region shows the highest tolerance for price increases, whereas the western region has the lowest tolerance, with the central region falling in between. (3) Double machine learning feature importance analysis reveals that research and experimental development investment and economic development are the dominant factors affecting agricultural product circulation efficiency in the eastern region; water consumption and capital stock are the key factors in the central region; and energy prices, foreign trade dependence, and infrastructure are the most sensitive factors in the western region. This study provides empirical evidence for designing differentiated regional circulation policies and enhancing the resilience of the grain circulation system.
1. Introduction
In recent years, frequent geopolitical events—such as the Russia–Ukraine conflict, tensions in the Middle East, and the rise in global trade protectionism—have severely disrupted the supply–demand balance in international energy markets (Yang & Fu, 2025; Su et al., 2025) [1,2]. International energy prices, including crude oil and natural gas, have experienced dramatic changes—from sharp declines to surges—within short periods. These changes have exerted a strong impact on domestic energy markets through channels such as import cost pass-through, exchange rate transmission, and market expectations. As the world’s largest energy importer and a major producer and consumer of agricultural products, China experiences the transmission of abnormal change in energy prices throughout the industrial chain, exerting a profound impact on the grain circulation system (Zhuang et al., 2025) [3].
Grain circulation serves as a critical link connecting agricultural production and consumption, and its efficiency is directly linked to national food security, farmers’ income growth, and consumer welfare (Barrett et al., 2022) [4]. Grain circulation is typically energy-intensive; long-distance transportation from production areas to consumption areas relies heavily on diesel and gasoline, while the circulation and processing stages are equally dependent on a stable energy supply (Magazzino & Mele, 2021; Alder, 2025) [5,6]. Consequently, changes in energy prices directly translate into changes in circulation costs, thereby influencing the operational decisions of circulation entities and the overall efficiency of the circulation network.
However, despite the recognized importance of energy prices, the existing literature exhibits several notable gaps. First, most previous studies assume a linear relationship between energy price changes and grain circulation efficiency (Arshad et al., 2018; Xie & Wang, 2017) [7,8], overlooking the possibility that moderate price increases may stimulate technological adaptation, whereas extreme surges generate cost-squeeze effects. Second, regional heterogeneity in the impact of energy price shocks has received insufficient attention. China’s eastern, central, and western regions differ markedly in economic development, infrastructure endowment, and innovation capacity (Hong et al., 2011; Yang, 2016) [9,10], yet few studies have systematically compared the mechanisms across these regions. Third, conventional efficiency measurement methods, such as data envelopment analysis and stochastic frontier analysis (Clarke & Polselli, 2026) [11], provide relative efficiency scores but fail to quantify the resource misallocation losses caused by factor price distortions. Fourth, although energy price changes have recently become a critical background factor reshaping global energy supply chains (Kuang & Qin, 2024) [12], their indirect effects on grain circulation efficiency have rarely been examined under a unified framework that combines nonlinear modeling and region-specific driver analysis.
To address these gaps, this paper focuses on the following three core research questions: (i) How can provincial-level grain circulation efficiency be approximated? (ii) Do energy price levels exhibit significant nonlinear threshold effects on grain circulation efficiency, and if so, at what threshold does the positive effect turn negative? (iii) What are the differences in the key factors influencing grain circulation efficiency across the eastern, central, and western regions, and how do the dominant drivers vary by region?
By answering these questions, this paper makes the following main contributions:
Firstly, this study challenges the conventional linear assumption by demonstrating a nonlinear “rise-then-fall” relationship between energy price levels and grain circulation efficiency, thereby extending the induced technological innovation hypothesis to the grain circulation sector. It also reveals a spatial gradient pattern of energy price tolerance, with the eastern regions exhibiting the highest resilience and the western regions the lowest.
Secondly, this study innovatively combines a counterfactual decomposition framework (based on resource misallocation theory) with double machine learning (DML) and the Light Gradient Boosting Machine (LightGBM) algorithm. This approach not only improves the measurement of grain circulation efficiency by capturing distortions in factor allocation but also enables a data-driven ranking of feature importance across regions, overcoming the limitations of traditional linear models in handling high-dimensional control variables and nonlinear relationships.
Finally, by comparing the dominant drivers of circulation efficiency across the three major regions, this study provides empirical evidence for designing differentiated regional circulation policies, preventing and controlling energy price risks, and enhancing the resilience of the grain circulation system under geopolitical uncertainty.
The remainder of this paper is structured as follows: Section 2 reviews the theoretical mechanisms and proposes research hypotheses, linking them to the existing literature. Section 3 describes the research design, including the counterfactual measurement of grain circulation efficiency, variable selection, and model specification. Section 4 presents the empirical results, including threshold effect tests, regional heterogeneity analysis, and DML-based feature importance rankings. Section 5 concludes with policy recommendations, limitations, and future research directions.
2. Theoretical Analysis, Literature Review, and Research Hypotheses
2.1. The Dual Mechanisms Through Which Energy Price Levels Affect Grain Circulation Efficiency
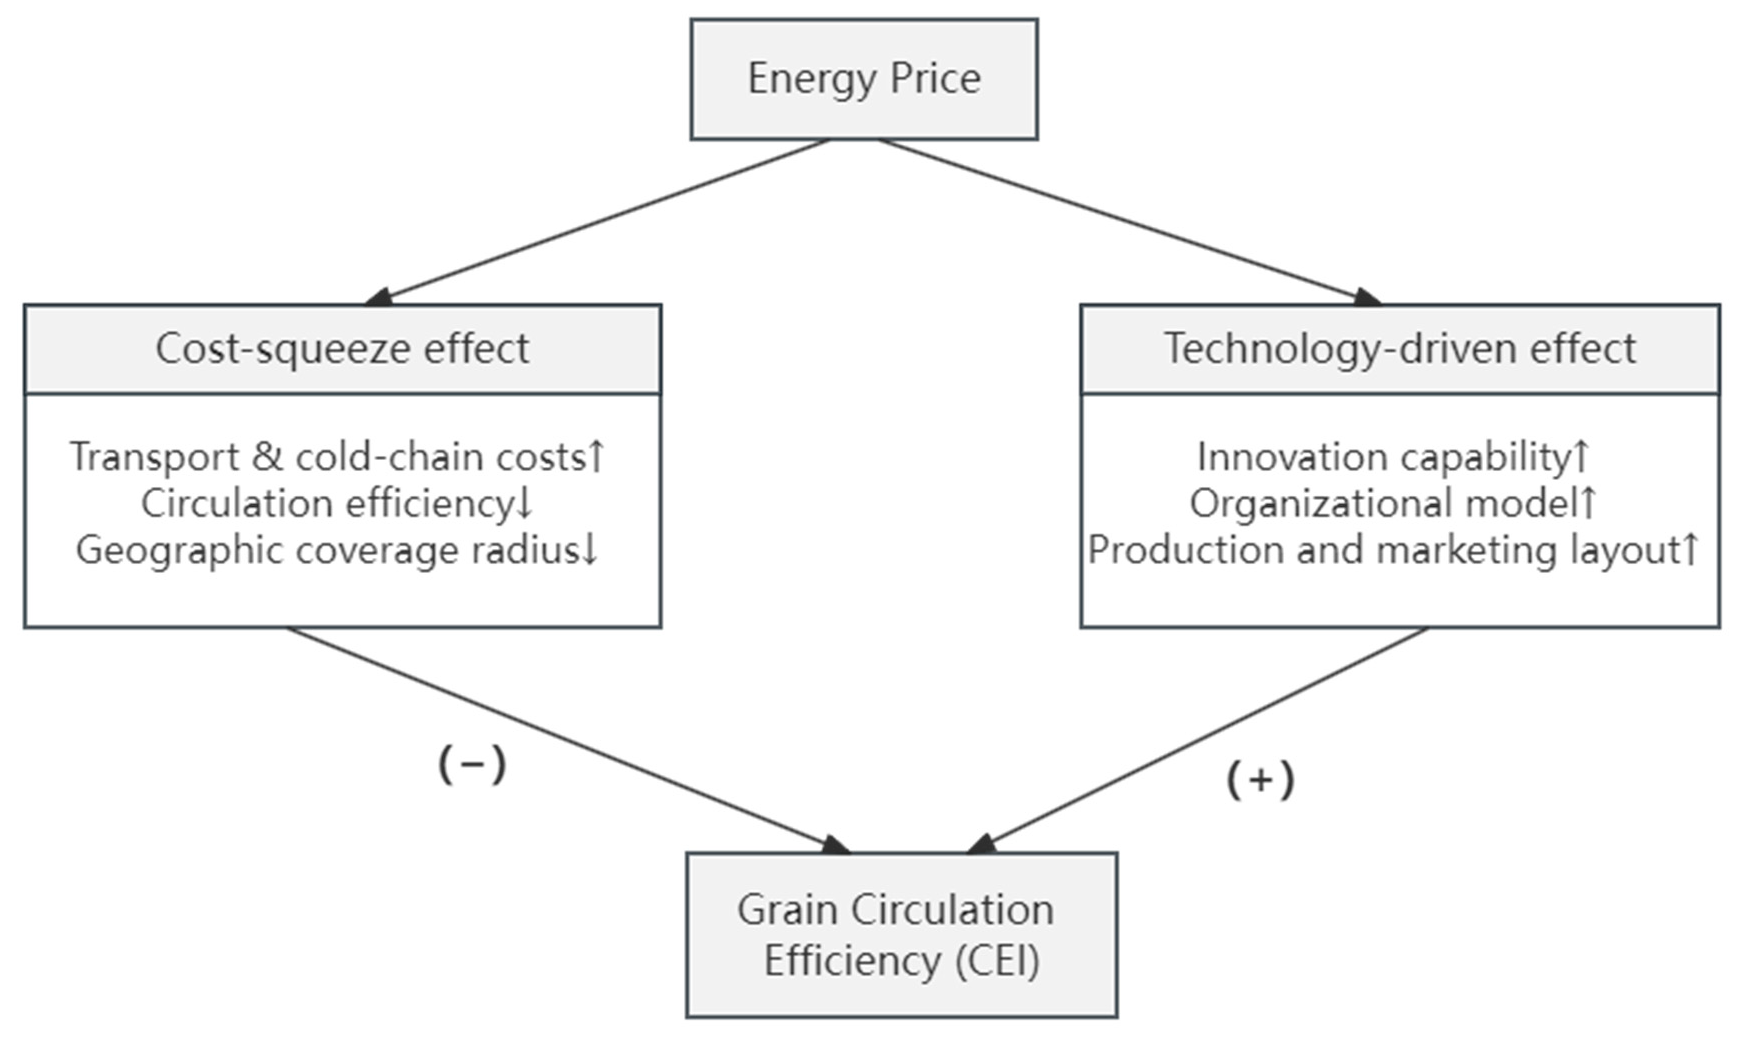
Energy is a core input factor in grain circulation activities. Changes in energy prices exert dual and opposing effects on circulation efficiency through cost and technological channels (Raimbekov et al., 2023; Marchi & Zanoni, 2017) [13,14]. Recent literature on the energy–food–water nexus emphasizes that energy cost transmission in agricultural supply chains cannot be analyzed in isolation, as water consumption in grain processing and cold-chain logistics creates an interdependent cost structure that amplifies energy price shocks (Al-Saidi & Elagib, 2017) [15]. Furthermore, food supply chain resilience research highlights that logistics cost transmission—particularly fuel price volatility—tests the adaptive capacity of distribution networks.
- (1)
- Cost-squeeze effect. Transportation is the most energy-intensive stage in grain circulation. Rising prices for gasoline and diesel directly increase the unit cost of inter-regional grain transportation (Szaruga et al., 2024) [16]. In addition to direct transport fuel costs, studies on fuel delivery logistics and delivery-cost impacts in energy systems provide empirical evidence that diesel distribution cost shocks are rapidly passed through to freight rates, creating a secondary transmission channel that compounds the cost burden on grain logistics (Cui & Li, 2026) [17]. In cold-chain logistics for grain processing, both the refrigeration units of refrigerated vehicles and the cooling systems of cold storage facilities consume significant amounts of electricity; rising energy prices lead to increased costs for cold-chain services (Katris et al., 2024; James & James, 2010) [18,19]. This logistics cost transmission mechanism is magnified by geopolitical energy shocks, which create sudden and unpredictable spikes in fuel prices and disrupt fuel supply chains, leading to severe logistics cost escalation (Taheri Hosseinkhani, 2025) [20]. In market structures characterized by perfect competition or buyer monopoly, circulation enterprises find it difficult to fully pass these increased costs on to upstream and downstream partners, resulting in compressed profit margins (Pu et al., 2023) [21]. Firms may adopt countermeasures such as reducing delivery frequency, lowering cold chain standards, or delaying vehicle upgrades. This can lead to longer transit times for grain, increased spoilage rates, and shorter circulation radii, ultimately reducing circulation efficiency (Hammond et al., 2015) [22]. In summary, when energy prices rise to extreme levels, the cost-squeeze effect becomes dominant, exerting a significant inhibitory influence on circulation efficiency.
- (2)
- Technology-driven effect. Moderate increases in energy prices may also generate positive incentives. According to the induced technological innovation hypothesis, changes in relative factor prices guide the direction of technological progress (Yang et al., 2019) [23]. Faced with rising energy costs, circulation enterprises have an incentive to adopt energy-efficient transportation vehicles, optimize delivery routes, build intelligent warehouse management systems, and promote advanced organizational models such as consolidated delivery and drop-and-hook transport. These measures not only reduce energy consumption per unit of circulation but also enhance circulation speed, accuracy, and customer satisfaction, thereby improving circulation efficiency (Cullen & Allwood, 2010) [24]. From a food supply chain resilience perspective, such technology-driven adaptations are critical for maintaining circulation continuity under cost pressure (Stone & Rahimifard, 2018) [25]. Furthermore, energy price signals may also prompt the optimization of grain production and circulation layouts, reduce unnecessary long-distance transportation, and promote regional supply–demand matching, thereby enhancing circulation efficiency at the systemic level (Chen et al., 2025) [26].
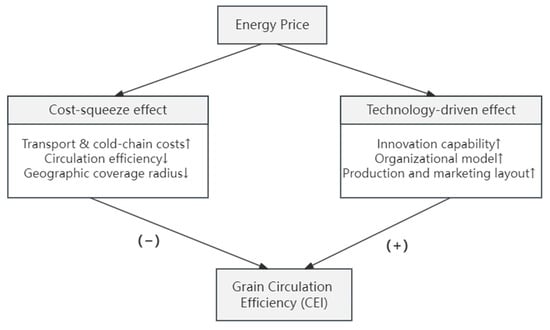
These two mechanisms have been discussed in the broader energy-logistics literature. The energy–food–water nexus literature further suggests that water-related energy costs interact with logistics energy costs, creating compound transmission channels. In the grain supply chain context, the energy–food nexus literature emphasizes the transmission of energy costs to food prices and logistics; however, few studies have empirically tested the threshold nature of this relationship in the circulation sector. This study builds on that literature by explicitly modeling the nonlinear transition. The mechanism diagram of energy prices is shown in Figure 1. Arrows indicate the direction of effect.
Figure 1.
Mechanism diagram.
2.2. The Threshold Effect of Energy Price Levels on Grain Circulation Efficiency
The relative strength of the cost-squeeze effect and the technology-driven effect depends on the range of energy prices (Bager et al., 2022) [27]. When energy prices are low or increase moderately, the cost pressure on circulation enterprises remains manageable, and profit margins can still support technological upgrades and business model innovation. At this stage, the technology-driven effect dominates, and rising energy prices may have a positive or neutral impact on circulation efficiency. However, once energy prices exceed a certain threshold, enterprises’ operating costs surge sharply, and the long-term benefits of technological upgrades are overshadowed by short-term survival pressures. Enterprises are then forced to cut back on equipment investment and Research and Development Expenditures (R&D) (Song & Zhao, 2024) [28]. Geopolitical energy shocks can accelerate the crossing of this threshold, as sudden cost surges leave insufficient time for technological adaptation (Kilinc-Ata et al., 2025) [29]. At this stage, the cost-squeeze effect replaces the technology-driven effect, and further increases in energy prices will significantly suppress circulation efficiency. Based on this, this paper proposes:
Hypothesis 1 (H1).
Energy price levels exhibit a significant threshold effect on grain circulation efficiency, manifested as a nonlinear “first rise, then fall” relationship.
2.3. Regional Heterogeneity and Variations in Factor Importance
There are significant gradients in economic development, logistics infrastructure, industrial structure, and dependence on foreign trade among China’s eastern, central, and western regions (Deng et al., 2022; Zhang et al., 2022) [30,31]. These differences result in varying pathways and dominant factors through which energy price levels affect grain circulation efficiency (Shen et al., 2024) [32]. Regional disparities in food supply chain resilience and exposure to geopolitical energy risks further shape these differential impacts (Khan, 2025) [33].
The eastern region is economically developed, with well-established logistics infrastructure, strong technological innovation capabilities, and circulation enterprises that are larger in scale and have higher management standards (Du et al., 2025) [34]. In this region, R&D investment and regional economic development may be the dominant factors influencing circulation efficiency; intensive innovation activities help enterprises rapidly develop or adopt energy-saving and efficiency-enhancing technologies, thereby mitigating the negative impacts of energy price shocks.
As a transportation hub connecting the eastern and western regions, the central region handles a significant volume of interregional grain transshipment, and its circulation efficiency is highly dependent on the density and quality of the transportation network (Zhu et al., 2024) [35]. Drawing on the energy–food–water nexus perspective, grain processing and cold-chain logistics in this region compete for both energy and water resources, making water consumption a jointly critical factor alongside infrastructure (Rohde, 2018) [36].
The western region is landlocked, characterized by long transport distances and relatively weak circulation infrastructure. It has a high degree of dependence on foreign trade (with active grain import and export trade in some provinces) and, while rich in energy resources, faces price changes influenced by both international markets and domestic regulations (Dai, 2024) [37]. Its supply chain resilience is lower and it is more exposed to geopolitical energy shocks due to cross-border energy dependencies (Zhou et al., 2026) [38]. In this region, energy price levels themselves, dependence on foreign trade, and the level of infrastructure are likely to be the core factors influencing circulation efficiency.
Based on the above analysis, this paper proposes:
Hypothesis 2 (H2).
The key characteristic factors influencing grain circulation efficiency differ significantly across the eastern, central, and western regions, exhibiting distinct rankings of importance.
The two hypotheses described above are both firmly grounded in the theoretical framework and the extended literature review. Hypothesis 1 extends the dual mechanisms of cost-squeeze effects and technology-driven effects by incorporating insights from research on logistics cost transmission and geopolitical energy shocks. The theoretical logic underlying Hypothesis 1 is further enriched by the literature on the energy–food–water nexus, which suggests that composite energy–water cost pressures can amplify the nonlinear characteristics of circulation efficiency. Hypothesis 2 builds on the literature concerning regional logistics disparities and heterogeneity in food supply chain resilience. By integrating the energy–food–water nexus with the geopolitical risk perspective, Hypothesis 2 posits that the dominant factors reflect each region’s unique vulnerability characteristics and adaptive capacity in response to energy price shocks. This aligns with recent research on supply chain reorganization and trade fragmentation, which emphasizes that regional exposure to energy disruptions reshapes the relative importance of cost and capacity factors in circulation efficiency.
3. Research Design
3.1. Counterfactual Approximation of Grain Circulation Efficiency
Obtaining a reliable proxy for grain circulation efficiency forms the foundation of this empirical study. While traditional efficiency measurement methods, such as data envelopment analysis and stochastic frontier analysis, can provide relative efficiency scores, they struggle to quantify the losses in resource allocation efficiency caused by factor price distortions (Song et al., 2025) [39]. Drawing on the theory of resource misallocation and the counterfactual decomposition framework proposed by Hsieh and Klenow (2009) [40], this study constructs a metric for measuring grain circulation efficiency. The basic approach is as follows:
We treat grain circulation activities in each region as a “production” process, where the “output” is the total volume of circulation services (proxied by grain circulation volume), and the “inputs” are factors such as capital, labor, and energy. Under ideal conditions of fully flexible factor prices and perfect market competition, the marginal product of each factor in a region should equal its factor price, and the actual share of factor inputs in a region should equal its theoretically optimal share (Zeng et al., 2022) [41]. In reality, due to market segmentation, government intervention, and information asymmetry, the proportions of factor inputs deviate from the optimal state, leading to losses in circulation efficiency. By estimating the circulation production function, the marginal elasticity of output for each region’s factors can be calculated, from which the counterfactual optimal factor input shares can be derived. Comparing these with the actual shares yields an approximated circulation efficiency index.
Due to limitations in the availability of provincial-level grain circulation volume data, we construct a proxy as follows: First, we use the product of grain output and grain yield per unit area as a baseline measure of agricultural output. Second, we construct a “circulation intensity” adjustment coefficient using the ratio of each province’s total agricultural output value to its total grain output. This coefficient captures the relative commercialization and market circulation intensity of grain in each province. Third, we estimate grain circulation volume as:
Grain circulation volume = (Grain output × Grain yield per unit area) × (Total agricultural output value/Total grain output)
All variables are expressed in consistent physical and monetary units (grain output in tons, agricultural output value in constant CNY), ensuring dimensional consistency. This proxy is justified because provinces with higher agricultural output value per unit of grain output typically have more diversified, higher-value agricultural products that require more intensive circulation services. While not a perfect measure, it provides a reasonable approximation for interprovincial comparison.
We establish a distribution production function, assuming that the grain circulation volume in region i in year t is determined by a Cobb–Douglas production function, as shown in Equation (1):
Here, represents the stock of capital in the circulation sector, calculated by multiplying the province’s total capital stock by the proportion of the agricultural sector in the economy; represents the workforce in the circulation sector, calculated as the proportion of employees in the wholesale and retail trade within the province’s total workforce; represents energy consumption in the circulation sector, calculated by multiplying the province’s total energy consumption by a grain circulation coefficient. The grain circulation coefficient is computed as: national grain logistics volume divided by total social logistics volume, then adjusted by each province’s share of primary industry value-added in the national total.
To estimate the output elasticity of factors, taking the logarithm of Equation (1) yields Equation (2):
Using provincial panel data, the elasticity coefficients , , and are estimated via a fixed-effects model on the full sample. These elasticities are assumed to be common across regions for comparability, as is standard in the resource misallocation.
The grain circulation efficiency index is defined as the ratio of actual distribution volume to the counterfactual optimal distribution volume, as shown in Equation (3):
To clarify the construction of the counterfactual efficiency index, we provide the following additional explanations. First, all symbols in Equation (3) are defined as follows: is the actual grain circulation volume; is the actual output (proxied by regional GDP); is region i’s output share; is the capital elasticity for region i (assumed equal to for all regions under the common elasticity assumption); and is the national average capital elasticity. The term serves as an adjustment factor that converts actual output into the counterfactual optimal output under distortion-free allocation.
Second, the range follows directly from the resource misallocation theory. In a competitive equilibrium without distortions, factors are allocated such that the marginal revenue product of each factor is equalized across regions. Any deviation from this optimal allocation reduces actual output relative to the counterfactual optimum given the same factor endowments. Hence, , and the ratio is bounded between 0 and 1. No additional normalization or truncation is applied.
Third, the counterfactual benchmark is operationalized in four steps: (i) estimating output elasticities; (ii) computing actual factor shares; (iii) computing optimal factor shares as ; and (iv) deriving . The efficiency index is then calculated as the ratio of actual to counterfactual output.
3.2. Variable Selection and Data Description
3.2.1. Dependent Variable
The Grain Circulation Efficiency Index (CEI) is constructed as a proxy using the counterfactual decomposition framework described above. It should be noted that this index is based on indirectly estimated circulation volumes rather than directly observed provincial logistics flow data. A value closer to 1 indicates higher circulation efficiency.
3.2.2. Key Explanatory Variable
The level of energy price (Price) is measured using the provincial fuel and power purchase price index (Based on previous year = 100). This index reflects price fluctuations in energy products such as diesel, gasoline, coal, and electricity used in agricultural production and distribution.
3.2.3. Threshold Variable
In the panel threshold regression, the energy price level itself is used as the threshold variable to test whether the impact of energy prices on grain circulation efficiency undergoes structural changes when energy prices fall within different intervals.
3.2.4. Control Variables
Drawing on existing research, the following control variables are selected:
Grain yield volatility (Yield). Measured as the absolute deviation of total grain output from its five-year moving average, reflecting the stability of agricultural output. Production fluctuations directly affect the spatiotemporal distribution of circulation demand, thereby influencing circulation efficiency (Zhao et al., 2022; Wang et al., 2023) [42,43].
Grain trade dependency (Trade). Measured as the ratio of total grain imports and exports to gross agricultural output, reflecting the degree of integration between the circulation system and international markets (Kovalenko et al., 2023; Yemelyanov et al., 2023) [44,45].
Water use per unit of grain output (Water). Measured as the ratio of total agricultural water use to total grain output, this indicator assesses the intensity of water resource consumption in agricultural production. Water resource constraints affect local grain supply capacity, thereby altering the structure and direction of circulation demand (Xu et al., 2022) [46].
Profit of grain industry enterprises (Profit). The natural logarithm of the total profit of grain industry enterprises above a certain scale, reflecting the profitability and investment potential of circulation enterprises (Fan et al., 2025) [47].
Capital stock (Capital). The natural logarithm of the physical capital stock in each province, representing the overall level of circulation infrastructure such as transportation and warehousing (Liu et al., 2025; Meng et al., 2023) [48,49].
R&D expenditures (RD). The natural logarithm of internal expenditures on research and experimental development, measuring regional technological innovation capacity (Zhu et al., 2024) [50].
Gross regional product (GRP). The natural logarithm of gross regional product, reflecting the level of economic development (Zhang, 2023) [51].
Carbon emissions (CO2). The natural logarithm of carbon dioxide emissions, serving as a composite proxy for industrialization and energy consumption (Bambi et al., 2024) [52].
Table A1 (see Appendix A) presents the descriptive statistics for all variables.
This study utilizes balanced panel data from 2011 to 2022 for 30 provinces, autonomous regions, and municipalities directly under the central government in China (Tibet was excluded due to missing data). The time span (2011–2022) covers both pre- and post-2022 geopolitical shocks, but we note that the full impact of the Russia–Ukraine conflict extends beyond our sample. Therefore, we treat geopolitical conflicts as the background motivation rather than a directly estimated causal factor. Agricultural data, including grain production, sown area, and total agricultural output value, are sourced from the China Rural Statistical Yearbook and provincial statistical yearbooks; macroeconomic data, such as the energy price index, regional GDP, and capital stock, are sourced from the China Statistical Yearbook and the National Bureau of Statistics database; R&D data were sourced from the China Science and Technology Statistical Yearbook; water resource data from the China Water Resources Bulletin; and carbon emissions data from the CEADs China Carbon Emissions Database. Specific data required for measuring circulation efficiency—such as circulation volume and energy consumption—were estimated based on the above sources and subjected to dimensionless processing. Individual missing data points were imputed using linear interpolation.
3.3. Model Specification
3.3.1. Panel Threshold Regression Model
To examine the nonlinear impact of energy price levels on grain circulation efficiency, this study adopts the panel threshold regression method proposed by Hansen (1999) [53]. This method is chosen because it allows the coefficient on the energy price variable to change depending on whether the price index exceeds an unknown threshold, without requiring prior specification of the functional form. Compared to simple quadratic or interaction models, the threshold regression provides a clear breakpoint and regime-specific coefficients, making the results more interpretable for policy purposes (e.g., setting early-warning levels). We construct a single-threshold model as shown in Equation (4):
In this model, serves as both the core explanatory variable and the threshold variable; represents the threshold value to be estimated; denotes the indicator function; and represent province and year fixed effects, respectively, controlling for time-invariant provincial heterogeneity and common macroeconomic or geopolitical shocks (e.g., international energy crises, global supply chain disruptions). The threshold value is determined using the grid search method, and the significance of the threshold effect is tested using the bootstrap method.
To examine differences in the impact of energy price shocks across regions, we conducted separate regressions on the eastern, central, and western subsamples based on the threshold model, comparing regional differences in threshold values and estimated coefficients.
3.3.2. Double Machine Learning Feature Importance Analysis
It should be emphasized that the DML framework adopted in this paper is only used for predictive feature importance analysis instead of causal inference. The standard DML method relies on orthogonality constraints and cross-fitting, and is originally designed to estimate heterogeneous treatment effects. The machine learning algorithm embedded in DML, namely LightGBM used in this paper, can generate quantitative feature importance indicators including information gain, which visually reflect the predictive contribution of each variable to the core explained variable.
This paper separates this analysis from the causal identification research based on threshold regression. The combined DML-LightGBM method is employed to rank the importance of potential driving factors of grain circulation efficiency across different regions, so as to clarify the priority of policy implementation for formulating differentiated regulatory policies in various areas.
Within the DML framework, this study employs the LightGBM gradient boosting tree algorithm as the base learner, with CEIit as the target variable and all control variables along with energy price levels as predictors, and performs 5-fold cross-validation. For each fold, the total information gain contribution of each feature during the decision tree construction process is calculated, and these values are averaged to obtain the feature importance across the entire sample. This process is then repeated for the eastern, central, and western subsamples to obtain the feature importance rankings for each region. The purpose of this analysis is not to infer causal effects, but rather to identify differences in the predictive drivers of circulation efficiency across regions, thereby providing a basis for differentiated policies. In practice, this study specifies the partial linear form of DML as shown in Equations (5) and (6):
Here, contains all control variables. A 5-fold cross-validation is employed: the dataset is randomly divided into five subsets, and the LightGBM model is trained sequentially on four of these subsets to estimate g(⋅) and m(⋅). The remaining subset is used to calculate the residuals and extract feature importance. The final feature importance is the average of the 5-fold results.
To make the feature importance analysis more robust and interpretable, we further employ SHAP (Shapley Additive Explanations) values to validate the feature importance rankings derived from the Gain-based metric. The SHAP results are reported in the robustness tests section.
4. Analysis of Empirical Results
4.1. Descriptive Statistics
Table A1 (see Appendix A) reports the descriptive statistics. The mean of the Grain Circulation Efficiency Index is 0.574, with a standard deviation of 0.285, indicating significant variations in circulation efficiency across provinces. The mean value of the energy price level (Price) is 101.35, with a standard deviation of 2.07, a minimum of 93.21, and a maximum of 106.19, reflecting notable variation in energy prices across provinces and years.
4.2. Threshold Effect Test
The CEI calculated using Equations (1)–(3), together with the threshold regression model that can be constructed with Equation (4), is used to analyze the nonlinear relationship between energy prices and the CEI. Table 1 reports the results of the significance test for the threshold effect, with energy price level serving as the threshold variable. The F-statistic for the single-threshold effect is 34.85, with a p-value of 0.000, strongly rejecting the null hypothesis of no threshold effect at the 1% level. The p-value for the dual threshold is 0.213, which fails the significance test. Therefore, the model contains a significant threshold value, confirming the existence of a nonlinear relationship.
Table 1.
Results of the Threshold Effect Test.
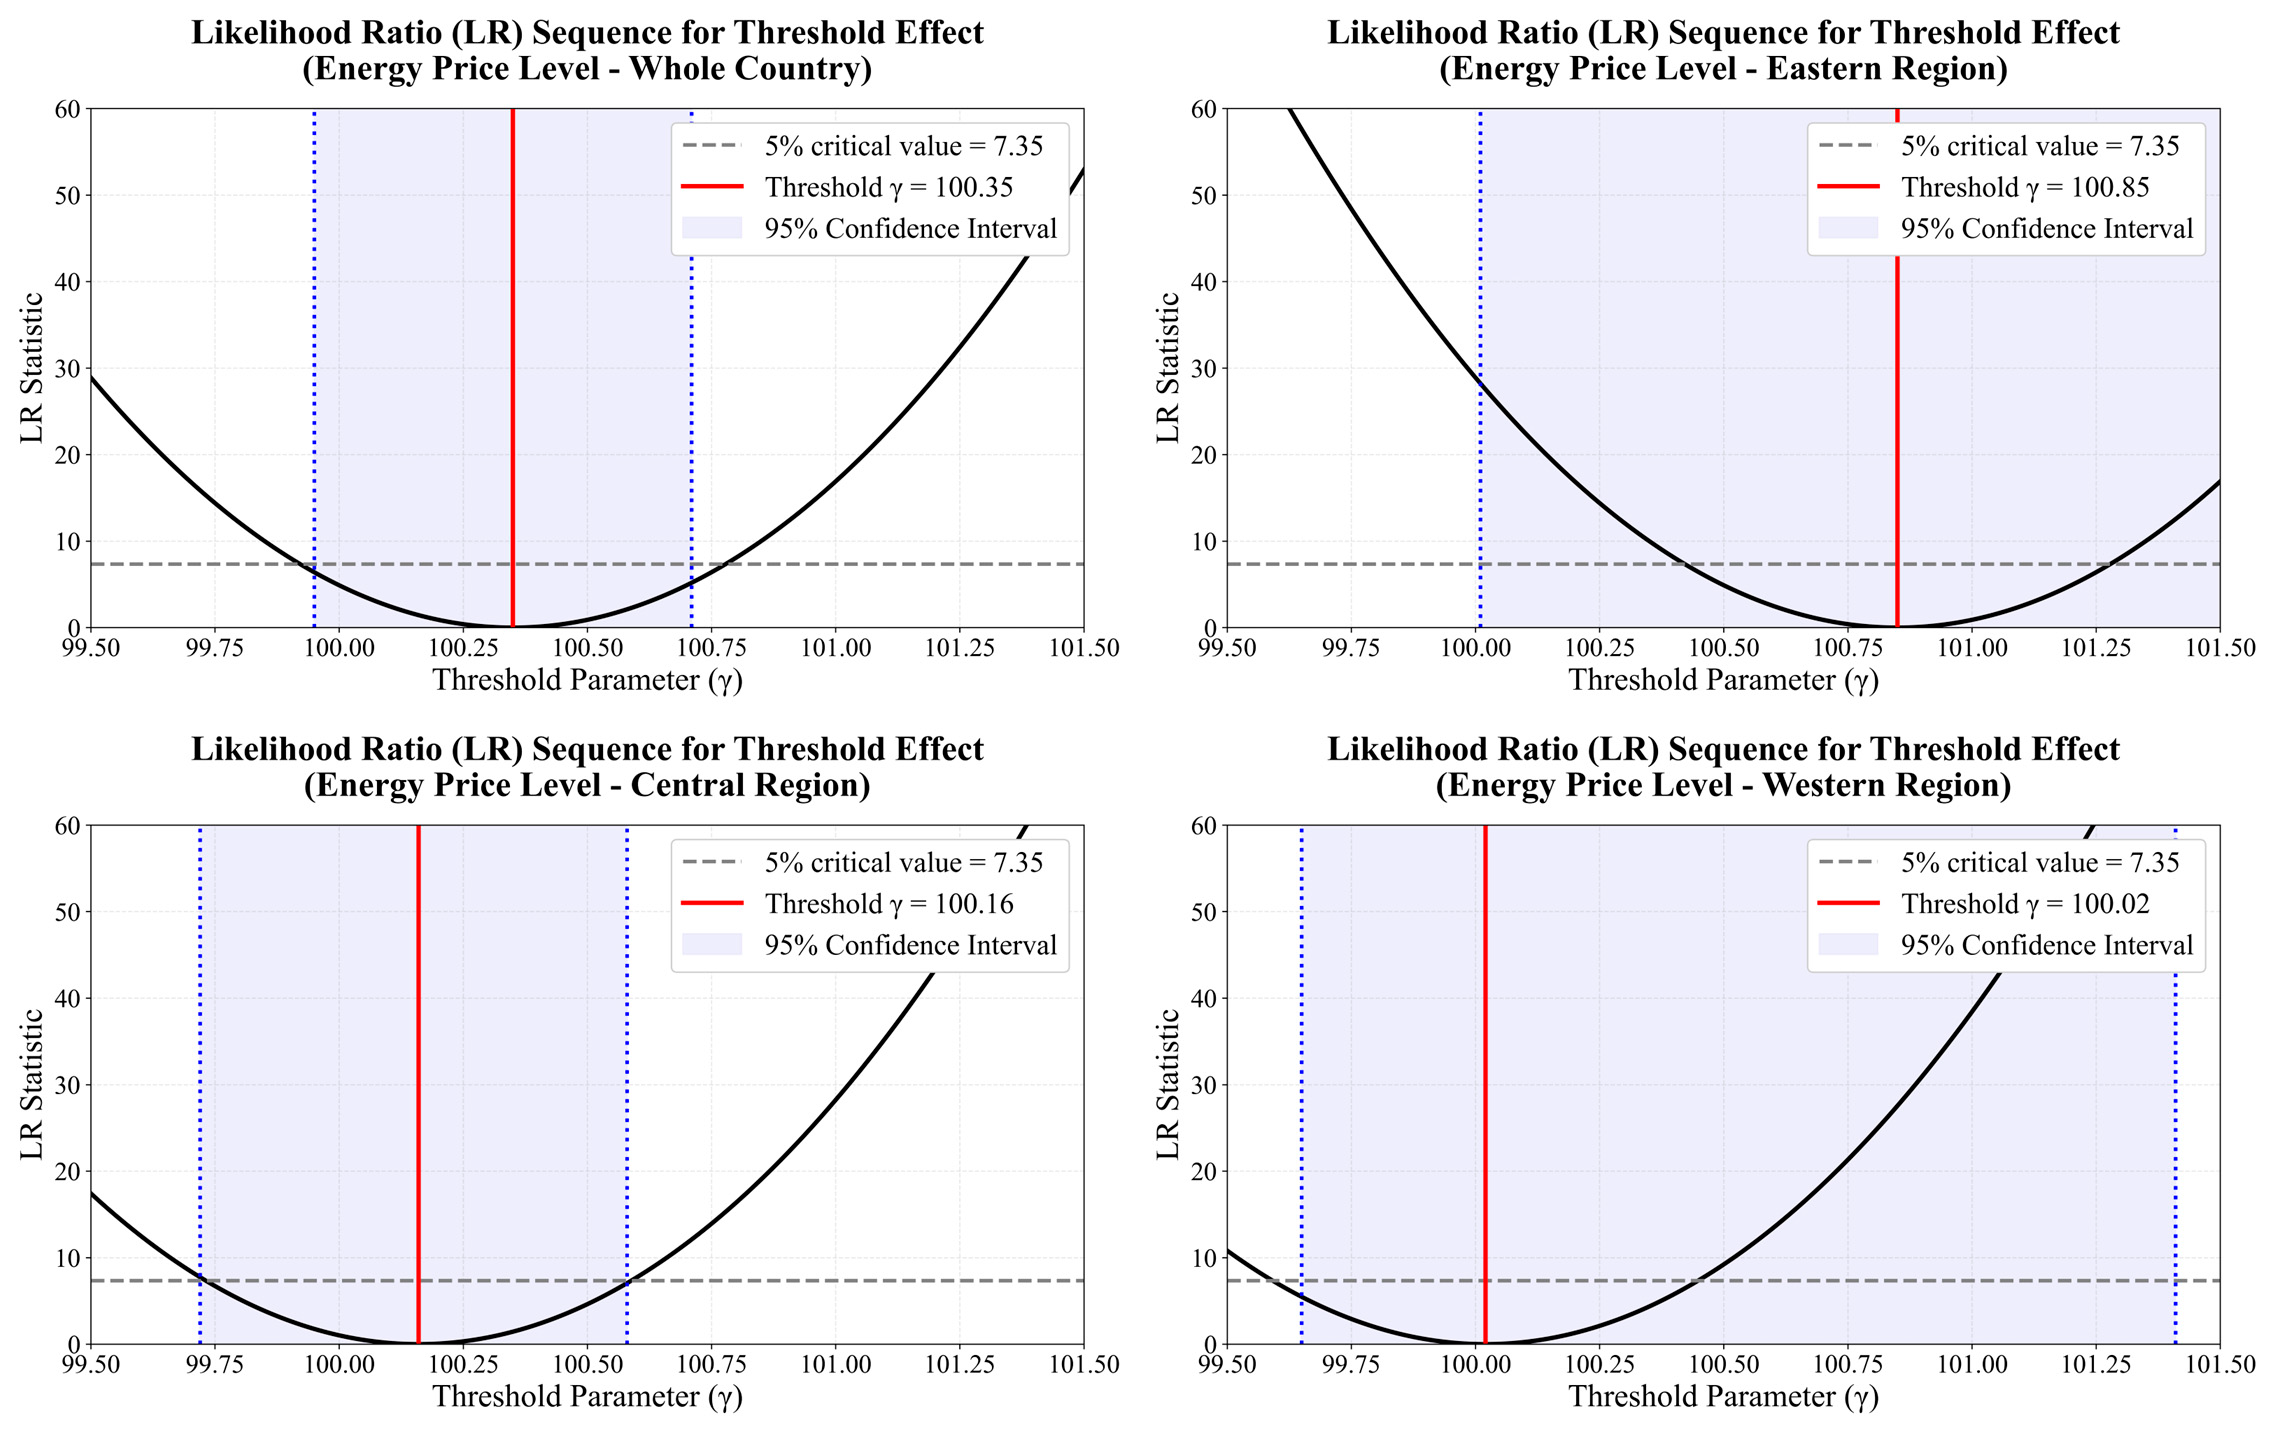
Table 2 presents the estimated threshold value is 100.35, with a 95% confidence interval of [99.95, 100.71]. The narrow confidence interval indicates that the threshold estimate is relatively precise.
Table 2.
Estimated Threshold Value.
4.3. Threshold Regression Results and Analysis
Table 3 presents the parameter estimates from the panel threshold model. When the energy price level is less than or equal to the threshold value, the coefficient of its impact on grain circulation efficiency is 0.1873, which is significantly positive at the 5% level; when the energy price level exceeds the threshold value, the coefficient changes to −0.0629, which is significantly negative at the 5% level. This result clearly indicates that the impact of energy price levels on grain circulation efficiency exhibits a significant nonlinear characteristics: during periods of relatively moderate or slight increases in energy prices, moderate price increases can promote improvements in circulation efficiency through the technology-driven effect; however, once energy prices exceed the threshold, the cost-squeeze effect becomes dominant, and further price increases will significantly inhibit circulation efficiency. Hypothesis 1 is empirically supported.
Table 3.
Panel Threshold Model Regression Results.
Regarding the control variables, grain yield volatility (Yield) exhibits a significant negative impact across the entire sample, indicating that instability in grain output disrupts circulation planning and reduces circulation efficiency. The foreign trade dependency (Trade) coefficient is significantly negative at the 10% level, suggesting that excessive reliance on international markets may weaken the autonomy and stability of the domestic circulation system. The coefficient for water resource consumption intensity (Water) is negative, consistent with theoretical expectations: regions with low water use efficiency often have weak agricultural foundations and relatively low circulation efficiency.
4.4. Analysis of Spatial Heterogeneity
The entire sample is divided into three subsamples—Eastern, Central, and Western—and threshold panel regression was performed for each. The results are shown in Table 4.
Table 4.
Results of Regional Threshold Regression.
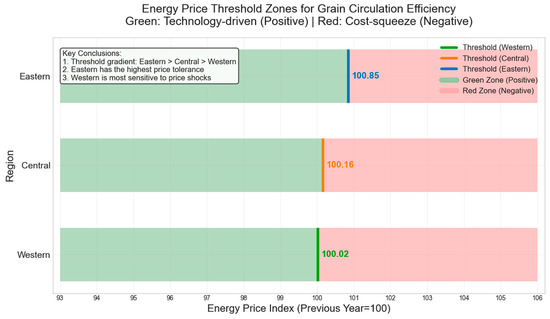
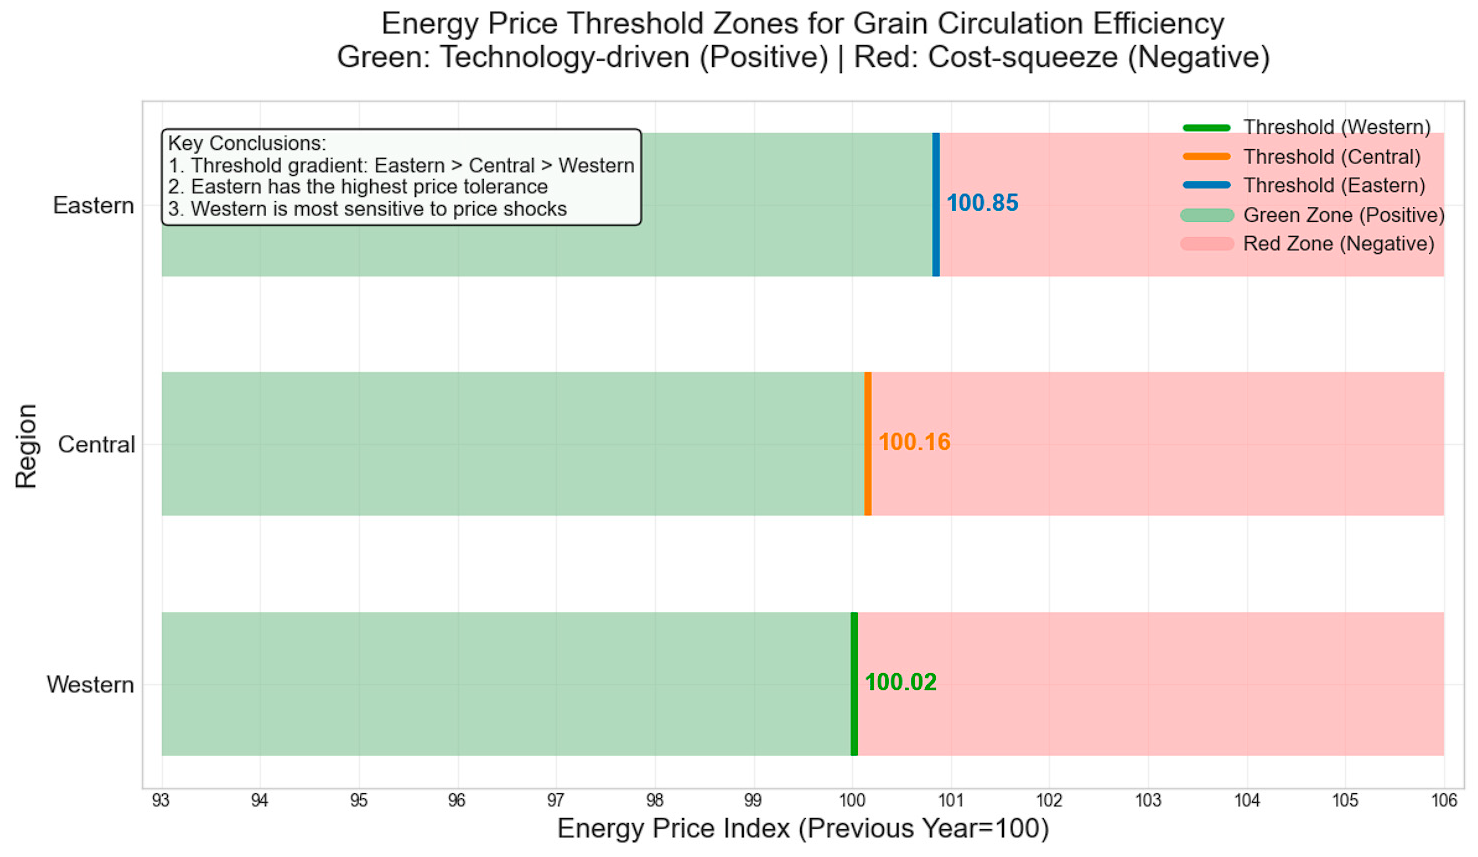
The results of the regional regression analysis show that the threshold effect is significant across all three regions (bootstrap p-values < 0.01), but the threshold values follow a pattern of being higher in the east and lower in the west. The threshold value for the eastern region is 100.85, for the central region 100.16, and for the western region 100.02. This indicates that the eastern region has a higher tolerance for rising energy prices and only enters the suppression zone when energy prices rise significantly; whereas the western region enters the cost-squeeze phase even when energy prices remain nearly flat. In the high-energy-price range, the suppression coefficient for the eastern region is not significant, while those for the central and western regions are significantly negative, with the western region having the largest absolute value of the coefficient, indicating that the western region’s circulation efficiency is most sensitive to energy price shocks. This difference stems from the eastern region’s more developed infrastructure, greater capital accumulation, and stronger technological innovation capabilities, which enable it to effectively hedge against energy cost pressures; in contrast, the western region’s sparse logistics networks, long transport distances, and limited alternatives mean that rising energy prices directly lead to a shortened circulation radius and reduced efficiency.
4.5. Feature Importance Analysis Based on Double Machine Learning
Using the CEI calculated by Formulas (1)–(3), along with Formulas (5) and (6), a double machine learning model can be constructed to analyze the main variables affecting CEI levels across the full sample and different regions. To ensure the reliability of the results, the model was first hyperparameter-tuned (learning rate 0.05, tree depth 6, number of leaves 50, with an early stopping strategy to prevent overfitting), followed by 5-fold cross-validation to calculate the information gain contribution ratio of each feature during the tree-building process. Table 5 reports the feature importance rankings for the full sample and each region.
Table 5.
Gain-based Feature Importance Rankings.
The following conclusions can be drawn from the feature importance rankings across all variables:
First, the three variables with the highest feature importance in the eastern region are R&D investment (25.8%), regional GDP (21.4%), and carbon emissions (15.9%), which together account for over 63% of the total. In sharp contrast, capital stock (6.2%) and water consumption (9.5%) rank lower in the eastern region. This “innovation-driven” model implies that for the economically developed eastern provinces, the primary pathway for further improving logistics efficiency is no longer the expansion of infrastructure investment, but rather relying on technological innovation and industrial upgrading. The relatively high contribution of carbon emissions may be because, as a composite proxy variable for industrialization and logistics activities, it is highly correlated with the dense logistics network activities in the eastern region.
Second, the ranking of factor importance in the central region exhibits a polarized pattern. Water consumption (26.3%) and capital stock (20.9%) make the largest contributions, with energy price levels (18.5%) and foreign trade dependency (17.2%) forming the second tier, while variables such as R&D investment (0.5%) and carbon emissions (3.6%) have extremely low contributions. This pattern reflects the “factor-driven” characteristics of the central region’s current stage of development. As a major grain-producing area and transportation hub, the region’s water resources endowment and the level of warehousing and logistics infrastructure directly determine the upper limit of circulation efficiency, while technological innovation has not yet become a dominant force.
Finally, the western region exhibits the highest concentration in the distribution of variable contributions. Four variables—energy price levels (24.7%), foreign trade dependency (21.2%), capital stock (18.4%), and water consumption (15.6%)—collectively account for approximately 80% of the total, with energy price levels contributing significantly more than in the other regions. R&D investment (1.2%) and regional GDP (0.5%) contribute almost no explanatory power. This profoundly reflects the fragility of the western region’s circulation system—namely, its inland location, long transport routes, and limited alternative routes. Coupled with the high dependence of grain trade in some provinces on specific ports and trading partners, changes in energy prices and external trade conditions together constitute the primary constraints on circulation efficiency. Hypothesis 2 is supported.
4.6. Robustness Tests
To verify the reliability of the feature importance rankings and the threshold regression results, this study conducts two types of robustness tests: First, the Gain-based Feature Importance Rankings in the LightGBM algorithm are replaced with SHAP values, and the feature importance analysis is repeated for the full sample and by region; second, the threshold regression is re-estimated using the one-year lagged energy price level.
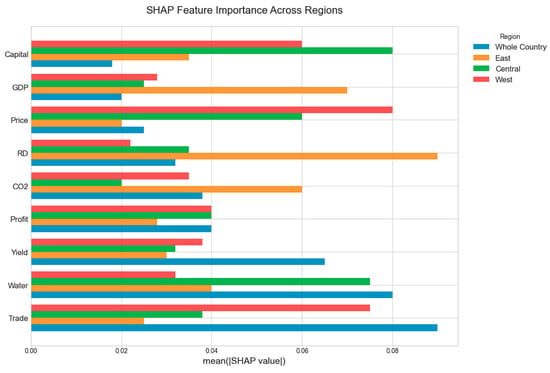
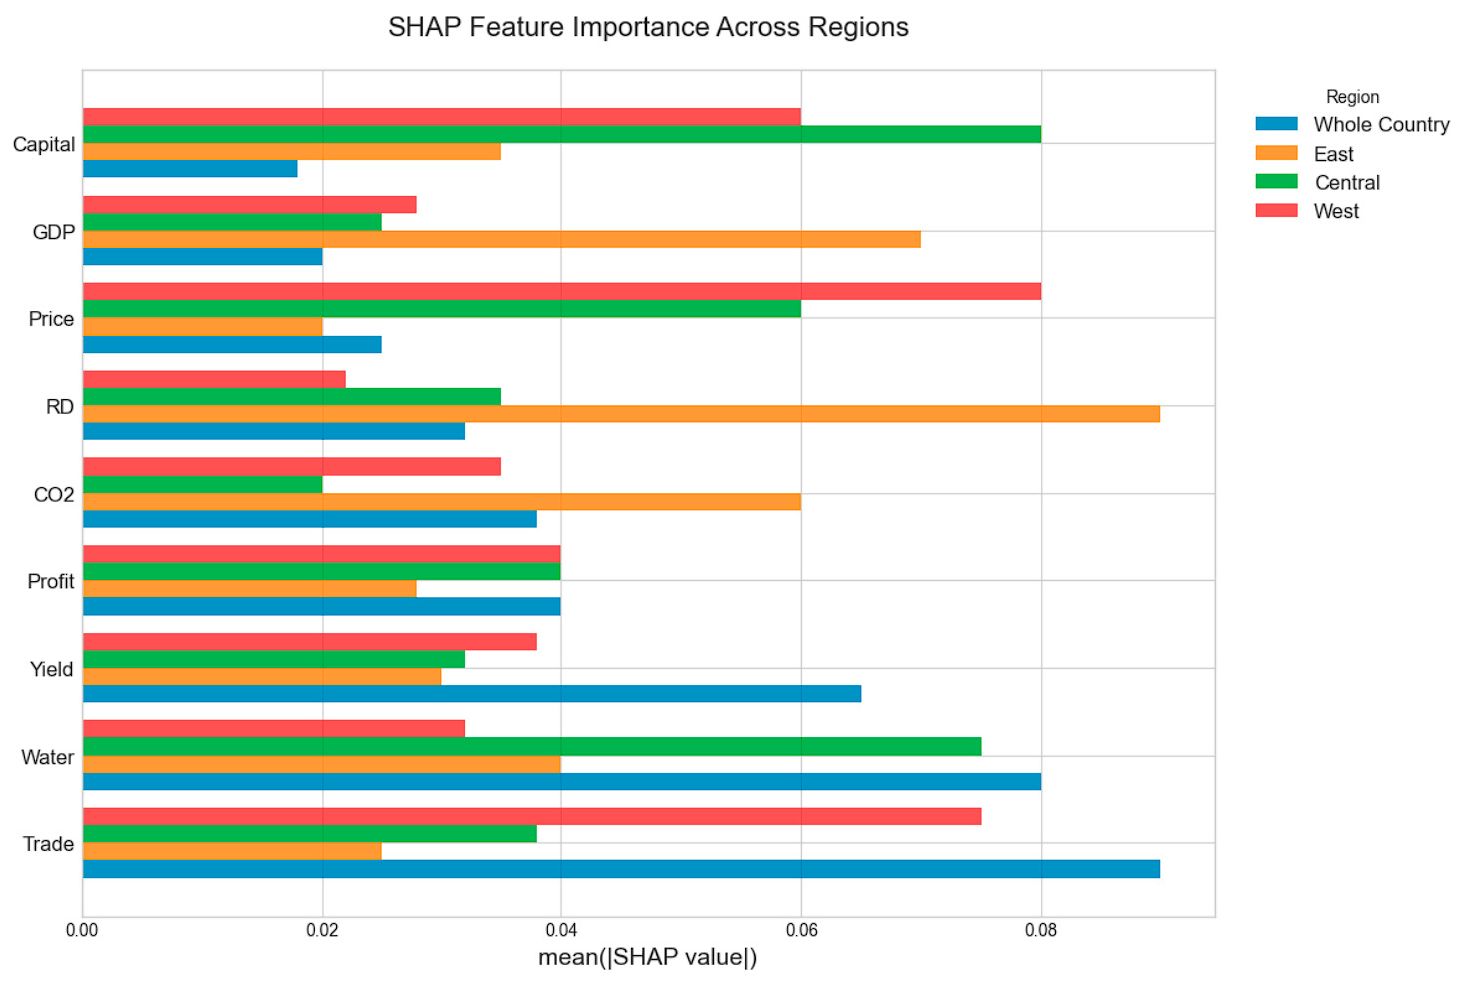
The ranking of the most important core variables in each region from the Shapley Additive Explanations (SHAP) feature importance (Figure 2) is consistent with that of the original model’s gain-based feature importance, verifying the robustness of the conclusions. Partial differences exist in the ranking of less important variables, which is due to the different underlying logics: gain-based feature importance reflects the contribution of variables to reducing model training error, while SHAP importance measures the marginal impact of variables on individual prediction outcomes.
Figure 2.
SHAP bar plot.
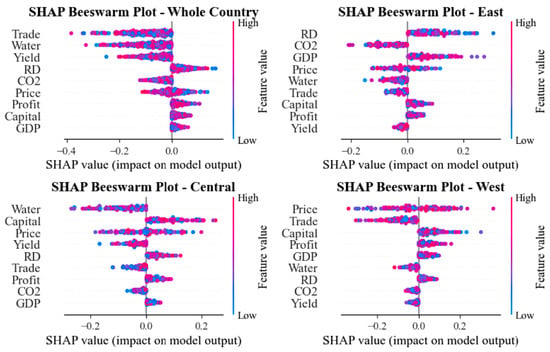
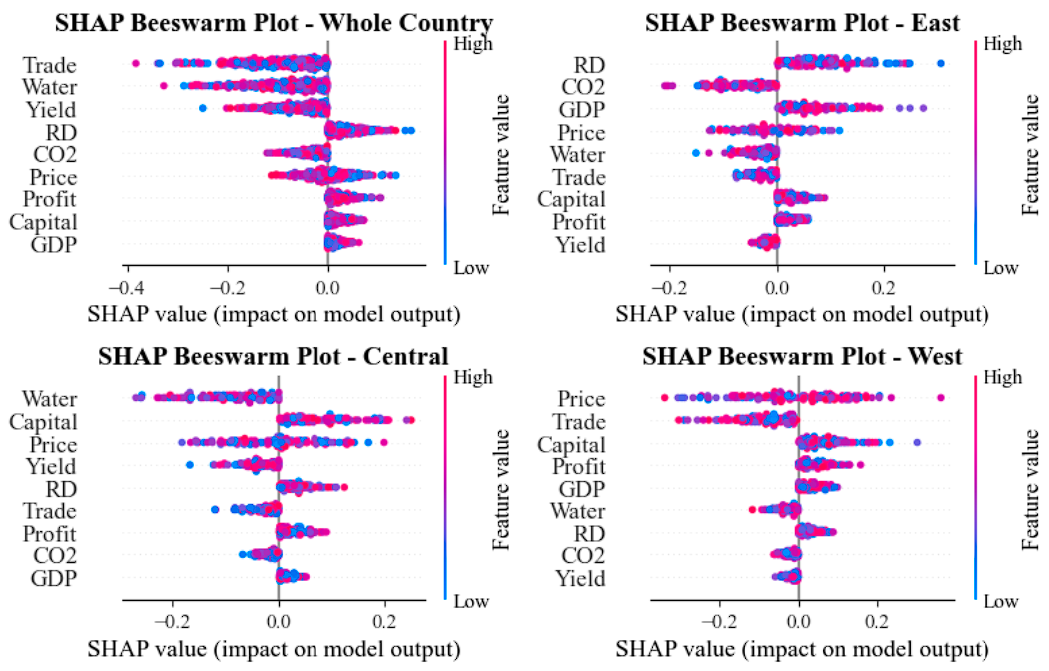
Figure 3 presents the SHAP beeswarm plots for the whole country and the eastern, central, and western regions. It can be observed that: (1) the top three core features in each region remain consistent with the gain-based feature importance of the original model, ruling out the bias of a single method; (2) the direction of feature impacts aligns with the regression results; (3) the dominant features across regions are consistent with expectations, reflecting genuine regional differences. As an unbiased measure of feature contribution, SHAP effectively compensates for the potential bias of gain-based importance, demonstrating that our conclusions hold under a more rigorous methodological framework and are strongly robust.
Figure 3.
SHAP beeswarm plot.
To mitigate potential endogeneity concerns, we re-estimate the threshold model using the one-year lagged energy price level as an alternative explanatory variable. The results reported in Table 6 remain consistent with the baseline findings.
Table 6.
Panel Threshold Regression with One-Year Lagged Energy Price Level (L.Price).
Our empirical findings reveal a nonlinear, threshold-dependent relationship between energy price levels and grain circulation efficiency, along with pronounced regional heterogeneity in both the threshold values and the importance of driving factors. These results not only advance the understanding of energy price transmission in grain supply chains but also invite comparison with prior studies in several important respects.
First, the nonlinear “rise-then-fall” pattern identified in this study (Hypothesis 1) contrasts with the largely linear or unidirectional negative relationship assumed in much of the existing agricultural economics literature. For instance, Arshad et al. (2018) [7] and Xie & Wang (2017) [8] explicitly treat rising energy costs as a persistent drag on agricultural output and distribution efficiency. By contrast, our threshold regression results show that moderate energy price increases, below an index of 100.35, can exert a positive technology push effect, improving circulation efficiency. This supports the induced technological innovation hypothesis (Yang et al., 2019) [23] in the specific context of grain circulation, a channel that has received little attention in prior work. Only after the price index exceeds the threshold does the cost-squeeze effect dominate, aligning with the conventional view that extreme energy shocks harm logistics performance (Magazzino & Mele, 2021) [5].
Second, the spatial gradient of energy price tolerance, highest in the eastern region (threshold = 100.85), intermediate in the central region (100.16), and lowest in the western region (100.02), extends previous studies that have documented regional disparities in infrastructure and economic development (Hong et al., 2011; Yang, 2016) [9,10]. While earlier research has noted that the western region is more vulnerable to external shocks due to longer transport distances and weaker logistics networks (Zhang et al., 2022) [31], our study quantifies this vulnerability in terms of a concrete energy price threshold.
Third, the feature importance rankings derived from the DML LightGBM framework offer a data-driven refinement of the “one-size-fits-all” policy assumptions prevalent in earlier policy discussions. For example, the previous literature often emphasizes infrastructure investment as a universal lever for improving grain circulation (Chen et al., 2025) [26]. Our results show that while capital stock is indeed one of the top two drivers in the central and western regions, it ranks only ninth in the eastern region, where R&D investment and GDP dominate. Similarly, water consumption, highlighted in the energy–food–water nexus literature, is the most important factor in the central region but less so in the east and west. These cross-regional differences in driver importance have not been systematically documented in prior empirical work and directly inform the design of regionally differentiated policies.
Finally, our findings are broadly consistent with recent studies that emphasize the role of geopolitical energy shocks in reshaping supply chain resilience (Khan, 2025; Zhou et al., 2026) [33,38], although we treat geopolitical conflicts as background motivation rather than directly estimated causal factors. The robustness of our threshold estimates and feature rankings across alternative measures and lagged specifications reinforces the credibility of these comparisons.
5. Conclusions and Policy Recommendations
5.1. Research Findings
Based on panel data from 30 Chinese provinces covering the period 2011–2022, this study employs a counterfactual decomposition framework to construct a proxy for grain circulation efficiency. Using panel threshold regression and double machine learning feature importance analysis, it systematically examines the impact of energy price levels on grain circulation efficiency—as well as regional heterogeneity—against the backdrop of geopolitical conflicts. The study reaches the following main conclusions:
First, this study finds that energy price levels exhibit a threshold effect on grain circulation efficiency—initially positive and subsequently negative. This conclusion contrasts with the linear assumptions regarding the relationship between energy prices and agricultural output found in existing agricultural economics literature. Some prior studies have argued that rising energy prices primarily exert a unidirectional negative impact on agriculture and circulation by driving up production costs (Su et al., 2019) [54]. This study innovatively employs a nonlinear perspective to demonstrate that, within a low-price range, moderate increases in energy prices can generate a positive technological spillover effect, thereby enhancing circulation efficiency. This finding supports the applicability of the induced technological innovation hypothesis in the circulation sector.
Second, threshold regression analysis by region reveals that the eastern region exhibits the highest tolerance for rising energy prices, with negative effects in the high-price range being insignificant; the western region exhibits the lowest tolerance, entering a cost-squeeze phase when energy prices are nearly flat, and experiencing the strongest inhibitory effects. These findings indicate that the sensitivity of circulation efficiency to energy price shocks exhibits a spatial gradient pattern of “low in the east and high in the west.”
Finally, the differences in the importance of regional characteristics revealed by the double machine learning methods employed in this study provide new empirical evidence for formulating differentiated circulation policies. Traditional “one-size-fits-all” policy designs overlook the heterogeneity of the drivers of circulation efficiency across different regions, which may lead to suboptimal policy outcomes. For example, in the eastern region, continuously increasing R&D investment and promoting the digital transformation of the circulation industry will be effective ways to improve efficiency; in the central region, strengthening water conservancy infrastructure and accumulating capital for warehousing and logistics is more critical; while in the western region, stabilizing energy price changes, expanding diversified foreign trade channels, and improving the basic transportation network should be policy priorities. This data-driven approach to implementing region-specific policies will help improve the efficiency of public resource allocation.
5.2. Policy Recommendations
It should be noted that the energy price threshold identified in this study (100.35) refers to the provincial fuel and power purchase price index (previous year = 100). This value implies that when energy prices increase by no more than 0.35% compared to the previous year, the price rise exerts a positive effect on grain circulation efficiency; however, once the increase exceeds 0.35%, the cost-squeeze effect becomes dominant, and circulation efficiency declines. This indicates that China’s grain circulation system has limited tolerance for energy price increases. This finding further highlights the necessity of early intervention in the critical range where energy prices shift from “stable to rising”. In terms of empirical frequency, among the 360 province–year observations, a total of 244 observations recorded an energy price index exceeding 100.35, thereby entering the cost-squeeze regime. To improve the efficiency of grain circulation in China, based on the above conclusions, this paper proposes the following policy recommendations.
First, implement differentiated strategies to enhance grain circulation efficiency that match regional characteristics. The feature importance analysis from double machine learning indicates that the key factors influencing grain circulation efficiency exhibit structural differences across the eastern, central, and western regions. In the eastern region, R&D investment and gross regional product contribute the most, so policies should focus on innovation-driven development and digital transformation. In the central region, water resource consumption and capital stock are the dominant factors, requiring greater investment in water conservancy facilities and storage and logistics infrastructure. In the western region, energy price levels and foreign trade dependence are the most sensitive factors, making energy cost stabilization and expansion of diversified trade channels key policy priorities. These regional heterogeneity findings provide clear empirical support for abandoning a “one-size-fits-all” approach and shifting toward precise, data-driven, regionally differentiated policy implementation.
Second, establish a differentiated early-warning and intervention mechanism for energy prices based on regional threshold values and key influencing factors. Our empirical results show that the impact of energy prices on grain circulation efficiency exhibits a significant nonlinear threshold effect, with a gradient pattern of “high in the east, low in the west” across the three major regions: eastern region threshold = 100.85, central region = 100.16, and western region = 100.02 (fuel and power purchase price index, base year = 100). Based on the key influencing factors identified in the first recommendation for each region, we propose a two-tier early-warning and intervention system consisting of a “green zone (≤threshold)” and a “red zone (>threshold)”, eliminating intermediate intervals to achieve precise responses.
In the eastern region’s green zone, the price level has not yet reached the inhibitory threshold. The region’s innovation-driven advantages should be fully utilized, encouraging circulation enterprises to increase R&D investment and promote intelligent dispatching, new-energy transport vehicles, and digital warehousing management systems, thereby converting price signals into drivers of technological upgrading. Once the red zone (>100.85) is entered, the cost-squeeze effect becomes dominant. At this stage, simple subsidies are not appropriate; instead, an “innovation-hedging” mechanism should be activated. For example, the government, in cooperation with industry associations, may set up an emergency fund for grain logistics technologies, providing equipment purchase subsidies or low-interest loans to enterprises adopting energy-saving and efficiency-enhancing technologies, while organizing universities and research institutes in the eastern region to deliver smart logistics solutions to circulation enterprises, using technological innovation to absorb rising energy costs and prevent declines in efficiency.
In the central region’s green zone, priority should be given to the use of central and local fiscal funds to accelerate the construction of high-standard grain warehouses, cold-chain logistics bases, and dedicated road and rail links connecting main transport arteries, thereby increasing capital stock. At the same time, comprehensive reforms of agricultural water pricing should be advanced, encouraging water recycling and water-saving drying technologies to reduce water consumption per unit of grain circulation. When the price enters the red zone, a temporary reduction in tolls for key logistics hubs undertaking interprovincial grain transport may be implemented, using the redundancy of infrastructure to offset the impact of energy cost shocks.
In the western region, due to its very low threshold, a regularized comprehensive support mechanism should be established. Before energy prices rise significantly, efforts should focus on diversifying foreign trade channels to reduce dependence on single trade routes, while improving road and rail cold-chain facilities to address infrastructure gaps. Once energy prices rise rapidly, the government should provide long-term fuel subsidies, preferential electricity rates for cold-chain operations, and guaranteed capacity subsidies to key circulation enterprises in the western region, ensuring uninterrupted grain logistics. In addition, grain logistics infrastructure in the western region should be included in the priority list for central government budget investment to fundamentally enhance system resilience. The red and green zones for each region are shown in Figure 4.
Figure 4.
Regional energy price thresholds for grain circulation efficiency.
Third, advance market-oriented reforms and organizational development within the grain circulation system. Based on the significance of characteristics across the full sample, foreign trade dependency and water consumption have the strongest explanatory power for circulation efficiency, while corporate profits contribute relatively little. This suggests that structural issues—such as insufficient marketization and the fragmentation and weakness of circulation entities—still persist in the current grain circulation sector. On the one hand, we should continue to deepen market-oriented reforms in the grain circulation sector, reduce the obstacles posed by local protectionism and administrative barriers to cross-regional circulation, and improve price discovery functions such as those in the grain futures market and wholesale market auction mechanisms. This will ensure that changes in energy costs are reasonably shared across all links in the industrial chain through price signals, thereby preventing price distortions from causing the allocation of circulation resources to deviate from the optimal state. On the other hand, efforts should focus on enhancing the organizational capacity of circulation entities. By supporting intermediary organizations such as federations of farmers’ cooperatives and grain circulation industry associations, we can improve the collective bargaining power and resource integration capabilities of dispersed farmers and small- and medium-sized circulation enterprises in areas such as energy procurement, transportation scheduling, and cold chain sharing. This organizational strength will help mitigate the uncertainty caused by energy price changes. At the same time, a cross-regional emergency coordination mechanism for grain circulation should be established. In the event of extreme external shocks, such as geopolitical conflicts, this mechanism should enable the rapid activation of coordinated responses—including the allocation of transport capacity, the matching of production and sales, and the release of reserves—to prevent short-term circulation bottlenecks from escalating into systemic risks in the grain supply chain.
5.3. Limitations and Future Research
This study makes three main contributions: (i) it reveals the nonlinear threshold effect of energy price levels on grain circulation efficiency and the spatial gradient of this effect across the eastern, central, and western regions; (ii) it identifies region-specific heterogeneous drivers of circulation efficiency using double machine learning with LightGBM; and (iii) it demonstrates the robustness of these findings through alternative model specifications and feature importance measures. Nevertheless, two main limitations should be acknowledged.
First, the measurement of grain circulation efficiency relies on indirectly constructed proxies (e.g., circulation volume estimated from agricultural output and circulation intensity) due to the lack of direct provincial-level logistics flow data. While we have provided detailed justification and robustness checks, future research would benefit from more granular firm-level or logistics-network data to validate and refine the findings.
Second, the time span of this study (2011–2022) makes it difficult to fully capture the comprehensive impact of post-2022 geopolitical conflicts, such as the Russia–Ukraine conflict, on energy prices and grain circulation. Therefore, in this study, geopolitical conflicts are treated only as background motivation rather than as directly estimated causal factors. Future research using longer panel data would allow for a more comprehensive assessment of these effects.
Beyond these limitations, future research could extend the analysis to other countries or regions to test the generalizability of the threshold effects and could apply alternative methods (e.g., causal machine learning) to further explore heterogeneous responses to energy price changes across different circulation contexts.
Author Contributions
H.M.: Methodology, Conceptualization, Writing—review and editing, Supervision, Writing—original draft and Funding acquisition; F.X.: Methodology, Software, Writing—original draft; Z.L.; Visualization, Writing—review and editing; Y.W.: Methodology, Software, Writing—original draft; J.Z.: Writing—review and editing, Data curation. All authors have read and agreed to the published version of the manuscript.
Funding
The study was funded by the National Social Science Fund of China [grant number 23BGL146].
Institutional Review Board Statement
Not applicable. This study does not involve human participants or live vertebrates.
Informed Consent Statement
Not applicable.
Data Availability Statement
The data supporting the findings of this study are obtained from publicly available sources including the China Statistical Yearbook, the China Rural Statistical Yearbook, the China Energy Statistical Yearbook, the China Water Resources Bulletin, the China Logistics Yearbook, the CEADs database, and the CSMAR database. Provincial-level indicators on grain production, energy prices, GDP, capital stock, R&D, water use, carbon emissions, employment, trade, and logistics are compiled as described in Section 3.1 and Section 3.2. The constructed grain circulation efficiency index (CEI) and all other variables are available from the corresponding author upon reasonable request, without undue reservation.
Conflicts of Interest
The authors declare no potential conflicts of interest with respect to the research, authorship, and publication of this article.
Abbreviations
| CEI | Grain Circulation Efficiency Index |
| CO2 | Carbon Dioxide Emissions |
| DML | Double Machine Learning |
| LightGBM | Light Gradient Boosting Machine |
| R&D | Research and Development Expenditures |
| SHAP | Shapley Additive Explanations |
Appendix A
Table A1.
Descriptive Statistics of Variables.
Appendix B
Figure A1.
Threshold-effect plot.
References
- Yang, S.; Fu, Y. Interconnectedness among supply chain disruptions, energy crisis, and oil market volatility on economic resilience. Energy Econ. 2025, 143, 108290. [Google Scholar] [CrossRef] [Scilit]
- Su, X.; Razi, U.; Zhao, S.; Li, W.; Gu, X.; Yan, J. Geopolitical risk and energy markets in China. Int. Rev. Financ. Anal. 2025, 103, 104187. [Google Scholar] [CrossRef] [Scilit]
- Zhuang, X.; Wang, S.; Tang, Z.; Fu, Z.; Dong, B. Food Security Under Energy Shock: Research on the Transmission Mechanism of the Effect of International Crude Oil Prices on Chinese and US Grain Prices. Systems 2025, 13, 870. [Google Scholar] [CrossRef] [Scilit]
- Barrett, C.B.; Reardon, T.; Swinnen, J.; Zilberman, D. Agri-food value chain revolutions in low-and middle-income countries. J. Econ. Lit. 2022, 60, 1316–1377. [Google Scholar] [CrossRef] [Scilit]
- Magazzino, C.; Mele, M. On the relationship between transportation infrastructure and economic development in China. Res. Transp. Econ. 2021, 88, 100947. [Google Scholar] [CrossRef] [Scilit]
- Alder, S. Chinese roads in India: The effect of transport infrastructure on economic development. J. Int. Econ. 2025, 157, 104140. [Google Scholar] [CrossRef] [Scilit]
- Arshad, M.; Amjath-Babu, T.S.; Aravindakshan, S.; Krupnik, T.J.; Toussaint, V.; Kächele, H.; Müller, K. Climatic variability and thermal stress in Pakistan’s rice and wheat systems: A stochastic frontier and quantile regression analysis of economic efficiency. Ecol. Indic. 2018, 89, 496–506. [Google Scholar] [CrossRef] [Scilit]
- Xie, H.; Wang, B. An empirical analysis of the impact of agricultural product price fluctuations on China’s grain yield. Sustainability 2017, 9, 906. [Google Scholar] [CrossRef] [Scilit]
- Hong, J.; Chu, Z.; Wang, Q. Transport infrastructure and regional economic growth: Evidence from China. Transportation 2011, 38, 737–752. [Google Scholar] [CrossRef] [Scilit]
- Yang, F.; Pan, S.; Yao, X. Regional convergence and sustainable development in China. Sustainability 2016, 8, 121. [Google Scholar] [CrossRef] [Scilit]
- Clarke, P.S.; Polselli, A. Double machine learning for static panel models with fixed effects. Econom. J. 2026, 29, 69–86. [Google Scholar] [CrossRef] [Scilit]
- Kuang, X.; Qin, J. Forecasting Volatility and Analyzing Importance Using Dual Machine Learning Algorithms and Elastic Net Regression. In Proceedings of the 2024 3rd International Conference on Data Analytics, Computing and Artificial Intelligence (ICDACAI); IEEE: New York, NY, USA, 2024; pp. 908–914. [Google Scholar]
- Raimbekov, Z.; Syzdykbayeva, B.; Rakhmetulina, A.; Rakhmetulina, Z.; Abylaikhanova, T.; Ordabayeva, M.; Doltes, L. The impact of agri-food supply channels on the efficiency and links in supply chains. Economies 2023, 11, 206. [Google Scholar] [CrossRef] [Scilit]
- Marchi, B.; Zanoni, S. Supply chain management for improved energy efficiency: Review and opportunities. Energies 2017, 10, 1618. [Google Scholar] [CrossRef] [Scilit]
- Al-Saidi, M.; Elagib, N.A.; Ribbe, L.; Schellenberg, T.; Roach, E.; Oezhan, D. Water-Energy-Food Security Nexus in the Eastern Nile Basin: Assessing the Potential of Transboundary Regional Cooperation. Water-Energy-Food Nexus Princ. Pract. 2017, 103–116. [Google Scholar] [CrossRef] [Scilit]
- Szaruga, E.; Załoga, E.; Drewnowski, A.; Kowalska, S.; Dąbrosz-Drewnowska, P. The Role of EU Transport Market Liberalization in Shaping Directions of Rail Energy Consumption Rationalization in Relation to the Export of Goods: The Case of Poland. Energies 2024, 17, 3118. [Google Scholar] [CrossRef] [Scilit]
- Cui, C.; Li, J. Strategic Planning for Sustainable Last-Mile Logistics: Balancing Airspace Constraints and Carbon Price Uncertainty in Truck-Drone Delivery. Sustainability 2026, 18, 3978. [Google Scholar] [CrossRef] [Scilit]
- Katris, A.; Turner, K.; Calvillo, C.F.; Zhou, L. The importance of heat pump cost reduction and domestic supply chain development in the presence of persisting energy price shocks. Energy Strategy Rev. 2024, 55, 101518. [Google Scholar] [CrossRef] [Scilit]
- James, S.J.; James, C. The food cold-chain and climate change. Food Res. Int. 2010, 43, 1944–1956. [Google Scholar] [CrossRef] [Scilit]
- Taheri Hosseinkhani, N. Geopolitical Turmoil, Supply-Chain Realignment, and Inflation: Commodity Shocks, Trade Fragmentation, and Policy Responses. 2025. Available online: https://papers.ssrn.com/sol3/papers.cfm?abstract_id=5448354 (accessed on 16 December 2025).
- Pu, X.; Cai, Z.; Chong, A.Y.L.; Paulraj, A. Dependence structure, relational mechanisms and performance: Teasing out the differences between upstream and downstream supply chain partners. Int. J. Oper. Prod. Manag. 2023, 43, 1009–1039. [Google Scholar] [CrossRef] [Scilit]
- Hammond, S.T.; Brown, J.H.; Burger, J.R.; Flanagan, T.P.; Fristoe, T.S.; Mercado-Silva, N.; Nekola, J.C.; Okie, J.G. Food spoilage, storage, and transport: Implications for a sustainable future. BioScience 2015, 65, 758–768. [Google Scholar] [CrossRef] [Scilit]
- Yang, F.; Cheng, Y.; Yao, X. Influencing factors of energy technical innovation in China: Evidence from fossil energy and renewable energy. J. Clean. Prod. 2019, 232, 57–66. [Google Scholar] [CrossRef] [Scilit]
- Cullen, J.M.; Allwood, J.M. The efficient use of energy: Tracing the global flow of energy from fuel to service. Energy Policy 2010, 38, 75–81. [Google Scholar] [CrossRef] [Scilit]
- Stone, J.; Rahimifard, S. Resilience in agri-food supply chains: A critical analysis of the literature and synthesis of a novel framework. Supply Chain. Manag. Int. J. 2018, 23, 207–238. [Google Scholar] [CrossRef] [Scilit]
- Chen, L.; Xia, X.; Zhang, J.; Zhu, Y.; Long, C.; Chen, Y.; Yan, X. Multi-objective optimization of grain trade considering food security and water resources sustainability in China with a water-food-energy nexus perspective. J. Clean. Prod. 2025, 523, 146466. [Google Scholar] [CrossRef] [Scilit]
- Bager, S.L.; Singh, C.; Persson, U.M. Blockchain is not a silver bullet for agro-food supply chain sustainability: Insights from a coffee case study. Curr. Res. Environ. Sustain. 2022, 4, 100163. [Google Scholar] [CrossRef] [Scilit]
- Song, W.; Zhao, K. Navigating the innovation policy dilemma: How subnational governments balance expenditure competition pressures and long-term innovation goals. Heliyon 2024, 10, e34787. [Google Scholar] [CrossRef] [Scilit]
- Kilinc-Ata, N.; Proskuryakova, L.N. Modeling Hybrid Renewable Microgrids in Remote Northern Regions: A Comparative Simulation Study. Energies 2025, 18, 5827. [Google Scholar] [CrossRef] [Scilit]
- Deng, X.; Liang, L.; Wu, F.; Wang, Z.; He, S. A review of the balance of regional development in China from the perspective of development geography. J. Geogr. Sci. 2022, 32, 3–22. [Google Scholar] [CrossRef] [Scilit]
- Zhang, Y.; Kong, J.; Zhang, Y.; Wang, H.; Deng, S. Case study of stratification, spatial agglomeration, and unequal logistics industry development on western cities in China. J. Urban Plan. Dev. 2022, 148, 05022009. [Google Scholar] [CrossRef] [Scilit]
- Shen, L.; Sun, R.; Liu, W. Examining the drivers of grain production efficiency for achieving energy transition in China. Environ. Impact Assess. Rev. 2024, 105, 107431. [Google Scholar] [CrossRef] [Scilit]
- Khan, K. How do supply chain and geopolitical risks threaten energy security? A time and frequency analysis. Energy 2025, 316, 134501. [Google Scholar] [CrossRef] [Scilit]
- Du, J.; Wang, J.; Liang, J.; Liang, R. Research on the impact of smart logistics on the manufacturing industry chain resilience. Sci. Rep. 2025, 15, 9052. [Google Scholar] [CrossRef] [Scilit]
- Zhu, M.; Yuan, P.; Cui, H. Analysis of intercity transportation network efficiency using Flow-Weighted time circuity: A case study of seven major City clusters in China. Appl. Sci. 2024, 14, 3834. [Google Scholar] [CrossRef] [Scilit]
- Rohde, M.M. Securing Food, Energy, and Water in India. Food Energy Water Sustain. 2018, 21, 21–37. [Google Scholar]
- Dai, X.; Liu, M.; Lin, Q. Research on optimization strategies of regional cross-border transportation networks—Implications for the construction of cross-border transport corridors in Xinjiang. Sustainability 2024, 16, 5337. [Google Scholar] [CrossRef] [Scilit]
- Zhou, Y.; Lu, Y.; Yang, Y.; Cheng, Y.; He, Z.; Wang, Y.; Shan, Y. Reshaping global energy security: Implications of embodied energy transfers in global supply chains. Energy Policy 2026, 213, 115186. [Google Scholar] [CrossRef] [Scilit]
- Song, W.; Zhao, M.; Yu, J. Price distortion on market resource allocation efficiency: A DID analysis based on national-level big data comprehensive pilot zones. Int. Rev. Econ. Financ. 2025, 102, 104128. [Google Scholar] [CrossRef] [Scilit]
- Hsieh, C.T.; Klenow, P.J. Misallocation and manufacturing TFP in China and India. Q. J. Econ. 2009, 124, 1403–1448. [Google Scholar] [CrossRef] [Scilit]
- Zeng, S.; Shu, X.; Ye, W. Total factor productivity and high-quality economic development: A theoretical and empirical analysis of the Yangtze River economic belt, China. Int. J. Environ. Res. Public Health 2022, 19, 2783. [Google Scholar] [CrossRef] [Scilit]
- Zhao, Y.; Cheng, S.; Lu, F. Seasonal characteristics of agricultural product circulation network: A case study in Beijing, China. Agronomy 2022, 12, 2827. [Google Scholar] [CrossRef] [Scilit]
- Wang, J.; Liu, S.; Zhao, Y. Spatial–temporal evolution and driving factors of economic dual circulation coordinated development in China’s coastal provinces. Sustainability 2023, 15, 11009. [Google Scholar] [CrossRef] [Scilit]
- Kovalenko, O.; Bokiy, O.; Rybak, Y.; Lysenko, H.; Voznesenska, N. Assessment of export potential and state of foreign food and agriculture trade in the world. Agric. Resour. Econ. 2023, 9, 179–196. [Google Scholar]
- Yemelyanov, O.; Petrushka, T.; Lesyk, L.; Havryliak, A.; Yanevych, N.; Kurylo, O.; Chernushkina, O.; Petrushka, K. Assessing the Sustainability of the Consumption of Agricultural Products with Regard to a Possible Reduction in Its Imports: The Case of Countries That Import Corn and Wheat. Sustainability 2023, 15, 9761. [Google Scholar] [CrossRef] [Scilit]
- Xu, Y.; Man, X.; Fu, Q.; Li, M.; Li, H.; Li, T. A decoupling analysis framework for agricultural sustainability and economic development based on virtual water flow in grain exporting. Ecol. Indic. 2022, 141, 109083. [Google Scholar] [CrossRef] [Scilit]
- Fan, Q.; Wang, L.; Jia, W. The Bias of Chinese Agricultural Enterprises’ Export: Profit Margin or Productivity? Rev. Dev. Econ. 2025, 29, 1663–1676. [Google Scholar] [CrossRef] [Scilit]
- Liu, L.; Ma, X.; Li, Y. Does new infrastructure promote the development of rural industries? A nonlinear analysis based on provincial panel data from China. Land 2025, 14, 986. [Google Scholar] [CrossRef] [Scilit]
- Meng, T.; Yu, D.; Ye, L.; Yahya, M.H.; Zariyawati, M.A. Impact of digital city competitiveness on total factor productivity in the commercial circulation industry: Evidence from China’s emerging first-tier cities. Humanit. Soc. Sci. Commun. 2023, 10, 927. [Google Scholar]
- Zhu, H.; Geng, C.; Chen, Y. Urban–rural integration and agricultural technology innovation: Evidence from China. Agriculture 2024, 14, 1906. [Google Scholar] [CrossRef] [Scilit]
- Zhang, Q.; Qu, Y.; Zhan, L. Great transition and new pattern: Agriculture and rural area green development and its coordinated relationship with economic growth in China. J. Environ. Manag. 2023, 344, 118563. [Google Scholar] [CrossRef] [Scilit]
- Bambi, P.D.R.; Pea-Assounga, J.B.B. Assessing the influence of land use, agricultural, industrialization, CO2 emissions, and energy intensity on cereal production. J. Environ. Manag. 2024, 370, 122612. [Google Scholar] [CrossRef] [Scilit]
- Hansen, B.E. Threshold effects in non-dynamic panels: Estimation, testing, and inference. J. Econom. 1999, 93, 345–368. [Google Scholar] [CrossRef] [Scilit]
- Su, C.W.; Wang, X.Q.; Tao, R.; Oana-Ramona, L. Do oil prices drive agricultural commodity prices? Further evidence in a global bio-energy context. Energy 2019, 172, 691–701. [Google Scholar] [CrossRef] [Scilit]

Disclaimer/Publisher’s Note: The statements, opinions and data contained in all publications are solely those of the individual author(s) and contributor(s) and not of MDPI and/or the editor(s). MDPI and/or the editor(s) disclaim responsibility for any injury to people or property resulting from any ideas, methods, instructions or products referred to in the content. |
© 2026 by the authors. Licensee MDPI, Basel, Switzerland. This article is an open access article distributed under the terms and conditions of the Creative Commons Attribution (CC BY) license.