


Abstract
This paper presents a numerical investigation into a prototype energy harvesting system utilizing airflow around a bluff-body. The system consists of a flexible cantilever beam in a flag configuration with bonded piezoelectric transducers, integrated with a nonlinear triple-well potential established by auxiliary elastic elements. Three distinct bluff-body geometries—triangular, square, and semi-circular—with characteristic heights of 20 mm and 30 mm were analyzed. Aerodynamic excitation parameters were identified using CFD simulations, comparing exact and simplified mathematical representations of the lift force. The system’s dynamical response was evaluated through bifurcation diagrams, Diagrams of Coexisting Solutions (DS), and 3D Poincaré sections for zero and variable initial conditions. The results indicate that the triangular cross-section provides the widest frequency band for high-amplitude inter-well oscillations, maximizing energy harvesting effectiveness. A key innovation of this study is the demonstration that the simplified excitation model provides sufficient accuracy for rapid engineering design while significantly reducing computational overhead. Furthermore, it highlights the practical applicability of a flag-type system integrated with flexible elements to stabilize the beam’s free end.
1. Introduction
Model-based research on energy harvesting systems is generally conducted along two main paths. The first involves evaluating the impact of nonlinearities on dynamic properties, while the second focuses on designing structural solutions that offer high energy harvesting effectiveness under minimal external excitation [1]. In a broader context, these research efforts converge on the search for optimal potential energy characteristics, which are most commonly modeled as non-linear functions [2,3,4]. Linear systems are no longer the primary focus of widespread research because efficient energy recovery in such cases requires the precise tuning of the excitation frequency to the system’s resonance. Consequently, linear harvesters operate effectively only within a narrow frequency band. In contrast, nonlinear systems do not require such rigorous tuning, as the external load excites harmonic components across a broad frequency spectrum. The shaping of these nonlinear characteristics, which act upon the electromechanical transduction element, is typically achieved through the strategic arrangement of permanent magnets [5,6,7] or the angular orientation of elastic elements [8].
A significant subfield of this technology involves flow energy harvesters, which find increasing applications in civil infrastructure, smart buildings, and transportation systems [9,10,11]. In these sectors, such devices are utilized to power autonomous structural health monitoring (SHM) sensors on bridges, high-rise buildings, or within ventilation ducts, where traditional power sources are difficult to maintain [12,13]. Regardless of the source—be it base vibrations or wind energy—the fundamental principle of energy conversion remains similar: the external energy is harvested by inducing mechanical vibrations in a flexible cantilever beam, which are subsequently converted into electricity via a piezoelectric transducer [14]. However, a key distinction lies in the nature of the excitation. Unlike vibration harvesters, which rely on the inertial base excitation of the entire structure, flow-based systems extract energy directly from fluid–structure interaction. This interaction, often manifested as vortex-induced vibrations or galloping, requires specialized coupling between the aerodynamic wake of a bluff-body and the mechanical resonator to achieve sustainable energy conversion in varied environmental conditions [15,16,17,18].
To achieve a broad operational frequency range, current research utilizes non-linear effects induced by magnetic interactions [19]. Although magnetic levitation or attraction effectively shapes the potential wells, it often introduces challenges related to magnetic field interference with electronic components and limited adjustability in complex environments [20,21]. This paper proposes an alternative approach, where the nonlinear potential of the flag-type harvester is tailored using a system of elastic elements with adjustable mounting orientations. By substituting permanent magnets with a mechanical spring configuration, it becomes possible to precisely define the potential barrier topology, including the induction of a controlled asymmetric triple-well potential [22]. This mechanical method not only facilitates easier fine-tuning of the system’s nonlinear characteristics but also serves a structural role, as the springs act as amplitude limiters that protect the cantilever beam from excessive fatigue and damage [23]. Such a configuration offers a robust and versatile framework for optimizing energy harvesting effectiveness while ensuring the long-term reliability of the device.
In the design of flow-driven energy harvesters, two primary configurations of the bluff-body and cantilever beam arrangement are mainly investigated. The first, often termed the tail-type harvester [24,25], features the bluff-body mounted at the free end of the beam. In contrast, the second configuration—the flag-type harvester—involves a rigid bluff-body fixed upstream, with the flexible beam attached to it and allowed to oscillate freely in the generated turbulent wake [26]. The present study focuses on the latter, flag-type arrangement. However, a unique modification is introduced: the free end of the ‘flag’ is integrated with a system of elastic elements, creating a nonlinear potential. This arrangement allows the complex aerodynamic signature of the bluff-body to interact with the beam’s stiffness-modulated dynamics, significantly enhancing energy harvesting effectiveness through controlled inter-well oscillations.
The core mechanism of energy harvesting in flag-type systems relies on the formation of vortexes in the wake of a bluff-body [27,28]. As the air flows around the obstacle, periodic vortex shedding occurs, inducing fluctuating pressure fields that exert alternating aerodynamic forces on the flexible beam. These forces cause the beam to oscillate, effectively converting the kinetic energy of the fluid into mechanical strain. The effectiveness of this process is highly sensitive to the geometry and orientation of the bluff-body [29,30], as different shapes dictate the strength, frequency, and stability of the shed vortices across varying velocity regimes. Because each geometry triggers different fluid–structure interaction phenomena at specific flow ranges, identifying the most efficient configuration remains a critical challenge [31]. Therefore, continuous scientific research is essential to optimize these aerodynamic to mechanical couplings and to expand the operational bandwidth of energy harvesters in real-world environmental conditions [32,33,34].
The paper is organized as follows. Section 2 details the EH design and the formulation of the mathematical model, including the CFD-based identification of aerodynamic forces. Section 3 presents the results of numerical simulations, comparing the impact of various bluff-body geometries and excitation models on the harvester’s performance. This analysis evaluates both energy effectiveness and dynamic properties under zero and variable initial conditions to identify coexisting solutions. Finally, Section 4 summarizes the findings and outlines future research directions.
2. Formulation of the Mathematical Model
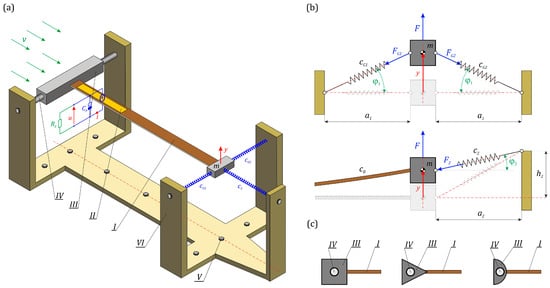
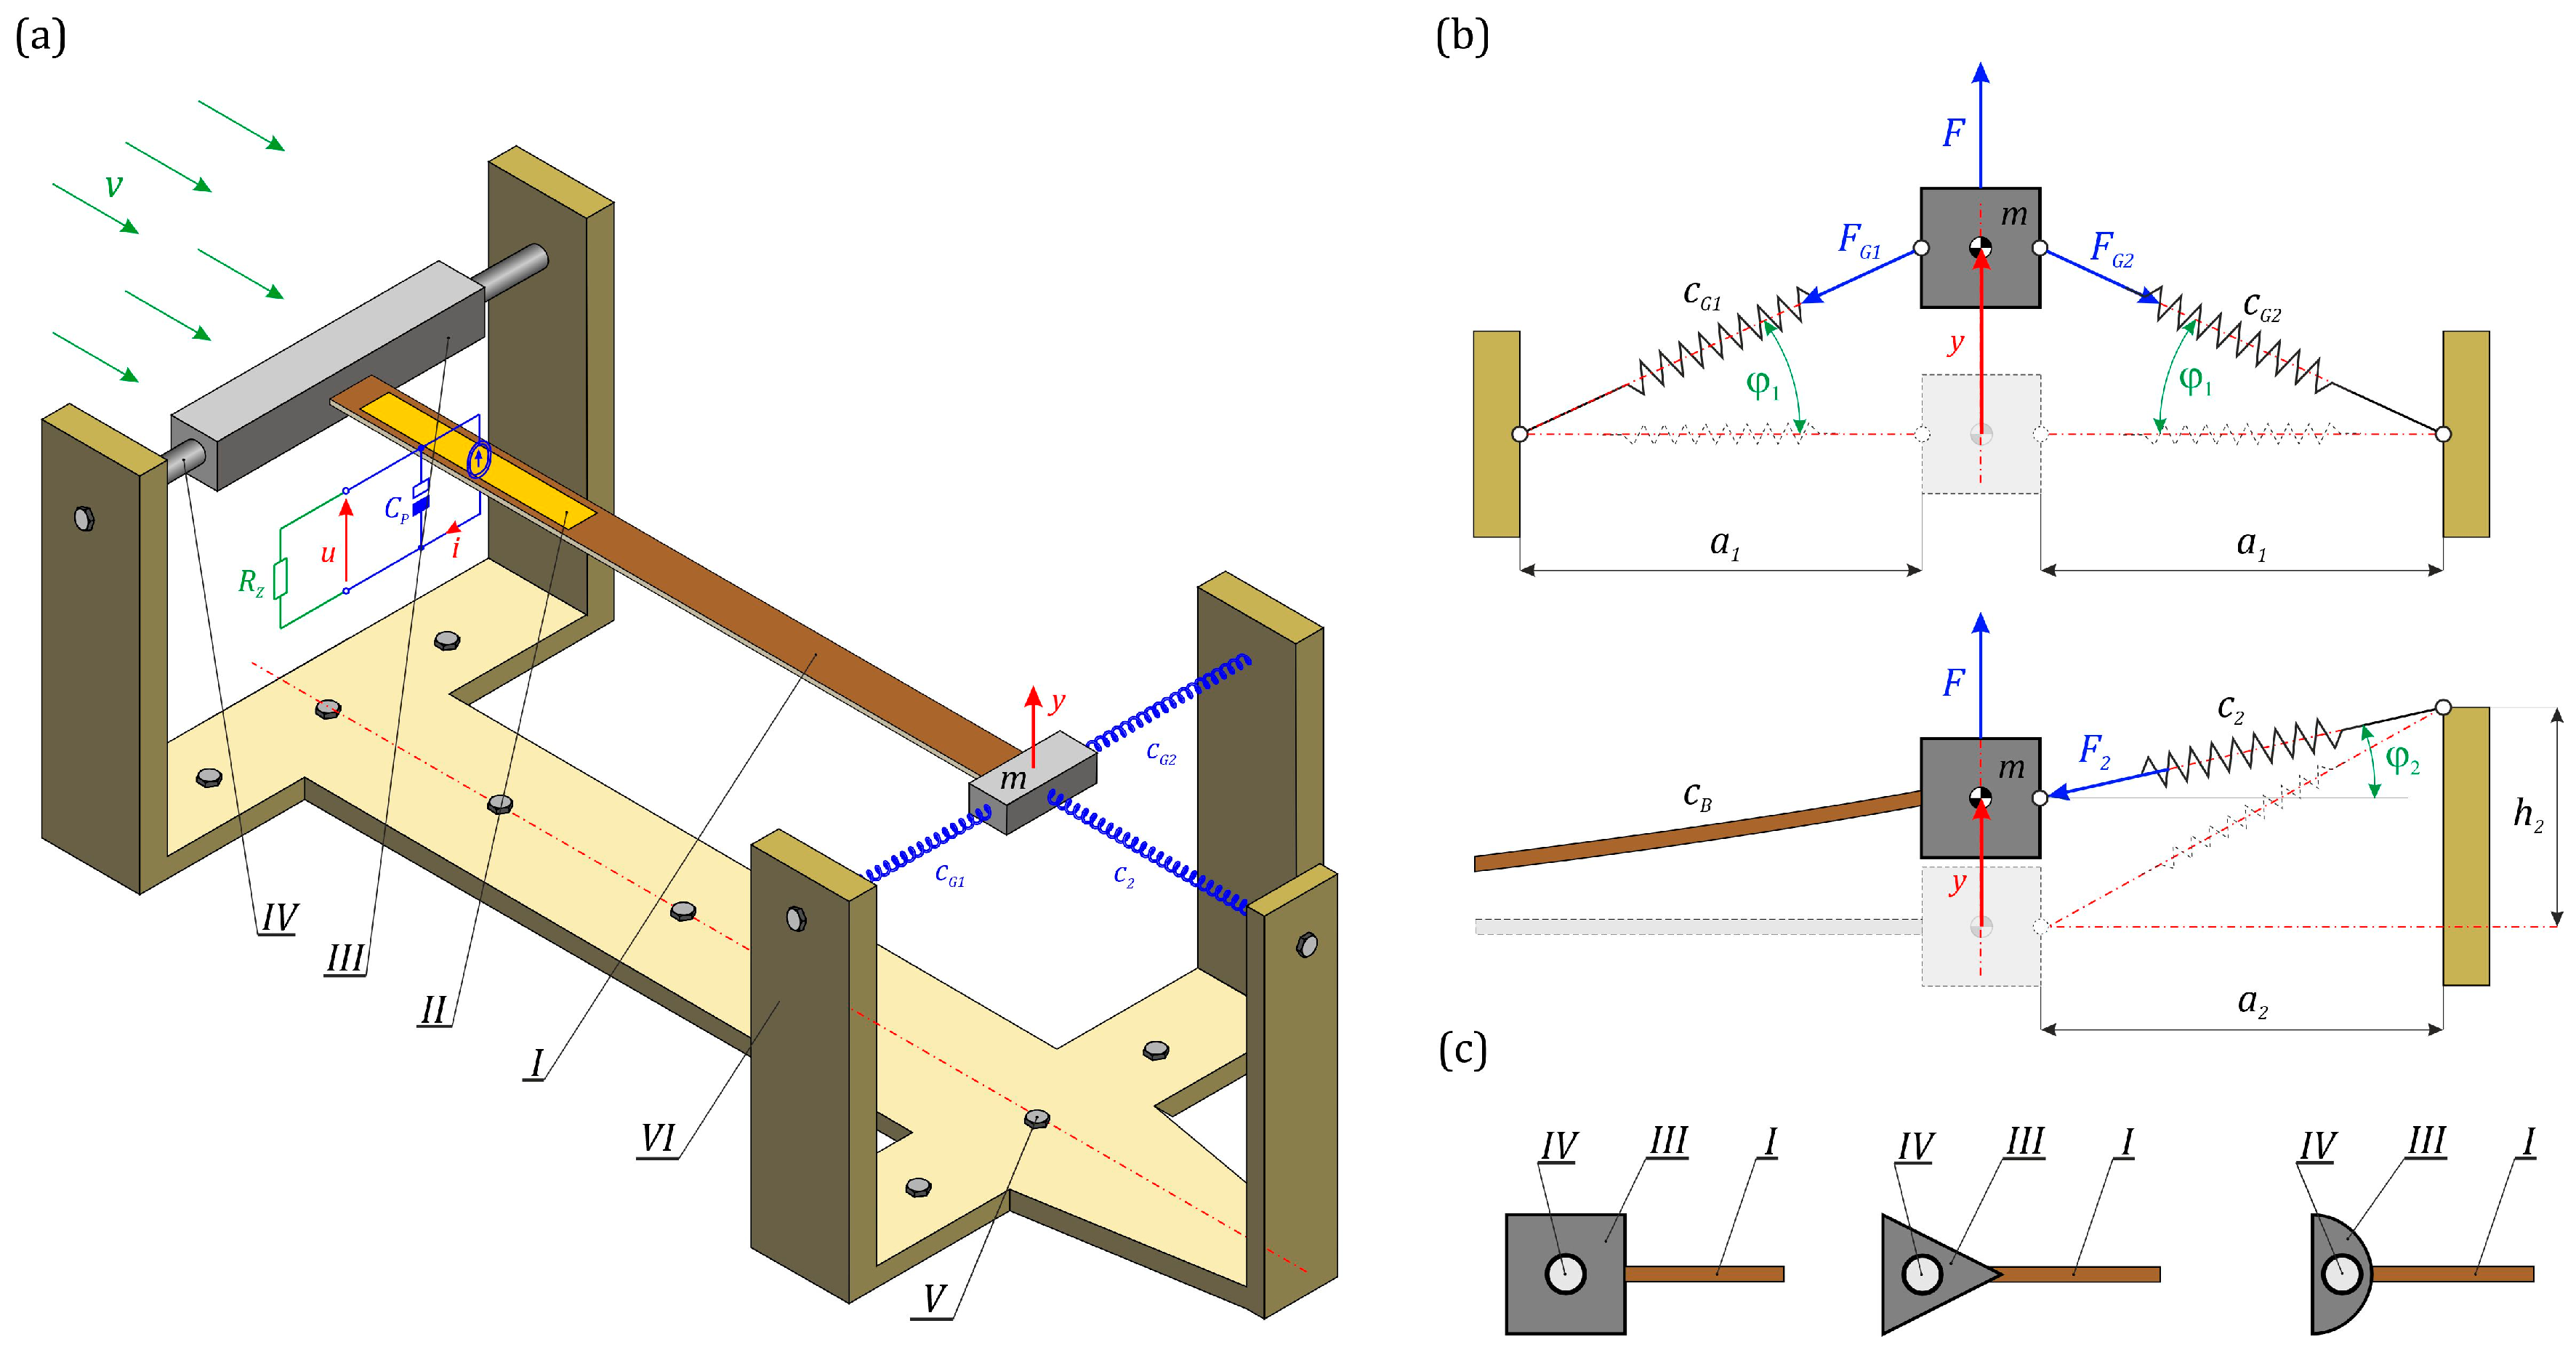
This paper investigates a prototype energy harvesting system designed to recover energy from airflow around a bluff-body (Figure 1a). The concept employs a flexible cantilever beam (I), rigidly attached to the obstacle (III) at one end. The design features interchangeable bluff-bodies, which are secured to a rigid frame (VI) via fastening bolts (IV). To fine-tune the system’s performance, the free end of the beam is equipped with an inertial mass m that interacts with linear elastic elements. The harvester’s potential energy profile can be adjusted by modifying the mounting positions of these elements on the frame. Mechanical-to-electrical energy conversion is achieved through a piezoelectric transducer (II) bonded to the beam’s surface. The elastic deformation of the beam induces an electric charge on the transducer electrodes, providing a power source for low-power electronic circuits.
Figure 1.
The system under investigation: (a) three-dimensional view of the structure, (b) diagrams for identifying the potential characteristics, (c) analyzed geometric structures of bluff-bodies.
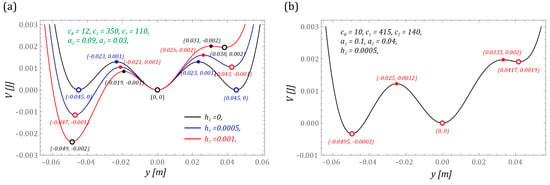
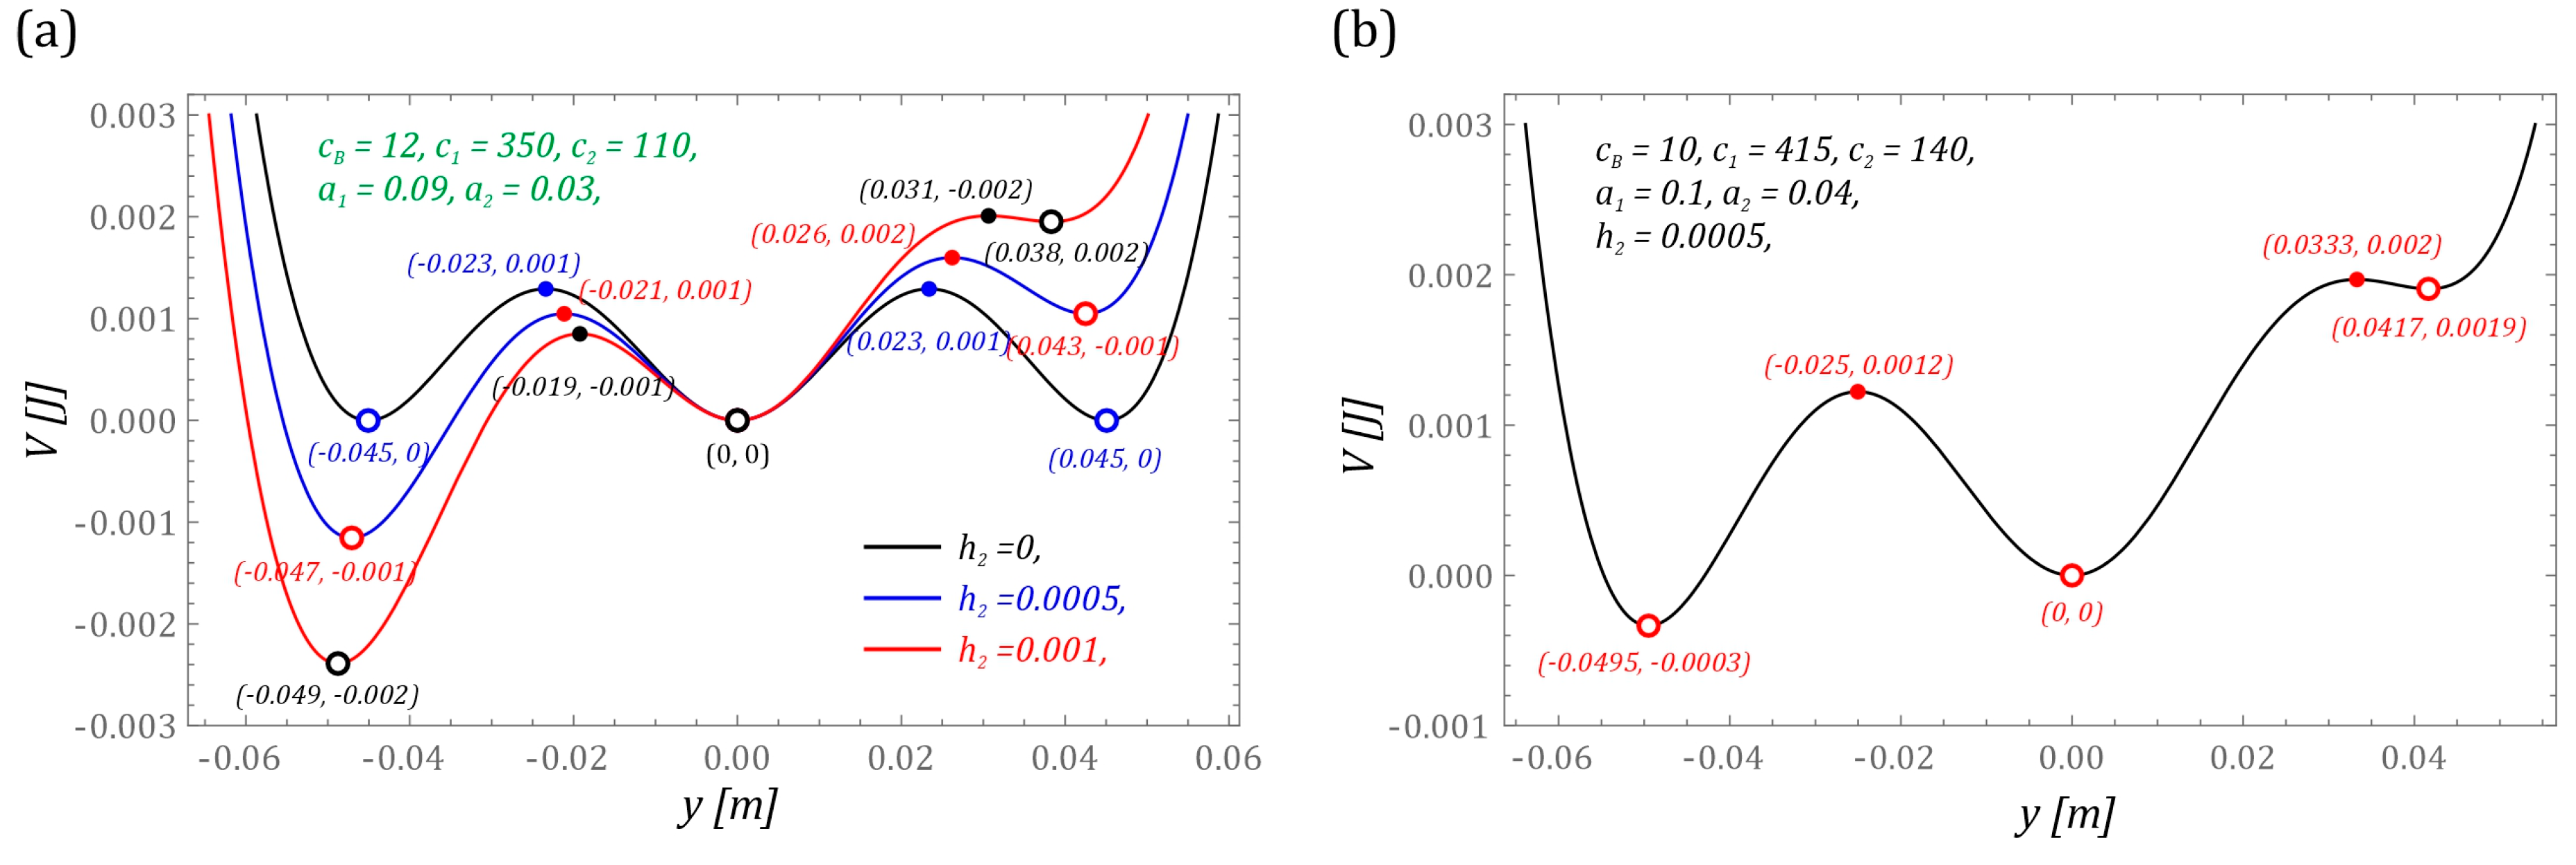
From a theoretical standpoint, the total potential of the energy harvesting system is a superposition of potentials exhibiting quasi-zero and tunnel stiffness characteristics [35,36]. Harvesting efficiency depends significantly on the nonlinearity of the potential, which is governed by the geometric and physical parameters of the elastic elements. In this study, these parameters were selected to induce an asymmetric triple-well potential. Although a symmetric triple-well potential is theoretically achievable, it would require extreme precision in the fabrication of the spring mounting nodes. From a technical perspective—considering that all manufacturing processes are subject to specific tolerances—even minor deviations result in asymmetric potential barriers. This is primarily due to the high sensitivity of the potential’s topology to geometric dimensions (Figure 2a). To evaluate the influence of aerodynamic excitation on the harvester’s performance, three distinct bluff-body geometries were analyzed: square, triangular, and semi-circular (D-shape) cross-sections (Figure 1c). Each geometry was investigated in two sizes, with characteristic heights of H = 20 mm and H = 30 mm, resulting in a total of six analyzed obstacle configurations. These shapes were selected to induce different vortex shedding patterns and pressure distributions, which directly affect the lift force acting on the beam and, consequently its oscillation amplitude. The bluff-bodies (III) are mounted symmetrically relative to the cantilever beam (I) using a mounting bolt (IV), ensuring consistent alignment across all simulation cases.
Figure 2.
Potential energy function of the energy harvesting system: (a) sensitivity of the potential profile to the mounting precision of the elastic element c2, (b) potential energy distribution adopted for numerical simulations. Individual parameters are shown in the graphs.
The total mechanical characteristic, defining the relationship between the external load and the displacement of the cantilever beam’s free end, is identified by neglecting inertial forces and factors responsible for energy dissipation. Based on these modeling assumptions, the static equilibrium equations are formulated as follows:
As the elastic elements providing the quasi-zero stiffness characteristic are arranged in a symmetrical geometric configuration, the general equation defining the mechanical characteristic simplifies to:
The displacement of the elastic cantilever beam from its equilibrium position induces changes in both the length and angular orientation of the elastic elements. By accounting for the geometric constraints and relationships within the system, the total mechanical characteristic is derived as follows:
The explicit expressions for the positions of the potential wells and saddles are obtained by integrating the total mechanical characteristic (3):
where:
The term represents the integration constant, the value of which is determined by assuming that . Based on the derived general potential equation, representative characteristics were calculated and are illustrated in Figure 2. As shown in Figure 2b, the system exhibits an asymmetric triple-well potential, which is crucial for the high-sensitivity response to aerodynamic excitation. The static equilibrium positions of the system are determined by the condition (V′(y) = 0). The stability of these equilibrium points is subsequently verified using the second derivative of the potential energy, where (V″(y) > 0) indicates a stable equilibrium point (potential well). In the analyzed case, a proper selection of geometric and physical parameters ensures the coexistence of three stable equilibrium positions, which characterizes the asymmetric, tri-stable nature of the harvester.
2.1. Identification of the Excitation Model
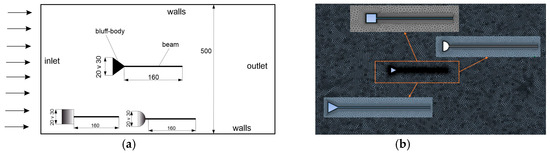
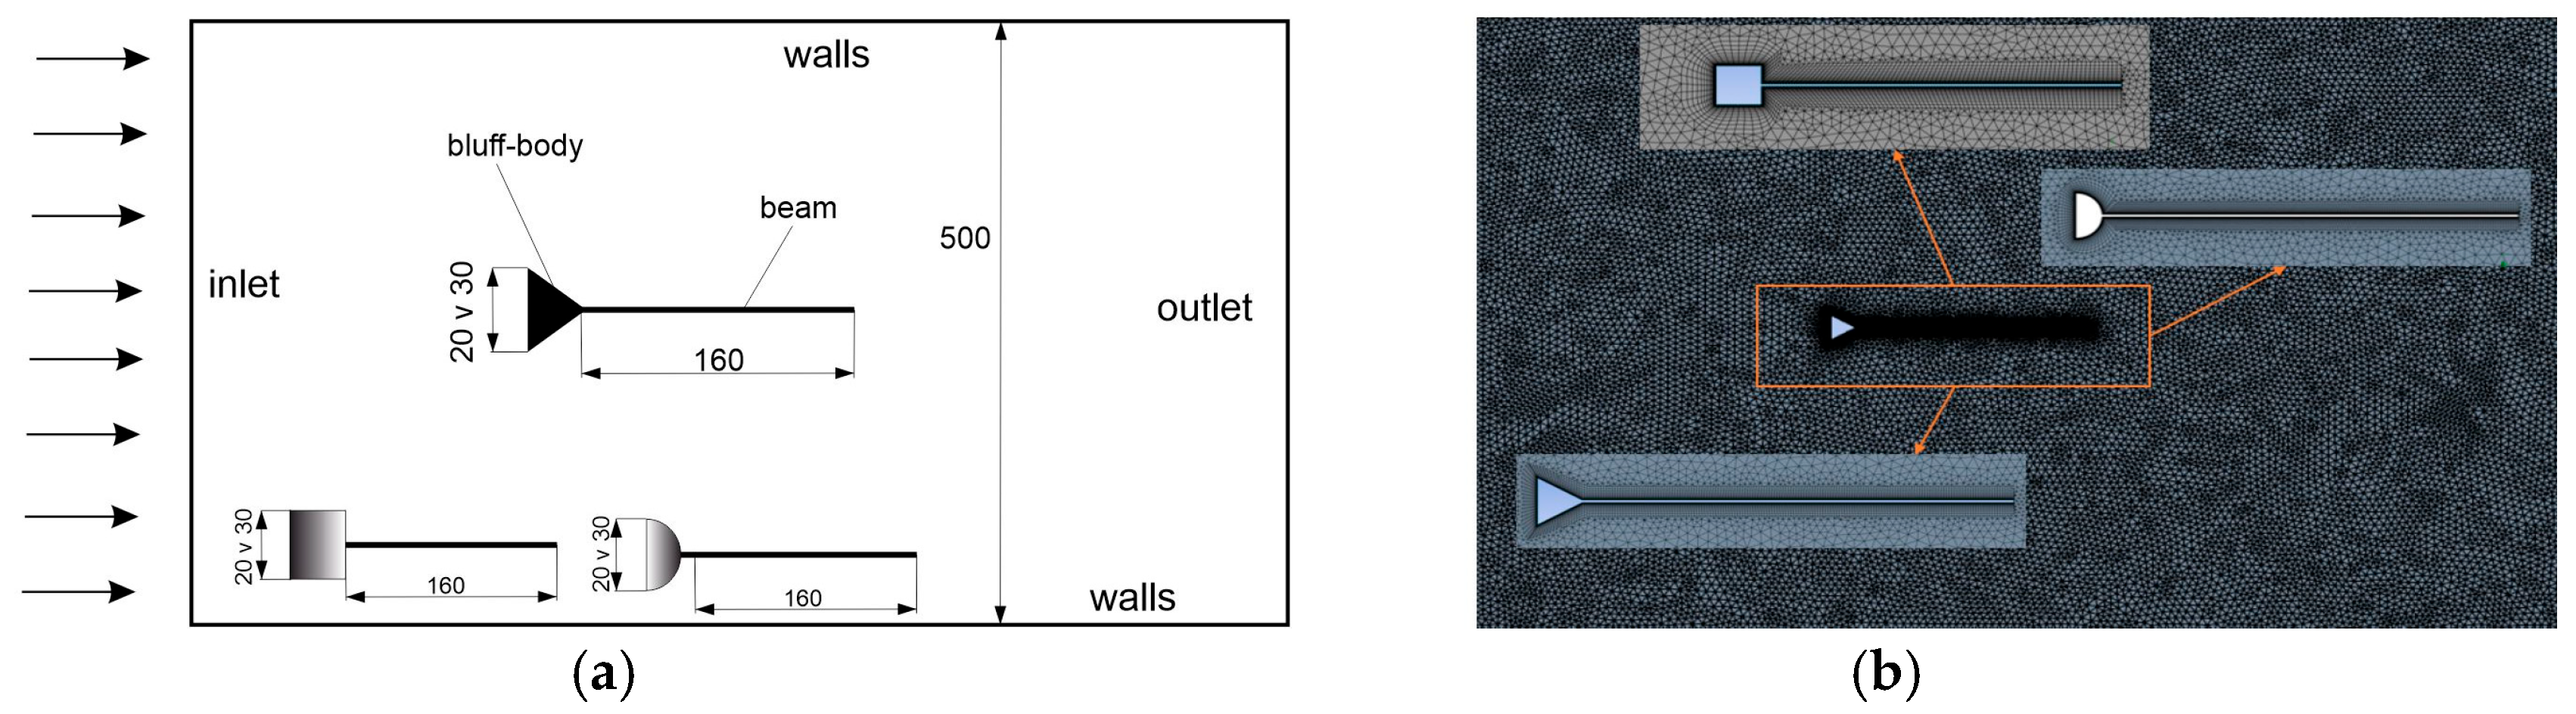
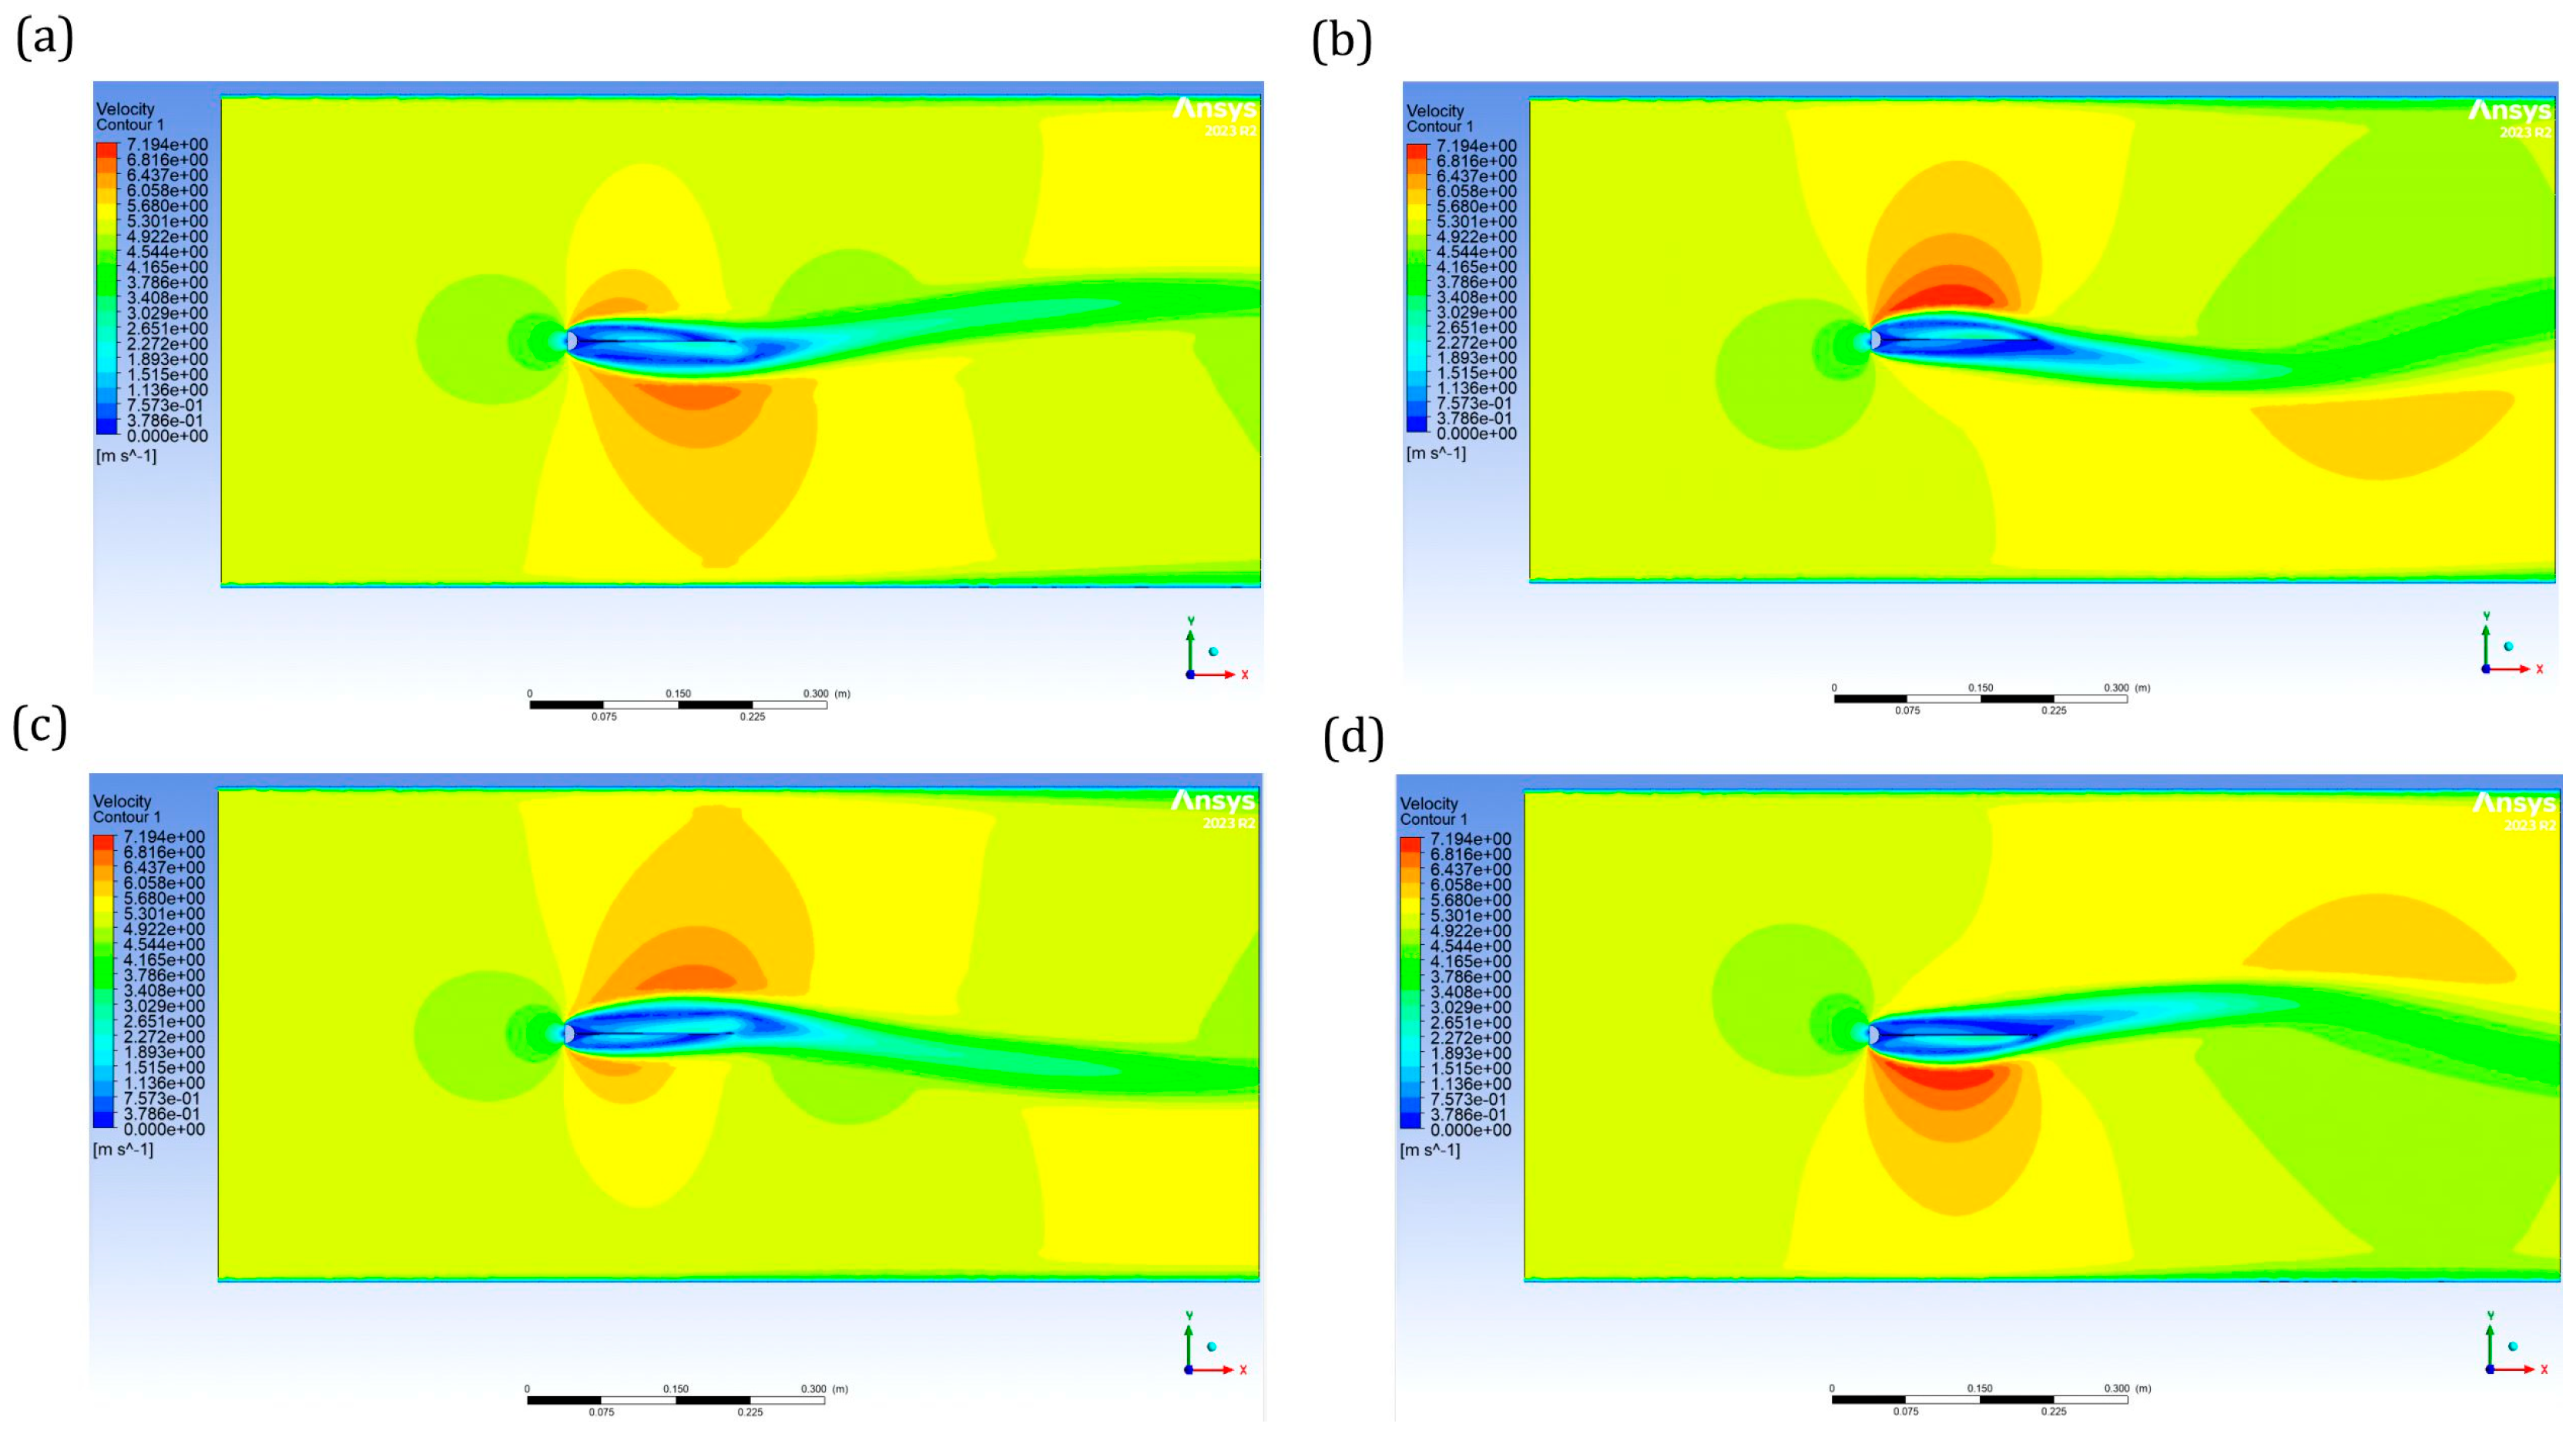
Effective energy harvesting in cantilever-based systems occurs when aerodynamic forces displace the structure from its equilibrium position. While the classical approach to identifying the lift force involves solving the Navier–Stokes equations [37], this study employs a Finite Element Method (FEM)-based approach. To ensure computational efficiency without compromising reliability, a simplified model featuring a rigid beam was used to identify the lift force. The flow domain in the vicinity of the bluff body was discretized using a first-order 2D finite element mesh (Figure 3). This procedure follows the methodology established in our previous works [15,38]. Numerical simulations were performed in ANSYS 2023 R1 using a pressure-based solver with the SIMPLE algorithm for pressure-velocity coupling (Figure 4). Turbulent airflow was modeled (the value of the Reynolds number for the analyzed case—rounded pipe and flow velocity was over 10,000) using the k-ω Wilcox scheme, which accounts for low-Reynolds-number effects and shear flow spreading. Gradient calculations were executed using the Least Squares Cell-Based method, while a Second-Order Upwind scheme was applied for the discretization of flow and turbulence parameters. The transient CFD simulations were performed with a fixed time step size of 0.01 s and a limit of 50 iterations per step. The total duration varied based on the air flow velocity: 300 steps (3 s) were executed for (v > 3) m/s, whereas 700 steps (7 s) were required for velocities (v < 3) m/s. The time step of one hundredth of a second was strictly selected to capture the precise dynamic characteristics of the flow, while the total simulation time ensured that a fully developed steady state was achieved. Furthermore, a rigorous mesh independence study was conducted. The grid resolution was optimized to minimize computational cost while maintaining strict accuracy. The mesh was verified as independent, as any further refinement in element size or increase in element count yielded no noticeable change in the numerical results.
Figure 3.
The form of the Finite-Volume model for numerical calculations: (a) geometric dimensions of the bluff-body beam and the pipe, boundary conditions, (b) finite element mesh.
Figure 4.
Characteristic values of velocity acting on the beam for selected moments of time: (a,c) velocity for “0” lift force values, (b) velocity for maximal lift force, (d) velocity for max negative lift force.
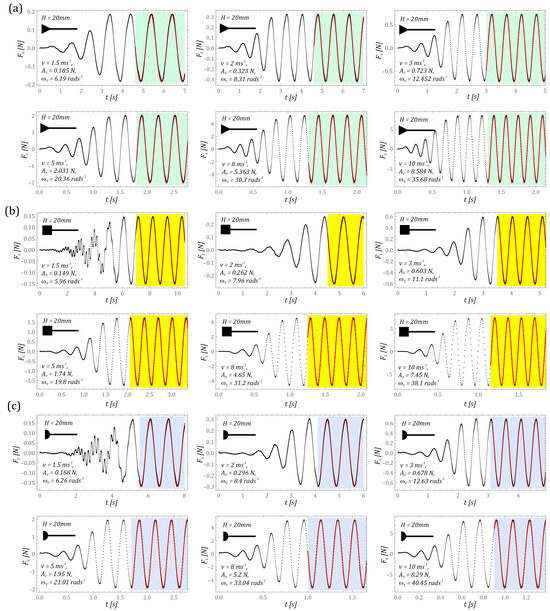
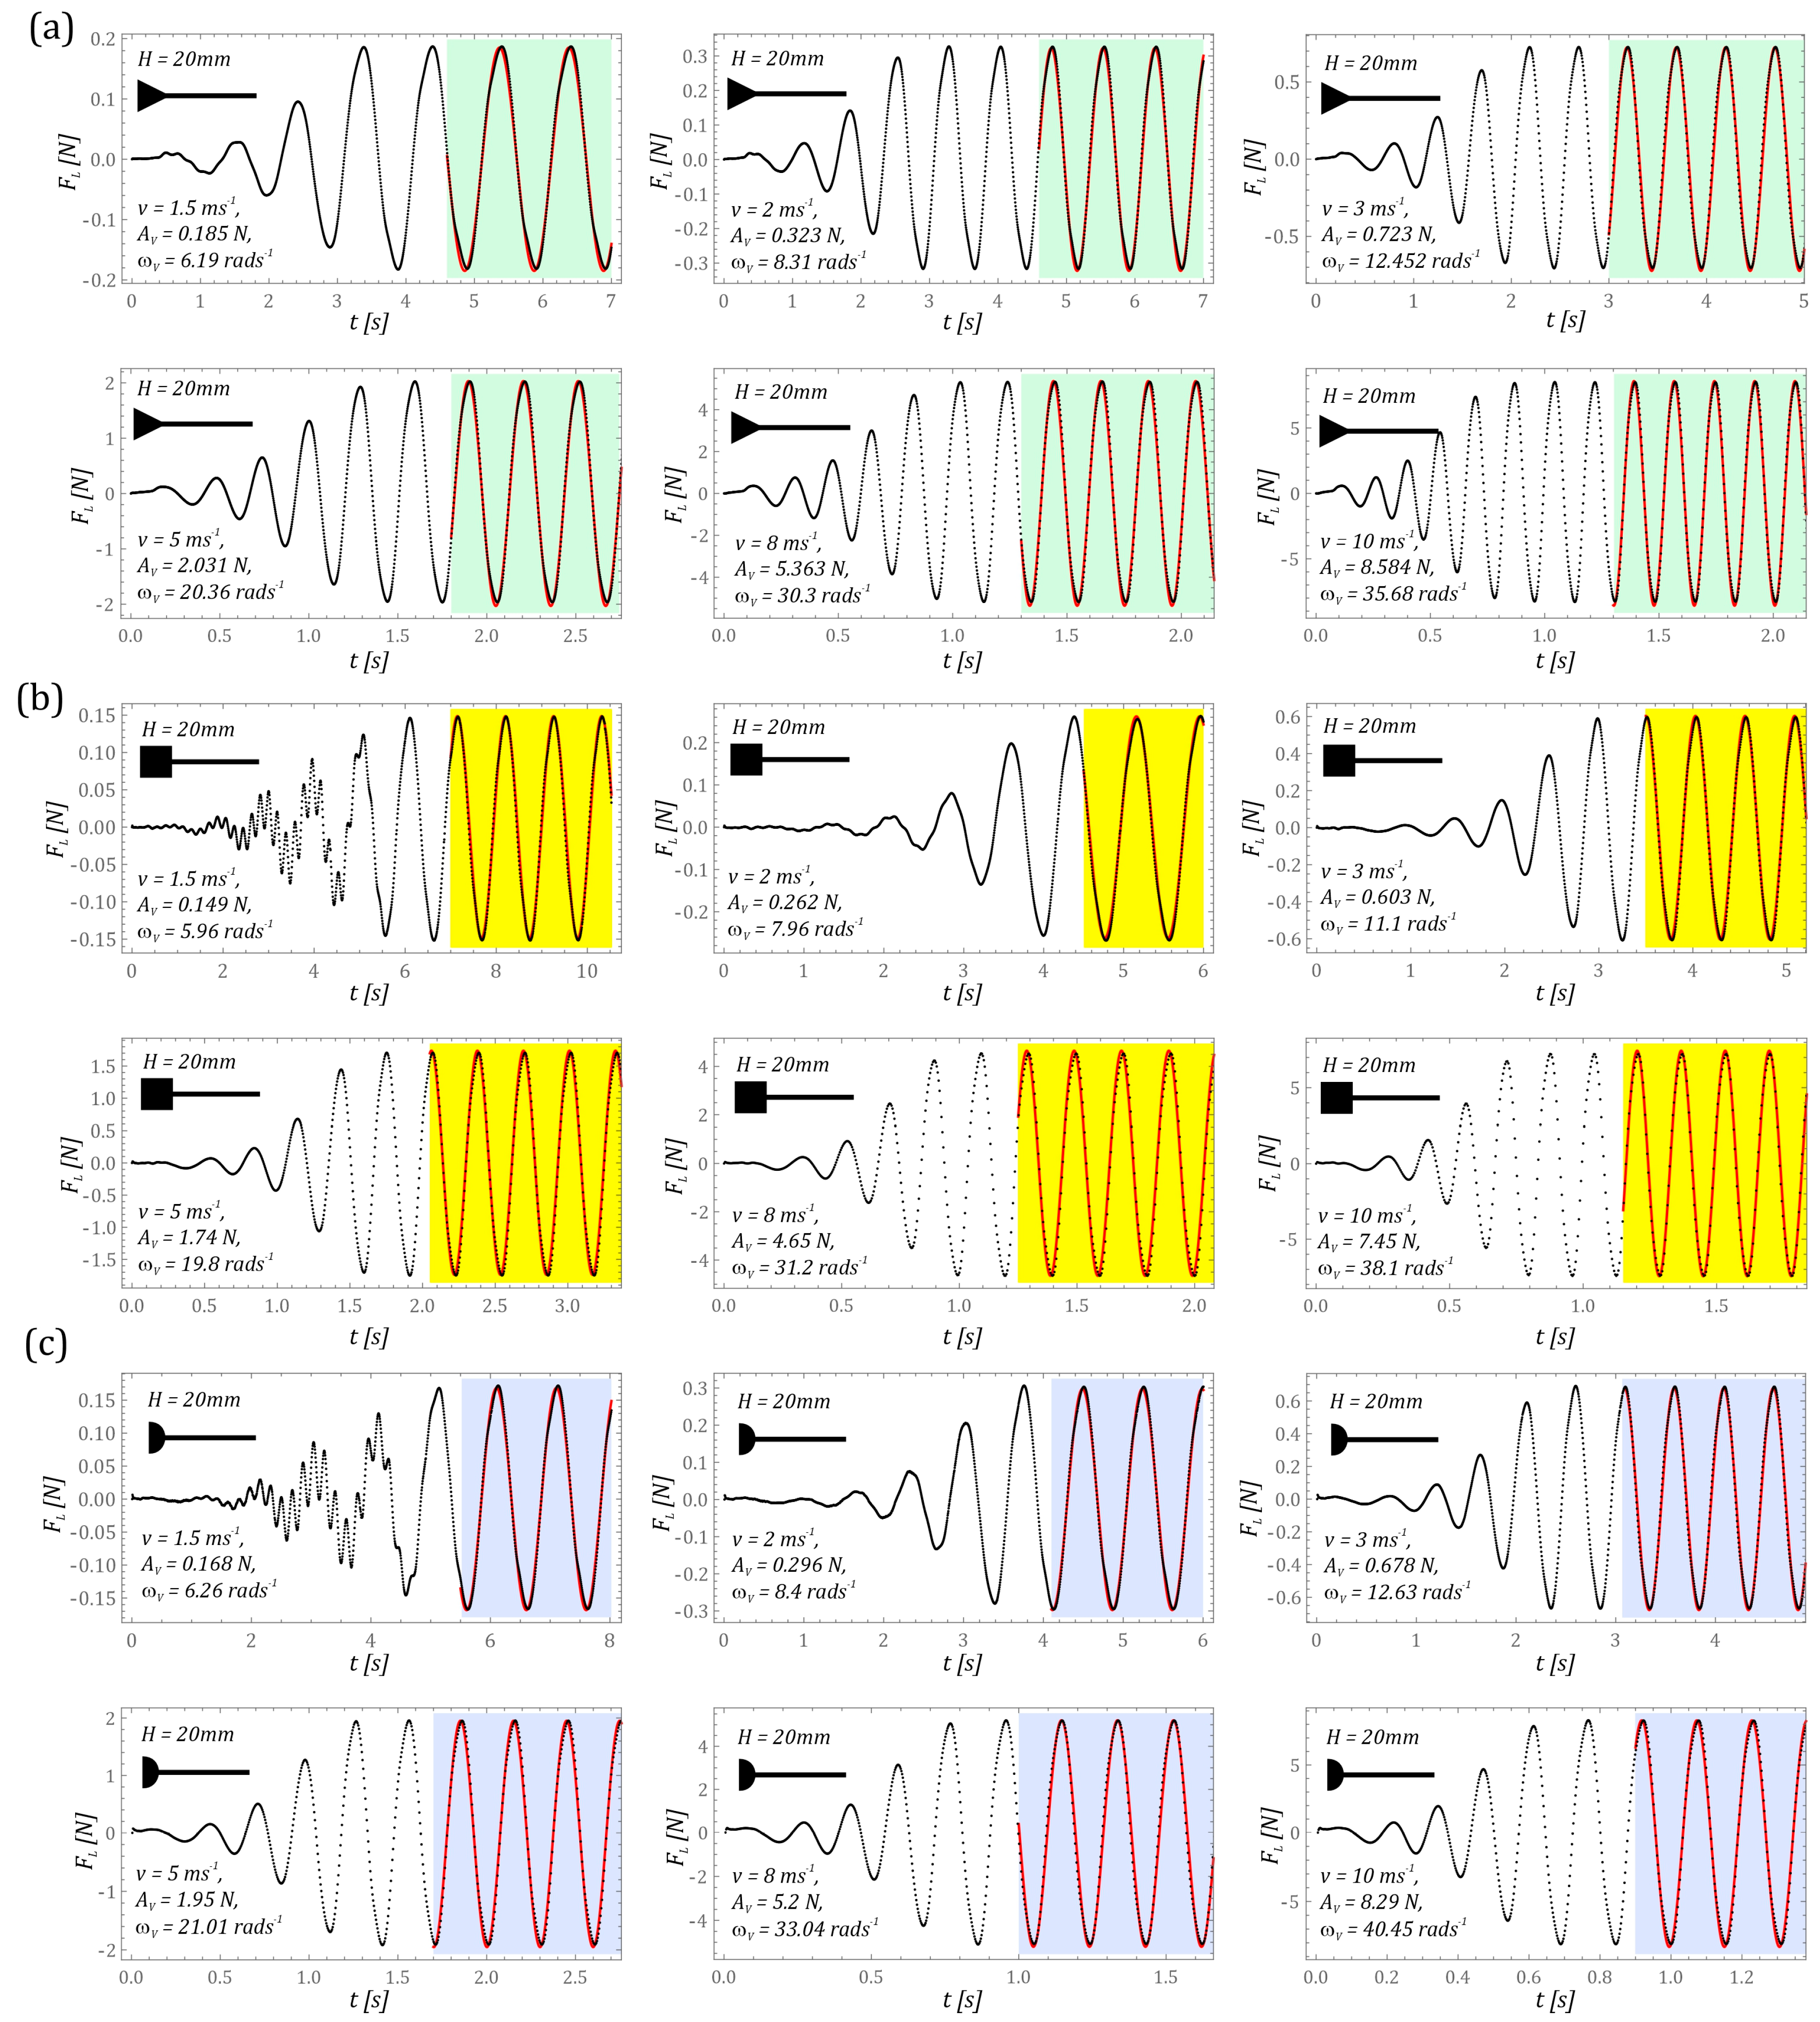
Mechanical vibrations of the beam are induced by a cyclically varying lift force, generated by the airflow around the bluff-body (see Figure 1). The amplitude and frequency of this force were identified under steady-state flow conditions for two obstacle heights: H = 20 mm and H = 30 mm. To maintain conciseness, exemplary simulation results and the estimated physical quantities are presented only for the H = 20 mm case. This selection is justified by the analogous nature of the identification procedure for both heights and the consistently high correlation between the approximating functions and the input data. Colors in the plots distinguish the steady-state load phases acting on the cantilever beam. Furthermore, the numerical values characterizing the lift force were derived from time series spanning at least four full periods. In select cases where the lift force reached a steady state more rapidly, shorter time series were used for identification (Figure 5).
Figure 5.
Time-histories of the lift force FL(t) and identification of excitation parameters for bluff bodies with a height of H = 20 mm: (a) triangular, (b) square, and (c) semi-circular cross-sections. Colored areas indicate the steady-state regions used for the identification of the lift force amplitude Av and angular frequency ωv, with specific values provided for each individual case.
The highest loads acting on the cantilever beam occur for obstacles with a height of H = 30 mm. As part of the parametric study, load characteristics for a smaller height, H = 15 mm, were also investigated. For this dimension, lift force values sufficient to induce vibrations with acceptable harvesting efficiency were recorded only in the high flow velocity range (v ≥ 8 ms−1). Notably, for such small obstacles, the identified lift force time series often assumed a constant value. Since an oscillatory load is essential to sustain the beam’s vibrations, these non-oscillatory cases were excluded from further analysis. This stable, non-varying load behavior was observed for both square and semi-circular cross-sections. Although the equilateral triangular cross-section maintained non-zero amplitudes at this height, it was also rejected due to its lower energy harvesting efficiency compared to the H = 20 mm and 30 mm configurations.
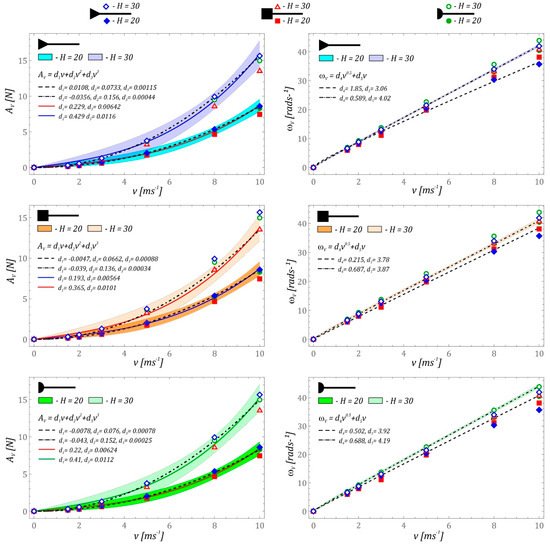
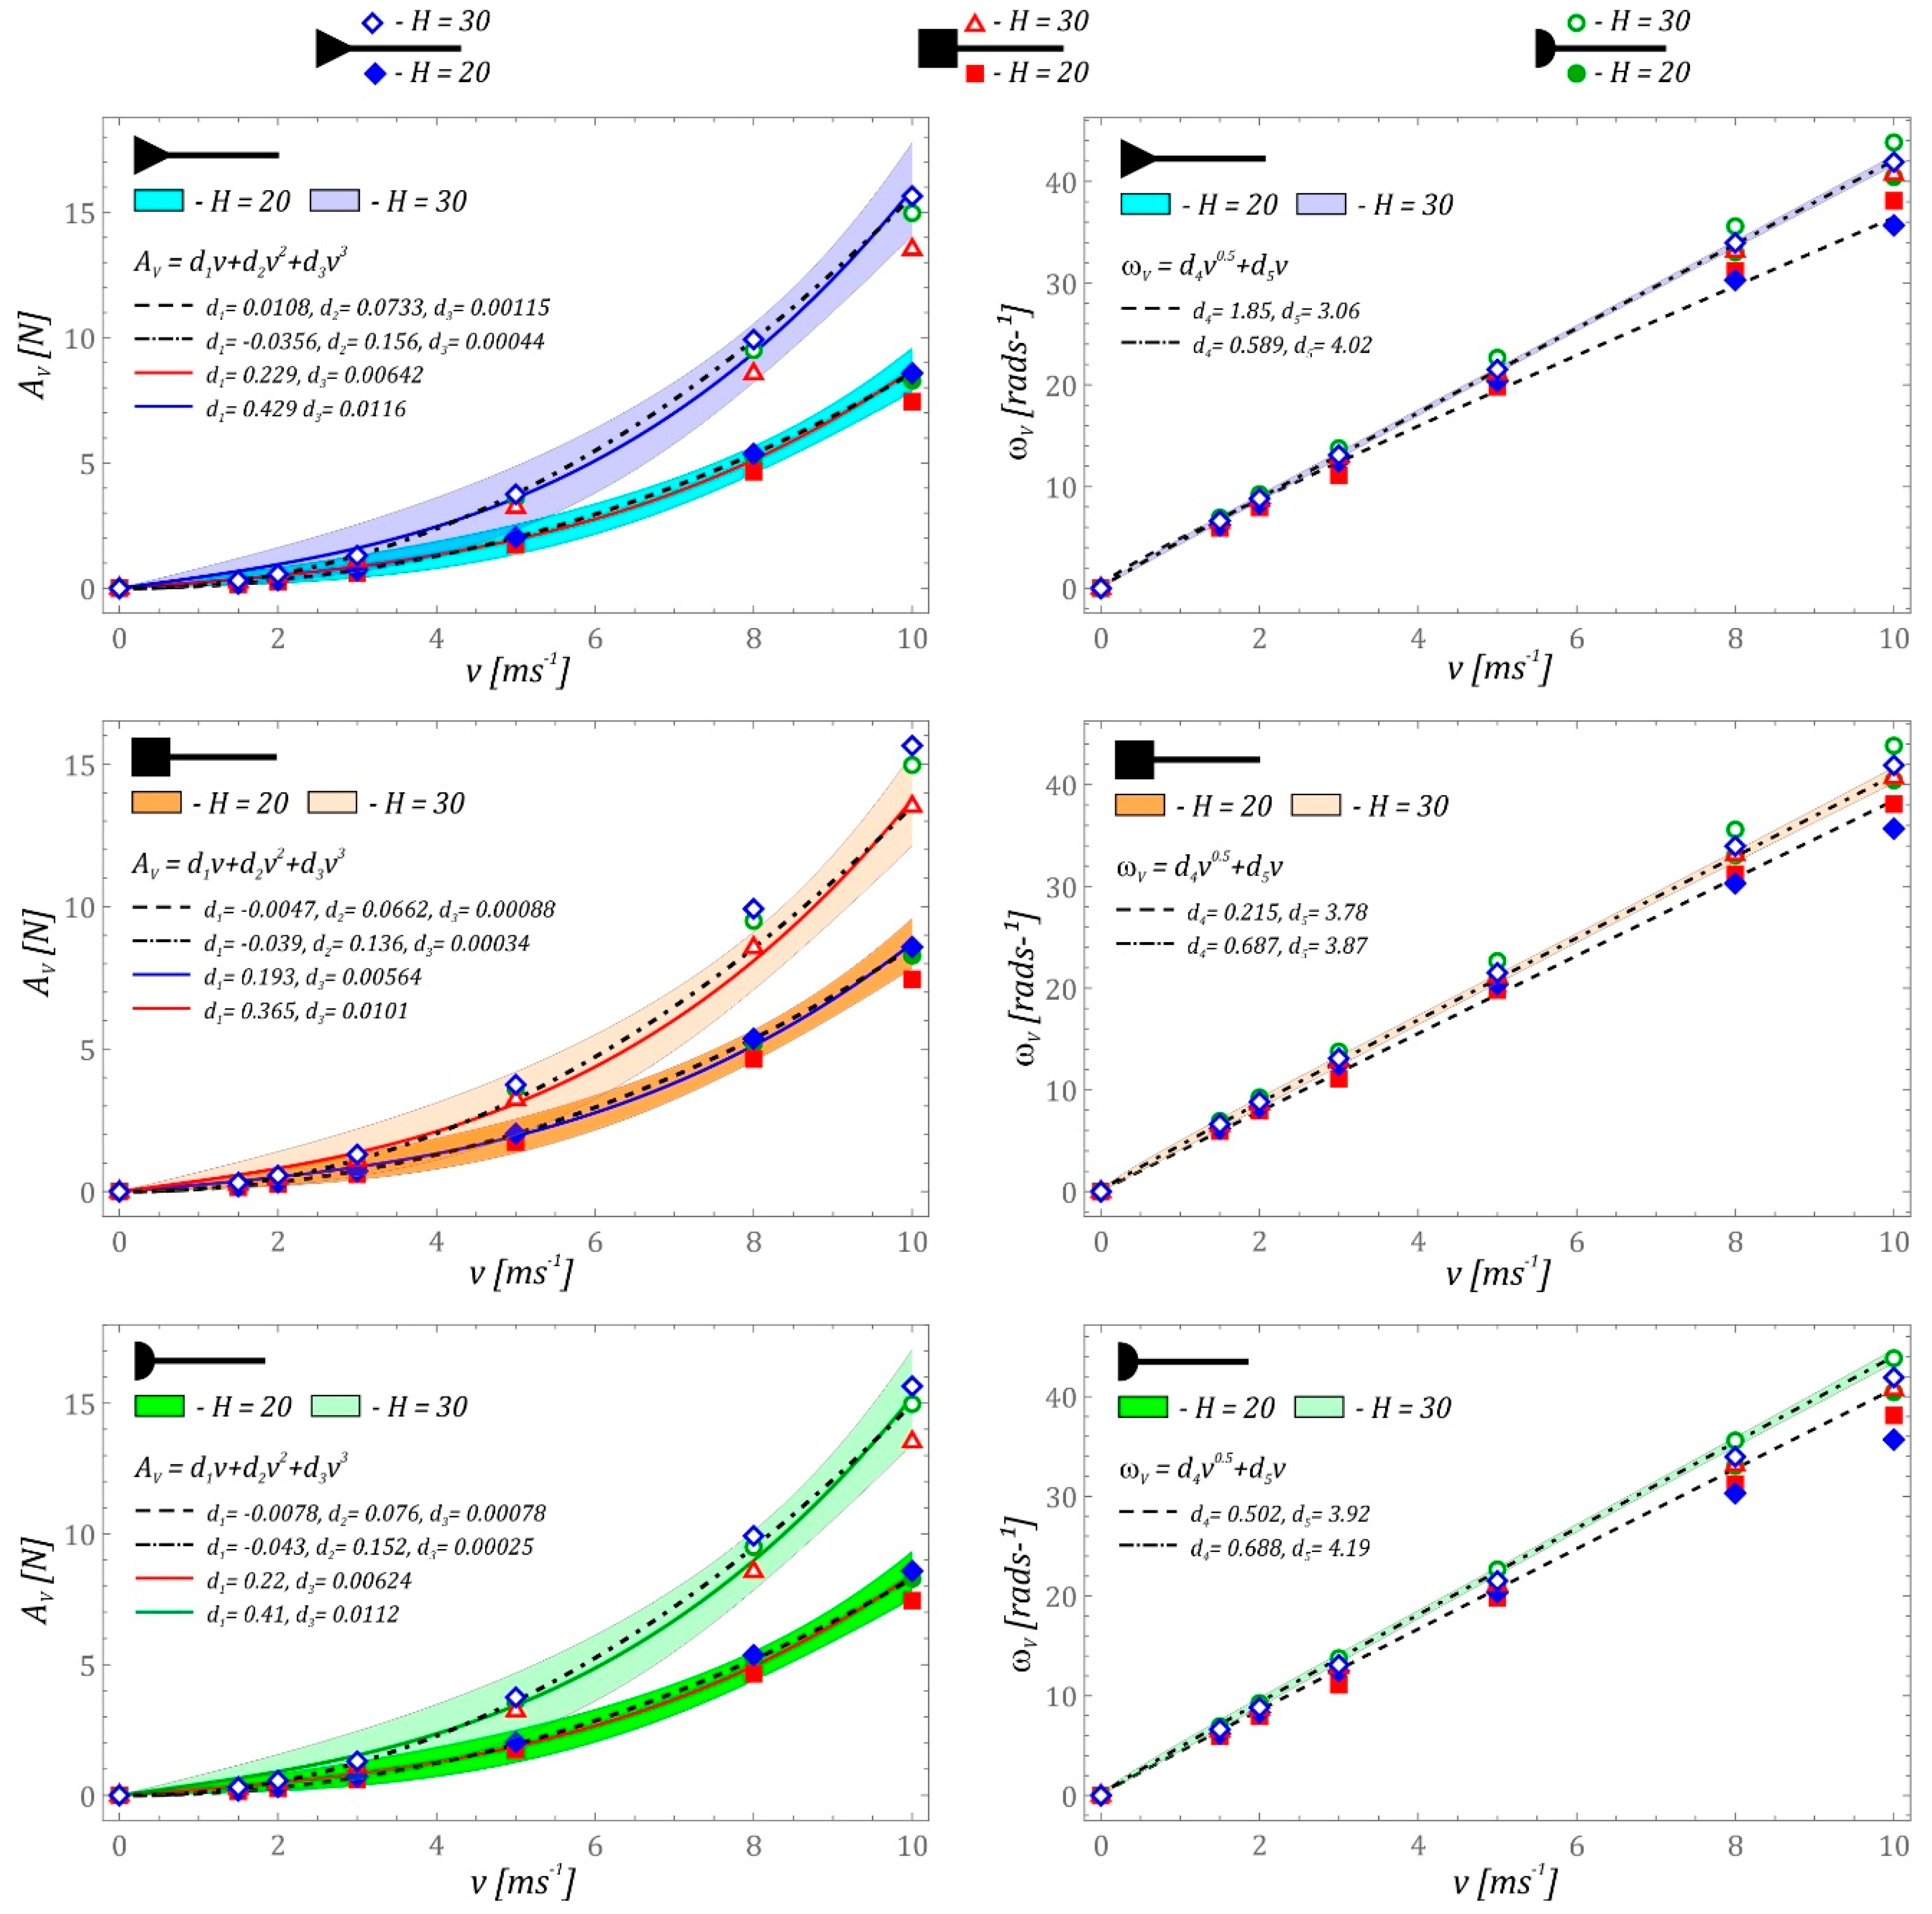
Numerical simulations indicate the existence of a critical obstacle height required to induce oscillatory loads on the flexible cantilever beam. Based on these findings, it can be hypothesized that there is also a maximum height beyond which the excitation no longer effectively drives the beam’s response. From a theoretical perspective, such a scenario may occur at high airflow velocities. This hypothesis is consistent with experimental results reported in the [39], where energy harvesting efficiency drops abruptly to zero once a critical flow velocity is exceeded. The data obtained from the Finite Element Method (FEM) simulations were subsequently used to identify the relationships between the lift force amplitude, frequency, and airflow velocity (Figure 6).
Figure 6.
Identification of the relationships between lift force amplitude (Av), frequency (ωv), and airflow velocity (v) for the analyzed bluff-body geometries. The plots include data points from numerical simulations and the corresponding approximating functions, with shaded regions representing the confidence intervals for each characteristic.
The identification results presented in Figure 6 reveal distinct correlations between the airflow velocity and the excitation parameters across the three studied bluff-body geometries. For all cases, the lift force amplitude Av exhibits a clear non-linear increase with velocity, which is accurately captured by third-order polynomial approximations. As expected, obstacles with a height of 30 mm consistently generate significantly higher lift forces compared to the 20 mm variants, regardless of the cross-sectional shape. Among the analyzed geometries, the triangular and semi-circular profiles demonstrate the highest excitation potential at high velocities v = 10 m/s. In contrast, the square prism exhibits slightly lower peak amplitudes. Regarding frequency ωv, the relationship with airflow velocity remains nearly linear, which is consistent with the classical vortex shedding theory and a stable Strouhal number. Interestingly, the frequency values for both analyzed heights are relatively close to each other for each specific shape, suggesting that in this Reynolds number range, the frequency is predominantly governed by the velocity and the cross-sectional geometry. The narrow confidence intervals (shaded regions) further confirm the high reliability of the numerical model and the stability of the identified aerodynamic characteristics.
In model-based research, it is fundamental to seek a mathematical representation using the simplest possible system of equations. While this objective is standard for linear systems and typically does not qualitatively alter the response, nonlinear dynamical systems are extremely sensitive—even minor modifications can lead to vastly different outcomes. Standard excitation models (e.g., lift/drag coefficients or Van der Pol oscillators) widely used in the literature frequently fail to initiate self-excited oscillations under zero initial conditions. By directly mapping the exact pressure distribution to the resultant force via transient CFD, we provide a far more robust numerical framework for future physical implementation. Consequently, numerical simulations are necessary to assess how adopted simplifications influence the system’s behavior. To this end, the relationships between amplitudes and airflow velocity were mapped using both exact and simplified approximating functions. While the exact functions represent the data with high fidelity, the simplified versions do not deviate significantly from their precise counterparts. The primary distinction between these two approaches lies in the confidence intervals, estimated at a level of p = 0.99. For the lift force amplitude, these intervals are relatively wide, whereas the frequency-velocity model exhibits much narrower confidence limits. Notably, the confidence regions expand as the obstacle height increases. In all cases, the numerical data are accurately captured by third-order polynomials, providing a formal basis for the analyses presented in the subsequent sections.
2.2. Dimensionless Mathematical Model Formulation
Mathematical models of energy harvesting systems based on flexible cantilever beams typically share a similar differential structure. The primary distinguishing features are the terms representing the nonlinear mechanical characteristics, which define the potential barriers. It is important to note that in systems excited by airflow, dynamic excitation is characterized by an amplitude and frequency that are intrinsically dependent on the flow velocity. From a theoretical perspective, the governing equations for such linear and nonlinear dynamical systems can be derived using both classical and non-classical methods [40]. In this study, the mathematical model was implemented and simulated using the latest version of Wolfram Mathematica. In the following analysis, two approaches to approximating the aerodynamic excitation are compared: an exact model, which preserves the full complexity of the identified lift force characteristics, and a simplified model, designed to reduce computational overhead while maintaining qualitative accuracy. The subsequent results illustrate how these two modeling strategies affect the predicted bifurcation behavior and energy harvesting efficiency. The formal basis for the numerical analysis is the system of differential equations given by Equation (5):
Since the primary objective of the numerical experiments is to perform a quantitative and qualitative analysis of the induced phenomena, the system of Equation (5) was transformed into a dimensionless form. The use of dimensionless models in computer simulations facilitates the evaluation of the system’s dynamic and energy harvesting properties across both macro and micro scales. For the sake of conciseness, the intermediate transformations leading to the dimensionless model are omitted here, and only the final representation is presented:
where:
The dimensionless mathematical model of the prototype energy harvesting system serves as the formal framework for the quantitative and qualitative numerical simulations. The results presented in the following sections illustrate the system’s dynamic and energy characteristics. The numerical values of the geometric and physical parameters used in the mathematical model are summarized in Table 1.
Table 1.
Geometric and physical parameters of the investigated energy harvesting systems.
3. Results of Model Studies
3.1. Analysis of Energy Properties
The fundamental numerical tools used to evaluate energy properties are diagrams illustrating the energy harvesting effectiveness across a wide range of control parameter variability. In principle, control parameters can be chosen arbitrarily, and their selection is most often determined by the source of the external load. In the case of structures excited by mechanical vibrations, the control parameter assumes the values of the excitation frequency, while it is much less frequently represented by the vibration amplitude. If the transformation of mechanical energy into electrical energy is induced by airflow, the velocity at which the air stream flows around the obstacle is then adopted as the control parameter. Another important physical quantity regarding which a specific decision must be made concerns the adoption of an indicator characterizing the energy harvesting effectiveness. Its selection is important because it facilitates interpretation and the verification of results. From a theoretical perspective, the energy harvesting effectiveness can be described by the displacement of the flexible cantilever beam. Such an approach is justified because model studies have demonstrated a cause-and-effect relationship between the beam’s displacement and the voltage induced on the piezoelectric electrodes [39]. Nevertheless, such a description is not very intuitive and entails the necessity of recalculating the results of model or experimental studies every time. Even with an explicit calibration formula, this approach is inefficient because any structural change requires its re-determination. From a practical point of view, the natural choice for an indicator characterizing energy harvesting effectiveness is to define it through an electrical quantity: voltage, current, or power recorded on the piezoelectric electrodes. Regardless of which of these is considered the most appropriate, the plotted diagram structures exhibit geometric similarity. Keeping in mind the far-reaching simplification of both the computer simulation process and the verification of results, the most convenient description of the energy harvesting effectiveness is achieved by representing it through the voltage recorded on the piezoelectric electrodes. This approach is justified because voltage is a quantity obtained directly from the computer simulation. It also follows directly from the mathematical model, as it is one of the generalized coordinates characterizing the dynamic properties of the investigated system.
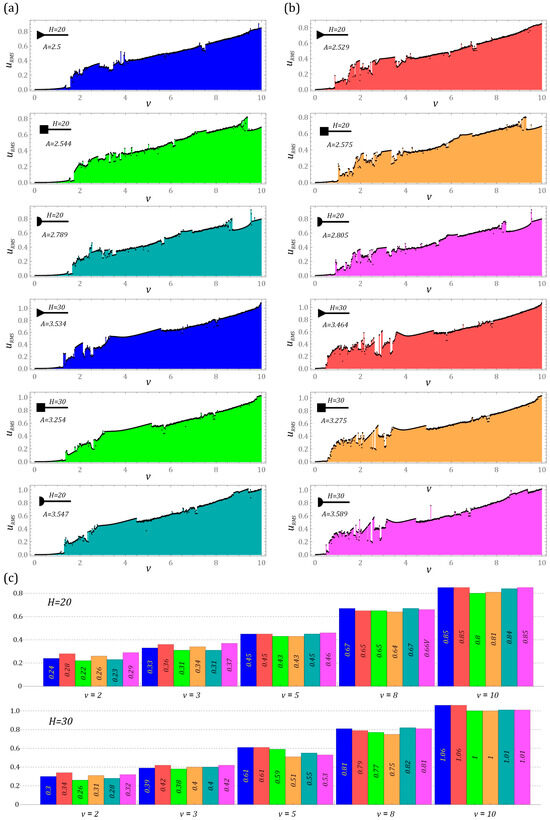
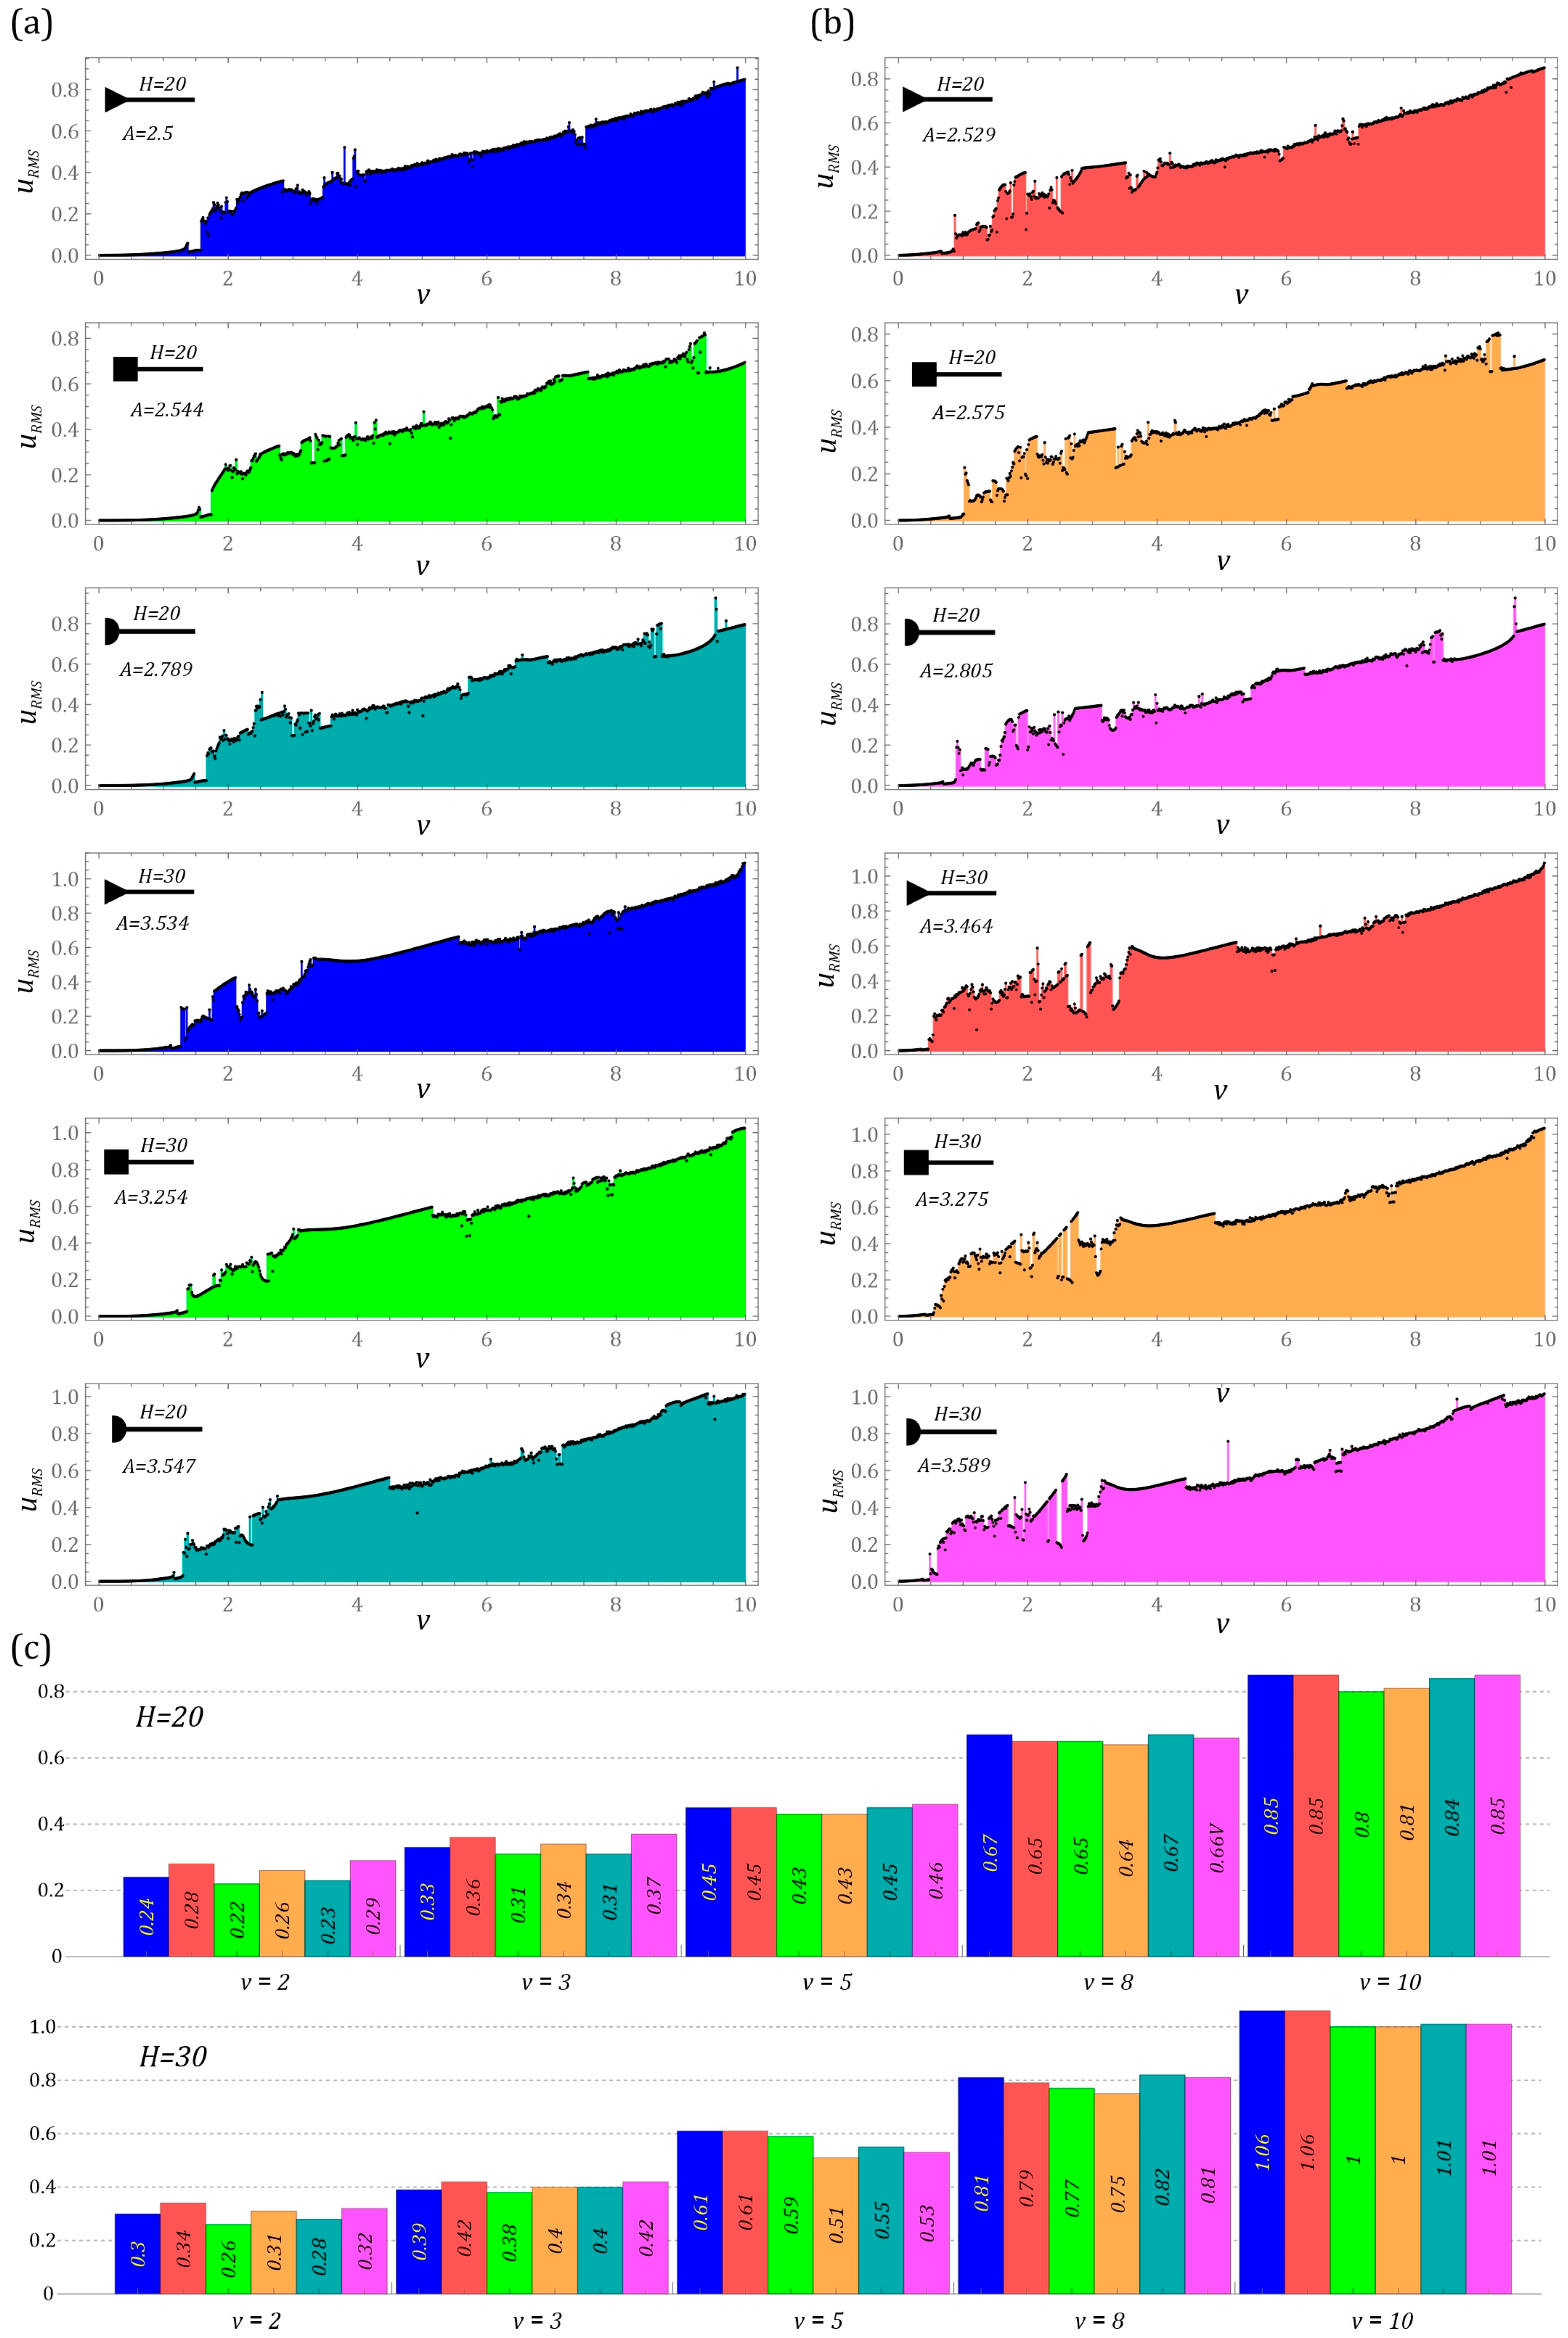
The diagrams of the root mean square (RMS) voltage induced on the piezoelectric electrodes, presented in Figure 7, were plotted for the steady-state operation of the energy harvesting system. It was assumed that transient processes fade out after 600 periods of the external load. The model studies focusing on energy harvesting effectiveness were conducted assuming zero initial conditions. This approach is justified because, at time τ = 0, the flexible cantilever beam is in a position of static equilibrium. Furthermore, for each identified diagram, a broadband index A was estimated, defined as the area under the branches of the diagram. Based on this index, it is possible to directly compare the energy harvesting effectiveness of systems with bluff-bodies of various sizes and cross-sectional shapes. Additionally, bar charts were prepared for selected airflow velocities, where the colors directly correspond to those used in the RMS voltage diagrams. Utilizing the broadband A index along with the information contained in the bar charts allows for a quantitative and qualitative determination of how the adopted functions approximating the excitation source characteristics influence the energy harvesting effectiveness of the investigated design solutions.
Figure 7.
RMS voltage diagrams induced by airflow, identified for excitation amplitude approximation cases using: (a) the exact model and (b) the simplified model, where individual A index values are provided for each diagram. Panel (c) presents the RMS voltage values at specific airflow velocities, displayed as bar charts. Computer simulations were conducted assuming zero initial conditions:
Simulation results demonstrate that obstacles with a larger frontal area consistently exhibit superior energy harvesting effectiveness, regardless of their cross-sectional geometry. This trend is quantitatively confirmed by the broadband A-index values. Notably, the A-index reaches slightly higher values when the aerodynamic excitation is represented by the simplified mathematical model (Figure 7b). This discrepancy stems from a shift in the effective energy harvesting band toward lower airflow velocities—a phenomenon observed across all investigated bluff-body sizes and shapes. This shift is considered the primary factor responsible for the marginal increase in the broadband index values. Furthermore, while an increase in the frontal area similarly displaces the effective harvesting range toward lower velocities (Figure 5a), the specific cross-sectional geometry appears to have a negligible impact on the magnitude of this displacement.
Across all configurations, the peak RMS voltages are consistently achieved in the high-velocity regime. In the low-velocity range, the simplified excitation models yield higher RMS voltage outputs than the exact models (Figure 7c). This behavior is universal for all analyzed shapes and heights. Conversely, a reversal of this trend occurs in the high-velocity regime (v > 5), where the exact model produces higher values, although the discrepancies between the two modeling approaches become less pronounced than at lower velocities.
3.2. Analysis of Dynamic Properties
While the previous section focused on electrical output, this section investigates the underlying dynamical behavior of the system that enables effective energy harvesting. The analysis of dynamic properties is crucial for understanding how different bluff-body geometries and excitation models influence stability and the type of oscillations (e.g., periodic, quasi-periodic, or chaotic). Attention should be drawn to the structure of the diagram branches (Figure 7), which represent non-smooth curves in selected ranges of v, potentially indicating the presence of chaotic solutions. However, a precise determination of the response nature solely from the URMS diagrams is not possible. Therefore, additional computer simulations are necessary to resolve this research problem. In evaluating dynamic properties, several numerical tools are commonly employed, the most significant being diagrams of the largest Lyapunov exponent and bifurcation diagrams [41], which illustrate the steady-state responses of the nonlinear system. Both procedures provide information on the system’s dynamic properties over a wide range of control parameter variability, enabling the localization of periodic and chaotic regimes. Nevertheless, the application of the largest Lyapunov exponent is essentially limited to identifying chaotic responses. In contrast, bifurcation diagrams provide additional information regarding the periodicity of the induced responses. It should be noted that steady-state diagrams can be plotted based on the time series of the mathematical model’s generalized coordinates by identifying their local minima and maxima. Similar results are obtained by examining the intersections of the phase flow with the displacement axis. While both procedures are straightforward in practical applications, they do not always reliably reflect the periodicity of solutions. For this reason, an alternative approach was adopted in our computer simulations (Figure 8), based on the intersection of the phase flow with a Poincaré section. Furthermore, bifurcation diagrams can be constructed based on any of the phase coordinates.
Figure 8.
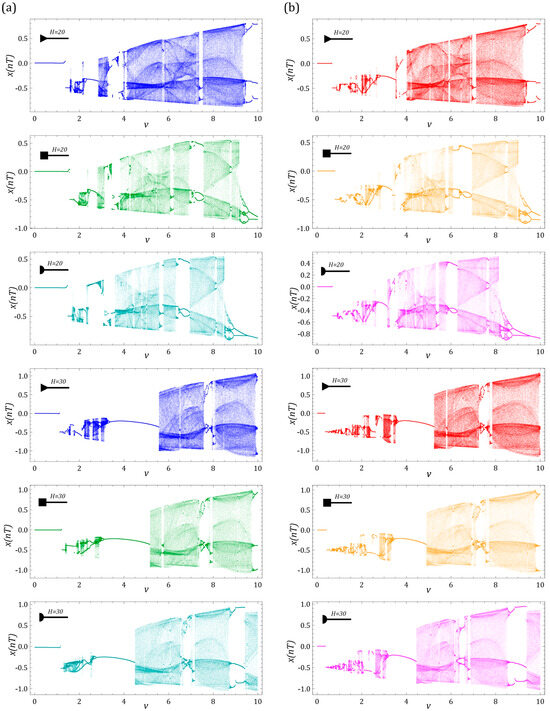
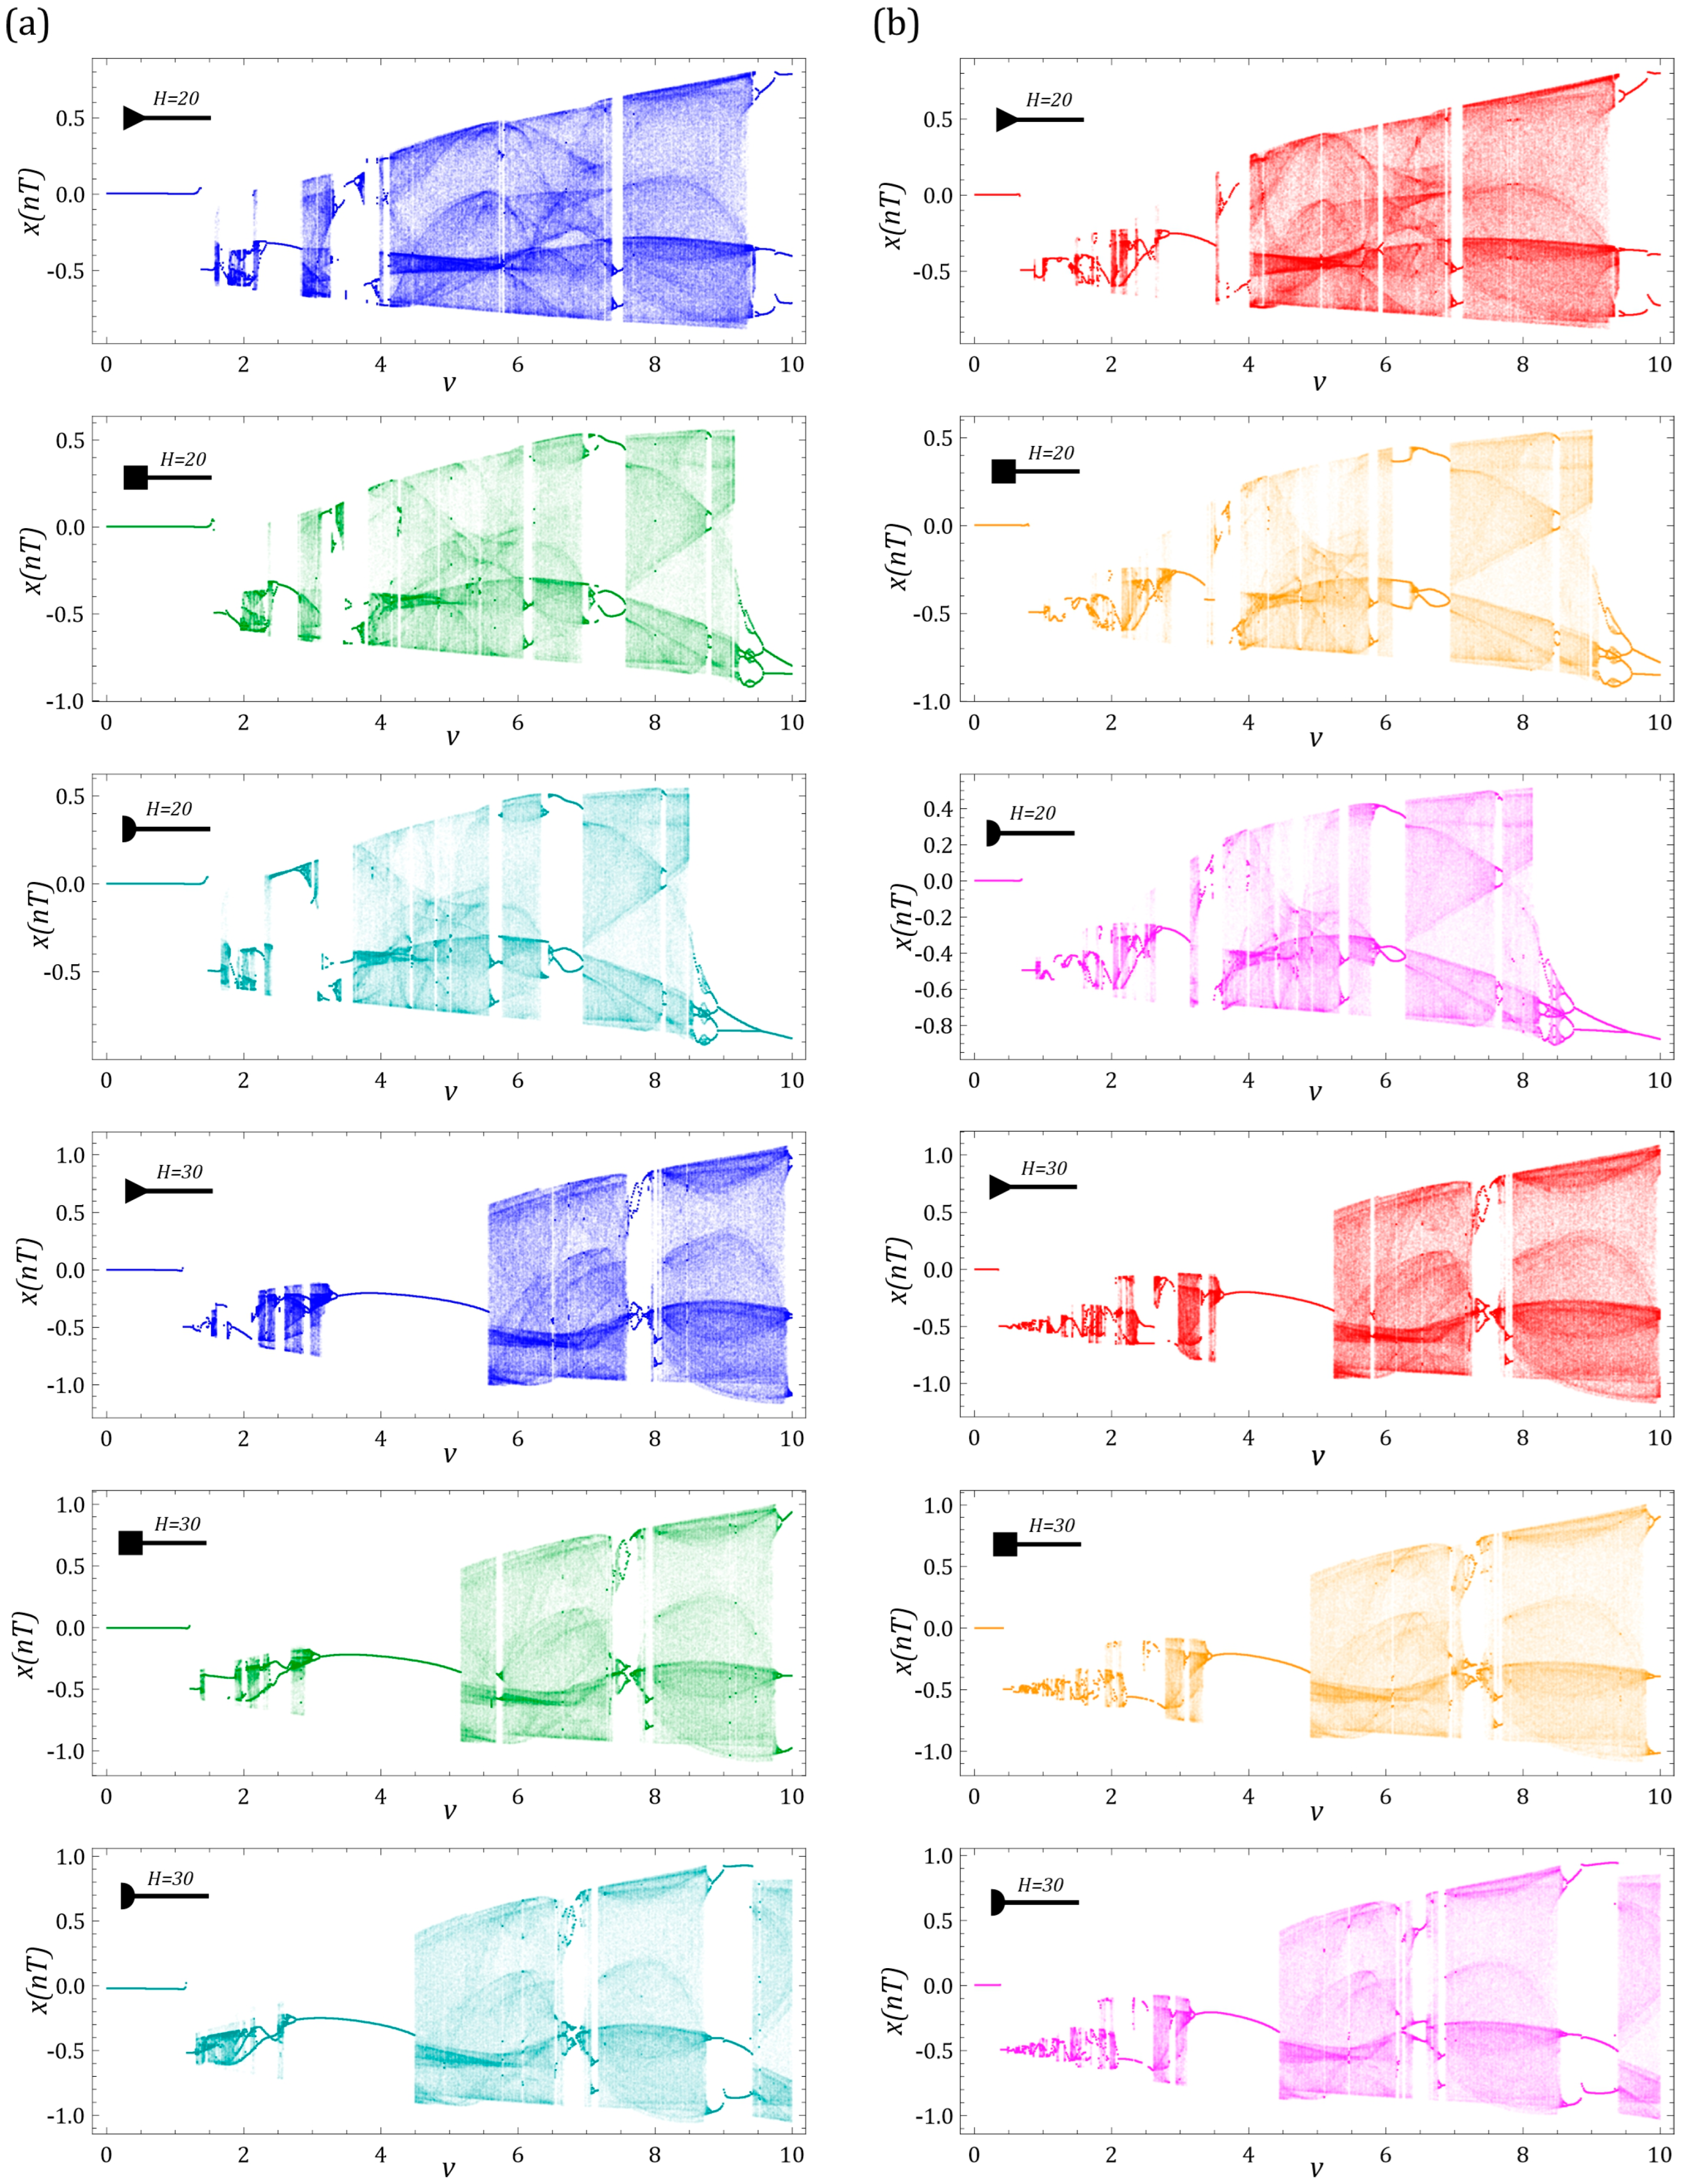
Bifurcation diagrams identified for the excitation amplitude approximation using: (a) the exact model and (b) the simplified model. The varying density of points within the chaotic regions, achieved through transparency. Numerical simulations were performed assuming zero initial conditions:
To visualize the dynamic properties within the chaotic response bands, a specific transparency was applied to the points in the bifurcation diagrams. This approach enables the assessment of the chaotic attractor’s evolution. Mathematically, the denser regions within the chaotic bands symbolize the locations where the phase flow most frequently intersects the Poincaré control plane. To ensure satisfactory resolution, the phase flow intersection points were identified over an observation window spanning 500 periods of the external load. Consistent with the RMS voltage diagrams, it was assumed that the steady state is reached after 600 excitation periods. The results of the computer simulations are summarized in Figure 8. The bifurcation diagrams were constructed for all investigated obstacle shapes and sizes, further evaluating the influence of the lift force amplitude approximation on the resulting bifurcation structure.
For a bluff body height of H = 20 mm, chaotic solutions dominate the system’s response across the investigated range of airflow velocities v. Regardless of the cross-sectional geometry, the bifurcation diagrams exhibit significant qualitative similarity. This resemblance is even more pronounced when comparing the results from the exact model (Figure 8a) and the simplified lift force model (Figure 8b). This high degree of agreement justifies the use of the simplified model for rapid dynamical mapping, as it preserves all essential system characteristics. When the obstacle height is increased to H = 30 mm, stable 1T periodic solutions emerge within the velocity range v ∈ [3, 5.5]. This broad band of stable oscillations is most prominent for the triangular cross-section, while it narrows for the square and semi-circular geometries. Notably, these regions correspond to high-amplitude inter-well orbits, which are critical for maximizing energy harvesting effectiveness. In contrast, the 1T solutions excited at low velocities (v < 1) represent intra-well oscillations confined within a single potential well; consequently, their harvesting effectiveness is negligible due to the insufficient lift force amplitude. Furthermore, higher-periodicity solutions, appearing as periodic windows within the chaotic regimes, are induced at higher velocities (v > 6). Correlating these regions with the RMS voltage diagrams (Figure 7) confirms that these windows also involve large-scale orbits encircling all potential wells, thus maintaining high power output. The engineered system is designed to serve a dual purpose: an energy harvester and an autonomous sensor. A major limitation of traditional linear harvesters is that they only activate within a narrow frequency band or at specific cut-in wind velocities. In contrast, our tri-stable system generates measurable vibrations and energy across the entire evaluated velocity spectrum. Furthermore, this independent unit can operate as a redundant, self-powered sensor, providing backup telemetry completely decoupled from the primary power source of the monitored infrastructure.
3.3. Identification of Coexisting Solutions and Their Energy Effectiveness
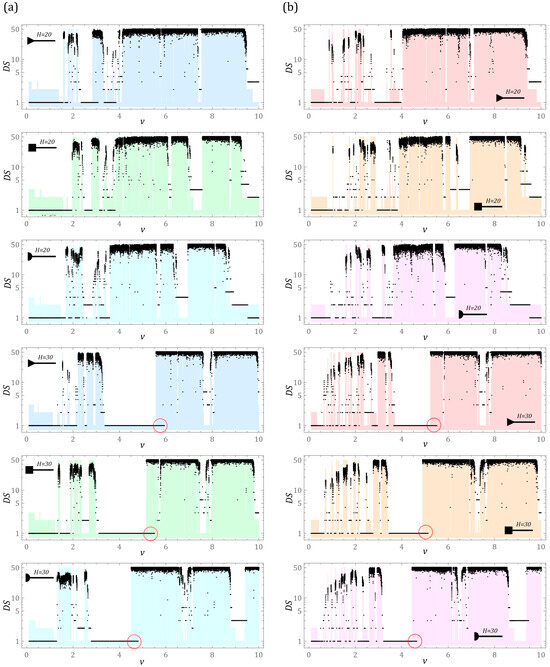
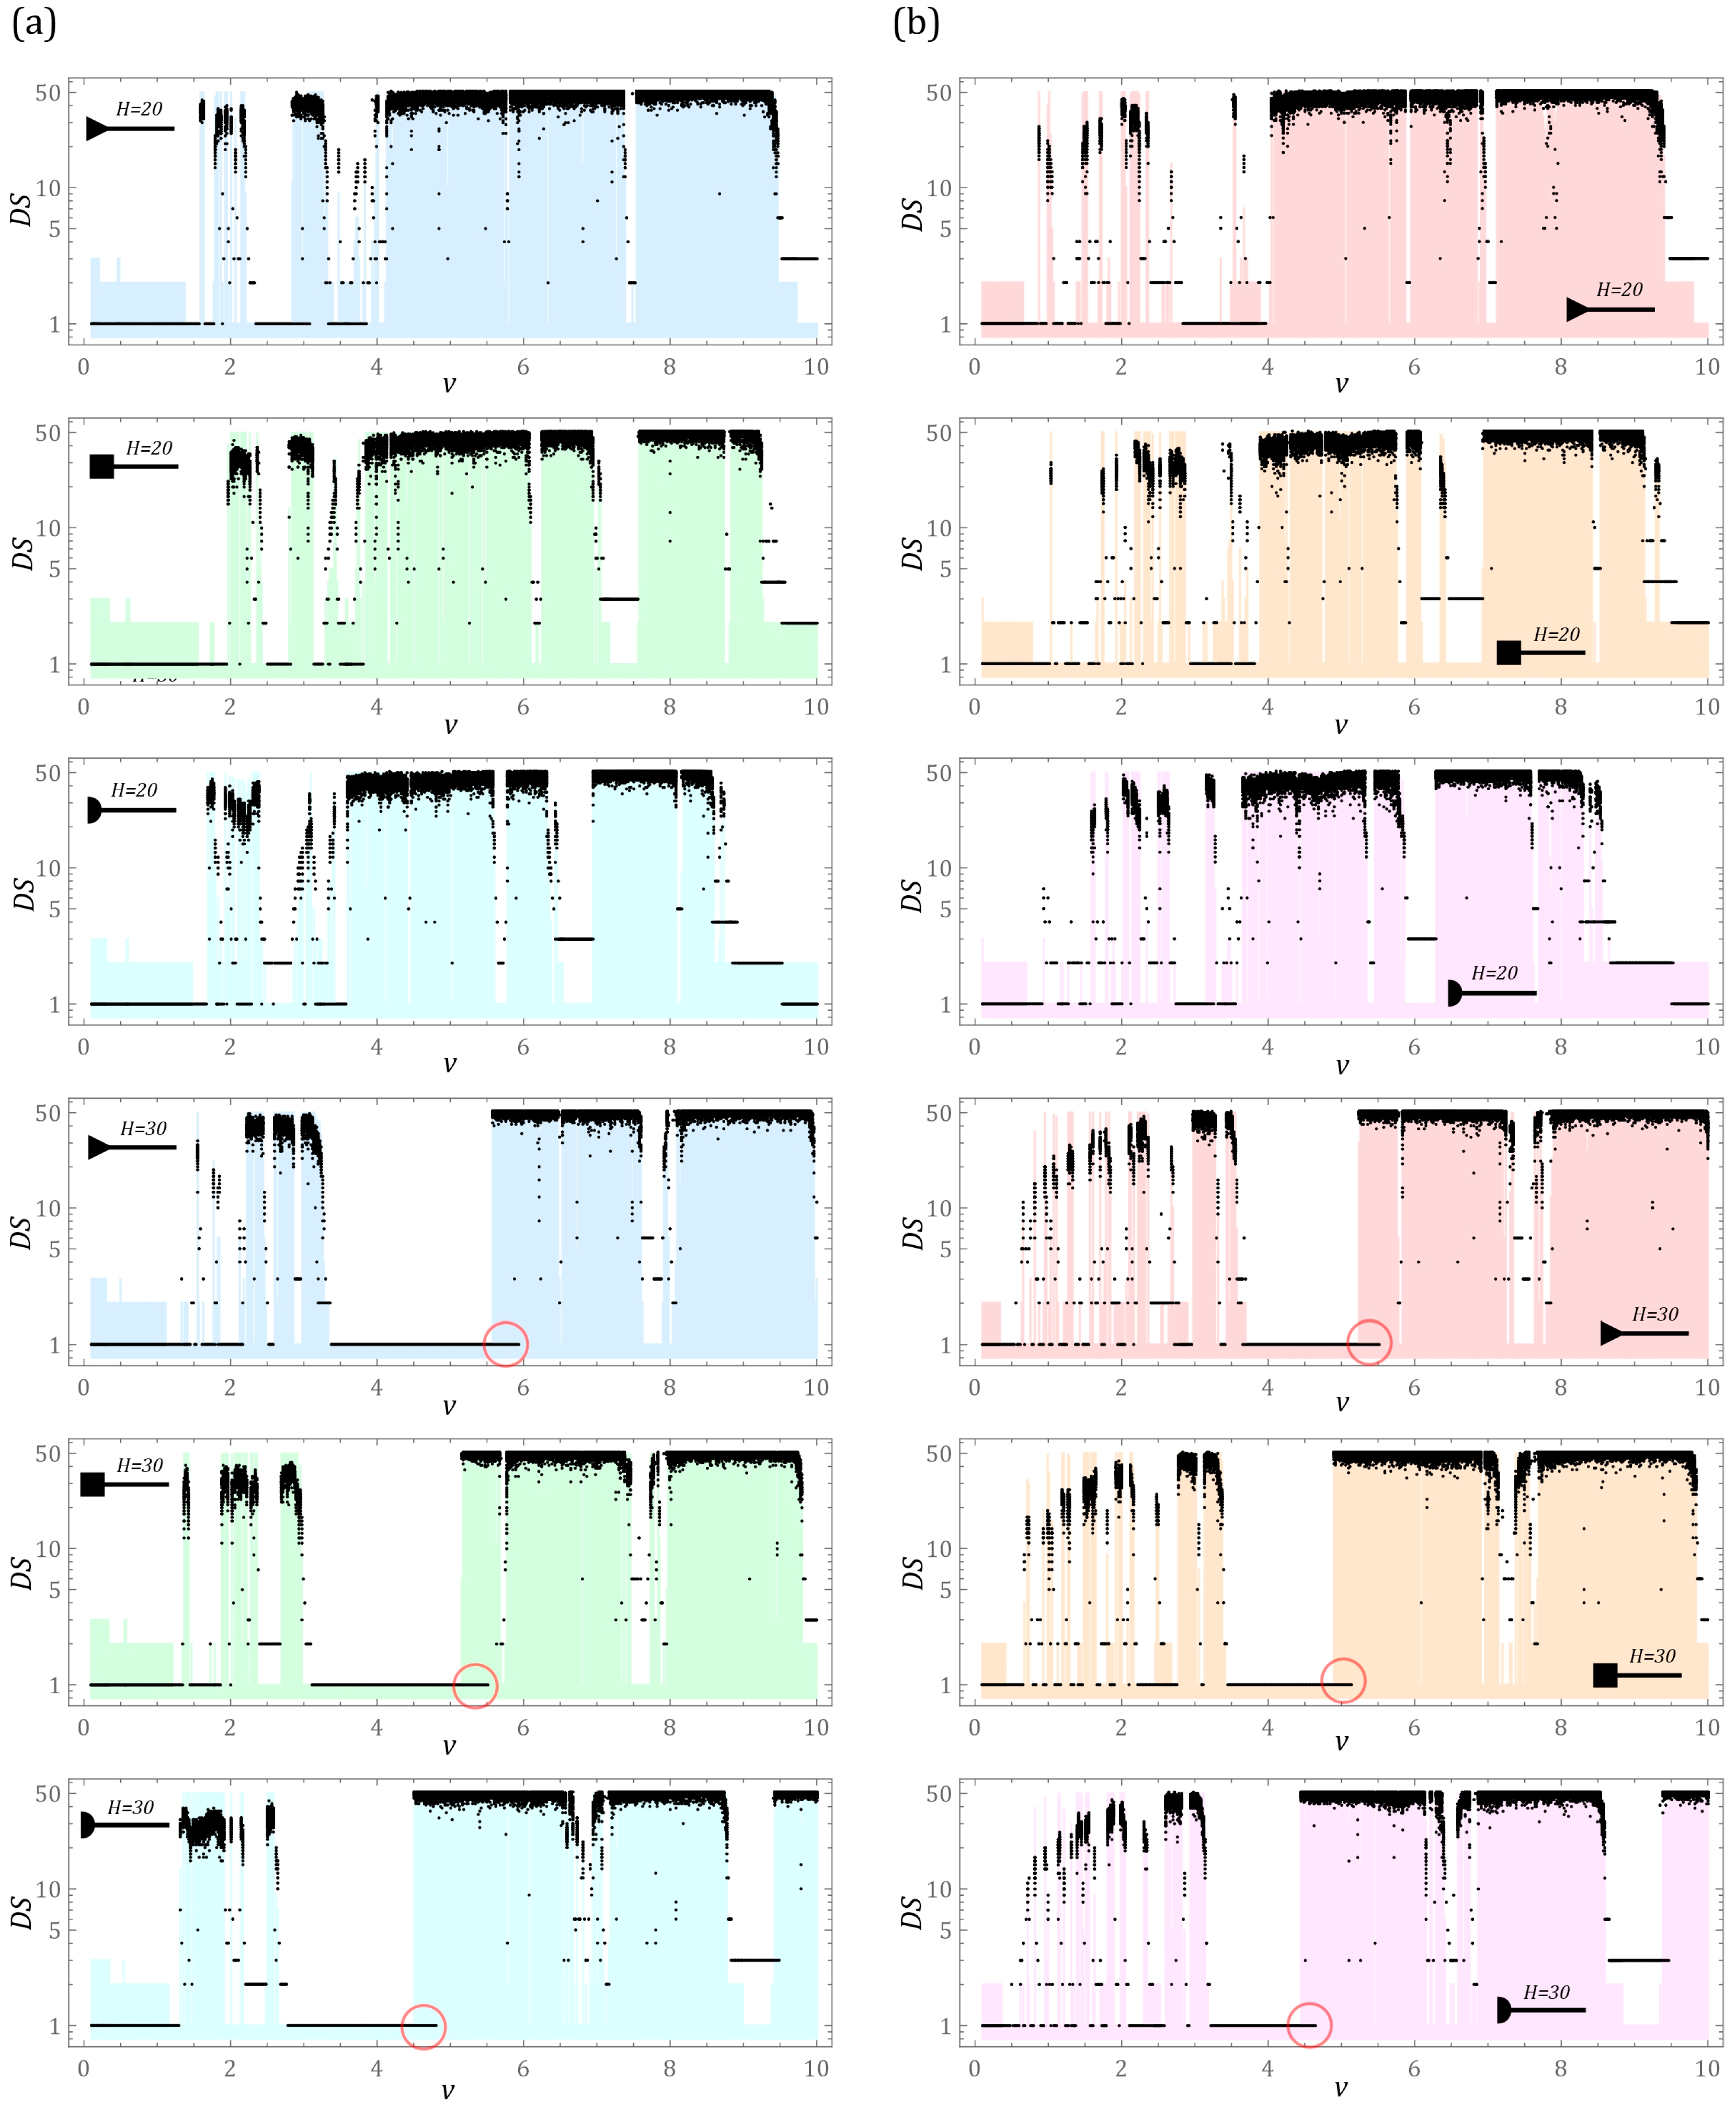
The preceding subsection presented numerical results illustrating the system’s dynamics under the assumption of zero initial conditions, where the system is forced from an initial state of equilibrium. However, a comprehensive understanding of the dynamic phenomena is only achieved by analyzing a broader range of initial conditions. This is particularly critical because a fundamental property of nonlinear dynamical systems is the potential for multiple solutions to coexist under a given load characteristic. In practical terms, this necessitates the identification of basins of attraction, the topology of which characterizes each specific case. The results of the numerical experiments presented in this section describe the dynamic properties over a wide range of control parameter variation. Rather than focusing on the magnitude of the solutions, these results quantify the number and periodicity of the excited responses. The simulation results (Figure 9) are presented as Diagrams of Coexisting Solutions (DS). Generally, such a DS is constructed by merging two data sets: a periodicity diagram, represented by black dots, and a bar graph indicating the total number of excited solutions. From a mathematical perspective, the methodology for constructing these diagrams is analogous to the process of mapping basins of attraction.
Figure 9.
Diagrams of Coexisting Solutions (DS) identified for the excitation amplitude approximation using: (a) the exact model and (b) the simplified model. Numerical simulations were performed under variable initial conditions. The periodicity of the solutions is indicated by black dots, while the shaded bar graphs represent the total number of excited solutions for a given airflow velocity. Red circles highlight the narrow velocity bands where the coexistence of solutions with different periodicities is observed.
To ensure the reliability of the results, the transient processes in the identification of the DS diagrams were assumed to fade out after 1000 periods of the external load. It should be noted that, to date, no unambiguous criteria have been established to determine the exact duration required for transients to fully subside. The authors have encountered cases where chaotic-like solutions were attracted to a stable periodic orbit only after 5000 excitation periods. This issue is sufficiently complex to require verification through the construction of large-scale Poincaré maps, defined here as maps consisting of at least 20,000 points. Furthermore, this consideration applies not only to the Diagrams of Coexisting Solutions but also to bifurcation diagrams and the distribution of the largest Lyapunov exponent.
Regarding the numerical findings, the use of the simplified mathematical formula (Figure 9b) results in two coexisting 1T periodic solutions for v < 0.5. In contrast, the high-fidelity approximation model (Figure 9a) identifies three coexisting 1T solutions within the same velocity band. It should be noted, however, that periodic responses in the low-velocity range (v < 2) are of minor interest, as they are characterized by low energy harvesting effectiveness due to their orbits being confined within a single potential well (intra-well oscillations). This conclusion is supported by the values presented in the RMS voltage diagrams. Regardless of the obstacle’s geometry or size, coexisting solutions with different periodicities either do not occur or are limited to very narrow intervals of v. Such instances are observed for obstacles with a height of H = 30 mm, and these regions are highlighted with red circles in the diagrams. Outside these specific cases, chaotic responses predominantly occur in isolation. In the broader ranges of the control parameter, the periodicity of stable solutions does not exceed 5T. While solutions with higher periodicity (T > 5T) are indeed excited, they are typically located within bifurcation zones adjacent to chaotic bands. Correlating the results from the Diagrams of Coexisting Solutions (DS) with the RMS voltage plots suggests that the periodic responses occurring in the high-velocity regime (v > 5) represent high-amplitude inter-well orbits encircling the potential wells.
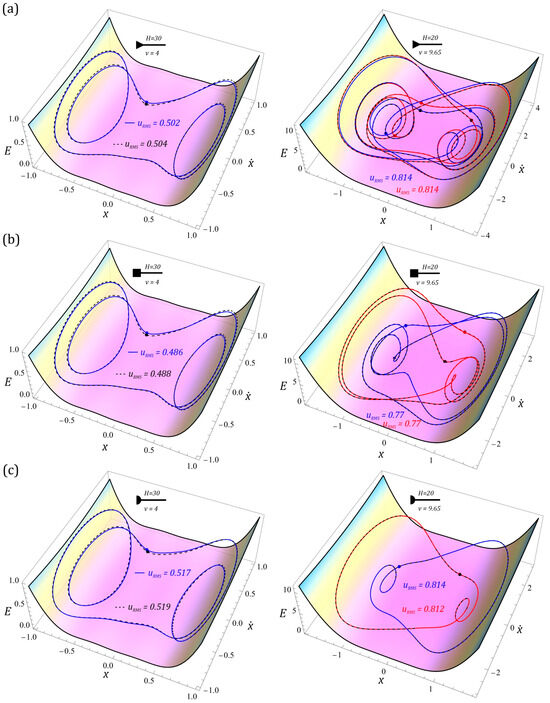
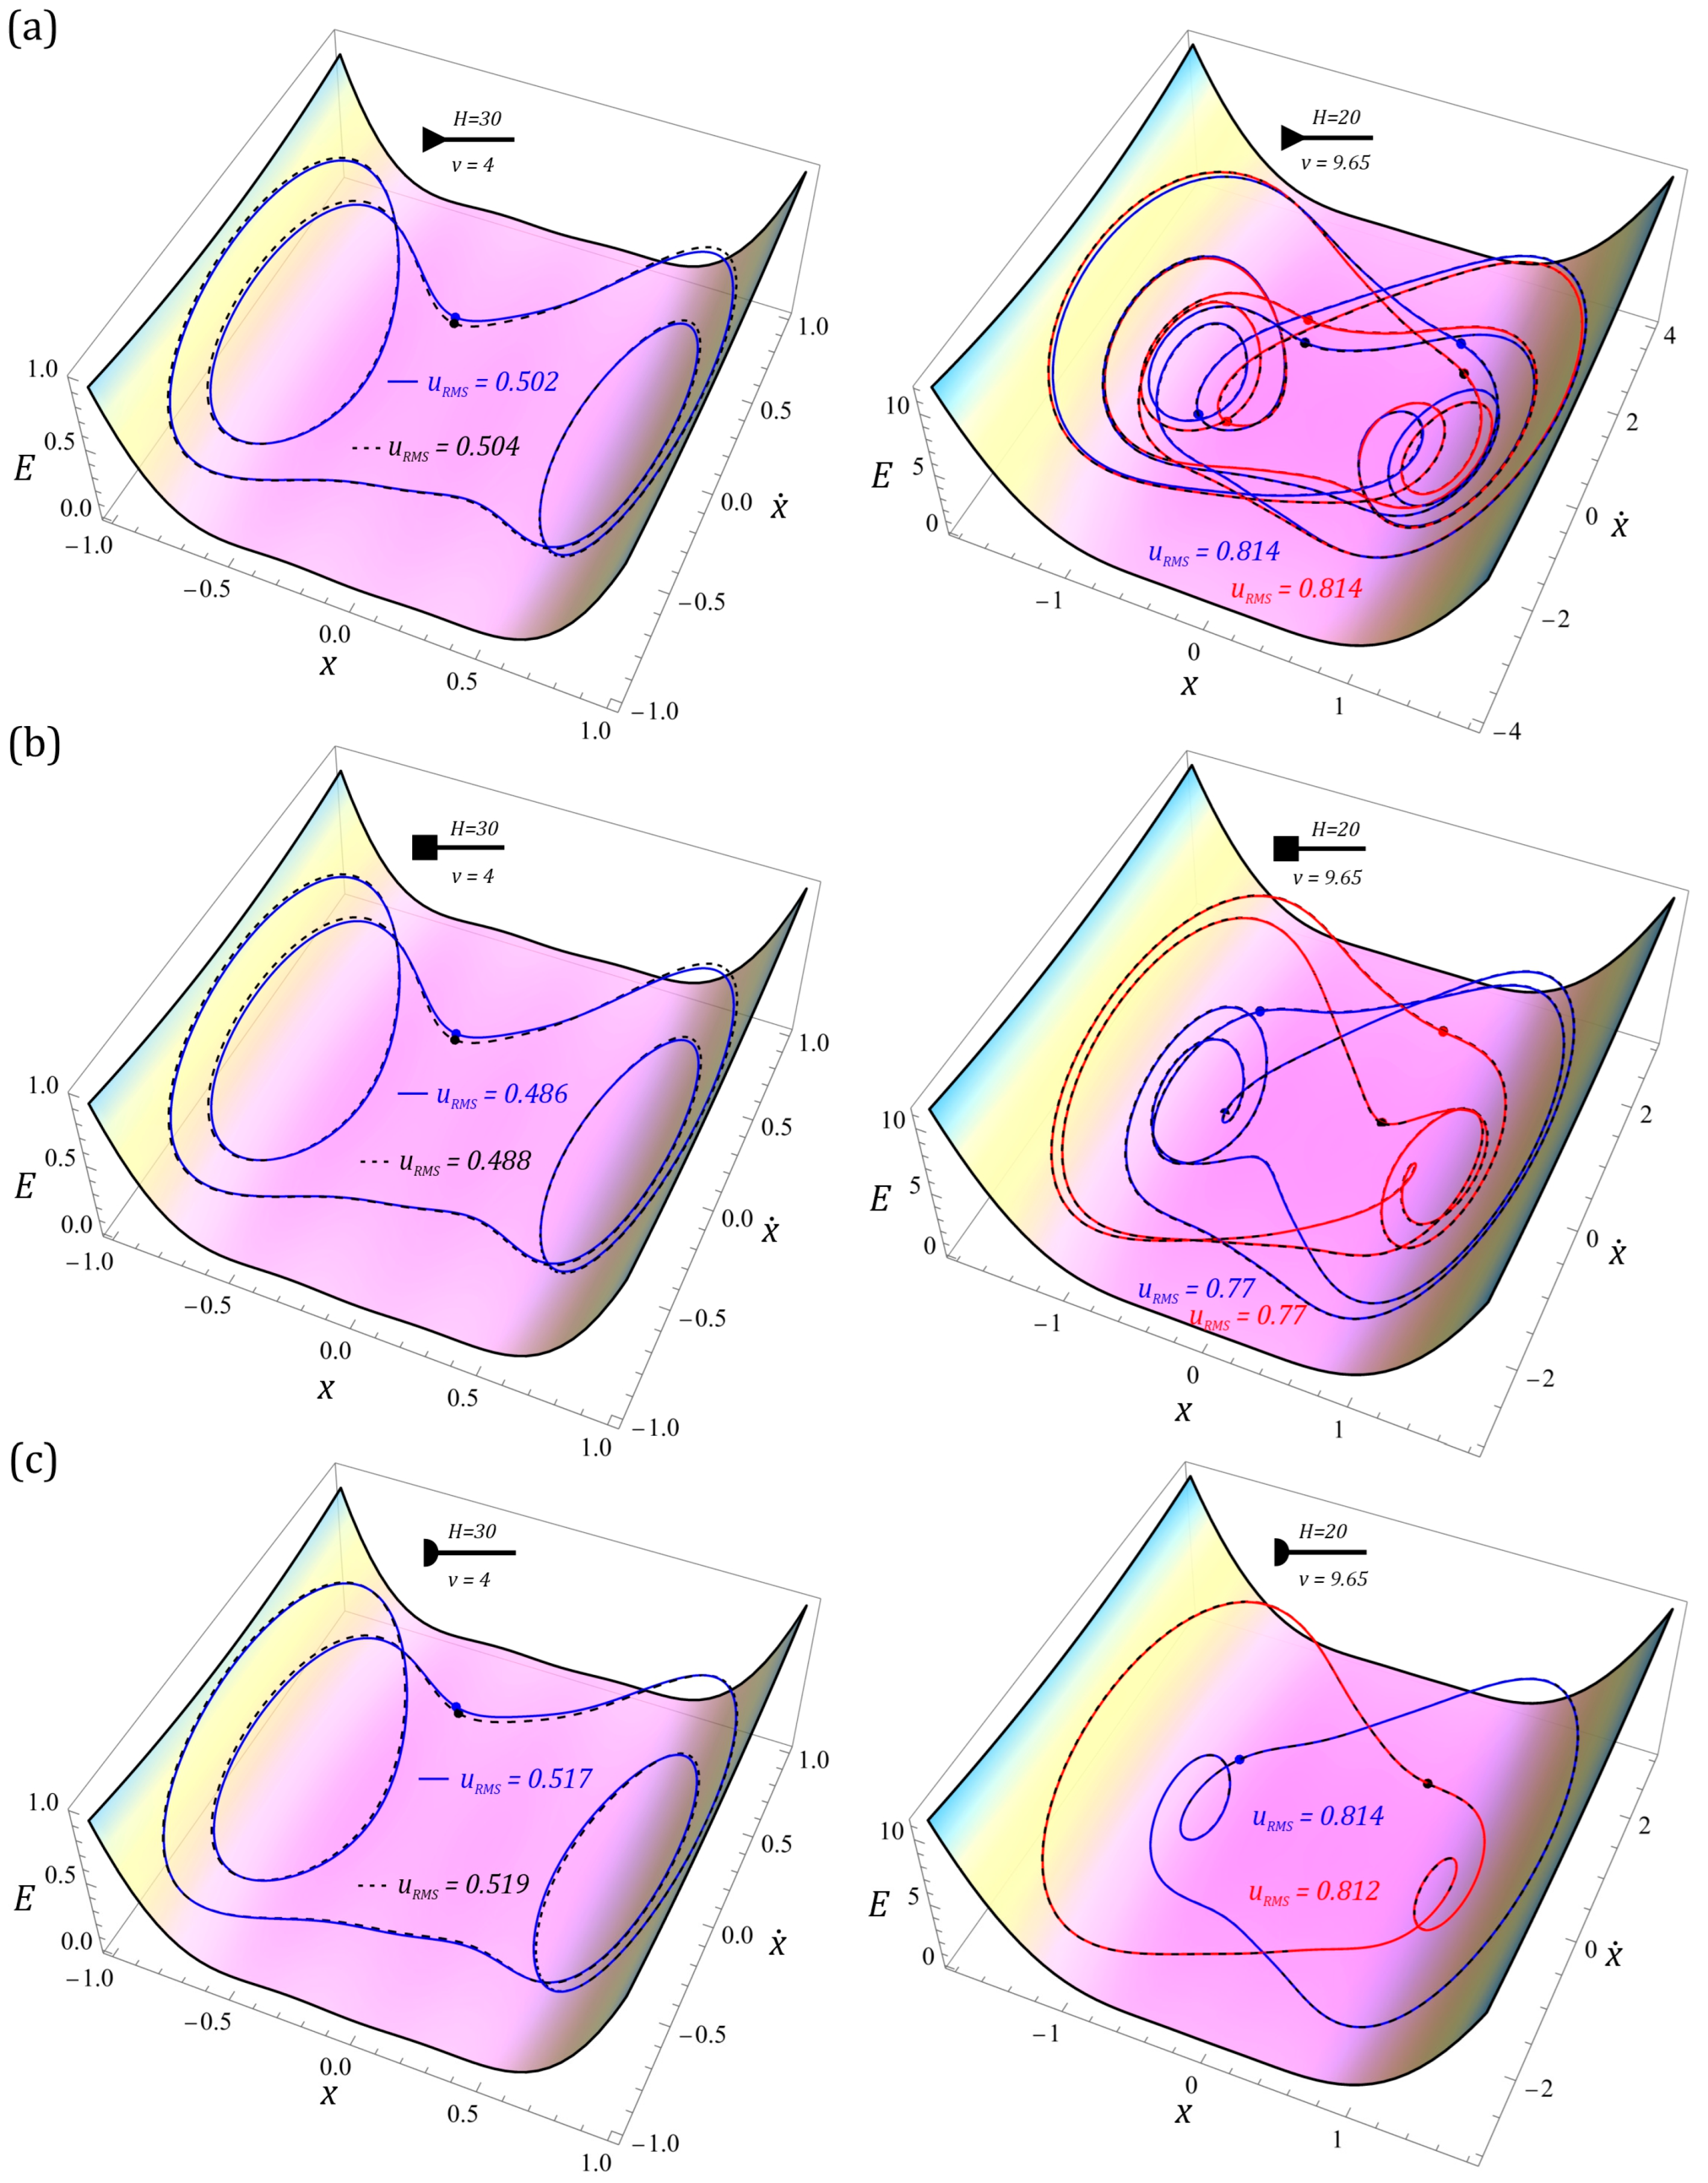
Based on the plotted diagrams, the subsequent part presents the orbits of coexisting periodic solutions with high energy harvesting effectiveness for selected airflow velocities. Given the results shown in the RMS voltage diagrams (Figure 7), excited responses in the low-velocity range (v < 2) were omitted due to their low performance. As the system exhibits solutions with various periodicities, the analysis is limited to cases occurring at identical airflow velocity values. The simulation results are visualized against a three-dimensional surface of the triple-well potential. Stable orbits of the coexisting periodic solutions, identified using the high-fidelity (exact) lift force approximation, are highlighted in blue and red. Conversely, the orbits derived from the simplified excitation model are indicated by black dashed lines. For each presented phase flow, the RMS voltage and periodicity were determined (Figure 10), the latter of which corresponds to the intersection points of the phase trajectory with the Poincaré control plane.
Figure 10.
Representative phase trajectories of stable periodic solutions visualized against the three-dimensional triple-well potential surface for bluff-body heights H = 20 mm and H = 30 mm: (a) triangular, (b) square, and (c) semi-circular cross-sections. Solid blue and red lines denote coexisting orbits identified using the exact excitation model, while black dashed lines represent results obtained from the simplified model. Red dots indicate the intersection points with the Poincaré section, and specific RMS voltage values (URMS) are provided for each trajectory.
For an airflow velocity of v = 4, single 1T periodic solutions are observed. Regardless of the cross-sectional geometry of the obstacle, the recorded RMS voltage values remain at a similar level. Furthermore, the bluff-body shape does not alter the periodicity of the response. A similar trend is observed with respect to the excitation model; however, the energy harvesting effectiveness is slightly higher for the simplified model. Coexisting solutions emerge in the high-velocity regime (v > 9), where the modeling approach for the excitation characteristics has no significant impact on the induced vibrations. This is confirmed by the calculated RMS voltage values, which reach nearly identical levels for both models. For high airflow velocities and obstacles with a height of H = 20 mm, a significant influence of the cross-section on the periodicity of the solutions was observed. The highest periodicity (3T) was identified for the equilateral triangular cross-section, while the lowest (1T) was characteristic of the semi-circular bluff-body.
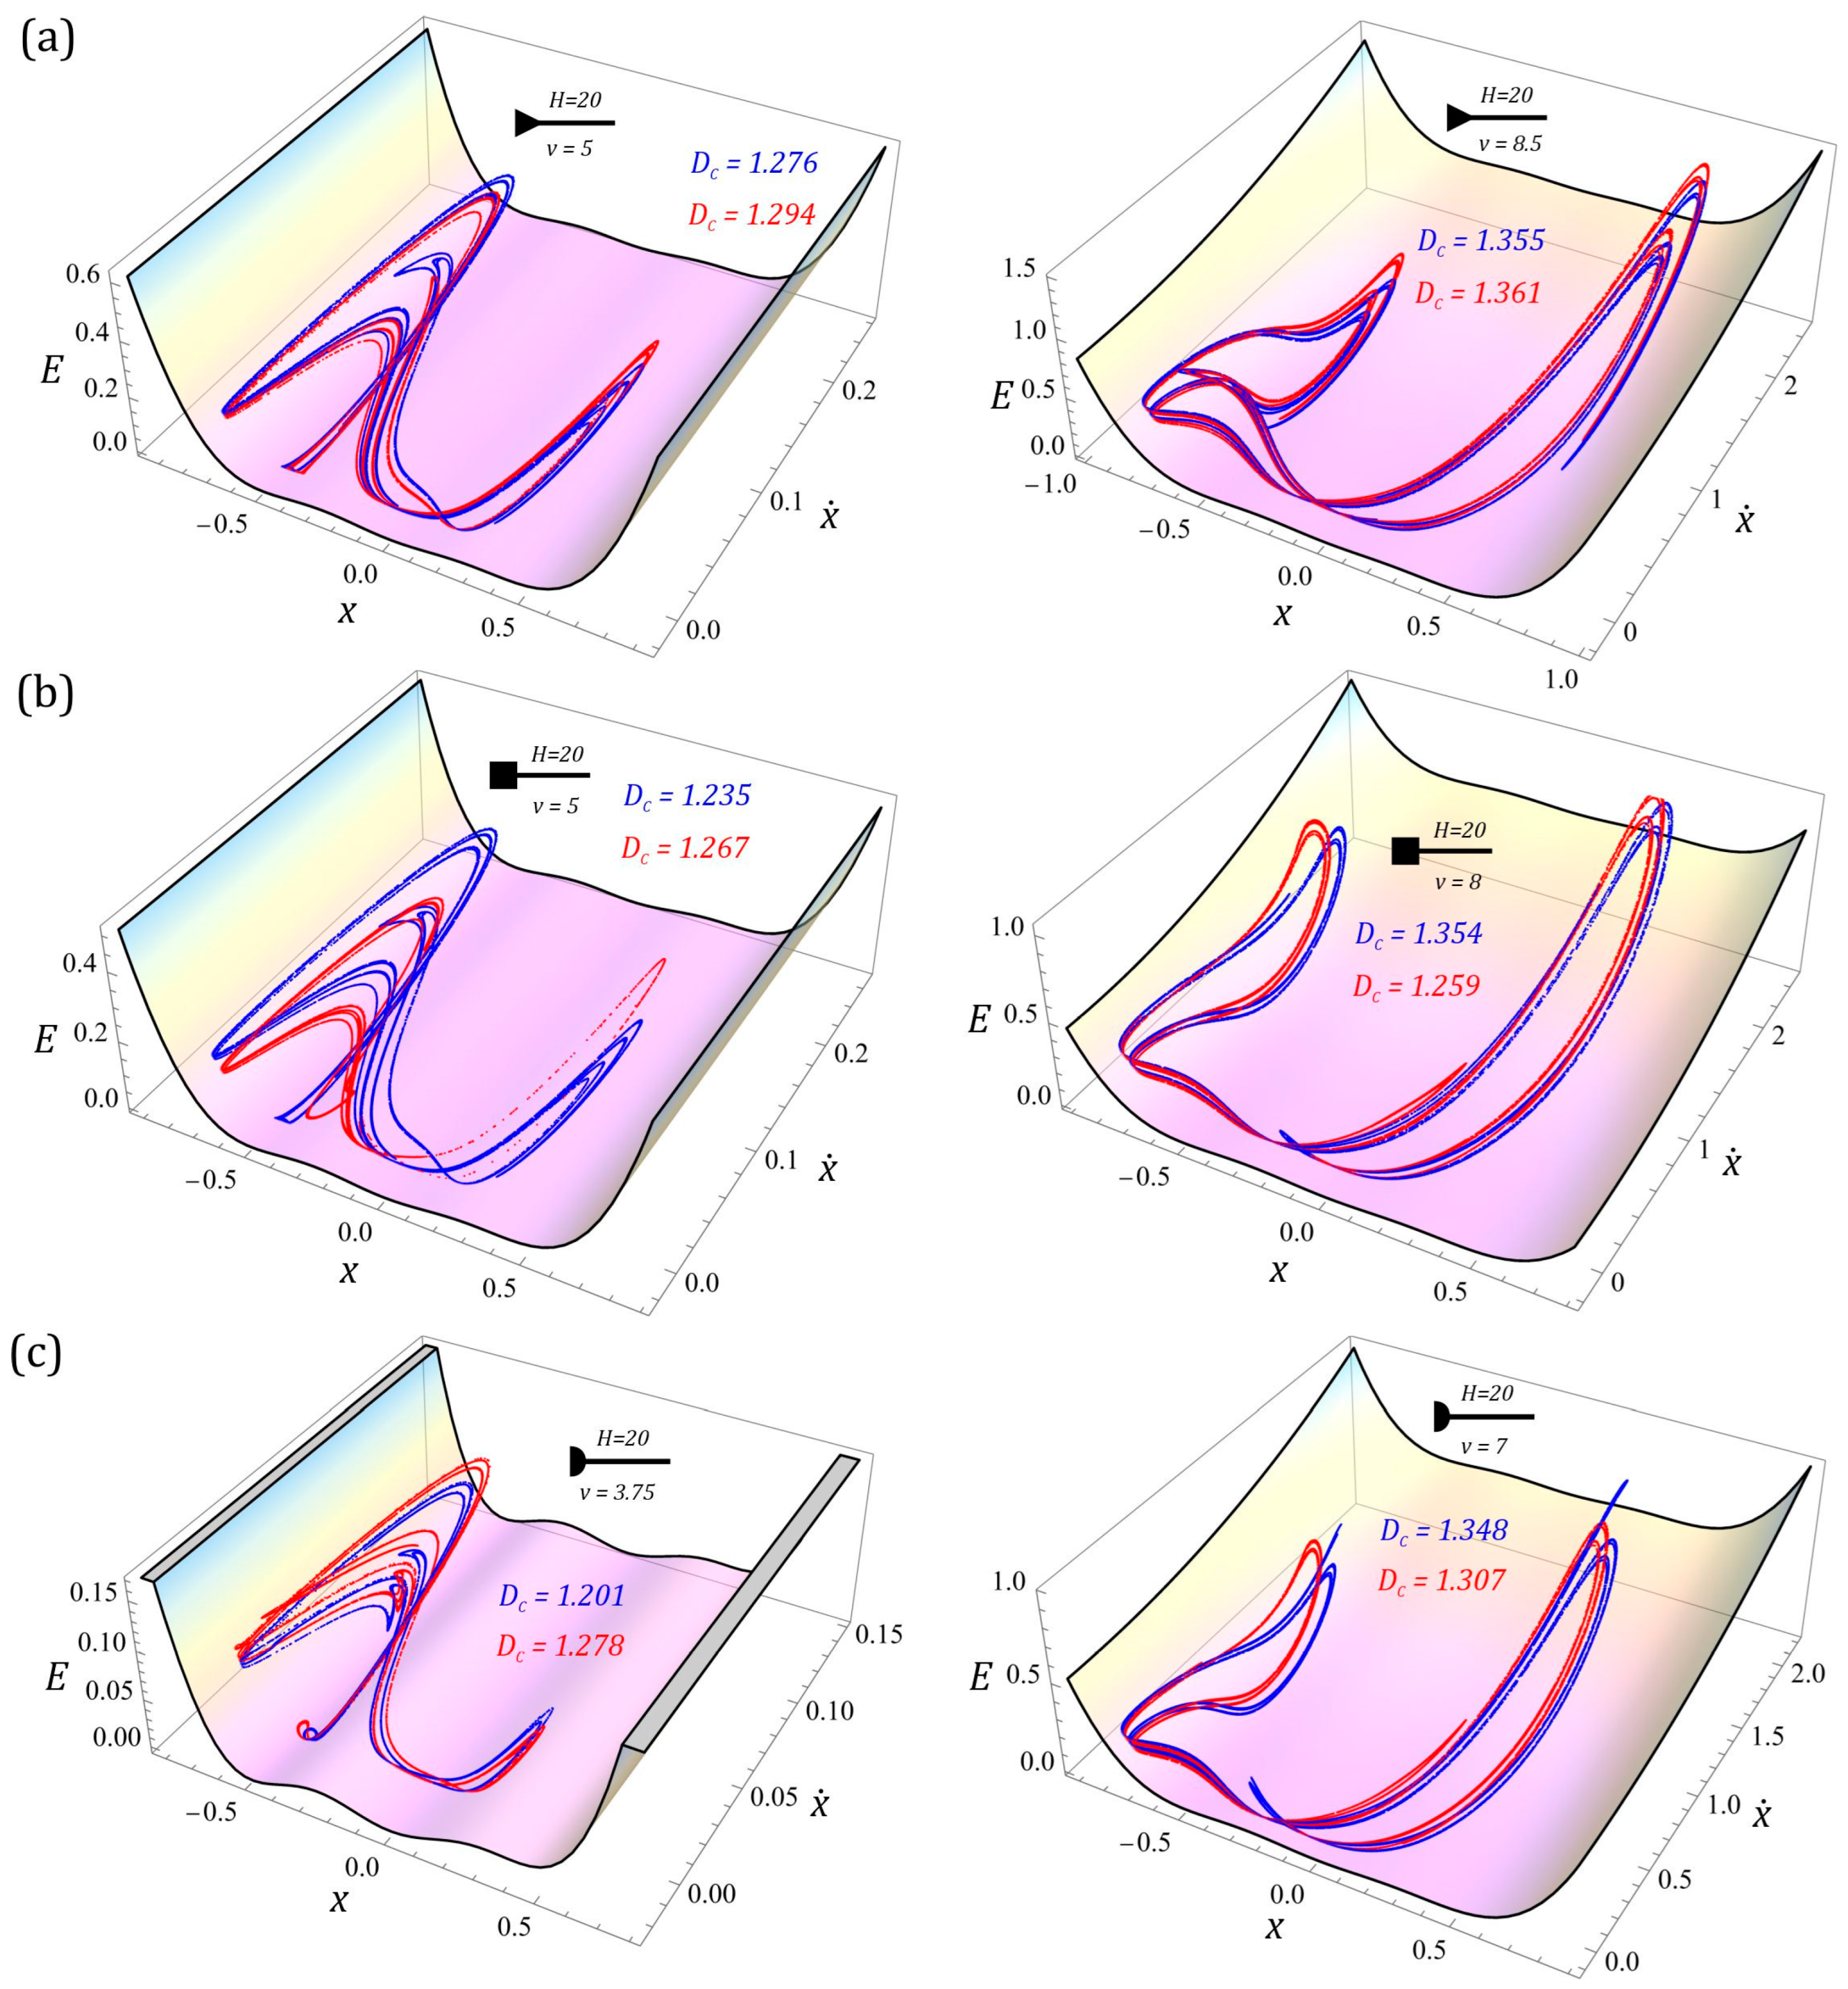
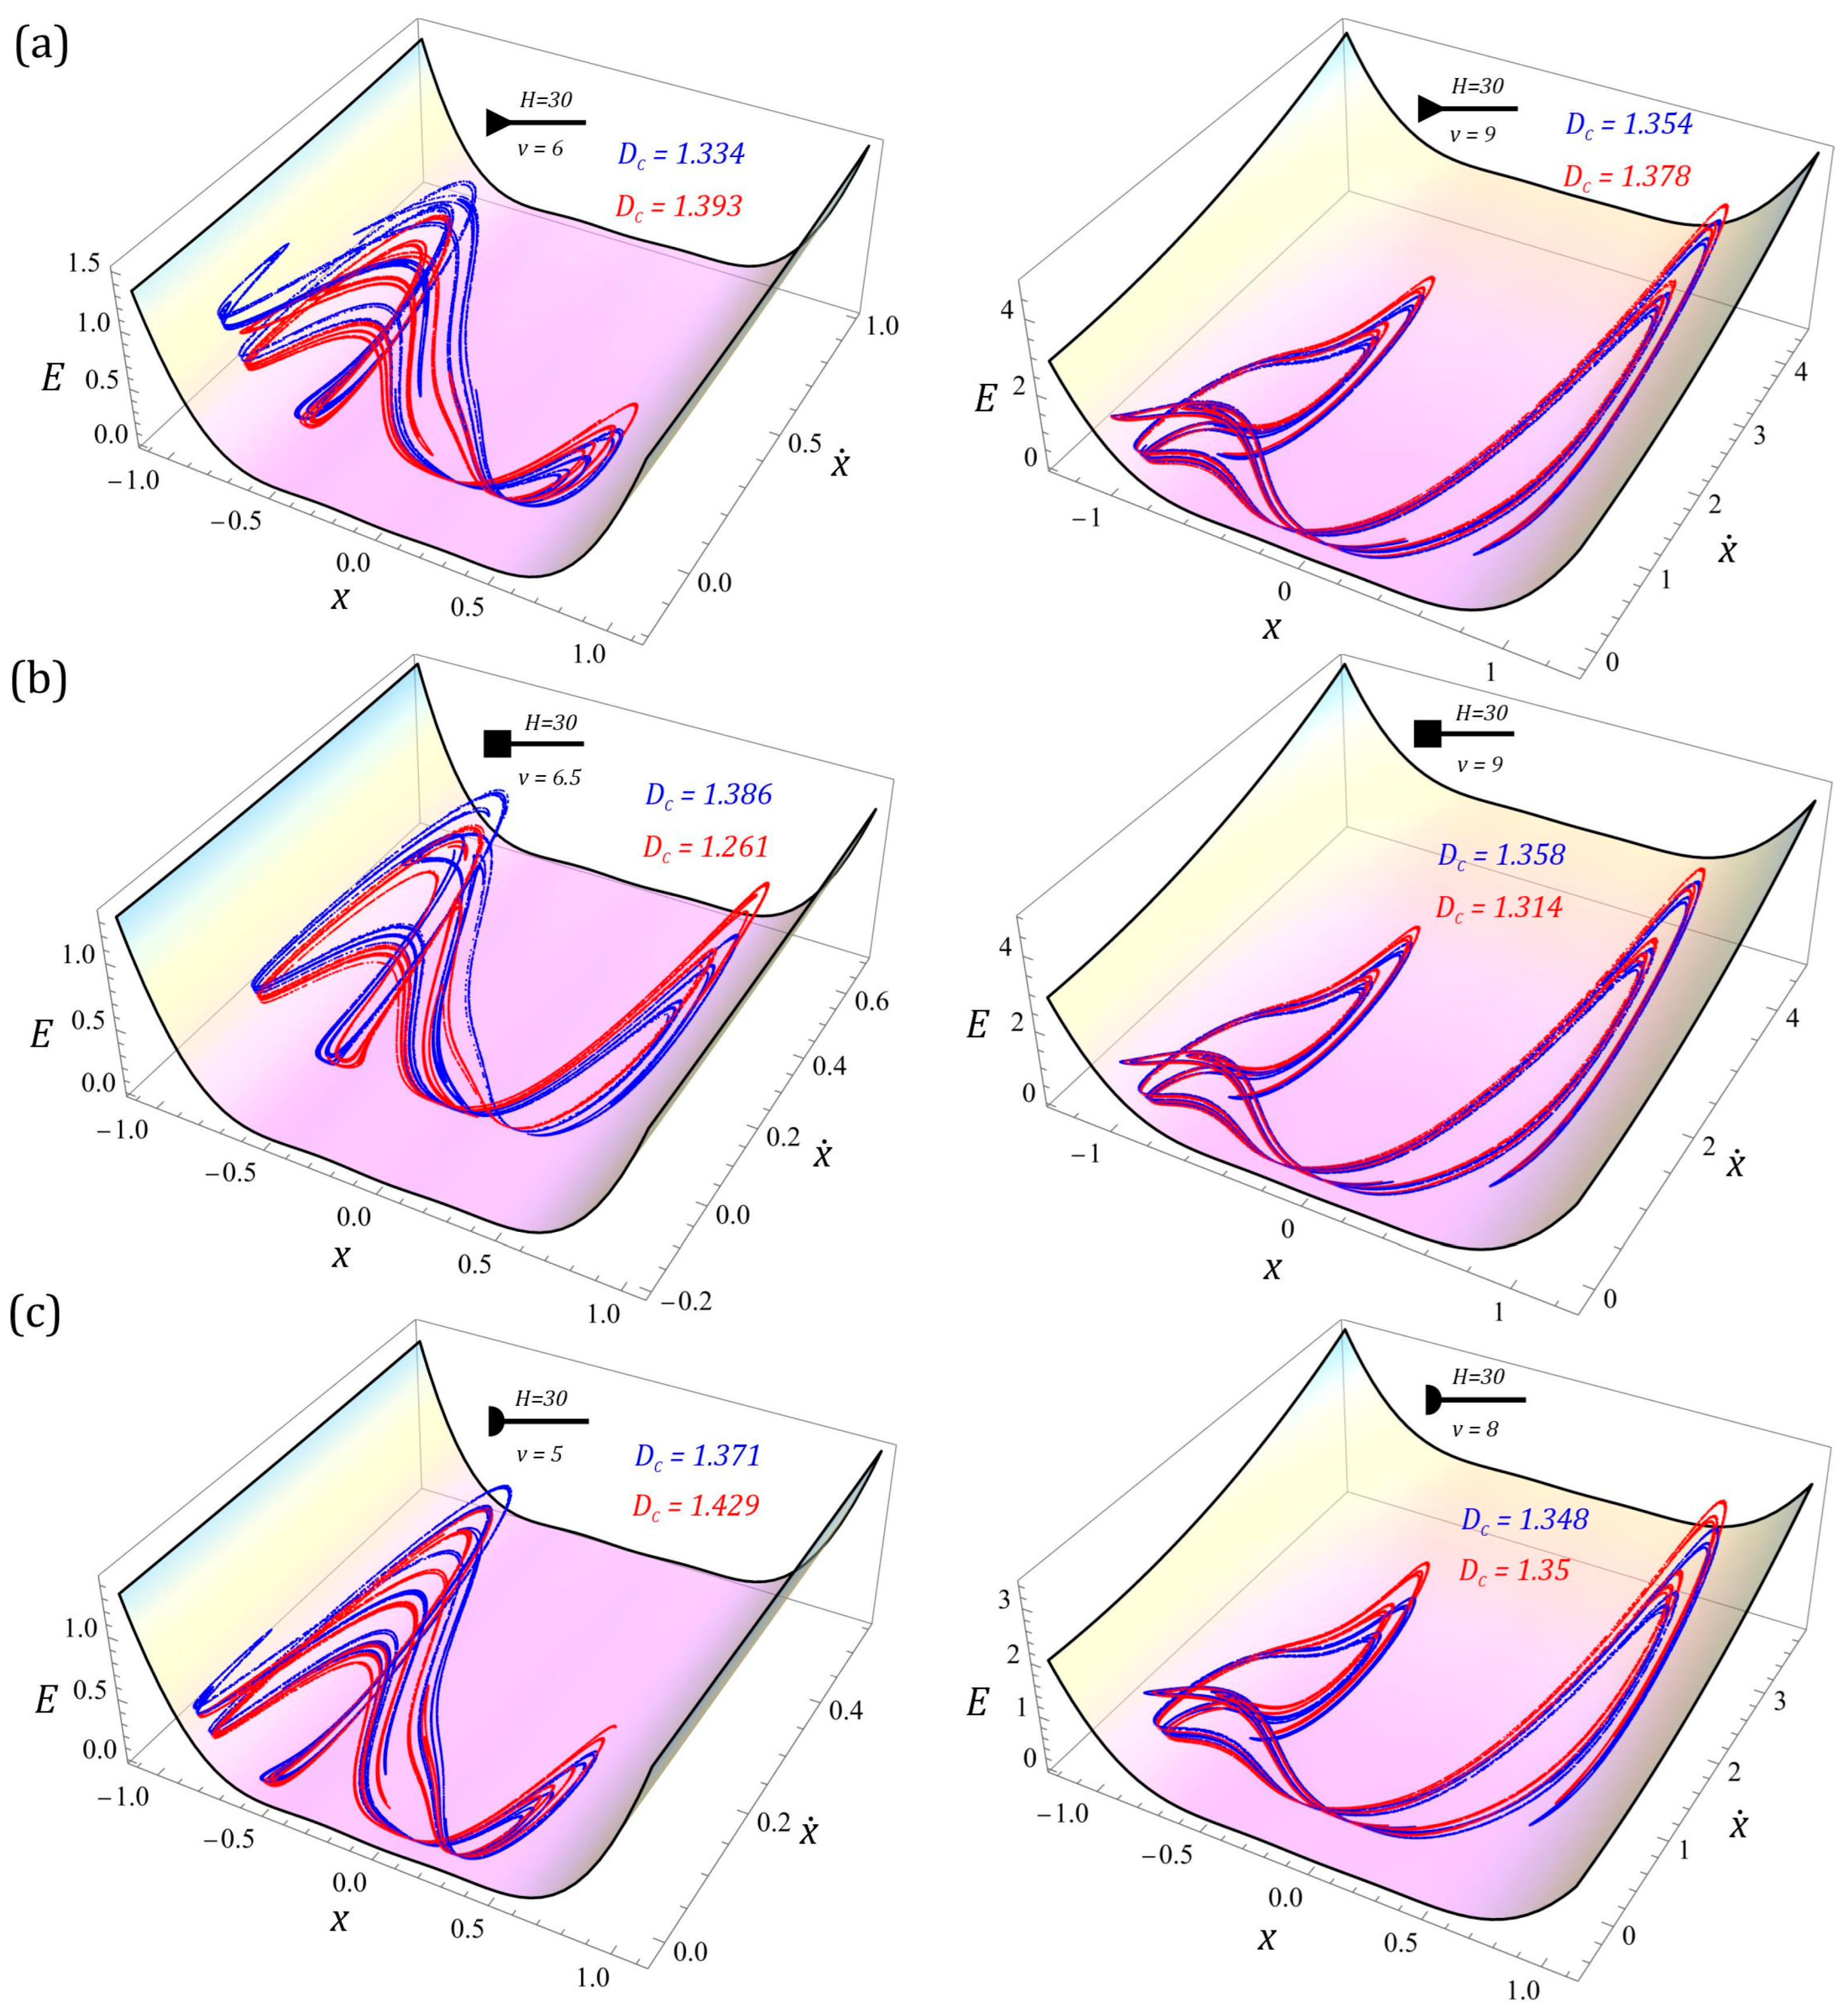
Analogous numerical studies were conducted for chaotic solutions. Like the periodic responses, the cases were selected to visualize the results for identical or closely related airflow velocity values. The results of the numerical calculations are presented in the form of three-dimensional Poincaré sections (Figure 11 and Figure 12). It is worth noting that across most of the analyzed velocity range, chaotic solutions are excited even under zero initial conditions.
Figure 11.
Representative 3D Poincaré sections identified for obstacles with a height of H = 20 mm: (a) triangular, (b) square, and (c) semi-circular cross-sections. Blue attractors denote the solutions obtained using the exact excitation model, while red attractors represent the simplified model. The calculated values of the correlation dimension DC are provided for each case to characterize the chaotic response.
Figure 12.
Representative 3D Poincaré sections identified for obstacles with a height of H = 30 mm: (a) triangular, (b) square, and (c) semi-circular cross-sections. Blue attractors denote the solutions obtained using the exact excitation model, while red attractors represent the simplified model. The calculated values of the correlation dimension DC are provided for each case to characterize the chaotic response.
Each three-dimensional Poincaré map presents two chaotic attractors: the solution identified using the exact mathematical model is shown in blue, while the results for the simplified model are highlighted in red. Although the modeling approach had a negligible impact on the periodic responses, the differences became clearly noticeable in the case of chaotic phenomena. For each chaotic attractor, the correlation dimension DC was estimated. This index serves as a metric to distinguish between ‘strong’ and ‘weak’ chaotic solutions. In the case of ‘strong’ attractors, the correlation dimension assumes values of DC > 1.5, whereas DC ≈ 1 typically indicates quasi-periodic solutions (for periodic solutions, the correlation dimension is zero). In the presented examples, the correlation dimension values fall within the range DC ∈ [1.2, 1.43]. It is also worth noting that the geometric structure of chaotic attractors can be influenced by the system’s damping; specifically, an increase in damping limits the correlation dimension value. Based on the visualized chaotic responses, it can be concluded that attractors excited at airflow velocities of v ≥ 7 exhibit similar geometric structures, independent of the obstacle’s height or cross-sectional shape. These structures can, to a close approximation, be represented by a line. Significantly more complex Poincaré sections are observed in the low-velocity range for obstacles with a height of H = 20 mm.
4. Summary and Conclusions
Regardless of the cross-sectional shape, a critical bluff-body height H exists, below which the lift force loses its oscillatory character within the investigated velocity range. For obstacles with H = 15 mm, constant lift force values were recorded, preventing vibration excitation and renders energy harvesting ineffective.
The study revealed the high sensitivity of the system to the positioning precision of the elastic elements. This characteristic was intentionally incorporated into the model by introducing a slight, controlled asymmetry in the potential barriers, accurately reflecting real-world technical conditions and manufacturing tolerances. It was demonstrated that such an approach is essential for reliable dynamical forecasting; it ensures the preservation of high-energy inter-well oscillations while preventing the degradation of the triple-well structure into a non-functional, deep double-well potential that could occur under larger assembly errors. The integration of additional elastic elements into the energy harvesting system provides dual advantages. Firstly, they enable precise tailoring of the non-linear potential profile (e.g., an asymmetric triple-well system), which optimizes the excitation of high-voltage responses across a wide range of airflow velocities. Secondly, these elements act as mechanical limiters for the cantilever beam’s vibration amplitude. By controlling maximum deflections, mechanical stresses are significantly reduced, minimizing the risk of material fatigue and structural damage. Consequently, this results in an extended operational lifespan, reduced degradation of the piezoelectric transducers, and enhanced long-term reliability of the prototype.
A comparison of the simulation results demonstrated high qualitative and quantitative agreement between the exact and simplified excitation models. Despite its lower computational complexity, the simplified model accurately identifies the primary effective harvesting bands and the structure of the bifurcation diagrams, justifying its use in the rapid prototyping of such systems. It allows for significant acceleration of the design process and optimization such EH prototypes without the need for extensive computational resources.
The cross-sectional shape of the bluff-body determines the width of the periodic solution bands. The triangular cross-section is characterized by the widest range of stable, high-amplitude 1T (inter-well) responses, making it the most optimal configuration across a broad range of airflow velocities. Dynamical analysis revealed that the chaotic solutions in the investigated system are predominantly high-energy (orbits encircling all potential wells). The correlation dimension values DC ∈ [1.2, 1.43] confirm the presence of stable chaotic structures which, despite their non-periodicity, provide high energy harvesting effectiveness, comparable to those of large-orbit periodic oscillations.
Although the presented numerical results provide deep insights into the non-linear phenomena occurring within the asymmetric tri-stable harvester, certain limitations arising from the adopted idealized model must be acknowledged. The 2D CFD simulations and the mathematical representation of the lift force do not account for three-dimensional flow effects or potential assembly inaccuracies, such as magnet misalignment or variations in structural damping. These factors may introduce quantitative shifts in the boundaries of coexisting solutions or affect critical velocity thresholds. Furthermore, while the physical design includes mounting bolts for integration with external structures, the system’s performance under non-stationary or highly turbulent real-world conditions requires further investigation. These issues, particularly the sensitivity analysis of the system to parameter uncertainties, constitute a significant research challenge that will be comprehensively addressed in future publications. Future experiments, conducted under controlled wind tunnel conditions, will allow for the final validation of the identified characteristics and confirm the high energy harvesting effectiveness predicted for the optimized bluff-body geometries and non-linear potential profiles. These findings offer not only a robust theoretical foundation but also a practical framework for developing durable, high-efficiency commercial energy harvesters.
Author Contributions
Conceptualization, S.B., J.M. and D.G.; methodology, S.B. and J.M.; software, S.B. and J.M.; validation, J.M. and D.G.; formal analysis, J.M.; investigation, S.B., J.M. and D.G.; resources, S.B., J.M. and D.G.; data curation, J.M.; writing—original draft, S.B., J.M. and D.G.; writing—review and editing, S.B., J.M. and D.G.; visualization, S.B. and J.M.; supervision, J.M. and D.G.; project administration, J.M. and D.G.; funding acquisition, J.M. and D.G. All authors have read and agreed to the published version of the manuscript.
Funding
This research was funded by the National Science Centre, Poland under the OPUS call in the Weave programme under the project no. 2023/51/I/ST8/02739.
Data Availability Statement
The original contributions presented in this study are included in the article. Further inquiries can be directed to the corresponding authors.
Conflicts of Interest
The authors declare that they have no known competing financial interests or personal relationships that could have appeared to influence the work reported in this paper.
References
- Zhou, S.; Lallart, M.; Erturk, A. Multistable vibration energy harvesters: Principle, progress, and perspectives. J. Sound Vib. 2022, 528, 116886. [Google Scholar] [CrossRef] [Scilit]
- Erturk, A.; Hoffmann, J.; Inman, D.J. A piezomagnetoelastic structure for broadband vibration energy harvesting. Appl. Phys. Lett. 2009, 94, 254102. [Google Scholar] [CrossRef] [Scilit]
- Cottone, F.; Vocca, H.; Gammaitoni, L. Nonlinear energy harvesting. Phys. Rev. Lett. 2009, 102, 080601. [Google Scholar] [CrossRef] [Scilit] [PubMed]
- Wang, J.; Geng, L.; Ding, L.; Zhu, H.; Yurchenko, D. The state-of-the-art review on energy harvesting from flow-induced vibrations. Appl. Energy 2020, 267, 114902. [Google Scholar] [CrossRef] [Scilit]
- Zhou, S.; Li, Z.; Zhou, S. A two-degree-of-freedom nonlinear electromagnetic energy harvester in rotational motion. Mech. Syst. Signal Process. 2024, 220, 111695. [Google Scholar] [CrossRef] [Scilit]
- Fang, S.; Zhou, S.; Yurchenko, D.; Yang, T.; Liao, W.H. Multistability phenomenon in signal processing, energy harvesting, composite structures, and metamaterials: A review. Mech. Syst. Signal Process. 2022, 166, 108419. [Google Scholar] [CrossRef] [Scilit]
- Cong, M.; Dong, W.; Gao, Y.; Wang, W.; Li, C.; Dong, H. Bio-inspired magnetically triggered snap-through mechanism for enhanced mechanical-to-electrical energy conversion. Chem. Eng. J. 2026, 538, 176507. [Google Scholar] [CrossRef] [Scilit]
- Zhang, J.; Li, X.; Feng, X.; Li, R.; Dai, L.; Yang, K. A novel electromagnetic bistable vibration energy harvester with an elastic boundary: Numerical and experimental study. Mech. Syst. Signal Process. 2021, 160, 107937. [Google Scholar] [CrossRef] [Scilit]
- Abdelkefi, A. Aeroelastic energy harvesting: A review. Int. J. Eng. Sci. 2016, 100, 112–135. [Google Scholar] [CrossRef] [Scilit]
- Su, B.; Guo, T.; Alam, M.M. A review of wind energy harvesting technology: Civil engineering resource, theory, optimization, and application. Appl. Energy 2025, 389, 125771. [Google Scholar] [CrossRef] [Scilit]
- Wang, H.; Jasim, A.; Chen, X. Energy harvesting technologies in roadway and bridge for different applications—A comprehensive review. Appl. Energy 2018, 212, 1083–1094. [Google Scholar] [CrossRef] [Scilit]
- Zhang, Y.; Wang, W.; Wu, X.; Lei, Y.; Cao, J.; Bowen, C.; Bader, S.; Yang, B. A comprehensive review on self-powered smart bearings. Renew. Sustain. Energy Rev. 2023, 183, 113446. [Google Scholar] [CrossRef] [Scilit]
- Zelenika, S.; Hadas, Z.; Bader, S.; Becker, T.; Gljušćić, P.; Hlinka, J.; Janak, L.; Kamenar, E.; Ksica, F.; Kyratsi, T.; et al. Energy Harvesting Technologies for Structural Health Monitoring of Airplane Components—A Review. Sensors 2020, 20, 6685. [Google Scholar] [CrossRef] [Scilit] [PubMed]
- Prajwal, K.T.; Manickavasagam, K.; Suresh, R. A review on vibration energy harvesting technologies: Analysis and technologies. Eur. Phys. J. Spec. Top. 2022, 231, 1359–1371. [Google Scholar] [CrossRef] [Scilit]
- Litak, G.; Caban, J.; Sadasiavan, S.; Klimek, M.; Margielewicz, J.; Gąska, D. Wind induced energy harvesting with an aero-elastic resonator: Effect of the bluff body diameter. J. Ecol. Eng. 2025, 26, 197–204. [Google Scholar] [CrossRef] [Scilit] [PubMed]
- Alhussein, H.; Laws, P.; Daqaq, M.F. On the escape from a potential well via vortex-induced vibrations: A computational approach. J. Fluids Struct. 2022, 108, 103424. [Google Scholar] [CrossRef] [Scilit]
- Ma, X.; Zhou, S. A review of flow-induced vibration energy harvesters. Energy Convers. Manag. 2022, 254, 115223. [Google Scholar] [CrossRef] [Scilit]
- Ma, X.; Litak, G.; Zhou, S. Using 0–1 test to diagnose periodic and chaotic motions of nonlinear vortex-induced vibration energy harvesters. Chaos Solitons Fractals 2025, 192, 116036. [Google Scholar] [CrossRef] [Scilit]
- Li, H.-T.; Ding, H.; Jing, X.-J.; Qin, W.-Y.; Chen, L.-Q. Improving the performance of a tri-stable energy harvester with a staircase-shaped potential well. Mech. Syst. Signal Process. 2021, 159, 107805. [Google Scholar] [CrossRef] [Scilit]
- Wang, G.; Zheng, Y.; Zhu, Q.; Liu, Z.; Zhou, S. Asymmetric tristable energy harvester with a compressible and rotatable magnet-spring oscillating system for energy harvesting enhancement. J. Sound Vib. 2023, 543, 117384. [Google Scholar] [CrossRef] [Scilit]
- Ma, X.Q.; Zhang, H.; Margielewicz, J.; Gąska, D.; Wolszczak, P.; Litak, G.; Zhou, S.X. A dual-beam piezo-magneto-elastic wake-induced vibration energy harvesting system for high-performance wind energy harvesting. Sci. China Technol. Sci. 2024, 67, 221–239. [Google Scholar] [CrossRef] [Scilit]
- Zhou, S.; Zuo, L. Nonlinear dynamic analysis of asymmetric tristable energy harvesters for enhanced energy harvesting. Commun. Nonlinear Sci. Numer. Simul. 2018, 61, 271–284. [Google Scholar] [CrossRef] [Scilit]
- Margielewicz, J.; Gąska, D.; Litak, G.; Caban, J.; Dudziak, A.; Ma, X.; Zhou, S. Energy Harvesting System Whose Potential Is Mapped with the Modified Fibonacci Function. Sensors 2023, 23, 6593. [Google Scholar] [CrossRef] [Scilit]
- Ahmed, S.A.; Litak, G.; Waśkowicz, M.; Ravi, D.; Giri, A.M.; Caban, J. Response of the air flow energy harvester with two side-by-side bluff-bodies of various shapes. J. Ecol. Eng. 2025, 26, 238–249. [Google Scholar] [CrossRef] [Scilit]
- Agarwal, A.; Purohit, A. Performance Evaluation of Flutter-Based Energy Harvester Under Different Vortex Flow Regimes: An Experimental Study. Arab. J. Sci. Eng. 2023, 48, 3491–3501. [Google Scholar] [CrossRef] [Scilit]
- Kim, H.; Kang, S.; Kim, D. Dynamics of a flag behind a bluff body. J. Fluids Struct. 2017, 71, 1–14. [Google Scholar] [CrossRef] [Scilit]
- Feng, L.H.; Hu, Y.W.; Wang, J.J. Flow-structure interactions of multiple inverted flags in different arrangements. Exp. Fluids 2021, 62, 254. [Google Scholar] [CrossRef] [Scilit]
- Shi, T.; Hu, G.; Zou, L.; Song, J.; Kwok, K.C.S. Performance of an omnidirectional piezoelectric wind energy harvester. Wind Energy 2021, 24, 1167–1179. [Google Scholar] [CrossRef] [Scilit]
- Latif, U.; Dowell, E.H.; Uddin, E.; Yamin Younis, M. Parametric aerodynamic and aeroelastic study of a deformable flag-based energy harvester for powering low energy devices. Energy Convers. Manag. 2023, 280, 116846. [Google Scholar] [CrossRef] [Scilit]
- Mehdipour, I.; Madaro, F.; Rizzi, F.; De Vittorio, M. Comprehensive experimental study on bluff body shapes for vortex-induced vibration piezoelectric energy harvesting mechanisms. Energy Convers. Manag. X 2022, 13, 100174. [Google Scholar] [CrossRef] [Scilit]
- Zheng, X.; He, L.; Wang, S.; Liu, X.; Liu, R.; Cheng, G. A review of piezoelectric energy harvesters for harvesting wind energy. Sens. Actuators A Phys. 2023, 352, 114190. [Google Scholar] [CrossRef] [Scilit]
- Pan, J.; Zhang, X.; Cheng, Y.; Zhang, J.; Qin, W. Harvesting both wind energy and vibration energy by a zigzag structure with hybrid magnetic and piezoelectric effects. Mech. Syst. Signal Process. 2025, 224, 112066. [Google Scholar] [CrossRef] [Scilit]
- Francis, S.; Swain, A. Modelling and harnessing energy from flow-induced vibration, particularly VIV and galloping: An explicit review. Ocean Eng. 2024, 312, 119290. [Google Scholar] [CrossRef] [Scilit]
- Sun, W.; Jang, H.; Seok, J. Magnetically coupled piezoelectric galloping-based energy harvester using a tandem configuration. Mech. Syst. Signal Process. 2021, 161, 107952. [Google Scholar] [CrossRef] [Scilit]
- Wang, Q.; Zhou, J.; Wang, K.; Gao, J.; Lin, Q.; Chang, Y.; Xu, D.; Wen, G. Dual-function quasi-zero-stiffness dynamic vibration absorber: Low-frequency vibration mitigation and energy harvesting. Appl. Math. Model. 2023, 116, 636–654. [Google Scholar] [CrossRef] [Scilit]
- Li, M.; Li, X.; Gan, C.; Zeng, J.; Zhao, L.; Ding, H.; Wei, K.; Zou, H. Human motion energy harvesting backpack using quasi-zero stiffness mechanism. Energy Convers. Manag. 2023, 288, 117158. [Google Scholar] [CrossRef] [Scilit]
- Badrinath, S.; Bose, C.; Sarkar, S. Identifying the route to chaos in the flow past a flapping airfoil. Eur. J. Mech.—B/Fluids 2017, 66, 38–59. [Google Scholar] [CrossRef] [Scilit]
- Margielewicz, J.; Gąska, D.; Bucki, S.; Litak, G.; Sadasivan, S. Multiple solutions and orbit change in energy harvesting system with a flag configuration. Nonlinear Dyn. 2024, 113, 7879–7899. [Google Scholar] [CrossRef] [Scilit]
- Litak, G.; Margielewicz, J.; Gąska, D.; Wolszczak, P.; Zhou, S. Multiple Solutions of the Tristable Energy Harvester. Energies 2021, 14, 1284. [Google Scholar] [CrossRef] [Scilit]
- Karnopp, D.C.; Margolis, D.L.; Rosenberg, R.C. System Dynamics: Modeling, Simulation, and Control of Mechatronic Systems, 5th ed.; John Wiley & Sons: Hoboken, NJ, USA, 2012. [Google Scholar] [CrossRef] [Scilit]
- Cattani, M.; Caldas, I.L.; de Souza, S.L.; Iarosz, K.C.; Stefanski, A.; Dabrowski, A.; Kapitaniak, T. Deterministic Chaos Theory: Basic Concepts. Rev. Bras. Ensino Física 2016, 39, 1–13. [Google Scholar] [CrossRef] [Scilit]

Disclaimer/Publisher’s Note: The statements, opinions and data contained in all publications are solely those of the individual author(s) and contributor(s) and not of MDPI and/or the editor(s). MDPI and/or the editor(s) disclaim responsibility for any injury to people or property resulting from any ideas, methods, instructions or products referred to in the content. |
© 2026 by the authors. Licensee MDPI, Basel, Switzerland. This article is an open access article distributed under the terms and conditions of the Creative Commons Attribution (CC BY) license.