1. Introduction
Although there is broad and in-depth research on indoor thermal comfort, there is little research and few applied studies on comfort in the external environment [
1,
2,
3,
4,
5,
6]. The latter is of crucial importance in the face of global warming (GW) and urban heat island (UHIs) effects. Adaptive comfort models are particularly important, especially if developed in relation to the variability of environmental conditions in space (urban-built, green, or other natures and intended uses) and in time (i.e., impulsiveness and unpredictability of the variation in external forcings and ongoing climate change) [
7,
8,
9,
10].
As a matter of fact, they can be effective tools for guiding urban planning, building design and energy efficiency interventions on existing ones, and for UHI mitigation and responsive solutions for climate change mitigation and adaptation. Some studies have highlighted the importance of green areas as a temperature regulating factor for thermal comfort and physical and psychological well-being, promoting ecological sustainability [
11,
12].
The environmental sustainability of any urban area is a complex process that requires a systemic approach based on applied thermodynamics, advanced digital technologies, robust computational tools, digital data, and wide climatic and thermo-physical monitoring campaigns. At present, there are many techniques of modelling and mapping the different energy uses at the urban-scale, connected to different Physiological Environmental Temperature (PET) assessments [
13,
14,
15,
16]. Given the complexity of any urban live context, both modelling and mapping techniques are frequently integrated in order to detect the multiscale information that is needed to potentially be used for environmental energy, combined with PET prediction, assessment, and risk analysis [
17,
18]. For modelling research on improvement, they are typically focused on (i) mesoscale models, (ii) large eddy simulation models, and (iii) urban canopy models [
19,
20,
21,
22], with increasing space precision quality, respectively. Therefore, in many studies, the multiscale approach has been integrated while analysing (i) satellite thermal images, (ii) fixed networks of weather stations, and (iii) transect measurement campaigns, with increasing data granularity [
23,
24,
25,
26].
Recent research has shown the importance of PET mapping for studying human thermal perception considering microclimatic conditions’ variation, the urban environment combining thermo-physiological parameters that refer to the human body energy balance [
27]. The authors have used artificial neural networks to determine nonlinear dependencies and complex synergistic interactions between variables, resulting in an improved model fit and error reduction.
Another study, using Copernicus Climate Change Service Era 5 reanalysis and collected microclimatic data, has highlighted how thermal stress and perceived comfort are strictly connected to city morphology, i.e., with low-, medium-, and high-rise compact urban areas, densely wooded areas, scattered trees areas, and large low-rise urban built-up areas with a high and low greenery presence causing thermal discomfort, with higher UHI effects [
28]. Furthermore, the literature research [
29] has demonstrated that the proposed Modified Physiologically Environmental Temperature (mPET) allows for a universal application across a variety of climate zones. The authors have confirmed that the mPET model improves PET’s weaknesses by accounting for humidity and the varying thermal resistance of clothing, providing more realistic core and average skin temperatures than the PET model. They have compared the results obtained with PET, mPET, and Universal Thermal Climate Index (UTCI) modelling, again showing that mPET provides a more realistic estimate of human thermal sensation and heat stress.
This research enriches the physical concept DCV, used for energy and entropy urban analyses connected to urban morphology, environmental energy performances, and socio-economic policies [
30]. The DCV represents a three-dimensional georeferenced thermodynamic system (from a single block to an entire neighbourhood) where the urban fabric is modelled as interconnected volumes matching spatial, energy, and environmental information in real time. Its vertical extension includes the canopy layer, where microclimatic variability is higher, allowing cities to be analysed as open thermodynamic systems in which energy and mass flows continuously interact across scales [
31].
In this context, the Florence Nova district was selected as a pilot site and divided into DCVs based on building typology, construction age, and morphology, using georeferenced municipal and national datasets (e.g., ISTAT, Systems Registry, Fire Brigade, Civil Protection). This study proposes a useful method for outdoor comfort evaluation at a district scale, based on the energy form of built-up areas and hyperlocal climatic conditions.
The core of this approach lies in the integration of heterogeneous data sources to bridge the gap between the discrete and continuous spatial scale. By establishing a physical correlation between hyperlocal point measurements and aerial thermography, the method links the surface temperature field to local temperature, enabling a spatial distributed representation of the Virtual Physiological Environmental Temperature (from here on, PET*) across the entire surveyed area. This approach allows for a significant scale-up of urban thermal analysis while maintaining a connection to the physics of local environmental phenomena and their synergistic effects.
The method is easy to apply in different climatic and urban contexts and at different scales, i.e., from open spaces to neighbourhoods to single buildings, allowing us to obtain a distributed PET mapping.
The main results highlighted that the proposed method can predict thermal sensation and adaptation, taking into account the effects of climate change in relation to the variability of different urban built-up forms and different greenery presences.
The findings also highlighted the method’s effectiveness for evaluating solutions for outdoor quality, starting from a rational thermodynamic control of the external environment of urban areas (built-up areas, green areas, infrastructures, advanced technologies, ecosystems services, nature-based solutions, etc.) as a function of the PET distribution at a hyperlocal scale.
In particular, the presented method provides basic parameters that can be easily integrated with BIG DATA sources (such as the Copernicus data store) and local, ancillary datasets, currently available from local municipalities, while furnishing and providing a broader measure of urban sustainability.
The robustness and reliability of the method were tested by means of experimental measurements on the investigated urban area, chosen as a prototype of the whole metropolitan area of Florence.
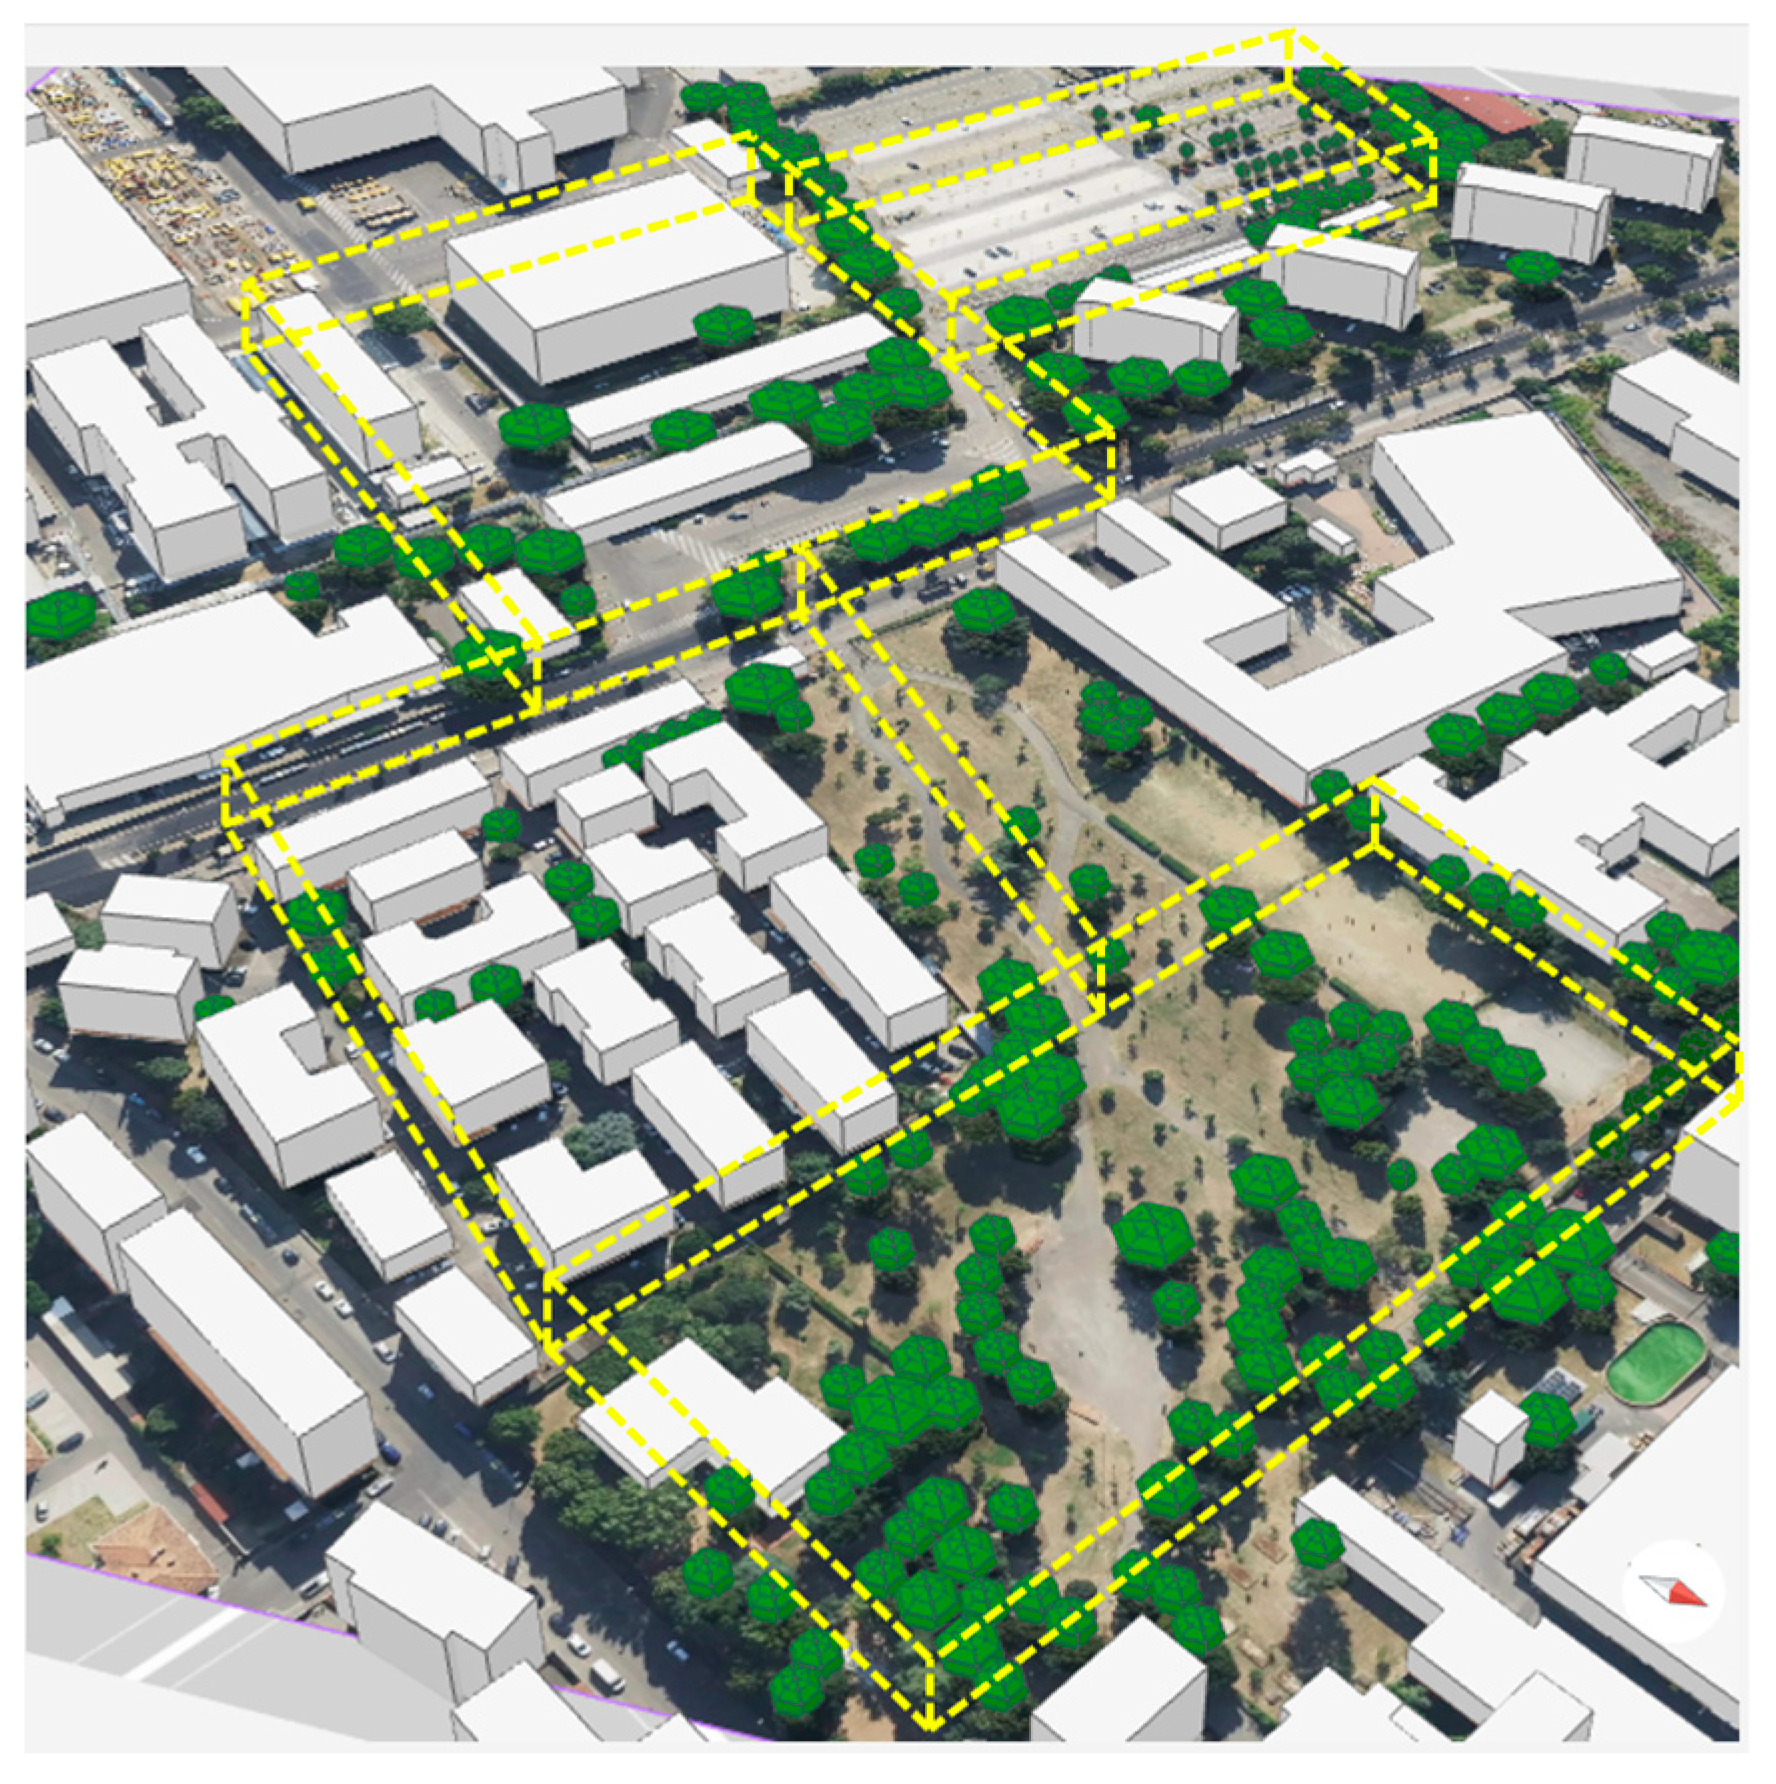
The results highlight the crucial importance and necessity of a multisensory and multiscale analysis framework for future DCV-based urban modelling with a focus on thermal comfort and proactive responsible sustainability for resilient cities. An example of the DCV approach for the present study is shown in
Figure 1. The city districts can be divided into coherent DCVs where the information of buildings and greenery is included and modelled for the analysis of mass and energy balances in order to understand the complex dynamics of the urban context.
2. The Method: Spatial Modelling of Thermal Comfort by Means of Multiple Measurement Techniques
Urban thermal comfort is the result of a complex interaction between microclimatic forcing, urban morphology, and human physio-psychological responses [
29]. To quantify the actual thermal stress experienced by citizens under typical external conditions, we adopted an integrated approach to thermal comfort, combining microclimatic monitoring, physiological measurements, and human bio-meteorological indices: the PET [
16] and the UTCI [
32]. Both indices are derived from the fundamental human energy balance, albeit through different levels of physiological complexity, and are internationally recognized for external comfort assessments in accordance with ISO standards and the recent bio-meteorological literature [
33]. These models provide a physically and physiologically consistent estimate of the stress imposed on the human body by the external environment and are widely used in urban climatology, biometeorology, and environmental ergonomics.
The proposed methodological approach, based on hyperlocal microclimatic measurements, drone flights, and outdoor thermal comfort modelling, was implemented in the urban area of Florence’s Nova district, divided into DCVs (
Figure 1). The method allows us to determine a scaling relationship through a three-step approach. At first, hyperlocal point measurements of atmospheric variables were collected. These data served as the basis for calculating physiological comfort indices at specific locations, identifying the key environmental parameters that most accurately represent local radiative thermal stress.
Consequently, aerial drone flights were conducted to acquire high-resolution, spatially continuous thermal data. By synchronizing these flights with ground-based monitoring, a physical correlation was established between the remote sensing data and local microclimatic variables.
Finally, this correlation was used as a scaling-up tool: the relationships found between point-based and aerial measurements allowed for the extension of the physiological comfort indices into a spatially distributed field. This integrated process enables the transition from discrete, local-scale information to a widespread thermodynamic characterization of the entire district.
To represent actual pedestrian exposure conditions, different measurement techniques were adopted in a set of human-centred urban hotspots characterized by distinct combinations of surface materials and radiative environments. Unlike conventional morphological classifications—such as the widely adopted Local Climate Zones (LCZs), which are primarily surface- and structure-oriented [
34]—the taxonomy adopted focuses on radiative and thermodynamic loads acting on the human body, distinguishing contexts based on (i) surface-induced microclimatic forcing and (ii) direct or obstructed exposure to short-waves. This choice reflects a conceptual shift from a morphology-centric to an exposure-centric classification, explicitly aligned with human energy budget drives and outdoor pedestrian experiences.
Different local configurations were studied in a pilot project within the EU-LIFE Project ESCAPOS (see
Section 3). In particular, five scenarios were investigated considering a surface of about 0.15 km
2, situated in the Nova district of the city of Florence, asphalt–sun, asphalt–shade, green–sun, green–shade, and urban canyoning, representing the typical conditions in which a citizen may be located. The first label (asphalt or green) indicates the morphological characteristic of the land, including on a sidewalk or an asphalt road, in a park, or in a city forest. The second condition instead indicates whether the subject’s body is entirely in the sun or in the shade, which, depending on the type of material on the ground, means either a natural (trees) or an artificial (buildings) shade. To these four combinations, a fifth has been added, typical in urban centres or residential neighbourhoods, characterized by narrow, typically asphalted streets lined with buildings. The sun/shade configuration here is highly variable, but the presence and orientation of the buildings play a critical role, especially for shade generation, radiative release, and convective heat exchange with the surrounding air.
2.1. Data Collection with Hyperlocal Measurements
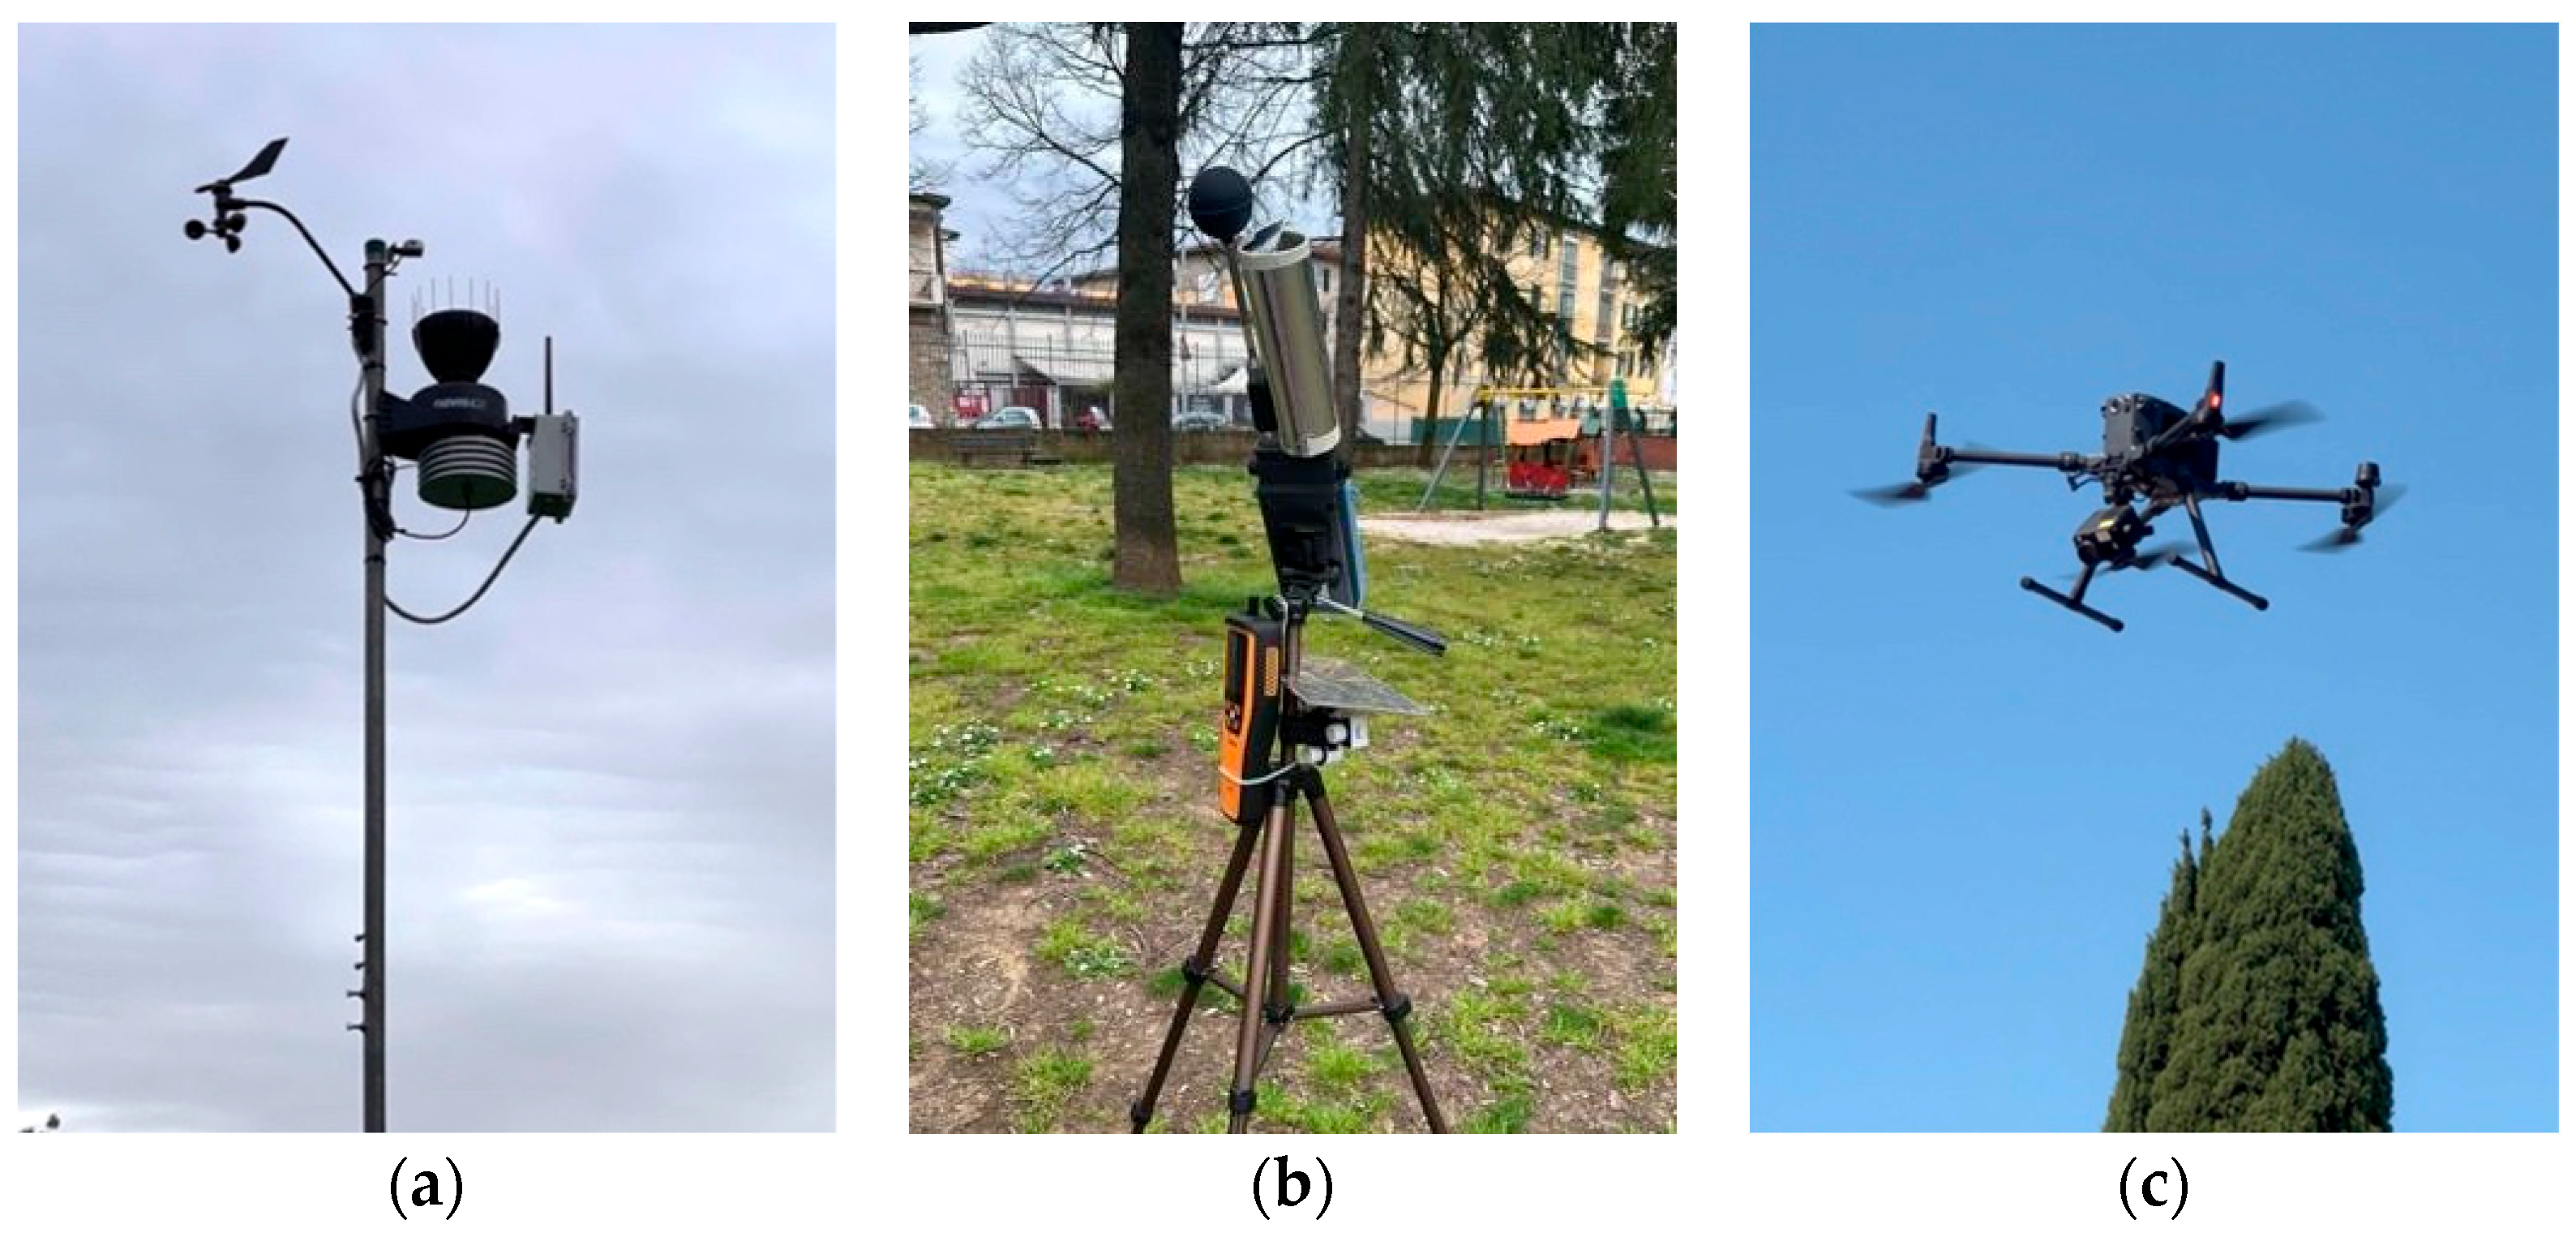
As mentioned above, integrated microclimatic measurement techniques were implemented through a multidomain matching in the studied district. First of all, two fixed weather stations (
Figure 2a) were deployed at a distance of about 250 m from each other to provide continuous data on the overall atmospheric boundary conditions: ambient temperature
Taw [°C], relative humidity
RHw [%], global irradiation from the sun on the horizontal
I [W/m
2], wind direction [°] and velocity
W [m/s], and rainfall
P [mm]. All data were synchronized and aggregated into uniform 1 h time steps.
To capture the hyperlocal microclimate in the five different scenarios, a suite of portable instruments was used (
Figure 2b). In this case, the set of sensors was defined with the proper characteristics and accuracy according to the standards for indoor comfort evaluations [
35], adding the possibility of associating the acquired parameters with the geographical coordinates and time of logging (one of the sensors acts as a reference for the others and connects with the GPS of a mobile phone). In detail, the measured values are related to air temperature
Ta [°C], relative humidity
RH [%], black globe temperature
Tg [°C], CO
2 concentration [ppm], Particulate Matter (PM2.5 and PM10) [μg/m
3] and Volatile Organic Compounds, VOC [ppm]. Data were recorded with a time step of 1 s.
The measurement campaign was carried out, identifying and investigating some walking routes, repeated for 3 weeks between June and July 2025 in the middle hours of hot days. Every route took about 1 h and passed through some relevant hotspots from a thermal comfort point of view; the hotspots were then classified into the previously mentioned scenarios according to the ground material (asphalt/green) and sun exposure (sun/shade/urban canyoning). Each hotspot was characterized through a 15 min stop to ensure the achievement of thermal equilibrium by all the used sensors.
The final stage of the methodological approach involves generalizing the collected measurements beyond the specific routes. This allows for the derivation of the relevant parameters over a broader extended area, which can be used as an intermediate step for the subsequent development of scaling-up procedures across the entire urban area.
For this focus, drone measurements were implemented, integrating aerial photogrammetry, thermography techniques, and LIDAR (not considered in the present study). The Unmanned Aerial System’s instrumentation, UAS (
Figure 3), provides further georeferenced data which could be used to generate orthophotos, high-resolution 3D models (Digital Surface Models), and thermal radiance maps. This information is essential for analysing the temperature distribution within the urban context and assessing the thermal effects of greenery and building materials. In
Section 2.3, the matching and integration processes of the different measurement techniques are explained in detail.
2.2. Thermal Comfort Modelling
The measurement campaign along the routes allowed for the collection of a large dataset of the monitored environmental parameters, which was then elaborated on to obtain the outdoor comfort indices. In particular, in this section, only the data concerning thermal effects were taken into account, i.e., air and surface temperature, relative humidity, wind velocity, etc., neglecting the parameters connected to air quality.
PET was derived from the well-known Munich Energy Balance Model for Individuals (MEMI), where thermal comfort arises from the steady-state solution of the human energy balance under standardized internal heat production and clothing insulation [
16]. The energy balance is expressed as follows:
where
M is metabolic heat production,
Wmec is mechanical work,
R is net radiation flux,
C is convective flux,
Esk is evaporative heat loss from the skin,
Eres and
Cres are latent and sensible heat exchanges through respiration, and
S is body heat storage. PET corresponds to the air temperature in a reference indoor environment that yields the same core and skin temperatures as the actual outdoor condition. Operationally, PET provides a temperature-equivalent interpretation of outdoor thermal stress, facilitating comparative analyses across sites and scenarios.
On the other side, UTCI is defined as the air temperature of a reference environment that produces an equivalent thermo-physiological response, as computed through the UTCI-Fiala multinode model, which dynamically simulates heat transfer, vasomotion, sweating, shivering, and clothing heat resistance [
36]. The model is formulated through a time-dependent thermoregulation equation:
where
Ereq denotes the required evaporative heat loss to maintain thermo-physiological equilibrium, written as function of internal (
Tcore) and skin temperature (
Tskin), clothing insulation (
Icl), and atmospheric conditions like air temperature (
Ta), mean radiant temperature (
Tr), and relative humidity (
RH).
Unlike PET, UTCI accounts for non-steady-state responses and transient microclimatic changes, making it particularly suitable for outdoor pedestrian environments affected by shading transitions, ventilation gradients, and radiative asymmetries.
Both PET and UTCI are strongly governed by the mean radiant temperature, which quantifies the combined radiative load from short-wave and long-wave fluxes impinging on the human body. Following the International Standard [
35],
Tr was derived from the black globe thermometer measurements as follows (in the presence and absence of wind, respectively):
where
Tg is the black globe temperature,
Ta is the air temperature,
W is the air velocity,
D is the black globe diameter (0.05 m in our case), and
εg is the globe emissivity (0.95). As demonstrated [
37],
Tr is typically the dominant driver of outdoor thermal stress, especially in urban canyons where geometric enclosures modulate the radiative field through multiple reflections and long-wave trapping.
2.3. Data Elaboration Process
The measured parameters were post-processed for the parameter assessment used in the balances of
Section 2.1. Hotspot data were then selected and filtered, averaging the last 5 min after checking the equilibrium reached, with a type A error of less than 0.5% for all the quantities. Among the different information, ambient temperature
Ta [°C], relative humidity
RH [%], and black globe temperature
Tg [°C] were extrapolated from the portable sensors, and the wind velocity
W [m/s] was extrapolated from the weather stations.
In particular, no significant variability was found between the two stations installed in the investigated area. The wind velocity was corrected to estimate the correct value at 1.5 m from the ground (the position of the portable sensors, while the stations are about 10 m in height) with a logarithmic law according to [
38], with the von Karman constant equal to 0.01. PET and UTCI were directly evaluated for all the hotspots, creating a spatial, yet discrete, matrix of information related to outdoor thermal comfort for specific scattered points.
With the objective of extending the analysis and obtaining a “continuous” distribution of the indices, the drone measurements were integrated and combined by flying over the area of the routes and recording images through the thermal camera mounted on the UAS. Such images are georeferenced and contain the information of the radiative heat emitted by the ground (and the materials above it), captured by the camera lens in the infrared region. The photos underwent multiple processes of elaboration, combining commercial software tools (DJI Thermal Analysis Tool version.3) with codes compiled in a Python environment (v3.13), alignment, filtering/converting pixel values, and masking algorithms, to derive the temperature at the ground level. The majority of the objects above it were excluded using the ExcessGreen Index (
ExG) [
39], which drives a segmentation analysis based on RGB space. This index is defined as follows:
where
G,
R, and
B represent the values in the green, red, and blue channels, respectively. By opportunely setting the ranges of
ExG values, it was possible to easily recognize the buildings (
ExG in (200,240)) and the trees/bushes (
ExG in (30,100)).
Since it was not possible to automatically separate the ground cover materials such as asphalt, grass, and compacted aggregate, an average emissivity value of 0.94 (ranging from 0.9 for dry soil to 0.98 for grass, passing through 0.95 for asphalt [
40,
41]) was applied to the export parameters of the thermal camera images. The other calibration parameters (surrounding temperature and relative humidity) were retrieved from the weather station, and the distance from the ground was taken directly from the drone.
Therefore, the described processing led to the calculation of the ground temperature captured by the drone, Td. This temperature, from a physical point of view, can conceptually be analogous to the one recorded by a globe thermometer, Tg, as both are the result of the combination of ambient temperature and the (solar and non-solar) radiation reaching the measurement point. For that reason, the values in the pixels around the hotspots and the portable sensor outputs were compared at the same time of the day, finding a good matching between them (with a regression coefficient of 0.86; see next paragraph for details). The correlation therefore allowed for the use of the temperature measured during the drone flights to calculate a new, distributed radiant temperature in Equations (3) and (4). Consequently, by re-establishing the balances of Equations (1) and (2), it was also possible to obtain the PET spatially spread across the entire surveyed area, thus characterizing it in terms of comfort levels during hot summer hours. In the next chapter, the application of the method to a real case study, i.e., the pilot project, is extensively explained in detail.
3. Implementation of the Pilot Project
The proposed method was applied over the global area of Firenze Nova (Florence), Tuscany, a region in central-northern Italy and the test area of the EU ESCAPOS-LIFE project.
Specifically, it enriches and develops the concept of Dynamic Control Volume (DCV), used for energy and entropy urban analyses connected to urban morphology, environmental energy performance, and socio-economic policies, through which the project finds its crucial fundamental real improvements of the literature research [
30]. In particular, referring to [
31], the DCV represents a three-dimensional georeferenced thermodynamic system (from a single block to an entire neighbourhood) where any urban built-up area can be modelled as interconnected volumes connecting spatial, energy, and environmental information in real time. Its vertical extension includes the canopy layer, where microclimatic variability is higher, allowing cities to be analysed as open thermodynamic systems in which energy and mass flows continuously interact. Furthermore, the characteristics of the pilot area and the associated hotspots were chosen so as not to impact the proposed method and the experimental/modelling procedures.
Following the Köppen–Geiger classification [
42,
43], Florence lies on the boundary between the humid subtropical (
Cfa) and the hot-summer Mediterranean (
Csa) climate zones, characterized by mild, wet winters with precipitation from mid-latitude cyclones and hot, muggy summers with thunderstorms. The city’s seasonality is moderate, with distinct hot and cool seasons. Therefore, its climate is typical of the Mediterranean area at a medium-low latitude.
According to the Consorzio LAMMA [
44], data collected from 1991 to 2020 show an annual mean temperature of 15.5 °C, which increases to 24.5 °C when considering only the summer period. The record minimum and maximum temperatures observed were −10.2 °C (30 December 2005) and 41.3 °C (1 August 2017), respectively. Typical relative humidity values are around 70%, with a peak of 80% in the winter period and a minimum average value of 65% in July. The predominant wind direction during winter is south-westerly (SW), with typical speeds of 10–12 km/h.
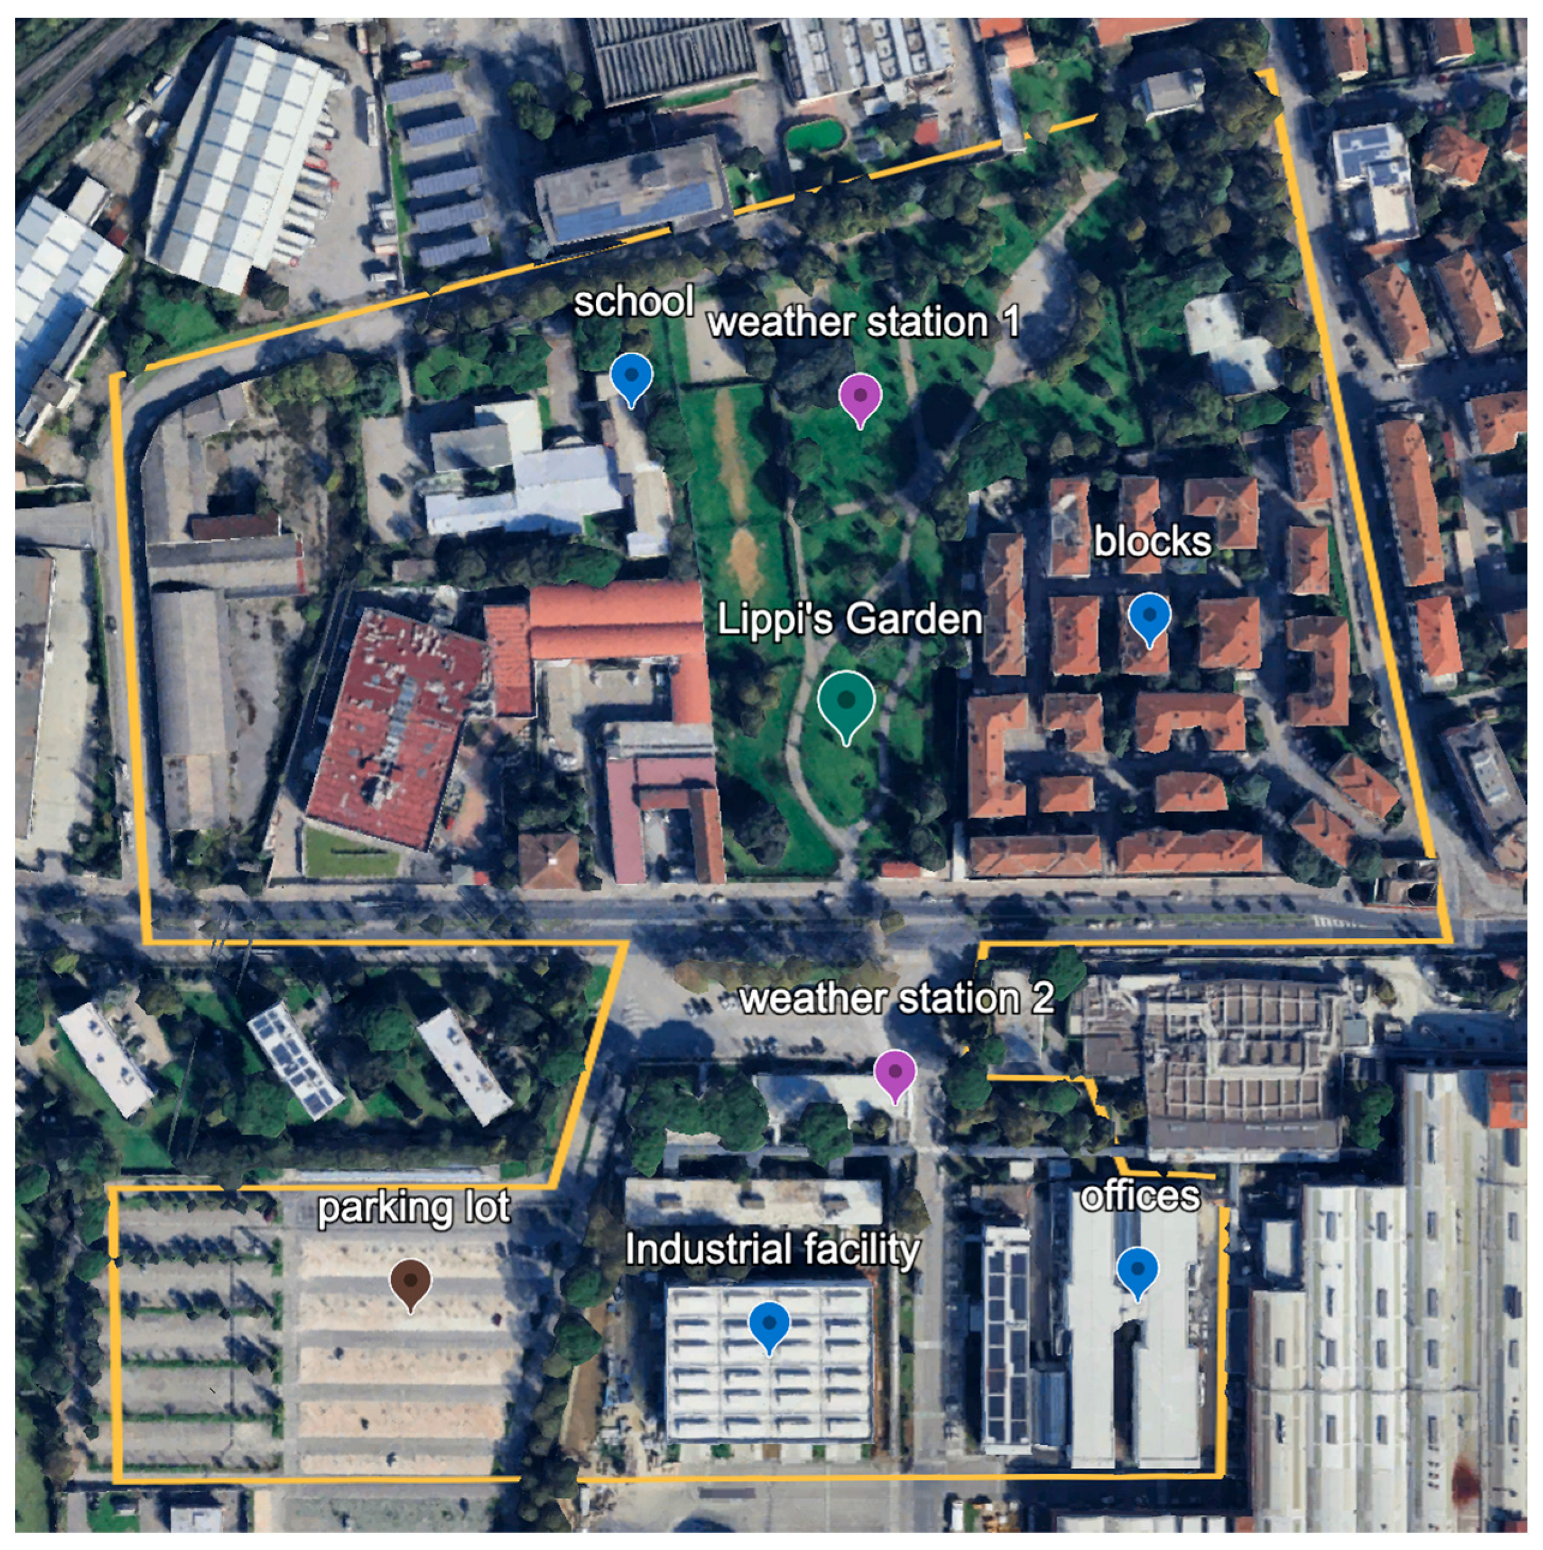
The studied area (
Figure 2) is specifically located at the geographic coordinates 43°48′ 23.472′′ N, 11°13′ 40′′ E, which has a mean altitude of 50 m above sea level and covers an area of 0.15 km
2. It is characterized by a large public garden (Lippi’s Garden), a green parkland where different species of trees are located—old trees over 20 m in height, younger trees, or species of smaller dimensions (6–8 m)—and asphalted pedestrian zones.
In particular, the tree species in the Lippi’s Garden are those widely distributed in Florence, such as
Tilia x europaea,
Quercus ilex,
Fraxinus excelsior,
Celtis australis, and
Pinus pinea. The Municipality and the Environmental Directorate, to maximize ecosystem services for the protection of the environment and biodiversity, will plant the species identified by a key reference at the regional level [
45].
The garden is embedded within an urban area featuring residential buildings, which create typical urban canyoning effects. A nursery school is in the north-western part, and a large industrial area is in the south-western part, both included in the study area. The surrounding streets alternate among wide, tree-lined avenues and narrower roads.
3.1. Hyperlocal Data Collection and Processing
The methodological framework of this research study integrates high-resolution environmental monitoring to assess human responses to different urban microclimates.
As mentioned before, the project first involved the installation of two weather stations as a reference for atmospheric boundary conditions: one in the park and one in the industrial area (shown in purple in
Figure 3). However, no appreciable differences were found compared to the accuracy of the standard sensors they are equipped with, so the former was not used due to some interruptions in recording for maintenance.
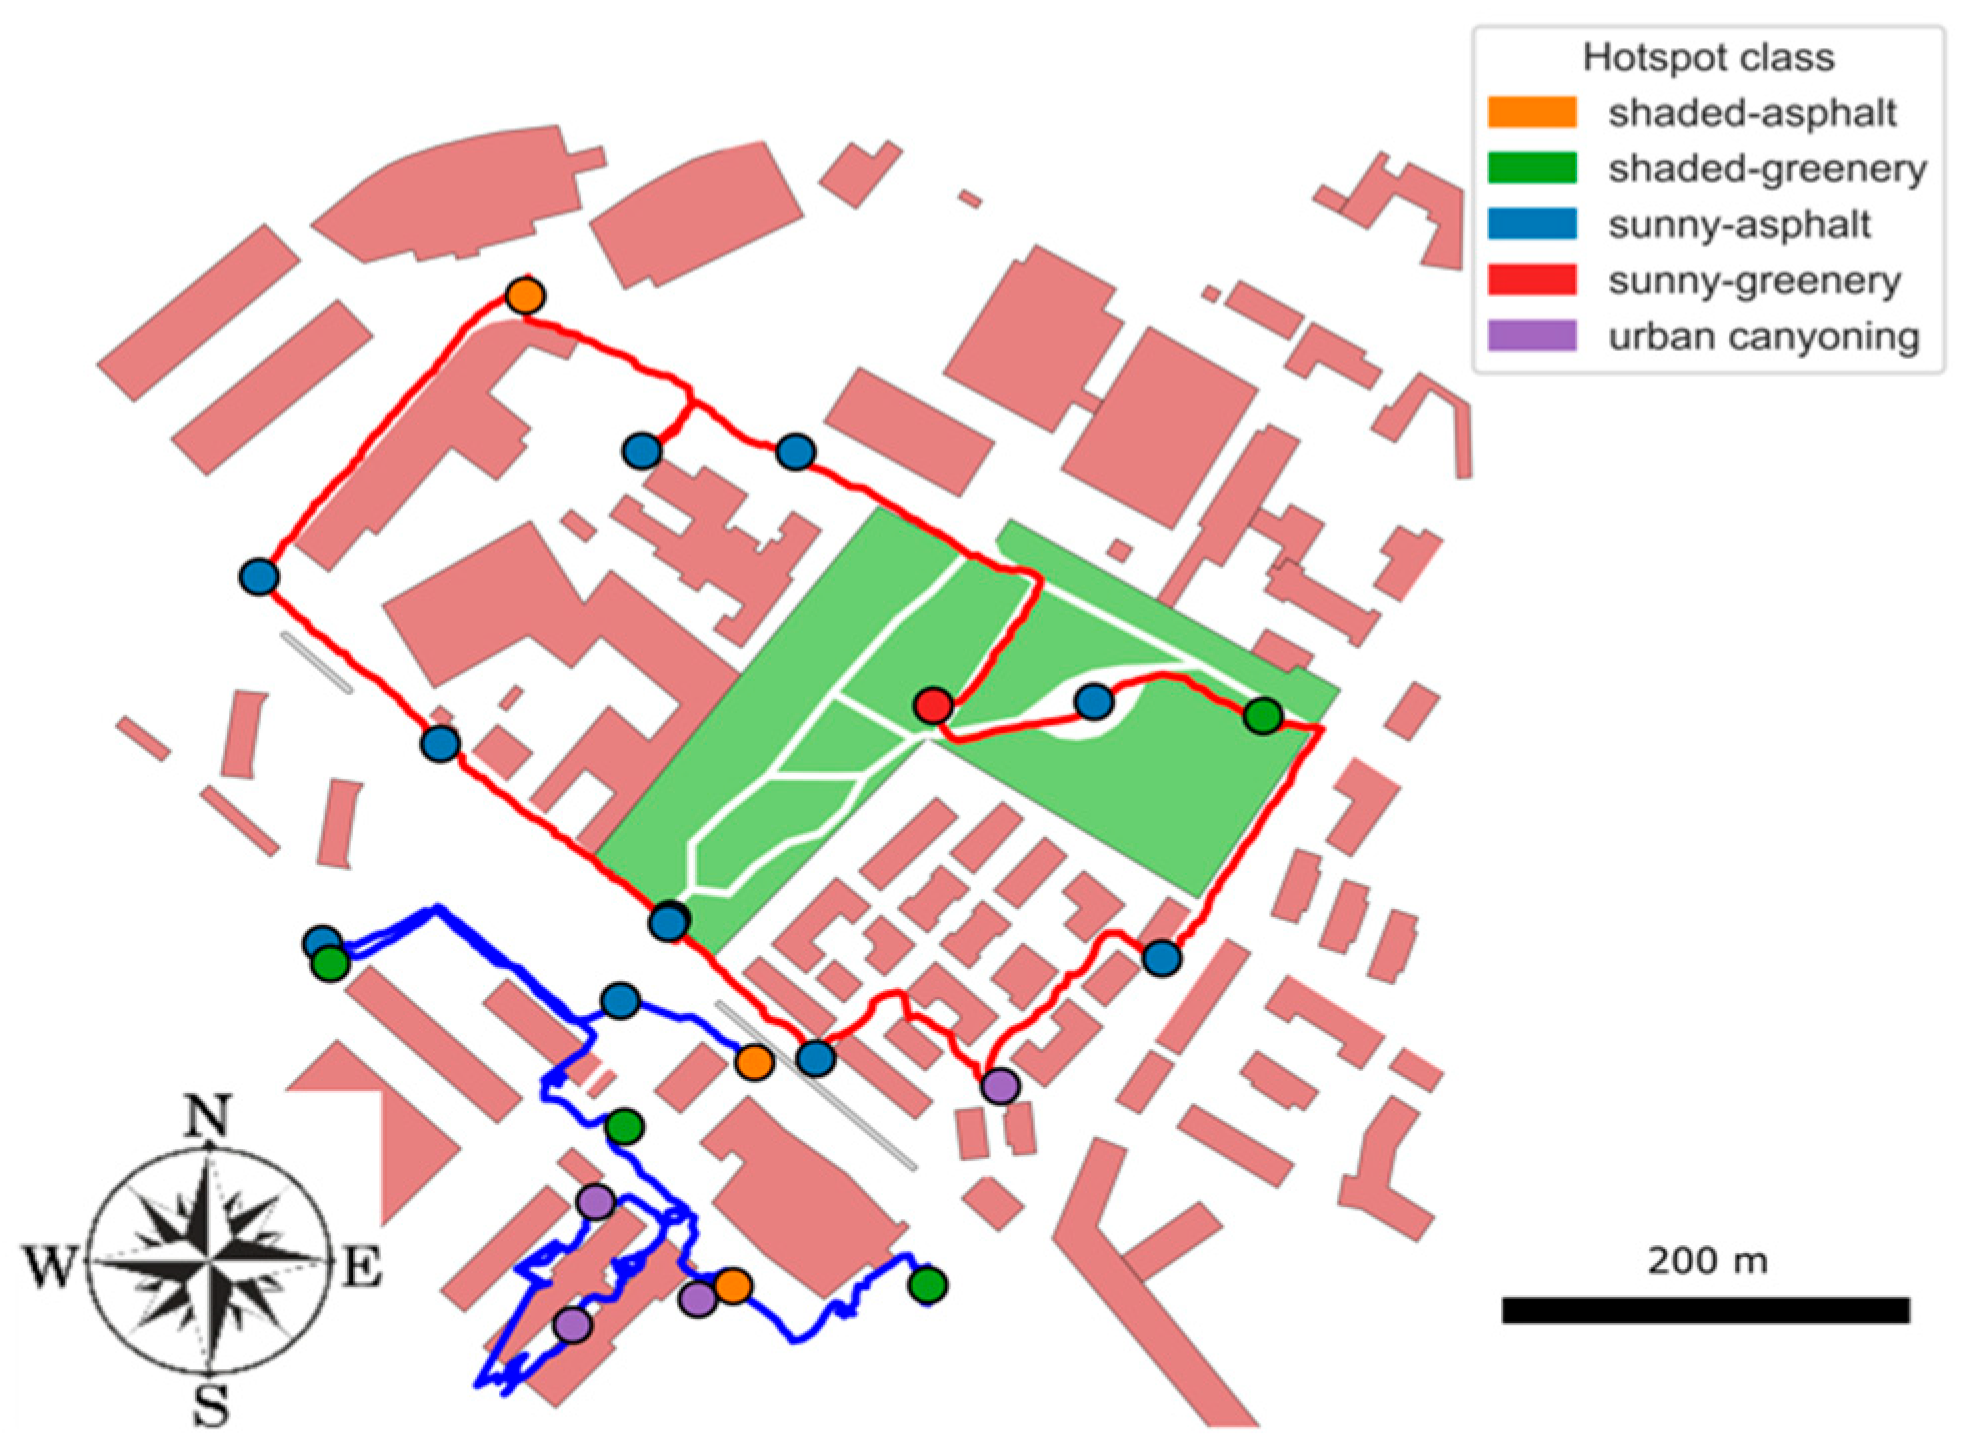
Then, two routes (
Figure 4) were specifically designed to acquire measurements with the portable equipment at pre-established points, or hotspots, characterized by distinct and contrasting environmental conditions. The hotspots were selected to represent the five typical urban scenarios previously described, ensuring an alternation among different conditions in the ground materials and sun exposure.
The first route involved the public garden, the adjacent building blocks, the school, and the main street of the district (in red on
Figure 4). The second one started from the same street and went further into the industrial site of the Nuovo Pignone facility, passing through a parking lot, common areas within the offices, and an internal square (in blue in
Figure 4).
The routes were followed thanks to the
Open GPX Tracker (version variable with device OS Windows11), application, recording latitude, longitude, and altitude. The app was also used to create time markers indicating the start and end of the acquisition interval at each hotspot, facilitating subsequent data alignment. To reach the steadiness of each measured parameter, a 15 min logging period was set. In
Figure 4, the hotspots are highlighted by colours related to the five chosen scenarios.
The measurement sessions with the portable sensors were carried out from June to August 2025, with the replication of the shown routes. Among all sessions, four sessions were selected for each path, corresponding to extreme atmospheric conditions (the hottest and worst ones for human comfort), i.e., with clear skies and light winds. Data derived from the different instruments were standardized and averaged to obtain a complete dataset per hotspot during each session. For weather data, the values acquired from the spatially closest station were selected. The average, maximum, minimum, and median values of all tests are given in
Table 1 for the main parameters of interests.
From this dataset, using the balances and equations from
Section 2.2, PET and UTCI indicators were calculated for each individual measurement hotspot thanks to a precompiled and open source Python package [
46]. The MEMI model also requires, in addition to environmental data, some physiological and personal parameters, such as age, height, weight, sex, metabolite activity, and quantity of clothes worn. A 25-year-old man with a height of 1.80 m and weight of 75 kg in a standing position, who performs zero external work (W = 0), was considered: these boundary values correspond to a metabolic rate level of 1.6 met. Referring to summer conditions, a clothing insulation average value of 0.4 clo was chosen. A sensitivity analysis was also performed showing that, as some of these parameters change (sex, age, height, weight) within plausible ranges, there is a corresponding variation in PET in the order of one degree, which therefore does not substantially impact on the results. The comparisons of the indicators, obtained across the entire dataset and aggregated in different classes, are provided in
Table 2.
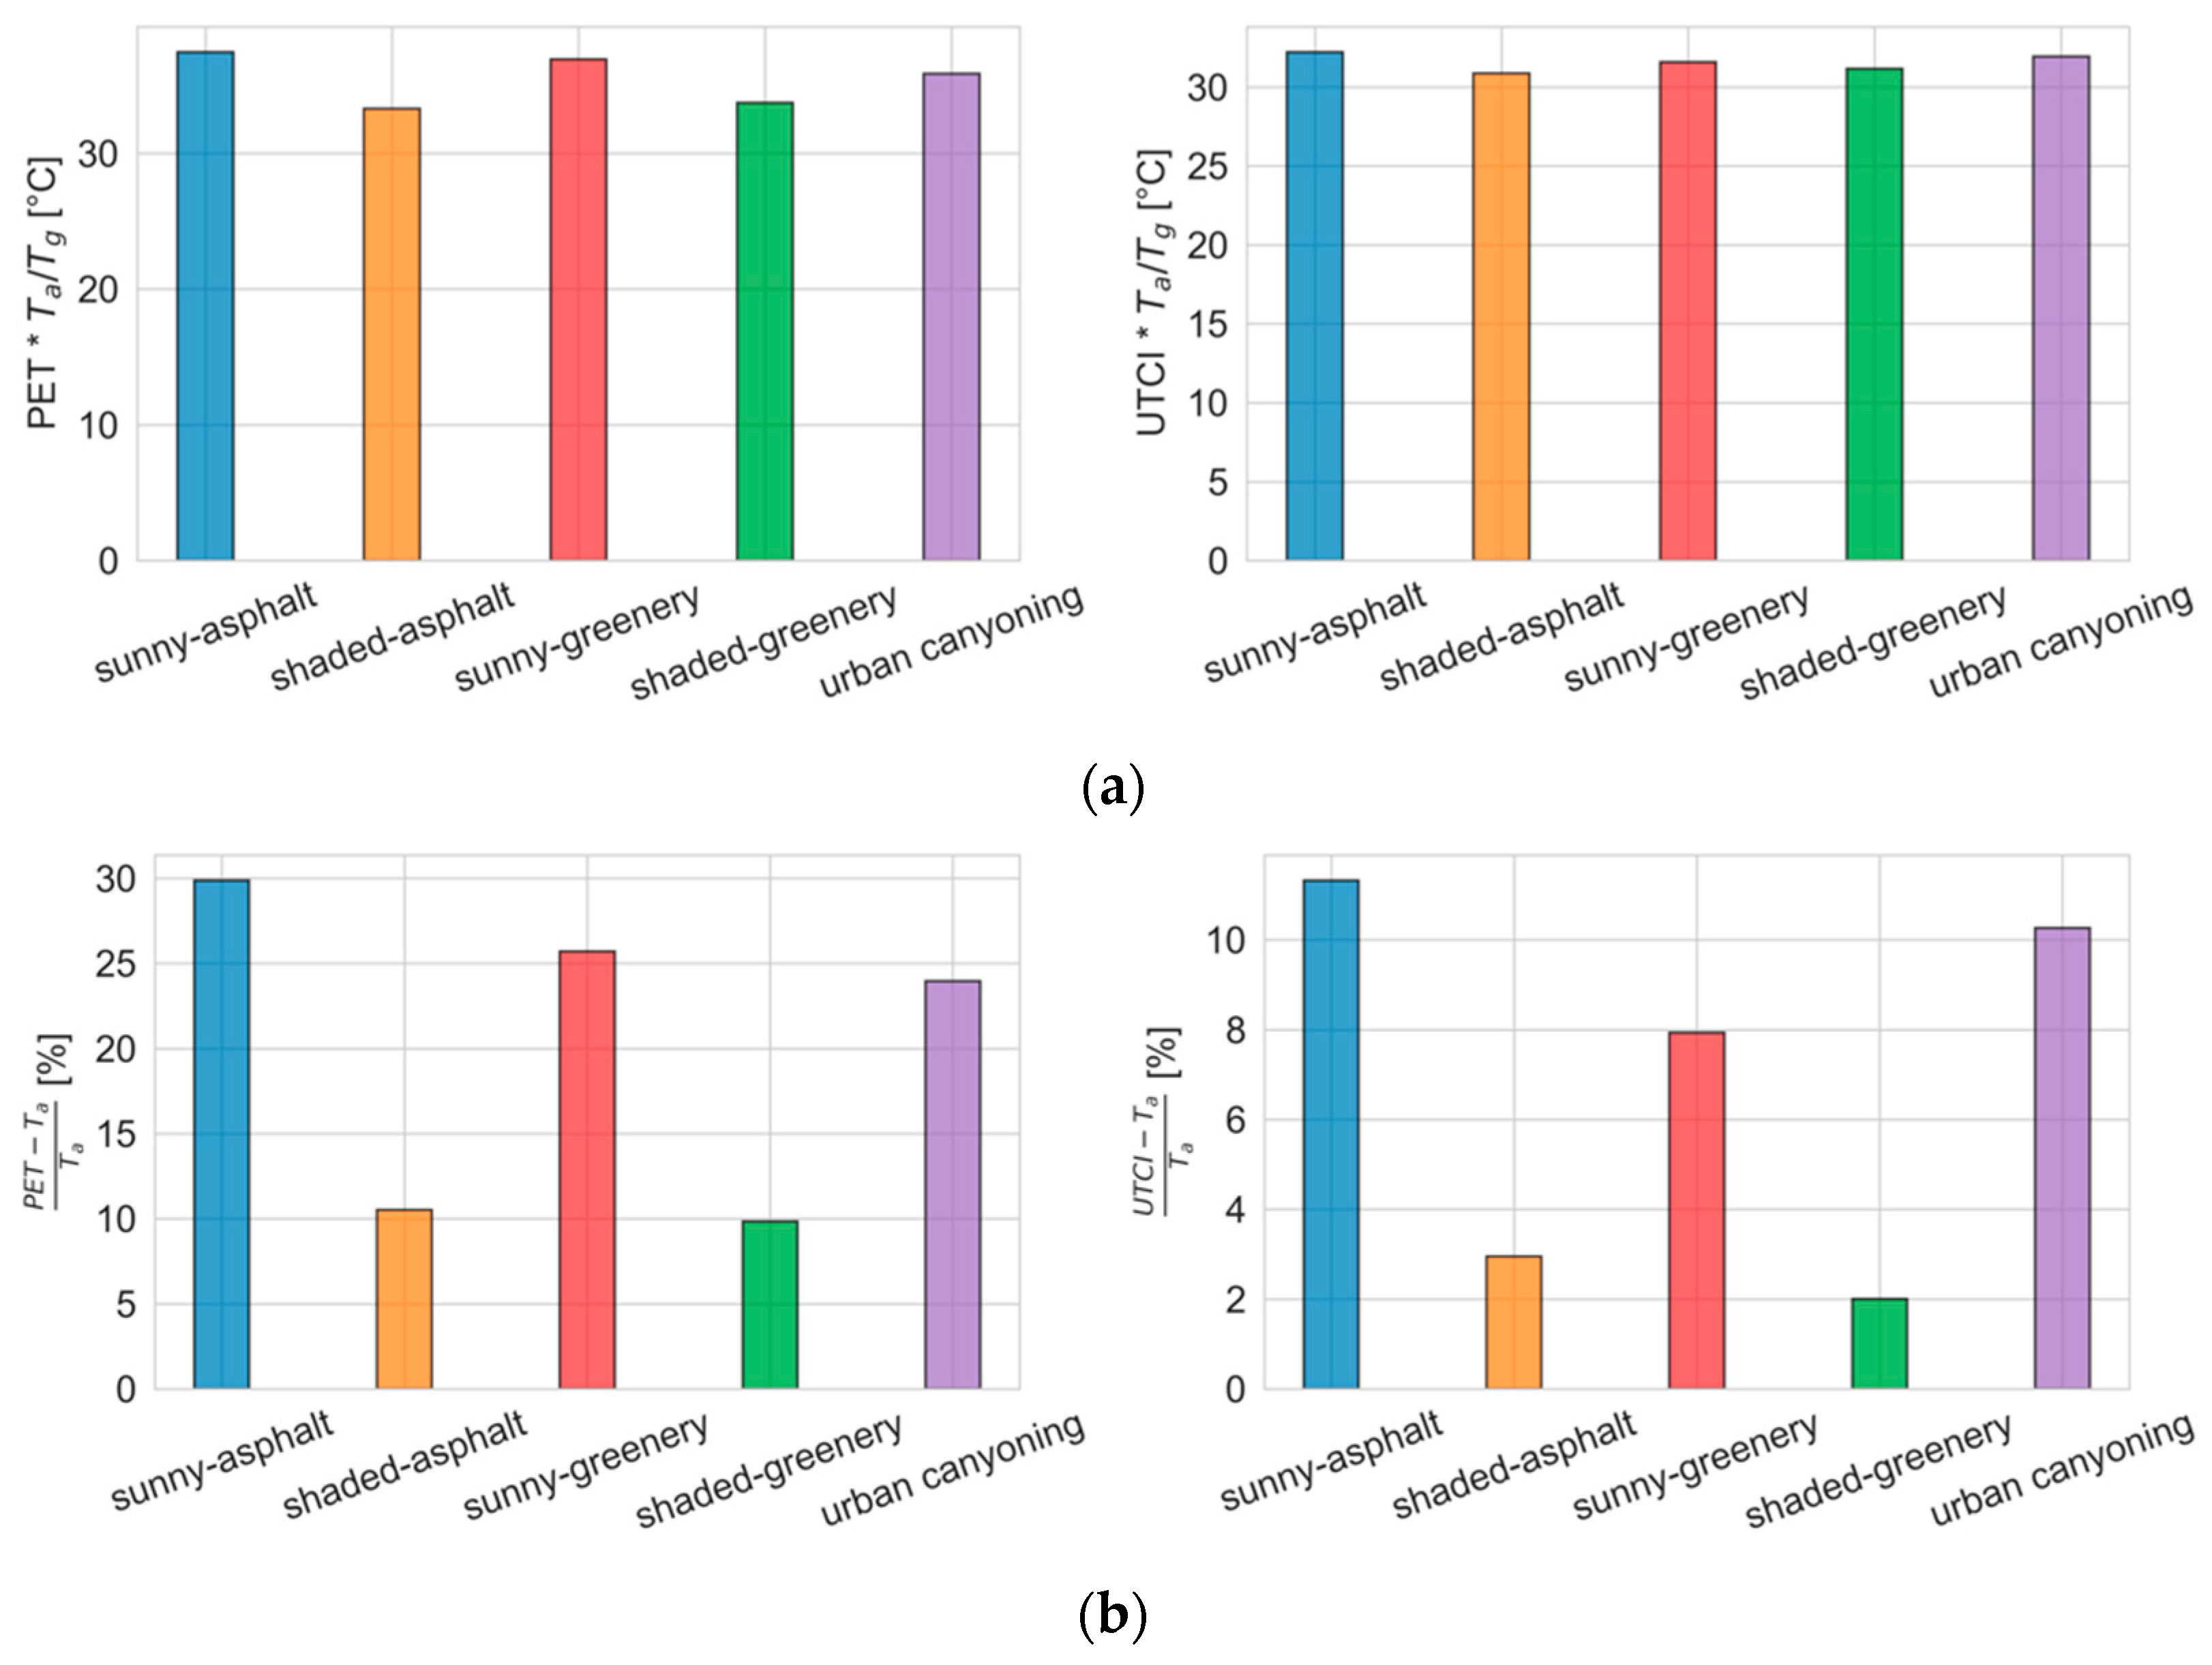
To highlight the differences among different possible urban configurations, the average PET and UTCI are shown in
Figure 5, still grouped by hotspot class.
All the different atmospheric conditions that occurred during the measurement session were taken into account, normalizing the indicators and multiplying them for the ratio between the temperature of the black globe thermometer and the air temperature, extrapolated at the same recording time (
Ta/
Tg); they are provided in
Figure 5a.
Moreover, the indices are expressed as deviations from the ambient temperature (PET—Ta and UTCI—Ta, respectively) as a percentage of the same temperature, Ta.
The results are consistent across both presentations and quantitatively confirm the expected and intuitive predictions. Sun exposure provides more than double the deviation of PET from Ta compared to shaded conditions. In the investigated scenarios, the presence of vegetation only slightly mitigates the perceived temperature compared to asphalt pavement, which is due to the lack of irrigation (e.g., moist soil and well-hydrated green surfaces). Indeed, the vegetation was rather dry and therefore unable to effectively trigger evapotranspiration processes connected to the subsequent adiabatic saturation process of air cooling. In the worst-case scenarios, the PET values hover around 45 °C, while, in shaded conditions, they still reach 35 °C.
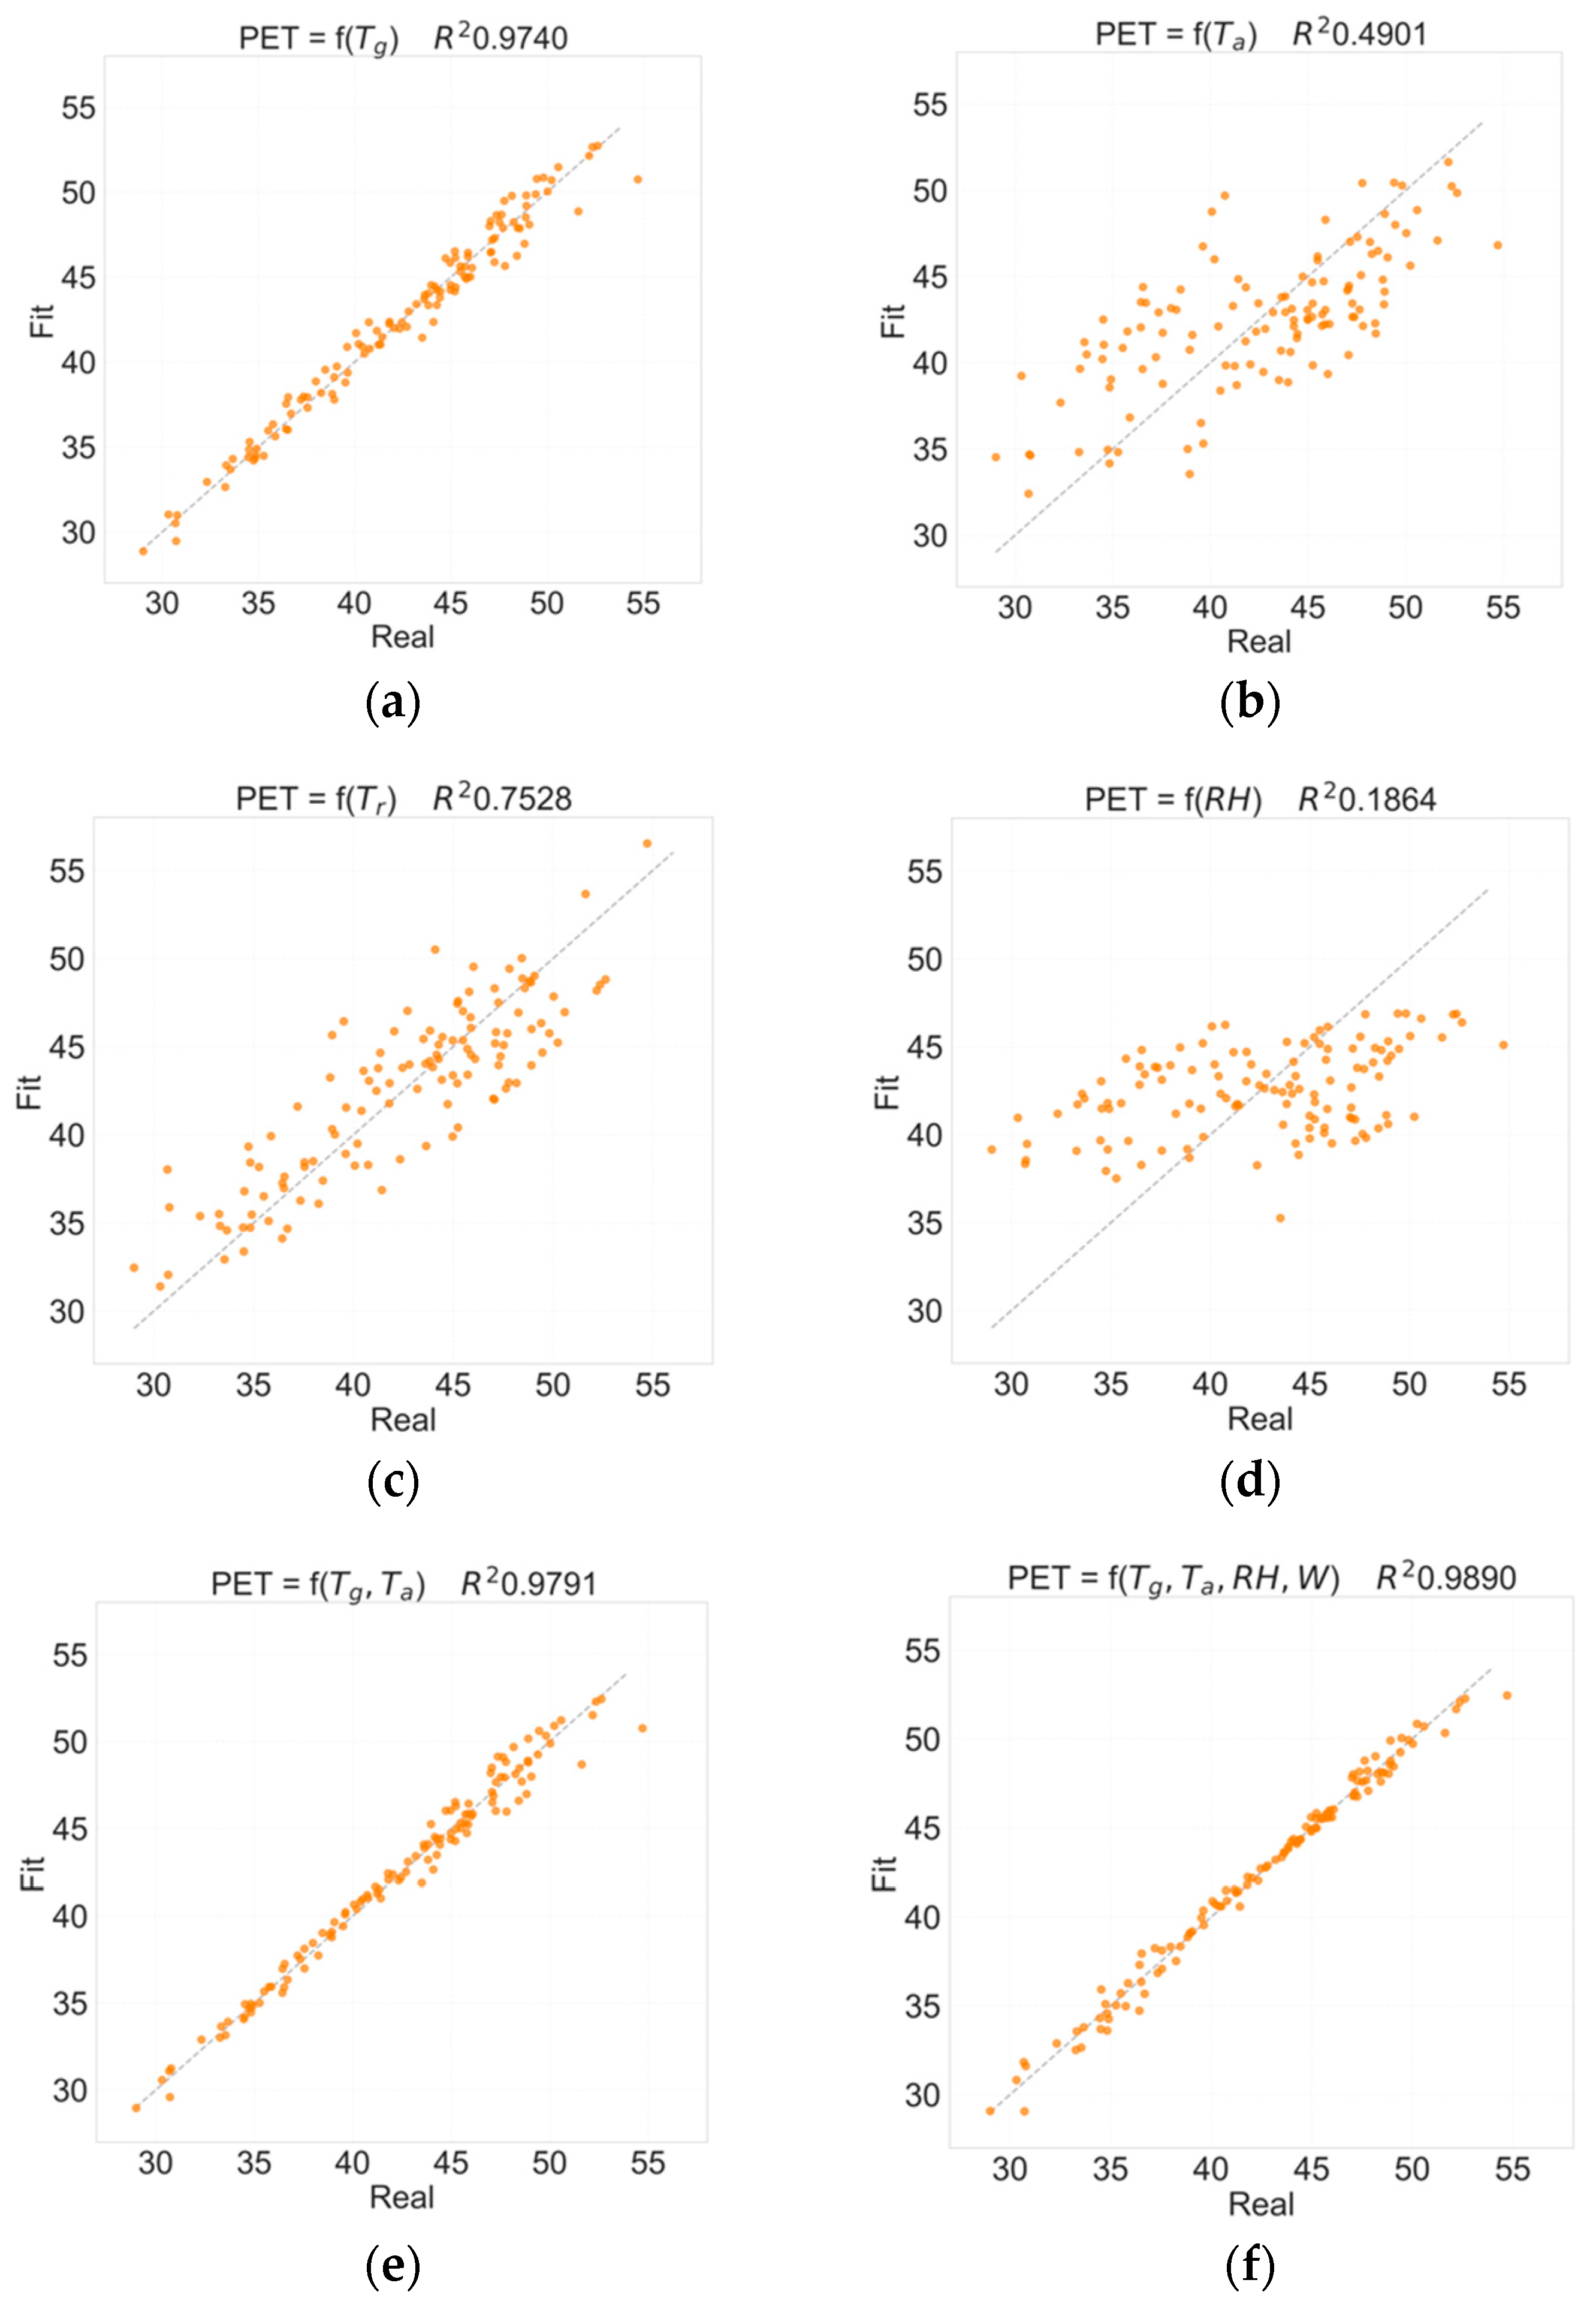
At this point, the objective shifted towards extending the hotspot measurements to a continuous and distributed surface across the entire investigated area. For this reason, the dependence of PET on the monitored environmental variables acting in the energy balances was thoroughly analysed. Through a multilinear approach, the relationship between the observed quantities and the indicators assumed the following form:
where Y is the predicted variable, e.g., PET or UTCI, and
X is the vector of the predictor variables chosen for each case. The parameters
a and
b are the linear coefficients estimated by the fit, and the dot represents the scalar product.
From this perspective, the empirical relationships identified between PET (or UTCI) and the environmental variables measured represent a local, data-driven expression of how thermal stress and perceived comfort emerge from real external conditions. Through linear and multilinear analysis, the study captures how variations in major microclimatic factors contribute to changes in PET, thus providing a quantitative basis for dynamic comfort models capable of responding to spatial and temporal variability.
Figure 6 shows the comparison between the real values and those obtained from the linear fit, considering six different cases: (a)
X = [
Tg], (b)
X = [
Ta], (c)
X = [
Tt], (d)
X = [
RH], (e)
X = [
Tg, Ta], and (f)
X = [
Tg,
Ta,
RH,
W]. As can be noted from
Figure 6f, linearity is confirmed by the high regression coefficient (>98%) when PET is dependent on all parameters simultaneously. Individually, some of the variables, such as the ambient temperature and relative humidity, show a weak direct relation with PET (coefficient of 49% and 19%, respectively); however, the black globe temperature is strictly linked to PET by itself, with a regression coefficient greater than 97% (
Figure 6a). This fact proves that the radiative phenomena are the most significant for the thermal comfort assessment.
Therefore, a new measurement campaign was designed using an aerial survey, exploiting the technology of drones equipped with a thermal camera, as described in the next
Section 3.2.
3.2. Drone Measurements
The drone measurements were carried out for the same areas as the routes performed with the portable instruments. The drone is equipped with a thermal camera, stabilized on a gimbal mount, and a lens with a focal length of 13.5 mm and a sensitivity in the spectral range of 8–14 μm. The imagery acquisition was organized in specific missions with manual and automatic flights. The first flights recorded spot data, while the second allowed us to cover a large part of the investigated area on the order of tens of thousands of square meters.
The different missions were conducted concurrently with the ground measurements taken by the portable sensors to obtain comparable data at the same atmospheric boundary conditions, e.g.,
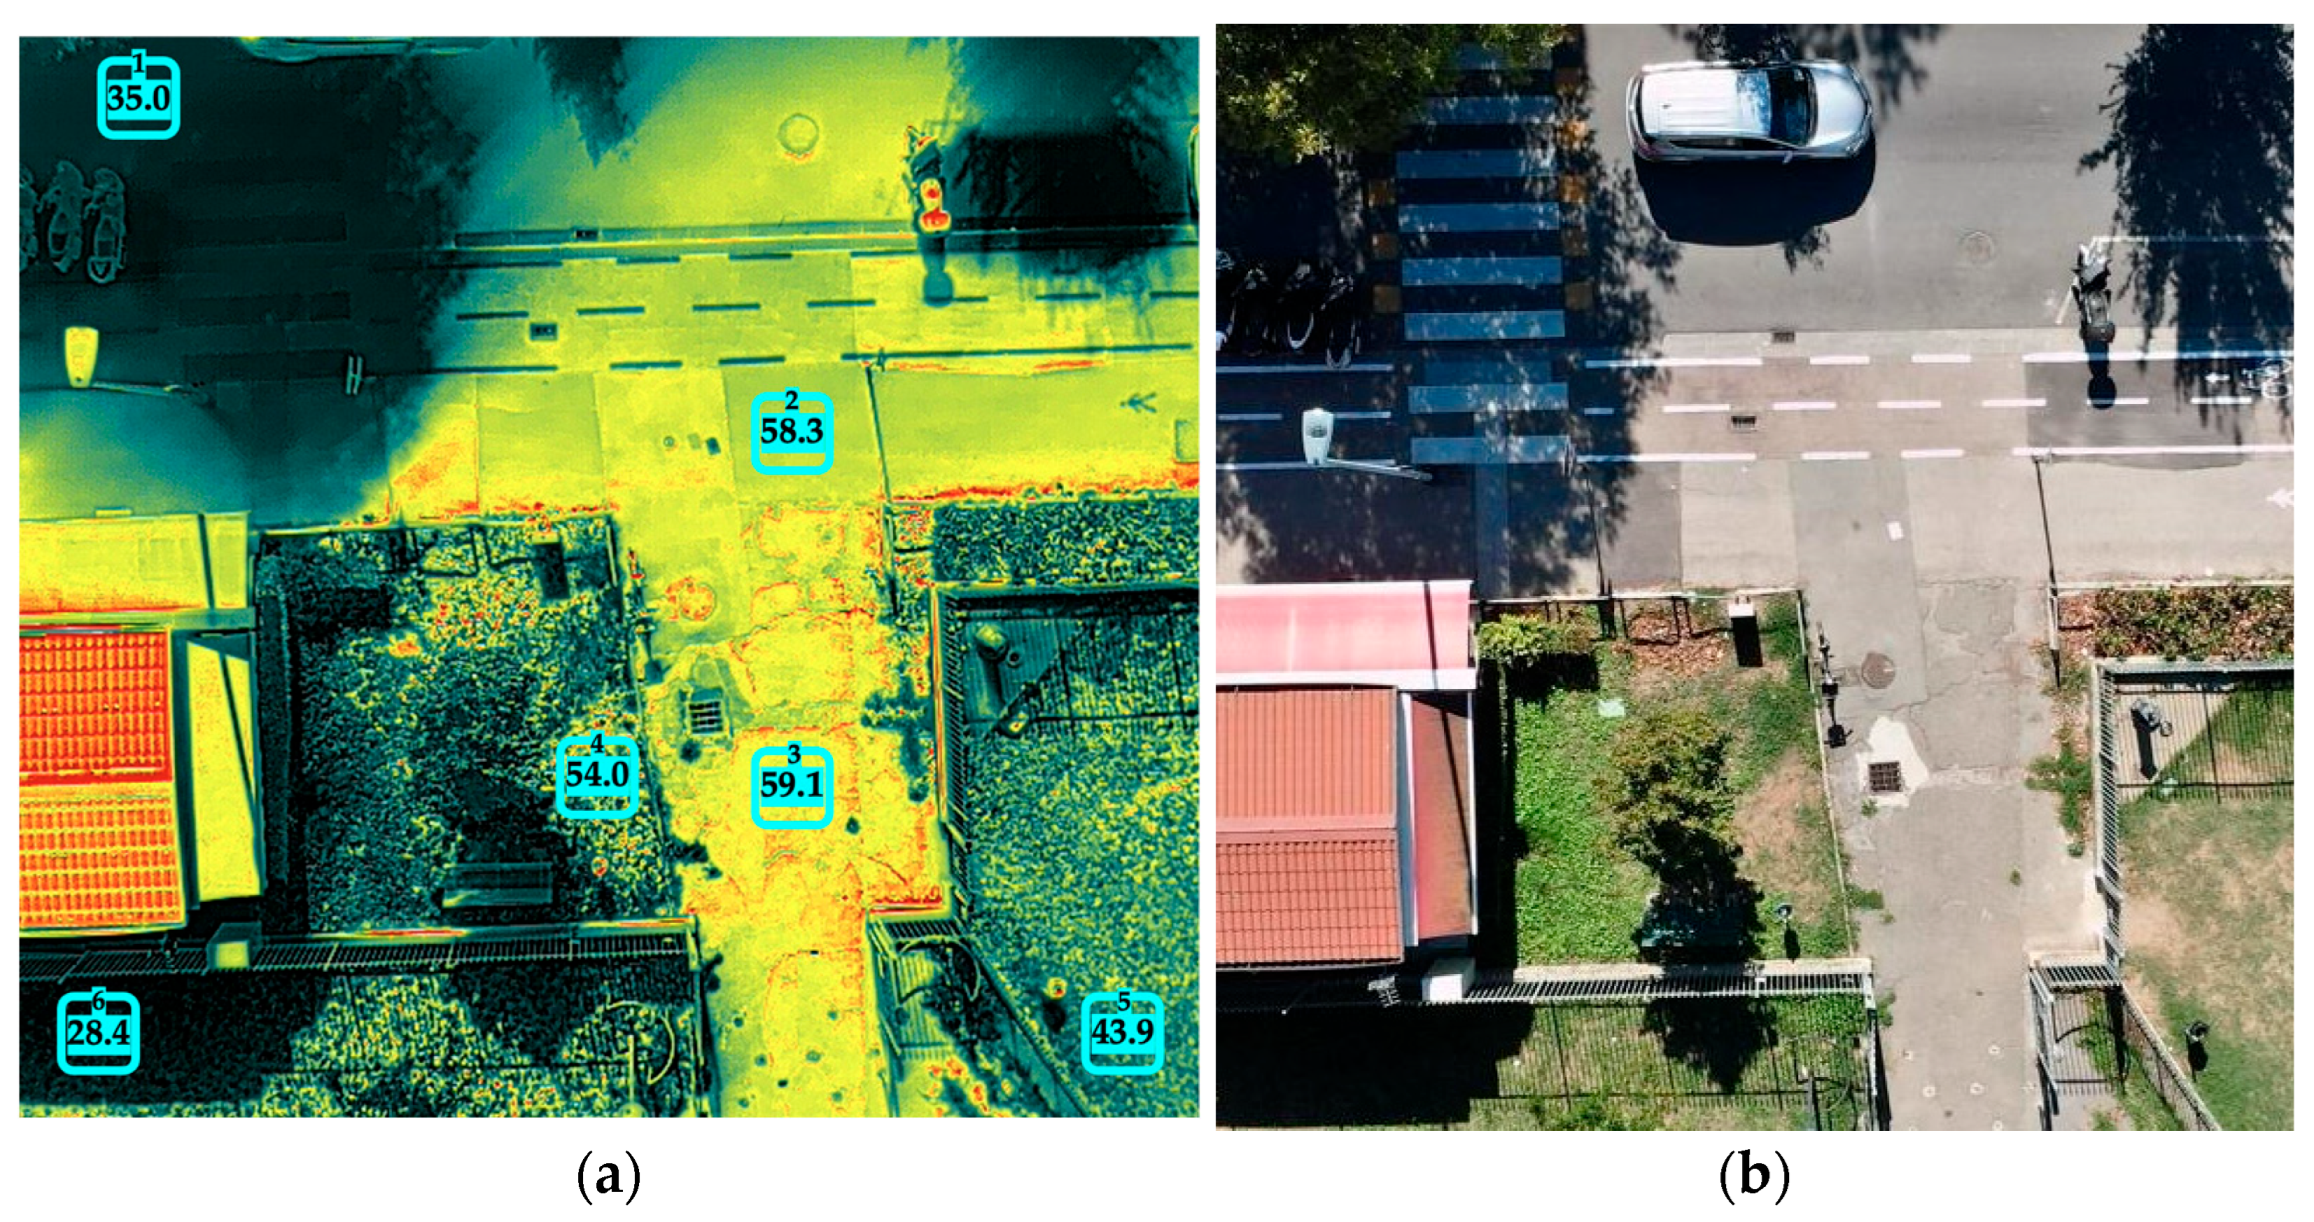
Figure 7 shows a picture of the thermal field viewed by the drone camera at the entrance of Lippi’s Garden.
The photo is processed using the native commercial software of the thermal camera (DJI Thermal Tool v3.5), setting the surrounding temperature (31.0 °C) and relative humidity (38.4%) from the portable sensors and the distance directly taken from the drone. For a single shot, the emissivity was varied to correct the temperature as a function of the different materials, applying the following values: 0.90 for dry soil, 0.95 for asphalt, and 0.98 for green grass [
40,
41]. The light-blue rectangles of 1 m
2 are placed in typically different contexts, obtaining the following average temperatures:
#1: along the shaded street at 35.0 °C;
#2–3: on the sidewalk in the sun at 58.3 and 59.1 °C;
#4: on dry soil in the sun at 54 °C;
#5: on the green grass on the sun at 43.9 °C;
#6: on shaded green grass at 28.4 °C.
The values provide at least a qualitative (but also a quantitative by means of comparisons) evaluation of the impact of different materials under the same boundary conditions. In general, the scenarios may change during the day, but in the specific picture the rectangles were placed where the solar exposure is almost constant. The green grass in the sun forces the temperature to be about 15 °C lower than the asphalt, while in the shaded hotspots the decrease is limited to 7 °C. The thermal behaviour of dry soil or parched grass is closer to that of asphalt, and temperatures are reduced by 4 °C.
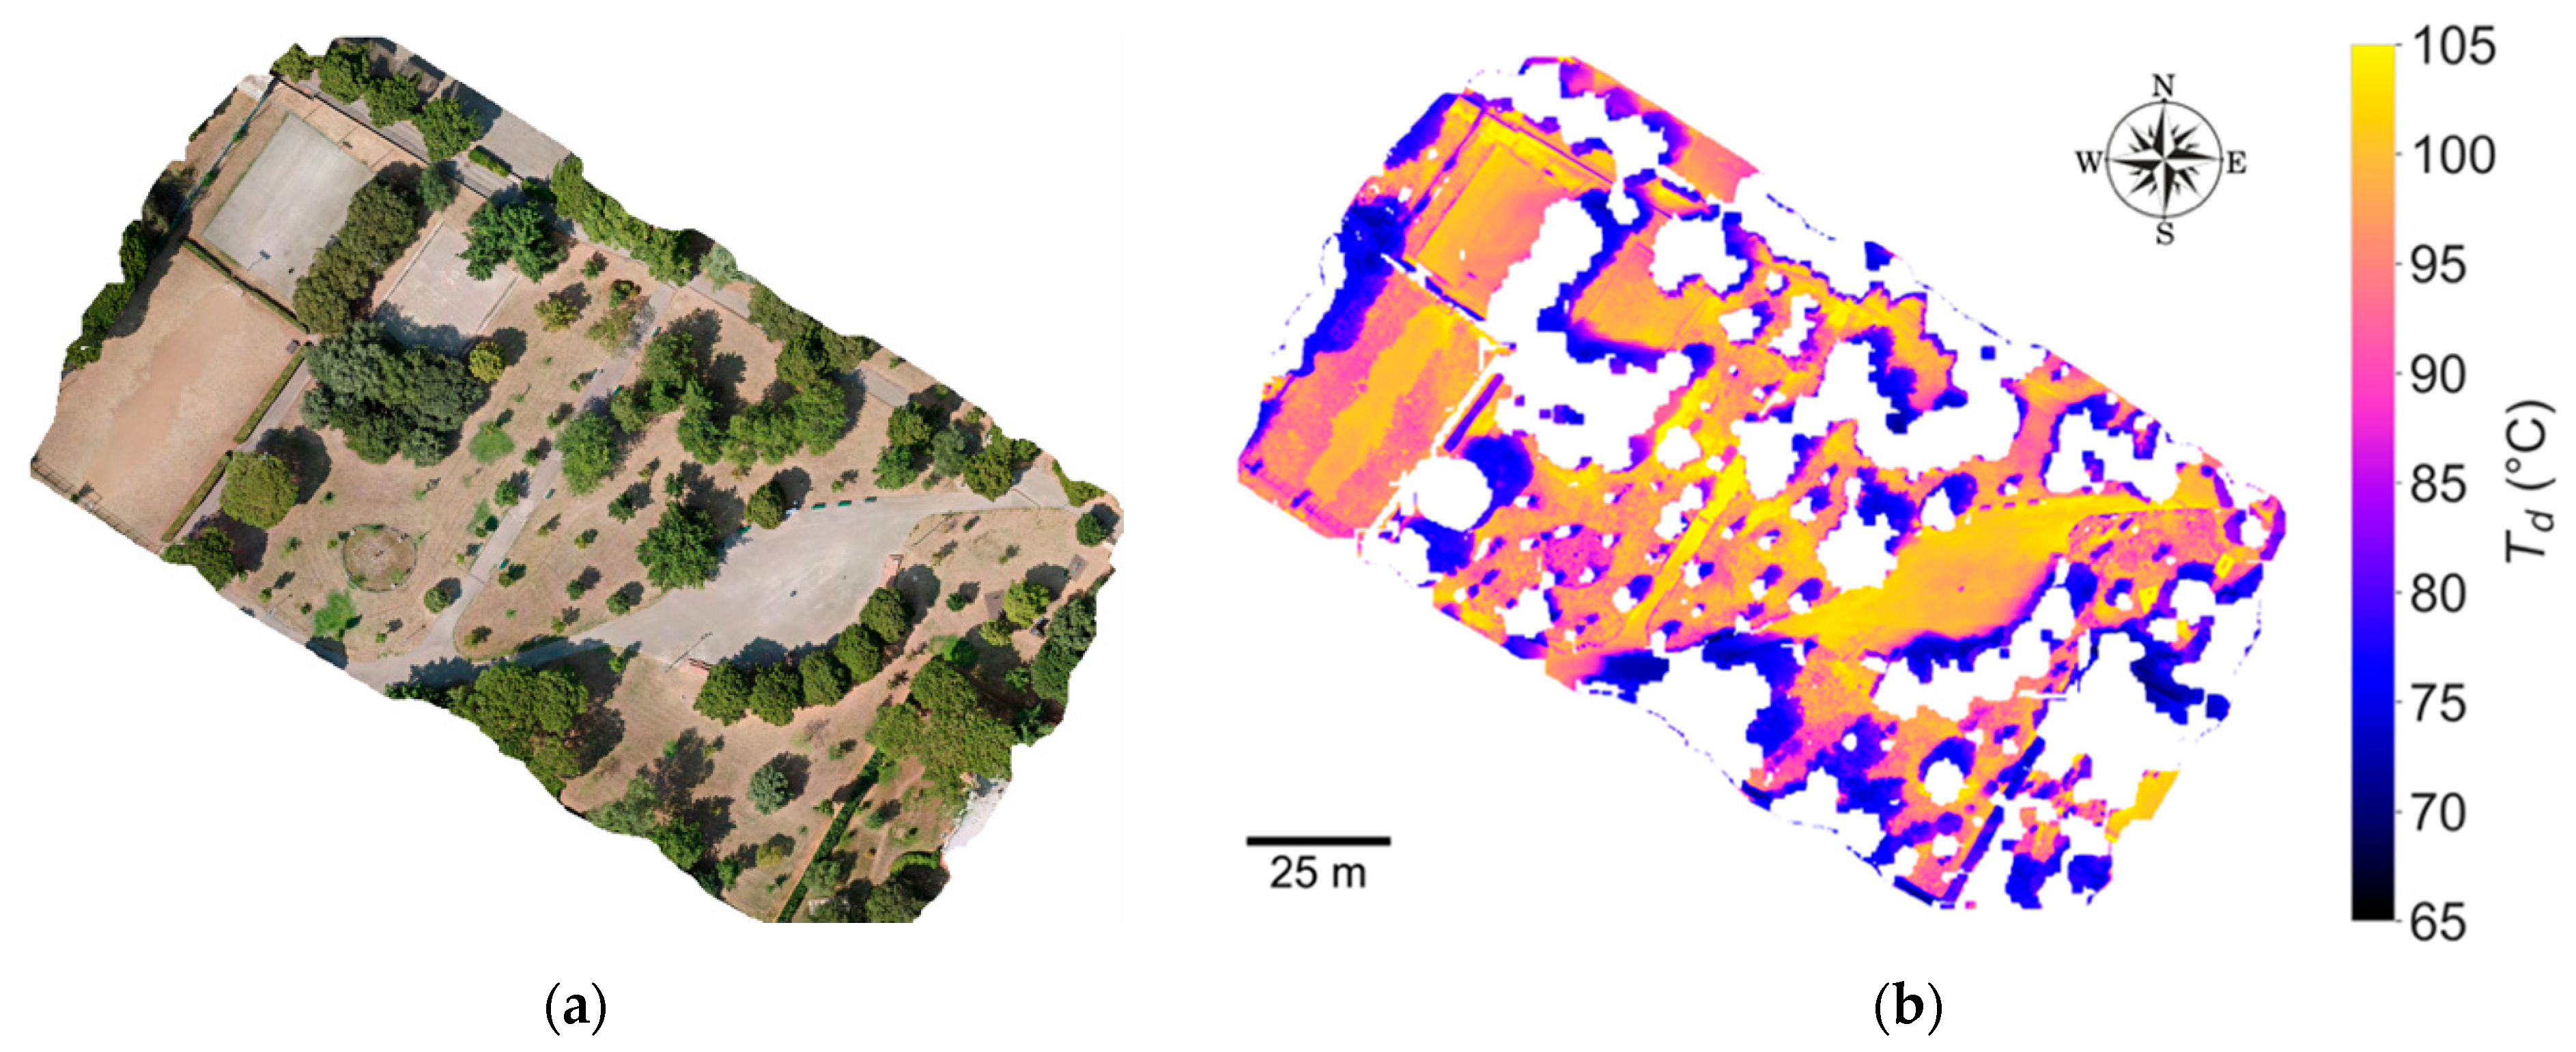
The drone missions allowed for the acquisition of hundreds of georeferenced pictures (with thermal and RGB information), which could be matched together to obtain the temperature
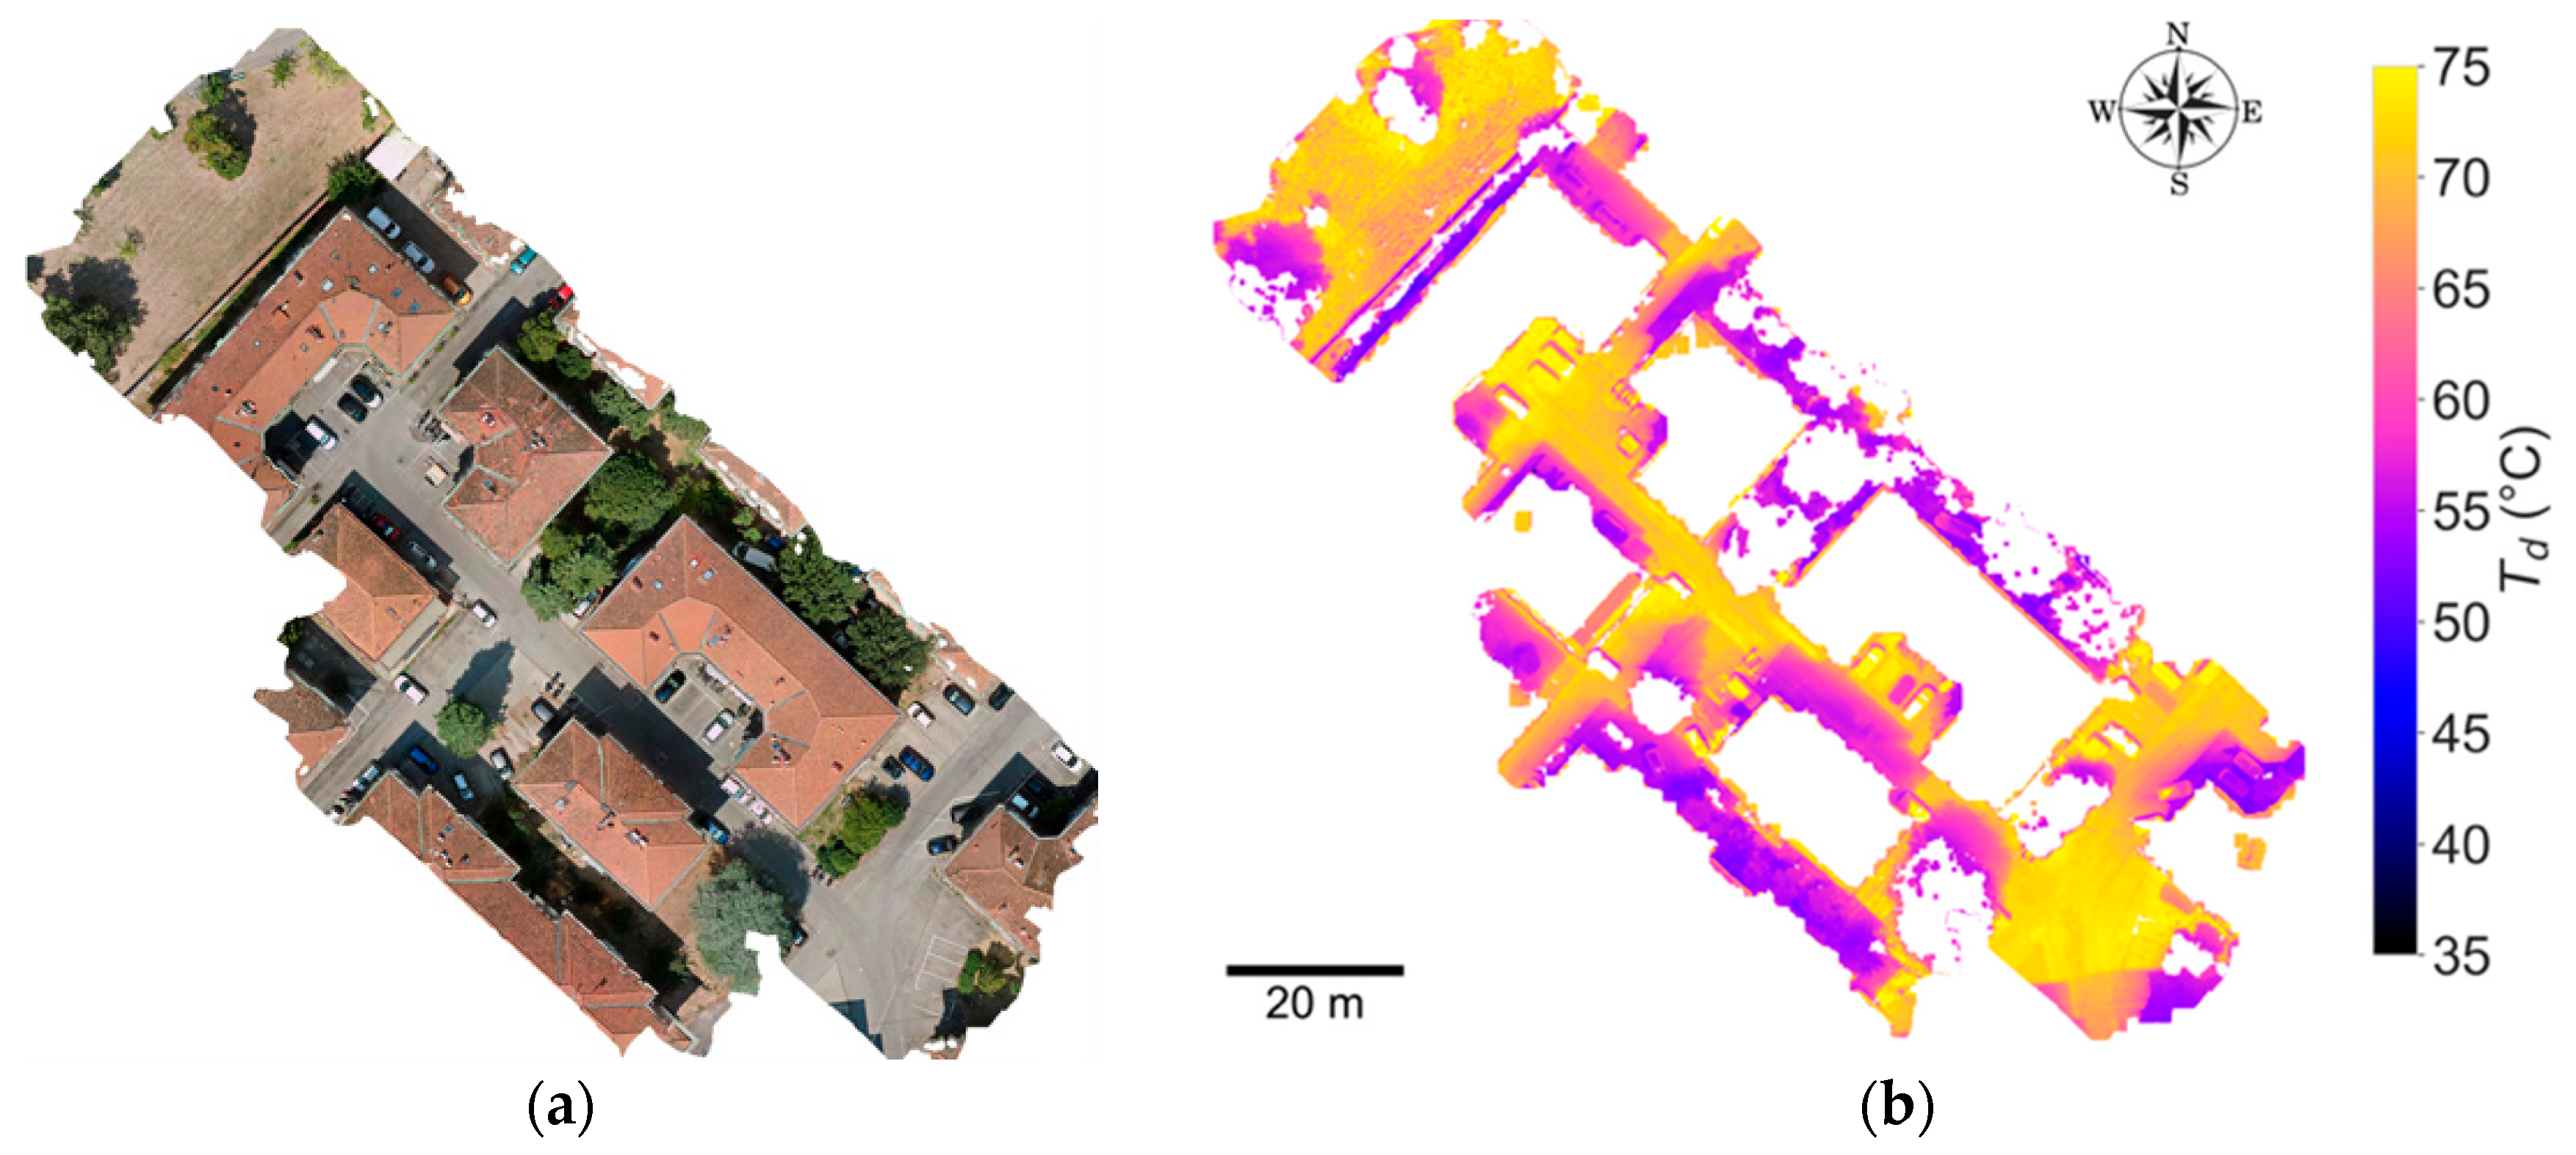
Td maps over almost the entire area under investigation. The software QGIS (v3.40-bratislava) was used to create thermal and RGB ortho-mosaics from the multiple shots, with a homogeneous temperature scale (two examples are reported in
Figure 8 and
Figure 9).
Masking algorithms were implemented in Python, exploiting the
ExG index (see
Section 2.3) to avoid pixels representing buildings and trees/bushes. The thermal maps show a very high temperature acquired by the drone (essentially a radiant temperature from the ground), despite a maximum air temperature of 38.8 °C and a relative humidity of 35.2%.
It is important to note that the soil and vegetation in the garden appear very dry, which is the reason why the
Td values are high not only in the asphalted sections (
Figure 8b). Furthermore, the space is free from large and tall obstacles; shade, even if present, moves throughout the day without constantly covering the surfaces around and under the plants. On the opposite side, in the area of the buildings, shadows are more durable on certain surfaces, and temperatures are relatively lower (
Figure 9b).
3.3. Matching of the Multiple Measurement Techniques
The drone missions allowed for the evaluation of a radiant temperature coming from the ground surface. As this temperature is measured, it can be said to represent the thermal state in proximity of the ground as the sum of the ambient temperature information and all the radiative contributions entering and leaving the measurement point. For this reason, a certain parallel can be hypothesized with the detection performed by the black globe thermometer, one of the instruments used during the hotspot surveys. Based on this principle, some experimental campaigns were conducted, simultaneously recording measures in significant locations (with asphalt/greenery and sunny/shade combinations), capturing aerial thermal images, and focusing on a 1 m
2 area close to the placement of portable sensors. In particular,
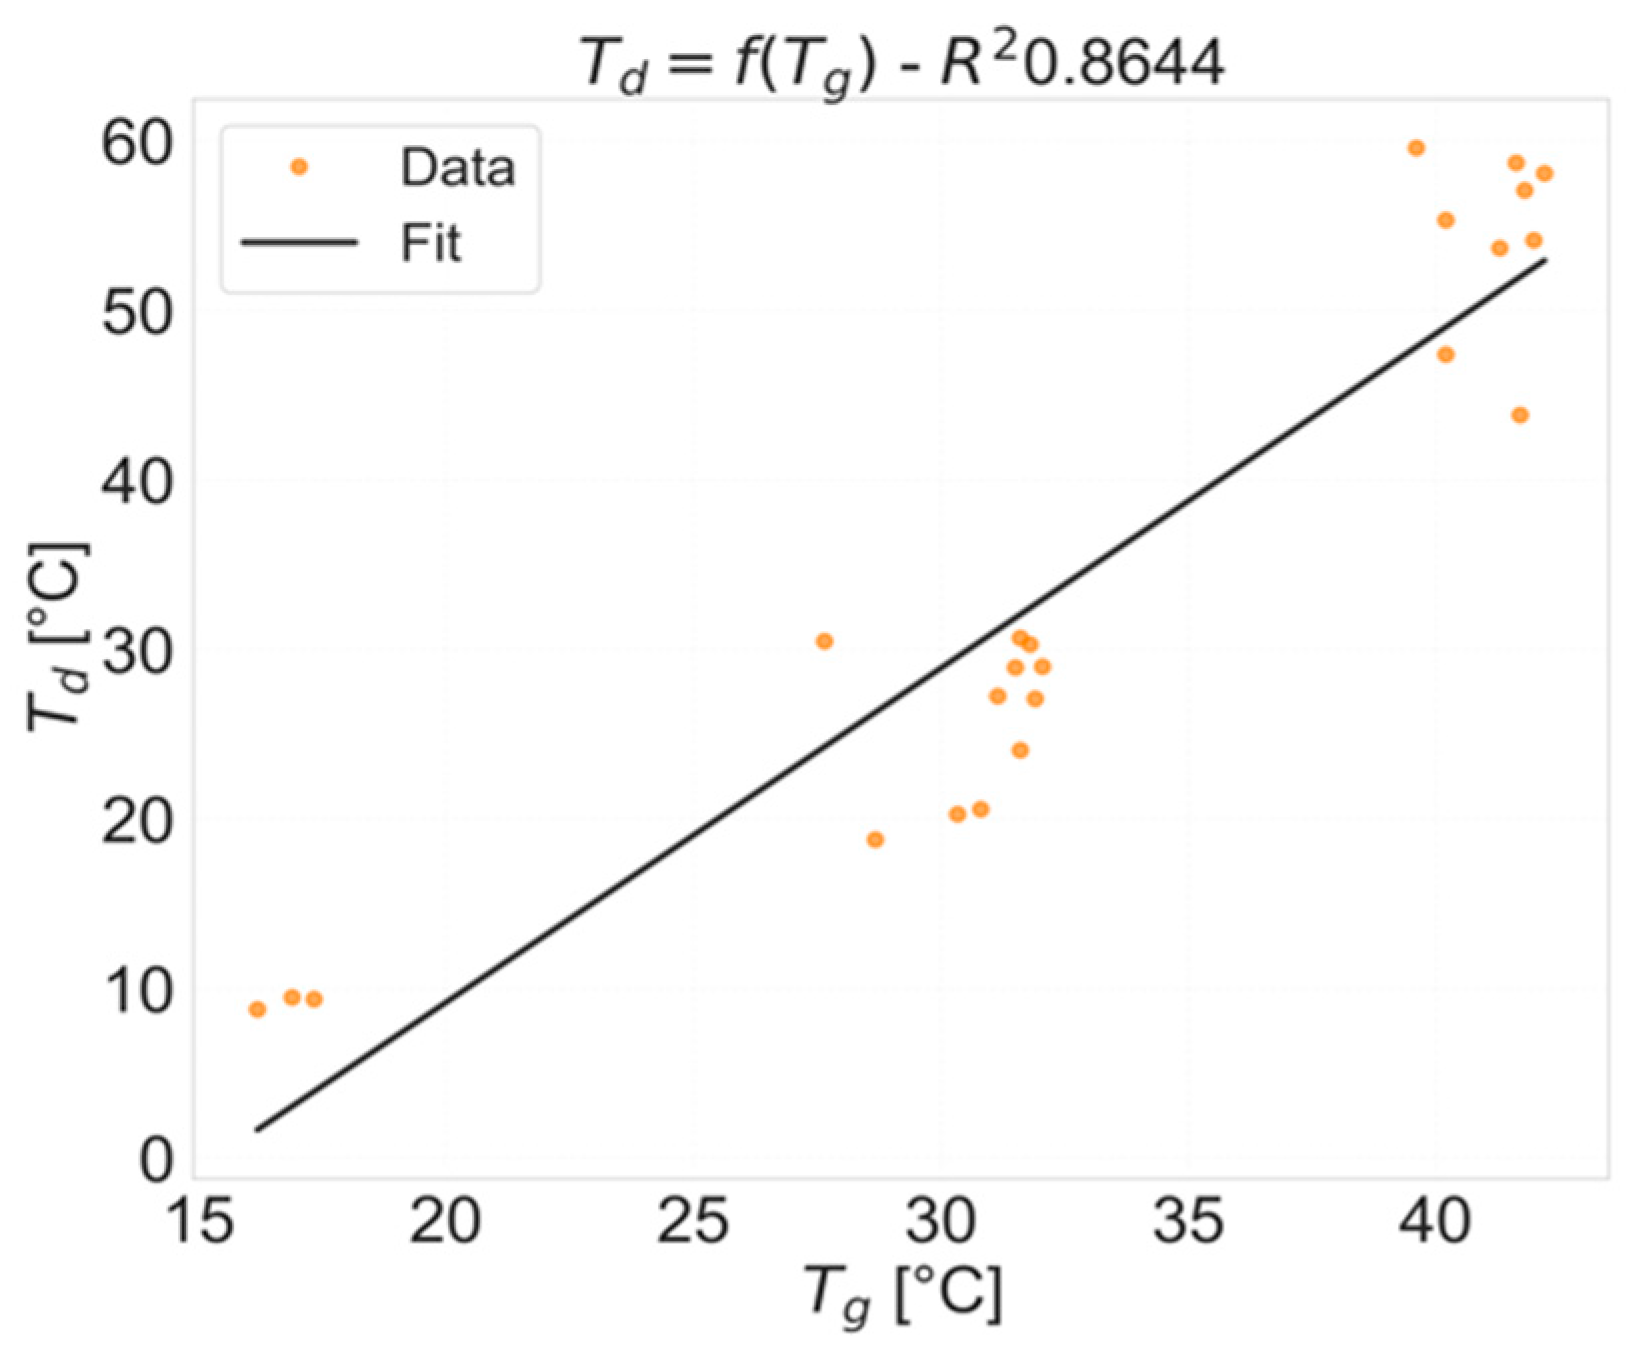
Figure 10 shows the relationship between the average values of
Td and
Tg obtained in 23 hotspots inside Lippi’s Garden. The tests were carried out on two different days (18 September 2025 and 5 November 2025), logging each hotspot for 15 min (stable conditions in the last 5 min, the same procedure as
Section 3.1).
The statistical analysis provides a linear correlation with a regression coefficient greater than 86%, providing evidence of a good physical correspondence between the two quantities. The linear equation can be written as follows:
Knowing the relationship between
Td and
Tg, it is possible to re-calculate new PET values, called
PET*, this time distributed across all surfaces investigated by the drone rather than localized in the hotspots. For the
PET* calculation, the strong linear relationship with
Tg (R
2 > 97%), found in
Figure 6a, was used:
Then, it becomes the following:
Finally, the distributed thermal values of the ortho-mosaic pictures (
Figure 8 and
Figure 9) were converted into
PET*, assessing thermal comfort in the pilot area. For this purpose, drone missions were also accomplished inside the industrial site of Nuovo Pignone, in particular, flying over the parking lot and the zones around the offices (
Figure 3).
4. Results and Discussion
In this section, the final results obtained from the integrated measurement processes are shown and discussed. First, the estimated indicators for thermal comfort (PET and UTCI) were obtained in significant hotspots, exploiting hyperlocal measurements with environmental mobile and fixed stations. The weight of the different parameters in the PET balances was investigated, highlighting a strong linear relationship on
Tg (
Figure 3).
Then, another linear dependence was found between two radiative temperatures measured at different scales: one hyperlocal (again, the black globe thermometer-based values,
Tg) and the other spatially extended (the drone-based
Td). Finally, by concatenating the relations, new distributed
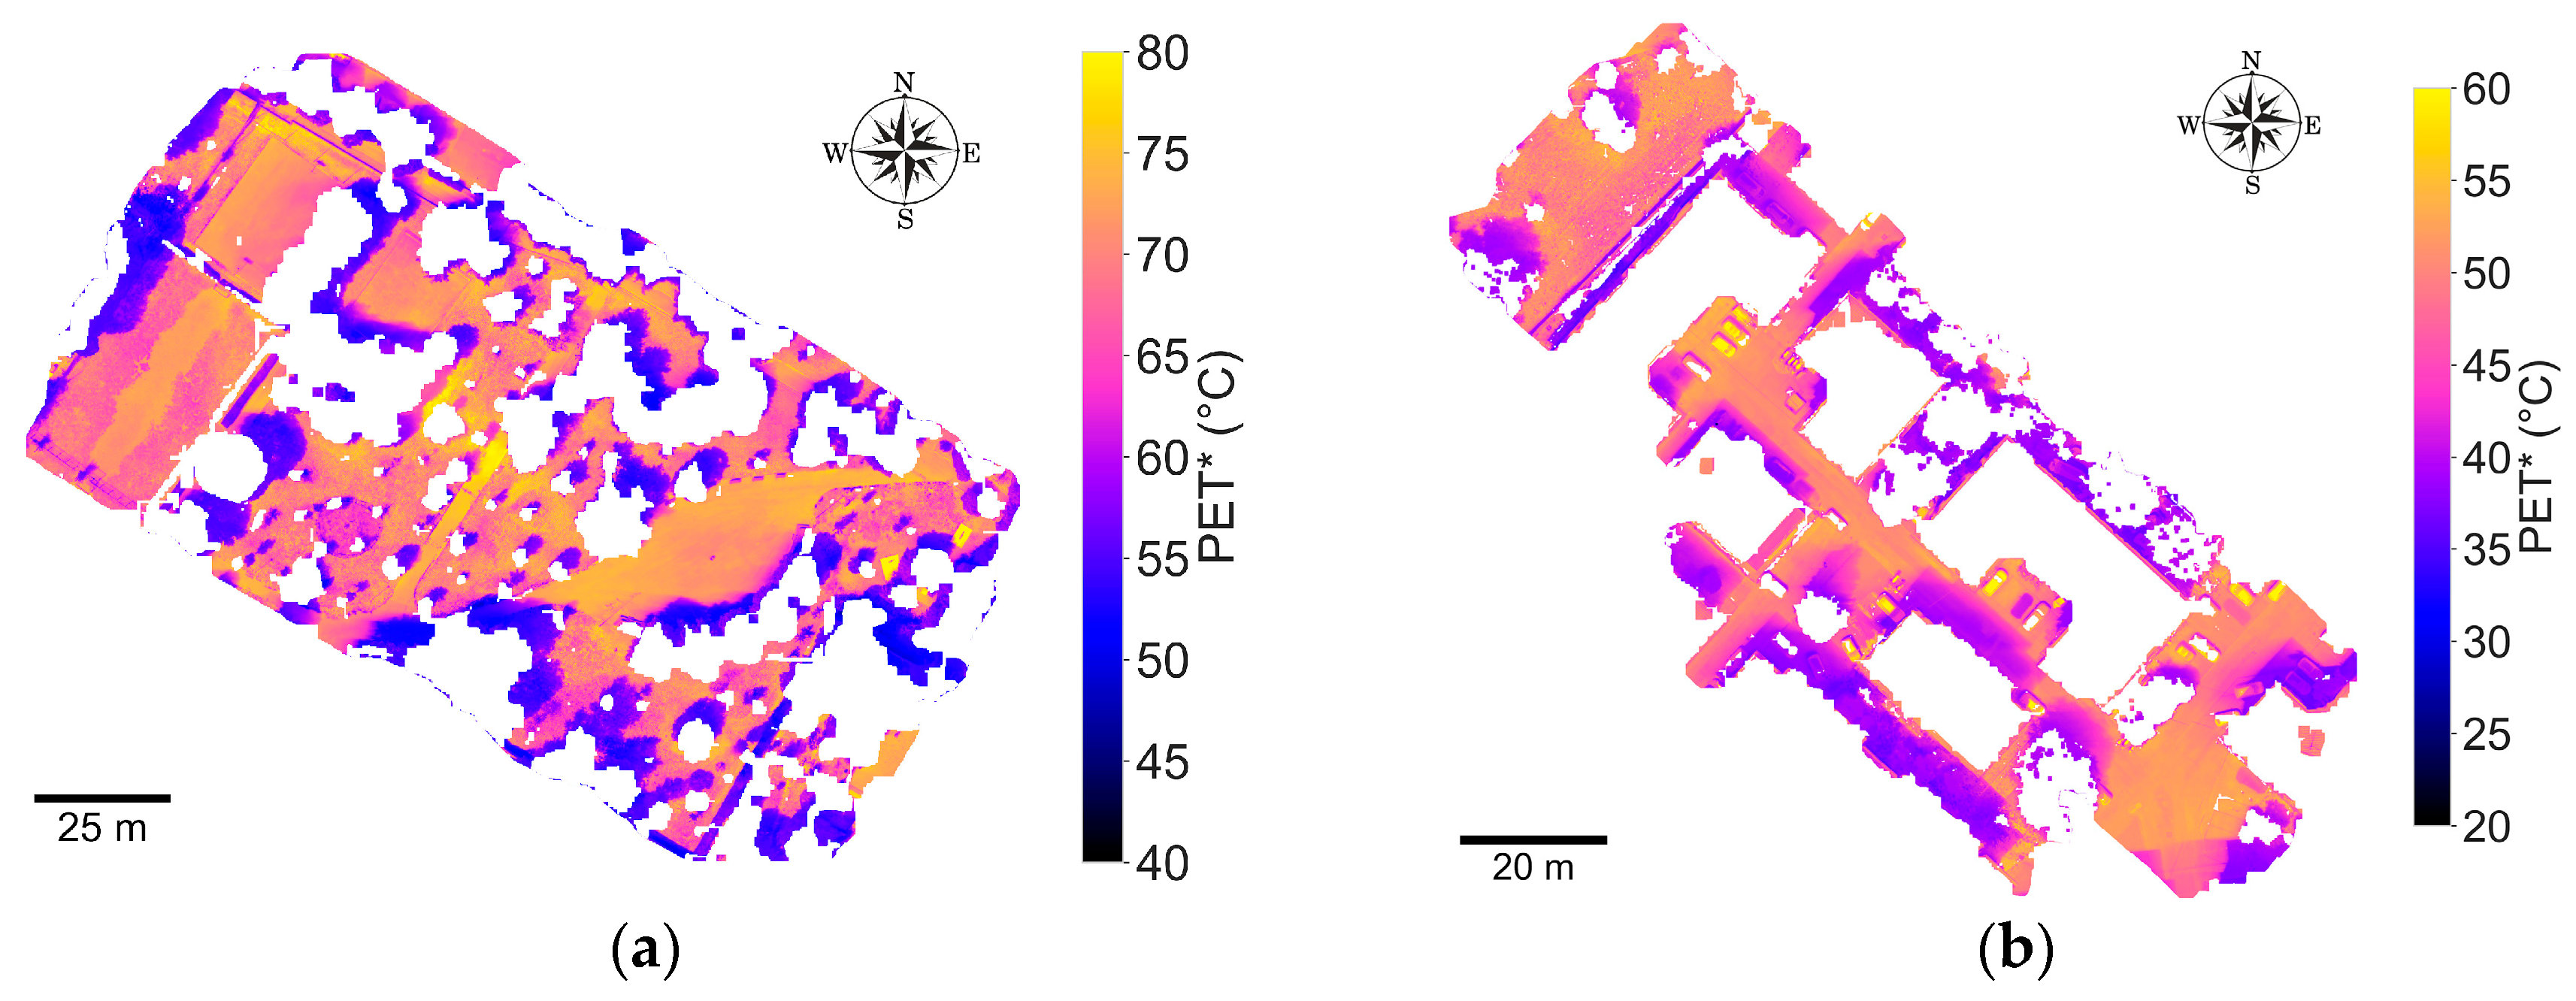
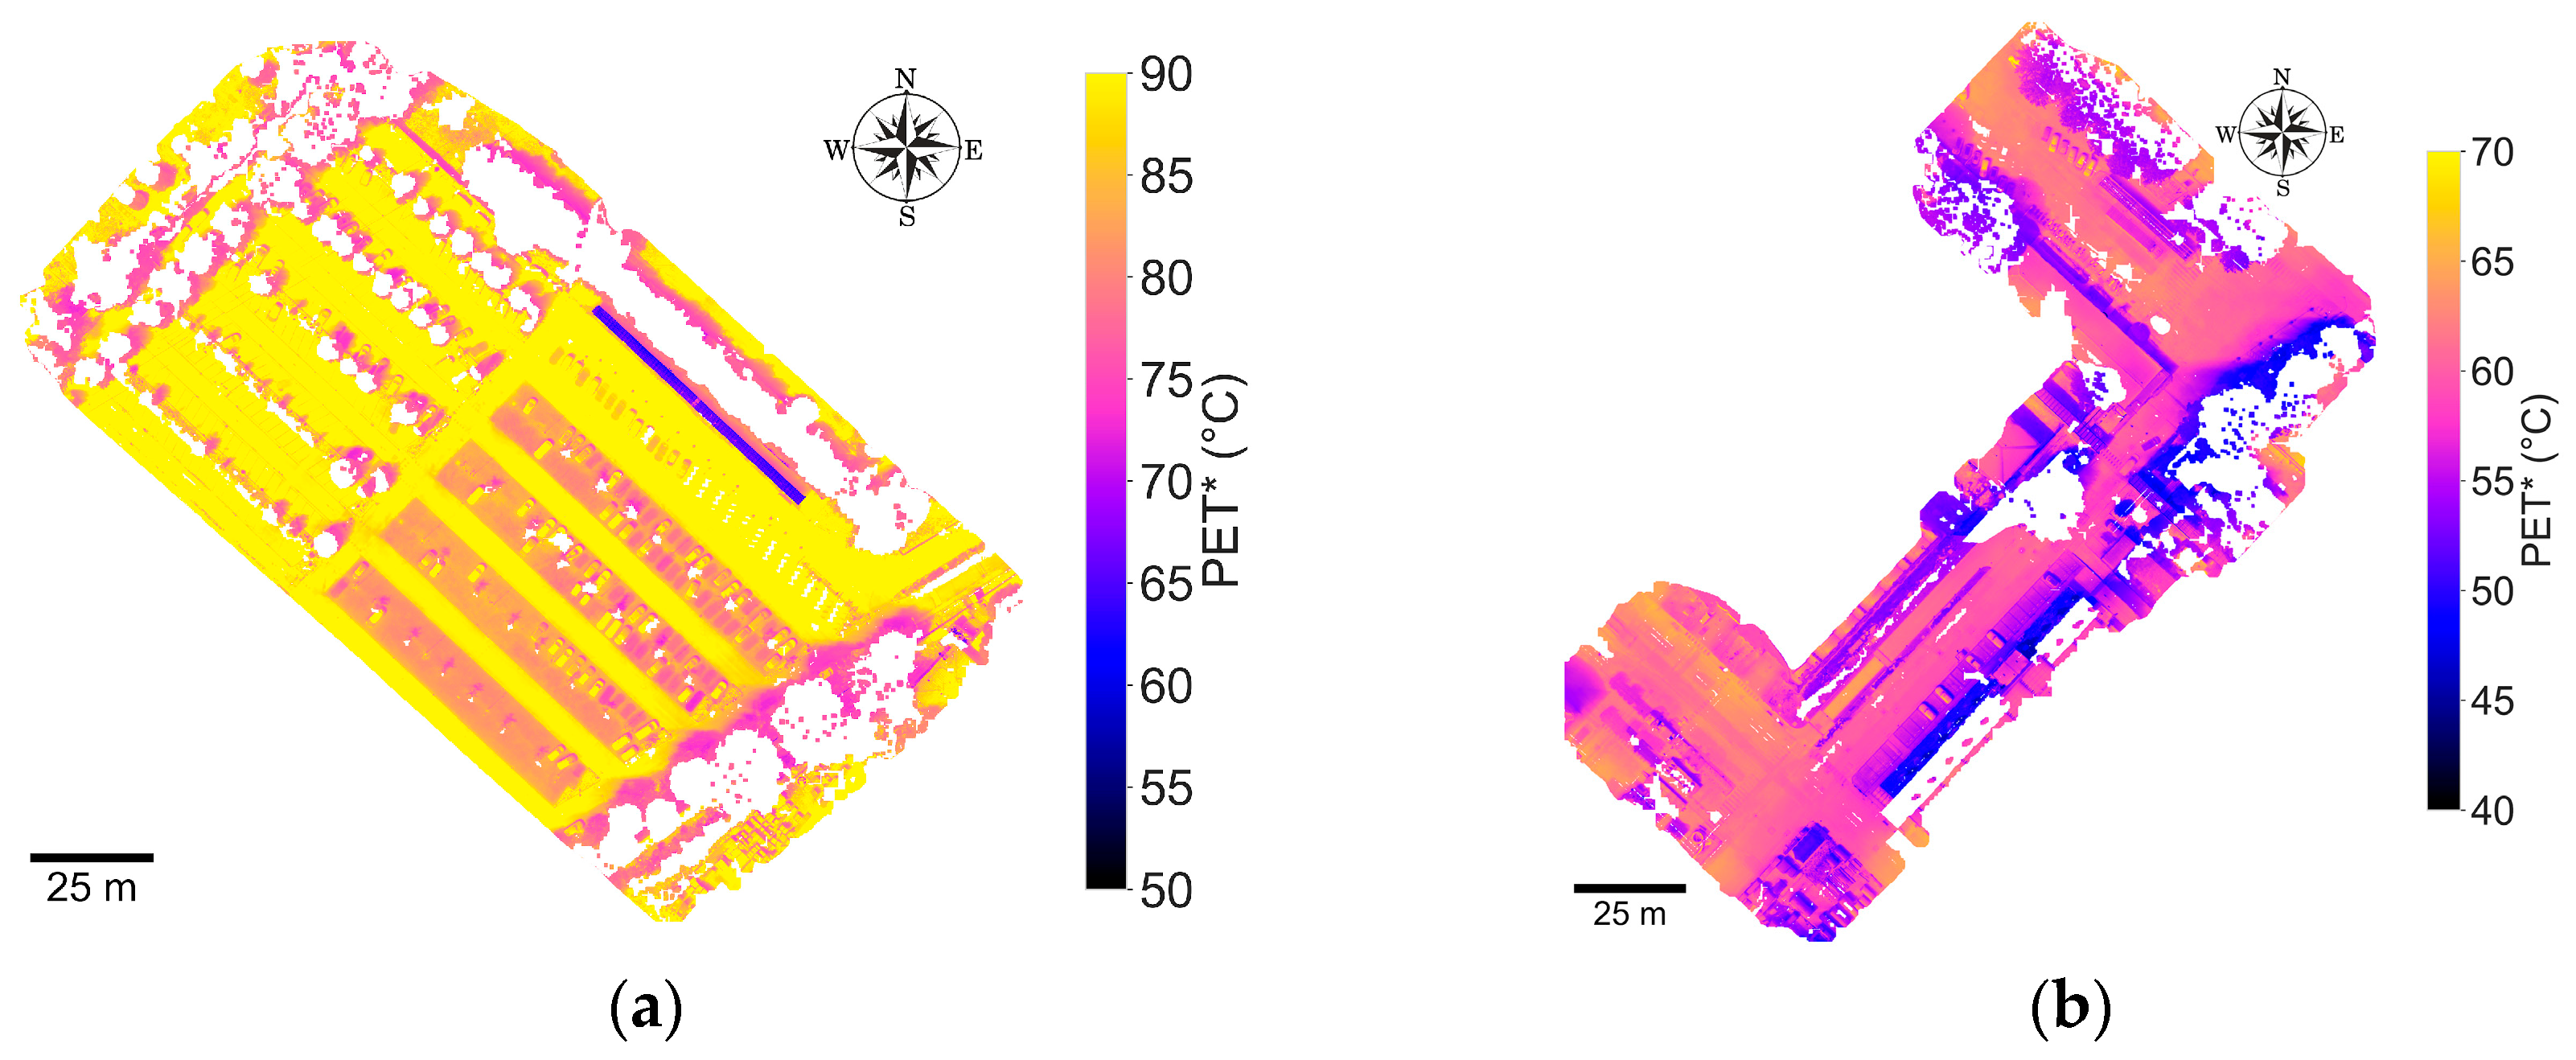
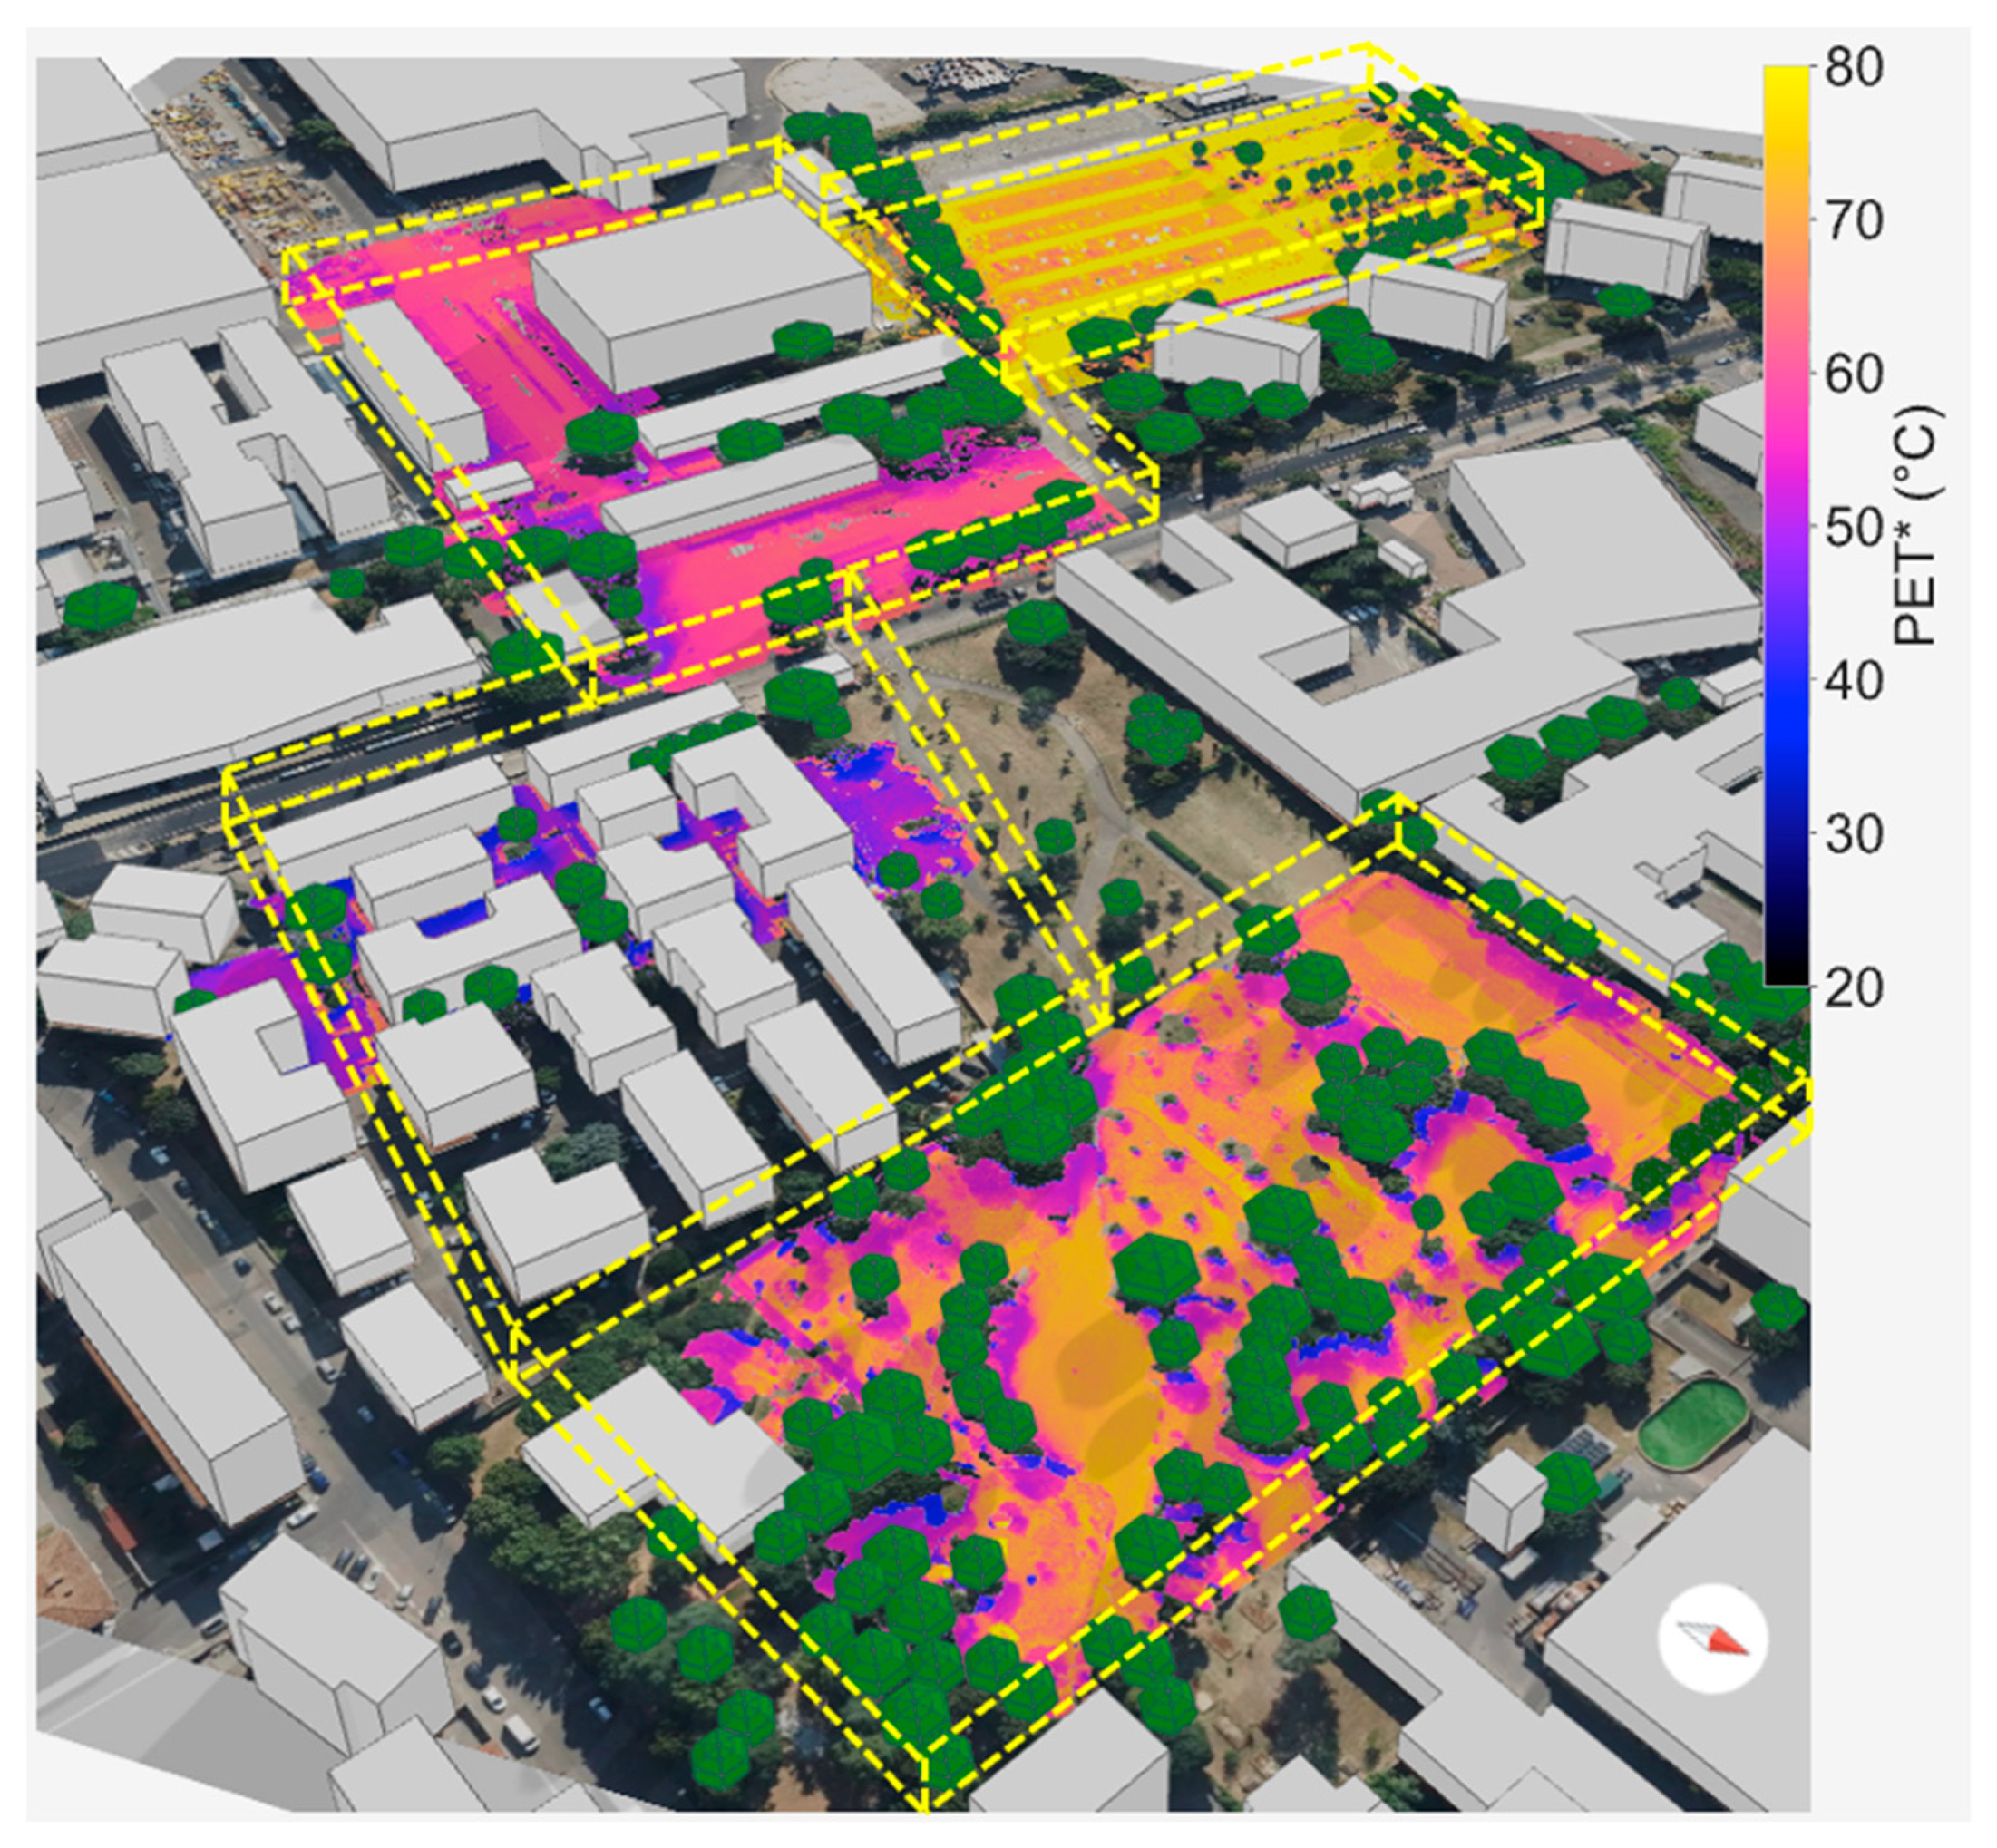
PET* fields were derived, converting the ortho-mosaic thermal images. In
Figure 11, they are shown for Lippi’s Garden (a) and the building block (b) areas, while in
Figure 12 they are related to the Nuovo Pignone industrial site (the parking lot (a) and the entrance to the offices (b)). In both of the cases, masking processing (
Section 2.3) was applied to exclude the pixels with trees/bushes and buildings).
From a quantitative point of view, very high values for the PET* came out in the investigated areas:
Lippi’s Garden: range from 46.9 to 84.6 °C, with a mean of 65.5 °C;
Building blocks: range from 23.5 to 67.3 °C, with a mean of 46.2 °C;
Parking lot: range from 53.7 to 101.0 °C, with a mean of 86.5 °C;
Entrance of the Nuovo Pignone facility: range from 40.6 to 89.5 °C, with a mean of 58.1 °C.
It is important to mention that these missions, yielding the aforementioned results, were accomplished over two very hot days in August (with an average value of Ta 38.8 °C during the tests), when the researchers worked at a high thermal stress. Therefore, the data collected represent the worst-case scenario as an extreme limit condition for the level of thermal acceptability of the environment by people.
The magnitudes of these PET* values also stem from the experimental nature of the study and its intrinsic monitoring complexities. These results reflect real-world mutual radiative heat exchange conditions, including significant infrared reflections from urban surfaces (e.g., asphalt and industrial materials) that are captured by the infrared thermographic sensors. While these radiative effects are partially accounted for in the globe thermometer measurements, and were further minimized through the pixel filtering of rooftops and vehicles, they highlight the high sensitivity of drone-based thermal imaging to the urban microclimate. Indeed, the high values obtained for the PET* are the strictly connected results of an experimental process validated on-field in real environmental conditions, which demonstrated an optimal correlation between the drone-derived surface temperature (Td) and the globe thermometer temperature (Tg).
Furthermore, thermographic measurements carried out with drone surveys are specifically of an optical–physical nature and can be influenced by the mutual infrared radiations reflected from different urban surfaces. While this contribution is difficult to quantify with absolute accuracy during rapid drone surveys, it represents an intrinsic important challenge of thermal imaging in complex urban built-up environments.
Therefore, it can easily occur, especially during experimental campaigns directed and strongly influenced by extreme and variable climatic forces, that the temperatures acquired by drone flights are slightly overestimated; nonetheless, a similar phenomenon (radiative reflection) also affects the globe thermometer measurements and, consequently, the calculation of the mean radiant temperature. Therefore, the PET* proposed notation is used to physically distinguish these on-field, spatially extended measurements from simulations, taking into account the impact of thermal reflected radiation on the final calculated stress levels.
Combining the maps obtained for four
PET* indices and aligning them with the schematic division into DCVs of the pilot area,
Figure 13 was obtained, providing this composite result.
Therefore, it is important to mention some aspects concerning the measurement errors: for the sake of clarity, the error bands for the measurement in all the graphs.
However, all analyses and post-processing were carried out referring to [
47]. For portable sensors, since they comply with the standard [
35], the accuracy index obtained is the standard reference value, and data processing in relatively stable intervals allowed for an overall relative error of less than 5% for most parameters (e.g., temperatures were below 1% of the measured values).
For the temperatures detected by the drone, the declared accuracy for the thermal imaging camera sensor is around 2% (for a black body at 5 m), but the measurement error compared to the true temperature of the photographed objects cannot be assessed as an absolute value, since it depends on many different external factors, such as the amount of reflected radiation and the angle of the surfaces with respect to the lens. It must also be noted that the thermal imaging camera’s native image processing software has internal temperature correction formulas based on ambient temperature, nearby objects, relative humidity, emissivity, and distance. These parameters are applied to the entire image and cannot be adjusted for specific parts of it (for example, by adjusting the emissivity of materials present in the same shot). The raw sensor data conversion formulas are not available from the manufacturer, so they cannot be applied retrospectively to images outside of the commercial software environment, for example, after a segmentation process implemented in an open source software such as Python version 3.13.7.
Detailed image processing will be explored by the authors, for future and in-progress studies, to overcome these critical issues for improving and increasing measurement accuracy, at least from an optical perspective.
5. Conclusions
The novelty and importance of the proposed method lie in its basic approach that combines integrated techniques of small-scale hyperlocal physical measurements (crucial within the UHI context) and thermal comfort modelling through the calculation of the new proposed index,
PET*. In particular,
PET* values were not directly derived from high-resolution statistical models, such as a regression analysis based on land use/land cover together with morphological data [
48,
49]. They were not even obtained by means of simulations with software such as ENVI-met version 5.7, considering evapotranspiration surfaces and other factors of thermal comfort and quantifying their thermal effects and PET [
50].
The presented results were derived from direct field measurements taken during the worst time of the year from the perspective of the expected external perceived thermal comfort. The proposed method can be applied to scale up urban thermal analysis (UHI combined with PET) while maintaining a strong connection to the physics of local environmental phenomena and their synergistic effects. Although the methodology is universal, the established correlation coefficients are inherently hyperlocal. Therefore, the numerical derivation can be used directly only for similar areas and climate zones (especially in the Mediterranean region) or even larger ones (i.e., from portions of cities and isolated neighbourhoods to entire cities).
The method would also allow for specific analyses, i.e., of individual built-up urban areas with varying amounts of greenery, and targeted comparisons to identify larger-scale strategic solutions aimed at sustainability and climate adaptation, crucial for decreasing GW, with the consequent control, reduction, and mitigation (in intensity and extent) of UHIs, ensuring conditions for the well-being and health of people. The application of the method would be a useful and effective tool for strategic environmental and energy planning for local authorities and governments.
Indeed, from this perspective, the defined routes were designed to pass through locations undergoing intervention by the Municipality of Florence and Nuovo Pignone within the LIFE-ESCAPOS project. All the measures and method applications will be extended until its conclusion in 2027. Therefore, the method will be flexible and updatable to monitor the impact of future actions in the context of continuous change and resilience. By converging simulations with real measurement data, the method will enable the validation of DCV-based models for calculating energy, entropy, and outdoor comfort balances across the entire urban area, with the aim of implementing sustainable development strategies for citizens.
A limitation of the method concerns the physical nature and physical meaning of the introduced new indicator (PET*), derived from direct measurements based on optical phenomena (drone), which takes into account all the phenomena of radiative reflection and absorption inside an urban built-up and green area. The elevated PET* values recorded in this study are deeply rooted in the hyperlocal physical nature of the numerical variables obtained, which were rigorously validated through on-site experimental campaigns under real-world environmental conditions. Although a robust correlation was established between drone-derived surface temperatures (Td) and globe thermometer readings (Tg), it is important to recognize that aerial thermographic surveys are susceptible to interference from mutual infrared radiation reflected by the diverse surfaces of the urban fabric. While precisely quantifying this radiative contribution during flight remains a significant technical hurdle, it constitutes an inherent and critical challenge for thermal imaging applications within complex built-up environments. Indeed, especially during campaigns characterized by extreme and fluctuating climatic forcing, drone-acquired temperatures may exhibit a slight overestimation. Nevertheless, a comparable phenomenon of thermal radiative reflection simultaneously affects globe thermometer measurements; consequently, this bias is similarly reflected in the calculation of the mean radiant temperature, maintaining a consistent relationship between the different datasets.
However, the method is amenable to further development and in-depth analysis. Since the authors cannot easily perform a complete scan of the entire urban environment using UAS in a reasonable amount of time, they are working at targeted studies that allow the physical comparison of drone measurements, starting with pilot projects, with data from satellite imagery (e.g., LST) to find further effective and significant correlations. In this way, the method could be used to validate even larger thermal maps (recall that the typical resolution of satellite thermal data is on the order of 30 × 30 m tiles), highlighting the physical connection these have with comfort-related ground temperature indices such as PET*.