Article

Failure Modes and Effect Analysis of Turbine Units of Pumped Hydro-Energy Storage Systems

1
Faculty of Industrial Technology, Technical University of Sofia, 1000 Sofia, Bulgaria
2
Faculty of Transport, Technical University of Sofia, 1000 Sofia, Bulgaria
*
Author to whom correspondence should be addressed.
Energies 2025, 18(8), 1885; https://doi.org/10.3390/en18081885
Submission received: 21 February 2025 / Revised: 25 March 2025 / Accepted: 2 April 2025 / Published: 8 April 2025
(This article belongs to the Special Issue Optimization Design and Simulation Analysis of Hydraulic Turbine)

Abstract

:
In the present paper, the subject of investigation is the reliability assessment of the single-stage reversible Hydropower Unit No. 3 (HU3) in the Bulgarian Pumped Hydro-Electric Storage (PHES) plant “Chaira”, which processes the waters of the “Belmeken” dam and “Chaira” dam. Preceding the destruction of HU4 and its virtual simulation, an analysis and its conclusions for rehabilitation and safety provided the information required for the reliability assessment of HU3. Detailed analysis of the consequences of the prolonged use of HU3 was carried out. The Supervisory Control and Data Acquisition (SCADA) system records were studied. Fault Tree Analysis (FTA) was applied to determine the component relationships and subsystem failures that can lead to an undesired primary event. A Failure Modes and Effect Analysis methodology was proposed for the large-scale hydraulic units and PHES. Based on the data of the virtual simulation and the investigations of the HU4 and its damages, as well as on the failures in the stay vanes of HU3, it is recommended to organize the monitoring of crucial elements of the structure and of water ingress into the drainage holes, which will allow for detecting failures in a timely manner.

1. Introduction

This article is related to the contract of the “National Electric Company” EAD (NEK AD) of Bulgaria [1] for the investigation and analysis of the possibility of the safe operation of HU3 at the “Chaira” PHES plant. A brief history of the construction and operation of the Chaira HPES can be found in [2].
The objective of the contract was the investigation of the reliability of the single-stage reversible HU3 at the “Chaira” PHES plant, which processes the waters of the “Belmeken” dam and the “Chaira” dam (Figure 1). The “Belmeken” dam is located at an altitude of about 2000 m. The upper water level of the dam is at an altitude of 1920 m. The lowest level is at 1865 m. Figure 1 also shows the altitude of the dam walls. The dam contains 144 million cubic meters of water. The “Chaira” fam is located at an altitude of about 1200 m. It contains about 5 million cubic meters of water. The upper water level of the dam is 1260 m, and the lower level is 1231 m. The plant consists of four hydro units (HUs) that are located at an altitude of 1169 m. The power generated by the “Chaira” PHES is 864 megawatts, and in pumping mode it consumes 788 megawatts. The water pipes are divided into two levels, each with two pipes with diameters of 4.4–4.2 m. The level of the upper section is at an altitude of about 1900 m. The total length of the pipelines is 2510 m for the upper level and 1816 m for the lower level, respectively. The flow rate of each pipe is about 7.2 cubic meters per second.
The scheme of each powerhouse is presented in Figure 2. The high-pressure water flow enters from the “Belmeken” dam (Figure 1) into each HU (Figure 2) through pressure water pipe 6 (penstock) in powerhouse 1 and drives the turbine 1b and the motor–generator in generator mode. In pump mode, pump 1b is turned on, which is driven by the motor–generator in engine mode. The waste water flows through pipeline 7 (tailraces) into the lower reservoir “Chaira” (Figure 1). The water flow is interrupted through the downstream gates 7a. Transformers and power lines are installed in cable gallery 8, and part of the water flow is accumulated in lower surge shafts 3 to equalize the pressure and prevent water hammer. The water flow is regulated through the downstream gates 7a.
The rehabilitation of the HU3 unit began on 20 February 2021 with the completion of repair and installation activities and the adjustment of the unit’s systems. As a result of the damages that occurred in HU4, on 2 June 2022, and before the start of the trial testing stages of HU3, the activities were terminated by the contractor in order to prevent similar damage as that of HU4 [3].
Cases of failures in hydroelectric power plants and, more specifically, in HPESs are not unusual worldwide. Such cases have been described in the literature since the beginning of the 20th century. In [4], many incidents are listed, although it is not a complete list. Predominantly Francis turbines are applied either as turbines or as pumps, since this type of structure is especially effective for both cases. Many cases of Francis turbine failures for the period from 1990 to 2010 are analyzed in the paper of Yasuda and Watanabe [5]. Incidents were reported for power plants in Canada, China, Australia, Iran, Nepal and the USA. One of the most dramatic cases was reported for the Sayano-Shushenskaya power station [6]. In the scientific literature, the destructions and failures of the turbine blade are mainly discussed. In [5], there are no cases analyzed regarding the damages of the stay vanes. Severe vibrations were the reasons for the cracks found in the runners of Francis turbines [7]. Damages as a result of the erosion of the turbine blades and guide vanes were reported in Nepal in 2003 [8]. Cracks were found at the trailing edges of the turbine blades of Francis turbines in Iran in 2006 [9] and in Canada in 2008.
Another case of the destruction of a Francis turbine of 88 MW was reported in the USA in 2008. The runner blades had severe damage due to hard-hitting by a freed guide vane. A similar case was reported in the Tocantins River in central Brazil [10]. The cause was the dropping of a link pin of the guide vane operating mechanism. In 2010, in Canada [11], many cracks were found at the flange fillet of the main shaft at the runner side.
Some cases of spiral casing destructions of Francis turbines are also discussed. In Australia, in 1990, a Francis turbine of 150 MW experienced spiral case failure due to an excessive pressure increase due to the instant shutdown of all guide vanes [12]. Spiral case embedment and destruction was discussed in several articles by Chinese scientists [13,14].
It should be noted that investigations of possible destructions of Francis turbine stay vanes could not be found in the scientific literature. Todorov et al. [15,16,17] analyzed the destruction of the Francis turbine stay vanes of the PHES “Chaira” HU4 and the possible reasons for the occurrence of cracks. They conducted detailed investigations on the influence of concrete erosion [15] on the destruction of the spiral casing and the stay vanes [16]. The fatigue of the material was also discussed [16,17].
The unprecedented accident at HU4 of the Chaira HPP [17] necessitated the termination of the rehabilitation of HU3. The main cause of the accident at HU4 was the complete destruction of all blades, an event that has not been described in scientific publications. In Figure 3 the stay vane No. 1 of HU4 and the cracks are shown. It was proven as a result of the virtual simulations in [16,17] that the reason for the stay vanes’ destruction was the low-cycle fatigue of the material. The red circle shows the stay vane No. 1, where the yellow sector is the part with inadmissible stresses and strains. These are the places where the cracks appeared. Surveying the scientific literature showed that the problems of the fatigue life and the service live of Francis turbines were within the scope of many publications. In [18], it is recommended that fatigue safety factors to be more than 1.5 and guidelines are proposed for the determination of fatigue cycles and crack propagation calculations. In [19], the fatigue reliability of welded steel structures is analyzed. Liu et al. [20] reviewed the publications on the fatigue damage mechanisms in hydro turbines. Lyutov et al. [21] used the stress pulsation amplitude to estimate the number of cycles until the moment of fatigue failure. The numbers of loading cycles and oscillation frequency are also used to calculate the runner service time. Paresas et al. [22] estimated the fatigue lives of Francis turbines based on experimental strain measurements. Biner et al. [23] performed a numerical fatigue damage analysis of a variable-speed Francis pump turbine in start-up and generating modes. In case of variable loading conditions, the use of the correct factor of safety in structural strength calculations is of particular importance. Zhang et al. [24] studied the major factors affecting the fatigue life prediction of steel spiral cases in pumped-storage power plants. They expected that the factors identified in the paper would assist in understanding the role of adequate fatigue design and the analysis of PHES plants.
A key element in the analysis of failures and, most importantly, the probability of their occurrence is the risk assessment methodology. A type of methodology that is increasingly being used in modern products is the Failure Modes, Effects and Analysis (FMEA) methodology. Its premise is the availability of quantitative estimates of the probability of a given type of failure occurring, and it examines in greater detail the types of failure of the facility.
A suitable method for conducting reliability and safety analyses is Fault Tree Analysis (FTA). This method uses systems analysis to determine the component relationships and subsystem failures that can lead to an undesired event, known as a primary event. The automotive industry mainly uses FMEA, while the aerospace industry uses FTA. In many cases, the best results are obtained by combining several analysis methods.
Souza and Álvares [25] applied FMEA and FTA for the assessment of the reliability of hydraulic Kaplan turbines used in the hydroelectric plant of Balbina, Amazonas, Brazil. They showed the contribution of each one to predictive maintenance. Peeters et al. [26] assessed the FMEA model in order to select the critical system-level failure modes. For each of them, a function-level FTA was performed, followed by an FMEA. The Infraspeak Team [27] published a paper about the differences between the FTA and FMEA models. It was shown that each analysis has its own approach to failures, which could lead to different results.
Another type of analysis included in some international standards does not require a quantitative assessment of the probability of a particular type of failure but only a description of the possible failures, their effects and the risk of failure (criticality). This type of analysis is known as risk hazard analysis (RHA). This type of analysis is described in detail by the standards DIN EN ISO 12100 [28].
Flynn [29] discussed the methods used to identify hazards and the causes and consequences of accidents. It was emphasized that many accidents occurred because of a lack of knowledge of the system, process or substance being dealt with. TheSafeyMaster published a study report [30] for consultancy and training services about hazard identification and risk assessment. It was clearly stated that hazard identification and risk assessment are critical processes that organizations need to undertake to ensure the safety of their employees.
This article examined the possibility of accidents occurring at HU3 of the PHES “Chaira” plant. The causes of the HU4 accident were analyzed and the design documentation, the installation process, the SCADA system records, the protocols of the current repairs performed, and the results of the virtual modeling of the hydro units were studied. The results of the HU4 investigations were compared with the data from the investigations of HU3, which did not suffer an accident, as it is identical to HU4, both in terms of construction and installation performance. The results of the SCADA system records and information, as well as the operation data of HU3, were compared with those of the damaged HU4.
The probability of system failure was estimated based on the failure probabilities of the primary events. The creation of the so-called fault tree was based on system and functional analysis, the definition of the unwanted event (failure at the basic level), the determination of the types and categories of failures, the depiction of the effectiveness of failures in the fault tree to the main events, the assessment of the main events from the input data (failure frequency, duration of the events) and the probabilistic assessment of the fault tree. The effects of static loads, dynamic loads and low-cycle loads were investigated. A systematic risk analysis was carried out. The results of the application of FMEA and FTA were supplemented with the results of the hazard and operability study of RHA, with the best solutions being achieved through a combination of the analysis methods. Since the existing methods for risk assessment are mainly used for the aeronautics and automobile industries, the innovation of the proposed methodology consisted of improving it applicability to large-scale hydraulic units such as PHES.
Based on experience and the investigations of the HU4 and its damages, as well as of some failures in the stay vanes of HU3, it is recommended, according to Section 5, to conduct monitoring of the major parts of the HUs, as well as for water ingress into the drainage holes to be organized. This will allow for detecting failures in a timely manner.

2. Materials and Methods

2.1. Risk Analysis: Essence

Risk hazard analysis (RHA), set out in some international standards and safety requirements for a number of devices, does not require a quantitative assessment of the probability of given types of failures. Only a description of the possible failures, their effects and the risk of failure occurring (criticality) is needed. It is used to identify and assess potential risks in the use of a device. The measures taken to ensure operational safety are to be documented, and it is not required to include all measures taken with regard to the safety of the device. It should be noted that technical and formal errors are possible when preparing the documentation.
The presented description of RHA is based on and described in detail by the German standard DIN EN ISO 12100 Part1 [28]. It applies to lifting facilities but also is used for other equipment. The specific possible risks and their causes are the main objects of consideration. The analysis report should also contain prescriptions for operational control based on knowledge of the nature of the occurrence of failures and their specificities. The identification of the risk level is obtained through the assessment of the risk and the corresponding types of dangerous failures. The frequencies and the possibility of failure occurrences are determined according to a scale defined in the standard and shown in Figure 4.
The notations presented on the Figure 4 are as follows:
  • B: 1–4: Categories for security-related parts of controls;
  • N: Normal category for the risk level
  • (N): Additional directions for standard solutions for protection devices and electronical devices (this category can generally be accomplished by using electronics);
  • +: Deviation to an upper category;
  • −: Deviation to a lower category.
Hazard analysis documentation is prepared in order to make the hazard more clear and understandable, and, thus, the hazardous location, the hazard cause and the operating method are also listed. The definition of the type of hazard is evaluated as follows:
  • (S): Grade of the possible injury:
S1: Light injury;
S2: Severe permanent injury.
  • (F): Frequency of the incidence:
F1: Rarely to often;
F2: Frequent to always.
  • (P): Possibility of risk prevention:
P1: Possible risk prevention under certain circumstances;
P2: Almost impossible.
The DIN EN ISO 14121-1 [31] standard defines risk as a combination of the probability of damage occurring and its degree of criticality. There are a large number of procedures for analyzing these factors. In general, two main types of risk analysis are applied—deductive and inductive. The deductive procedure starts with an event and analyzes its causes. The inductive procedure assumes the existence of possible deviations in a process or a system and analyzes their effects.
The technical context of the present study requires that the concept of safety analysis be considered, although the term risk analysis is often used in connection with economic analyses.

2.2. Methodology Used for the Analysis of Failures and Their Effects

The main method used for reliability analysis and the definition of the probability of damage and destruction is based on the investigation performed via Failure Modes, Effects and Criticality Analysis (FMECA) [32]. This method is increasingly being used in modern products. The premise is the availability of quantitative estimates of the probability of a given type of failure and its detailed examination. The FMECA is performed prior to any failure actually occurring. FMECA analyzes risk, which is measured by criticality (the combination of severity and probability), to take action and, thus, provide an opportunity to reduce the possibility of failure.
FMECA and Failure Mode and Effects Analysis (FMEA) [25,26,27] are closely related tools. There are two activities used to perform FMECA: creating FMEA; performing the criticality analysis. Each tool resolves to identify failure modes that may potentially cause product or process failure. FMEA is qualitative, exploring “what-if scenarios”, where FMECA includes a degree of quantitative input taken from a source of known failure rates. A source for such data is Military Handbook 217 [33] or an equivalent source.
As already mentioned, there are a large number of methods for performing analysis and evaluation. The automotive industry mainly uses FMEA, while the aerospace industry uses Fault Tree Analysis (FTA), although very often these two methods are applied sequentially [27]. The chemical industry often uses the hazard and operability (HAZOP) study methodology [34]. In many cases, the best results are obtained by combining several methods for risk and safety analysis.
The FMEA methodology was developed in the NASA space program in 1959/60. FMEA is applied to the study of potential weaknesses in the planning and design phase. This analytical methodology is of a preventive nature.
The analysis of certain risks involves considering each system unit and its association with the probability of hazard. An important element of FMEA is the determination of a quantitative expression of the risk, the risk priority number (RPN), which assesses the criticality of the specific failure. The RPN is determined as follows:
S × O × D = RPN,
where the following is true:
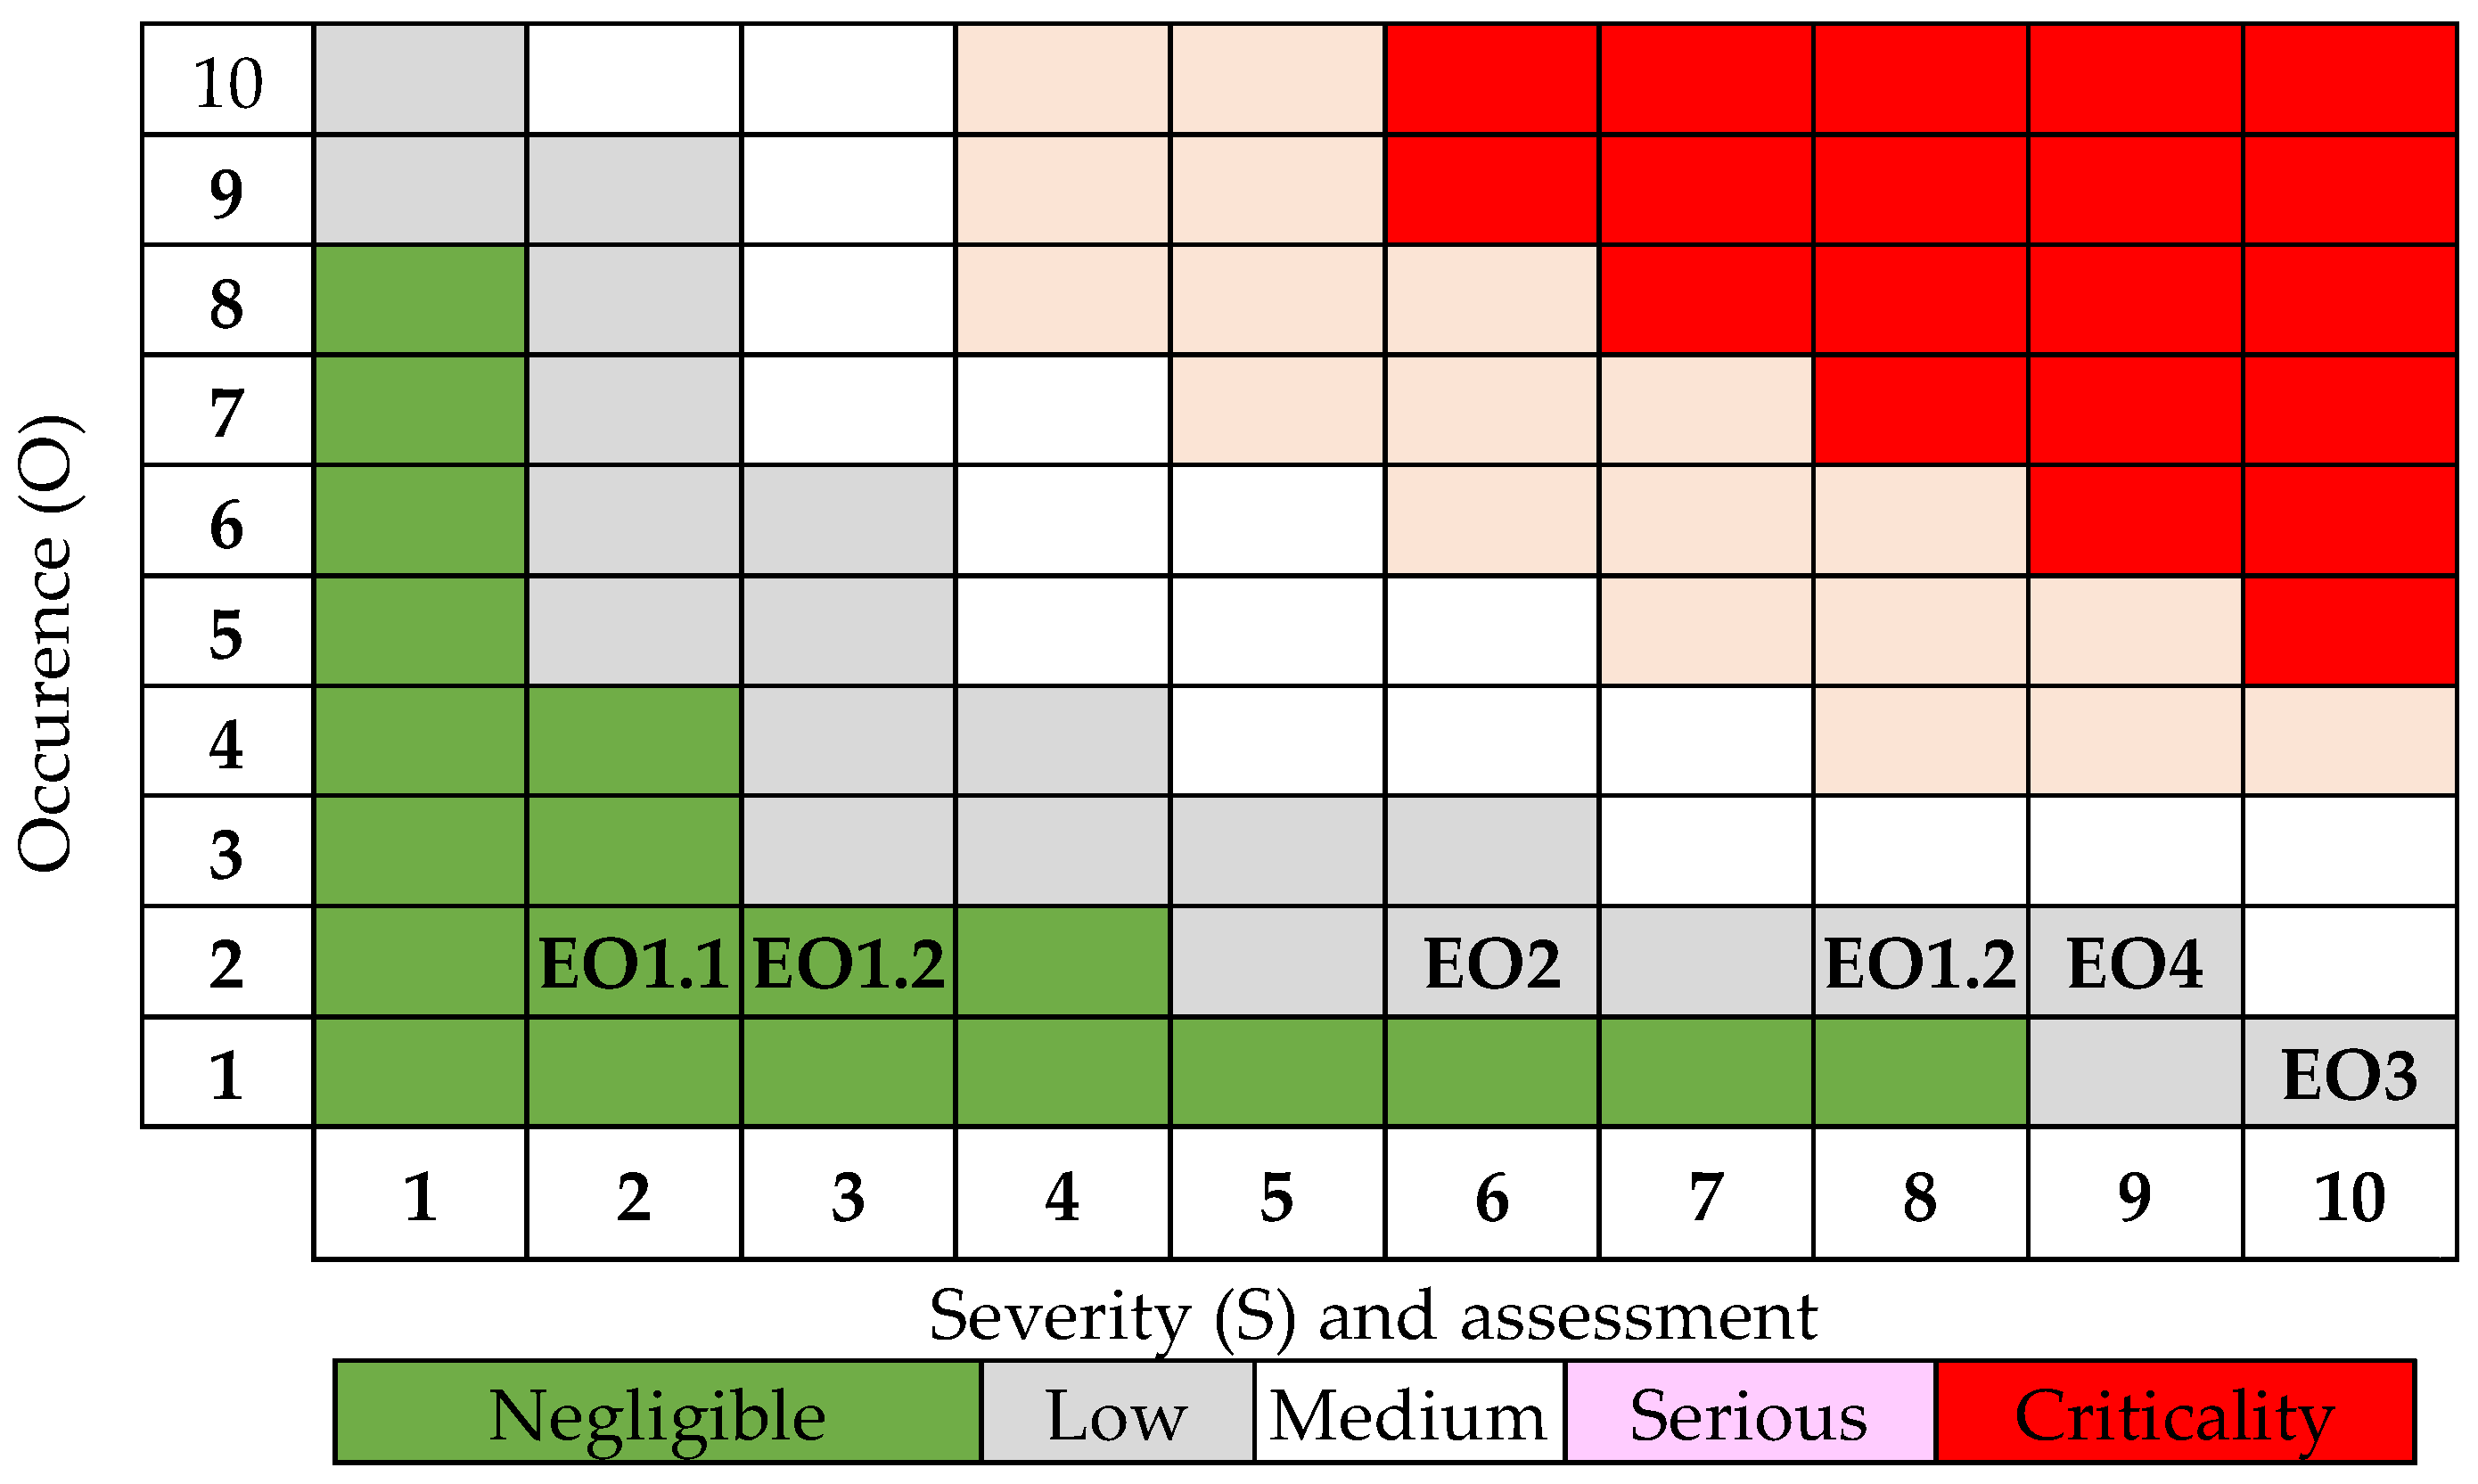
  • S—severity (criticality)—assesses the degree of significance of a failure;
  • O—occurrence (failure intensity)—assesses the likely occurrence of such a failure;
  • D—detection (detectability)—represents the probability of detecting the cause of a failure.
The RPN value is used for decisions regarding the need for intervention and changes. The values indicate the following:
  • RPN values up to 40 indicate low risk (no need for corrective actions);
  • RPN values in the range 40 ÷ 100 indicate moderate risk (certain actions are needed to improve the study object);
  • RPN values above 100 are classified as unacceptable risk (urgent actions are needed).
The generally accepted values and descriptions of these parameters are given in Table 1, Table 2 and Table 3.

3. Results

Fault Tree Analysis of HU3 of PHES “Chaira”

FTA is suitable for conducting reliability and safety analyses. The methodology uses system analysis to determine the relationships and subsystem failures that could lead to an undesired event, known as a primary event. The FTA enables the representation of the functional structure of the system as a causal chain of failures and their effects. The main aim is to estimate the probability of total system failure based on the probabilities of the main failure events occurring. The FTA shows which failures cause emergency events, and the aim is evaluating and predicting possible preventive measures. Further, a quantitative analysis is performed to calculate the probability of the occurrence of an undesirable event.
In general, the following components and fault categories are used:
  • Primary failure (failure of a component under normal operating conditions);
  • Secondary failure (failure of a component as a result of secondary failure from a primary failure or as a result of extreme operating conditions);
  • Errors as a result of incorrect operation or misuse.
An important factor is the nature of the fault linkage. While an “OR” combination of two inputs is sufficient to trigger a fault, an “AND” connection requires both inputs for it to occur.
The creation of the so-called fault tree occurs during the following stages: performing system and functional analysis; defining the unwanted event (failure at the basic level); determining the types and categories of failures; depicting the effectiveness of failures in the fault tree to the main events; evaluating the main events from input data (failure frequency, times); performing probabilistic assessment of the fault tree (calculation of the above event).
A section of the Francis turbine and its simplified mayor units and parts are shown in Figure 5. The following parts are denoted by numbers: 1—the concrete surrounding the structure; 2—the spiral casing; 3—the stay vanes; 4—the guide vanes; 5—the bolts of the upper 6 and the lower 7 covers; 8—the bearing; 9—the runner. The corresponding units are in different colors.
A simple example of a possible failure during HU operation is shown. As a result of increasing the gap between spiral casing 2 and concrete 1, the loading and the deflections in stay vanes 3 become unacceptable and cracking appears. Then, the destruction of stay vanes 3 follows and the destruction of bolts 5 connecting the upper 6 and lower 7 covers follows. Water penetrating through bearings 8 appears. This process was observed during the failure of HU4.
Based on the results, it is possible to determine the most effective measures to eliminate weak points and optimize reliability and safety. This analysis is related to the possible failures of the stay vanes of the spiral casing (stator columns) and the effects caused by them. The following possible failures of the stay vanes are described further down.
  • Primary failures/shutting out (PFs):
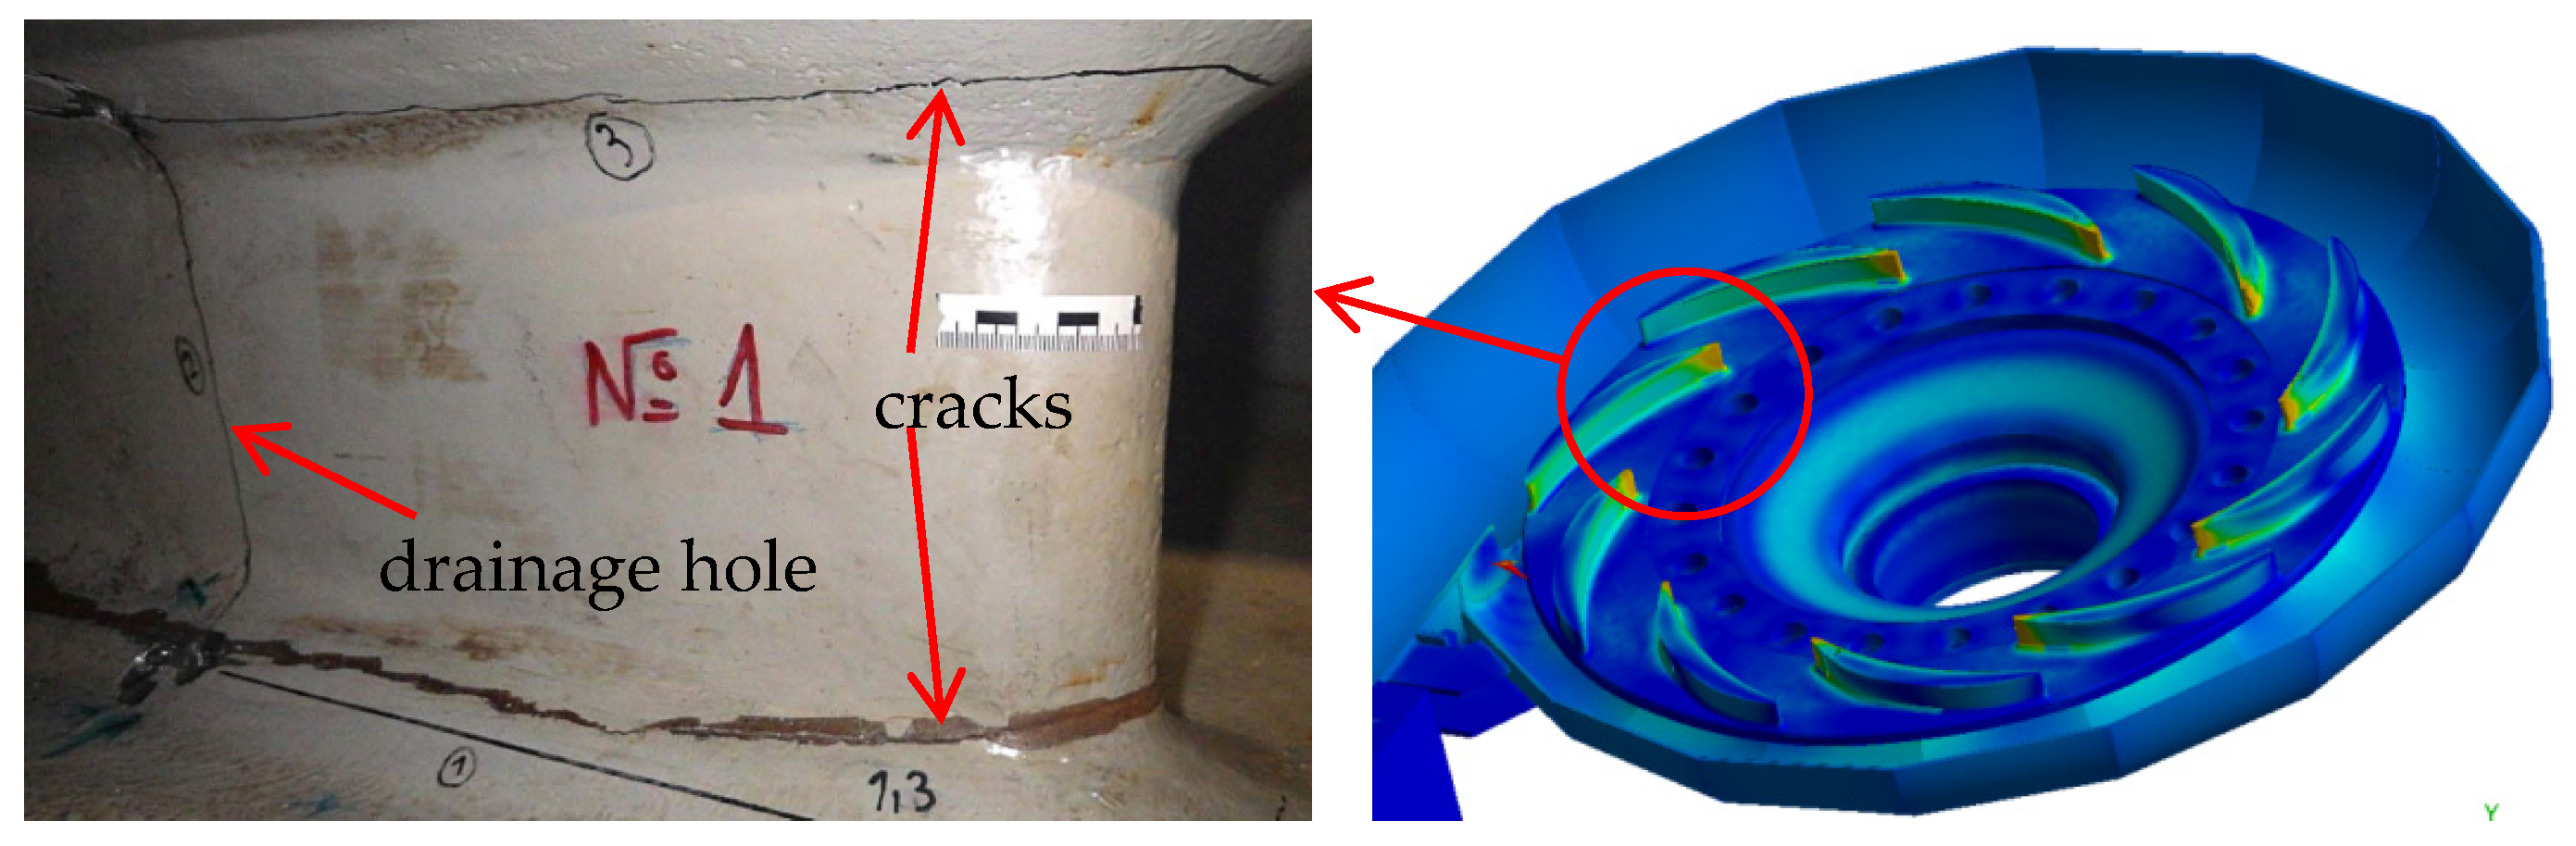
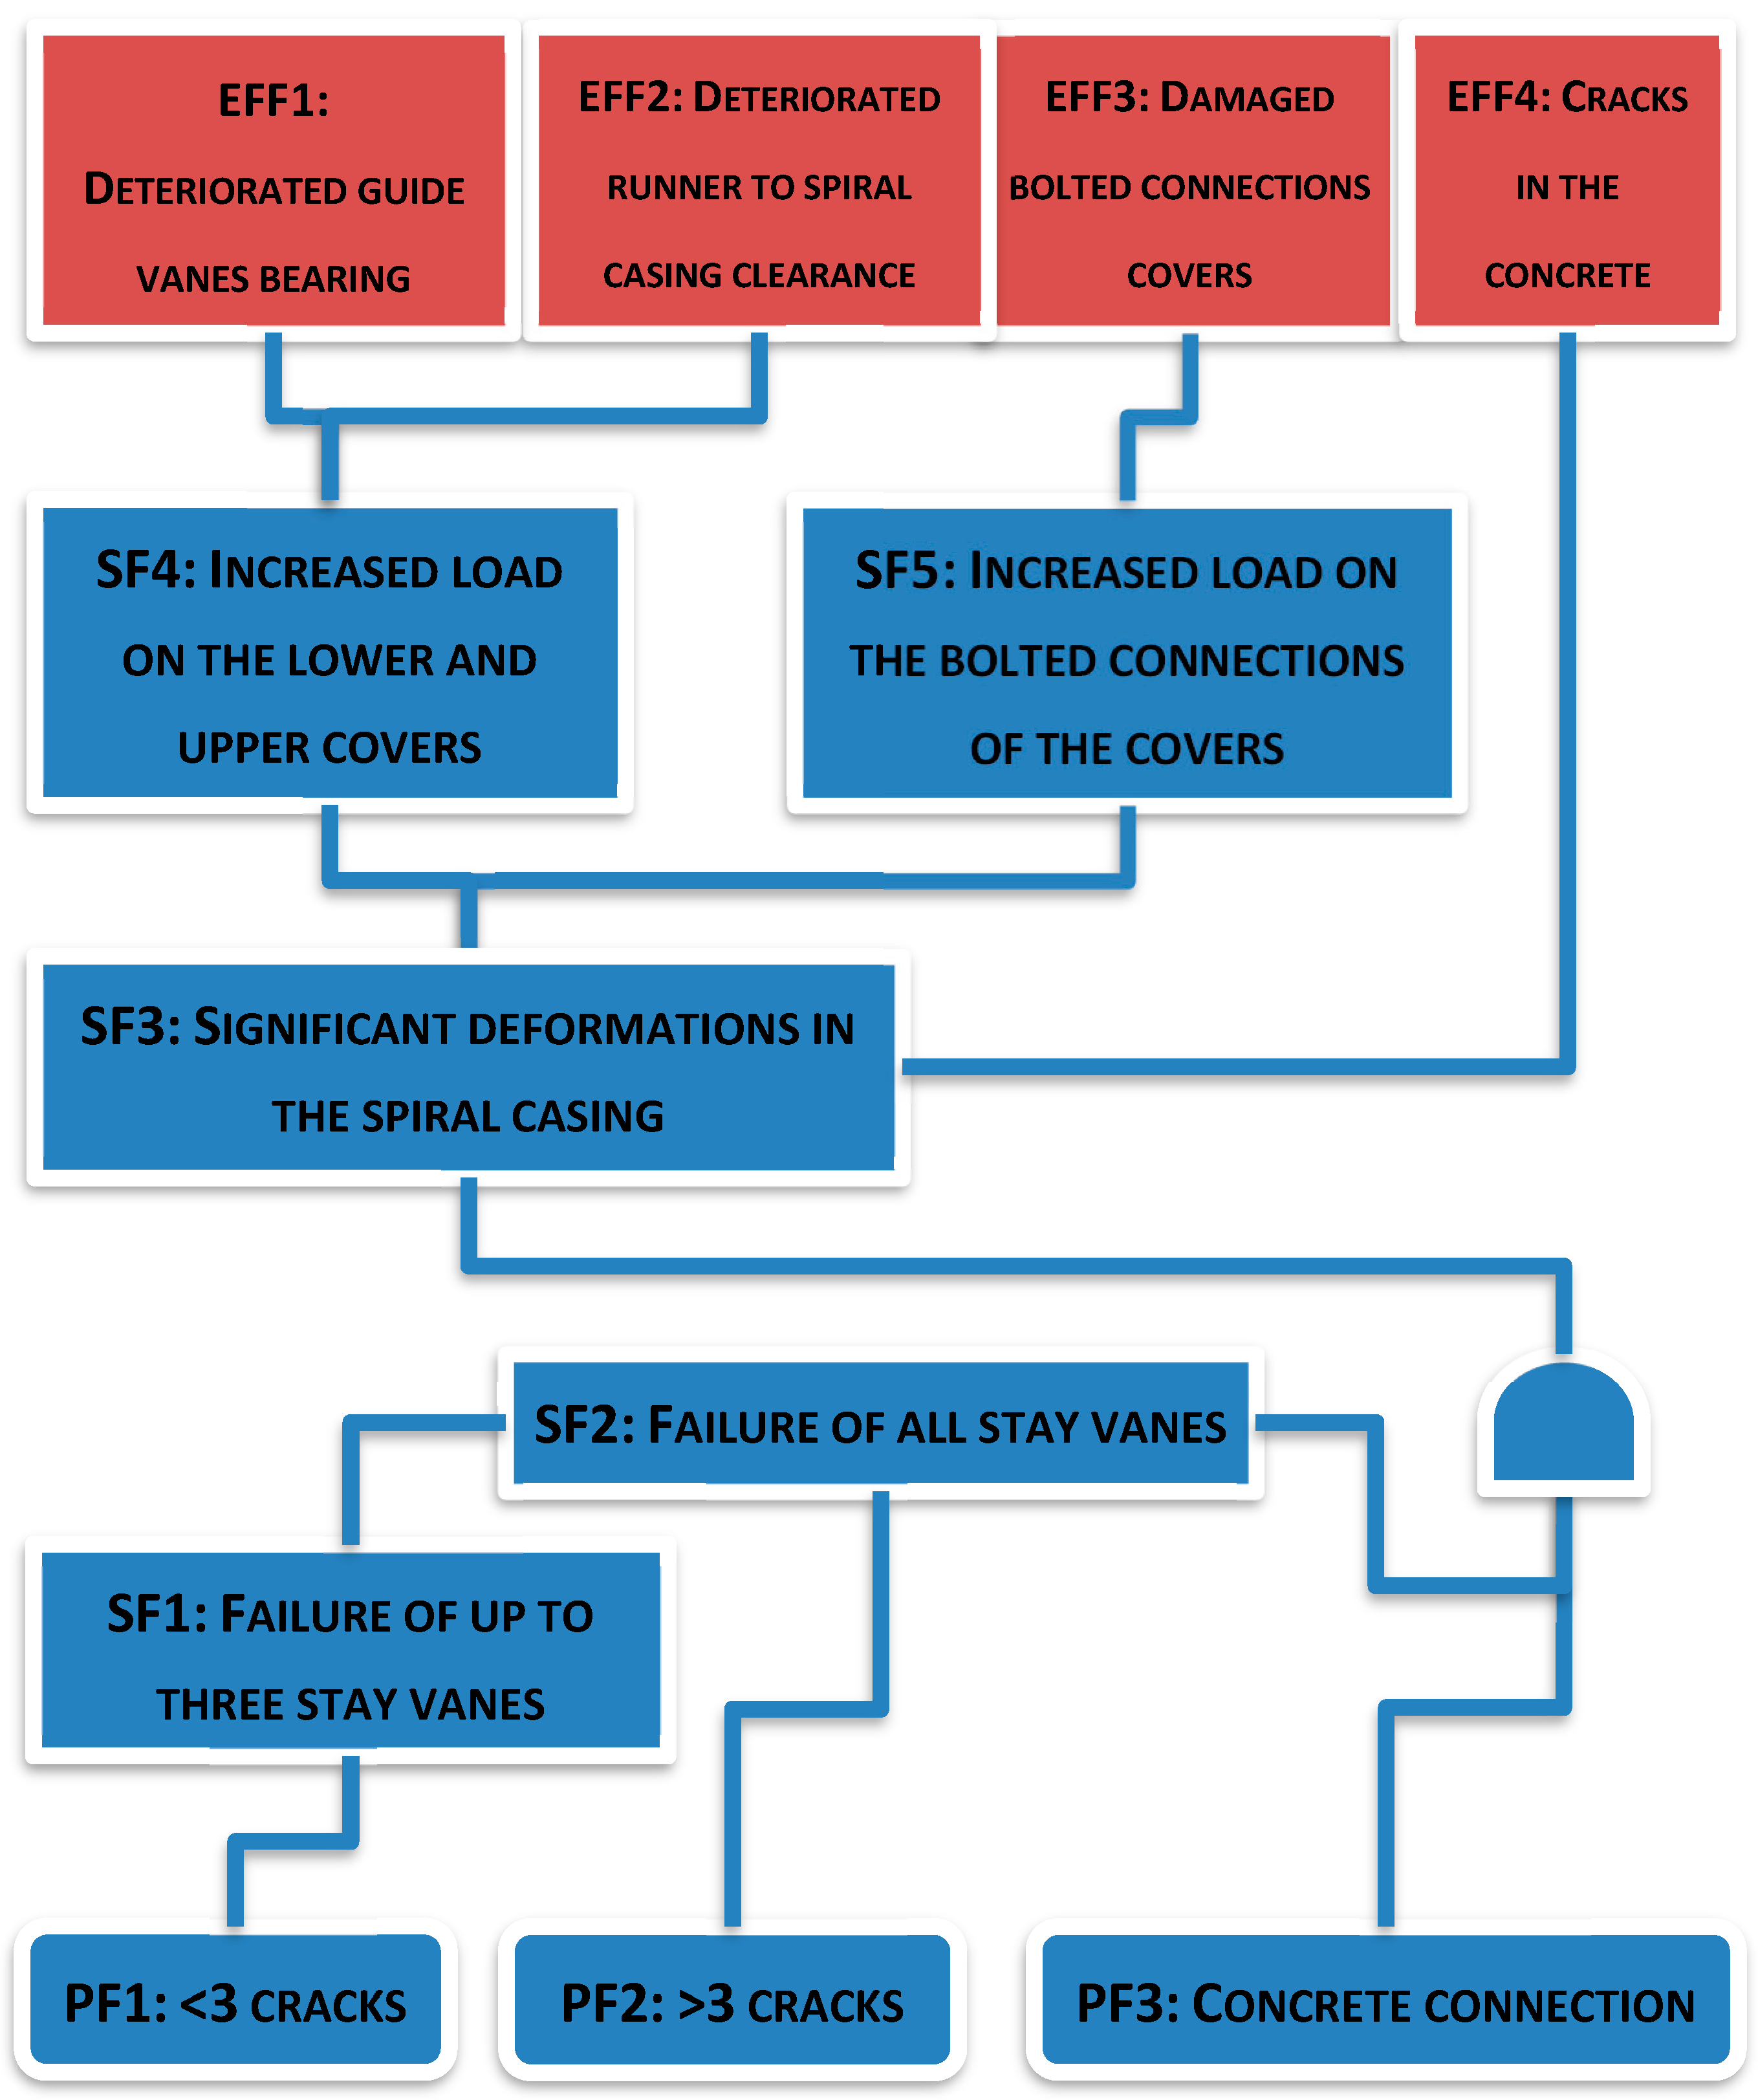
    PF1: Crack formation on the faces of up to three stay vanes due to low-cycle material fatigue;
    PF2: Crack formation on the faces of more than three stay vanes due to low-cycle material fatigue;
    PF3: The violation of the bond between concrete and spiral casing, leading to a backlash.
  • Secondary failures/shutting out (SFs):
    SF1: The failure of up to three stay vanes;
    SF2: The failure of all stay vanes;
    SF3: Significant deformations in the spiral casing;
    SF4: Increased load on the lower and upper covers;
    SF5: Increased load on the bolted connections of the covers due to their overloading by bending moment.
  • Effects of failures (EFFs):
    EFF1: Deteriorated guide vane bearings—the violation of clearance and coaxiality occurs between the guide vanes and the bearings, leading to difficulty closing (switching off) the vane control;
    EFF2: Deteriorated runner to spiral casing clearance—the violation of clearance between the runner and the spiral casing and possible mutual contact;
    EFF3: Damaged bolted connections of covers—the destruction of bolted connections of the covers due to their overloading by bending moment;
    EFF4: Cracks in the concrete—the cracking of the concrete due to the overloading of the spiral casing and the total failure of the stay vanes.
These failures and their effects are used to construct the fault tree, which is drawn as a pictogram that highlights the system relations. It is shown in Figure 6.
The possible failures modes are systematized using the compiled failure tree presented in Table 4.
The failure modes and their effects are quantitatively assessed as the criticality level, intensity of occurrence and degree of detectability in Table 5.
Case EO4—the cracking of the concrete due to the overloading of the spiral casing and broken integrity of the stay vanes—can be found in Table 4. The operating modes are as follows: G1—nominal generator; G2—peak loads in the generator; P1—nominal pump mode; P2—peak loads in the pump; A1—drop of the load.
The parameter RPN (risk priority number) could be calculated according the classification in Table 5 from Equation (1): the risk priority number is calculated as RPN = S × O × D = 18, which could be counted directly from the matrix in Figure 7.

4. Discussion

The processes of analysis related to the rehabilitation, damage and repair of the units of the HPES “Chaira” were carried out after the shutdown for rehabilitation of HA3.
Damages to the stator columns were found, which were not critical at this stage. Soon after that, a very serious damage occurred in HU4, which necessitated thorough analysis of both HU3 and HU4 in order to prevent critical accidents and to plan the appropriate repairs. After the detailed analysis of the failed PHES HU4 [16,17] and the analysis of the records of current repairs and emergency situations in HU3 and HU4, a number of recommendations can be made regarding the maintenance and control of the units in PHES “Chaira”.
Particular attention should be paid to regular inspection and planned repairs. Events that depend on the degree of detectability should be taken into account. These are the units and places classified with 10 points for detectability D (inability to establish the failure, Table 3). Places and units that cannot be identified visually must be equipped with sensors and control devices. These are the guide vanes, the water ingress in the bearings, and the gap between the concrete and the spiral casing. Special attention should be paid to the deflections of the bolts of the upper and lower covers, as well as the stresses in the spiral casing.
Regular inspections of the stay vanes and the cavities on their surfaces because of the cavitation effects are needed. The welded parts of the stay vanes should be regularly monitored. The regimes for the welding of cavities and cracks should be not extreme and must not be the reason for changing the characteristics of the metal.
The results are also visualized as a criticality matrix, as shown in Figure 7.

5. Conclusions

The main task of this study was to propose measures and activities regarding the rehabilitation of HU3, PHES “Chaira”, by analyzing the causes of the damage to its stator columns.
The analysis of the accident that occurred on the identical structure of HU4, PHES “Chaira”, and full analysis of the concrete, spiral chamber, stator columns, loads, and strength and deformation characteristics of the materials of the critical elements are the basis of the comparative analysis of HU3, PHES “Chaira”. The destruction of HU4 and its virtual simulation and analysis, as well as the conclusions for the rehabilitation processes and safety programs, provided information on the possible failure processes in HU3.
Detailed analysis of the consequences of prolonged use of HU3 was carried out. The records of the accidents and the rehabilitation processes were studied and used as the major information sources for the conclusions and proposal of the safety measures.
FTA was applied to determine the component relationships and subsystem failures that can lead to an undesired primary event.
The probability of system failure was estimated based on the failure probabilities of the primary events. The effects of static loads, dynamic loads and low-cycle loads were investigated.
Based on experience and the investigation of HU4 and its damages, as well as of the failures in the stay vanes of HU3, the following are recommended:
  • Regular inspection and planned repairs be to provided.
  • Units that cannot be surveyed visually must be equipped with sensors and control devices; these are the following:
    The guide vanes and their welding places;
    The water ingress in the bearings;
    The gap between the concrete and the spiral casing;
    The deflections of the bolts of the upper and lower covers;
    The stresses in the spiral casing.
  • Monitoring for water ingress into the drainage holes should be organized.
    These measures and additional equipment will allow for the timely detection and prediction of failures.

Author Contributions

Conceptualization, G.T. and K.K.; methodology, G.T., K.K. and Y.S.; validation, I.K. and Y.S.; formal analysis, G.T.; investigation, K.K. and B.Z.; resources, Y.S.; data curation, B.Z. and Y.S.; writing—original draft preparation, K.K.; writing—review and editing, G.T. and K.K.; visualization, Y.S. and B.Z.; supervision, I.K.; project administration, G.T. and I.K.; funding acquisition, I.K.; editing, consultation and review E.Z. All authors have read and agreed to the published version of the manuscript.

Funding

This study is financed by the European Union—Next Generation EU through the National Recovery and Resilience Plan of the Republic of Bulgaria, project № BG-RRP-2.004-0005, and by project KΠ-06-H67/8: Development of a fluid–structural methodology for the study and modernization of turbomachines through virtual prototyping—HydraTech.

Data Availability Statement

The data presented in this study are available on request from the corresponding author. The data are not publicly available due to their relation to public funding specifics.

Conflicts of Interest

The authors declare no conflicts of interest.

References

  1. Available online: https://www.nek.bg/index.php/en/ (accessed on 5 January 2025).
  2. Available online: https://wwtech.com.pl/en/2024/09/11/chaira-pump-storage-hpp-bulgaria/ (accessed on 1 April 2025).
  3. Available online: https://balkangreenenergynews.com/bulgaria-to-replace-broken-turbines-in-chaira-pumped-storage-hydropower-plant/ (accessed on 5 January 2025).
  4. Available online: https://en.wikipedia.org/wiki/List_of_hydroelectric_power_station_failures (accessed on 1 April 2025).
  5. Yasuda, M.; Watanabe, S. How to Avoid Severe Incidents at Hydropower Plants. Int. J. Fluid Mach. Syst. 2017, 10, 296–306. [Google Scholar] [CrossRef]
  6. Available online: https://en.wikipedia.org/wiki/Sayano-Shushenskaya_power_station_accident (accessed on 1 April 2025).
  7. Nicolet, C.; Avellan, F.; Allenbach, P.; Sapin, A.; Simond, J.-J. New Tool for the Simulation of Transient Phenomena in Francis Turbine Power Plants. In Proceedings of the Hydraulic Machinery and Systems, 21st IAHR Symposium, Lausanne, Switzerland, 9–12 September 2002; Available online: https://www.powervision-eng.ch/Profile/Publications/pdf/IAHR_2002.pdf (accessed on 1 April 2025).
  8. Available online: https://www.hydropower.org/sediment-management-case-studies/nepal-kali-gandaki (accessed on 1 April 2025).
  9. Aliabadi; Jam, F.; Ghahremani, H. Crack Formation on Francis Runners for Karun III Hydroelectric Project: Causes and Solutions. In Proceedings of the 1st International and 3rd National Conference on Dams and Hydropower, Tehran, Iran, 8–13 February 2012; Available online: https://civilica.com/doc/138473/ (accessed on 1 April 2025).
  10. Alvarez, A. Solving a Problem Related to Shear Pin Failure. Hydro Review 2011. Available online: https://www.hydroreview.com/world-regions/latin-america/solving-a-problem-related-to-shear/ (accessed on 1 April 2025).
  11. Halipchuk, P.; Penner, K.; Smith, S. Machining Solutions: Repairing Cracked Turbine Shafts at Jenpeg. HydroWorld.com. Available online: https://www.renewableenergyworld.com/baseload/hydropower/machining-solutions-repairing-cracked-turbine-shafts-at-jenpeg/ (accessed on 1 April 2025).
  12. Price, J.W.H. The failure of the Dartmouth turbine casing. Int. J. Press. Vessel. Pip. 1998, 75, 559–566. [Google Scholar] [CrossRef]
  13. Gao, X.; Fu, D.; Wu, H. Embedment of Steel Spiral Casings in Concrete: Lessons from a Structural Deformation Accident in China. Appl. Sci. 2022, 12, 8395. [Google Scholar] [CrossRef]
  14. Ma, Z.; Zhang, C. Static and dynamic damage analysis of mass concrete in hydropower house of Three Gorges Project. Trans. Tianjin Univ. 2010, 16, 433–440. [Google Scholar] [CrossRef]
  15. Todorov, G.; Kralov, I.; Kamberov, K.; Sofronov, Y.; Zlatev, B. Failure mechanisms of stay vanes in a PHES Francis turbine unit. In Proceedings of the 13th International Scientific Conference “TechSys 2024”—Engineering, Technologies and Systems, Plovdiv, Bulgaria, 18 May 2024. [Google Scholar]
  16. Todorov, G.; Kralov, I.; Kamberov, K.; Zahariev, E.; Sofronov, Y.; Zlatev, B. An Assessment of the Embedding of Francis Turbines for Pumped Hydraulic Energy Storage. Water 2024, 16, 2252. [Google Scholar] [CrossRef]
  17. Todorov, G.; Kralov, I.; Kamberov, K.; Sofronov, Y.; Zlatev, B.; Zahariev, E. Investigation and Identification of the Causes of the Unprecedented Accident at the “Chaira” Pumped Hydroelectric Energy Storage. Water 2024, 16, 3393. [Google Scholar] [CrossRef]
  18. Hanel, B. FKM-Guideline. In Analytical Strength Assessment of Components in Mechanical Engineering; VDMA Verlag GmbH: Frankfurt, Germany, 2003. [Google Scholar]
  19. Chryssanthopoulos, M.; Righiniotis, T. Fatigue reliability of welded steel structures. J. Constr. Steel Res. 2006, 62, 1199–1209. [Google Scholar] [CrossRef]
  20. Liu, X.; Luo, Y.; Wang, Z. A review on fatigue damage mechanism in hydro turbines. Renew. Sustain. Energy Rev. 2016, 54, 1–14. [Google Scholar] [CrossRef]
  21. Lyutov, A.; Kryukov, A.; Cherny, S.; Chirkov, D.; Salienko, A.; Skorospelov, V.; Turuk, P. Modeling of a Francis Turbine Runner Fatigue Failure Process Caused by Fluid-Structure Interaction. IOP Conf. Ser. Earth Environ. Sci. 2016, 49, 072012. [Google Scholar] [CrossRef]
  22. Presas, A.; Luo, Y.; Wang, Z.; Guo, B. Fatigue life estimation of Francis turbines based on experimental strain measurements: Review of the actual data and future trends. Renew. Sustain. Energy Rev. 2019, 102, 96–110. [Google Scholar] [CrossRef]
  23. Biner, D.; Alligné, S.; Nicolet, C.; Dujic, D.; Münch-Alligné, C. Numerical fatigue damage analysis of a variable speed Francis pump-turbine during start-up in generating mode. In IOP Conference Series: Earth and Environmental Science; IOP Publishing: Bristol, UK, 2022; Volume 1079, p. 012079. Available online: https://iopscience.iop.org/article/10.1088/1755-1315/1079/1/012079 (accessed on 1 April 2025).
  24. Zhang, Q.-L.; Hu, L.; Gao, X.-F. Fatigue life prediction of steel spiral cases in pumped-storage power plants: Factors to be considered. Eng. Fail. Anal. 2024, 157, 107908. [Google Scholar] [CrossRef]
  25. Souza, R.Q.; Álvares, A.J. FMEA and FTA Analysis for Application of the Reliability Centered Maintenance Methodology: Case Study on Hydraulic Turbines. ABCM Symposium Series in Mechatronics. 2008; Volume 3, pp. 803–812. Available online: https://www.abcm.org.br/symposium-series/SSM_Vol3/Section_VII_Emerging_Technologies_and_Applications/SSM3_VII_10.pdf (accessed on 1 April 2025).
  26. Peeters, J.F.W.; Basten, R.J.I.; Tinga, T. Improving failure analysis efficiency by combining FTA and FMEA in a recursive manner. Reliab. Eng. Syst. Saf. 2018, 172, 36–44. [Google Scholar] [CrossRef]
  27. InfraSpeak Team. FTA vs FMEA: What Are the Differences? 23 October 2020. Available online: https://blog.infraspeak.com/fta-vs-fmea/ (accessed on 1 April 2025).
  28. Standard: DIN EN ISO 12100:2011-03, Safety of Machinery—General Principles for Design—Risk Assessment and Risk Reduction, Publication Date 2011-03, Original Language German, Pages 96. Available online: https://www.dinmedia.de/en/standard/din-en-iso-12100/128264334 (accessed on 1 April 2025).
  29. Flynn, A.M. Hazard Risk Assessment, Chapter in the Book. In Introduction to Environmental Management, 2nd ed.; Theodore, M.K., Theodore, L., Eds.; CRC Press: Boca Raton, FL, USA, 2021; pp. 1–11. Available online: https://www.taylorfrancis.com/chapters/edit/10.1201/9781003171126-44/hazard-risk-assessment-ann-marie-flynn (accessed on 1 April 2025).
  30. TheSafetyMaster. Hazard Identification and Risk Assessment; Study Report Consultancy and Training Services; TheSafetyMaster: Gurugram, India, 2024; Available online: https://www.thesafetymaster.com/hazard-identification-and-risk-assessment-study-report-consultancy-and-training-services-by-thesafetymaster/ (accessed on 1 April 2025).
  31. Standard DIN EN ISO 14121-1:2007-12 Safety of Machinery—Risk Assessment—Part 1: Principles (ISO 14121-1:2007); German Version Sicherheit von Maschinen—Risikobeurteilung—Teil, Pages 35. Available online: https://www.dinmedia.de/en/standard/din-en-iso-14121-1/94405328 (accessed on 1 April 2025).
  32. Quality-One International. Introduction to Failure Mode, Effects & Criticality Analysis (FMECA). Available online: https://quality-one.com/fmeca/ (accessed on 1 April 2025).
  33. Military Handbook. Reliability Prediction of Electronic Equipment. 1991. Available online: https://www.navsea.navy.mil/Portals/103/Documents/NSWC_Crane/SD-18/Test%20Methods/MILHDBK217.pdf (accessed on 1 April 2025).
  34. Rausand, M.; Haugen, S. Risk Assessment: Theory, Methods, and Applications, 2nd ed.; Wiley: Hoboken, NJ, USA, 2020; ISBN 978-1-119-37722-1. [Google Scholar]
Figure 1. The principal scheme of the PHES “Chaira” plant.
Energies 18 01885 g001
Figure 2. The structure of a unit of PHES at the “Chaira” plant.
Energies 18 01885 g002
Figure 3. The cracks of stay vane No. 1 of HU4 [17].
Energies 18 01885 g003
Figure 4. The risk assessment system for performing RHA according to DIN EN ISO 12100 Part1.
Energies 18 01885 g004
Figure 5. A section of the Francis turbine and its main units and details.
Energies 18 01885 g005
Figure 6. Fault tree related to stay vanes.
Energies 18 01885 g006
Figure 7. Failure criticality matrix.
Energies 18 01885 g007
Table 1. Severity (S): criticality levels and their assessment.
LevelDescriptionRating (S)
NoneNo effect on components1
MinorMinor effect on the system2
Very lowSlightly pronounced impact on the system3
LowLow level of criticality regarding the functioning of the system4
AverageThe system is functioning, albeit with broken parameters 5
HighReduced system functionality6
Very highLoss of important system functions7
DangerousFunctions are lost, leading to potential danger to users8
Very dangerousPotentially dangerous system condition, with indications allowing preventive action9
Extremely dangerousSystem condition with possible critical impacts on personnel, albeit without possibility of detection and prevention10
Table 2. Occurrence (O): failure intensity assessment.
IntensityProbabilityRating (O)
Extremely low≤1 × 10−51
Low1 × 10−42
Average grade5 × 10−43
1 × 10⁻³⁴
2 × 10⁻³⁵
High degree (repeatability)5 × 10−36
1 × 10⁻²⁷
2 × 10⁻²⁸
5 × 10⁻²⁹
Very high degree≥1 × 10−110
Table 3. Detection (D): detection rate.
GradeDescription Rating (D)
Very highVery high probability of failure detection1
HighHigh probability of failure detection2
Relatively highRelatively high probability of failure detection3
MediumAverage probability of detecting failure4
Relatively lowRelatively low probability of detecting the potential cause/mechanism of failure5
LowLow probability of detecting the potential cause/mechanism of failure6
Very lowVery low probability of detecting the potential cause/mechanism of failure7
WeakWeak probability of detecting the potential cause/mechanism of failure8
Very weakVery weak probability of detecting the potential cause/mechanism of failure9
ImpossibleInability to establish the failure10
Table 4. Possible failure modes and their effects.
Effect of RefusalModeEffectMark
EO1: The violation of the clearance and alignment between the guide vanes and bearings, leading to difficult or no controlP1/P2/Strong vibrations in the structure;
Water appearing in the service area through drainage holes in the stay vanes.
EO1.1
G1/G2Strong vibrations in the structure;
Water appearing in the service area through drainage holes in the stay vanes;
Difficulty closing the water flow and switching off the machine
EO1.2
A1Strong vibrations in the structure;
Water appearing in the service area through drainage holes in the stay vanes;
A rapid increase in the machine rotation frequency and danger of exceeding critical ones, leading to destruction;
Serious damage to the electrical part of the system
EO1.3
EO2: The violation of the clearance between the runner and the spiral casing and contactG1/G2/P1/P2/A1Strong impacts on the structure;
Water in the service area;
The risk of the destruction of the runner bearing;
Possible mechanical damage to the spiral casing and the runner
EO2
EO3: The destruction of bolted connections of the covers due to overloading by bending momentG1/G2/P1/P2/A1Strong impacts on the structure;
Massive water ingress into the engine room;
Difficult or impossible to close the guide vanes
EO3
EO4: The cracking of the concrete due to the overloading of the spiral casing and broken integrity of the stay vanesG1/G2/P1/P2/A1Severe deformations in the structure;
Difficult or impossible to close the guide vanes
Danger of the destruction of the runner bearing;
Serious damages to the electrical part of the system
EO4
Table 5. Evaluation of failure modes.
Failure EffectSeverity (S)Occurence (O)Detection (D)RPN
EO1.122624
EO1.232636
EO1.382232
EO262112
EO3101220
EO492118
Disclaimer/Publisher’s Note: The statements, opinions and data contained in all publications are solely those of the individual author(s) and contributor(s) and not of MDPI and/or the editor(s). MDPI and/or the editor(s) disclaim responsibility for any injury to people or property resulting from any ideas, methods, instructions or products referred to in the content.

