Abstract
This paper provides a comprehensive review of the integration of carbon capture, utilization, and storage (CCUS) technologies in waste-to-energy (WtE) plants, specifically focusing on incineration, the most adopted process for managing residual waste fractions that cannot be recycled. The review examines the current CO2 capture technologies, including the widely used monoethanolamine (MEA) absorption method, and explores emerging alternatives such as molten carbonate fuel cells and oxyfuel combustion. Additionally, the paper discusses the management options for the captured CO2, exploring both storage (CCS) and utilization (CCU) options, with a focus on current storage projects involving CO2 from WtE plants and the potential for its use in sectors like chemicals, construction materials, and synthetic fuels. Currently, only four large-scale WtE plants worldwide have successfully implemented carbon capture technologies, with a combined capacity of approximately 78,000 tons of CO2 per year. However, numerous feasibility studies and pilot-scale projects are ongoing, particularly in northern Europe, with countries such as Norway, the Netherlands, Sweden, the United Kingdom, and Finland leading the way in the development of CO2 capture, storage, and utilization strategies within the WtE sector. The paper further discusses techno-economic issues for CCUS implementation, including energy demands and associated costs. The use of MEA systems in WtE plants leads to significant energy penalties, reducing plant efficiency by up to 40%. However, alternative technologies, such as advanced amines and calcium looping, could provide more cost-effective solutions by improving energy efficiency and reducing the overall costs. Life cycle assessment studies indicate that CCUS has the potential to significantly reduce CO2 emissions, but the achievable environmental benefits depend on factors such as energy consumption, process efficiency, and system integration. Overall, while the implementation of CCUS in WtE plants presents CO2 mitigation potential and may also be exploited to achieve other benefits, energy requirements and economic viability remain challenging.
1. Introduction
According to the Intergovernmental Panel on Climate Change (IPCC), it is indisputable that human activities are the primary cause of the increase in well-mixed greenhouse gas (GHG) atmospheric concentrations observed since 1750 and of the associated average rise of above 1.1 °C in the global surface temperature compared to 1850–1900 levels [1]. The IPCC has also outlined near-, medium- and long-term risks and highlighted the necessity to take immediate action to improve the current condition [1]. In the last decade, many countries, as well as high-GHG-emitting sectors, have established emission reduction targets and promoted specific policies. In particular, one of the most notable is the Paris agreement achieved at the United Nations 21st Conference of the Parties in 2015, by which 196 countries committed to the goal of keeping the increase in the global average temperature well below 2 °C above preindustrial levels [2]. Furthermore, the European Union (EU), through the Europe Climate Law [3], established a roadmap for achieving a climate-neutral economy and society by 2055, with an intermediate target of reducing net GHG emissions by at least 55% by 2030 compared to 1990 levels.
From this perspective, the waste management sector also needs to formulate and implement its own climate change mitigation strategies. According to Climate Watch and the World Resource Institute, in 2021 the global GHG emissions of the waste sector represented 3,4% of total greenhouse gas emissions, corresponding to 1677 Mtons CO2eq [4]. The main contributors to these emissions were landfills (59% in 2021), followed by wastewater treatment processes (38% in 2021), waste-to-energy plants (around 3% in 2021), and other sources of minor relevance [4,5]. Worldwide, around 37% of waste is disposed of in landfills, 33% is sent to open dumps, 19% is reused or processed for material recovery (including composting), and around 11% is treated in waste-to-energy (WtE) plants [6]. Dumping and also landfilling are unsustainable solutions and have been identified as significant sources of methane emissions. In fact, in 2022, methane emissions from European landfills reached approximately 78 Mtons CO2eq, accounting for 80% of the waste sector’s methane emissions [7]. This gas has a short atmospheric lifetime and a high Global Warming Potential (GWP), 28 times that of CO2 over 100 years and 86 times that of over 20 years, meaning that a decrease in methane emissions could lead to a rapid improvement in the fight against climate change. To reduce the GHG emissions and other environmental impacts of the waste sector, the EU adopted the circular economy package in 2018, which aims at maximizing material recovery from waste, while minimizing landfill disposal. For example, it has established a minimum target of 65% and a maximum one of 10% for municipal waste recycling and landfilling, respectively. Considering the amounts of waste that are currently sent to disposal, it is clear that alternative treatment options must be applied, since a large amount of this waste cannot be recycled. Waste-to-energy represents one of the most viable and proven options to manage the non-biodegradable fraction of waste. Furthermore, even in a circular economy scenario, WtE technologies will still be necessary as a waste treatment strategy to manage the residual waste that cannot be feasibly recycled [8], but this technology must be adapted to meet new requirements. IEA bioenergy identified four central areas where innovation should be prioritized with regard to WtE in a future circular economy scenario [9]: material recovery from ashes; energy recovery from an industrial symbiosis perspective; difficult waste treatment in a sustainable consumption scenario; and carbon capture, utilization, and/or storage (CCUS) to counter fossil carbon emissions from the burning of the non-biogenic waste stream and further reduce the carbon footprint of this treatment process. Even in a future climate-neutral economy that must significantly alter its production and/or consumption habits to achieve neutrality, fossil carbon-based materials will still be used and will hence be retrieved in waste materials. Therefore, carbon capture, utilization, and/or storage (CCUS) can play a central role in reducing the GHG emissions of WtE, even leading to net negative CO2 emissions, depending on the composition of the treated waste and utilization or storage option considered. From this perspective, the European Council, the European Commission, and the European Parliament, in December 2022, started the process for including WtE plants in the EU GHG Emission Trading System (ETS) that up to that point had regarded only the energy and heavy industry sectors: “EU countries must measure, report, and verify emissions from municipal waste to energy installations from 2024. By 31 January 2026, the Commission shall present a report with the aim of including such installations in the EU ETS from 2028 with a possible opt-out until 2030 at the latest” [10].
However, at present, full-scale CCUS applications in the WtE sector are still scarce; instead, a large number of feasibility studies, pilot projects, and large-scale projects have been (or are being) carried out, mainly in Norway, the Netherlands, Sweden, and Finland. Switzerland, in addition, requires WtE plants to be equipped by 2030 with at least one CO2 capture plant with a minimum nominal capacity of 100,000 tons CO2/year [11].
Despite the ongoing initiatives, challenges remain for the full-scale integration of CCUS in WTE plants, particularly in terms of economic viability, energy efficiency, and long-term environmental impacts. Continued research, technological advancements, and supporting policies are essential for overcoming these barriers.
Most reviews published on CCUS focus on general technological aspects or its application to conventional power plants [12,13] (e.g., coal- and gas-fired plants) and hard-to-abate sectors [14,15] such as the cement, steel, and chemical industries. This review specifically examines the integration of CCUS in WtE plants, and differently from [16], which primarily addresses operational principles, emission types, and regulatory frameworks, this paper offers a detailed analysis of the unique challenges and opportunities related to energy production, economic considerations, and life cycle assessment (LCA) in the context of WtE systems. By focusing on these critical aspects, this review aims at offering new insights that are less explored in the existing literature, contributing to a deeper understanding of CCUS in WtE applications. After a brief overview of the current characteristics of waste-to-energy plants, as well as of their GHG emissions, carbon capture, storage, and utilization technologies applicable to WtE plants are reviewed. Examples of cases in which CCUS is already integrated into the plants are provided as well as future projects. Finally, the techno-economic and environmental impacts of the application of CCUS in WtE plants are discussed.
2. Current Status of WtE Systems
WtE makes use of a thermal process to treat waste streams that cannot be prevented or recycled in a technically or economically viable manner. Waste-to-energy processes refer to various methods used to manage different types of waste while recovering energy. These processes include the following:
- Anaerobic Digestion, which is applied specifically to organic waste that is biodegraded by microorganisms in an oxygen-free environment, producing biogas (with a 50–60% vol. methane content) that is exploited for electricity and/or heat production or as a fuel after upgrading processes.
- Gasification, in which waste is heated in a low-oxygen environment to produce a synthetic gas (syngas), which can be used to generate electricity or be converted into a fuel.
- Pyrolysis, which involves the thermal decomposition of waste in the absence of oxygen, generating bio-oil, syngas, and char.
- Incineration, through which waste is combusted in air at a high temperature, producing heat that can be used to generate electricity and/or provide district heating.
By far the most adopted process employed in WtE plants is oxidation in excess air, i.e., incineration. Hence, in this paper, where not explicitly mentioned otherwise, by WtE we mean waste incineration plants. In line with the European Union’s waste hierarchy concept, energy recovery methods such as WtE represent an improved strategy compared to landfilling, which should, however, only be employed for managing residual waste that cannot be sent to material recovery. The priority, hence, remains the separation of recoverable materials from waste at the source, in order to direct them to high-quality recycling processes. As previously mentioned, while prevention and recycling are priority strategies, even in a circular economy system, WtE is a necessary element. There will in fact always be residual waste that cannot be effectively recycled, as well as by-products from waste sorting and recycling processes, such as non-compostable materials from the management of organic waste, heterogeneous plastics mixed with non-plastic impurities from plastic recycling, and pulper waste residues, which primarily consist of mixed plastics from paper recycling [17]. These materials are not recyclable and, in many cases, are suitable for energy recovery. Therefore, waste-to-energy and recycling are complementary methods and key solutions for minimizing waste disposal. This is clearly evident in Europe, where countries with higher incineration rates also achieve the highest recycling rates [18] and do not need to landfill non-recyclable waste. Also in the United States, evidence from a study covering 82 WtE facilities across 22 states showed that communities using waste-to-energy exhibited an aggregate recycling rate at least 5% points above the national average, indicating that indeed WtE does not negatively impact recycling rates and can coexist with recycling programs [19].
WtE reduces the volume of the treated waste by around 90% and produces heat and/or electricity. The heat generated from incineration is used to generate steam, which, in turn, can be employed to produce electricity. Currently, there are more than 2600 plants worldwide that treat around 460 Mtons/year of waste [20]. Due to the limited land available for landfills and high urban population density, Asian countries have the highest number of waste-to-energy plants, with around 1500. Japan is particularly notable in this regard, with around 70% of MSW being processed by small facilities that also employ other technologies besides incineration. Europe has around 500 plants, and the size of installations varies between different technologies and waste types. The largest incineration plant in Europe has a capacity of more than 1 million tons of waste per year [21]. Currently, more than 60% of European waste incineration plants are combined heat and power plants. In 2019, the European WtE sector produced about 39 TWh of electricity and 90 TWh of heat [22], and assuming to meet the circular economy targets for municipal, commercial, and industrial waste, a total energy production of around 189 TWh has been estimated for 2035 [23]. This would be equivalent to the energy supplied by 19.4 billion m3 of natural gas in terms of primary energy, corresponding to approximately 12% of the natural gas imported in 2021 from Russia to the EU [23].
The process generates two main types of solid residues: bottom ash and fly ash. The bottom ash consists mainly of coarse non-combustible materials collected at the outlet of the combustion chamber. In many incineration plants, the combustion chamber uses a moving grate system. As the waste burns, the bottom ash falls through the grate and moves toward the end of the chamber, accumulating at the bottom of the furnace. This ash is cooled using either air or water and then removed by mechanical equipment and transported to storage or treatment areas for further processing. Bottom ash represents the most significant residue in terms of mass, with its production amounting to approximately 20% by weight of the incinerated feed waste [24]. Until recently, in Italy, as well as in other European countries, this residue was disposed of directly in landfills or at most employed as an additive in cement manufacturing. However, in recent decades, this heterogeneous material has been increasingly sent to large treatment plants to recover ferrous and non-ferrous metals and also to obtain mineral fractions (90% by weight of the total bottom ash) that can be used in construction, for example, as aggregates or sand substitutes in concrete or asphalt mixtures and in addition to cement or ceramics manufacturing [24]. Fly ash can include both the ashes collected in the boiler section of the incineration plant and air pollution control (APC) residues resulting from flue gas treatment. However, the management of these ashes depends on operational practices and regulatory requirements. In some cases, boiler ash and APC residues are combined and treated as a single waste stream, while in others, they are kept separate due to differences in their physicochemical properties, contamination levels, or potential utilization applications. These ashes are typically collected through a variety of systems, such as electrostatic precipitators or baghouse filters, which are designed to trap fine particulate matter and pollutants from the exhaust gases. Generally, fly ash has a fine particle size and contains significant concentrations of metals, metalloids, and salts, leading to its classification and management as hazardous waste. Due to its high contaminant levels, which make recovery challenging, and its lower weight (3–4% of the mass of the feed waste) compared to bottom ash, it has traditionally been considered uneconomical to process. As a result, it is typically sent to final disposal. However, in recent years, there has been growing interest in developing recovery pathways for this material after treatments aiming to reduce its environmental impact and exploring potential utilization applications [25,26]. The flue gas generated from the process, before being released into the atmosphere, undergoes advanced treatments to substantially reduce the concentrations of contaminants (i.e., particle matter, NOx, acid gases, heavy metals, and dioxins) and guarantee emissions nearly at the threshold of detectability. The complexity of the flue gas treatment section has increased over the years due to stricter regulations and advances in air pollution control technologies. In relation to emissions reduction, the European Commission published the BREF—Best Available Techniques (BAT) Reference—Document [21] to promote environmental and human health protection. The EU Commission periodically updates this document, reporting the best techniques currently available and industrially exploitable BATs and the limit values achievable by applying these techniques. The objective is to continually upgrade technologies and ensure that all facilities employ them in order to consistently reduce their environmental impact. A plant must be authorized according to what is reported in the BREF, and old permits must be reviewed in all EU Member States to ensure compliance with the values of BAT emission limits. Compared to other emissive sectors such as combustion plants and industrial activities, the emission limits for WtE facilities are the most restrictive [17].
Opponents to the expansion of waste-to-energy have frequently voiced worries about the health effects on those living close to WtE facilities. To understand the health status of the population exposed to risk factors from WtE, the historical development of the technologies employed in a waste-to-energy plant must be considered. It is important to highlight the differences between a recent, well-designed and -managed incineration plant and an older generation plant (before the 2000s), characterized by higher emissions due to limited technology for managing flue gases and lower incineration temperatures. Newer facilities are typically built employing higher engineering standards and are equipped with more advanced air pollution control systems. As mentioned previously, these facilities are strictly monitored, and their emissions are strongly regulated. As a result, emissions from these plants are kept to a minimum, ensuring better environmental performance. The conclusions of epidemiological studies performed in different areas of the world analyzing the health of people living near to a WtE plant are consistent and indicate that there is no evidence that modern waste-to-energy plants that comply with emission regulations pose an enhanced cancer risk or exert adverse effects on reproduction or development [17,27]. Concerns about the potential health effects of incinerators due to pollutants such as heavy metals, dioxins, and furans in the flue gas are largely related to older generation plants and management techniques in place prior to the mid-1990s. The results obtained for these older plants are also inconsistent, as a wide range of outcomes has been reported [27].
CO2 Emissions from Waste-to-Energy Plants and Applicability of CCUS Processes
Among all the substances generated during the combustion of waste, carbon dioxide is the only one that bypasses the flue gas treatment section. In incineration processes, the carbon content of the input waste is entirely oxidized to CO2, leading to emissions of nearly one ton of CO2 per ton of treated waste [23,28]. This therefore is a significant challenge that needs still to be addressed, as CO2 is a greenhouse gas and a major contributor to climate change.
CO2 emissions from WtE plants can be classified as fossil or biogenic emissions. The prior ones result from the combustion of waste materials in which the carbon content is of fossil origin and can be considered a net positive emission, contributing to climate change. In contrast, biogenic emissions arise from the biomass components of various waste streams and according to the IPCC can be considered carbon-neutral because the carbon released during their combustion was originally absorbed from the atmosphere through plant photosynthesis [29]. By capturing and storing this CO2 underground, it is prevented from being released back into the atmosphere, making it a form of Bioenergy with Carbon Capture and Storage (BECCS). In a BECCS system, the CO2 emissions from biomass combustion are captured and stored, removing CO2 from the carbon cycle and resulting in carbon-negative emissions. However, while BECCS ideally focuses on capturing 100% biogenic CO2 from biomass combustion, applying CCS to WtE does not exclusively target biogenic emissions. Currently, the biogenic CO2 emissions of WtE plants account for a significant portion of the total emissions, ranging from 45 to 71% [30,31]. Implementing CCS technologies in these plants could hence potentially turn WtE plants into net-negative carbon emission sources. The variability of the biogenic fraction of CO2 emissions from WtE is mainly linked to changes in the feed waste composition [31], which may be related to seasonal fluctuations or variations in Municipal Solid Waste (MSW) collection. To reach climate neutrality by 2050, it will be necessary to implement BECCS where possible. Basically, this technology could be integrated into any sector where there is a considerable amount of biogenic CO2 emissions. Currently, just over 2 Mtons of CO2/year are captured from biogenic sources, and around 1 Mtons of CO2 are stored in dedicated storage sites [32].
In addition to BECCS, the integration of carbon capture in WtE processes offers several advantages: waste-to-energy plants are a source of steam, which is crucial for processes like amine-based carbon capture (post-combustion), where steam is used to regenerate the solvent, and for pre-combustion processes like gasification, where steam is used to treat the waste and facilitate CO2 separation (see Section 3.1); there is the possibility of retrofitting an existing plant in the short term; and part of the captured CO2 could be used for the carbonation of bottom ashes produced in the plant to achieve their permanent storage [33]. As detailed in Section 5.3, waste-to-energy plants in the future may be a net contributor to climate change due to the fact that the produced energy would substitute the fossil-free energy generated from renewable sources. Hence, CCUS could prove instrumental for reducing the climate change impact of the WtE plants. Synergies between a WtE plant and the capture processes (such as steam, power, water, and air) can reduce the total cost of capturing CO2 due to reductions in the Capital Expenditure (CAPEX), Operational Expense (OPEX), and space requirements [34]. Finally, carbon capture and utilization/storage could help to improve the social acceptance of these plants in places with low public support for WtE.
However, despite the potential benefits of carbon capture processes, there are some major issues associated with them. The primary problem is the energy penalty incurred by the incineration plant due to energy requirements, which is discussed in Section 5.1. Additionally, the carbon capture unit involves an increase in costs, which can vary depending on the system considered (see Section 5.2). Furthermore, in terms of CO2 utilization, the limited size of the existing market for CO2 means it could quickly become saturated with CCU initiatives [35].
3. Carbon Capture, Storage, and/or Utilization Strategies
Carbon capture technologies aim to obtain a concentrated CO2 stream by separating the CO2 from the flue gas generated by the plant. Then, the CO2 is compressed and liquified for transport, regardless of whether it is stored (CCS) or used (CCU).
3.1. Carbon Capture Strategies
There are three different methods for capturing CO2, depending on the type of plant and the characteristics of the treated flue gas: post-combustion, pre-combustion, and oxyfuel.
3.1.1. Post-Combustion
Post-combustion capture is a retrofitting method applicable to existing plants, which would make it possible to significantly reduce CO2 emissions in hard-to-abate sectors. There are different processes applicable to WtE plants, some more developed and already applicable, others in development. Among these, we mention chemical and physical absorption, adsorption, and membrane processes.
In the absorption process, specific solvents capture CO2 by forming either chemical or physical bonds. Generally, chemical absorption is preferred for lower concentrations of carbon dioxide in the flue gas, while physical absorption is more effective for treating streams with higher concentrations.
Chemical absorption is a solvent-based CO2 capture process, which is very suitable for waste incineration plants. The solvent typically used in the absorption process is an aqueous amine solution, commonly containing 30% by weight of monoethanolamine (MEA) [36]. This solution is well suited for capturing CO2 in flue gases with low concentrations [37] and is already being implemented in various carbon capture projects for WtE applications. As illustrated in Figure 1, the process involves two main columns: the absorber and the stripper. The absorber captures CO2 from the flue gas, while the stripper regenerates the amine solution for reuse in the system. The flue gas is introduced at the bottom of the absorption column, after being cooled and sent to a blower to overcome the pressure drop within the column, ensuring continuous flow during the CO2 absorption process. In the absorption column, at a temperature of 25–60 °C and a pressure of 1 bar [37,38,39,40], CO2 exothermically reacts with the MEA solution. An intercooling unit can be installed to maintain a low temperature within the absorber column, ensuring a reduced column height and enhanced solvent loading capacity [41]. The processed flue gas exits from the top of the column, whereas the enriched solvent exits from the bottom. The CO2-rich amine solution is compressed to around 2 bar [39,40] and then heated up to 100–140 °C [37,38,39,40,42] in a heat exchanger, recovering heat from the amine-lean flow at the outlet of the stripper column. To guarantee an adequate temperature for the regeneration process, it is possible to use steam extracted from the turbine through a reboiler [37,39,40]. The lean solution is recirculated to the absorber after being regenerated to the necessary conditions and after an eventual reintegration of fresh amine solution, whereas the captured CO2 presenting > 99% purity is dehumidified in a condenser [37,38,39].

Figure 1.
MEA-based post-combustion carbon capture process.
The need for a buffer tank for MEA solvent reintegration is due to partial MEA degradation, heat-stable salt formation, and solvent loss as a vapor or aerosol caused by stripping [40]. Among the degradation mechanisms, thermal degradation can occur in the stripper column due to the high temperature. Oxidative degradation is another type of degradation process that is due to the presence of oxygen in the flue gas and leads to ammonia production. It has been demonstrated that metals act like catalysts; thus, additives can be employed to limit oxidation. Finally, acidic pollutants, such as SOx or NOx, are highly reactive with the solvent, leading to the production of heat-stable salts, which block a part of the MEA solvent [43,44]. The chemical absorption process requires energy and presents high costs for solvent regeneration, but it is a well-established technology.
An alternative solvent is potassium carbonate (K2CO3). No current applications have been reported for waste-to-energy plants; however, this reagent is used for the purification of natural gas, synthesis gas, and other gases in the hot potassium carbonate process, also known as the Benfield process [45]. One of the advantages of this process is that the two columns can be operated at the same temperature, so there is no need for a heat exchanger, and, moreover, the higher temperature in the absorber guarantees faster kinetics and the higher solubility of bicarbonate salts [45]. Also, less regeneration energy is required, due to a lower solvent circulation flow [41]. The disadvantage of the use of high temperatures in the absorber is that the equilibrium solubility of CO2 in the solution decreases, leading to incomplete absorption and a lower purity of the captured gas. This issue can be partially mitigated by using a ‘split stream’ configuration, where part of the lean solution is cooled and sent back to the absorber [45]. Compared to MEA, potassium carbonate has a lower cost and toxicity and there are no problems with degradation and heat-stable salts formation [46]. The reaction, however, is considered slower, so a promoter must be added to accelerate it. For this purpose, an inorganic substance can be used. It should be durable and not react with impurities but may also be toxic or have an inefficient concentration capacity; alternatively, an amine promoter has been proposed, but the drawback is that it may form carbamate ions, which can reduce the availability of free amine groups for CO2 absorption, leading to a reduction in the overall efficiency of the carbon capture process [41].
The physical absorption process usually requires less energy than the chemical one, but the cost of the physical solvent is quite high, as well as the capital costs [36]. The CO2 is put in contact with an absorbent solution, usually SelexolTM, and then the subsequent release takes place through a series of pressure reductions in the so-called flash chambers. Due to the CO2 concentration that usually characterizes the flue gas of a waste incineration plant (i.e., around 9% vol.), chemical absorption is preferred to the physical process.
The adsorption process is similar to the absorption one, but the solvent is usually solid, instead of liquid or gaseous. In this case, there is also a distinction between chemical and physical processes. For WtE plants, in this study we considered calcium looping (CaL) as a chemical process and pressure/vacuum swing adsorption (P/VSA) as a physical one.
In the calcium looping (CaL) process, calcium oxide (CaO) obtained from limestone is used as an adsorber in a system of two interconnected fluidized bed reactors, made up of a carbonator and a calciner. The flue gas from the waste-to-energy plant is fed to the carbonator, which has an operation temperature of 650 °C. Here, the CO2 reacts exothermically with CaO, forming calcium carbonate (CaCO3). The loaded solid stream is sent to the calciner for regeneration. In this reactor, the endothermic reaction demands a temperature of 900 °C and, to obtain it, an on-site air separation unit (ASU) for burning with pure O2 and additional fuel are required [41,47,48]. Using Solid Recovered Fuel (SRF), a typical pre-treated waste that is sent to WtE plants, as additional fuel in the calciner could be advantageous; in addition, if, for example, the captured CO2 is used to produce methanol, the oxygen resulting from the electrolysis process can be used for the oxy-firing process, without the need for an ASU [47]. The regenerated sorbent is sent back to the carbonator to start the loop again. Due to the high operation temperatures required in the two fluidized bed reactors, a supercritical water–steam cycle for effectively recovering the excess heat can be adopted [48]. A disadvantage of the CaL process is that the reaction is slower than that of other physical adsorption reactions [41], and the CO2 carrying capacity of the sorbent decreases rapidly, which means that a fresh limestone stream is introduced constantly [47]. However, among the oxide adsorbers (CaO, MgO, SrO, and BaO), CaO is the preferred one because it is derived from limestone, which is cheap and abundant [41].
In pressure/vacuum swing adsorption (P/VSA), CO2 is adsorbed in a two-stage process made up of four steps, pressurization, adsorption, purging with CO2, and blowdown, and by three adsorption columns working simultaneously to ensure a continuous feed [49]. During the pressurization step, the flue gas pressure rises up to the pressure of the adsorption phase [43]. Then, the flue gas flows through the adsorption column, where CO2 is adsorbed in the adsorbent while the gas phase is enriched in the weak adsorbate N2 [49]. At this point, a purge is carried out with CO2 to enrich the adsorbed phase. Finally, the bed is depressurized with a blowdown and the product is recovered [49]. An additional step of purging with N2 can be included to increase the recovery of CO2 [43] after the blowdown. The P/VSA process has many advantages, such as its operation simplicity, high performance at ambient temperature, and fast regeneration of the adsorbent, and this is why it is considered an attractive technology [49]. Among the potential adsorbents, zeolites have a good regeneration capacity and are not subject to degradation processes, but since the flue gas of a waste-to-energy plant contains H2O, which has a greater polarity than CO2, this can lead to interference with the CO2 adsorption rate [41]. Other physical adsorbers are activated carbon, which presents low costs and environmental impacts but needs further improvement, and metal–organic frameworks [41]. A higher CO2 concentration is favorable; thus, physical adsorption appears to be more suitable for industrial processes [49] than WtE plants.
Membrane capture is a promising technology due to its flexibility in operation and lower energy and economic costs, compactness, and modularity [50], but its application for CO2 separation is still under development [39]. The membrane allows for the flow of a certain substance blocking the rest, or vice versa. The permeability, i.e., the ability to permeate a gas, per membrane thickness is called the permeance, and the required permeance to compete against MEA absorption should be higher than 500 Gas Permeance Units (GPUs), while the CO2/N2 selectivity should be higher than 40 [50]. The membrane is usually made up of natural materials, such as wool and cellulose, or synthetic materials, such as polyamide [41], but with the development of ceramic or metallic and polymeric membranes, there could be a significant increase in efficiency [39]. The efficiency depends on the concentration of the species, and in WtE plants the CO2 flue gas concentration is low and, in addition, retrofitting this technology is not an option, so to date it has not been considered suitable for these types of plants [41].
Among post-combustion CO2 capture technologies, molten carbonate fuel cells (MCFCs) can also be considered, though they are still in the research phase and not yet widely used. The flue gas is fed to the MCFC cathode, where CO2 is converted into carbonate ions, while the anode uses natural gas to generate hydrogen, which reacts with carbonate ions and produces an enriched flow of CO2 and H2O, as well as electricity. The exhaust gases, enriched in CO2 and H2O, are processed to separate and compress CO2, which can then be stored or utilized, while the remaining gases are recycled into the system for improving energy efficiency. According to Viganò et al. [51], MCFC can yield improvements for the host WtE plant in terms of both energy performance (increasing electricity production (+90.2%), electrical efficiency (+10%), and the co-generation capability (+3%)) and carbon footprint reduction. Cretarola et al. [52], comparing MCFCs to MEA and CaL technologies, found that both MCFC-based and CaL-based systems significantly outperform the conventional MEA option. Specifically, in terms of the Specific Primary Energy per Carbon Capture Avoidance (SPECCA) index, the values are as follows: for the MEA case, the index is approximately 2.5, indicating higher energy consumption per unit of CO2 not produced; for the CaL case, the index is around 1.5, showing better performance than MEA but still requiring significant energy. On the other hand, for MCFCs, the SPECCA index ranges between 0.2 and −0.7, depending on the reference system used to account for conventional power production, indicating a much more efficient use of primary energy for carbon capture avoidance compared to both MEA and CaL technologies.
3.1.2. Pre-Combustion
One of the problems of a post-combustion configuration is the economic and energy costs of the capture system; to reduce these, one of the most promising alternatives is pre-combustion, i.e., the gasification of the waste [53,54,55].
In the Integrated Gasification Combined Cycle (IGCC) (Figure 2), the solid feedstock (in this case the solid waste) is gasified using steam and oxygen to obtain a raw syngas composed mainly of hydrogen (H2) and carbon monoxide (CO). After some treatments, the raw syngas becomes a pure H2 syngas, which can be used in the combined power plant. The process involves a gasification unit, a water gas shift unit, a syngas quench and cooling unit, a syngas purification unit, and an air separation unit (ASU). In the gasification unit, the solid feedstock reacts with O2, which is produced by the ASU using the steam generated in the power plant. The raw syngas obtained consists of hydrogen, carbon monoxide, carbon dioxide, sulfur compounds, and steam. Instead of the ASU, it is possible to employ a cryogenic air separation unit or, eventually, adsorption and membrane air separation technologies. Also a chemical looping air separation process has been proposed by Lv et al. 2019 [54]. With regard to the gasifier, the most promising reactors for the IGCC process with CCS are entrained-flow gasifiers due to their good cold gas efficiency and flexibility to operate with different fuels. The temperature in the reaction zone should be at around 1400–1500 °C to ensure a high degree of conversion [53].
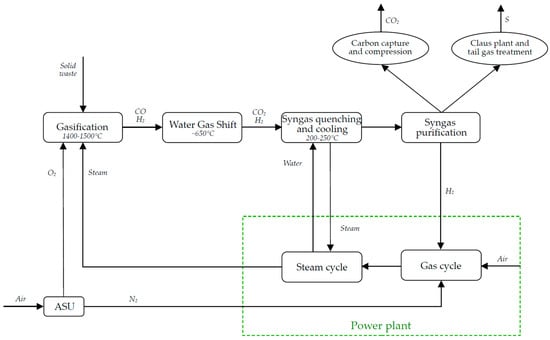
Figure 2.
Scheme of the pre-combustion capture process.
To increase the H2/CO ratio, it is necessary to remove particulate matter before carrying out the water gas shift (WGS) reaction, where CO reacts with H2O to produce H2 and CO2 [55]. To accelerate the WGS process, CaL technology can be integrated with the WGS, and this integration can also absorb CO2 and adjust the H2/CO ratio [54]. Otherwise, chemical or physical absorption can be used to capture CO2.
Before syngas purification, the syngas must be quenched and cooled, so as to guarantee an adequate temperature for the subsequent removal of pollutants with efficient thermal recovery. The syngas purification unit consists of a CO2 separation unit and a desulfurization unit. In the former, the CO2 is captured and then compressed and liquified to be stored or used. Physical solvents, membranes with high CO2/H2 selectivity, or solid sorbents can be used for CO2 capture. In particular, among the physical solvents, SelexolTM and Ionic liquids are preferred [55]. With regard to the latter, sulfur compounds (mainly H2S) react with oxygen in a Claus plant to produce elemental sulfur and heat used for steam production. The sulfur still present in the form of H2S and SO2 is treated in a specific unit and the recirculating gases are introduced upstream of the Claus process [53].
The hydrogen obtained can be used in the plant with a combined cycle gas turbine or be exported for direct utilization or temporary storage after compression.
Some advantages of using solid waste as a feedstock of IGCC processes are a low ash melting point, which means a reduction in the gasifier temperature (i.e., lower oxygen consumption, higher cold gas efficiency, and plant energy efficiency), and a higher content of modifier oxides (CaO), which means a lower viscosity of the ash due to lower silica and alumina content [53]. The use of this capture process layout, however, would require a different type of WtE treatment process (gasification instead of incineration), which has been indicated to be more sensitive to variations in the waste composition and would thus entail the pre-treatment of the feed waste.
3.1.3. Oxyfuel Combustion
Oxyfuel combustion (OFC) is the most promising technology for CO2 capture since it can be retrofitted in existing waste-to-energy plants, like post-combustion systems [56]. In OFC processes (Figure 3), combustion occurs with pure oxygen. This means that it is necessary to introduce a cryogenic air separation unit (CASU), which is very energy-intensive, so one of the aspects to further develop is the application of a more efficient separation system, such as chemical air looping separation [56].

Figure 3.
Scheme of the oxyfuel combustion process.
In the combustion chamber, an inert gas must be introduced, because with air separation nitrogen is no longer present, so CO2 is used as a process fluid. Part of the exhaust gases of a Heat Recovery Steam Generator (HRSG) are cooled in a heat exchanger, so H2O, acid gases, and particulate matter are separated from CO2 [43], and then part of the CO2 is extracted and sent to a liquefaction system to be stored or used, while the rest is recirculated in the compressor, instead of air. Recirculation is important for furnace temperature control in the grate-fired boilers of waste incineration plants [57].
MSW is a well-suited fuel for OFC [57]: the sulfur content is generally low, and thus, when used in addition to recirculating flue gas, desulphurization is easier than for other fuels such as coal [43]. Furthermore, the NOx emissions are low due to the absence of nitrogen in the process fluid, but to obtain a combustion performance similar to the case with nitrogen, the O2/CO2 ratio must be 30/70, whereas the O2/N2 ratio is 20/80. The higher concentration of O2 increases the process temperature: the advantage is that a smaller quantity of auxiliary fuel is necessary; the disadvantage is that NOx emissions also increase. This ratio also leads to a major presence of heavy metals in the bottom ashes instead of the fly ashes, which means lower emissions to the atmosphere [56] but may affect the utilization potential of the bottom ash. Knowledge of the combustion characteristics with a range of different O2/CO2 ratios is of paramount importance, so some studies are being performed by SINTEF Energy Research for this purpose [57]. Other positive aspects are the decrease in the energy penalty compared to post-combustion capture, which could be reduced even more with a different air separation system, and the increase in the boiler efficiency, due to the reduction in the exhaust gas stream [56].
3.2. Storage and/or Utilization Strategies
There are two pathways for CO2 after it is captured: it can be stored underground permanently (CCS), or it can be reintroduced in the economic cycle for a specific use (CCU). The geological storage of CO2 involves injecting carbon dioxide into deep geological formations, often the same reservoirs that the hydrocarbons were originally extracted from. In contrast, CCU technologies focus on converting the captured CO2 into value-added products, creating jobs and income streams to help offset the costs of CO2 capture. However, these processes must ensure that no additional CO2 is generated compared to the amount removed.
3.2.1. CO2 Storage
In Europe, CO2 storage sites are typically located in the North Sea, where extensive studies have been conducted to evaluate the quality of the site, reservoir properties, seal properties, safety, and data coverage [58]; these data are also reported in the Nordic Competence Center for CCS (NORDICCS) map of potential sites for carbon storage in the Nordic region [59]. Out of the total estimated storage capacity of 120 Gtons of CO2, around 86 Gtons are considered viable for storage, distributed across 18 sites (10 in Norway, 5 in Denmark, and 3 in Sweden). This capacity could correspond to over 500 years of emissions from Nordic industry sources [59]. It is noteworthy to point out that most of Europe’s WtE plants are located in central and northern Europe; therefore, transport to North Sea storage sites may be feasible.
There are many European carbon capture, transport, and storage (CCS) sites that also include waste-to-energy plants (Table 1); as may be noted, the storage sites are located mainly in the Nordic region.

Table 1.
European projects for carbon capture, transport, and storage.
In Belgium, the Antwerp@C project [60,61,62,63,64] integrates eight players in the chemical and energy sector to investigate the feasibility of CCUS in the Port of Antwerp. Since Belgium has no suitable sites for CO2 storage, the initial plan is to use the Northern Lights storage solution, while looking for other potential storage options such as depleted gas fields in the North Sea. Hence, the transport of CO2 by ship or by pipeline to Norway, the Netherlands, or the UK is necessary. In the future, other pipelines could be built to connect northern France and Germany to the Antwerp@C network.
In Denmark, there are two main projects: C4—Carbon Capture Cluster Copenhagen—and Greensand. The C4 project [61,65,66,67,68] includes some energy plants that supply electricity and district heating using residual waste (the ARC Amager Bakke, Vestforbrænding and Argo waste-to-energy plants), biomass (HOFOR plant), and wastewater treatment sludge (BIOFOS plant). The C4 cluster’s aim is to convert CO2 into green fuels and store excess carbon in deep saline formations and depleted oil and gas reservoirs in the Danish North Sea. The total CO2 stored in this project will correspond to 15% of the Danish total reduction target of 70% by 2030. Furthermore, Denmark has very suitable subsoil to store CO2. The Greensand project [61,65,69,70] deals with the transport and storage of CO2 in Denmark derived from the waste-to-energy and cement production sectors. The selected storage site is the depleted oil field of Nini West in the INEOS-operated Siri area, where geological and production data have been collected for over 20 years, and subsequently the project will expand the storage to also include the Nini main field and later the Siri fairway.
The Aramis project [61,65,71] in the Netherlands is an EU Project of Common Interest. It will provide hard-to-abate industries and storage field operators with access to the pipeline infrastructure developed for this initiative, both within the Netherlands and across neighboring countries.
In Norway, the Northern Lights (Langskip/Longship) project [61,65,72,73,74] is an expanding initiative. Ships will be used to transport liquefied CO2 from multiple sources and industries around Europe to a permanent offshore storage site in the North Sea. The project will be developed in two stages: during the first phase, the transport, injection, and storage capacity will be up to 1.5 Mtons/year CO2, where around 0.8 Mton/y will be reserved for two capture projects including the Klemetsrud waste-to-energy plant (0.4 Mtons/year), and then in a second phase, the project will expand to include 90 suitable capture sites across eight European countries, increasing the CO2 receiving capacity to up to 5 million tons per year, in line with the market’s development [75].
In the UK, there are three projects: the V Net Zero Humber Cluster, HyNet North West, and the Northern Endurance Partnership. The V Net Zero Humber Cluster project [76,77], which changed its name to the Viking CCS project, is a part of the Humber Zero project: in addition to the Humber Zero emitters, it also includes the Humber Bank Energy Centre, a WtE plant. The Humber is the UK’s most industrialized region and the largest emitter of CO2 near the Viking storage area in the southern North Sea; in particular, the depleted Rotliegend gas fields, Viking and Victor, and the Bunter Formation aquifer could be used to increase the future storage capacity of the project. The HyNet North West project [61,78,79,80] mainly concerns the storage of CO2 captured from industrial sources and the production of hydrogen for industry, transport, domestic, and commercial use of the Liverpool, Manchester, Chester, and Wrexham areas, but recently the Runcorn Energy Recovery facility, a WtE plant belonging to the Viridor company, has been added to the possible sources.
3.2.2. CO2 Utilization
While the purpose of CCS is to store carbon underground for as long as possible, CCU aims to reintroduce the carbon as a product [50]. To date, the potential areas of CO2 use are the chemical, petroleum, energy, food, pharmaceutical, paper and pulp, construction, and steel sectors, which can either convert it into some other form or use it directly [82]. In 2020, around 230 Mtons of CO2 were used globally [60]. According to Galimova et al., 2022 [83], waste-to-energy plants are the source defined as sustainable or unavoidable (including also cement mills and pulp and paper mills) with the second-highest emissions. In 2030, WtE plants will contribute to 28% of the total CO2 emissions of these sources, considering a global total of 600 Mtons of CO2, whereas by 2050, the volume of CO2 from WtE plants is expected to grow significantly, and its share should increase to 56% of the total CO2 emissions of sustainable or unavoidable sources.
In general, the market for CO2-based products is expected to remain relatively small in the short term, though it may expand significantly in the longer term. The theoretical demand for CO2 in applications such as chemicals, building materials, and synthetic hydrocarbon fuels could potentially reach up to 5 gigatons of CO2 per year. However, achieving these levels is challenging and unlikely in practice, primarily due to economic constraints [60]. For example, in waste-to-energy plants, capturing and converting CO2 into useful products leads to energy penalties. This approach will only become a viable solution if it delivers clear and substantial climate benefits [84].
The key challenges in utilizing CO2 from waste-to-energy plants include ensuring CO2 purity, addressing the market size and availability, and overcoming concerns about its perception in the product market. Additionally, CO2 must be cleaned before it can be utilized. However, a comprehensive analysis of the markets for CO2 products remains unfeasible at this time, as there are still relatively few WtE plants equipped with carbon capture [84]. The main features of the currently tested CO2 utilization options, including their TRL (technology readiness level), the conversion factor from CO2 to product, and market interest, are presented in Table 2.
- SYNTHETIC HYDROCARBON FUELS AND CHEMICALS
To produce a chemical, a waste-to-energy plant needs, in addition to a carbon capture unit, a CO2 purification facility, an electrolyzer to produce hydrogen, and a synthesis plant to produce the chemical [84]. It is estimated that the total CO2 required for the production of fuels and chemicals will be of about 633.8 Mtons per year in 2030, and it is expected to increase to over 6000 Mtons by 2050, due to improvements in economic viability [83].
Among the synthetic hydrocarbon fuels and chemicals that can be produced, we can mention methanol, dimethyl ether (DME), formic acid, and methane. According to Christensen and Bisinella 2021 [84], methanol and DME are the most attractive options as in non-fossil-based energy systems they work well as both fuels and chemicals (see Section 5.3).
Methanol production involves the electrochemical reduction of CO2, where hydrogen generated through water electrolysis reacts with the captured CO2 [85]. Research has established that the optimal H2/CO2 ratio for this process is 3:1 [50]. According to Shaliha [85] and Llorach Naharro [50], approximately 1.4 tons of CO2 are required to produce one ton of methanol. However, Mikhelkis et al. [82] report a slightly higher requirement of 1.7 tons of CO2 per ton of methanol. Methanol can be used in the chemical industry for producing formaldehyde, MTBE/TAME, gasoline, acetic acid, and other types of chemicals, but also as an energy storage solution in future energy scenarios. In particular, methanol can chemically store excess energy produced during periods of high generation, and it can be converted back into electricity or heat when demand is high, ensuring a stable and flexible energy supply. Additionally, it is being explored as a potential fuel for decarbonizing “hard-to-abate” sectors, playing a crucial role in the transition towards a low-carbon economy [86]. Thus, all hydrocarbon fuels and products which are obtained from fossil fuels could be produced from methanol, and this may lead to a potential growing demand in the future [47]. The major problem with this product is the electricity that is required for water electrolysis. Therefore, only if energy systems become fossil-free will it be really attractive [84]. The Technology Readiness Level (TRL) of this process is currently 9, indicating that it is fully commercial and in operational use [87].
Methane production involves three main process stages using a water electrolyzer that generates hydrogen, a CO2 separation unit that captures carbon dioxide from flue gas, and a methanation unit where CO2 and H2 are converted into methane and water. The resulting synthetic natural gas (SNG) has versatile applications, including as an intermediate in the chemical industry, a fuel for transportation, and an energy carrier for residential use and power generation. Additionally, it can be injected when it is required into the furnace of a waste-to-energy plant to maintain the combustion temperature [50]. However, methanol and DME contain 92% of the energy content of hydrogen, while methane contains 87%. Moreover, the amount of the product obtained from 1 ton of wet waste is 275 kg of methane versus 565 kg of methanol, 410 kg of DME, and 820 kg of formic acid [84]. For these reasons, methane is considered less attractive as a CO2 utilization option.
Formic acid production can be performed either by thermochemical conversion or electrochemical reduction, and the former has higher production costs compared to the latter [85]. Formic acid has a low energy intensity, so it is less desirable as a transportation fuel compared to the others [84]. Furthermore, the market size for formic acid is significantly smaller compared to the ones for methanol and dimethyl ether (DME), with an annual demand of 0.4–1 million tons for formic acid versus 40–60 million tons for methanol and approximately 20 million tons for DME [85,88]. Additionally, formic acid production remains at the demonstration scale, whereas methanol and methane production have already reached commercial-scale operation [85].
- USE IN GREENHOUSES
The CO2 from waste combustion can be utilized in intensive horticulture to enhance crop yields. In greenhouses, maintaining an elevated CO2 concentration is essential to support crop growth, typically increasing levels from about 400 ppm to 500–1000 ppm [89]. This practice is already implemented in countries like the Netherlands, where CO2 enrichment in greenhouses is a common technique to boost agricultural productivity (see Section 4). The demand for CO2 in such applications ranges between approximately 100–300 kg of CO2 per hectare per hour according to Shaliha [85] and a higher value of 500–600 kg of CO2 per hectare per hour according to Milkhelkis et al. [82]. Supplying greenhouses with 1 ton of CO2 from waste-to-energy plants reduces the greenhouses’ own emissions by 0.93 tons. However, there is still a demand for heat, and some of the electricity generated in the waste-to-energy plants is used for carbon capture, meaning it cannot be sold to the grid. As a result, this electricity must be produced elsewhere, currently still likely by a fossil fuel power plant. Therefore, the total CO2 avoidance is estimated to be 0.80 tons, rather than 0.93 tons. However, the use of CO2 in greenhouses is only a temporary solution, as most of it is released soon after. The actual CO2 reduction comes from the reduced use of natural gas in greenhouses, which is a more potent greenhouse gas than CO2 [89]. The TRL score is set to 9 and this technology is currently applied at a large scale [89]. There is no opposition regarding its utilization and the market size is also large [85], with greater demand in the summertime, due to enhanced plant growth and the lower heat demand [89].
- SODIUM BICARBONATE
Sodium bicarbonate can be used in WtE plants for flue gas cleaning, as it neutralizes acid gases [50]. In this process, aqueous sodium hydroxide (NaOH) used as a feedstock reacts with the CO2 in the flue gas to obtain sodium bicarbonate, also known as baking soda [89]. This avoids the purchase of sodium bicarbonate from a third party [90], and another advantage is that 0.52 tons of CO2 are used per ton of sodium bicarbonate produced according to de Leeuw and Koelemeijer [89] or 1 ton of CO2 is converted to around 1.6 tons of bicarbonate according to Llorach Naharro [50], allowing for additional savings due to lower transportation costs. The reaction is endothermic with a heat demand of 522 kWh per ton of sodium bicarbonate produced. The process has a CO2 capture rate of 95–99%. Inorganic carbonates have a global market of 200–250 million tons [88] and, in particular, sodium bicarbonate has a global market size of USD 1.6 billion and an expected annual growth rate of 0.8%.
Sodium bicarbonate production is currently integrated in the WtE plant in Hengelo, the Netherlands, where CO2 from the plant is used to mineralize sodium carbonate into a sodium bicarbonate slurry. This slurry is then utilized in the flue gas cleaning process. This technology currently presents a TRL of 5–7, which means it is still at the demonstration stage [89].
- MINERAL CARBONATION AND CONCRETE CURING
CO2 can also be utilized for construction applications, exploiting and accelerating the exothermic carbonation reactions that occur during rock weathering. It can be employed to produce building materials or as a curing agent. In addition, in this case, CO2 is not only utilized but also stored in a permanent form, unless the material undergoes calcination. As a curing agent, 4–5% of CO2 is added to concrete to improve the hardening process [82]. This treatment should reduce the cement demand to achieve the same mechanical performance of the concrete, an important feature, given the high carbon intensity associated with cement production [84]. This process has a TRL of 7–8 and makes use of 0.03 tons of CO2 per ton of blocks produced and 0.12 tons of CO2 per ton of precast concrete [82].
Accelerated carbonation reactions aimed at producing building materials or other mineral products can exploit as a feedstock milled rocks or mine tailings presenting a high content of Mg and/or Ca silicates, as well as industrial alkaline residues, such as those generated in WtE plants or steel mills, and can be carried out via either a direct route or an indirect one. The direct method is suitable for treating feedstocks such as APC residues from WtE or fly ash from biomass combustion processes that present a high content of readily reactive phases (i.e., Ca oxides and hydroxides). It is carried out in an aqueous phase and leads to the formation of calcium carbonate within the treated material. The indirect method requires an extraction step to dissolve reacting phases such as Mg and/or Ca silicates, followed by a precipitation step that leads to the production of the respective pure carbonate powders [85]. The latter can be used in paper, paint, rubber, and plastic production [83]. Carbonation can also be employed to reduce the time required to chemically stabilize WtE bottom ash prior to its use in construction from months to just a few hours [85] and to potentially improve the leaching behavior of alkaline residues such as ashes and slags [84]. The critical factors for the applicability of this CO2 utilization option include the reaction rates and the availability of reactive species in natural rocks or residues [85]. Depending on the type of feedstock and route considered, different CO2 uptakes can be achieved; energy-intensive operating conditions and/or pre-treatment processes (such as size reduction and magnetic separation, along with thermal treatment) may be adopted to increase reaction yields [36]. For example, in the Carbstone process, 0.25 tons of CO2 are stored per ton of steel slag that is compacted to manufacture building blocks cured by accelerated carbonation [82]. The TRL is 7–8 [82], and there are some companies like Carbon8Aggregates and Solidia that have built commercial plants [85]. In general, there is no public opposition to the production of construction materials by mineral carbonation, and indeed governments and regional institutions encourage this process [85]. The market size for the products is relevant, about 80 million tons annually, and the revenues are comparable to those of conventional products [85]. As mentioned previously, WtE residues may also be exploited for this process, although the amounts generated in a single plant are not sufficient to store a significant part of its CO2 emissions; hence, the focus would be more on residue valorization and the production of useful products.
- UREA
Urea can be produced from ammonia and CO2, requiring approximately 0.74 tons of CO2 per ton of urea [82]. This process is a proven technology, with a TRL of 9, indicating successful industrial application [82]. Even if urea has a global market size of 100 million tons per year, the market is quite saturated [88] and the price and demand for urea are very unstable, so this CCU option is not considered attractive [85].
- ENHANCED HYDROCARBON RECOVERY
Enhanced hydrocarbon recovery systems include Enhanced Oil Recovery (EOR), Enhanced Gas Recovery (EGR), Enhanced Coal Bed Methane (ECBM) recovery, and the Enhanced Geothermal System (EGS). Among these, only EOR is a mature process, well known since the 1980s, which consists of injecting CO2 into a depleted crude oil reservoir, so as to facilitate the recovery of the residual hydrocarbons. The demand of CO2 for this application is of around 50 million tons per year, but most of the CO2 originates from the reservoir itself, so the CO2 CCUS cost is less than USD 20 per ton [85]. There is always some uncertainty in an EOR project with regard to the effects of CO2 injection on oil recovery. As a reference, for a well injection rate of 0.8 Mtons of CO2 per well per year, an average EOR response of 1.25 barrels of oil (bbl) per ton of CO2 can be expected [91]. EGR is still an immature technology, not attractive due to its low economical profit. ECBM recovery was still at a pilot stage in 2011, and CO2 is in a supercritical state in this application. For ECBM recovery, the CO2 demand is estimated to be 24 tons per MW energy produced [85]. However, from an environmental perspective, injecting CO2 to extract fossil fuels (EOR, EGR, ECBM recovery) makes very little sense. It essentially contributes to the continued reliance on fossil energy, undermining efforts to reduce carbon emissions and adopt more sustainable energy sources. In addition, the feasibility of integrating WtE with EOR depends on factors beyond the mere availability of CO2. These include the proximity of WtE plants to oil fields, the need for a transport infrastructure, and the associated costs. Furthermore, a comprehensive assessment of both economic and environmental implications is necessary, given the complexities inherent in both waste management and oil extraction processes. Unlike other applications where WtE plants can be located near existing facilities, in the case of EOR, it is possibly unlikely for WtE plants to be situated close to oil fields.
- POLYMERS
CO2 can be used to form polyols from which it is possible to obtain other chemicals, such as polyurethane or polypropylene carbonate (PPC). Producing 1 ton of polyurethane requires 0.1–0.3 tons of CO2, whereas producing PPC requires 0.43 tons of CO2 [82]. The market size for polyols is 2.8 million tons per year, and for polyurethane it is 14.2 million tons per year; these polymers have a limited market because the demand is limited to the chemical industry [85].
There is scope for integrating WtE into polymer production, particularly through industrial symbiosis. WtE plants generate heat and electricity, which could be used in the production processes of polymers, helping to reduce the reliance on fossil fuels. The integration of WtE could also provide energy for the chemical processes involved in polymer synthesis or in the production of raw materials for polymers. Additionally, WtE plants can supply CO2, which could potentially be utilized in the production of certain polymers, such as those used in polycarbonate or other CO2-based plastics, contributing to a more sustainable and circular production process.
The TRL is 7 [82,87], indicating that the technology has been demonstrated in an operational environment but is not yet fully commercialized.
- MICRO-ALGAE
In algae cultivation, CO2 levels are often too low, requiring an increased CO2 input to produce biomass for feed, food, or biochemical industries [84]. CO2 is bubbled through ponds or bioreactors, and the uptake is of 1.8–2.0 tons of CO2 per ton of algae produced with a productivity of 200 tons of algae per hectare per year. The advantages of algae cultivation include the absence of complicated feedstocks and a relatively low energy requirement. However, algae production is land-intensive, and the annual operating cost for such plantations is around USD 43,800 per hectare, making the economic aspect quite significant [85]. To date, this CCU option is uncertain and still at a demonstration stage. There is an international R&D program, financed by Syctom, the utility in charge of waste management in Paris, which is considering to apply CCU to WtE emissions for the production of micro-algae to be used as biofuels or biomaterials [90].
Waste-to-energy plants can support micro-algae cultivation by providing the necessary CO2, heat, and electricity. In fact, besides CO2, micro-algae also require light and specific temperatures for optimal growth [92]. WtE plants can supply electricity for artificial lighting and temperature control, creating ideal conditions for algae cultivation. For example, in Saga City, Japan, CO2 from a WtE plant is already being used to grow algae, demonstrating a successful integration of these systems [93,94].
- OTHER APPLICATIONS
Other possible applications include the following:
- Protein production, which is still at the demonstration phase. The investment costs for the electrolyzer are significant, but the potential revenue is considered low, because the protein demand can currently be fulfilled from other natural resources (animals and plants) [85].
- Lignin production, which is a mature technology that needs 0.22 tons of CO2 per ton of lignin produced [82].
- Food and beverages, even if their production is not considered a suitable application for waste-to-energy plants despite adequate CO2 purity standards, due to concerns regarding the possible contamination of the CO2. However, further developments may be foreseen [85].
- Semiconductor cleaning, e.g., in solar panels [85].
- Refrigerants, such as a coolant in industrial refrigerators and cooling facilities or dry ice [84].
- Fire-extinguishing gas used in portable cylinders [84].
Table 2.
Tested options for CO2 utilization.
4. Waste-to-Energy Plants Coupled with CCUS
In the last decade, carbon capture technologies have been applied in specific sectors. In 2022, 65% of CO2 capture plants were operated for natural gas processing, one of the applications with the lowest costs, with a capacity of 28 Mton CO2/year, followed by hydrogen production (7,7 Mton CO2/year), industry (5 Mton CO2/year), power and heat, and other fuel supplies [96]. However, the application in waste-to-energy was still limited.
4.1. Plants in Operation
According to the results of our research, currently this technology is fully applied in only four plants worldwide, with a total capture capacity of approximately 78,000 tons CO2/year (Table 3). All plants employ amine absorption as a capture technology but use the CO2 for different applications. The first application worldwide was implemented in 2016 in Saga City, Japan, where the CO2 feeds a nearby algae farm. An innovative process has been implemented in Hengelo, the Netherlands. Here, CO2 is used directly in the waste-to-energy plant for the mineralization of sodium carbonate into a sodium bicarbonate slurry, necessary for the flue gas cleaning process [97]. Also in the Netherlands, in Duiven, the captured CO2 is supplied as a liquid (30 bar, −20 °C) to greenhouse horticulture companies in the region to accelerate the growth of plants. Another application is in France, at an incineration plant for hazardous waste treatment in Le Havre. Here, after the CO2 capture process, the recovered CO2 is transported via a gas network to two industrial sites, where it is used as a raw material for producing lubricant additives. Currently, there are no WtE plants that operate CO2 storage.
Table 3.
Waste-to-energy plants in operation equipped with carbon CCU.
4.2. Future Projects
Despite the few operating plants, there are a large number of CCUS feasibility studies and pilot and large-scale projects (Table 4). Several projects have been developed worldwide and, in particular, in Europe, mainly located in Norway, the Netherlands, Sweden, the United Kingdom, and Finland. As seen for plants operating in the Netherlands, for these projects, the principal application for CO2 is utilization, mainly in the greenhouse horticulture sector, as has been planned in Rozenburg, Hengelo, Amsterdam, and Alkmaar. In contrast, Norway is mainly focused on the storage of CO2.
Among the utilization projects, different applications for the use of carbon dioxide as a raw material in the manufacturing of chemicals or fuels have also been taken into account. For example, the waste-to-energy plant in Aalborg will produce 130,000 tons of methanol per year; a feasibility study for the production of sustainable aviation fuels has started in Portugal, and the Mustasaari waste-to-energy facility is scheduled to start building a plant for the production of synthetic methane.
Concerning capture technologies, the majority of the planned plants will employ chemical absorption with amine solvents; however, in Sweden, a new concept is being developed in Malmo and Helsingborg. Here it was decided to focus on the application of hot potassium carbonate (HPC) processes. This technology has been applied in other sectors like the purification of natural gas, synthesis gas (from coal gasification), and other gases [45] but never to waste-to-energy plants. Like all carbonate-based capture systems, the hot potassium carbonate process (the Benfield process [45]) is also based on the reversible conversion of dissolved CO2 and carbonate () to bicarbonate (). HPC is considered a more environmentally friendly alternative due to its non-toxic properties and degradation resistance compared to amines [41]. However, the major challenge for the potassium carbonate absorption system is its slow reaction kinetics with CO2 in comparison to the amine absorption system [101]. An interesting application is at the Rådal waste-to-energy plant, where in June 2022 a mobile test module to produce carbon nanofibers was installed.
By 2030, all the proposed projects are expected to be operational, in compliance with the European Union’s ambitious objectives of reducing greenhouse gas emissions by 55% and placing the continent on a prudent pathway towards climate neutrality by 2050 [102].
Our findings indicate that the carbon capture initiatives launched for the WtE sector are expected to capture approximately 10 million tons of CO2 annually by 2030. Considering that the European WtE sector treats around 100 million tons of waste per year, and thus emits roughly an equivalent amount of CO2, with half of it being of biogenic origin, the total fossil CO2 emissions would be of around 50 million tons annually. Therefore, the proposed carbon capture efforts would account for 20% of the total fossil CO2 emissions of the European WtE sector. However, we expect that in the coming years, there will be a significant increase in the number and scale of CO2 capture initiatives, potentially leading to a higher share of captured CO2 emissions. As technologies mature, costs decrease, and regulatory frameworks further incentivize decarbonization, the implementation of carbon capture projects is likely to expand beyond the initial projections. This anticipated growth will amplify the contribution of the WtE sector to reducing its emissions and achieving net-negative emissions if also the biogenic share of the emissions is captured in addition to the fossil one. However, in order to correctly quantify the decarbonization contribution of these initiatives, the type of utilization strategy must be considered, since in some cases the CO2 is quickly re-emitted into the atmosphere, and the overall emissions of the applied technology must also be evaluated from a life cycle perspective.
Table 4.
Carbon capture projects planned for the waste-to-energy sector.
5. Techno-Economic and Environmental Aspects
5.1. Energy Requirements
In a post-combustion MEA-based carbon capture system, the energy requirements primarily include steam and electricity. Steam is utilized in the stripper column to maintain the necessary temperature for CO2 desorption, while electricity powers pumps, fans, and the CO2 conditioning process, including compression and liquefaction. These energy demands are detailed in Table 5. This table also presents the percentage of electricity penalties associated with carbon capture, calculated based on both types of waste-to-energy plants. Specifically, these include a power-only plant, which generates approximately 740 kWh per ton of waste, and a combined heat and power (CHP) plant, which produces 620 kWh per ton of waste along with 7.8 GJ per ton of waste in terms of the heat output. The energy requirements of these units are summarized in the table.
Several studies agree on the steam requirements for CO2 capture, which range from a minimum of 2.49 GJ/ton of CO2 [40] to a maximum of 4.71 GJ/ton of CO2 [137], even if the majority of the sources report around 3.5–3.7 GJ/ton of CO2 [38,39,41,42,84,138,139]. These variations arise from differences in technology (e.g., capture rate), the flue gas concentration, and the flue gas temperature. Higher capture rates, lower flue gas concentrations, and lower flue gas temperatures result in greater steam extraction requirements, increasing the energy penalty. Steam can be extracted either from the boiler drum or the turbine. In the case of boiler drum extraction, Magnanelli et al. [37] report a 30.3% reduction in power production and a 6.4% reduction in district heat production. When steam is extracted from the turbine, the reductions are 8.2% for power production and 12.2% for district heat production. If district heat production is kept constant, the effects on power production and the CO2 capture efficiency vary significantly. For boiler drum extraction, power production decreases by 17.3%, accompanied by a 43.9% drop in the CO2 capture efficiency. For turbine extraction, power production decreases by 4.9%, with a 44.4% CO2 capture efficiency drop.
However, part of the heat can be recovered. The waste heat from the amine regeneration process may be integrated with district heating in the case of CHP plants. For power-only configurations, the recovered heat can be used for heating the water delivered to the steam-generating boiler. It is estimated that 60% of the used steam can be recovered as heat [39,84], up to 90% when heat pumps are added [39]. So, considering a steam consumption of 3.7 GJ/ton of CO2, the heat recovery could range between 2.2 and 3.3 GJ/ton of CO2 [39]. To increase thermal recovery, in the Amager Bakke plant in Copenhagen, Bisinella et al. [40] suggested the adoption of post-capture direct flue gas condensation with a heat exchanger and post-capture heat pump flue gas condensation, which could allow a recovery of 4 GJ/ton of captured CO2. Incorporating flue gas condensation prior to the capture system could recover heat from the flue gas, which could potentially be used in the stripper of the capture unit [35,39,40]. This approach also enhances the CO2 removal efficiency by lowering the absorber temperature and reducing the flue gas volume, resulting in a higher partial pressure of CO2 [39]. It is estimated that up to 0.5 MWh/ton of CO2 can be obtained from flue gas pre-cooling, in addition to the 0.7–1.0 MWh/ton of CO2 that can be recovered employing other solutions [139]. Another method to boost heat recovery for district heating involves using the capture plant’s returned cooling water to cool the CO2 extracted from the stripper column [140]. However, all these options will increase the investment cost and may not be economically attractive [139].
The electricity required by the carbon capture system is approximately 15–35 kWh/ton of CO2 [43,91,139,141] or 15–44 kWh/ton of wet waste [39,40]. These values include the requirements for the recirculation pumps, flue gas blowers, cooling water, and MEA production utilities. If a post-capture heat pump is added for heat recovery, then 101–109 kWh/ton of wet waste is required in addition [40]. Finally, CO2 must be compressed and liquified to be transported via pipeline or ship. Depending on the conditions required, the electricity needed is in the range of 99–160 kWh/ton of CO2 [91,139,141] or 140–150 kWh/ton of wet waste [40]. Compression requires 86.1–105 kWh/ton of CO2 [137,138,139] or 65–105 kWh/ton of wet waste [39,40,84]. Thus, the total electricity required for a post-combustion MEA-based carbon capture system is 114–195 kWh/ton of CO2 or 101–164 kWh/ton of wet waste. Considering a power-only plant, which produces about 739 kWh/ton of wet waste, and a combined heat and power plant, which produces 618 kWh/ton of wet waste and 7.86 GJ heat/ton of wet waste [84], the electricity use for CO2 capture represents about 16.5–25.8% and 19.7–30.9% of the total electricity produced, respectively. These values appear to be lower than the typical energy penalties reported for power plants with carbon capture, i.e., a one-third reduction for power-only plants and a 50% reduction for CHP plants [39].
Table 5.
Steam and electricity requirements for MEA-based carbon capture in waste-to-energy plants.
Currently, the most widely used carbon capture method is the post-combustion MEA-based system, which is a mature and relatively easy-to-implement technology. However, without any optimization, this method reduces the efficiency by 25–40% [38,41] to a minimum of 12–15% [41,56,138] with heat recovery integration.
Looking ahead, oxyfuel combustion is considered the most promising carbon capture method. It would reduce efficiency by 11.6–12.6% [56,138,142], but this could be further improved to 8.9–9.6% [56,142] with some solutions, such as flue gas recirculation for heating the molecular sieve regeneration gas of the air separation unit (ASU) and utilizing waste heat to warm the primary condensate and regeneration gas [56]. The ASU is the primary driver of power consumption in oxyfuel plants. According to Ding et al. [142], it requires 0.32–0.37 kWh/Nm3 of O2, whereas Tang et al. [138] report a requirement of 0.42 kWh/Nm3 of O2, which corresponds to about 60% of the total power consumption. This means that it is necessary to optimize the oxygen concentration, so as to guarantee an adequate combustion process, but to limit the energy consumption of the ASU. It is estimated that the optimal concentration is 96% and, in any case, not beyond 98% [142]. However, in the future, other, more efficient methods will be implemented to reduce power consumption, such as chemical looping air separation. Eventually, instead of installing an ASU, O2 could be delivered from an electrolysis unit powered by renewable sources, even if this type of energy is volatile and involves some technical and commercial challenges [139]. Wienchol et al. [56] report that in the future the energy penalty could be reduced to 7% due to the highly efficient Integrated Gasification Combined Cycle (IGCC), also known as a pre-combustion system, because CO2-H2 separation is much easier than CO2-N2 separation, but, as said before, this technology may only be applied to newly built WtE plants employing the gasification technology.
5.2. Economic Considerations
The addition of a CCS system involves an increase in costs, which can vary depending on the system considered. Here, we present some costs related to post-combustion systems (MEA, calcium looping, advanced solvent, and membrane systems) and the oxyfuel combustion system, plus transport and storage.
Among the post-combustion systems, MEA is the most mature technology, but from an economic point of view, other technologies, such as advanced amine, membrane, and calcium looping systems, might be considered more promising [48,91]. The two main indicators are the LCOE (levelized cost of electricity) and the CAC (CO2 avoidance cost). The former represents a measure of the average net present cost of electricity generation for a power plant over its lifetime, whereas the latter represents the CO2 tax at which the product cost is the same for a fossil fuel plant without CO2 capture that pays the CO2 tax and for the same fossil fuel plant that employs CCS, including the capital cost and efficiency losses but avoiding the CO2 tax.
Regarding the MEA system, Roussanaly et al. [91] and Haaf et al. [48] both considered the LCOE for a plant without CCS to be 80 EUR/MWh, but the former study calculated the LCOE in the case with CCS to be 342 EUR/MWh, while the latter considered a slightly higher value of 433 EUR/MWh; as for the CAC, in the first case, 217 EUR/ton of CO2 was estimated [91], and in the other, it was 288 EUR/ton of CO2 [48]. The CACs are higher than those reported for typical power and industrial plants, but are in the low range for negative emissions technologies such as BECCS and Direct Air Capture (DAC) Units (50–250 EUR/ton of CO2 and 100–2000 EUR/ton of CO2, respectively) [91]. Tang et al. [43] obtained different values because they calculated the CAC based on profit rather than the LCOE and obtained 45.97 USD/ton of CO2. Instead, Pour et al. [38] considered a plant with circulating fluidized bed combustion, so the LCOE in the case without CCS was 140 USD/MWh, which became 220 USD/MWh with CCS, and the CAC was 81 USD/ton of CO2. The difference compared to the previous values was probably due to the different combustion technology considered. Among the costs incurred by adding the capture unit, the investment cost increases by around 17% [143]; in particular, the columns dominate the equipment costs (60–65%), followed by the heat exchangers, including the reboiler (15–20%), and the other equipment combined, which accounts for 20–25% of the costs [140], while the operation and management cost is 2.4% of the investment cost [143]. According to Tang et al. [43], the technology is still economically immature for waste-to-energy plants, and for a balance between financial revenue and expenditure, the revenues need to be at least 45 USD/ton of waste. If the revenues remain at 25.6 USD/ton of waste, then the market price of CO2 avoidance must reach 32.4 USD/ton of CO2 to become profitable.
In the case of CaL, the LCOE and CAC depend on the type of fuel used in the process. Haaf et al. [48] considered a range between 229 and 257 EUR/MWh for the LCOE (the use of SRF as fuel allowed for the lowest value, followed by NG and then coal) and a CAC of 119–128 EUR/ton of CO2 using SRF, 168 EUR/ton of CO2 with coal, and 183 EUR/ton of CO2 with NG. The CaL process is competitive compared to MEA for CO2 capture, and moreover, it is also cost-competitive compared to BECCS and other technologies for achieving negative emissions.
Another possibility is the use of membranes. Roussanaly et al. [91] considered two membrane-based systems, one with a 90% capture ratio and the other with a 50% capture ratio. The LCOE and the CAC of the former were 620 EUR/MWh and 730 EUR/ton of CO2, respectively, whereas for the latter, 155 EUR/MWh and 200 EUR/ton of CO2 were retrieved. The LCOE of the 90% case was nearly seven times higher than that of the case without capture due to the large reduction in the net power output, while the CAC was higher because it was mainly based on the membrane properties. Considering a membrane with a 50% capture ratio drastically reduced the energy penalty and the associated costs, but as a drawback there were no net-negative emissions. Finally, the advanced solvent’s LCOE was 279 EUR/MWh, and its CAC was 153 EUR/ton of CO2 [91].
Figure 4 shows a comparison of the different costs resulting for the considered capture technologies in the case of a generic WtE plant employing a moving grate combustion system. CaL-SRF and a membrane with a 50% capture efficiency are the most economical technologies, followed by CaL-NG, CaL–coal, and advanced amine. Roussanaly et al. [91] claim that this latter technology seems to be the most promising in terms of the CAC and including uncertainties, followed by MEA and membranes. However, the MEA solvent carbon capture process seems to be convenient only in comparison with the 90%-capture membrane, which is unfeasible.

Figure 4.
Levelized cost of electricity (LCOE) and CO2 avoidance cost (CAC) of post-combustion technologies.
For oxyfuel combustion, instead of the LCOE, a combustion cost ranging from 82 USD/ton of MSW (w/o CCS) to 153 USD/ton of MSW was determined, and this value would be the same if electricity could be sold at 0.2 USD/ton of MSW [28]. Tang et al. [43] considered a CAC value of 33.45 USD/ton of CO2, while Zeman [28] considered a value of 39 USD/ton of CO2, calculated from the combustion cost with the relative emission factor and considering the emissions to be 67% of biogenic origin. The cost of the facility would increase by 63% [28], so this technology may also be considered still economically immature for WtE plants [43]. To achieve a balance between the financial revenue and expenditure, the revenues need to be at least 38 USD/ton of waste (slightly lower than those of the MEA-based system) and if the revenues remain at 25.6 USD/ton of waste, then the market price of CO2 avoidance must reach 19.9 USD/ton of CO2 to become profitable. In general, the costs of the oxyfuel combustion system are 1.5 times the costs of the MEA absorption system; however, all the costs related to desulfurization and denitrification treatments would be null in the case of the oxyfuel process [28,43].
Once the CO2 is captured, it must be transported to the storage site or to the user by pipeline, ship, or road. A pipeline is the most economical solution for large quantities and medium distances (<1000 km); ship transport is preferred for longer transport distances, as the cost increase with distance is lower compared to that of pipelines, while road transport is ideal for demonstration sites or small quantities to be transported nearby (<250 km for <100 ktons/year) [83]. Pipelines require larger investments, but the costs are amortized due to their excellent scalability, their long lifetimes, their low operational costs, and the possibility to share the line with other plants [28,83]. Zeman [28] established a range of 1.5–8 USD/ton of CO2, considering only transport via a pipeline, whereas Pour et al. [38] considered an injection, storage, and monitoring cost of 15 USD/ton of CO2, which could reach 30 USD/ton of CO2 or more, depending on the depth and permeability of the formation. However, the cost depends on the quantities of CO2 to transport more than the distance. Galimova et al. [83] presented different costs considering a range of CO2 amounts and depending on the distance. For 2.5–10 Mtons/year, the cost was 5–15 EUR/ton of CO2 (<500 km); in the case of 180, 500, 750, and 1500 km, respectively, for about 10 Mtons/year, the cost was 2.23, 5.92, 8.82, and 17.53 EUR/ton of CO2, while for about 20 Mtons/year, it was 1.41, 3.81, 5.66, and 11.25 EUR/ton of CO2. Ship transport was the preferred solution compared to pipelines for distances of up to 100–200 km in the case of 1–2 Mtons/year or up to 700–1000 km in the case of 5–10 Mtons/year. Roussanaly et al. [91] indicated a ship fuel cost of 332 EUR/ton of fuel and also a well cost for saline aquifer storage of 21.8 million EUR/well and for an EOR project of 10.9 million EUR/well, plus a liability cost of 1 EUR/ton of CO2 in both cases.
5.3. Life Cycle Assessment-Based Evaluations
Several studies have modeled and evaluated the environmental performance of integrating carbon capture into waste-to-energy plants using the life cycle assessment (LCA) methodology. Among the studies reviewed, the majority focused on the storage of the captured CO2, with only one study [84] addressing its utilization.
The studies consistently indicate that the waste-to-energy sector contributes to climate change impacts, with relatively minor variations in CO2eq values among the studies. Pour et al. [38], who investigated the application of carbon capture to a circulating fluidized bed WtE, reported a contribution of 217 kg CO2eq/ton of wet waste in line with other studies. For example, Christensen and Bisinella [84] and Bisinella et al. [39] estimated contributions of 221 kg CO2eq/ton of wet waste and 180 kg CO2eq/ton of wet waste, and Struthers [144] calculated 151 kg CO2eq/ton of wet waste, all for a power-only configuration of a WtE plant. According to Bisinella et al. [39], who assessed different combinations considering APC technologies and energy recovery, the lowest values were found for plants with heat recovery and flue gas condensation (30 kg CO2eq/ton of wet waste) in line with the values for a CHP plant with flue gas condensation evaluated by [84] (65 kg CO2eq/ton of wet waste). This was due to the additional amount of heat produced and therefore the higher associated energy recovery. In their LCA study of the Amager Bakke plant in Copenhagen, Bisinella et al. [40] determined a current contribution of 140 kg CO2eq/ton of wet waste regarding its climate change impact. Materazzi et al. [145], for a CHP plant, found a contribution of 117 kg CO2eq/ton of wet waste. In all cases, the parameter that contributed most to the climate change impact was the fossil carbon dioxide emitted into the atmosphere, and the savings were mainly related to the contribution of energy recovery. Therefore, in a future fossil-free energy scenario, where the energy produced by waste-to-energy will replace green energy, there will be an increase in the climate change impact. This is evident in the study by Lausselet et al. [143], who reported an impact of 507 kg CO2eq/ton of wet waste for the current Norwegian WtE sector. This high impact value is primarily attributed to Norway’s reliance on hydropower—a renewable, low-carbon energy source—meaning that the energy replaced by the WtE process is already entirely green. Similarly, Christensen and Bisinella’s fossil-free energy scenario (wind for electricity and biomass for heat) [84] predicted an increase in emissions of about 60% for a power-only plant and 350% for a CHP plant with flue gas condensation. The same trend was found by Bisinella et al. [39,40], who reported that the impact of climate change in a fossil-free energy scenario increased by about 100–150%. Also, Boakes et al. [141], who considered three moving grate incinerators and three fluidized bed incinerators in industrial symbiosis and two current energy scenarios, i.e., a conventional gas plant for energy production and the ‘Belgian market for medium voltage electricity’ (nuclear (49%), fossil fuels (31.4%), and renewables and biofuels (19.5%)), found that for the normalized impact value, there was a strong increase of about 70% for the Belgian mix, which included a lower fossil fuel share compared to the other. Studies agree that the climate change impact of WtE is heavily contingent on its interaction with the energy system.
Therefore, to achieve a net reduction in climate change impacts in the future, the integration of carbon capture and storage processes in waste-to-energy plants will be crucial. Most studies have focused on the consolidated technology of the amine-based capture of CO2; only Tang and You [43] considered the application of three different capture technologies, i.e., monoethanolamine absorption, pressure/vacuum swing adsorption, and oxyfuel combustion. According to Bisinella et al. [39], CCS integration reduces the climate change impacts of waste-to-energy by approximately 500–800 kg CO2eq/ton of wet waste, and as an energy system moves away from fossil fuels, the beneficial effects tend to become more pronounced. Additionally, Boakes [141] and Lausselet [143] concluded that CCS leads to a lower climate change impact. Moreover, the implementation of CCS in a circulating fluid bed [38] creates net-negative emissions of around −700 kg CO2eq per kg of incinerated wet MSW with a total saving of approximately 900 kg CO2eq. The highest savings are correlated with the substitution of electricity produced with a fossil fuel-based power generation mix. Struthers [144] reported a saving of 648 kg CO2eq/ton of wet waste for a power-only configuration and 772 kg CO2eq/ton of wet waste for a CHP plant. Materazzi also observed reductions of 556 kg CO2-eq, further supporting these findings [145]. According to Tang and You [43], the total impact of direct emissions was reduced by 91.36%, 85.14%, and 90.06% when equipping a WtE plant with, respectively, MEA absorption, P/VSA, and oxyfuel combustion. The reduction was largely caused by the decline of the impacts in the human health, ecosystem health, and climate change categories.
CO2 utilization was assessed by Christensen and Bisinella [84] considering the application of MEA technology to a power-only waste incinerator and a CHP system considering five potential energy scenarios. The study investigated direct CO2 utilization (local use or available for the general market) and the hydrogenated utilization of CO2 to produce feedstock chemicals or fuels. In a fossil-based energy scenario, the local use of CO2 as a substitute for fossil-based CO2 production seemed to be the best alternative, with results similar to those of CO2 storage studies. However, the future demand for CO2 is uncertain and may be limited in its capacity. For hydrogenated CO2, the primary challenge lies in the substantial electricity demand of hydrogen production (more than 6MWh/ton of MSW) and the benefits derived from the avoided production of chemicals and the market for the by-products (e.g., O2 and H2). Hydrogenated utilization becomes attractive in non-fossil-based energy scenarios and offers high net savings (1000–4000 kg CO2eq/ton of MSW). The most favorable option for substituting fossil-based feedstock chemicals is to produce methanol or DME.
Impacts related to changes in the composition of waste were evaluated in two studies by Bisinella et al. [39,40]. Different compositions of the plant’s feed waste were considered, varying the proportion of biogenic and fossil carbon based on the improved source separation of recyclables and organic matter. The results of the studies were quite similar and showed an irrelevant variation in the climate change impact, especially when CCS was implemented. Without CCS, the difference in the climate change results was larger, mainly correlated with the release of fossil CO2 in the waste scenario with a higher share of fossil matter. Sebastiani et al. [146] reported that increasing the proportion of biogenic materials in the waste significantly reduces its climate change impact, irrespective of the presence of CCS. They considered burning wood waste, which has a 98% biogenic fraction, and demonstrated that WtE plants could function as “carbon negative” systems, delivering a net climate benefit of −237 kg CO2eq per ton of wood waste, even without implementing carbon capture systems.
The application of CCS has an effect on other impact categories, as noted by Tang et al. [43], who reported that the integration of carbon capture in waste-to-energy plants increased resource consumption, with the highest impacts resulting for MEA absorption compared to P/VSA or oxyfuel combustion. Pour et al. reported higher impacts for the category of water scarcity, mainly due to the high use of cooling water (106 m3/ton CO2) in the MEA process [38]. Bisinella et al. [39] found that retrofitting existing municipal waste incinerators with carbon capture and storage does not compromise other environmental impacts. Lausselet [143] affirmed that except for climate change, the CCS scenario performed worse than the WtE scenario w/o CCS due primarily to the assumption that Refuse-Derived Fuel (RDF) would be used as auxiliary fuel in the add-on boiler required for the CO2 capture process.
In summary, the reviewed studies agree that the integration of carbon capture and storage processes in WtE plants significantly improves the climate change impacts of these plants but in some cases may worsen other environmental impacts. The results of LCA studies depend strongly on the following assumptions: the amount and type of substituted energy and thus the correlation with the fossil share of public electricity and district heating production; the share of the biogenic and fossil fractions of the waste; the impact of the carbon capture unit on the energy balance of the incineration plant; and the capture rate of the capture unit.
6. Conclusions and Perspectives
Carbon capture, utilization, and storage (CCUS) strategies are being increasingly recognized as promising solutions for mitigating the greenhouse gas emissions generated by the waste-to-energy sector. In particular, CCUS integrated in waste-to-energy plants offers a pathway to reducing the GHG emissions of this waste treatment solution, which remains critical for managing residual waste and diverting it from landfills. As global decarbonization efforts intensify, CCUS is expected to play an essential role in aligning WtE operations with net-zero carbon emission goals. According to our perspective, the utilization of CO2 can be a viable practice in the early stages to bring carbon capture technology to a commercial level, but permanent storage strategies are essential to ensure long-term mitigation goals are met, since in some utilization processes CO2 is rapidly released back into the atmosphere. If, however, the captured CO2 is used to replace CO2 produced from fossil sources, then a mitigation effect may be considered.
Among the various currently available CO2 capture technologies, monoethanolamine (MEA) absorption is the only proven and commercially viable solution for WtE flue gases. In addition to MEA, molten carbonate fuel cells (MCFCs) and oxyfuel combustion stand out as promising alternatives. MCFCs, in particular, offer dual benefits by capturing CO2 and simultaneously generating electricity, potentially improving the overall energy efficiency of the system. Regarding oxyfuel combustion, further studies are needed to limit the energy consumption of the air separation unit and improve the overall efficiency of the plant.
Currently, carbon capture technology is fully applied in only four waste-to-energy (WtE) plants worldwide, with a total capture capacity of approximately 78,000 tons of CO2 per year. However, numerous feasibility studies and pilot projects are underway, particularly in Europe, where countries are actively exploring ways to integrate CO2 capture technologies into their waste-to-energy plants. While CO2 capture technology, especially the process employing amine-based methods, is well established and considered a mature solution, the optimal strategy for managing the captured CO2 remains an ongoing topic of debate. Regarding storage (CCS), large-scale projects are concentrated in the northern European region, particularly in countries such as Norway, the Netherlands, Sweden, the United Kingdom, and Finland, where CO2 is sequestered in geological formations like depleted oil and gas reservoirs. However, challenges related to the storage capacity, costs, and long-term safety persist. With WtE plants expected to contribute up to 56% of unavoidable CO2 emissions by 2050, CCS integration is becoming increasingly important in this sector. For utilization (CCU), the captured CO2 can be used in various industries, including chemicals, construction, and synthetic fuels, but large-scale implementation faces significant economic barriers. A key advantage of WtE plants is the potential for the captured CO2 to be used within the plant itself. For example, CO2 can be utilized in processes like sodium bicarbonate production for flue gas treatment, or it can be used for the carbonation of bottom ashes produced during incineration.
From an energy perspective, post-combustion MEA-based carbon capture systems require significant amounts of steam and electricity. Without optimization, MEA-based capture reduces the plant efficiency by 25–40%, although heat recovery integration can reduce this to 12–15%. Oxyfuel combustion, on the other hand, offers better efficiency, with an estimated reduction of around 12%, which could be further improved to 9% through flue gas recirculation and waste heat recovery. However, oxyfuel combustion still faces challenges related to the energy consumption of the air separation unit, which must be addressed to improve its overall efficiency. Economically, the feasibility of carbon capture in WtE plants is primarily determined by two key indicators: the levelized cost of electricity (LCOE) and the CO2 avoidance cost (CAC). While MEA technology is currently the most mature, other methods, such as advanced amines, membranes, and calcium looping, may prove more cost-effective in the long run. The market for CO2-based products is still relatively small but is expected to expand over time, which could improve the economic outlook for CCU applications. However, the progress and scale of this market’s expansion remain difficult to predict. From an environmental perspective, failing to adopt CO2 capture technologies in WtE plants could result in even greater negative impacts in the future due to the increasing replacement of fossil fuel-based energy with renewable sources. Without integrating effective carbon capture solutions, WtE plants risk increasing their carbon footprint, which would be in contradiction with the noteworthy environmental improvements that these plants have managed to achieve over the years. Therefore, the development and adoption of innovative technologies, alongside improvements in existing methods, will be crucial to mitigate GHG impacts and ensure the long-term sustainability of WtE operations.
In conclusion, despite the many potential benefits of CCUS processes, there are still several challenges that must be addressed for implementing them in waste-to-energy plants, including, in particular, the overall energy requirements of the capture unit and the energy penalty of the plant, the costs of installation and operation, and the need for government policies to incentivize CCUS investments to ensure the sustainability of CCUS operations. With the right incentives, research, investment, and support, CCUS has the potential to be a viable and effective solution to reduce emissions from the WtE sector. However, it is essential that all participants in the waste and product value chain, including consumers, work together to reduce the amount of fossil-based emissions related to residual waste management.
Author Contributions
Conceptualization, L.A., S.G. and G.C.; writing—original draft preparation, L.A. and S.G.; writing—review and editing, LA. and G.C.; supervision, G.C. All authors have read and agreed to the published version of the manuscript.
Funding
This research received no external funding.
Data Availability Statement
No new data were created in this study. The data can be retrieved in the cited references.
Acknowledgments
The authors thank the Italian Ministry of University and Research (MUR) for supporting this research through the PON Doctoral Scholarship of Luigi Acampora (DM 1061/2021, 10 August 2021), funded by FSE REACT-EU.
Conflicts of Interest
The authors declare no conflict of interest.
References
- Intergovernmental Panel on Climate Change (IPCC). Climate Change 2022—Impacts, Adaptation and Vulnerability: Working Group II Contribution to the Sixth Assessment Report of the Intergovernmental Panel on Climate Change, 1st ed.; Cambridge University Press: Cambridge, UK, 2023; ISBN 978-1-00-932584-4. [Google Scholar]
- Paris Agreement to the United Nations Framework Convention on Climate Change, Dec. 12, 2015, T.I.A.S. No. 16-1104. Available online: https://unfccc.int/sites/default/files/english_paris_agreement.pdf (accessed on 25 March 2025).
- Radley-Gardner, O.; Beale, H.; Zimmermann, R. (Eds.) Regulation (EU) 2021/1119 of the European Parliament and of the Council of 30 June 2021 Establishing the Framework for Achieving Climate Neutrality and Amending Regulations (EC) No 401/2009 and (EU) 2018/1999 (‘European Climate Law’); Hart Publishing: Oxford, UK, 2016; ISBN 978-1-78225-864-3. [Google Scholar]
- World|Total Including LUCF|Greenhouse Gas (GHG) Emissions|Climate Watch. Available online: https://www.climatewatchdata.org/ghg-emissions?end_year=2021&start_year=1990 (accessed on 5 December 2024).
- Where Do Emissions Come from? 4 Charts Explain Greenhouse Gas Emissions by Sector—World Resources Institute. Available online: https://www.wri.org/insights/4-charts-explain-greenhouse-gas-emissions-countries-and-sectors (accessed on 18 March 2025).
- Kaza, S.; Yao, L.C.; Bhada-Tata, P.; Van Woerden, F. What a Waste 2.0: A Global Snapshot of Solid Waste Management to 2050; World Bank: Washington, DC, USA, 2018; ISBN 978-1-4648-1329-0. [Google Scholar]
- European Environment Agency, Briefing No 01/2025. Methane, Climate Change and Air Quality in Europe: Exploring the Connections. Available online: https://www.eea.europa.eu/en/analysis/publications/methane-climate-change-and-air-quality-in-europe-exploring-the-connections?activeTab=6397c084-2e5f-4545-a873-f99323d40846 (accessed on 24 March 2025). [CrossRef]
- CEWEP WtE Sustainability Roadmap Towards 2035. 2019. Available online: https://www.cewep.eu/wp-content/uploads/2019/09/WtE_Sustainability_Roadmap_Digital.pdf (accessed on 5 March 2025).
- Fahnestock, J.; Johansson, I.; Hasselqvist, M.; Mirata, M.; Nilsson, C.; Persson, A.; Petterson, A.; Sahlén, J. Waste Incineration for the Future. Scenario analysis and action plans. IEA Bioenergy 2019. Available online: https://www.ieabioenergy.com/wp-content/uploads/2019/04/Waste-Energy-for-the-Future-IEA-version.pdf (accessed on 11 December 2024).
- Climate Change: Deal on a More Ambitious Emissions Trading System (ETS)|News|European Parliament. Available online: https://www.europarl.europa.eu/news/en/press-room/20221212IPR64527/climate-change-deal-on-a-more-ambitious-emissions-trading-system-ets (accessed on 13 January 2025).
- FOEN, Federal Office for the Environment, Agreement with Managers of Waste Treatment Installations. Available online: https://www.bafu.admin.ch/bafu/en/home/themen/thema-klima/klimawandel-stoppen-und-folgen-meistern/schweizer-klimapolitik/branchenvereinbarungen/zielvereinbarung-uvek-abfallverwertungsanlagen-ch.html (accessed on 13 January 2025).
- Figueroa, J.D.; Fout, T.; Plasynski, S.; McIlvried, H.; Srivastava, R.D. Advances in CO2 Capture Technology—The U.S. Department of Energy’s Carbon Sequestration Program. Int. J. Greenh. Gas Control 2008, 2, 9–20. [Google Scholar] [CrossRef]
- Leung, D.Y.C.; Caramanna, G.; Maroto-Valer, M.M. An Overview of Current Status of Carbon Dioxide Capture and Storage Technologies. Renew. Sustain. Energy Rev. 2014, 39, 426–443. [Google Scholar] [CrossRef]
- Kuramochi, T.; Ramírez, A.; Turkenburg, W.; Faaij, A. Comparative Assessment of CO2 Capture Technologies for Carbon-Intensive Industrial Processes. Prog. Energy Combust. Sci. 2012, 38, 87–112. [Google Scholar] [CrossRef]
- Zhang, T.; Zhang, M.; Jin, L.; Xu, M.; Li, J. Advancing Carbon Capture in Hard-to-Abate Industries: Technology, Cost, and Policy Insights. Clean Technol. Environ. Policy 2024, 26, 2077–2094. [Google Scholar] [CrossRef]
- Bertone, M.; Stabile, L.; Buonanno, G. An Overview of Waste-to-Energy Incineration Integrated with Carbon Capture Utilization or Storage Retrofit Application. Sustainability 2024, 16, 4117. [Google Scholar] [CrossRef]
- UTILITALIA White Paper on Municipal Waste Incineration. 2020. Available online: https://www.cewep.eu/wp-content/uploads/2021/03/WHITE-PAPER-DEFINITIVO-2-24-febbraio-2021.pdf (accessed on 12 November 2024).
- CEWEP Residual Waste Treatment Capacity Fact Sheet. 2020. Available online: https://www.cewep.eu/wp-content/uploads/2020/12/Residual-waste-treatment-capacity-factsheet-2020.pdf (accessed on 3 December 2024).
- Brettler Berenyi, E. Recycling and Waste-to-Energy: Are They Compatible? 2009 Update. June 2009. Available online: https://www.ecomaine.org/wp-content/uploads/2020/06/Berenyi-GAA-2009.pdf (accessed on 6 April 2025).
- Market Report Waste to Energy—The World Market for Waste Incineration Plants. Available online: https://www.ecoprog.com/publications/energy-management/waste-to-energy.htm (accessed on 5 January 2025).
- European Commission; Joint Research Centre. Best Available Techniques (BAT) Reference Document for Waste Incineration: Industrial Emissions Directive 2010/75/EU (Integrated Pollution Prevention and Control); EUR 29971 EN; Publications Office of the European Union: Luxembourg, 2019. [Google Scholar] [CrossRef]
- ESWET, European Suppliers of Waste-to-Energy Technology. Annual Report 2019; European Suppliers of Waste-to-Energy Technology; Brussels, Belgium, 2019; Available online: https://eswet.eu/wp-content/uploads/2020/12/ESWET-AR-2019_Spreads_Small.pdf (accessed on 3 February 2025).
- CEWEP WtE Climate Roadmap. 2022. Available online: https://www.cewep.eu/wp-content/uploads/2022/06/CEWEP-WtE-Climate-Roadmap-2022.pdf.pdf (accessed on 12 December 2024).
- Blasenbauer, D.; Huber, F.; Lederer, J.; Quina, M.J.; Blanc-Biscarat, D.; Bogush, A.; Bontempi, E.; Blondeau, J.; Chimenos, J.M.; Dahlbo, H.; et al. Legal Situation and Current Practice of Waste Incineration Bottom Ash Utilisation in Europe. Waste Manag. 2020, 102, 868–883. [Google Scholar] [CrossRef]
- Zhang, Y.; Wang, L.; Chen, L.; Ma, B.; Zhang, Y.; Ni, W.; Tsang, D.C.W. Treatment of Municipal Solid Waste Incineration Fly Ash: State-of-the-Art Technologies and Future Perspectives. J. Hazard. Mater. 2021, 411, 125132. [Google Scholar] [CrossRef]
- Quina, M.J.; Bontempi, E.; Bogush, A.; Schlumberger, S.; Weibel, G.; Braga, R.; Funari, V.; Hyks, J.; Rasmussen, E.; Lederer, J. Technologies for the Management of MSW Incineration Ashes from Gas Cleaning: New Perspectives on Recovery of Secondary Raw Materials and Circular Economy. Sci. Total Environ. 2018, 635, 526–542. [Google Scholar] [CrossRef]
- de Titto, E.; Savino, A. Environmental and Health Risks Related to Waste Incineration. Waste Manag. Res. 2019, 37, 976–986. [Google Scholar] [CrossRef]
- Zeman, F. Considering Carbon Capture and Storage for Energy Generation from Municipal Solid Waste. J. Environ. Eng. 2010, 136, 756–761. [Google Scholar] [CrossRef]
- IPCC (Intergovernmental Panel on Climate Change). 2006 IPCC Guidelines for National Greenhouse Gas Inventories; The National Greenhouse Gas Inventories Programme, Eggleston, H.S., Buendia, L., Miwa, K., Ngara, T., Tanabe, K., Eds.; Hayama, Japan, 2006; Available online: https://www.ipcc-nggip.iges.or.jp/public/2006gl/ (accessed on 5 November 2024).
- Mohn, J.; Szidat, S.; Zeyer, K.; Emmenegger, L. Fossil and Biogenic CO2 from Waste Incineration Based on a Yearlong Radiocarbon Study. Waste Manag. 2012, 32, 1516–1520. [Google Scholar] [CrossRef] [PubMed]
- Larsen, A.W.; Fuglsang, K.; Pedersen, N.H.; Fellner, J.; Rechberger, H.; Astrup, T. Biogenic Carbon in Combustible Waste: Waste Composition, Variability and Measurement Uncertainty. Waste Manag. Res. J. Sustain. Circ. Econ. 2013, 31, 56–66. [Google Scholar] [CrossRef] [PubMed]
- Bioenergy with Carbon Capture and Storage—Analysis. Available online: https://www.iea.org/reports/bioenergy-with-carbon-capture-and-storage (accessed on 20 February 2025).
- Costa, G.; Baciocchi, R.; Polettini, A.; Pomi, R.; Hills, C.D.; Carey, P.J. Current Status and Perspectives of Accelerated Carbonation Processes on Municipal Waste Combustion Residues. Environ. Monit. Assess. 2007, 135, 55–75. [Google Scholar] [CrossRef] [PubMed]
- Croymans, T.; Englebert, B.; Wightman, A.; Izquierdo, J. 11 Reasons Why Carbon Capture Should Be Prioritized in the Waste-to-Energy Sector. In Proceedings of the VENICE 2022—9th International Symposium on Energy from Biomass and Waste, Venice, Italy, 21–23 November 2022. [Google Scholar]
- Tota, V.; Viganò, F.; Gatti, M. Application of CCUS to the WtE Sector. In Proceedings of the 15th Greenhouse Gas Control Technologies Conference, Abu Dhabi, United Arab Emirates, 15–18 March 2021. [Google Scholar]
- Akbar, F.M.; Hafiy, M.N.; Ibrahim, F.; Yudhistira, A.M. Effectiveness of Integrated Carbon Capture Technology in Waste-to-Energy Plants and Implementation Prospects. Sociae Polites 2021, 22, 30–47. [Google Scholar] [CrossRef]
- Magnanelli, E.; Mosby, J.; Becidan, M. Scenarios for Carbon Capture Integration in a Waste-to-Energy Plant. Energy 2021, 227, 120407. [Google Scholar] [CrossRef]
- Pour, N.; Webley, P.A.; Cook, P.J. Potential for Using Municipal Solid Waste as a Resource for Bioenergy with Carbon Capture and Storage (BECCS). Int. J. Greenh. Gas Control 2018, 68, 1–15. [Google Scholar] [CrossRef]
- Bisinella, V.; Hulgaard, T.; Riber, C.; Damgaard, A.; Christensen, T.H. Environmental Assessment of Carbon Capture and Storage (CCS) as a Post-Treatment Technology in Waste Incineration. Waste Manag. 2021, 128, 99–113. [Google Scholar] [CrossRef]
- Bisinella, V.; Nedenskov, J.; Riber, C.; Hulgaard, T.; Christensen, T.H. Environmental Assessment of Amending the Amager Bakke Incineration Plant in Copenhagen with Carbon Capture and Storage. Waste Manag. Res. J. Sustain. Circ. Econ. 2022, 40, 79–95. [Google Scholar] [CrossRef]
- Andersson, J. An Investigation of Carbon Capture Technologies for Sävenäs Waste-to-Energy Plant. Master’s Thesis, Luleå University of Technology Department of Civil, Environmental and Natural Resources Engineering, Luleå, Sweden, 2020. [Google Scholar]
- Su, D.; Herraiz, L.; Lucquiaud, M.; Thomson, C.; Chalmers, H. Thermal Integration of Waste to Energy Plants with Post-Combustion CO2 Capture. Fuel 2023, 332, 126004. [Google Scholar] [CrossRef]
- Tang, Y.; You, F. Multicriteria Environmental and Economic Analysis of Municipal Solid Waste Incineration Power Plant with Carbon Capture and Separation from the Life-Cycle Perspective. ACS Sustain. Chem. Eng. 2018, 6, 937–956. [Google Scholar] [CrossRef]
- Aouini, I.; Ledoux, A.; Estel, L.; Mary, S. Pilot Plant Studies for CO2 Capture from Waste Incinerator Flue Gas Using MEA Based Solvent. Oil Gas Sci. Technol. Rev. D’IFP Energ. Nouv. 2014, 69, 1091–1104. [Google Scholar] [CrossRef]
- Stolaroff, J. Carbonate Solutions for Carbon Capture: A Summary; Lawrence Livermore National Lab (LLNL): Livermore, CA, USA, 2013. [Google Scholar]
- Ayittey, F.K.; Obek, C.A.; Saptoro, A.; Perumal, K.; Wong, M.K. Process Modifications for a Hot Potassium Carbonate-based CO2 Capture System: A Comparative Study. Greenh. Gases Sci. Technol. 2020, 10, 130–146. [Google Scholar] [CrossRef]
- Haaf, M.; Hilz, J.; Unger, A.; Ströhle, J.; Epple, B. Methanol Production Via the Utilization of Electricity and CO2 Provided by a Waste Incineration Plant. In Proceedings of the 14th International Conference on Greenhouse Gas Control Technologies (GHGT-14), Melbourne, Australia, 21–25 October 2018. [Google Scholar]
- Haaf, M.; Anantharaman, R.; Roussanaly, S.; Ströhle, J.; Epple, B. CO2 Capture from Waste-to-Energy Plants: Techno-Economic Assessment of Novel Integration Concepts of Calcium Looping Technology. Resour. Conserv. Recycl. 2020, 162, 104973. [Google Scholar] [CrossRef]
- Durán, I.; Rubiera, F.; Pevida, C. Vacuum Swing CO2 Adsorption Cycles in Waste-to-Energy Plants. Chem. Eng. J. 2020, 382, 122841. [Google Scholar] [CrossRef]
- Llorach Naharro, P. Carbon Capture and Utilization from a Municipal Solid Waste-to-Energy Plant. Master’s Thesis, Chemical Engineering—Smart Chemical Factories, Universitat Politècnica de Catalunya, Barcelona, Spain, 2021. [Google Scholar]
- Viganò, F.; Cretarola, L.; Spinelli, M. Molten Carbonate Fuel Cells (MCFC) for the Carbon Capture in Energy-from-Waste (EfW). In Proceedings of the VENICE 2022—9th International Symposium on Energy from Biomass and Waste, Venice, Italy, 21–23 November 2022. [Google Scholar]
- Cretarola, L.; Mazzolari, G.; Lena, E.D.; Spinelli, M.; Gatti, M.; Viganò, F. Carbon Capture for Energy-from-Waste Plants: Comparison of Three Appliable Technologies. In Proceedings of the CHANIA 2023 10th International Conference on Sustainable Solid Waste Management, Chania, Greece, 21–24 June 2023. [Google Scholar]
- Cormos, C.-C. Hydrogen and Power Co-Generation Based on Coal and Biomass/Solid Wastes Co-Gasification with Carbon Capture and Storage. Int. J. Hydrogen Energy 2012, 37, 5637–5648. [Google Scholar] [CrossRef]
- Lv, L.; Zhang, Z.; Li, H. SNG-Electricity Cogeneration through MSW Gasification Integrated with a Dual Chemical Looping Process. Chem. Eng. Process. Process Intensif. 2019, 145, 107665. [Google Scholar] [CrossRef]
- Ashkanani, H.E.; Wang, R.; Shi, W.; Siefert, N.S.; Thompson, R.L.; Smith, K.; Steckel, J.A.; Gamwo, I.K.; Hopkinson, D.; Resnik, K.; et al. Effect of Power Plant Capacity on the CAPEX, OPEX, and LCOC of the CO2 Capture Process in Pre-Combustion Applications. Int. J. Greenh. Gas Control 2021, 109, 103371. [Google Scholar] [CrossRef]
- Wienchol, P.; Szlęk, A.; Ditaranto, M. Waste-to-Energy Technology Integrated with Carbon Capture—Challenges and Opportunities. Energy 2020, 198, 117352. [Google Scholar] [CrossRef]
- Lucquiaud, M.; Herraiz, L.; Su, D.; Thomson, C.; Chalmers, H.; Becidan, M.; Ditaranto, M.; Roussanaly, S.; Anantharaman, R.; Moreno Mendaza, J.; et al. Negative Emissions in the Waste-to-Energy Sector: An Overview of the Newest-CCUS Programme. In Proceedings of the 15th Greenhouse Gas Control Technologies Conference, Abu Dhabi, United Arab Emirates, 15–18 March 2021. [Google Scholar]
- Bergmo, P.E.S.; Emmel, B.U.; Anthonsen, K.L.; Aagaard, P.; Mortensen, G.M.; Sundal, A. Quality Ranking of the Best CO2 Storage Aquifers in the Nordic Countries. Energy Procedia 2017, 114, 4374–4381. [Google Scholar] [CrossRef]
- Building Nordic Excellence in CCS NORDICCS—The Nordic CCS Competence Centre, Top-Level Research Initiative. Available online: https://www.sintef.no/en/projects/2011/nordiccs-nordisk-ccs-kompetansesenter-/ (accessed on 3 October 2024).
- Ausfelder, F.; Baltac, S. IEA Special Report on Carbon Capture Utilisation and Storage, CCUS in Clean Energy Transitions. Energy Technol. Perspect. 2020, 174. Available online: https://www.iea.org/reports/ccus-in-clean-energy-transitions (accessed on 5 April 2025).
- Map of CCUS Projects in Europe—IOGP Europe. Available online: https://iogpeurope.org/resource/map-of-eu-ccus-projects/ (accessed on 5 November 2024).
- Antwerp@C Details. Available online: https://www.geos.ed.ac.uk/sccs/project-info/2304 (accessed on 10 December 2024).
- Antwerp@C. Available online: https://ccushub.ogci.com/focus_hubs/antwerpc-kairosc/ (accessed on 12 January 2025).
- Antwerp@C. Investigates Potential for Halving CO2 Emissions in Port of Antwerp by 2030. Available online: https://newsroom.portofantwerpbruges.com/antwerpc-investigates-potential-for-halving-co2-emissions-in-port-of-antwerp-by-2030 (accessed on 15 February 2025).
- Global CCS. Institute Global Status of CCS 2024. Available online: https://www.globalccsinstitute.com/wp-content/uploads/2024/11/Global-Status-Report-6-November.pdf (accessed on 3 February 2025).
- C4—Carbon Capture Cluster Copenhagen Details. Available online: https://www.geos.ed.ac.uk/sccs/project-info/2731 (accessed on 14 December 2024).
- C4 Carbon Capture Cluster Copenhagen. Available online: http://a-r-c.dk/c4/ (accessed on 12 December 2024).
- Copenhagen Energy Players Form CCS Alliance with Great Potential. Available online: https://stateofgreen.com/en/news/copenhagen-energy-groups-form-ccs-alliance/ (accessed on 13 December 2024).
- Project Greensand Details. Available online: https://www.geos.ed.ac.uk/sccs/project-info/2730 (accessed on 20 December 2024).
- Greensand Project. Available online: https://greensandfuture.com/ (accessed on 26 February 2025).
- Aramis. Available online: https://ccushub.ogci.com/focus_hubs/aramis/ (accessed on 13 February 2025).
- Northern Lights Details. Available online: https://www.geos.ed.ac.uk/sccs/project-info/2142 (accessed on 15 December 2024).
- Northern Lights/Longship. Available online: https://ccushub.ogci.com/focus_hubs/northern-lights/ (accessed on 13 January 2025).
- A Story About the Johansen Formation. Available online: https://ccsnorway.com/a-story-about-the-johansen-formation/ (accessed on 13 January 2025).
- Northern Lights Annual Report 2023. Available online: https://norlights.com/wp-content/uploads/2024/04/Northern-Lights-4061-SF8-Arsrapport-2023.pdf (accessed on 15 October 2024).
- V Net Zero Humber Cluster Details. Available online: https://www.geos.ed.ac.uk/sccs/project-info/2736 (accessed on 12 February 2025).
- About-Viking CCS. Available online: https://www.vikingccs.co.uk/about (accessed on 6 December 2024).
- HyNet North West Details. Available online: https://www.geos.ed.ac.uk/sccs/project-info/2165 (accessed on 10 January 2025).
- HyNet North West. Available online: https://hynet.co.uk/ (accessed on 10 January 2025).
- Government Shortlists Viridor’s Runcorn CCS Project. Available online: https://www.viridor.co.uk/news-and-insights/government-shortlists-viridor-s-runcorn-ccs-project-2/ (accessed on 11 January 2025).
- Northern Endurance Partnership. Available online: https://northernendurancepartnership.co.uk/ (accessed on 4 March 2025).
- Mikhelkis, L.; Govindarajan, V. Techno-Economic and Partial Environmental Analysis of Carbon Capture and Storage (CCS) and Carbon Capture, Utilization, and Storage (CCU/S): Case Study from Proposed Waste-Fed District-Heating Incinerator in Sweden. Sustainability 2020, 12, 5922. [Google Scholar] [CrossRef]
- Galimova, T.; Ram, M.; Bogdanov, D.; Fasihi, M.; Khalili, S.; Gulagi, A.; Karjunen, H.; Mensah, T.N.O.; Breyer, C. Global Demand Analysis for Carbon Dioxide as Raw Material from Key Industrial Sources and Direct Air Capture to Produce Renewable Electricity-Based Fuels and Chemicals. J. Clean. Prod. 2022, 373, 133920. [Google Scholar] [CrossRef]
- Christensen, T.H.; Bisinella, V. Climate Change Impacts of Introducing Carbon Capture and Utilisation (CCU) in Waste Incineration. Waste Manag. 2021, 126, 754–770. [Google Scholar] [CrossRef] [PubMed]
- Shaliha, J.K.P. Internship Report: CO2 Utilisation and Power-to-X Possibility at Twence, University of Twente, Faculty of Engineering Technology, Master Programme Sustainable Energy Technology. 2017. Available online: https://essay.utwente.nl/85387/1/Report-Julia%20K.P.%20Shaliha%20-%20s1689819.pdf (accessed on 5 April 2025).
- Liu, H.; Ampah, J.D.; Zhao, Y.; Sun, X.; Xu, L.; Jiang, X.; Wang, S. A Perspective on the Overarching Role of Hydrogen, Ammonia, and Methanol Carbon-Neutral Fuels towards Net Zero Emission in the Next Three Decades. Energies 2022, 16, 280. [Google Scholar] [CrossRef]
- Nimmas, T.; Wongsakulphasatch, S.; Chanthanumataporn, M.; Vacharanukrauh, T.; Assabumrungrat, S. Thermochemical Transformation of CO2 into High-Value Products. Curr. Opin. Green Sustain. Chem. 2024, 47, 100911. [Google Scholar] [CrossRef]
- Naims, H. Economics of Carbon Dioxide Capture and Utilization—A Supply and Demand Perspective. Environ. Sci. Pollut. Res. 2016, 23, 22226–22241. [Google Scholar] [CrossRef]
- de Leeuw, M.; Koelemeijer, R. Decarbonisation Options for the Dutch Waste Incineration Industry; Netherlands Environmental Assessment Agency: Bilthoven, The Netherlands, 2022. [Google Scholar]
- Clerens, P.; Thuau, A. The Role of Waste-to-Energy (WtE) in the EU’s Long-Term Greenhouse Gas Emissions Reduction Strategy. Available online: https://books.vivis.de/wp-content/uploads/2023/01/2018_wm_025-036_clerens.pdf (accessed on 8 February 2025).
- Roussanaly, S.; Ouassou, J.A.; Anantharaman, R.; Haaf, M. Impact of Uncertainties on the Design and Cost of CCS from a Waste-to-Energy Plant. Front. Energy Res. 2020, 8, 17. [Google Scholar] [CrossRef]
- Singh, S.P. Effect of Temperature and Light on the Growth of Algae Species—A Review. Renew. Sustain. Energy Rev. 2015, 50, 431–444. [Google Scholar]
- News Release (10 August 2016): Toshiba Complete Installation of World’s First Commercial-Use CCU Syst|News|Toshiba. Available online: https://www.global.toshiba/ww/news/corporate/2016/08/pr1001.html (accessed on 10 February 2025).
- Giving CO2 an Economic Value: Carbon Capture Technology Helps Recycle Waste into Resources. Available online: https://asia.toshiba.com/highlights/giving-co2-an-economic-value-carbon-capture-technology-helps-recycle-waste-into-resources/ (accessed on 10 February 2025).
- IEAGHG Technical Report 2020 CCS on Waste-to-Energy. Available online: https://ieaghg.org/publications/ccs-on-waste-to-energy/ (accessed on 18 March 2025).
- Carbon Capture, Utilisation and Storage—Analysis. Available online: https://www.iea.org/reports/carbon-capture-utilisation-and-storage-2 (accessed on 12 February 2025).
- Huttenhuis, P.; Roeloffzen, A.; Versteeg, G. CO2 Capture and Re-Use at a Waste Incinerator. Energy Procedia 2016, 86, 47–55. [Google Scholar] [CrossRef]
- Le Havre: et si on Recyclait le CO2? Available online: https://www.veolia.fr/qui-sommes-nous/nos-engagements/nos-solutions-climat-france/havre-si-on-recyclait-co2 (accessed on 26 March 2025).
- CO2 Capture Plant. Available online: https://www.avr.nl/en/optimal-process/co2-capture-plant/ (accessed on 24 February 2025).
- Twence CO2 Capture Plant in Hengelo Sets an Example for The Netherlands. Available online: https://www.twence.com/news/twence-CO2-capture-plant-in-hengelo-sets-an-example-for-the-netherlands (accessed on 27 January 2025).
- Hu, G.; Nicholas, N.J.; Smith, K.H.; Mumford, K.A.; Kentish, S.E.; Stevens, G.W. Carbon Dioxide Absorption into Promoted Potassium Carbonate Solutions: A Review. Int. J. Greenh. Gas Control 2016, 53, 28–40. [Google Scholar] [CrossRef]
- European Commission. Stepping up Europe’s 2030 Climate Ambition Investing in a Climate-Neutral Future for the Benefit of Our People. J. Chem. Inf. Model. 2020, 53, 1689–1699. [Google Scholar]
- Reno-Nord har Skarpt Fokus på Plastaffaldet. Available online: https://renonord.dk/aktuelt/aktuelt/varmepumpe-skal-toemme-affaldsroeg-for-energi (accessed on 15 February 2025).
- Power-to-X Anlæg i Aalborg Skal Indfange CO2 Og Bruge Det Til Grønt Brændstof. Available online: https://renonord.dk/media/presse/pressemeddelelse_06.12.2021___ptx_til_aalborg.pdf (accessed on 12 February 2025).
- Møller, S.B. ARGO Will Capture CO2 by 2030 at the Latest. Available online: https://argo.dk/en/om-os/presse/nyheder/argo-vil-fange-co2-senest-i-2030/ (accessed on 5 December 2024).
- Technip Energies Selected for Vestforbrænding’s Carbon Capture Project at Waste-to-Energy Plant in Denmark|Technip Energies. Available online: https://www.ten.com/en/media/news/technip-energies-selected-vestforbraendings-carbon-capture-project-waste-energy-plant (accessed on 5 December 2024).
- Carbon Capture. Available online: http://a-r-c.dk/english/carbon-capture/ (accessed on 15 December 2024).
- Climate Positive Synthetic Methane Production Starts in the Vaasa Region in 2025. Available online: https://woimacorporation.com/climate-positive-synthetic-methane-production-starts-in-the-vaasa-region-in-2025/ (accessed on 11 January 2025).
- Hautamaa, S. EnergySampo CCU: Production of Synthetic Methane Starts at Westenergy in 2025. Available online: https://westenergy.fi/en/energysampo-ccu-production-of-synthetic-methane-starts-at-westenergy-in-2025/ (accessed on 16 December 2024).
- Fortum Launches a Ground-Breaking Pilot Project–Aims to Produce New Materials from the CO2 Emissions of Waste Incineration. Available online: https://www.fortum.com/media/2022/04/fortum-launches-ground-breaking-pilot-project-aims-produce-new-materials-co2-emissions-waste-incineration (accessed on 15 November 2024).
- Paul de Bruycker Presentation on CEWEP Congress 15th June 2023 Berlin: “WtE’s Role in the EU Green Deal”. Available online: https://www.cewep.eu/wp-content/uploads/2023/06/1.1-Paul-de-Bruycker.pdf (accessed on 23 November 2024).
- Born, J.-P. CATO meets the projects—Born Public. Presentation at CATO Workshop, The Netherlands, 4 December 2018. Available online: https://co2-cato.org/publish/pages/3375/_20181211_102020_23_2018-12-04_cato-meets-the-projects_born-public.pdf (accessed on 5 April 2025).
- AEB Amsterdam|Technology. Available online: https://www.aebamsterdam.com/technology/ (accessed on 22 January 2025).
- AVR to Capture CO2 in Holland. Available online: https://www.letsrecycle.com/news/avr-to-capture-co2-in-holland/ (accessed on 10 February 2025).
- Pedersen, A. BIR’s Carbon Capture Project and How Waste-to-Energy Can Contribute to Negative Emissions. Available online: https://www.uib.no/sites/w3.uib.no/files/attachments/20221101_energilab_v3.pdf (accessed on 25 February 2025).
- Frevar Capture Plant Details. Available online: https://www.geos.ed.ac.uk/sccs/project-info/2222 (accessed on 5 December 2024).
- Aker Carbon Capture Selected for Norwegian pre-FEED. Available online: https://bioenergyinternational.com/aker-carbon-capture-selected-for-norwegian-pre-feed/ (accessed on 5 December 2024).
- Hafslund Oslo Celsio—Klemetsrud CCS Project Details. Available online: https://www.geos.ed.ac.uk/sccs/project-info/1684 (accessed on 12 February 2025).
- Becidan, M.; Olsson, O. Deployment of Bio-CCS: Case Study on Waste-to-Energy; Fortum Oslo Varme (FOV): Oslo, Norway, 2021; Available online: https://www.ieabioenergy.com/wp-content/uploads/2021/05/Becidan-2021-FINAL-IEA-Bio-BECCS-FOV-Case-study.pdf (accessed on 12 November 2024).
- Fagerlund, J.; Zevenhoven, R.; Thomassen, J.; Tednes, M.; Abdollahi, F.; Thomas, L.; Nielsen, C.J.; Mikoviny, T.; Wisthaler, A.; Zhu, L.; et al. Performance of an Amine-Based CO2 Capture Pilot Plant at the Fortum Oslo Varme Waste to Energy Plant in Oslo, Norway. Int. J. Greenh. Gas Control 2021, 106, 103242. [Google Scholar] [CrossRef]
- Air Products Part of Carbon Capture Pilot Project. Available online: https://gcenode.no/news/air-products-part-of-carbon-capture-pilot-project/ (accessed on 13 February 2025).
- BCS—The Test Module for Direct CO2 Capture from BIR Has Been Delivered|MarketScreener. Available online: https://www.marketscreener.com/quote/stock/BERGEN-CARBON-SOLUTIONS-A-121299686/news/BCS-The-test-module-for-direct-CO2-capture-from-BIR-has-been-delivered-40866335/ (accessed on 4 February 2025).
- Aker Carbon Capture to Explore Opportunities for CO2 Capture at BIR in Bergen. Available online: https://news.cision.com/aker-carbon-capture-as/r/aker-carbon-capture-to-explore-opportunities-for-co2-capture-at-bir-in-bergen,c3381268 (accessed on 2 February 2025).
- Trendafilova, P. Ostfold Energi to Test Its Carbon Capture Plant for Waste Incineration. Available online: https://carbonherald.com/ostfold-energi-to-test-its-carbon-capture-plant-for-waste-incineration/ (accessed on 16 January 2025).
- Saren Kvitebjørn Varme Has Received NOK 3.55 Million in Support from CLIMIT. Available online: https://sarenenergy.com/en/kvitebjorn-varme-has-received-nok-3-55-million-in-support-from-climit/ (accessed on 5 December 2024).
- Cutting-Edge Power-to-Liquid Project Transforms Municipal Waste-Derived CO2 into Sustainable Aviation Fuels (SAF). Available online: https://www.veolia.com/sites/g/files/dvc4206/files/document/2022/02/pr-power-to-liquid-municipal-waste-derived-CO2-sustainable-aviation-fuels-saf-portugal-17022022.pdf (accessed on 30 January 2025).
- Förstudie om CCS Visar På Två Lovande Tekniker för Avskiljning av Koldioxid|Sysav—Tar Hand om Och Återvinner Avfall. Available online: https://www.sysav.se/om-oss/pressrum/pressmeddelande/forstudie-om-ccs-visar-pa-tva-lovande-tekniker-for-avskiljning-av-koldioxid--3176860/ (accessed on 30 January 2025).
- Sysav: Front-Runner Towards a Carbon-Neutral Sweden—Ramboll Group. Available online: https://www.ramboll.com/projects/energy/sysav-waste-facility-pursues-net-zero (accessed on 28 January 2025).
- Växjö Energi First to Test New Carbon Capture Technology. Available online: https://www.veab.se/en/about/press/pressmeddelanden/2021/vaxjo-energi-first-to-test-new-carbon-capture-technology/ (accessed on 7 February 2025).
- First CapsolGoTM Unit Operational at O¨resundskraft’s Energy-from-Waste Plant|Live. Available online: https://live.euronext.com/en/node/11938820 (accessed on 6 December 2024).
- Aker Carbon Capture Awarded Feasibility Study by Waste to Energy Player in Switzerland. Available online: https://www.prnewswire.com/news-releases/aker-carbon-capture-awarded-feasibility-study-by-waste-to-energy-player-in-switzerland-302017587.html (accessed on 6 December 2024).
- Curds, P. UK-First Carbon Capture Pilot on Energy from Waste Facility Goes Live. Available online: https://enfinium.co.uk/uk-first-carbon-capture-pilot-on-energy-from-waste-facility-goes-live/ (accessed on 6 December 2024).
- Reduction of CO2 Emissions by 2030: SUEZ and BP Sign a Memorandum of Understanding to Explore—SUEZ Group. Available online: https://www.suez.com/en/news/press-releases/reduction-co2-emissions-by-2030-suez-and-bp-sign-memorandum-net-zero-teesside-uk-first-decarbonised-industrial-hub (accessed on 29 January 2025).
- Decarbonisation, C. Project Overview. Available online: https://corydecarbonisation.co.uk//the-project/project-overview/ (accessed on 5 December 2024).
- Redcar Energy Centre: BEIS’ Industrial Carbon Capture (ICC) Sequencing Process|RPS. Available online: https://www.rpsgroup.com/about-us/news/rps-helps-drive-redcar-energy-centre-to-the-next-stage-of-beis-industrial-carbon-capture-icc-sequencing-process/ (accessed on 6 December 2024).
- Veolia Feasibility Study Highlights Potential of UK’s First Carbon Capture Technology to Produce Sustainable Fuels Using Energy Recovery Facilities. Available online: https://www.veolia.co.uk/press-releases/veolia-feasibility-study-highlights-potential-uks-first-carbon-capture-technology (accessed on 6 December 2024).
- Chandel, M.K.; Kwok, G.; Jackson, R.B.; Pratson, L.F. The Potential of Waste-to-Energy in Reducing GHG Emissions. Carbon Manag. 2012, 3, 133–144. [Google Scholar] [CrossRef]
- Tang, Y.; Ma, X.; Lai, Z.; Chen, Y. Energy Analysis and Environmental Impacts of a MSW Oxy-Fuel Incineration Power Plant in China. Energy Policy 2013, 60, 132–141. [Google Scholar] [CrossRef]
- Danish Energy Agency—Carbon Capture, Transport and Storage—Technology Descriptions and Projections for Long-Term Energy System Planning. 2024. Available online: https://ens.dk/en/analyses-and-statistics/technology-data-carbon-capture-transport-and-storage (accessed on 17 March 2025).
- Ros, J.A.; Monteiro, J.G.M.-S.; Goetheer, E.L.V. High Level Analysis of CO2 Capture in the Waste-to-Energy Sector. In Proceedings of the TCCS-11—Trondheim Conference on CO2 Capture, Transport and Storage, Trondheim, Norway, 21–23 June 2021. [Google Scholar]
- Boakes, E.; De Voogd, J.-K.; Wauters, G.; Van Caneghem, J. The Influence of Energy Output and Substitution on the Environmental Impact of Waste-to-Energy Operation: Quantification by Means of a Case Study. Clean Technol. Environ. Policy 2023, 25, 253–267. [Google Scholar] [CrossRef]
- Ding, G.; He, B.; Cao, Y.; Wang, C.; Su, L.; Duan, Z.; Song, J.; Tong, W.; Li, X. Process Simulation and Optimization of Municipal Solid Waste Fired Power Plant with Oxygen/Carbon Dioxide Combustion for near Zero Carbon Dioxide Emission. Energy Convers. Manag. 2018, 157, 157–168. [Google Scholar] [CrossRef]
- Lausselet, C.; Cherubini, F.; Oreggioni, G.D.; del Alamo Serrano, G.; Becidan, M.; Hu, X.; Rørstad, P.K.; Strømman, A.H. Norwegian Waste-to-Energy: Climate Change, Circular Economy and Carbon Capture and Storage. Resour. Conserv. Recycl. 2017, 126, 50–61. [Google Scholar] [CrossRef]
- Struthers, I.A.; Herraiz, L.; Muslemani, H.; Su, D.; Thomson, C.; Lucquiaud, M. Assessing the Negative Carbon Emissions Potential from the Waste-to-Energy Sector in Europe. In Proceedings of the 16th Greenhouse Gas Control Technologies Conference (GHGT-16), Lyon, France, 23–27 October 2022. [Google Scholar]
- Materazzi, M.; Chari, S.; Sebastiani, A.; Lettieri, P.; Paulillo, A. Waste-to-Energy and Waste-to-Hydrogen with CCS: Methodological Assessment of Pathways to Carbon-Negative Waste Treatment from an LCA Perspective. Waste Manag. 2024, 173, 184–199. [Google Scholar] [CrossRef]
- Sebastiani, A.; Paulillo, A.; Lettieri, P.; Materazzi, M. Retrofitting Waste-to-Energy with Carbon Capture and Storage in the UK: A Techno-Economic and Environmental Assessment. In Proceedings of the 31st European Biomass Conference and Exhibition, Bologna, Italy, 5–8 June 2023. [Google Scholar]


Disclaimer/Publisher’s Note: The statements, opinions and data contained in all publications are solely those of the individual author(s) and contributor(s) and not of MDPI and/or the editor(s). MDPI and/or the editor(s) disclaim responsibility for any injury to people or property resulting from any ideas, methods, instructions or products referred to in the content. |
© 2025 by the authors. Licensee MDPI, Basel, Switzerland. This article is an open access article distributed under the terms and conditions of the Creative Commons Attribution (CC BY) license (https://creativecommons.org/licenses/by/4.0/).