1. Background
As one of the specialized safety features associated with ACP100, the heat transfer performance of a Passive Air-Cooling System (PAS) is influenced by a variety of interrelated factors. In response to various influencing factors, researchers have conducted a series of experimental studies and numerical simulations. These include the structural characteristics of the PAS flow channel, such as flow channel width, height differences between the inlet and top outlet, and the number of ventilation sleeves, as well as external environmental conditions, like temperature, humidity, and environmental wind. Additionally, materials used in constructing the flow channel structure, such as coatings on steel shell surfaces, conditions of concrete walls, and types of stiffener materials, also play a significant role [
1,
2,
3,
4,
5]. Among the studies mentioned above, the objective of conducting a wind loading performance test on PAS is to investigate how these external environmental conditions affect its heat exchange capabilities [
6,
7].
In the investigation of the PAS wind loading performance test, a scaled-down ACP100 test model was developed, and cold-state experiments were conducted on a wind tunnel platform. However, under accidental conditions, the surface temperature of the steel shell of the ACP100 prototype can reach approximately 130 °C [
8,
9,
10]. The influence of heating conditions on the scaled steel shell surface in relation to test research findings, as well as the necessity for their implementation, requires further validation.
This variation arises from the fact that differing model scales lead to distinct impacts of heating conditions on test results [
11,
12,
13]. For example, when the ratio of a scaled-down model to the original is approximately 1:5, the natural circulation induced within the PAS channel by heating conditions remains quite pronounced. However, as the model scale is further reduced, the diminished density difference between hot and cold fluids inside and outside the PAS channel necessitates additional verification regarding how heating conditions influence test research.
The research on the PAS wind loading performance test focuses on the pressure variations at the inlets and outlet of the PAS flow channel, which are induced by different environmental wind field conditions. This allows for an assessment of the advantages and disadvantages of environmental wind effects on the PAS heat exchange performance. This study employs the scaled-down ACP100 numerical simulations to gather related data, which are then compared with experimental results to demonstrate both the reliability of numerical simulations and the feasibility of qualitative analysis. Subsequently, it advances to numerical simulation calculations concerning the ACP100 prototype.
In the course of researching the wind loading performance test of PAS, it is crucial to acknowledge that the chosen laboratory wind tunnel platform imposes a limitation on the maximum allowable blockage area [
14,
15], which must not exceed 8%. As a result, a scale ratio of 1:126 has been established for the ACP100 test model. The wind tunnel platform is employed to simulate various conditions pertaining to environmental wind speed and direction.
The ACP100 features a double-layer safety shell design, comprising an inner steel shell and an outer concrete shell.
Figure 1 illustrates a schematic diagram of the PAS flow channel structure, which primarily consists of the top outlet, annular flow channel, mixing wind corridor, inlets, and ventilation sleeves. Measurement points for temperature and pressure are designated at positions 1, 2, and 3 within the PAS flow channel. The test design encompasses various conditions, including wind direction tests, wind speed tests, inclined wind tests, and inlet blockage tests [
16].
The establishment of heating conditions for the steel shell wall significantly increases both testing and labor costs, while also prolonging the research cycle. By neglecting the influence of these heating conditions, one can reduce test complexity and expenses, thereby shortening the duration of research. In light of this, this study employs a combination of numerical simulations and experimental methodologies to investigate the effects of heating conditions on pressure distribution and airflow within the PAS flow channel. This study takes into account both scenarios: in the absence and presence of environmental wind field coupling effects. The objective is to provide valuable insights that will inform future design research related to wind loading performance tests for ACP100.
2. Numerical Calculation and Analysis
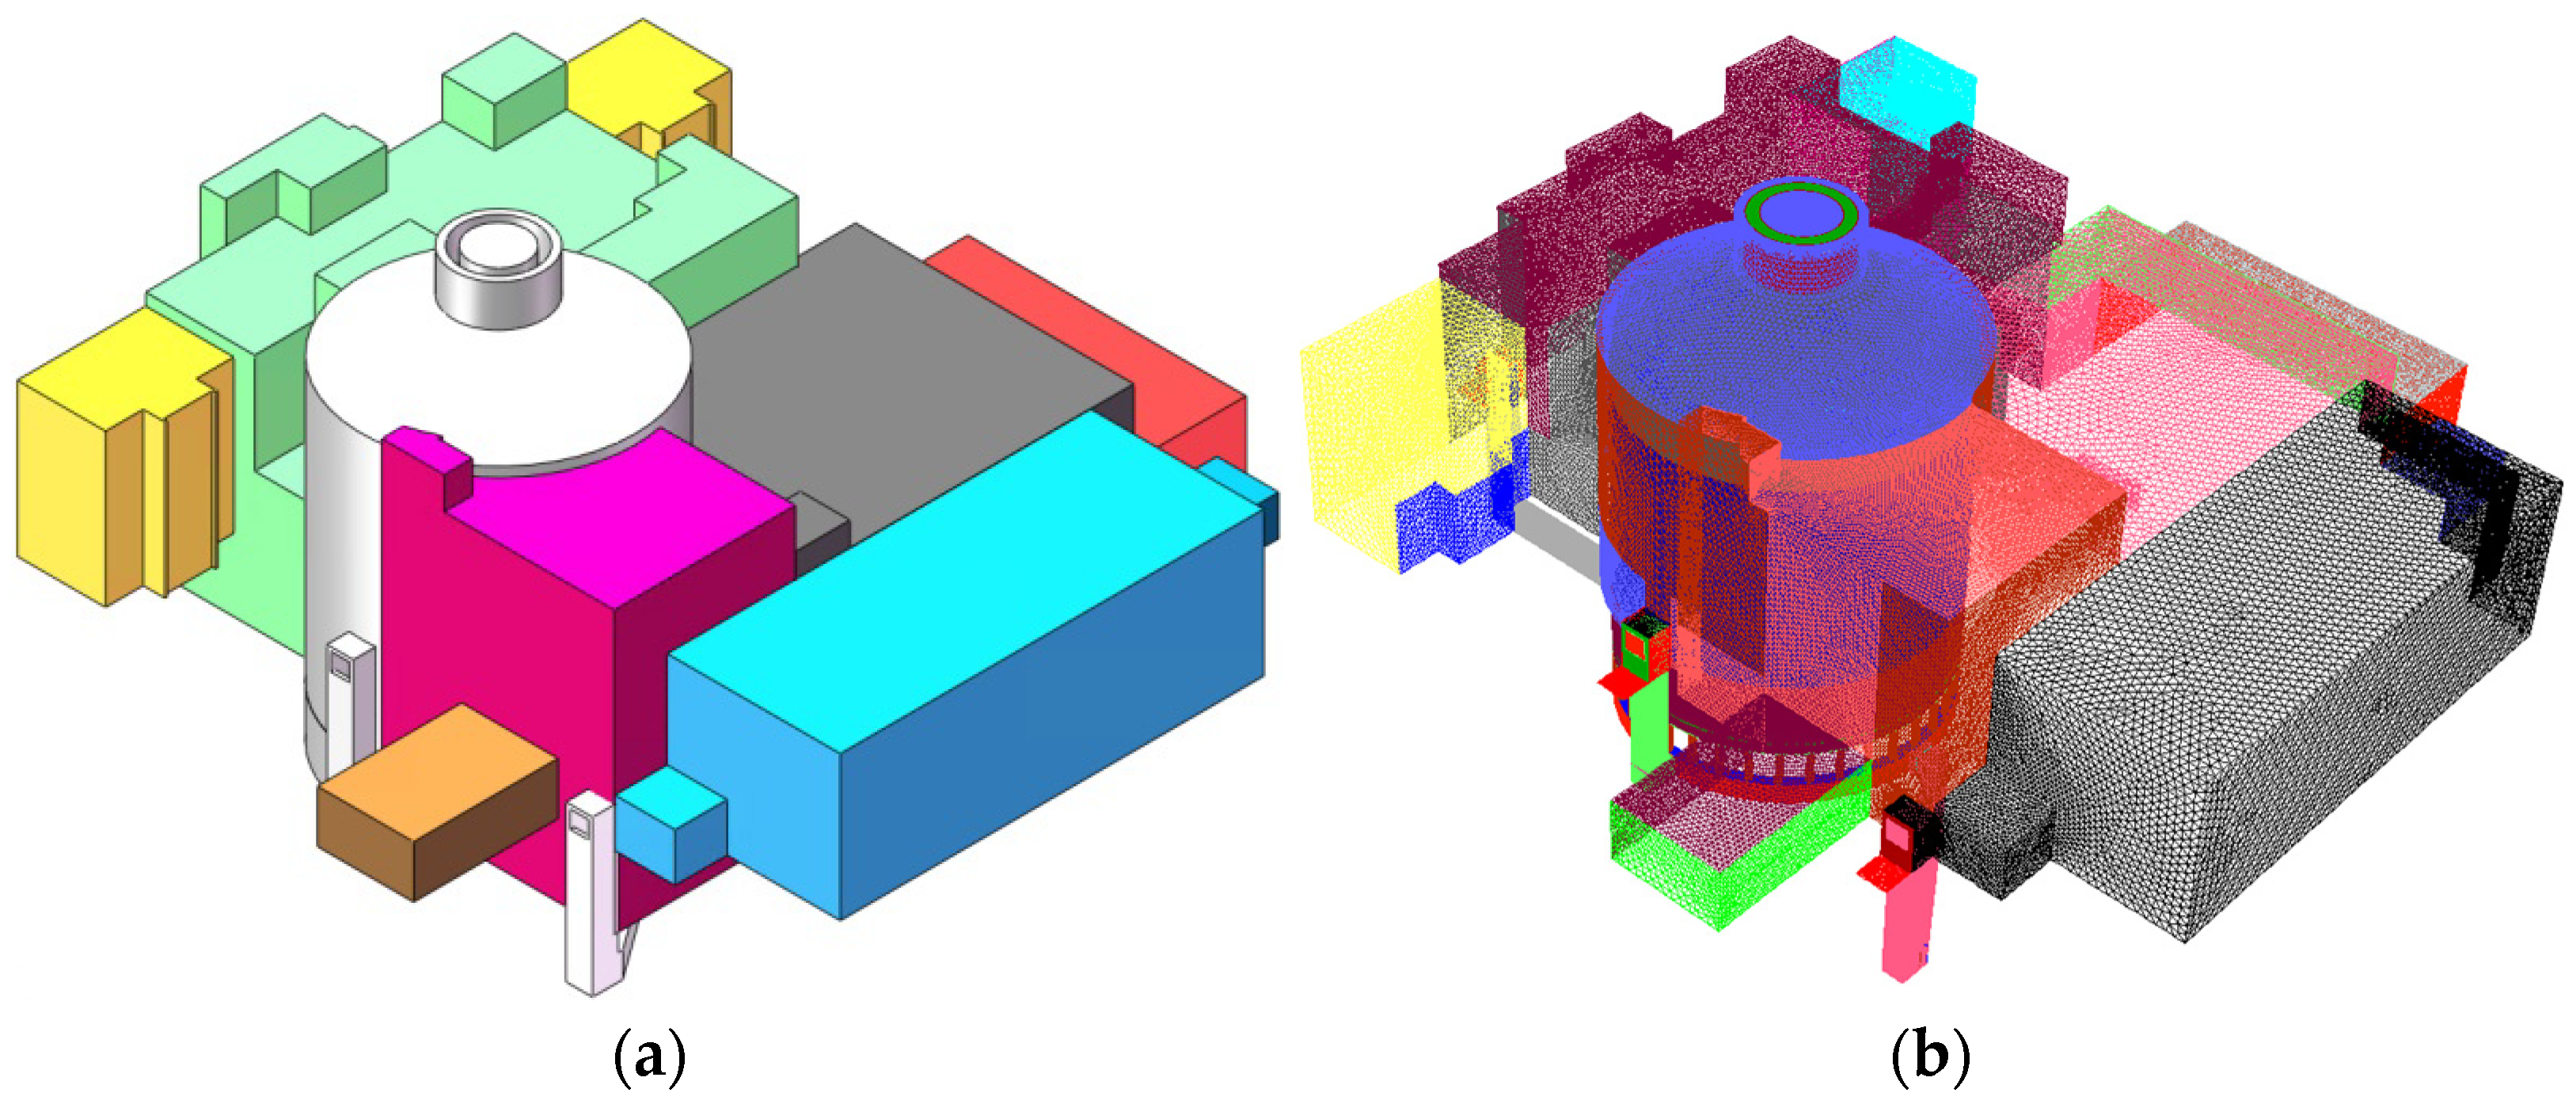
ANSYS Fluent18.2 was employed for numerical simulations of the 1:126 scaled-down ACP100 model [
17,
18,
19]. The calculations utilized the laminar model, the k-omega (SST) model or the k-ε turbulence model depending on the conditions of the computational cases and adhered to conservation principles, while neglecting the effects of radiative heat transfer and air humidity. A combination of structured and adaptive grids was implemented. The grid configurations were defined with cell counts of 1.37 million (Grid 1), 2.88 million (Grid 2), 5.12 million (Grid 3), and 9.82 million (Grid 4). The results indicated that the calculations from Grid 1, Grid 2, and Grid 3 differed from those obtained using Grid 4 by margins of 2.6%, 1.1%, and 0.4%, respectively. Considering both computational accuracy and time efficiency, Grid 3 was selected for further analysis in this study.
Figure 2 presents a schematic diagram illustrating the structure and grid configuration of the ACP100 scaled-down model.
In alignment with the actual test site conditions, the environmental air temperature was established at 13.9 °C for the numerical calculations. The heated wall was modeled with a constant wall temperature boundary condition. The surface roughness of the wall was set to a reference value of 20 μm. The temperatures of the steel shell wall were set to 13.9 °C (unheated), 55.8 °C, 93.5 °C, and 126.8 °C, while the environmental wind speeds were configured at 0 m/s, 5 m/s, 10 m/s, 15 m/s, and 20 m/s. The air was modeled as an ideal, incompressible gas with a density that varies with temperature. Additionally, radiative heat transfer and the effects of air humidity were neglected in the calculations. The setting of boundary conditions mainly refers to the actual laboratory conditions for the convenience of subsequent experimental comparative research. Through these numerical calculations, it is possible to obtain pressure distributions, temperature distributions, and flow velocity distributions within the PAS flow channel under various conditions using the ACP100 scaled-down test model.
2.1. Impact of Heating Wall Temperatures on PAS Flow Channel Pressure Distribution Calculation
The pressure distribution within the PAS flow channel is indicative of the airflow dynamics occurring inside it. A greater pressure differential between the inlets and top outlet results in a more substantial driving force for circulation. By analyzing the variations in pressure within the PAS flow channel under both heated and unheated conditions, we can ascertain the influence of heating on its pressure distribution. For this analysis, we assume that environmental wind effects are negligible, setting the corresponding environmental wind speed to 0 m/s. The pressures at each measurement position along the PAS flow channel were calculated for wall temperatures of 55.8 °C, 93.5 °C, and 126.8 °C during heating conditions.
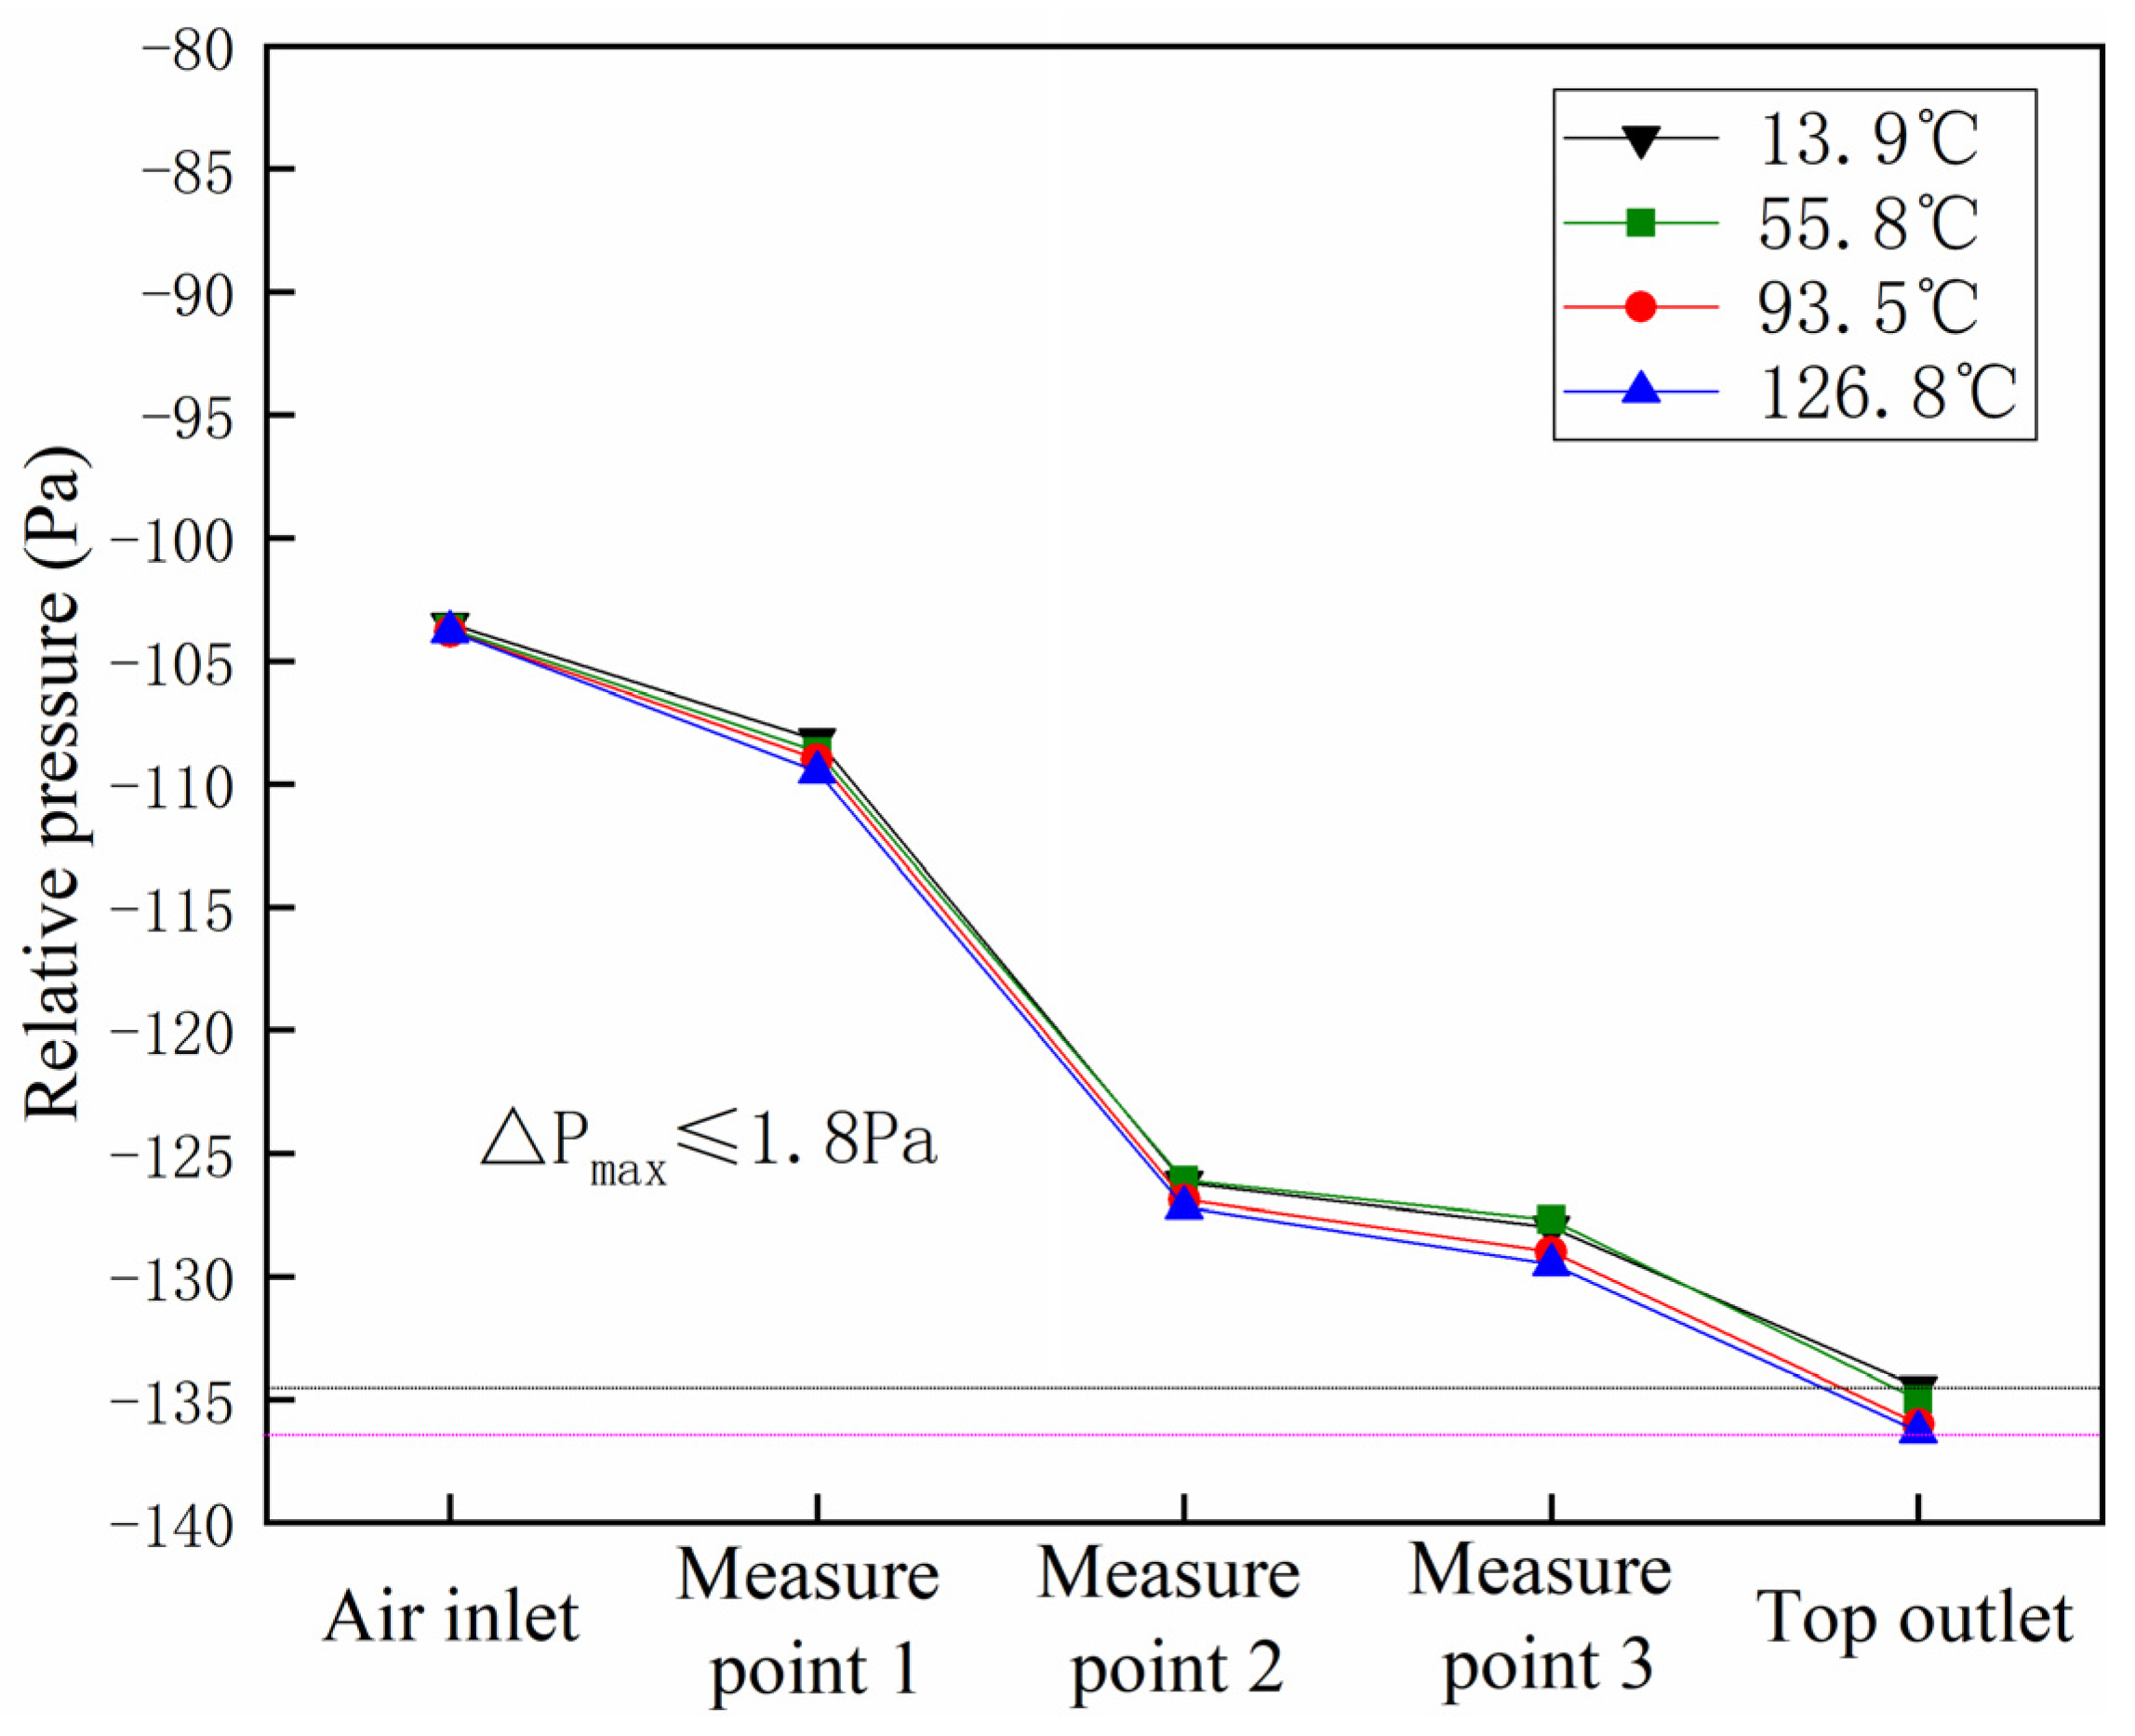
Figure 3 illustrates the pressure distribution within the PAS flow channel at various heating wall temperatures, with an environmental wind speed of 0 m/s. From the inlets to the top outlet, there is a gradual decrease in pressure throughout the PAS flow channel; however, the maximum pressure difference (∆P
io) remains below 3.9 Pa. The minimal pressure differential between the inlets and outlet suggests that natural circulation would be challenging to establish or exceedingly weak, rendering it negligible. For the inlets, positions 1, 2, and 3 as well as the top outlet, the maximum pressure deviation observed under identical conditions but with varying heating wall temperatures is less than 0.7 Pa (∆P
max < 0.7 Pa). This indicates that variations in heating wall temperature have a minor effect on pressure distribution within the PAS flow channel.
In summary, when the environmental wind speed is maintained at 0 m/s, the impact of heating conditions on the steel shell wall has a minimal effect on both the pressure distribution and airflow dynamics within the PAS flow channel. This influence can be regarded as negligible.
When examining the coupled effects of the environmental wind field, environmental wind speeds were established at 5 m/s, 10 m/s, 15 m/s, and 20 m/s. Concurrently, the temperatures of the heating walls were set to 13.9 °C (unheated), 55.8 °C, 93.5 °C, and 126.8 °C in order to calculate pressure variations within the PAS flow channel. The results indicate consistent patterns across different environmental wind speeds.
To illustrate this further, we will use an environmental wind speed of 10 m/s as a case study to describe the pressure distribution within the PAS flow channel at varying heating wall temperatures. Additionally, we will introduce airflow dynamics inside the PAS flow channel, specifically with a heating wall temperature of 55.8 °C.
For various environmental wind speed calculation conditions, it is observed that as the environmental wind speed increases, the relative pressure at each measurement position decreases. Nevertheless, the trend of pressure changes within the PAS flow channel remains consistent across all calculation scenarios. At identical positions, the pressure deviation values obtained under different temperatures of the steel shell heating wall remain relatively small.
Figure 4 illustrates the pressure distribution within the PAS flow channel at varying heating wall temperatures when subjected to an environmental wind speed of 10 m/s. The inlet pressure exceeds that of the top outlet pressure. The pressure difference (∆P
io) between the inlets and top outlet is significantly greater compared to conditions where the environmental wind speed is 0 m/s, indicating that ambient wind positively influences airflow within the PAS flow channel.
Under differing steel shell heating wall temperature conditions, a maximum pressure deviation (∆Pmax) of ≤1.8 Pa at each measurement position suggests that despite being influenced by both environmental wind fields and heating conditions, their impact on the pressure distribution within the PAS flow channel can be considered negligible.
Figure 5 illustrates the distribution of air flow velocity within the PAS flow channel under conditions where the environmental wind speed is 10 m/s and the heating wall temperature is set at 55.8 °C. The incoming environmental air, initially at a temperature of 13.9 °C, enters through the inlets, traverses through the ventilation sleeves and annular flow channel, and subsequently exits via the top outlet. As this environmental air flows into the annular channel, it undergoes continuous heating from contact with the steel shell surface; consequently, its temperature rises while its density decreases along its path.
Notably, in regions characterized by smaller cross-sectional areas, such as inlets, ventilation sleeves, mixing wind corridors, and top outlet, the airflow velocity can exceed 1.8 m/s. In contrast, within larger cross-sectional areas like the annular flow channel itself, the average air flow velocity remains below 0.2 m/s. It is important to highlight that within the PAS flow channel, airflow velocities are relatively low and exhibit uneven distribution patterns. For instance, in an area of approximately 0.8 cm width within an environmental flow channel section near a wall surface, airflow velocity approaches nearly 0 m/s; conversely, at the center of this same section of fluid passageway, velocities may reach up to 0.36 m/s.
In summary, with or without the influence of the environmental wind field, the maximum pressure deviation ∆Pmax at each measurement position of the PAS flow channel satisfies ∆Pmax ≤ 1.8 Pa, indicating that the impact of heating conditions on the pressure distribution of the PAS flow channel can be neglected.
2.2. Impact of Heating Conditions on PAS Flow Channel Temperature Distribution Calculation
When investigating the effects of heating conditions on the temperature distribution within the PAS flow channel, wall temperatures were established at 55.8 °C, 93.5 °C, and 126.8 °C. Correspondingly, environmental wind speeds were set to 0 m/s, 5 m/s, 10 m/s, 15 m/s, and 20 m/s in order to calculate the air temperature at each measurement position within the PAS flow channel.
Figure 6 illustrates the temperature distribution within the PAS flow channel at various measurement positions under different conditions. As air flows from the inlets to the top outlet of the PAS flow channel, it is continuously heated, resulting in a rise in temperature. When the heating temperature of the steel shell wall reaches 55.8 °C, the maximum temperature deviation satisfies ∆T
max ≤ 1.3 °C across all measurement positions within the PAS flow channel for varying environmental wind speeds (this conclusion also holds true for cases where the steel shell wall heating temperatures are 93.5 °C or 126.8 °C). It is observed that an increase in the heating temperature of the steel shell wall correlates with higher air temperatures at corresponding positions within the PAS flow channel and subsequently higher air temperatures at the top outlet.
Taking an environmental wind speed of 10 m/s and a heating wall temperature of 55.8 °C as an example, we present a detailed analysis of air temperature distribution within the PAS flow channel.
Figure 7 depicts a contour map illustrating this air temperature distribution when subjected to an environmental wind speed of 10 m/s and a heating wall temperature of 55.8 °C. The data indicate that as one moves closer to the surface of the heating wall horizontally, there is a corresponding increase in air temperature. Vertically, continuous heating causes gradual increases in air temperatures throughout the PAS flow channel until reaching their maximum values at elevated spaces near its top section.
In summary, regardless of the influence exerted by the environmental wind field, the maximum temperature deviation (∆Tmax) at each measurement position within the PAS flow channel remains within acceptable limits, specifically ∆Tmax ≤ 1.3 °C. It is observed that as the heating temperature of the steel shell wall increases, so does the air temperature, ultimately reaching its peak value in the upper region of the PAS flow channel.
To ensure the accuracy of the numerical calculations, a hot-state test experiment was carried out utilizing the ACP100 scaled-down model.
3. Experimental Design and Results Analysis
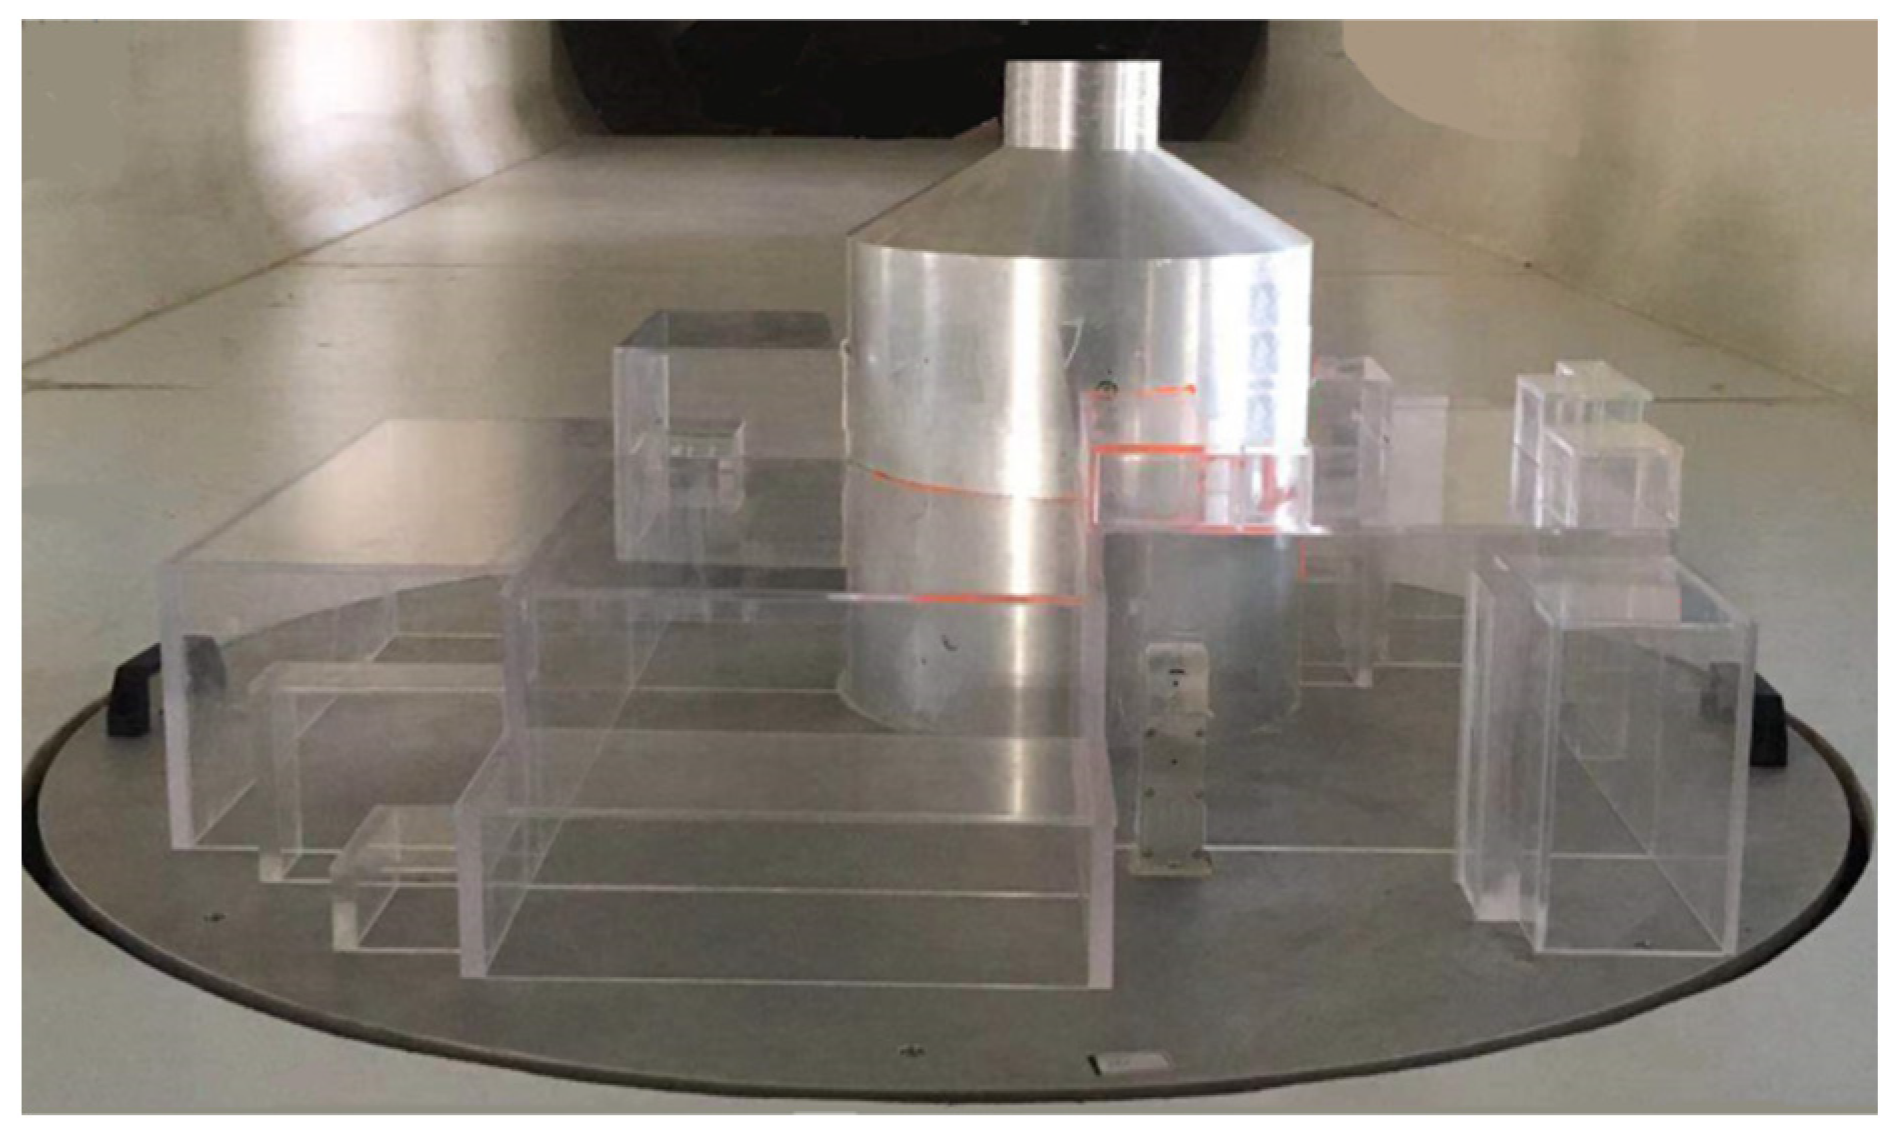
The ACP100 scaled-down test model primarily comprises the safety shell model, the plant model, and the bottom support frame [
20,
21,
22]. The safety shell model is constructed from aluminum alloy, while the plant model is fabricated from organic glass. The bottom support frame is made of stainless steel.
Figure 8 presents an actual drawing of the ACP100 scaled-down test model.
Pressure measurement positions were strategically arranged at the inlets, within the annular flow channel, and at the top outlet of the ACP100 scaled-down test model. A digital mini-pressure meter was employed for these measurements. Additionally, platinum resistance thermometers were installed at the inlets, on the steel shell surface, and at the top outlet to monitor both air temperature and steel shell surface temperature.
During the experimental tests, the ACP100 scaled-down test model was positioned on a wind tunnel platform equipped with a pitot tube and thermocouples to measure environmental wind speed and temperature. The wind tunnel platform employed in this study features a cross-sectional dimension of 2 m × 2 m and an effective usable length of 11 m. It is a direct-current, aspiration-type closed wind tunnel, comprising an intake flow-stabilizing section, a test section, and a fan exhaust section. Additionally, the test section is equipped with a 360° free-rotation turntable, facilitating research on wind direction angles and oblique wind conditions. The platform provides an airflow environment with a deflection angle of less than 1° and velocity non-uniformity of less than 1%, supporting experimental studies under various environmental wind speed conditions. Furthermore, the instrument and control system of the wind tunnel platform enables remote control of experimental operations and simultaneously monitors wind speed, temperature, and pressure. The measurement ranges and accuracies are as follows: wind speed range of 0 m/s to 30 m/s with an accuracy of ±0.1 m/s; temperature range of −20 °C to 100 °C with an accuracy of ±0.2 °C; and relative pressure range of 0 Pa to 10,000 Pa with an accuracy of ±1 Pa.
To achieve uniform and stable control over the surface temperature of the steel shell of the ACP100 scaled-down test model, silicone electric heating sheets were utilized to heat its inner surface. These silicone electric heating sheets had an approximate thickness of 1.5 mm, a rated heating power of 2.5 kW/m2, a maximum operating temperature limit of 180 °C, and a voltage limit of 380 V. A voltage regulator along with a temperature controller facilitated the precise control and adjustment of heat output.
During the experiment, it was observed that the heating voltage of the silicone electric heating sheets fluctuated within the uncertain range. To minimize the impact of these voltage fluctuations, the selected heating temperature should be set with a certain temperature interval. The surface temperatures of the ACP100 scaled-down model steel shell were recorded at various voltages: when set to 100 V, 150 V, and 175 V, respectively, yielded measured temperatures of 55.8 °C, 93.5 °C, and 126.8 °C. Considering the accidental scenarios, the surface temperature of the steel containment of ACP100 could exceed 130 °C; the temperatures of the steel shell wall were chosen as 13.9 °C (unheated), 55.8 °C, 93.5 °C, and 126.8 °C.
The primary measurement parameters for this experiment included pressure, temperature, and wind speed within the PAS flow channel; corresponding measurement errors were ±1 Pa for pressure readings, ±0.2 °C for temperature readings, and ±0.1 m/s for wind speed measurements.
3.1. Impact of PAS Flow Channel Pressure Distribution Experimental Research and Analysis
Without taking into account the environmental wind field, the corresponding environmental wind speed was recorded at 0 m/s. When the heating voltage of the silicone electric heating sheet was adjusted to 100 V, 150 V, and 175 V, the resulting surface temperatures of the steel shell were measured at 55.8 °C, 93.5 °C, and 126.8 °C, respectively. Pressure variations were monitored at each measurement position within the PAS flow channel.
The intensity of natural air circulation within the PAS flow channel is primarily characterized by the pressure difference between the inlets and outlet of the PAS flow channel. A larger pressure difference indicates a stronger driving force for circulation, while a smaller pressure difference suggests a weaker driving force. The presence of an external wind field can either enhance or weaken the natural air circulation within the PAS flow channel, which can be quantitatively assessed by examining the changes in the pressure difference between the inlet and outlet when the wind field is applied.
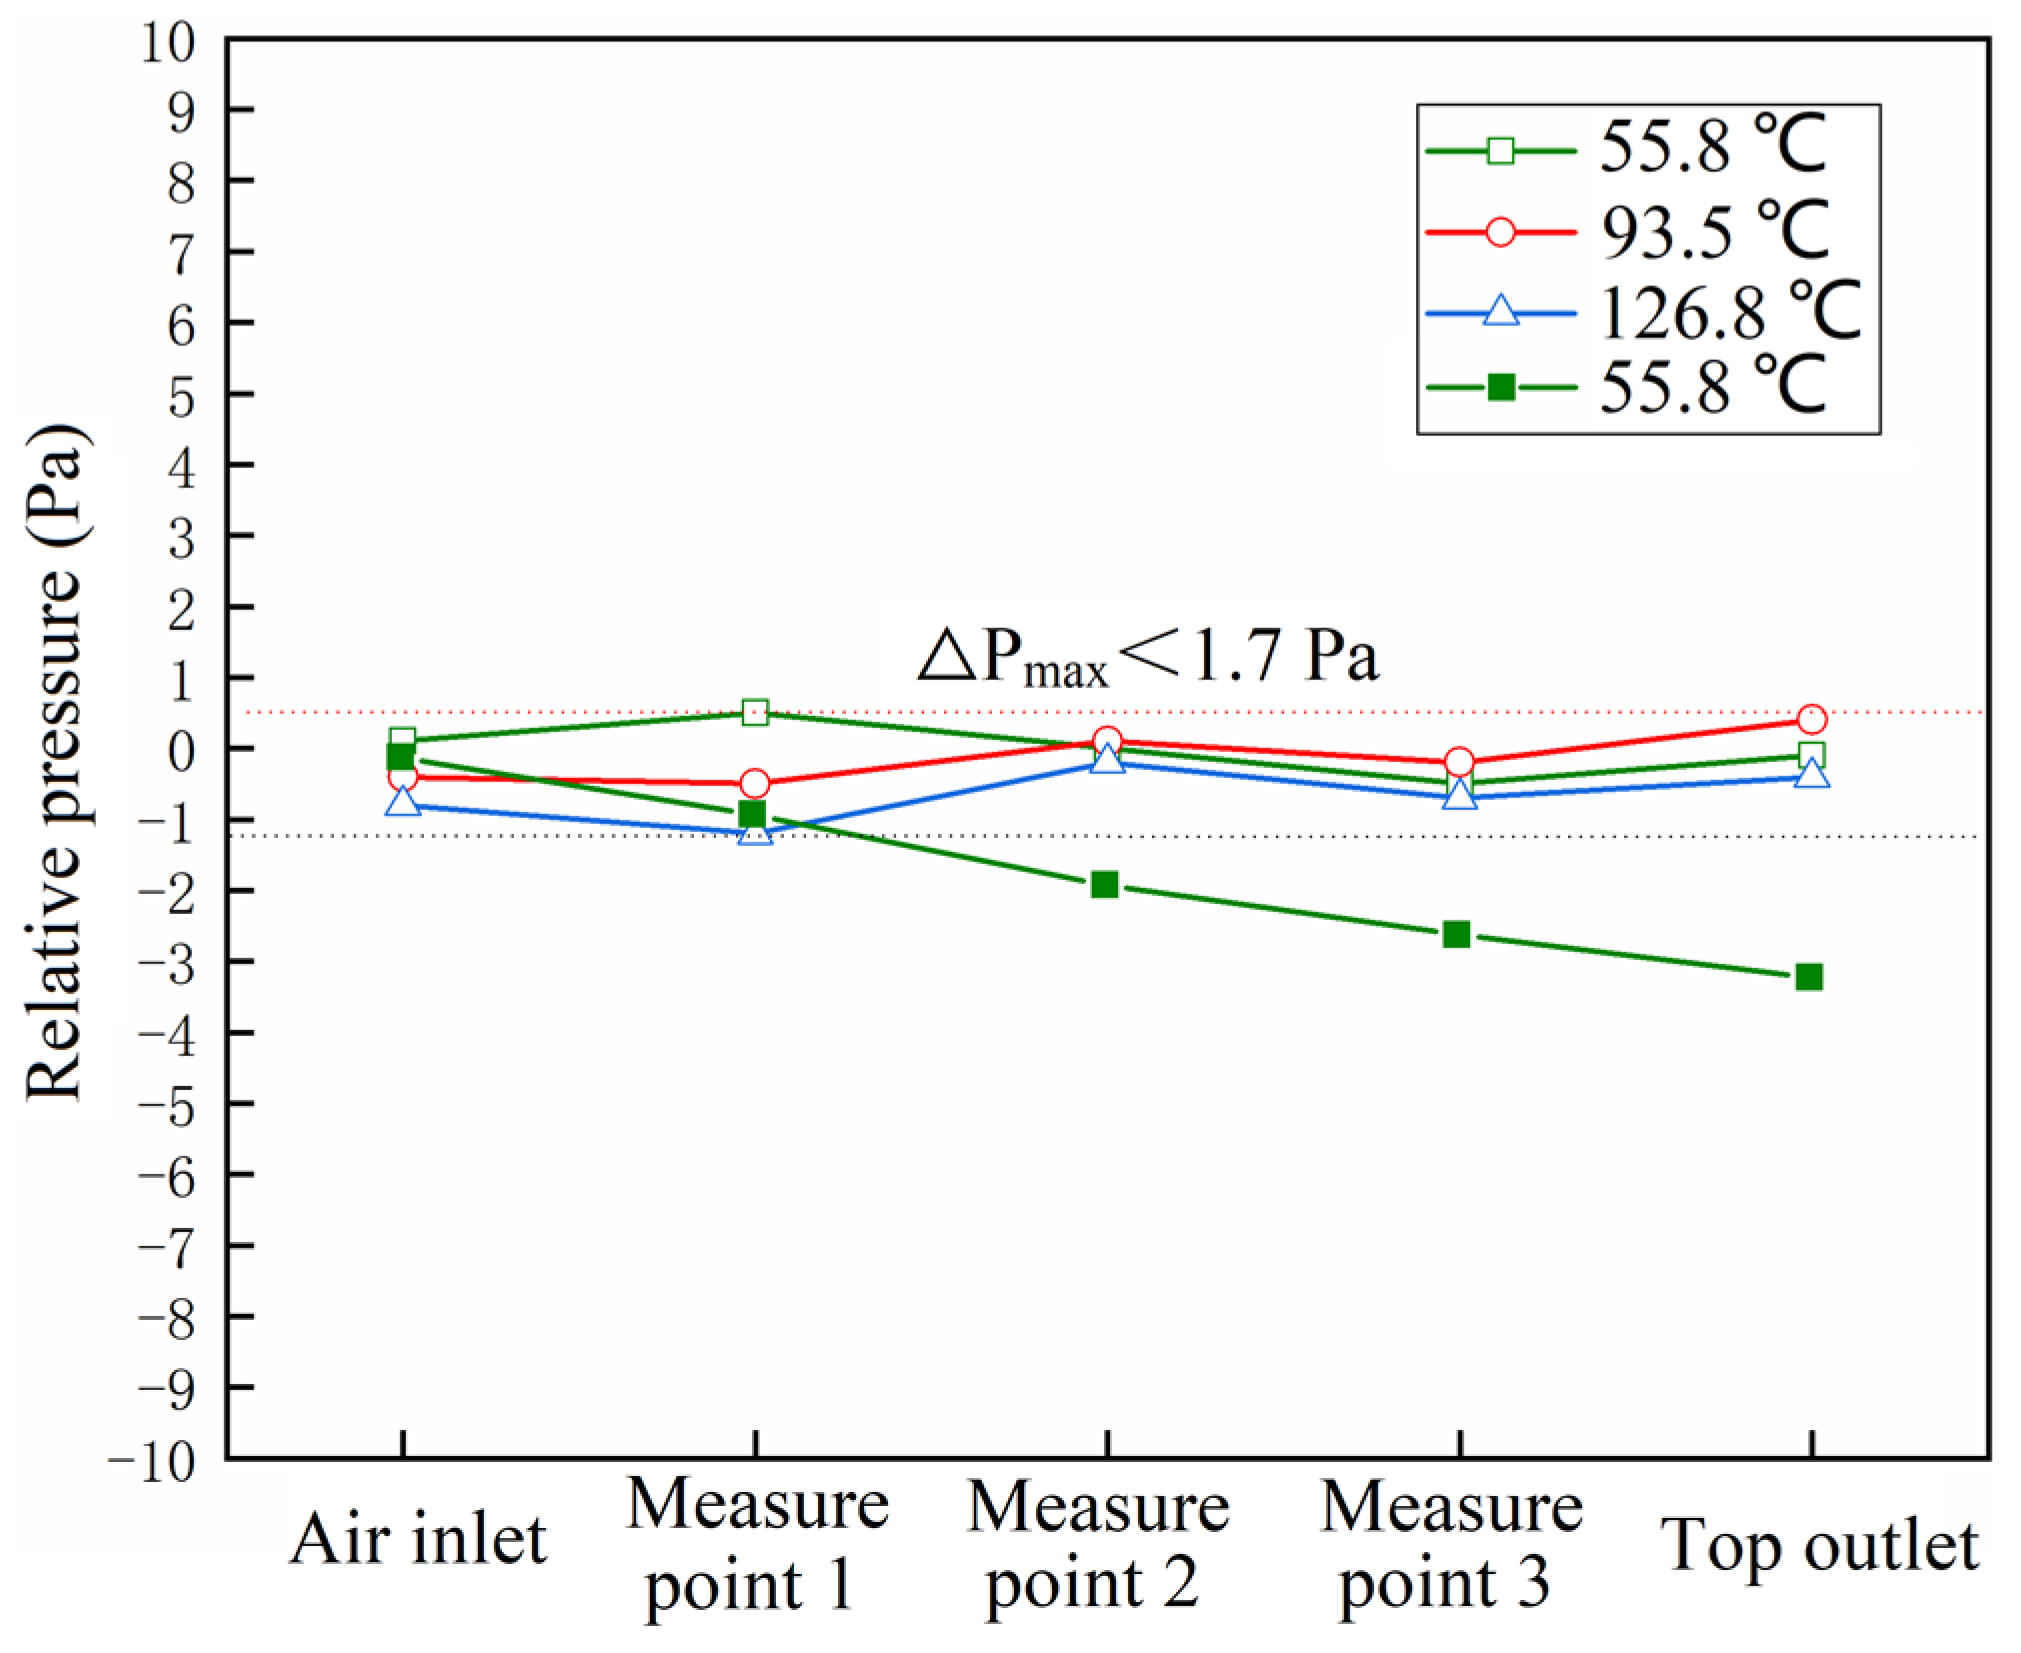
Figure 9 illustrates the pressure distribution within the PAS flow channel when the environmental wind speed is 0 m/s. The experimental data points depicted in the figure are represented as hollow markers, while the numerical calculation points are shown as solid markers (the same applies below). In comparison to the numerical results, there is no discernible trend in pressure variation from the inlets to the top outlet of the PAS flow channel. This observation can primarily be attributed to measurement errors and limitations inherent in experimental conditions. The range of pressure changes recorded within the PAS flow channel remains minimal, with a maximum pressure deviation of ∆P
max < 1.7 Pa at various positions under different heating wall temperatures. This indicates that there is either negligible gas flow or very weak flow present inside the PAS flow channel, thereby further substantiating our conclusion that “the impact of heating conditions on the pressure distribution within the PAS flow channel can be considered negligible”. In the absence of wind, the external wind field has no influence on the natural circulation of air within the PAS flow channel. The natural circulation of air within the flow channel is solely determined by the temperature differences between the fluid inside and outside the channel.
When examining the coupled effects of the environmental wind field, the corresponding wind speeds were set at 5 m/s, 10 m/s, 15 m/s, and 20 m/s. The temperatures of the heating walls were established at 13.9 °C (unheated), 55.8 °C, 93.5 °C, and 126.8 °C to monitor pressure variations at each measurement position within the PAS flow channel. Given that the experimental findings under different environmental wind speeds exhibit similar trends, this discussion will focus solely on an environmental wind speed of 10 m/s as a representative example to illustrate the experimental pressure distribution in the PAS flow channel under varying heating wall temperature conditions.
Figure 10 illustrates the pressure distribution within the PAS flow channel when the environmental wind speed is set at 10 m/s. From the inlets of the PAS flow channel to the top outlet, a distinct decreasing trend in pressure is observed at each measurement position. The pressure deviation of ∆P
max < 3 Pa across various heating wall temperatures indicates that the influence of heating conditions on the pressure distribution within the PAS flow channel of the ACP100 scaled-down test model can be considered negligible.
Furthermore, by taking the experimental results obtained with a heating wall temperature of 55.8 °C and an environmental wind speed of 10 m/s as a reference, we compare these findings with numerical calculation results. It is evident that from the inlets to the top outlet of the PAS flow channel, both experimental and numerical data exhibit consistent trends in pressure variation. Additionally, it has been confirmed that the pressure deviations at each measurement position are satisfactory within acceptable limits, further reinforcing the reliability of our numerical calculations.
3.2. Impact of PAS Flow Channel Temperature Distribution Experimental Research and Analysis
When investigating the influence of heating conditions on the temperature distribution within the PAS flow channel, the experimental setup is aligned with the numerical calculations. Specifically, the temperatures of the heating walls are established at 55.8 °C, 93.5 °C, and 126.8 °C. The environmental wind speeds corresponding to each heating wall temperature are set at 0 m/s, 5 m/s, 10 m/s, 15 m/s, and 20 m/s in order to monitor temperature variations at each measurement point within the PAS flow channel. For illustrative purposes, this discussion will focus on an example using a heating wall temperature of 55.8 °C to elaborate on the experimental results.
Figure 11 illustrates the temperature distribution within the PAS flow channel when the heating wall temperature is set at 55.8 °C. When the environmental wind speed is 0 m/s, there is a continuous increase in air temperature from the inlets to the top outlet due to ongoing heating. In contrast, at environmental wind speeds of 5 m/s, 10 m/s, 15 m/s, and 20 m/s, the temperature deviation at each measurement position within the PAS flow channel remains within T
max ≤ 2.8 °C. This indicates that the influence of the environmental wind field on temperature distribution in the PAS flow channel is minimal and can be considered negligible.
Taking, as an example, the experimental results obtained with a heating wall temperature of 55.8 °C and an environmental wind speed of 10 m/s, we observe that when compared to numerical calculation results, there exists a consistent trend in temperature change from the inlet to outlet of the PAS flow channel between both sets of data. Furthermore, it is noted that the temperature deviations at each measurement position align closely with one another, confirming that experimental findings are congruent with numerical calculations. Under both windy and windless conditions, the temperature continuously increases from the inlet to the outlet of the PAS flow channel. This indicates that the heating conditions have a certain influence on heat transfer within the flow channel. However, considering the relatively small pressure difference between the inlet and outlet, this influence is relatively minor.
During the aforementioned experiments, it was observed that both the experimental and numerical results exhibited certain discrepancies. In addition to measurement errors, the simplification of the experimental model and local variations in geometry were also identified as primary causes of these deviations. However, the overall trends of the experimental and numerical results were in good agreement, which had a negligible impact on the qualitative analysis.
4. Conclusions
In this study, a combined approach of numerical computation and experimental investigation was employed. We conducted numerical simulations and thermal tests on a 1:126-scaled ACP100 model to explore the influence of heating conditions on the PAS wind load tests using the scaled model. The aim was to provide a robust reference for the design of PAS wind load performance tests. The findings indicate that the heating conditions have a negligible effect on the pressure and temperature distribution within the PAS flow channel. The ambient wind field is beneficial for PAS heat transfer, and even with the coupling effect of the ambient wind field, the influence of heating conditions on PAS remains insignificant. The numerical and experimental results are in good agreement. The specific conclusions are as follows:
- (1)
Regardless of the presence or absence of an environmental wind field, the maximum pressure deviation (∆Pmax) at each measurement point within the PAS flow channel remains relatively small under various heating temperatures of the steel shell wall. For instance, when the environmental wind speed is 10 m/s, the maximum pressure deviation at each measurement point satisfies ∆Pmax ≤ 1.8 Pa, accounting for less than 1.4% of the total pressure. This indicates that the influence of heating conditions on the pressure distribution in the PAS flow channel can be considered negligible.
- (2)
Under the presence or absence of an environmental wind field, the maximum temperature deviation (∆Tmax) at each measurement point within the PAS flow channel remains small under various heating temperatures of the steel shell wall. For example, when the environmental wind speed is 10 m/s, the maximum temperature deviation at each measurement point satisfies ∆Tmax ≤ 2.8 °C, accounting for less than 7.8% of the total temperature variation. This indicates that the influence of the environmental wind field on the temperature distribution in the PAS flow channel can be considered negligible.
- (3)
Under various heating temperatures of the steel shell wall, the temperature consistently rises from the inlets of the PAS flow channel to the top outlet. Furthermore, it is observed that a higher heating wall temperature at any given measurement position correlates with an increased air temperature within the flow channel.
In summary, when utilizing the ACP100 scaled-down model for research on the PAS wind loading performance test, the influence of heating conditions on the test results is minimal and can be disregarded. By omitting the consideration of heating conditions, we not only reduce the complexity and cost of testing but also shorten the overall research timeline. The findings from this study serve as one of the valuable references and provide evidence for designing PAS wind loading performance tests.
Looking ahead, when conducting PAS wind loading performance test research under various conditions using the ACP100 scaled-down model, it is reasonable to neglect the setting of heating conditions. This approach effectively lowers both testing expenses and labor costs while streamlining the research process.


