


Comparative Analysis of Charging Station Technologies for Light Electric Vehicles for the Exploitation in Small Islands †


Abstract
1. Introduction
- Progressively substituting urban car trips with range less than order of 8 km, which are the majority worldwide;
- Reducing the use of cars also in rural areas [2];
- Stimulating a modal shift from private ownership to sharing modes [3];
- Enlarging the audience of potential users to the share of elderly and fragile people [4];
- Fostering the development of the so-called green tourism [5].
- Accessibility;
- Cost;
- Minimum level of desired quality of service;
- Environmental sustainability.
- Estimating the power and energy impact of LEVs recharging on the grid;
- Performing a techno-economic analysis of various charging station technologies;
- Assessing the environmental sustainability of the various solutions.
- The tourism multiplies tenfold the population of Favignana in summer, hence the demand for recharging EVs drastically varies among the seasons;
- The island of Favignana has a lowly structured power grid, which might benefit from even a low alleviation of the burden, especially in the peak hours in summer;
- The electricity in Favignana is produced using diesel generators, hence with an averagely high level of GHGs emissions.
1.1. Related Work
1.1.1. Carbon Footprint and Electric Mobility
1.1.2. Rural/Remote Areas
1.1.3. The Island of Favignana, Its Power Grid and Energy Mix
1.1.4. Off-Grid Charging Stations Powered by Renewables
1.1.5. Related Technologies
- Battery technology: recent developments have been achieved about super-capacitorbased installations [37,38], which are especially promising due to higher power densities and faster recharging times than batteries. The assessment of such technology might be promising when generalizing the approach of the present work to city scenarios and electric vehicles with much higher power demand.
- Communication infrastructure: since, as discussed for example in [35], the quality of service is not guaranteed when employing off-grid charging stations powered by renewables, smart charging algorithms [39] would be beneficial and this requires to set up adequate communication infrastructures for localizing the e-bikes while en route and for directing them at the most appropriate charging station.
1.2. Research Gap and Highlights
- The sustainability of PV-powered off-grid charging stations, specifically for the case of LEVs;
- A scrupulous techno-economic analysis regarding the exploitation of prototypes of off-grid charging stations in real-world scenarios, going beyond prototype design phase to which most of the state of the art is devoted;
- The identification of specific contexts (as the selected use case, island of Favignana), where the additional load of LEVs, although modest, might exacerbate the stress on lowly structured and isolated power grids, thus causing economic disadvantages.
1.3. Article Organization
2. Methods
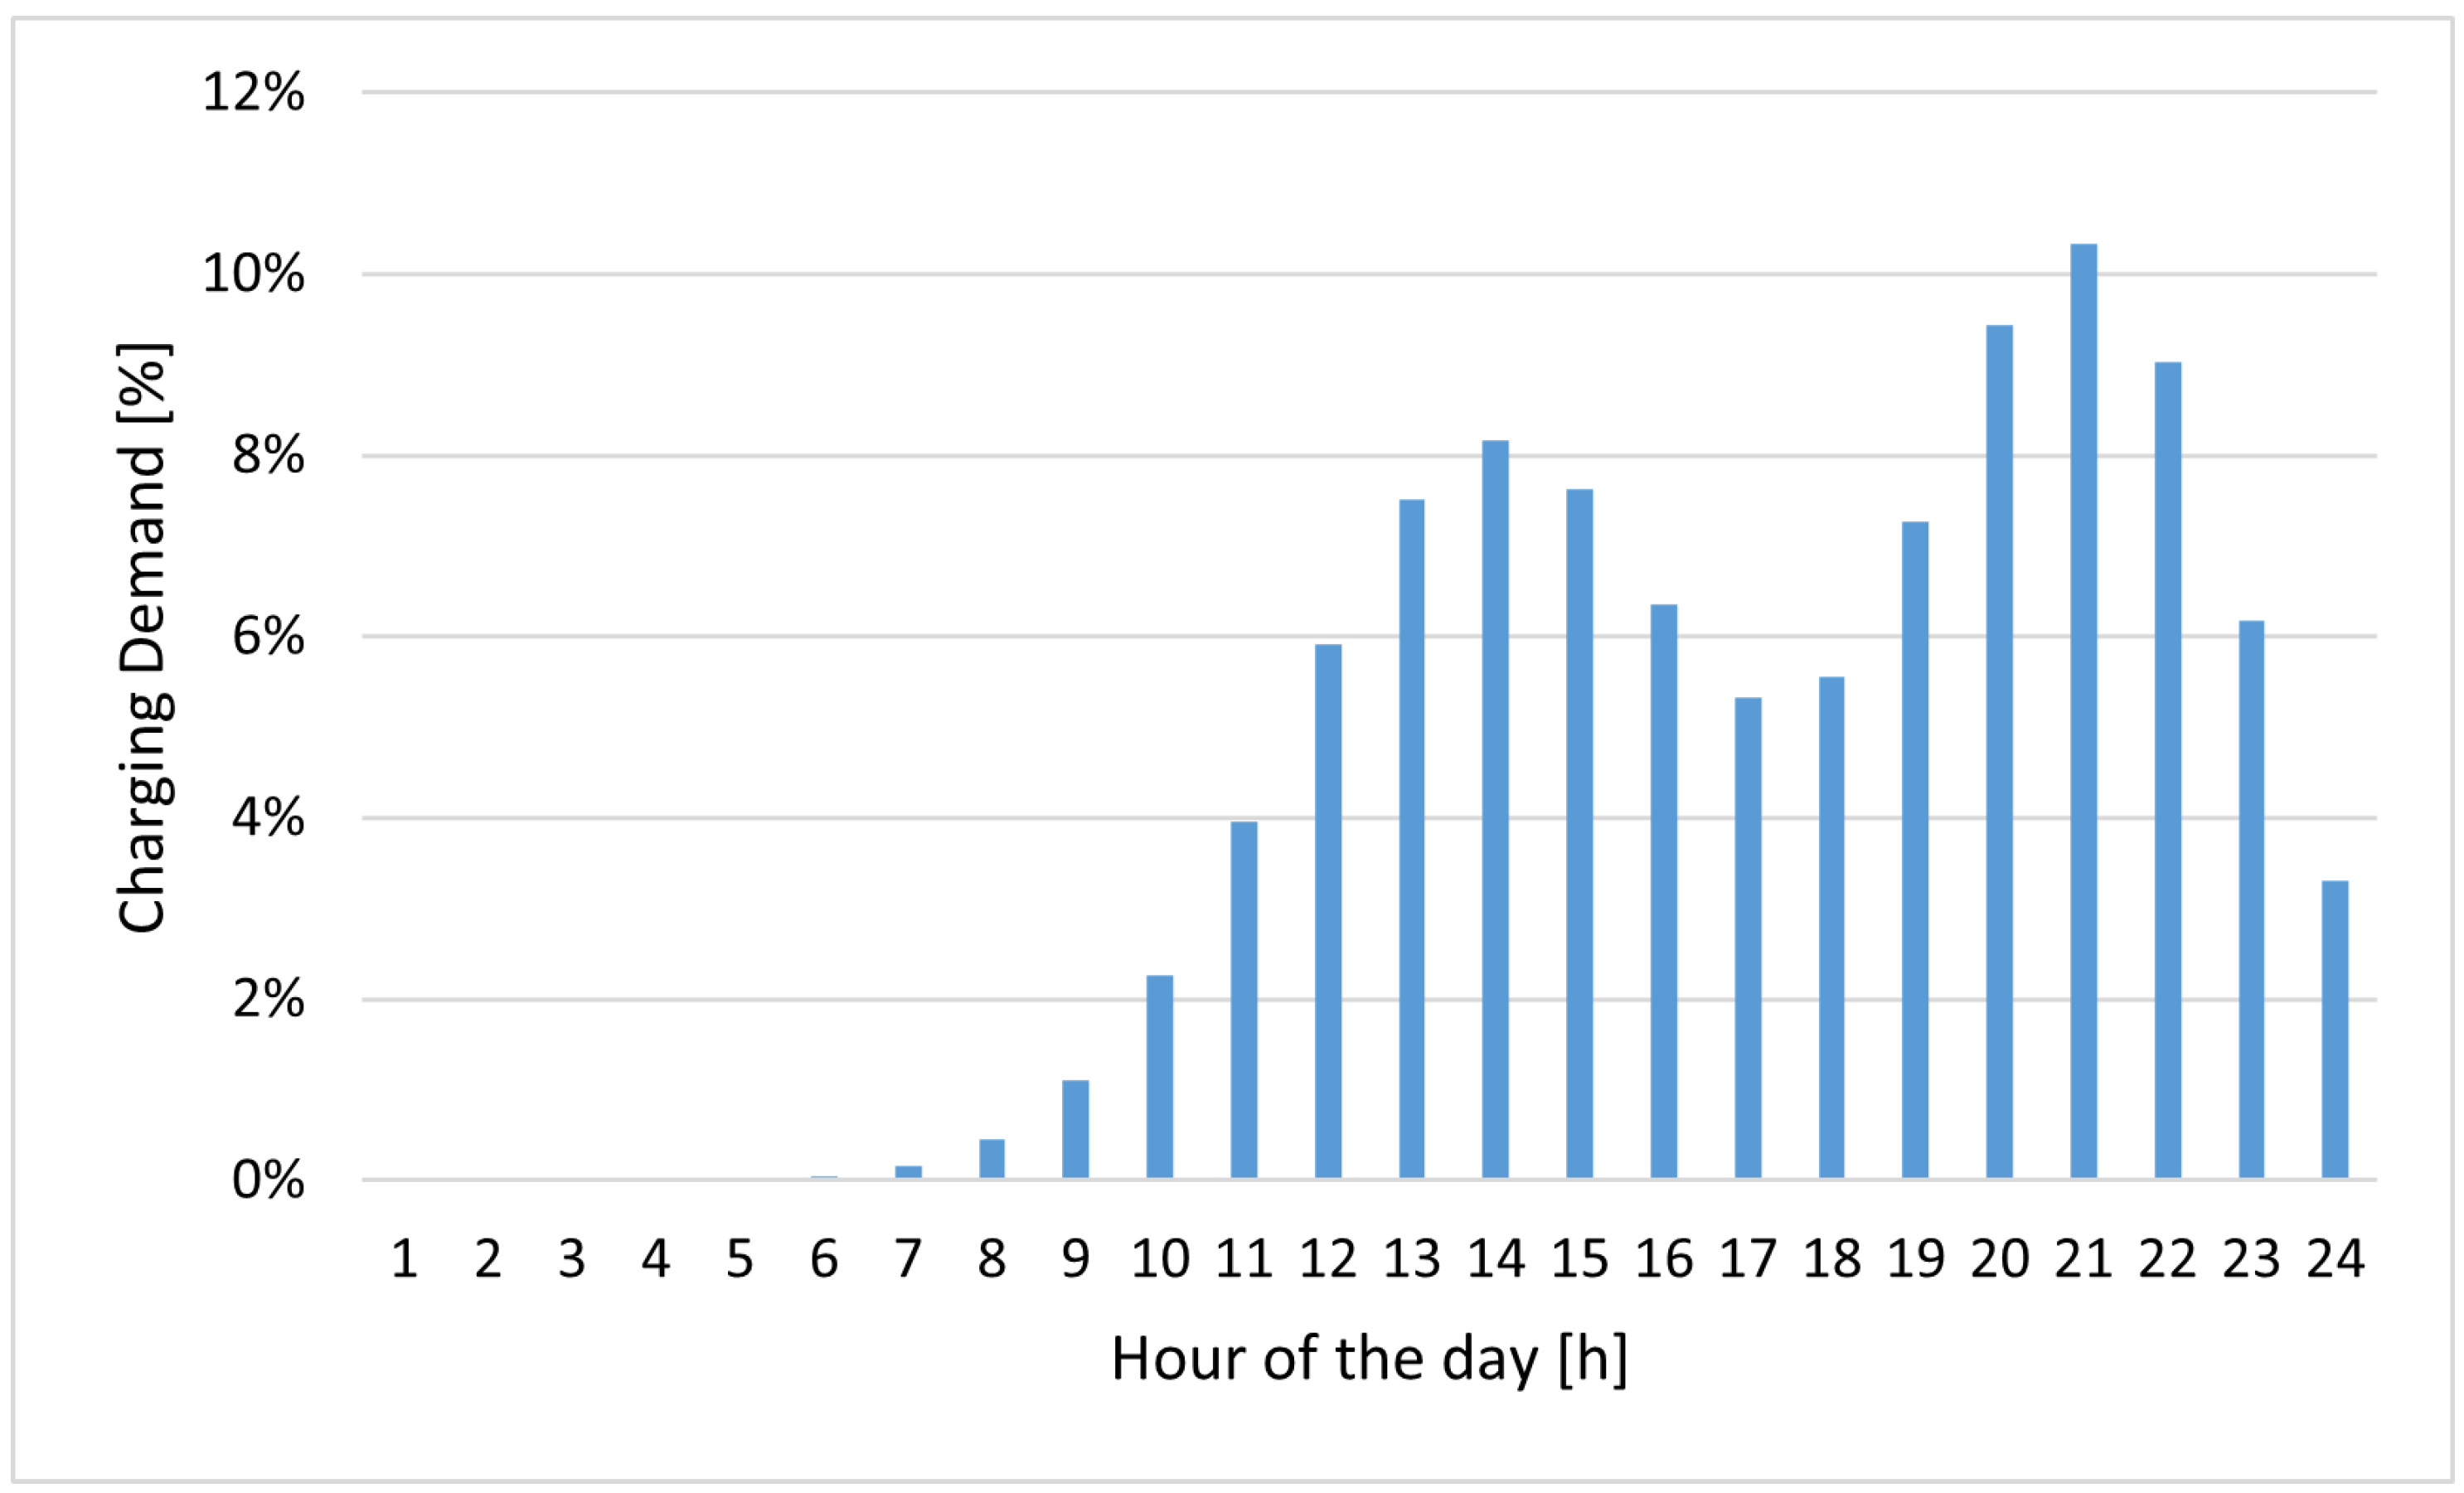
2.1. Power and Energy Consumption Analysis
2.2. Environmental Analysis
- photovoltaic panels production, whose data have been derived from reports and estimates based on average energy mixes;
- production and use of electrochemical storage, considering emissions related to extraction and processing of materials such as lithium and cobalt;
- electronic system, including inverters and controllers;
- transportation operations for seasonal station placement;
- maintenance and management at the end of life.
- 1.
- construction of the underground infrastructure, including excavation and laying cables;
- 2.
- electricity generation production, considering the local energy mix for calculations;
- 3.
- ordinary maintenance of the infrastructure;
- 4.
- network upgrades that could take place in the future.
2.3. Techno-Economic Analysis
- 1.
- PV panels purchase cost;
- 2.
- the electrochemical storage system purchase cost;
- 3.
- the electronic system, which includes inverters and controllers;
- 4.
- the cost of assembling and installing the components.
- 1.
- periodic replacement of batteries estimated over the average life cycle of 5–7 years;
- 2.
- panels and electronic component maintenance costs;
- 3.
- transportation costs associated with seasonal station repositioning;
- 4.
- communication costs for remote monitoring.
- 1.
- energy use for operating for 5 h per day at an estimated cost measured in €/kWh;
- 2.
- routine maintenance costs of the underground infrastructure;
- 3.
- an annual allowance for future upgrade cost of the network
3. Use Case
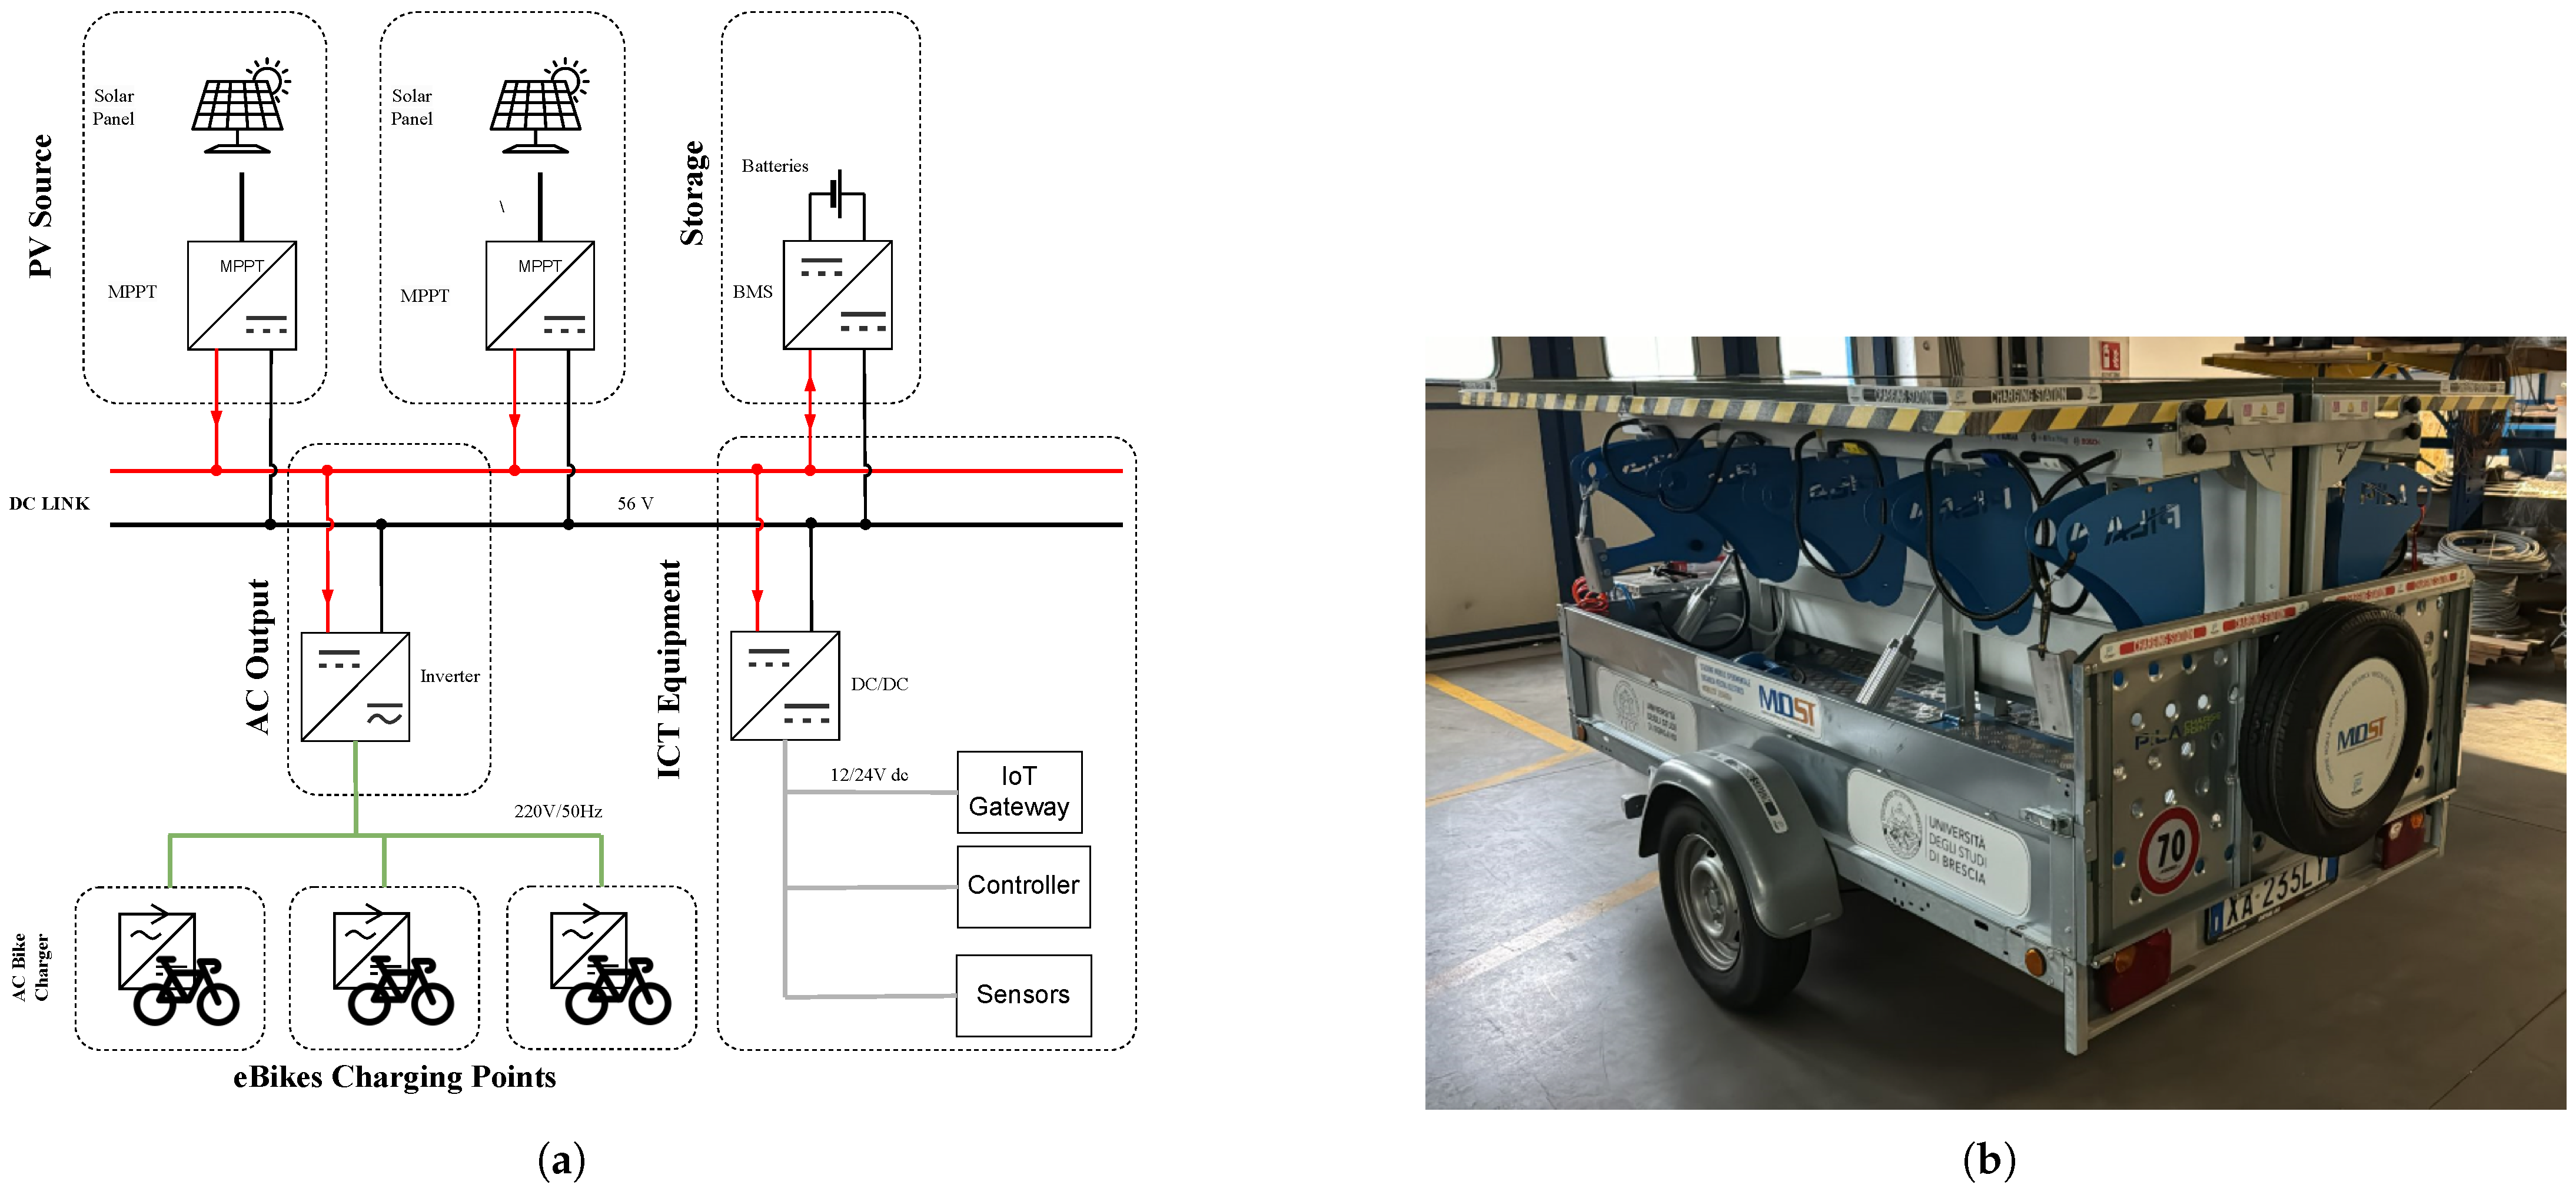
3.1. The Off-Grid Charging Station Prototype
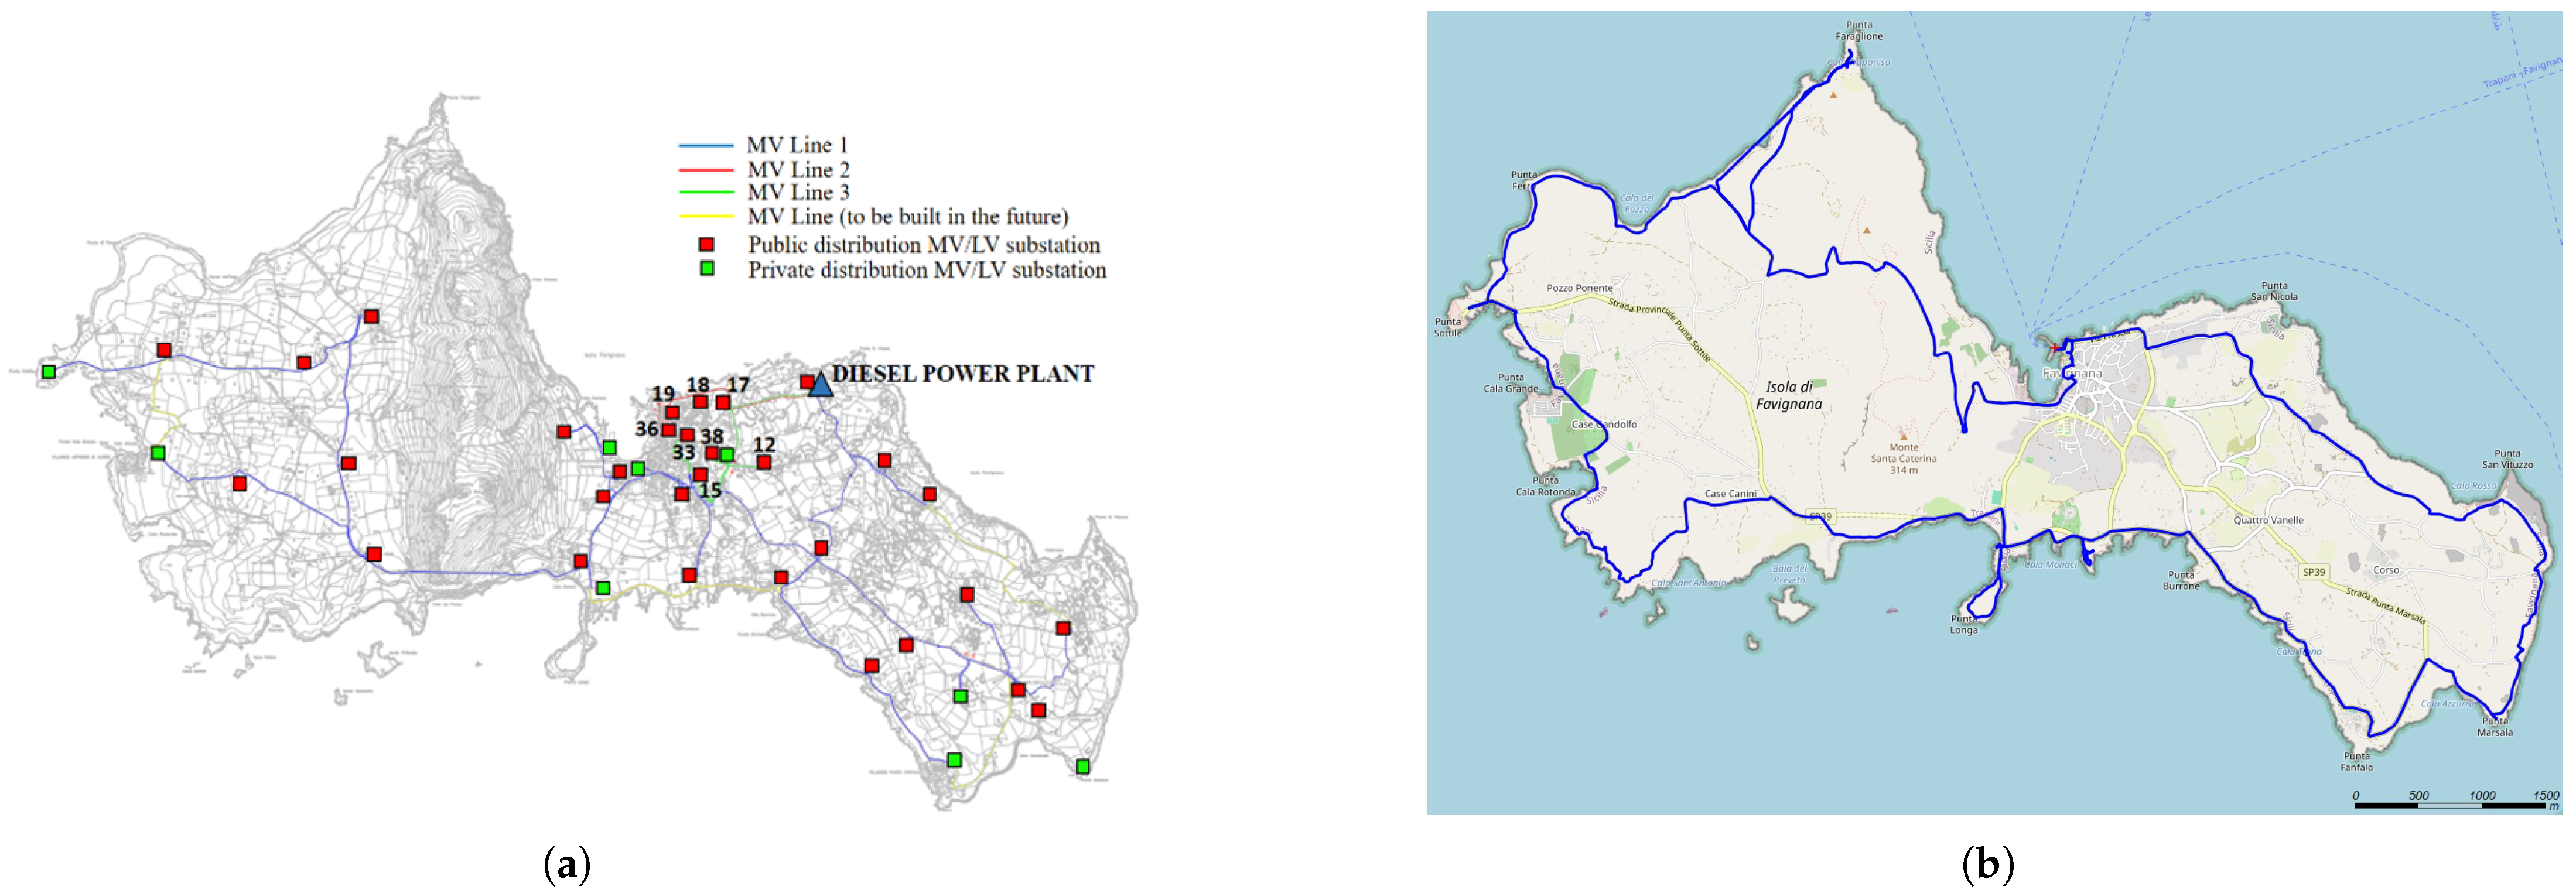
3.2. The Context: Favignana Island
4. Results
4.1. Power and Energy Consumption Analysis
- Apparent Power at peak, Figure 4a: this graph shows the peak apparent power as a function of LEV adoption rate and charging infrastructure utilization rate. It shows the way in which power demand rapidly increases with increasing adoption and utilization rates underlining the importance of proper planning of local electrical grid capacities.
- Total Daily Energy Consumption, Figure 4b: the trend represents the sum of the daily energy consumption, which is linearly dependent on the number of vehicle and on the charging rate.
4.2. Environmental Analysis
4.2.1. Mobile Charging Stations
4.2.2. Fixed POD
4.3. Techno-Economic Analysis
4.3.1. Mobile Charging Stations
4.3.2. Fixed POD
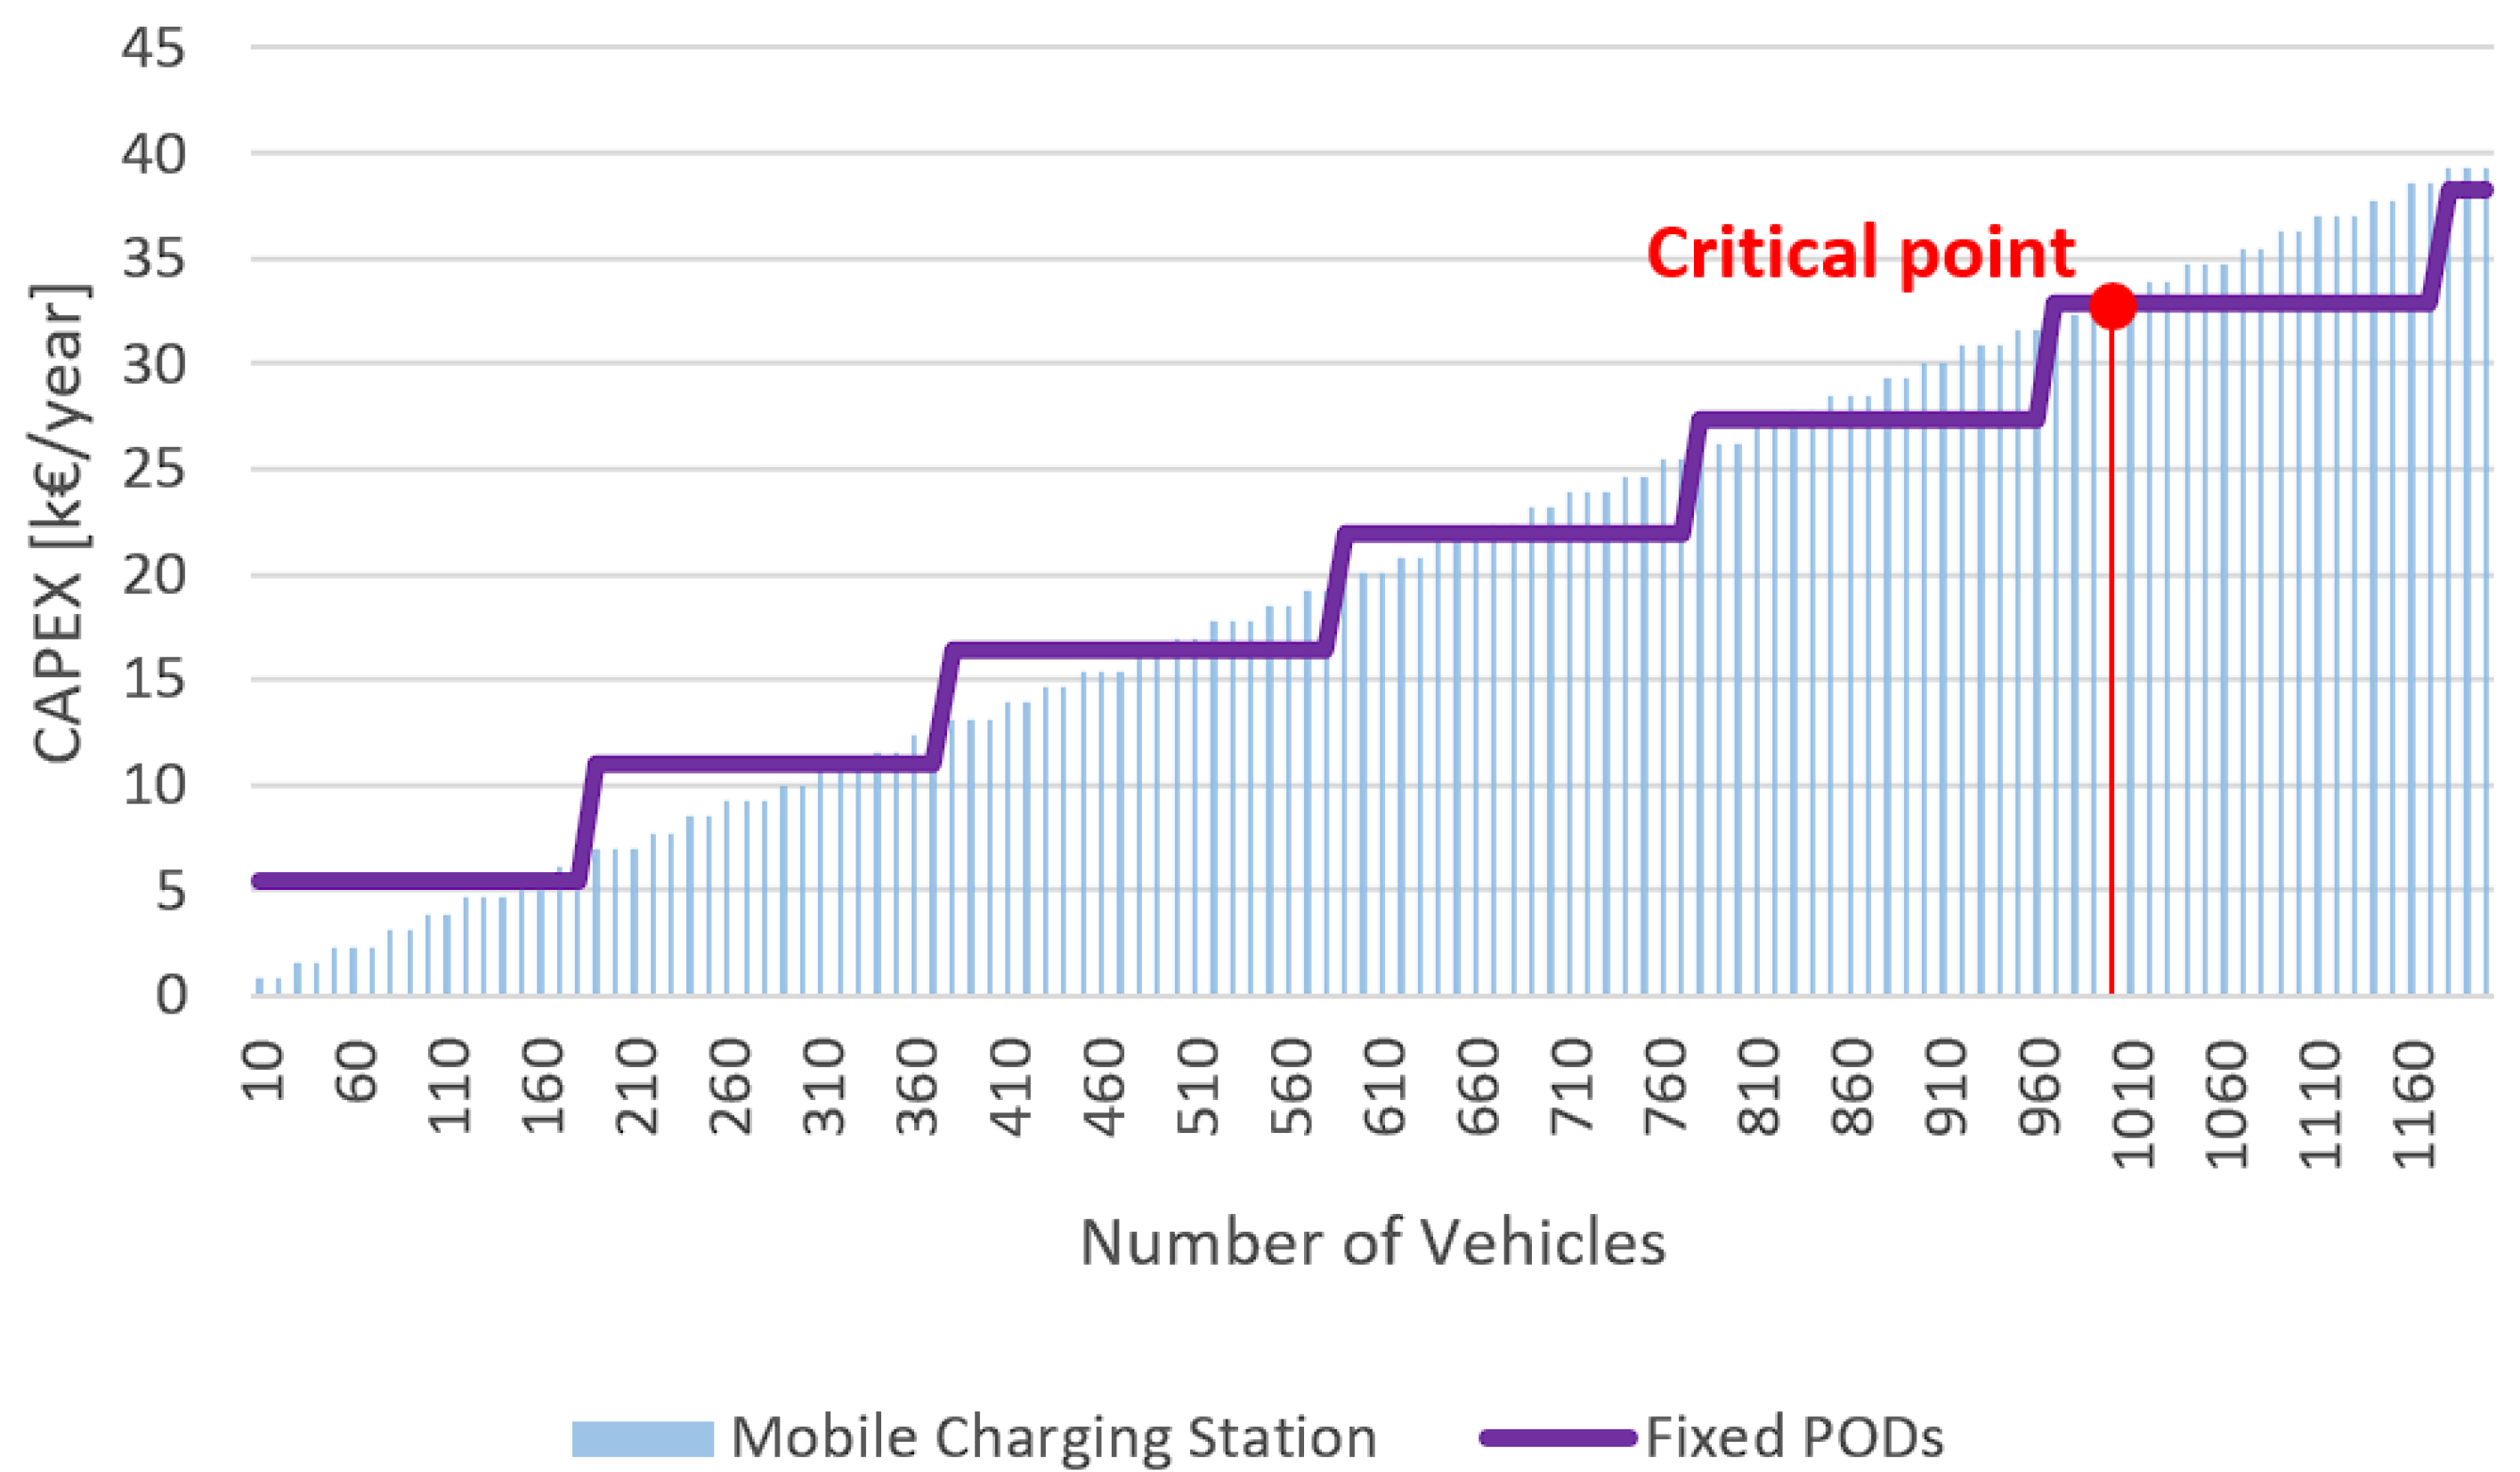
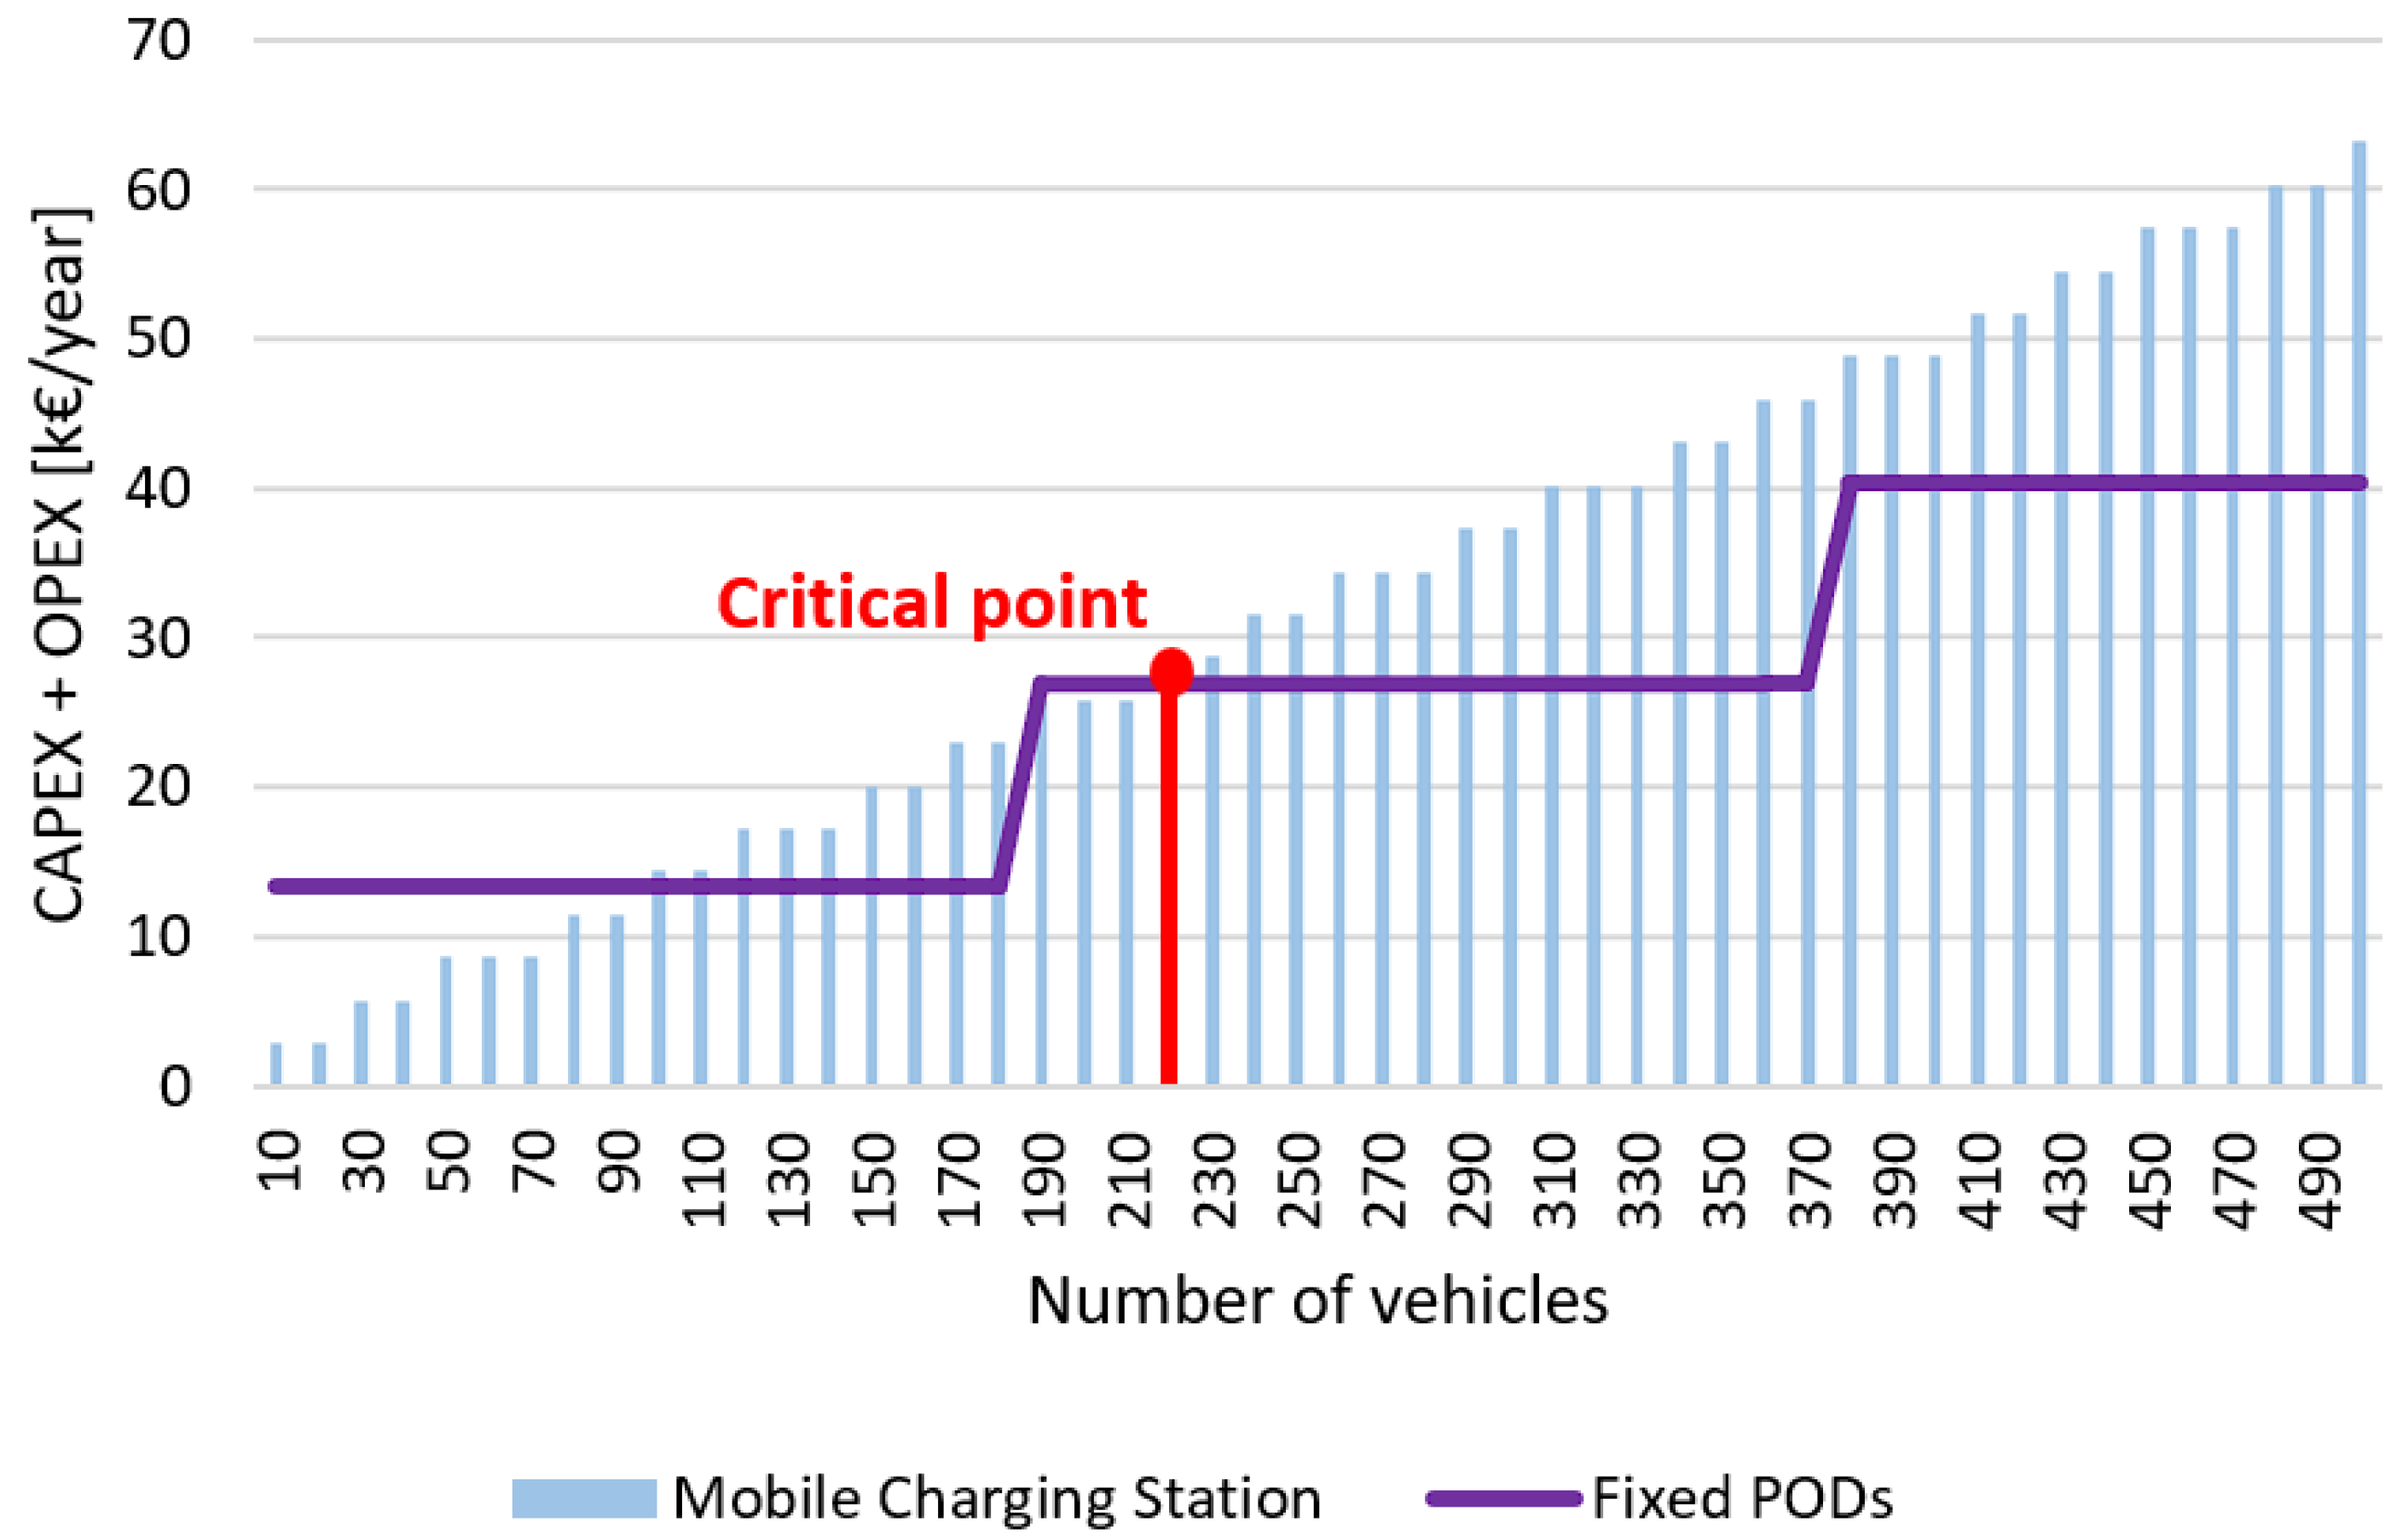
4.3.3. Comparison
4.4. Discussion
- Site Selection and Demand Assessment: select sites based on mobility patterns, grid connectivity, and seasonal demand fluctuation. Conduct questionnaires or obtain historical mobility data to forecast probable LEV adoption.
- Technical Feasibility Analysis: evaluate solar (or in general renewable) potential and energy demand based on geographic location, shading, and seasonal fluctuation, assess the battery storage sizing according to anticipated charging cycles and energy demand variations, check integration with existing renewable energy sources or microgrids, where possible.
- Economic and Environmental Analysis: estimate CAPEX and OPEX for various deployment scenarios, conduct LCA-based emissions study to evaluate the environmental impacts of the two options, consider possible incentives, regulatory structures, and local electricity pricing regimes to calibrate economic feasibility.
- Pilot Deployment and Testing: deploy mobile charging stations to collect empirical data on usage patterns and performance, track changes in charging demand fluctuations, energy use, and power reliability over time, measure user behavior, station accessibility, and practical limitations influencing station repositioning.
- Performance Evaluation and Scalability Model: analyze collected data to support predictive models of energy usage, economic impact, and CO2 savings, develop a scalability plan that identifies proper conditions for mobile charging station expansion, compare results from many test sites to further establish future deployment decision-making criteria.
5. Conclusions
- From an economical point of view, results indicate that mobile charging stations offer a cheap and modular solution in low- and medium-demand environments, particularly in areas with seasonal trends of tourism fluctuations. Although their CAPEX per unit is significantly lower (€8000 per unit) compared to fixed PODs (€56,780 per unit), their OPEX is slightly greater due to periodic battery replacement, transportation, and maintenance costs (€2000–€3000 per year). Fixed PODs, by contrast, become economical only if over approximately 210 users charge per day, with lower operating costs per user but a massive initial investment.
- From the energy and grid point of view, stand-alone charging points provide a reasonable off-grid alternative that is not going to burden the existing diesel-based grid, cutting down additional emissions and stress on the grid. However, large-scale usage of LEVs might increase peak energy demand, requiring additional regulation of diesel generator operation to minimize loss of efficiency.
- The environmental analysis assesses that PV-powered stations significantly reduce CO2 emissions compared to grid-connected charging points, especially if, for fixed PODs, the greater part of the electrical energy is generated from fossil fuels.
- By a methodological point of view, a proposal has been formulated to assess the feasibility of using mobile charging points in different contexts ensuring that constraints such as energy potential, economic investments, environmental impact, are addressed in a multi-faceted way. The strategy presents a scalable framework that can be extended to different off-grid and seasonal contexts to support future research and decision-making for sustainable mobility use cases.
Author Contributions
Funding
Data Availability Statement
Conflicts of Interest
References
- Şengül, B.; Mostofi, H. Impacts of E-Micromobility on the sustainability of urban transportation—A systematic review. Appl. Sci. 2021, 11, 5851. [Google Scholar] [CrossRef]
- Plazier, P.; Weitkamp, G.; Van den Berg, A. E-bikes in rural areas: Current and potential users in the Netherlands. Transportation 2023, 50, 1449–1470. [Google Scholar] [CrossRef]
- Felipe-Falgas, P.; Madrid-Lopez, C.; Marquet, O. Assessing environmental performance of micromobility using lca and self-reported modal change: The case of shared e-bikes, e-scooters, and e-mopeds in barcelona. Sustainability 2022, 14, 4139. [Google Scholar] [CrossRef]
- Leger, S.J.; Dean, J.L.; Edge, S.; Casello, J.M. “If I had a regular bicycle, I wouldn’t be out riding anymore”: Perspectives on the potential of e-bikes to support active living and independent mobility among older adults in Waterloo, Canada. Transp. Res. Part A Policy Pract. 2019, 123, 240–254. [Google Scholar] [CrossRef]
- Mehmood, S.; Zhou, Z. Pro-environmental attitudes, e-bike adoption motivations, and tourist green behavior. Leis. Sci. 2023, 1–23. [Google Scholar] [CrossRef]
- Business Market Insights. North America E-Bike Market Forecast to 2030—Regional Analysis—By Battery Type, Motor Type, Class, and Mode; Technical Report; BMI: New York, NY, USA, 2024. [Google Scholar]
- Grand View Research. U.S. E-Bike Market Size, Share & Trends Analysis Report by Propulsion Type, by Drive Type, by Application, by Battery, by End-Use (Personal, Commercial), and Segment Forecasts, 2023–2030; Technical Report; GVR: San Francisco, CA, USA, 2023. [Google Scholar]
- Filote, C.; Felseghi, R.A.; Raboaca, M.S.; Aşchilean, I. Environmental impact assessment of green energy systems for power supply of electric vehicle charging station. Int. J. Energy Res. 2020, 44, 10471–10494. [Google Scholar] [CrossRef]
- Nour, M.; Chaves-Ávila, J.P.; Magdy, G.; Sánchez-Miralles, Á. Review of positive and negative impacts of electric vehicles charging on electric power systems. Energies 2020, 13, 4675. [Google Scholar] [CrossRef]
- Rahman, S.; Khan, I.A.; Khan, A.A.; Mallik, A.; Nadeem, M.F. Comprehensive review & impact analysis of integrating projected electric vehicle charging load to the existing low voltage distribution system. Renew. Sustain. Energy Rev. 2022, 153, 111756. [Google Scholar]
- Iuliano, S.; Vaccaro, A. A Welfare Maximization-based Methodology for on-line Orchestration of Grid-connected Electric Buses. Smart Grids Sustain. Energy 2024, 9, 44. [Google Scholar] [CrossRef]
- Moon, H.; Park, S.Y.; Jeong, C.; Lee, J. Forecasting electricity demand of electric vehicles by analyzing consumers’ charging patterns. Transp. Res. Part D Transp. Environ. 2018, 62, 64–79. [Google Scholar] [CrossRef]
- Yi, T.; Zhang, C.; Lin, T.; Liu, J. Research on the spatial-temporal distribution of electric vehicle charging load demand: A case study in China. J. Clean. Prod. 2020, 242, 118457. [Google Scholar] [CrossRef]
- Santos, G. Sustainability and shared mobility models. Sustainability 2018, 10, 3194. [Google Scholar] [CrossRef]
- Corti, F.; Iacono, S.D.; Astolfi, D.; Pasetti, M.; Vasile, A.; Reatti, A.; Flammini, A. A comprehensive review of charging infrastructure for Electric Micromobility Vehicles: Technologies and challenges. Energy Rep. 2024, 12, 545–567. [Google Scholar] [CrossRef]
- Aydogan, H. Electric Vehicles and Renewable Energy. J. Phys. Conf. Ser. 2024, 2777, 012007. [Google Scholar] [CrossRef]
- Sadeghian, O.; Oshnoei, A.; Mohammadi-Ivatloo, B.; Vahidinasab, V.; Anvari-Moghaddam, A. A comprehensive review on electric vehicles smart charging: Solutions, strategies, technologies, and challenges. J. Energy Storage 2022, 54, 105241. [Google Scholar] [CrossRef]
- Pasetti, M.; Iacono, S.D.; Zaninelli, D. Real-Time State of Charge Estimation of Light Electric Vehicles Based on Active Power Consumption. IEEE Access 2023, 11, 110995–111010. [Google Scholar] [CrossRef]
- Ramshanker, A.; Chakraborty, S.; Elangovan, D.; Kotb, H.; Aboras, K.M.; Giri, N.C.; Agyekum, E.B. CO2 emission analysis for different types of electric vehicles when charged from floating solar photovoltaic systems. Appl. Sci. 2022, 12, 12552. [Google Scholar] [CrossRef]
- Rehman, A.u.; Khalid, H.M.; Muyeen, S. Grid-integrated solutions for sustainable EV charging: A comparative study of renewable energy and battery storage systems. Front. Energy Res. 2024, 12, 1403883. [Google Scholar] [CrossRef]
- Barberi, A.; Beccali, M.; Bonomolo, M.; Favuzza, S.; Brano, V.L.; Musca, R.; Provenzano, C.; Zizzo, G. Design of a Smart Car Park with PV generation and BESS for Grid-on and Grid-off Operation. The SMARTEP Project. In Proceedings of the 2022 IEEE 21st Mediterranean Electrotechnical Conference (MELECON), Palermo, Italy, 14–16 June 2022; pp. 1073–1078. [Google Scholar]
- Shafiq, A.; Iqbal, S.; Habib, S.; ur Rehman, A.; ur Rehman, A.; Selim, A.; Ahmed, E.M.; Kamel, S. Solar PV-based electric vehicle charging station for security bikes: A techno-economic and environmental analysis. Sustainability 2022, 14, 13767. [Google Scholar] [CrossRef]
- Bugaje, A.; Ehrenwirth, M.; Trinkl, C.; Zörner, W. Electric two-wheeler vehicle integration into rural off-grid photovoltaic system in Kenya. Energies 2021, 14, 7956. [Google Scholar] [CrossRef]
- Kakande, J.N.; Philipo, G.H.; Krauter, S. Optimized E-Mobility and Portable Storage Integration in an Isolated Rural Solar Microgrid in Uganda. Solar 2024, 4, 694–727. [Google Scholar] [CrossRef]
- Curto, D.; Favuzza, S.; Franzitta, V.; Musca, R.; Navia, M.A.N.; Zizzo, G. Evaluation of the optimal renewable electricity mix for Lampedusa island: The adoption of a technical and economical methodology. J. Clean. Prod. 2020, 263, 121404. [Google Scholar] [CrossRef]
- Barberi, A.; Favuzza, S.; Mineo, L.; Ippolito, M.G.; Musca, R.; Zizzo, G. Assessing the Grid Impact of Renewable Energy Communities in a Small Island. In Proceedings of the 2023 IEEE International Conference on Environment and Electrical Engineering and 2023 IEEE Industrial and Commercial Power Systems Europe (EEEIC/I&CPS Europe), Madrid, Spain, 6–9 June 2023; pp. 1–6. [Google Scholar]
- Di Silvestre, M.; Musca, R.; Sanseverino, E.R.; Sciumè, G.; Vasile, A.; Zizzo, G. A Feasibility Study for the Transition to Electric Mobility in the Island of Favignana. In Proceedings of the 2021 IEEE International Conference on Environment and Electrical Engineering and 2021 IEEE Industrial and Commercial Power Systems Europe (EEEIC/I&CPS Europe), Bari, Italy, 7–10 September 2021; pp. 1–6. [Google Scholar]
- Ali, Q.; Di Silvestre, M.L.; Restifo, G.L.; Sanseverino, E.R.; Sciumé, G.; Vasile, A.; Zizzo, G. A Simulation Study for Assessing the Minimum Number of V2G Recharge Points in Favignana. In Proceedings of the 2022 IEEE International Conference on Environment and Electrical Engineering and 2022 IEEE Industrial and Commercial Power Systems Europe (EEEIC/I&CPS Europe), Prague, Czech Republic, 28 June–1 July 2022; pp. 1–6. [Google Scholar]
- Mojumder, M.R.H.; Ahmed Antara, F.; Hasanuzzaman, M.; Alamri, B.; Alsharef, M. Electric vehicle-to-grid (V2G) technologies: Impact on the power grid and battery. Sustainability 2022, 14, 13856. [Google Scholar] [CrossRef]
- Vaccaro, A.; Iuliano, S.; Galdi, V.; Calderaro, V.; Graber, G. Achieving consensus in self-organizing electric vehicles for implementing v2g-based ancillary services. IEEE Access 2024, 12, 137222–137236. [Google Scholar] [CrossRef]
- Chandra Mouli, G.R.; Van Duijsen, P.; Grazian, F.; Jamodkar, A.; Bauer, P.; Isabella, O. Sustainable e-bike charging station that enables AC, DC and wireless charging from solar energy. Energies 2020, 13, 3549. [Google Scholar] [CrossRef]
- Mouli, G.R.; Vanduijsen, P.; Velzeboer, T.; Nair, G.; Zhao, Y.; Jamodkar, A.; Isabella, O.; Silvester, S.; Bauer, P.; Zeman, M. Solar powered e-bike charging station with AC, DC and contactless charging. In Proceedings of the 2018 20th European Conference on Power Electronics and Applications (EPE’18 ECCE Europe), Riga, Latvia, 17–21 September 2018; p. P-1. [Google Scholar]
- Mishra, S.; Dwivedi, G.; Upadhyay, S.; Chauhan, A. Modelling of standalone solar photovoltaic based electric bike charging. Mater. Today Proc. 2022, 49, 473–480. [Google Scholar] [CrossRef]
- Astolfi, D.; Bellagente, P.; Dello Iacono, S.; Flammini, A.; Malighetti, P.; Pasetti, M. Design and Pilot Tests of a Transportable Off-Grid Charging Station for E-Bikes Powered by Renewables. In Proceedings of the 2024 IEEE International Humanitarian Technologies Conference (IHTC), Bari, Italy, 27–30 November 2024. [Google Scholar]
- Astolfi, D.; Bellagente, P.; Brandao, D.; Dello Iacono, S.; Depari, A.; Ferrari, P.; Flammini, A.; Gaffurini, M.; Pasetti, M.; Rinaldi, S.; et al. Ict-equipped portable e-bike charging station powered by renewables for mass cycling events. In Proceedings of the 2024 IEEE International Workshop on Metrology for Automotive (MetroAutomotive), Bologna, Italy, 26–28 June 2024; pp. 141–146. [Google Scholar]
- Vasile, A.; Astolfi, D.; Pasetti, M.; Zizzo, G.; Riva Sanseverino, E.; Flammini, A. Promoting Sustainable Mobility and Inclusion via Renewable Charging Stations for Light Electric Vehicles, Case Study: Favignana Island. In Proceedings of the 2024 IEEE International Humanitarian Technologies Conference (IHTC), Bari, Italy, 27–30 November 2024. [Google Scholar]
- Gopi, C.V.M.; Ramesh, R. Review of Battery-supercapacitor Hybrid Energy Storage Systems for Electric Vehicles. Results Eng. 2024, 24, 103598. [Google Scholar] [CrossRef]
- Malozyomov, B.V.; Martyushev, N.V.; Kukartsev, V.A.; Kukartsev, V.V.; Tynchenko, S.V.; Klyuev, R.V.; Zagorodnii, N.A.; Tynchenko, Y.A. Study of supercapacitors built in the start-up system of the main diesel locomotive. Energies 2023, 16, 3909. [Google Scholar] [CrossRef]
- Barman, P.; Dutta, L.; Bordoloi, S.; Kalita, A.; Buragohain, P.; Bharali, S.; Azzopardi, B. Renewable energy integration with electric vehicle technology: A review of the existing smart charging approaches. Renew. Sustain. Energy Rev. 2023, 183, 113518. [Google Scholar] [CrossRef]
- Privitera, D. Turismo lento e territori insulari. Il caso studio Favignana (Italian). Boll. dell’Assoc. Ital. Cartogr. 2020, 145–153. [Google Scholar]
- Cattaneo, B. EU Science Hub. Photovoltaic Geographical Information System (PVGIS); European Commission: Brussels, Belgium.
- SolarPowerEurope. Sustainable Solar: Environmental, Social, and Governance Actions Along the Value Chain; Technical Report; SolarPowerEurope: Brussels, Belgium, 2024. [Google Scholar]
- Directive, E. Directive 2012/19/EU of the European Parliament and of the Council of 4 July 2012 on waste electrical and electronic equipment, WEEE. Off. J. Eur. Union L 2012, 197, 38–71. [Google Scholar]
- Daljit Singh, J.K.; Molinari, G.; Bui, J.; Soltani, B.; Rajarathnam, G.P.; Abbas, A. Life cycle assessment of disposed and recycled end-of-life photovoltaic panels in Australia. Sustainability 2021, 13, 11025. [Google Scholar] [CrossRef]
- Bošnjaković, M.; Santa, R.; Crnac, Z.; Bošnjaković, T. Environmental Impact of PV power systems. Sustainability 2023, 15, 11888. [Google Scholar] [CrossRef]
- Dai, Q.; Kelly, J.C.; Gaines, L.; Wang, M. Life cycle analysis of lithium-ion batteries for automotive applications. Batteries 2019, 5, 48. [Google Scholar] [CrossRef]
- IVL Swedish Environmental Research Institute. The Life Cycle Energy Consumption and Greenhouse Gas Emissions from Lithium-Ion Batteries; Technical Report; IVL: Stockholm, Sweden, 2017. [Google Scholar]
- IVL Swedish Environmental Research Institute. Lithium-Ion Vehicle Battery Production; Technical Report; IVL: Stockholm, Sweden, 2019. [Google Scholar]
- Ecoinvent Association. Ecoinvent Database; Ecoinvent Association: Zurich, Switzerland, 2021. [Google Scholar]
- European Environment Agency. Environmental Impact of Small Renewable Energy Systems; EEA Technical Reports; European Environment Agency: Copenhagen, Denmark, 2019. [Google Scholar]
- European Environment Agency. Emissions per Vehicle-km for Heavy-Duty Vehicles; EEA Reports; European Environment Agency: Copenhagen, Denmark, 2018. [Google Scholar]
- Kucukvar, M.; Onat, N.C.; Kutty, A.A.; Abdella, G.M.; Bulak, M.E.; Ansari, F.; Kumbaroglu, G. Environmental efficiency of electric vehicles in Europe under various electricity production mix scenarios. J. Clean. Prod. 2022, 335, 130291. [Google Scholar] [CrossRef]
- International Energy Agency. Tracking Power 2023; IEA Publications: Paris, France, 2023. [Google Scholar]
- Istituto Superiore per la Protezione e la Ricerca Ambientale. Le Emissioni di Gas Serra in Italia: Obiettivi di Riduzione e Scenari Emissivi (Italian); Technical Report; ISPRA: Rome, Italy, 2023. [Google Scholar]
- IPCC. Refinement to the 2006 Guidelines for National Greenhouse Gas Inventories; Intergovernmental Panel on Climate Change: Geneva, Switzerland, 2019. [Google Scholar]
- Bajolle, H.; Lagadic, M.; Louvet, N. The future of lithium-ion batteries: Exploring expert conceptions, market trends, and price scenarios. Energy Res. Soc. Sci. 2022, 93, 102850. [Google Scholar] [CrossRef]
- E-Distribuzione S.p.A. Guida per le Connessioni alla Rete di E-Distribuzione (Italian), Annex I; Technical Report; E-Distribuzione: Rome, Italy, 2023. [Google Scholar]
- ARERA—Autorità di Regolazione per Energia Reti e Ambiente. Andamento del Prezzo dell’Energia Elettrica per il Consumatore Domestico Tipo in Maggior Tutela (Italian). 2025. Available online: https://www.arera.it/dati-e-statistiche/dettaglio/andamento-del-prezzo-dellenergia-elettrica-per-il-consumatore-domestico-tipo-in-maggior-tutela (accessed on 2 February 2025).
- Perez, R.; Stewart, R.; Arbogast, C.; Seals, R.; Scott, J. An anisotropic hourly diffuse radiation model for sloping surfaces: Description, performance validation, site dependency evaluation. Sol. Energy 1986, 36, 481–497. [Google Scholar] [CrossRef]


| Parameter | Value |
|---|---|
| Resident Population | Variable |
| Number of Tourists | Up to 10 times resident population |
| LEV Adoption Rate | 0.01–0.1 |
| LEV Adoption Rate Step | 0.005 |
| Charging Station Usage Rate | 0.1–1 |
| Charging Station Usage Rate Step | 0.05 |
| Mean of the Gaussian 1 | 13 |
| Mean of the Gaussian 2 | 20 |
| Standard deviation Gaussian 1 | 2.5 |
| Standard deviation Gaussian 2 | 2 |
| Charging Active Power per Vehicle | 0.2–0.6 kW |
| Charging Power Factor | 0.7 |
| Apparent Power per Vehicle | 0.29–0.86 kVA |
| Energy per Single Charge | 0.5 kWh |
| Component | Stand-Alone (Min:Max) | Stand-Alone (Average) | Standard POD (Min:Max) | Standard POD (Average) |
|---|---|---|---|---|
| Photovoltaic panels | 6:28 | 17 | - | - |
| Electrochemical storage | 40:70 | 55 | - | - |
| Electronic system/inverter | 5:10 | 7.5 | - | - |
| Maintenance and disposal | 5:10 | 7.5 | 10:20 | 15 |
| Transportation | 1.5:9 | 4.9 | - | - |
| POD construction | - | - | 27:137 | 82 |
| Diesel generation | - | - | 650:750 | 700 |
| Solution | Minimum Emissions | Maximum Emissions | Average Emissions |
|---|---|---|---|
| Stand-alone station | 88 | 258 | 215.2 |
| Standard POD | 737 | 857 | 742 |
| Cost Item | Mobile Charging Station [€] | Fixed POD [€] |
|---|---|---|
| CAPEX | 8000 | Variable |
| CAPEX (Annual) | 771.20 | Variable |
| OPEX (Annual) | ||
| - Maintenance | 400–540 | 1000–2000 |
| - Battery Replacement | 400–560 | 0 |
| - Energy Costs | 0 | 5475 |
| - Transportation & Installation | 1000–1500 | 0 |
| - Communication (4G) | 120–180 | 0 |
| - Grid Upgrade Fund | 0 | 500 |
| - Insurance & Storage | 100–200 | 0 |
| Total OPEX (Annual) | 2000–3000 | 6500–8000 |
Disclaimer/Publisher’s Note: The statements, opinions and data contained in all publications are solely those of the individual author(s) and contributor(s) and not of MDPI and/or the editor(s). MDPI and/or the editor(s) disclaim responsibility for any injury to people or property resulting from any ideas, methods, instructions or products referred to in the content. |
© 2025 by the authors. Licensee MDPI, Basel, Switzerland. This article is an open access article distributed under the terms and conditions of the Creative Commons Attribution (CC BY) license (https://creativecommons.org/licenses/by/4.0/).
Share and Cite
Favuzza, S.; Zizzo, G.; Vasile, A.; Astolfi, D.; Pasetti, M. Comparative Analysis of Charging Station Technologies for Light Electric Vehicles for the Exploitation in Small Islands. Energies 2025, 18, 1477. https://doi.org/10.3390/en18061477
Favuzza S, Zizzo G, Vasile A, Astolfi D, Pasetti M. Comparative Analysis of Charging Station Technologies for Light Electric Vehicles for the Exploitation in Small Islands. Energies. 2025; 18(6):1477. https://doi.org/10.3390/en18061477
Chicago/Turabian StyleFavuzza, Salvatore, Gaetano Zizzo, Antony Vasile, Davide Astolfi, and Marco Pasetti. 2025. "Comparative Analysis of Charging Station Technologies for Light Electric Vehicles for the Exploitation in Small Islands" Energies 18, no. 6: 1477. https://doi.org/10.3390/en18061477
APA StyleFavuzza, S., Zizzo, G., Vasile, A., Astolfi, D., & Pasetti, M. (2025). Comparative Analysis of Charging Station Technologies for Light Electric Vehicles for the Exploitation in Small Islands. Energies, 18(6), 1477. https://doi.org/10.3390/en18061477