Article

Assessing Policy Contagion in China’s Wind Power Industry Chain
1
Centre for Gaming and Tourism Studies, Macao Polytechnic University, Macao 999078, China
2
Centre for Applied Macroeconomic Analysis, The Australian National University, Canberra 2601, Australia
3
Institute of Western China Economic Research, Southwestern University of Finance and Economics, Chengdu 610074, China
*
Authors to whom correspondence should be addressed.
Energies 2025, 18(23), 6328; https://doi.org/10.3390/en18236328
Submission received: 24 October 2025 / Revised: 25 November 2025 / Accepted: 27 November 2025 / Published: 1 December 2025
(This article belongs to the Special Issue Sustainable Energy Futures: Economic Policies and Market Trends)

Abstract

Wind power has become a strategic cornerstone of China’s renewable-energy transition and industrial upgrading, making it essential to understand how policy interventions shape the behaviour of its industry chain. This study examines how major wind power policies issued between 2015 and 2024 transmit shocks across nine upstream, midstream, and downstream sectors. Using four contagion tests based on higher-order co-moments, combined with a policy sensitivity index, the analysis identifies distinct transmission patterns across policy types. The results show that market-mechanism reforms induce the strongest and most systemic contagion effects, reflecting their ability to align financial incentives with renewable-integration objectives. Upstream sectors—particularly equipment and key material industries—exhibit the highest responsiveness, while midstream construction and downstream operation and maintenance display more moderate and delayed adjustments. Development and construction policies generate broader but less intensive contagion, whereas industry-support measures trigger selective, sector-specific responses. These findings offer practical guidance for improving policy coordination, investment planning, and industrial upgrading within China’s wind power value chain. Future research could extend the analysis by incorporating firm-level data, longer policy cycles, and interactions with other structural shocks such as electricity-market reforms and climate-related risks.

1. Introduction

To address global warming and climate change, wind power—a cornerstone of clean and renewable energy—has become a vital pillar supporting China’s carbon peaking and carbon neutrality objectives [1]. Since the enactment of the Renewable Energy Law in 2006, which laid the foundation for industrial growth, China’s wind power sector has transitioned from technology importation to domestic innovation and from rapid capacity expansion to quality-driven development [2]. By the end of 2023, China’s cumulative installed wind capacity reached 441 GW—the largest in the world—with 75.66 GW of new installations, accounting for nearly two-thirds of global additions and far exceeding those of the EU and the US [3,4]. These achievements highlight China’s emergence as the main engine of global wind power growth.
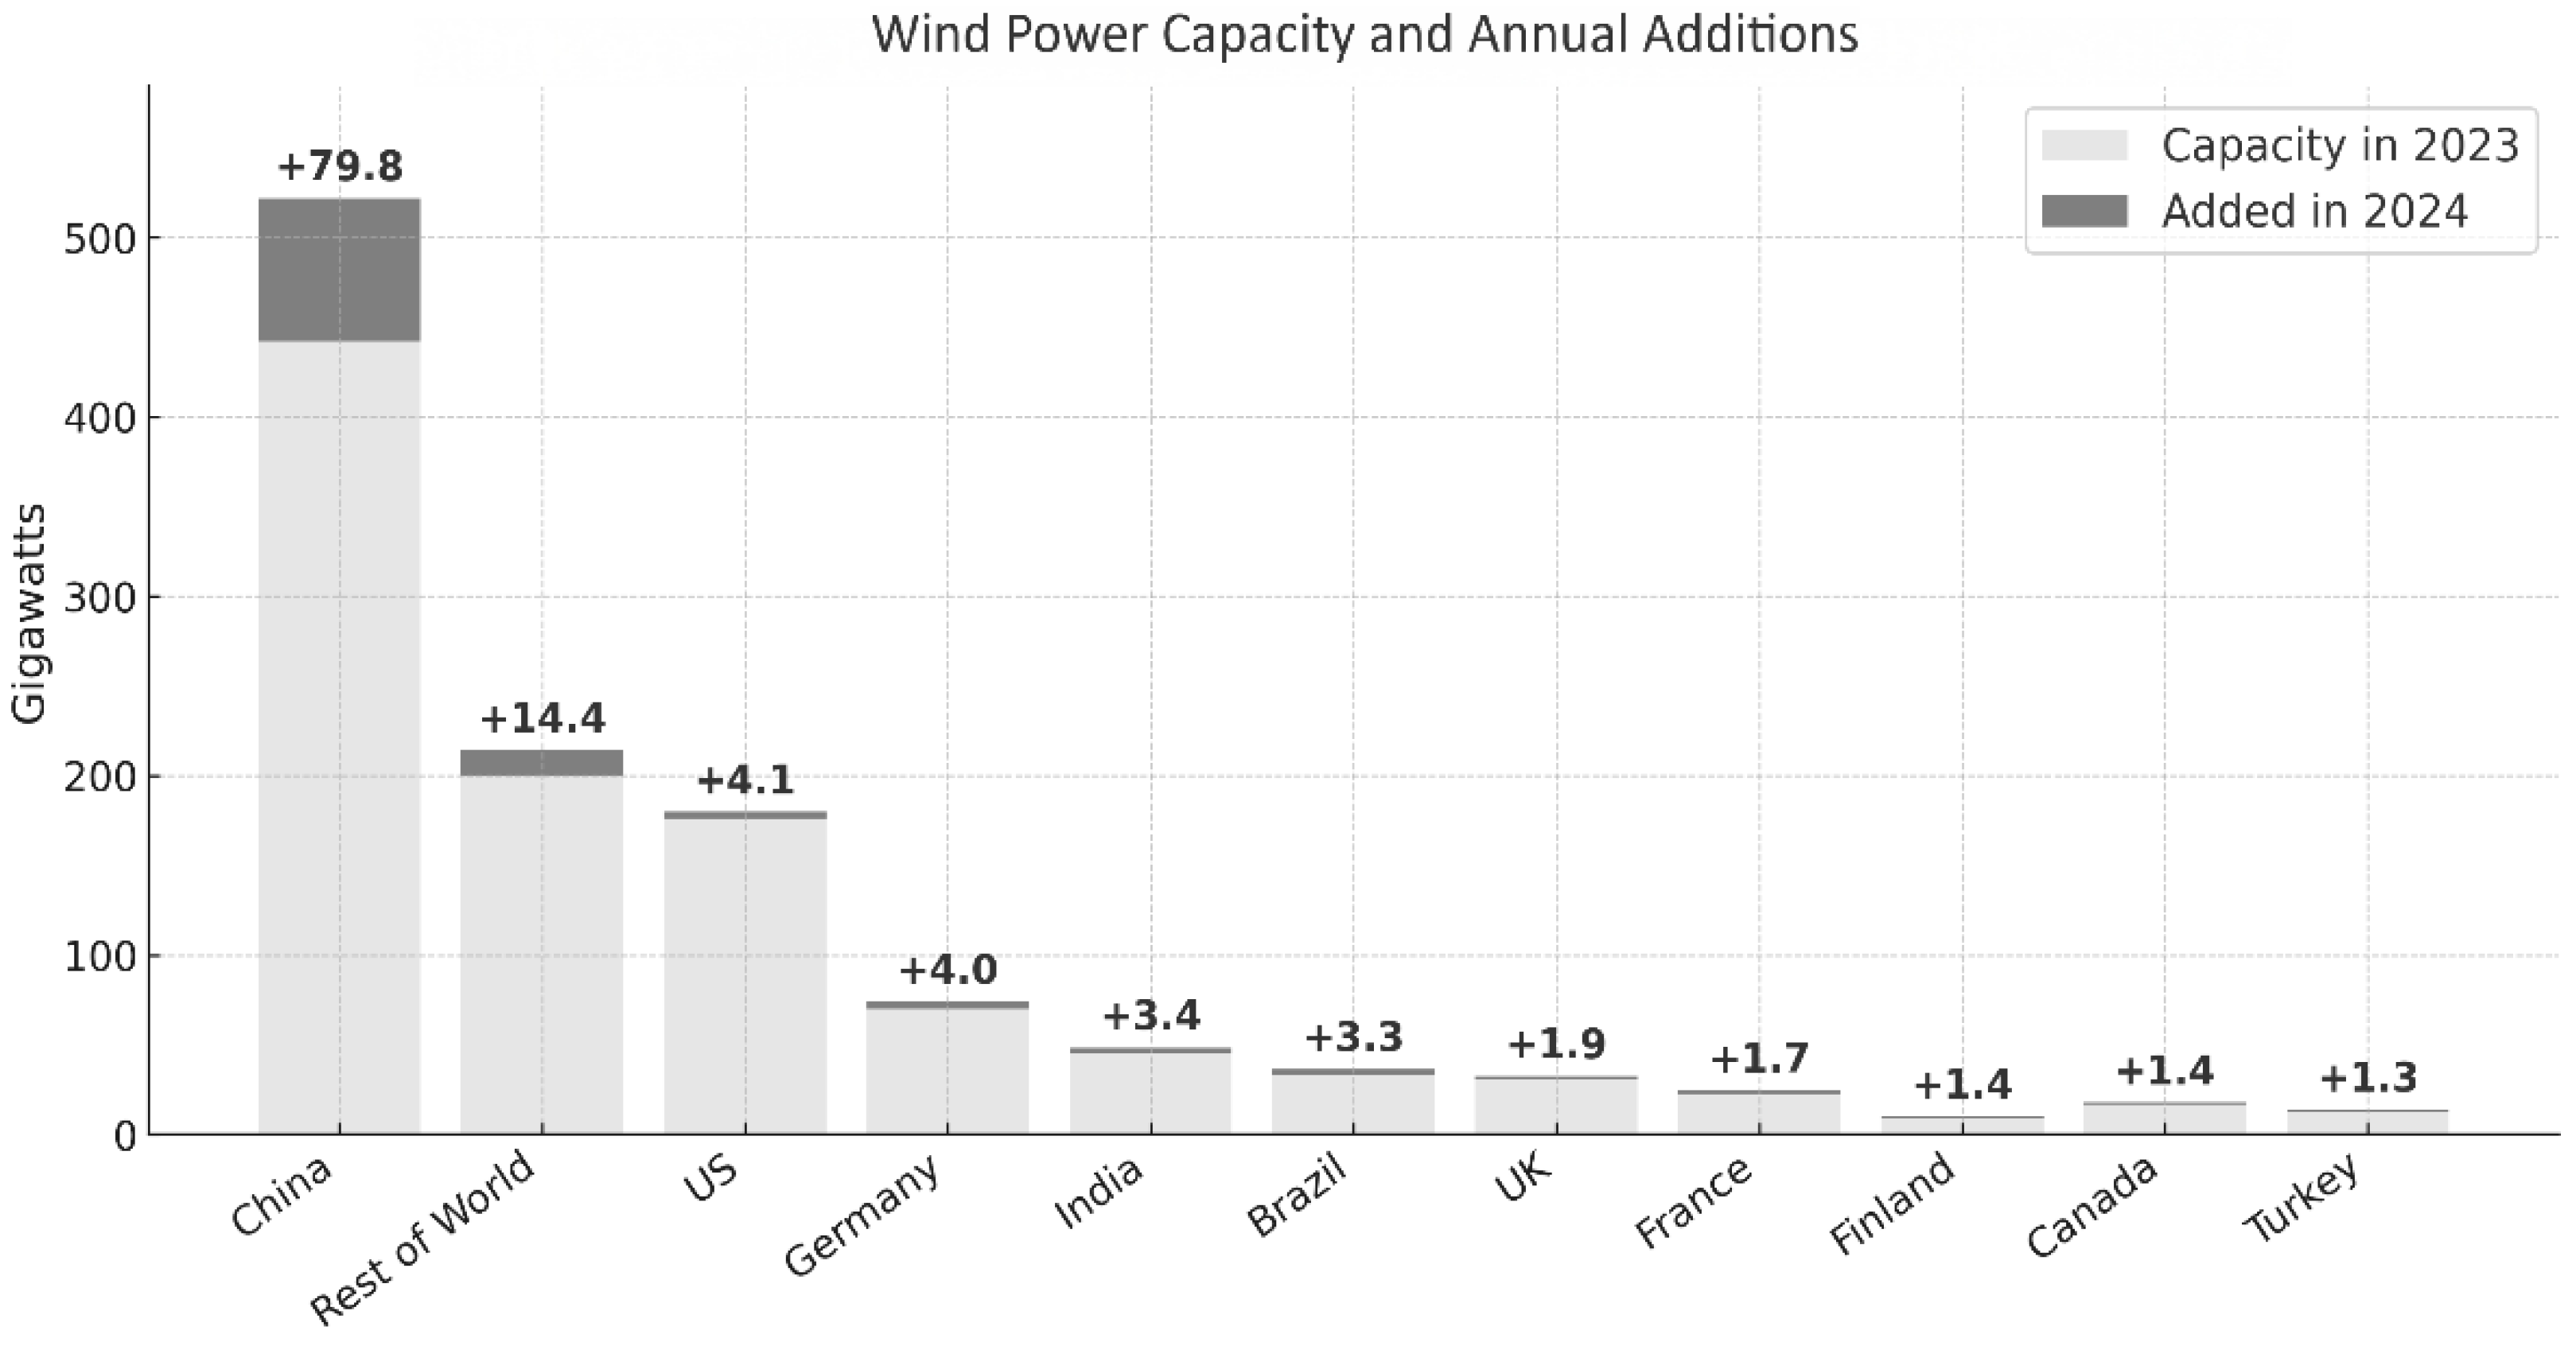
To contextualize China’s position in the global wind power landscape, Figure 1 compares installed capacity in 2023 and gross additions in 2024 across the world’s leading wind power countries. China not only maintained the largest cumulative capacity globally (437 GW in 2023) but also recorded by far the largest annual expansion in 2024 (79.8 GW), exceeding the combined additions of the US, Germany, India, and Brazil [5]. Other major economies show significantly smaller increments, highlighting China’s dominant contribution to global wind power deployment and its central role in driving clean energy growth. This global comparison underscores the importance of understanding how China’s domestic policy framework shapes the evolution of its wind power industry and influences sectoral dynamics along the supply chain.
Such achievements reflect the interaction between policy design and market dynamics. In the initial phase, quantity-oriented policies promoted rapid capacity expansion and the formation of a domestic supply chain. During the subsequent stage, policy emphasis shifted toward enhancing quality and cost efficiency to consolidate industrial competitiveness. In the current phase, the policy framework prioritizes market-oriented mechanisms and high-quality development, emphasizing technological upgrading, efficient resource allocation, and financial sustainability [6,7].
This study aims to investigate the effects of China’s wind power policies implemented between 2015 and 2024 on the stock returns of nine sectors along the wind power industry chain. The analysis differentiates among three major policy categories—development and construction, industry support, and market mechanism reforms—to identify their distinct transmission effects. The primary objective is to assess the relative importance of individual wind power policies in shaping sectoral performance, using contagion analysis to trace the transmission of policy shocks across upstream, midstream, and downstream segments. A nuanced understanding of these contagion dynamics offers policy insights into how different policy instruments interact with market responses, thereby guiding more effective policy coordination and helping investors evaluate sectoral resilience and systemic linkages within China’s rapidly evolving wind power industry.
Although the literature on China’s wind power development has grown substantially, existing studies remain fragmented and offer limited insight into how different policy instruments interact across the industry chain. Most prior work adopts a single-policy perspective—examining feed-in tariffs, carbon pricing, or green subsidies in isolation—and focuses on specific outcomes such as installed capacity, efficiency gains, or spatial deployment patterns [8,9]. This narrow focus constrains our understanding of policy interactions and overlooks the systemic nature of wind power development. The study by Hsiao [10] provides a broader macroeconomic assessment but does not examine how policy shocks propagate within the wind power value chain itself. Similarly, Dong and Li [11] emphasize supply-chain coordination but do not link these dynamics to policy-induced transmission, while Jiang and Shi [6] analyse government intervention mainly through the lens of innovation types, offering limited insight into sectoral heterogeneity. Overall, the existing literature lacks a critical assessment of how different policy categories jointly shape upstream, midstream, and downstream segments, and provides little empirical evidence on the transmission mechanisms through which policy shocks influence the industry chain. This gap underscores the need for a systemic, contagion-based approach to evaluate policy interactions and sectoral sensitivity across China’s wind power value chain.
This study addresses these gaps by integrating sectoral coordination with policy transmission mechanisms and quantifying the sensitivity of upstream, midstream, and downstream segments to different types of wind power policies. Accordingly, the central research question is: How do development and construction policies, industry support measures, and market-mechanism reforms differentially transmit shocks across China’s wind power value chain through policy contagion effects? Using contagion tests and a policy sensitivity index, the study offers a systematic evaluation of policy transmission patterns and their implications for the governance and development of China’s wind power industry.
This paper contributes to the existing energy economics and policy literature in three key respects. First, it extends prior studies by systematically evaluating the effects of China’s wind power policies on sectoral performance along the industry chain. Specifically, it examines three major categories of policy interventions—development and construction, industry support, and market mechanism reforms—and illustrates how each category generates distinct contagion dynamics across upstream, midstream, and downstream sectors. By differentiating the relative influence of these policy types, the study advances understanding of how government interventions transmit through financial and industrial channels, shaping the broader renewable energy ecosystem. Second, the paper introduces a policy sensitivity index, which captures the degree of exposure of individual sectors to policy shocks. This index offers a quantitative tool to identify which segments of the wind power value chain are most responsive to specific policy measures. Finally, the empirical results provide valuable insights for policymakers in optimizing the coordination of fiscal, financial, and regulatory instruments, while also assisting investors in assessing policy-induced risks and opportunities within China’s evolving wind power market.
Using contagion tests along with the policy sensitivity index, this study reveals three main findings. First, market mechanism reforms produce the strongest contagion effects (63%), underscoring their role in aligning financial and industrial responses to renewable integration. Development and construction policies rank second (47%), while industry support policies have weaker, more localized impacts (34%). Second, contagion is most evident in upstream sectors—such as wind equipment and raw materials—where investment and technology upgrades are highly policy-sensitive. The midstream construction segment shows moderate, lagged effects, while downstream operation and maintenance respond gradually through capacity expansion and grid integration. Finally, contagion occurs mainly through higher-order co-moments (co-kurtosis and co-volatility), indicating that policy shocks spread via nonlinear and tail-risk linkages. Overall, China’s wind power policy framework has shifted toward a risk-sensitive, market-oriented model that strengthens renewable energy policy transmission.
The remainder of this paper is structured as follows. Section 2 presents the theoretical framework for assessing the effects of wind power policies on industry chain sectors and outlines China’s wind power policy landscape. Section 3 describes the contagion testing methodology and the construction of the policy sensitivity index. Section 4 reports and interprets the empirical results, emphasizing their policy and industrial implications. Section 5 concludes the study.

2. Theoretical Background

2.1. Effects of Wind-Related Policies on Its Industry Chain Sectors

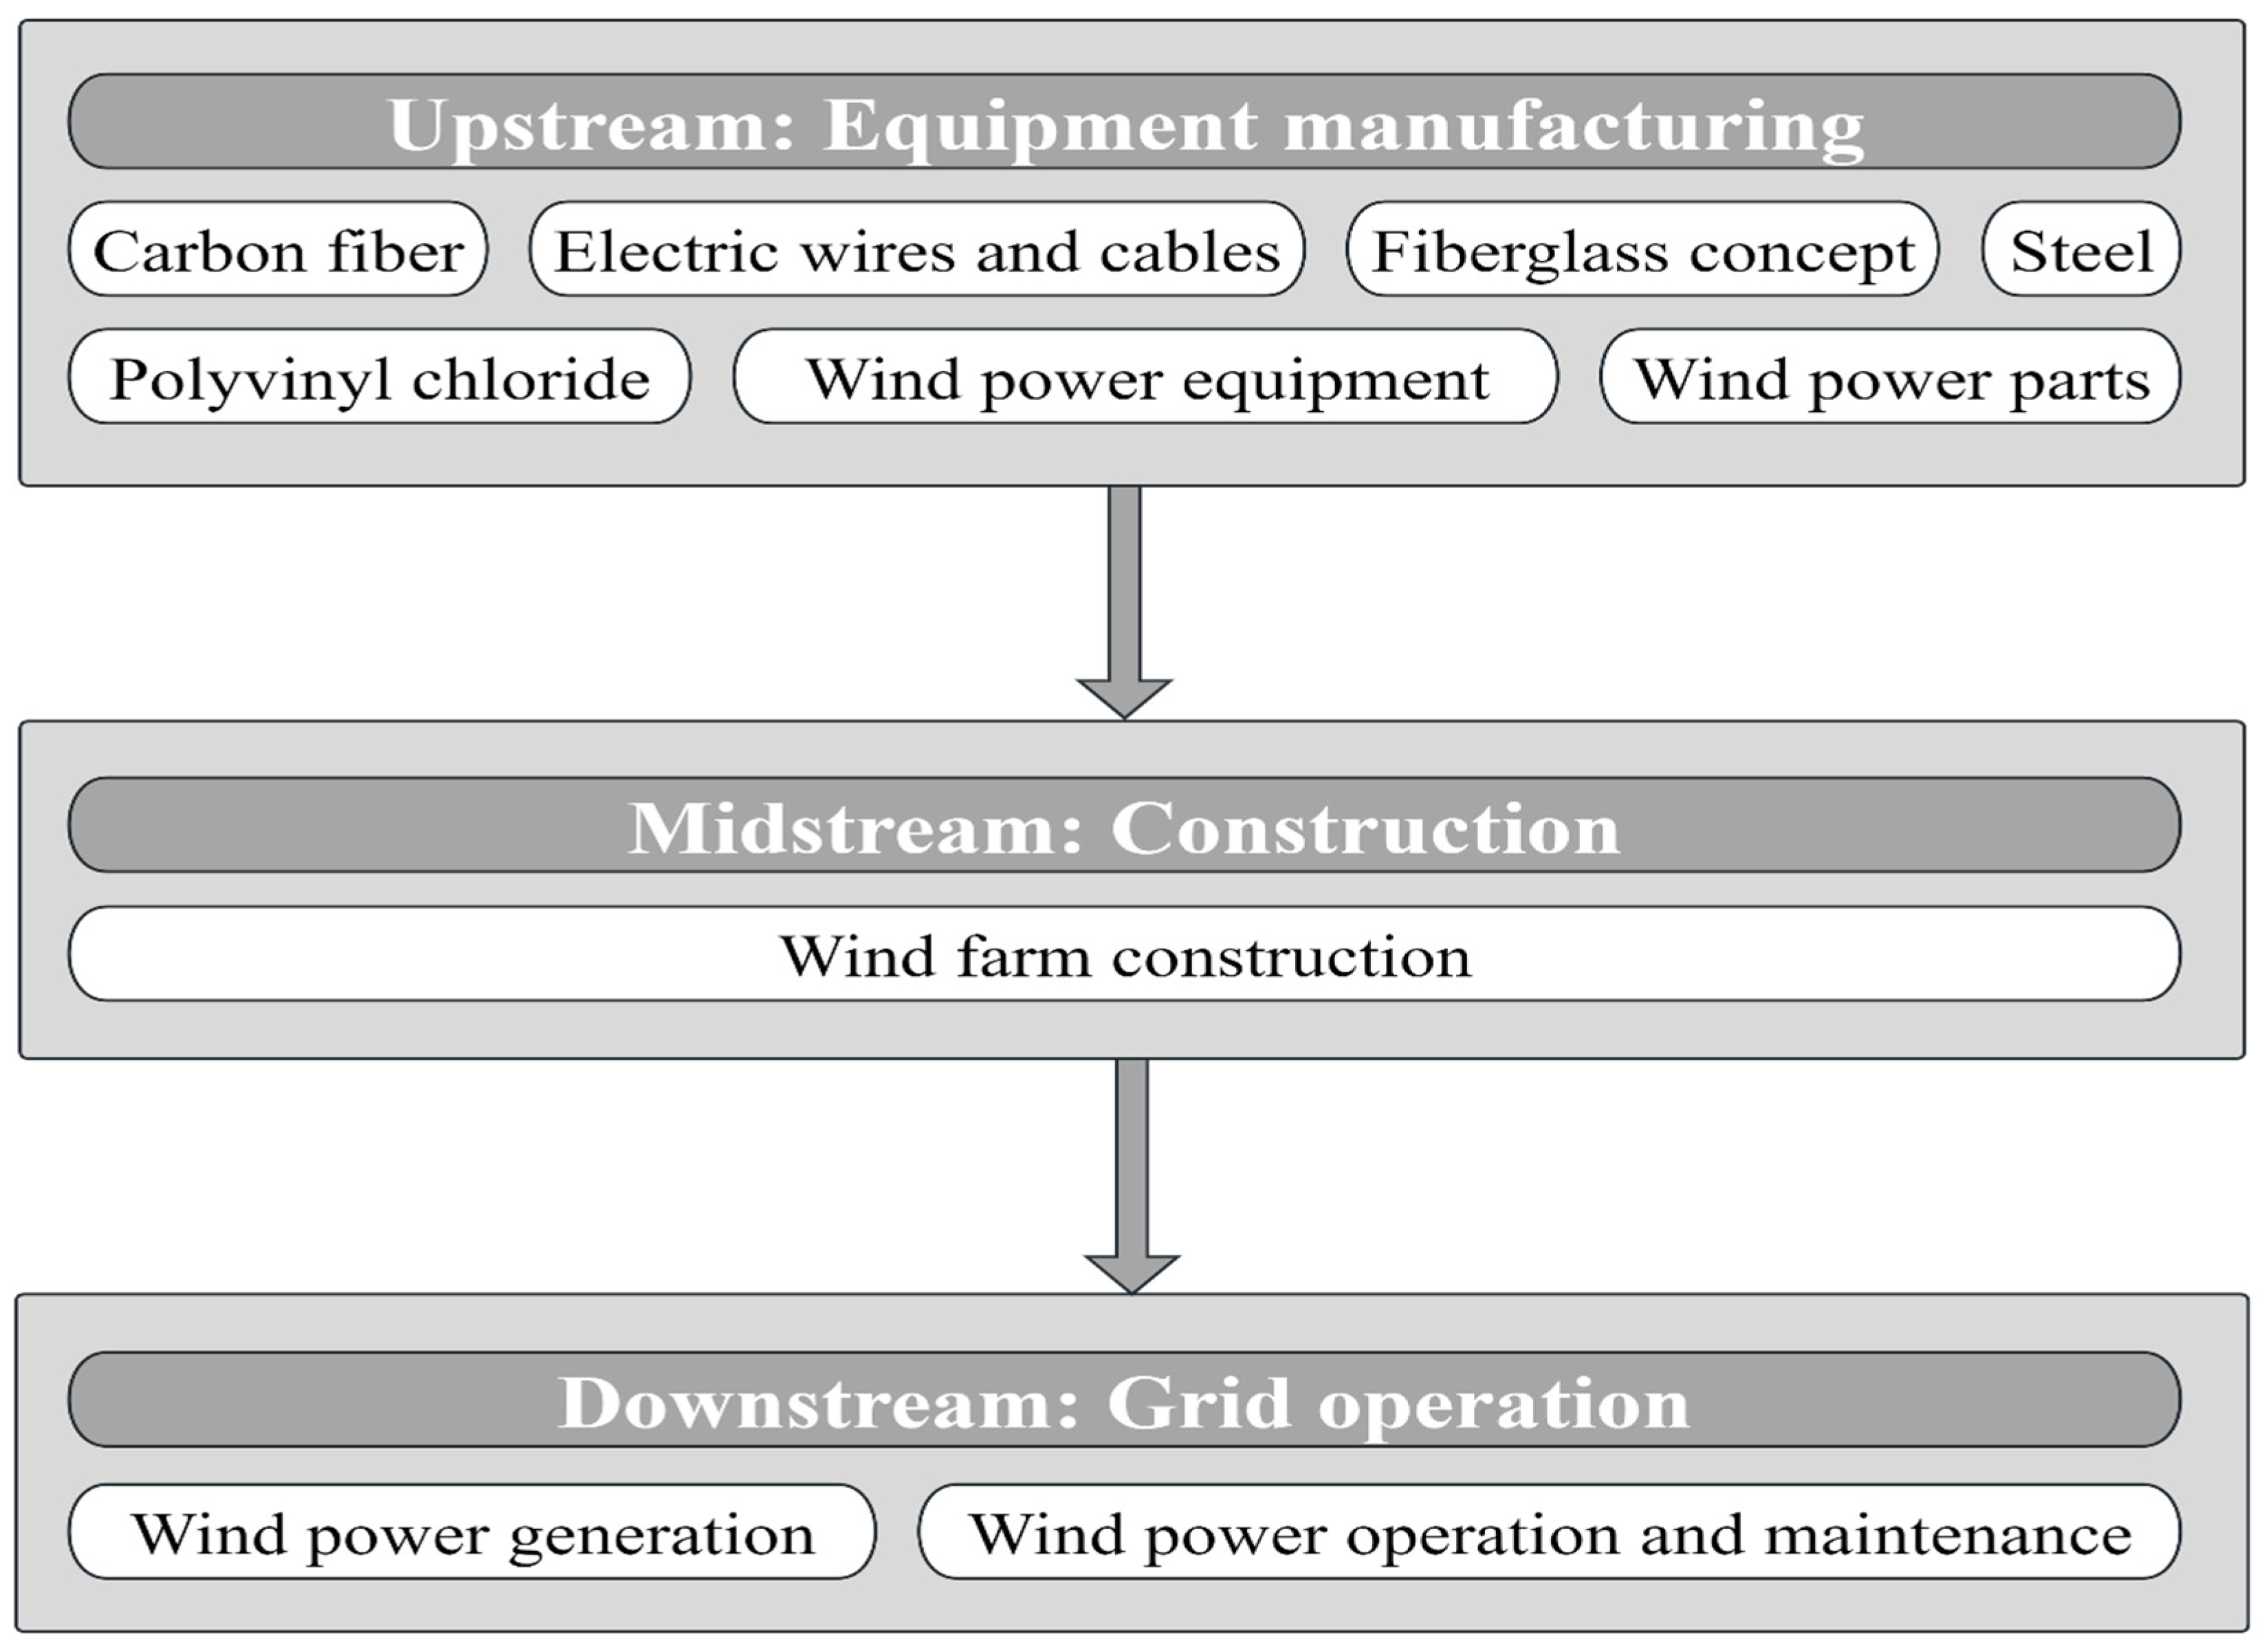
The wind power industry—one of the core pillars of China’s renewable energy transition—operates through an interconnected value chain spanning upstream manufacturing, midstream construction, and downstream grid operation. The ten subsectors selected for this study are designed to represent this integrated industrial structure [11]. As illustrated in Figure 2, the upstream segment includes carbon fiber, electric wires and cables, fiberglass, polyvinyl chloride, steel, wind power equipment, and related components. The midstream segment consists of wind farm construction, while the downstream segment comprises wind power generation and operation and maintenance (O&M) activities. This classification captures the full spectrum of China’s wind power industry chain and provides a coherent basis for examining how policy shocks propagate across different stages of the value chain.
China’s wind power policy framework demonstrates a trajectory of progressive refinement and adaptive adjustment. In its initial phase, policy efforts concentrated on resolving fundamental bottlenecks to large-scale wind power deployment, particularly those related to grid integration and investment regulation [3]. As noted by Li et al. [7], the evolution of China’s wind energy policy follows a pattern of “reactive intervention,” whereby targeted policy measures are formulated in response to specific industrial and technical challenges that emerge during different stages of sectoral development.
The upstream segment of China’s wind power industry plays a crucial role in stimulating raw material supply and high-end equipment manufacturing. Li et al. [12] emphasize that wind turbine production depends on the stable supply of key components such as blades, gearboxes, and generators. In the early stage, China relied heavily on imported core parts like main shaft bearings and converters. With the advancement of domestic manufacturing, large-scale production by domestic blade and gearbox firms has driven strong demand for glass fiber, carbon fiber, and specialty steel [13]. Meanwhile, growing technological sophistication has intensified the need for skilled R&D personnel. Using a stochastic frontier analysis, Lin and Luan [14] show that higher innovation efficiency in turbine manufacturing depends on qualified R&D teams, which in turn has promoted the expansion of wind engineering education and vocational training, forming a reinforcing link between innovation and human capital development.
The midstream stage of China’s wind power industry is closely interconnected with grid infrastructure, logistics, and energy storage development. Yuan et al. [15] highlight that the concentrated expansion of large-scale wind farms, particularly in the “Three North” regions, requires parallel investment in transmission corridors, thereby stimulating ultra-high-voltage equipment manufacturing and power engineering construction. Wind farm development also relies on complex turbine transport and foundation works, which have driven specialization in the logistics sector through increased demand for heavy-lift vehicles and port handling equipment [8]. Moreover, Dong and Li [11] demonstrate through a coupling coordination model that integrating energy storage systems—such as pumped hydro and electrochemical storage—is essential for mitigating intermittency, indirectly fostering technological innovation and market growth in the storage industry.
The downstream segment of wind power development—covering grid operation and consumption—has become a key driver of ancillary power services, smart grid technologies, and electricity trading markets. Based on a DEA model, Liu et al. [16] show that improving wind power integration requires enhanced ancillary services such as peak shaving and frequency regulation, which in turn stimulate the development of gas-fired and flexible hydropower plants and the formation of ancillary service markets [8]. Furthermore, grid integration policies, including renewable portfolio standards, have accelerated the expansion of market-based mechanisms such as green electricity and carbon trading, fostering a more integrated and adaptive industrial ecosystem [8].
The coordinated development of upstream, midstream, and downstream segments of the wind power industry generates significant spillover effects on regional economies and green service sectors. Dong and Li [11] highlight that in industrial clusters such as Jiangsu and Guangdong, the integration of equipment manufacturing, project construction, and grid operation has fostered the agglomeration of supporting services, including logistics, R&D design, and operation and maintenance, thereby enhancing regional industrial synergy and sustainability (Recent studies have also examined the environmental consequences of economic policy uncertainty, including its effects on load capacity factors and sustainability outcomes [17]).

2.2. Policy Classification Framework

To analyze China’s wind power governance systematically, the eight major policies issued between 2015 and 2024 are grouped into three categories based on their regulatory function, policy instruments, and position along the industry chain. This classification reflects the evolving priorities of China’s wind power transition—capacity expansion, industrial upgrading, and market-oriented reform—and provides a coherent foundation for assessing how policies are transmitted across upstream, midstream, and downstream sectors. Table 1 presents the classification logic, policy instruments, and representative examples of China’s wind power policies.

2.3. Overview of China’s Wind Power Policies

The Chinese government has introduced a series of wind power policies from 2015 to 2024, addressing development planning, industry support, and market-oriented reforms. Collectively, they demonstrate the government’s evolving approach to expanding capacity, promoting innovation, strengthening finance, and advancing the clean energy transition. Table 2 summarizes their main features, which are detailed below.

2.3.1. Notice of the 2016 National Wind Power Development and Construction Plan

The Notice on the 2016 National Wind Power Development and Construction Plan [No. 84, 2016], issued by the National Energy Administration (NEA) on March 17, 2016, mandates the allocation of annual wind power installation quotas across provinces, autonomous regions, and municipalities. The policy explicitly ties new capacity to grid absorption capability and national energy transition objectives, thereby seeking to curb disorderly investment, reduce curtailment, and raise the share of wind energy in China’s overall power mix [18].

2.3.2. 13th Five-Year Plan for Wind Power Development

The 13th Five-Year Plan for Wind Power Development [No. 314, 2016], issued by the NEA on November 16, 2016, set a target of 210 GW of cumulative grid-connected wind capacity and 420 TWh of annual generation by 2020. The plan focuses on reducing curtailment, optimizing the “Three North” stock, expanding distributed projects in central and southern regions, and advancing offshore wind, inter-provincial transmission, technology innovation, financial support, market reform, and international cooperation. These measures aim to strengthen wind power’s economic viability, improve system integration, and support the 15% non-fossil energy target in primary energy consumption [19,20].

2.3.3. Notice on Promoting Subsidy-Free and Grid-Parity On-Grid Projects for Wind and Solar Power

Notice on Promoting Subsidy-Free and Grid-Parity On-Grid Projects for Wind and Solar Power [No. 19, 2019], issued by the National Development and Reform Commission (NDRC) on 7 January 2019, aims to advance the subsidy-free development of wind and solar power by enabling grid-parity or below-parity on-grid tariffs, thereby shifting renewable expansion from subsidy-driven to market-driven growth. Its targets are to establish a series of parity and low-tariff pilot projects by 2020, ensure timely grid connection and full guaranteed purchase of electricity, reduce non-technical costs through supportive land, financial, and market measures, and provide policy certainty by maintaining stable support for approved projects throughout their operating period [21,22].

2.3.4. Notice on Improving the Renewable Energy Power Consumption Guarantee Mechanism

The Notice on Improving the Renewable Energy Power Consumption Guarantee Mechanism [No. 767, 2020], issued by the NDRC on 18 May 2020, introduces binding renewable energy consumption responsibility weights (commonly referred to as “consumption targets”) for provinces, autonomous regions, and municipalities. By assigning explicit obligations to local governments, grid operators, and electricity end-users, the policy institutionalizes accountability for renewable energy uptake. In doing so, it establishes a regulatory pathway for increasing the share of renewables in final electricity consumption and operationalizes China’s Renewable Portfolio Standard (RPS) framework [23].

2.3.5. Notice on Financial Support to Promote the Development of the Wind and Solar Power Industries

The Notice on Financial Support to Promote the Development of the Wind and Solar Power Industries [No. 266, 2021], issued by the NDRC on 24 February 2021, seeks to ease financing constraints for renewable energy enterprises and stabilize wind and solar development. It requires financial institutions to extend and renew loans on commercial terms, introduce subsidy entitlement loans backed by confirmed but unpaid subsidies, and tie repayment to closed subsidy management with green certificate revenues. The policy also prohibits local governments from reducing renewable tariff surcharges, prioritizes funding for grid-parity projects, and encourages pilot schemes to relieve liquidity pressures and ensure the sector’s orderly growth [24].

2.3.6. Notice on the Action Plan for Accelerating Green and Low-Carbon Innovation and Development of Power Equipment

The Notice on the Action Plan for Accelerating Green and Low-Carbon Innovation and Development of Power Equipment [No. 105, 2022], issued by the Ministry of Industry and Information Technology (MIIT) on 24 August 2022, outlines a five- to eight-year program promoting green upgrading, technological innovation, intelligent manufacturing, and international cooperation. Targeting ten key subsectors of the power equipment industry, the plan sets benchmarks for 2030, including over 200 GW of coal-fired flexibility retrofits, manufacturing capacity to support 1.2 TW of wind and solar installations, and 70 GW of nuclear equipment demand. It also emphasizes improvements in standards, finance, human capital, and international competitiveness to support the new power system and the “dual carbon” goals [25].

2.3.7. Notice on Issuing the Work Plan for Stabilizing Growth in the Power Equipment Industry

Notice on Issuing the Work Plan for Stabilizing Growth in the Power Equipment Industry [No. 119, 2023], issued by the MIIT on 9 August 2023, aims to achieve an average annual growth rate of over 9% in main business revenue and around 9% in industrial value added for the power equipment industry during 2023–2024 [26].

2.3.8. Notice on Implementing the Wind Power Action for Townships and Villages

Notice on Implementing the Wind Power Action for Townships and Villages [No. 378, 2024], issued by the NDRC on 1 April 2024, sets out to develop distributed wind projects at the village level in rural areas of eligible counties (cities, districts, and banners), with each administrative village generally limited to 20 MW. The policy aims to establish a new model of local development in which wind power projects are hosted by villages, collective revenues are enhanced, and households directly benefit, thereby promoting rural revitalization and advancing the green energy transition [27].
China’s wind power policy framework from 2015 to 2024 demonstrates strong top-down coordination and clear policy sequencing, but also reveals several structural limitations. Development and construction policies (2016 Plan; 13th FYP) effectively curbed disorderly expansion, reduced curtailment, and guided regional capacity optimization, yet their quota-based design sometimes constrained market responsiveness and slowed approval cycles. Market-oriented reforms (grid-parity policy; consumption-guarantee mechanism) represent major strengths, as they significantly improved price signals, strengthened renewable consumption accountability, and reduced dependence on subsidies; however, uneven provincial compliance and persistent non-technical barriers have limited their full effectiveness. Financial support measures alleviated liquidity pressures and improved credit access, but their short-term nature and reliance on administrative rollovers may not provide a sustainable long-term financing environment. Equipment-industry action plans (2022 and 2023 notices) promote technological upgrading, intelligent manufacturing, and international competitiveness, though their ambitious targets rely heavily on local implementation capacity and coordination across multiple ministries. Finally, the 2024 rural wind program broadens social benefits and supports distributed deployment, but faces challenges related to grid access, land availability, and village-level governance. Overall, the policies collectively strengthened capacity expansion and market reform, yet further progress requires deeper market integration, more consistent regional enforcement, and sustained financial and technological support.

3. Research Methodology

To assess whether China’s wind power policies generate significant spillover effects on the returns of upstream, midstream, and downstream sectors, this study employs three categories of contagion tests. The concept of financial market contagion originates from the economic literature, where it is commonly used to evaluate whether crises induce abnormal co-movements across markets [28]. Recent studies extend this framework to the policy domain, interpreting policy contagion as the transmission of shocks arising from policy announcements to related markets [29,30].
This study employs three contagion tests—correlation and co-skewness tests from Fry et al. [31] and co-kurtosis and co-volatility tests from Fry-McKibbin and Hsiao [32]. The contagion framework offers several advantages that justify its adoption. First, it captures nonlinear, asymmetric, and tail-dependent transmission mechanisms, which conventional correlation or volatility models cannot adequately detect, particularly when policy shocks affect sectors heterogeneously during stress periods. Second, these tests distinguish normal interdependence from genuine contagion and allow identification of directional spillovers, providing a more accurate evaluation of how wind power policies propagate across the industry chain. Third, the inclusion of higher-order co-moments (co-skewness and co-kurtosis) enables detection of extreme-risk linkages and distributional asymmetries that traditional mean–variance approaches overlook.
For the empirical implementation of policy contagion, the sample is divided into two subperiods: the pre-policy window ( T p r e ) and the post-policy window ( T p o s t ). Sector i denotes the transmission source, while sector j represents the recipient. The correlation coefficient between the source and recipient in the pre-policy period is expressed as ρ ^ p r e , and that in the post-policy period as ρ ^ p o s t . The mean returns of sectors i and j in the pre-policy period are denoted by μ ^ p r e , i and μ ^ p r e , j , respectively, while those in the post-policy period are represented by μ ^ p o s t , i and μ ^ p o s t , j . Similarly, the standard deviations of sectoral returns in the pre-policy period are given by σ ^ p r e , i and σ ^ p r e , j , and those in the post-policy period by σ ^ p o s t , i and σ ^ p o s t , j . These definitions form the basis for evaluating whether policy-induced shocks alter the dependence structure across industry chain sectors.

3.1. Correlation Contagion Test

The correlation contagion test ( C R test) extends the framework of Forbes and Rigobon [33], later refined by Fry et al. [31], to account for heteroscedasticity in policy event studies. This test assesses whether cross-market linkages strengthen significantly following a policy shock. Specifically, contagion is identified by comparing the heteroscedasticity-adjusted correlation coefficient in the post-policy period, v ^ p o s t | p r e i , with the pre-policy correlation coefficient between two markets, ρ ^ p r e . Formally, the test statistic is expressed, where the denominator of C R test is defined as V a r v ^ p o s t | p r e i ρ ^ p r e = V a r v ^ p o s t | p r e i + V a r ρ ^ p r e 2 C o v ( v ^ p o s t | p r e i , ρ ^ p r e ) with V a r v ^ p o s t | p r e i = 1 2 1 + δ 2 1 + δ 1 ρ ^ p o s t 2 3 1 T p o s t 2 ρ ^ p o s t 2 1 ρ ^ p o s t 2 2 + 1 T p r e ρ ^ p o s t 2 1 ρ ^ p o s t 2 2 ,   V a r ρ ^ p r e = 1 T p r e 1 ρ ^ p r e 2 2 , C o v v ^ p o s t | p r e i , ρ ^ p r e = 1 2 1 T p r e ρ ^ p o s t ρ ^ p r e 1 ρ ^ p o s t 2 1 ρ ^ p r e 2 1 + δ 1 + δ 1 ρ ^ p o s t 2 3 :
C R i j = v ^ p o s t p r e i ρ ^ p r e V a r v ^ p o s t p r e i ρ ^ p r e 2 ,
where
v ^ p o s t p r e i = ρ ^ p o s t 1 + δ 1 ρ ^ p o s t 2 .
and δ = σ ^ p o s t , i 2 σ ^ p r e , i 2 / σ ^ p r e , i 2 represents the proportional change in the variance of the source-policy market i between the pre- and post-policy periods. By testing whether the adjusted correlation coefficient in the post-policy period deviates significantly from the pre-policy benchmark, this approach captures potential contagion effects transmitted from sector i (policy source) to sector j (policy recipient).

3.2. Co-Skewness Contagion Tests

The second category of contagion testing is the co-skewness contagion tests, originally proposed by Fry et al. [31]. As a third-order co-moment, co-skewness provides a useful measure of asymmetry in return distributions and is particularly effective in detecting the presence of heavy tails and nonlinear dependence between markets. The test evaluates whether co-skewness between two sectors differs significantly across policy windows by comparing the post-policy and pre-policy periods. The test statistic is defined as:
C S a b i j = ψ ^ p o s t a b ψ ^ p r e a b 2 + 4 v ^ p o s t | p r e i 2 T p o s t + 2 + 4 ρ ^ p r e 2 T p r e 2 .
where ψ ^ k a b denotes the co-skewness coefficient with a b = 12 and a b = 21 , computed as z i , t and z j , t denote the standardized returns for market i and j, defined as z i , t = r i , t μ i / σ i .
ψ ^ k 12 = 1 T k t = 1 T k z i , t 1 z j , t 2 ; k p r e , p o s t ,
ψ ^ k 21 = 1 T k t = 1 T k z i , t 2 z j , t 1 ; k p r e , p o s t ,
with z i , t 1 and z j , t 1 denoting standardized returns for sectors i and j, respectively. In this framework, ψ ^ p o s t a b and ψ ^ p r e a b represent the co-skewness coefficients during the post- and pre-policy periods. The form C S 12 captures contagion transmitted from changes in the mean return of the policy-source sector ( a = 1 ) to the volatility of the recipient sector ( b = 2 ), while C S 21 evaluates contagion from volatility shocks in the source sector ( a = 2 ) to changes in the mean return of the recipient sector ( b = 1 ).

3.3. Co-Kurtosis and Co-Volatility Contagion Tests

The final category of contagion testing consists of the co-kurtosis and co-volatility tests, introduced by Fry-McKibbin and Hsiao [32]. As fourth-order co-moments, co-kurtosis and co-volatility extend the analysis of dependence structures by capturing extreme tail behavior in return distributions. These measures are particularly effective in identifying leptokurtic features of returns and detecting higher-order linkages that are not observable through correlation or co-skewness. The tests evaluate whether the co-kurtosis and co-volatility between two sectors differ significantly across policy windows by comparing the post-policy and pre-policy periods. The co-kurtosis test statistic is defined as:
C K a b i j = ψ ^ p o s t a b 3 v ^ p o s t | p r e i ψ ^ p r e a b 3 ρ ^ p r e 6 + 18 v ^ p o s t | p r e i 2 T p o s t + 6 + 18 ρ ^ p r e 2 T p r e 2 ,
where ψ ^ k a b denotes the co-kurtosis coefficient for a b = 13 and a b = 31 , computed as
ψ ^ k 13 = 1 T k t = 1 T k z i , t 1 z j , t 3 ; k p r e , p o s t ,
ψ ^ k 31 = 1 T k t = 1 T k z i , t 3 z j , t 1 ; k p r e , p o s t ,
The co-volatility test statistic is defined as:
C V 22 i j = ψ ^ p o s t 22 1 + 2 v ^ p o s t | p r e i 2 ψ ^ p r e 22 1 + 2 ρ ^ p r e 2 4 + 16 v ^ p o s t | p r e i 2 + 4 v ^ p o s t | p r e i 4 T p o s t + 4 + 16 ρ ^ p r e 2 + 4 ρ ^ p r e 2 T p r e 2 ,
where ψ ^ k 22 represents the volatility coefficient, computed as
ψ ^ k 22 = 1 T k t = 1 T k z i , t 2 z j , t 2 ; k p r e , p o s t .
In this framework, C K 13 evaluates contagion transmitted from changes in the mean return of the source-policy market to the skewness of the recipient sector, while C K 31 captures the reverse effect. By contrast, C V 22 identifies volatility-driven contagion, measuring the extent to which shocks in the volatility of the source sector propagate to recipient sectors. Together, these fourth-order tests provide a more comprehensive characterization of policy contagion by capturing nonlinear and extremal dependence structures beyond second- and third-order co-moments.

3.4. Policy Sensitivity Index

Following the framework of Hsiao et al. [29], a policy sensitivity index ( S I ) is constructed to quantify the extent to which each sector is influenced by China’s wind power policy interventions. The procedure involves two steps. First, six contagion channels are evaluated: correlation ( C R ), co-skewness ( C S 12 , C S 21 ), co-kurtosis ( C K 13 , C K 31 ), and co-volatility ( C V 22 ). For each test, a binary indicator is assigned. Specifically, the indicator I C R , j equals 1 if the correlation test statistic for sector j exceeds the 5% critical value of 3.84, and 0 otherwise. The same rule applies to I C S 12 , j , I C S 21 , j , I C K 13 , j , I C S 31 , j , and I C V 22 , j . Second, the sector-specific sensitivity index is calculated as the average of these six indicators:
S I j = I C R + I c s 12 + I C S 21 + I C K 13 + I C K 31 + I C V 22 6 × 100 .
An S I j value of 100% indicates that sector j is significantly affected through all six co-moment channels, whereas a value of 0% reflects no statistically significant impact of policy announcements.

4. Empirical Study

4.1. Data and Descriptive Statistics

This study examines the contagion effects of China’s wind power policy interventions on the stock performance of related industry chain sectors over the period 2015–2024. Using daily closing price indices of ten wind power subsectors obtained from the Wind database, covering 8 May 2015 to 17 September 2024, the analysis investigates how policy shocks transmit to sectoral markets. The data are obtained from the Wind database, a widely used financial and economic information platform in China. The upstream segment is represented by sectoral indices for carbon fiber (884693.WI), electric wires and cables (003074.CJ), fiberglass (8841043.WI), polyvinyl chloride (VFI.WI), steel (886012.WI), wind power equipment (801736.SI), and wind power components (003082.CJ). The midstream segment is proxied by a composite index of wind farm construction, constructed using weighted returns from eight listed firms: CRRC Corporation Limited, Beijing, China (601766.SH), Dongfang Electric Corporation Limited, Chengdu, China (600875.SH), Ming Yang Smart Energy Group Limited, Zhongshan, China (601615.SH), Sany Heavy Industry Co., Changsha, China (600031.SH), Goldwind Science & Technology Co., Ltd., Beijing, China (002202.SZ), Shanghai Electric Wind Power Group Co., Ltd., Shanghai, China (688660.SH), Jiangsu Haili Wind Power Equipment Technology Co., Ltd., Rudong, China (301155.SZ), and Shanghai Electric Group Co., Ltd., Shanghai, China (601727.SH). The downstream segment includes indices for wind power generation (884036.WI) and operation and maintenance, the latter constructed as a weighted composite of China Longyuan Power Group Co., Ltd., Beijing, China (001289.SZ), CECEP Wind-Power Co., Ltd., Beijing, China (601016.SH), Ming Yang Smart Energy Group Limited, Zhongshan, China (601615.SH), and Goldwind Science & Technology Co., Ltd., Beijing, China (002202.SZ). Because several firms along the wind power industry chain were listed only after 2015, earlier data are incomplete. Accordingly, the analysis focuses on wind power policies implemented from 2015 onward to ensure a consistent and reliable sample for empirical estimation. The policy measures under consideration comprise eight types, which are systematically classified into three categories: (i) development and construction policies, (ii) industry support instruments, and (iii) market mechanism reforms. To capture the short-term responses of sectoral indices to policy events, event windows are defined around each announcement, as detailed in Table 3. Specifically, the post-announcement window is set from the formal release date of a given policy and extends for 90 subsequent trading days.
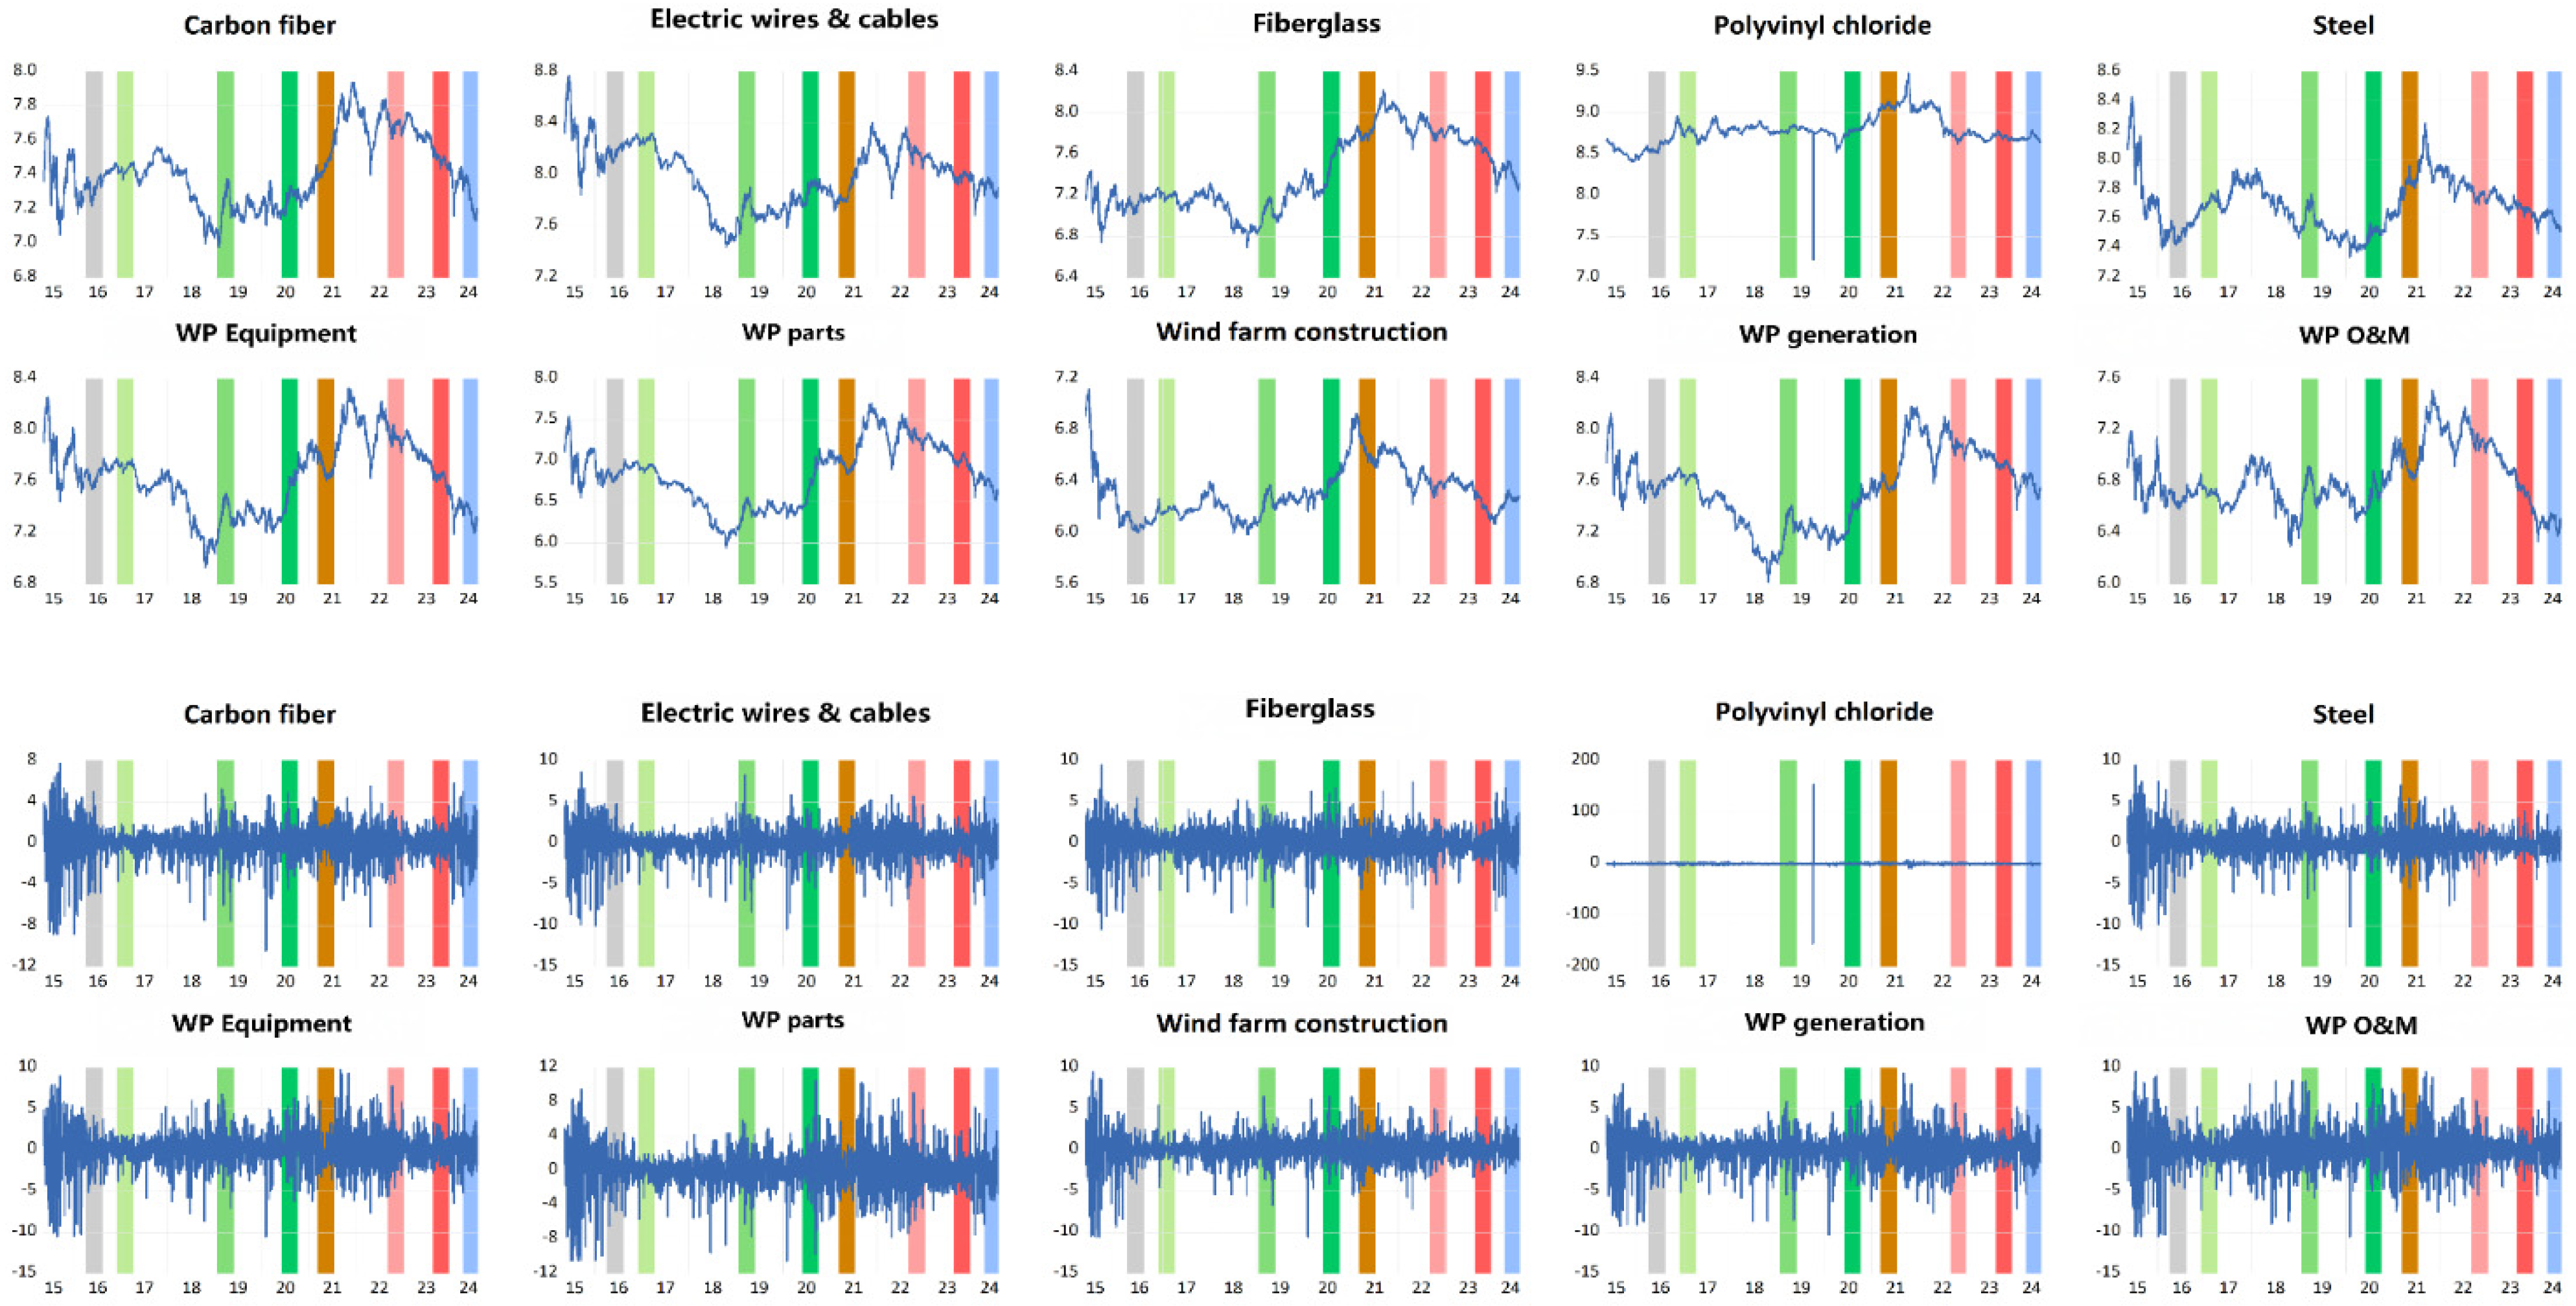
Figure 3 depicts the daily price indices (upper panels) and returns (lower panels) of China’s wind power industry chain sectors across eight major policy episodes. The figure demonstrates pronounced heterogeneity in policy responsiveness along the value chain. Upstream sectors—such as carbon fiber, steel, electric wires and cables, and wind power equipment—exhibit sharp fluctuations during policy windows, underscoring their high sensitivity to policy shocks and rapid adjustment to shifts in investment and production expectations. The midstream wind farm construction sector displays moderate but sustained responses, reflecting project cycle lags and the gradual realization of policy incentives. In contrast, downstream sectors, including power generation and operation and maintenance, show smoother trends, indicating that policy effects unfold progressively through improvements in grid integration and operational efficiency. The results highlight a cascading transmission mechanism from upstream manufacturing to downstream operations, consistent with the multi-stage adjustment dynamics of China’s wind power system.
Table 4 presents the descriptive moments of China’s wind power industry chain during the pre-policy (May 2015–March 2016) and policy (March–July 2016) periods under the 2016 Notice on the National Wind Power Development and Construction Plan. Mean returns across most sectors shifted from negative to positive, while volatility declined sharply, indicating improved market performance and stability following policy implementation. Upstream sectors—particularly carbon fiber, steel, and wind power equipment—recorded the strongest recovery, reflecting policy-driven expansion in high-end manufacturing and raw material demand. The midstream wind farm construction sector exhibited reduced variance and greater return stability, suggesting enhanced financing conditions and investment confidence. Downstream sectors, including power generation and operation & maintenance, showed modest but steady gains, underscoring improved grid integration and operational efficiency.
The co-moment results reveal more profound structural adjustments in market dependence. While correlation coefficients remained high, higher-order co-moments—especially co-kurtosis and co-volatility—rose markedly during the policy period, implying stronger nonlinear and tail-risk linkages across the industry chain. The most pronounced increases occurred in upstream sectors, indicating heightened sensitivity to financial and policy shocks, whereas midstream and downstream sectors exhibited more stable but persistent contagion patterns. Overall, the findings suggest that the 2016 wind power development plan reinforced inter-sectoral transmission channels and deepened the integration between financial dynamics and real economic activity within China’s wind power system.

4.2. Evidence of Policy Contagion

Table 5, Table 6 and Table 7 present the empirical evidence of policy contagion from wind power generation to its industry chain sectors across three categories of policies—namely, wind power development and construction, industry support measures, and market mechanism reforms.

4.2.1. Contagion Based on Wind Power Development and Construction Policies

Table 5 reports the contagion effects of three wind power development and construction policies on the upstream, midstream, and downstream sectors of China’s wind power industry chain. These include the 2016 Notice on the National Wind Power Development and Construction Plan, the 2021 Action Plan for Accelerating Green and Low-Carbon Innovation, and the 2024 Notice on Implementing the Wind Power Action for Townships and Villages.
Among three wind power development and construction policies, the 2016 National Wind Power Development and Construction Plan exhibits the strongest contagion, with an average policy sensitivity index of 26%. Contagion effects are detected across all sectors, especially in the upstream segment where carbon fiber (67%) and electric wires & cables (33%) record the highest sensitivity. Significant transmission occurs through both the correlation ( C R ) and higher-order channels—co-kurtosis ( C K 13 , C K 31 ) and co-volatility ( C V 22 )—indicating that large-scale policy interventions not only drive synchronous price responses but also amplify nonlinear risk linkages within the industry chain. Midstream (wind farm construction) and downstream (operation and maintenance) sectors also display moderate contagion, suggesting that policy implementation strengthened investment and grid integration dynamics during the “13th Five-Year Plan” period.
The 2021 Action Plan for Accelerating Green and Low-Carbon Innovation produces selective but more nonlinear contagion, with an average sensitivity index of 26%. The effects are most pronounced in technology- and material-intensive sectors such as steel, polyvinyl chloride, and wind power parts ( S I = 50 % ). The co-kurtosis and co-volatility tests capture the majority of significant linkages, implying that innovation-driven policies primarily operate through tail-risk and volatility channels rather than simple correlations.
In contrast, the 2024 Wind Power Action for Townships and Villages shows the weakest contagion, with an average sensitivity index of 9%. Significant effects are limited to fiberglass and steel, primarily through the co-skewness ( C S 12 , C S 21 ) and co-kurtosis ( C K 13 ) channels. These results suggest that distributed-generation policies stimulate localized industrial activity but have limited systemic transmission along the broader wind power value chain. Overall, the findings indicate a policy evolution from large-scale construction and industrial activation toward innovation-driven and decentralized development, accompanied by a shift in contagion channels from linear correlation to higher-order co-moment transmission.

4.2.2. Contagion Based on Wind Power Industry Support Policies

Table 6 reports the contagion effects of three wind power industry support policies on the upstream, midstream, and downstream sectors of China’s wind power industry chain. These include the 13th Five-Year Plan for Wind Power Development, the 2021 Notice on Financial Support to Promote the Development of Wind and Solar Power, and the 2022 Work Plan for Stabilizing Growth in the Power Equipment Industry.
Among these, the 13th Five-Year Plan for Wind Power Development exhibits the strongest and broadest contagion, with an average policy sensitivity index ( S I ) of 37%. Significant spillovers are observed in both upstream and downstream sectors, led by steel (83%), carbon fiber (50%), polyvinyl chloride (50%), and operation & maintenance (50%). The contagion channels are dominated by higher-order co-moments—particularly co-kurtosis ( C K 13 , C K 31 ) and co-volatility ( C V 22 )—which captures nonlinear and tail-risk transmission across the value chain. The results suggest that the implementation of the 13th Five-Year Plan effectively reinforced production linkages between raw materials, construction, and operation segments, promoting synchronized development during China’s large-scale wind capacity expansion phase.
The 2021 Notice on Financial Support to Promote the Development of Wind and Solar Power produces moderate contagion, with an average S I of 17%. Policy transmission is concentrated in technology-intensive sectors such as wind power equipment and parts (33%), where co-skewness ( C S 12 , C S 21 ) and co-volatility ( C V 22 ) channels dominate. This pattern reflects that financial support policies mainly enhance liquidity and reduce financing constraints rather than trigger widespread market interdependence.
In contrast, the 2022 Work Plan for Stabilizing Growth in the Power Equipment Industry shows the weakest and most localized contagion (average S I = 9 % ), limited primarily to carbon fiber, electric wires & cables, and wind farm construction (17%). Contagion occurs largely through correlation ( C R ) effects, suggesting that stabilization measures promote incremental industrial recovery without generating strong nonlinear transmission. Overall, the results demonstrate a policy hierarchy in which strategic planning policies exert systemic contagion, financial policies moderate liquidity channels, and stabilization policies yield only marginal sectoral responses.

4.2.3. Contagion Based on Wind Power Market Mechanism Reforms

Table 7 reports the contagion effects of two wind power market mechanism reforms on China’s wind power industry chain: the 2019 Notice on Promoting Subsidy-Free Wind and Solar Power and the 2021 Notice on Improving the Renewable Energy Power Consumption Guarantee Mechanism.
The 2019 Notice on Improving the Renewable Energy Power Consumption Guarantee Mechanism generates the strongest and most extensive contagion, with an average policy sensitivity index of 89%. Contagion spans all sectors across the value chain, led by carbon fiber, electric wires and cables, fiberglass, steel, wind farm construction, and wind power parts, all recording full sensitivity ( S I = 100 % ). The effects are highly nonlinear, dominated by co-kurtosis ( C K 13 , C K 31 ) and co-volatility ( C V 22 ) channels, indicating that the policy reshaped dependence structures through tail-risk and volatility linkages rather than linear correlations. These results reflect the systemic market response triggered by the establishment of consumption guarantees, which reinforced coordination between generation, transmission, and consumption, thereby strengthening the integration of renewable energy within the national power market.
By contrast, the 2021 Notice on Promoting Subsidy-Free Wind and Solar Power exhibits moderate contagion, with an average sensitivity index of 37%. Significant effects are concentrated in the upstream and midstream sectors, particularly in carbon fiber and wind power parts ( S I = 67 % ), as well as fiberglass and construction ( S I = 33 % ). Transmission occurs through both linear ( C R ) and higher-order channels, suggesting that the policy effectively redirected capital and market expectations but generated limited downstream responses. Overall, the comparison reveals a clear transition from investment-driven market reform under the subsidy-free policy toward a comprehensive, system-level reform under the consumption guarantee mechanism, marking China’s progression toward a mature and market-based renewable energy framework.

4.2.4. Comparative Analysis of Policy Contagion Effects

Comparing the three categories of policies—wind power development and construction, industry support, and market mechanism reforms—reveals distinct transmission strengths and structural characteristics across the wind power industry chain. Among them, market mechanism reforms exert the strongest and most systemic contagion, with policy shocks propagating widely through higher-order dependence channels such as co-kurtosis and co-volatility. The 2019 Notice on Improving the Renewable Energy Power Consumption Guarantee Mechanism demonstrates the highest policy sensitivity, indicating that reforms enhancing market integration and consumption guarantees produce deep, nonlinear linkages between financial and industrial sectors. In contrast, development and construction policies show moderate but broad contagion, particularly during the 2016 National Wind Power Development and Construction Plan period, which strengthened coordination across investment, construction, and manufacturing stages. Industry support policies generate the weakest and most selective transmission, mainly improving liquidity and innovation in technology-intensive sectors rather than causing full-chain contagion.
Across the industry chain, the upstream sector consistently shows the highest responsiveness, driven by policy-induced demand for materials and equipment such as steel, carbon fiber, and wind power parts. The midstream sector—wind farm construction—exhibits strong but lagged responses, reflecting the temporal nature of project development cycles. By contrast, the downstream segment, including power generation and O&M, displays stable yet limited reactions, primarily influenced by long-term capacity expansion and grid integration policies. Overall, the evidence suggests a structural policy hierarchy: market mechanism reforms deliver the most profound systemic effects, development and construction policies provide broad investment-driven contagion, and industry support policies yield targeted but weaker influence.
These contagion patterns also carry important implications for industrial coordination, investment behavior, and technological upgrading along the wind power value chain. The strong upstream responsiveness indicates that material and equipment suppliers rapidly incorporate policy signals into production and pricing decisions, suggesting that stable and predictable policy frameworks are essential to avoid cyclical over-capacity and supply–demand mismatches. The lagged, but meaningful, midstream reactions highlight the need for tighter alignment between policy timing and project development cycles, particularly through streamlined approvals and improved grid-connection processes. Meanwhile, the relatively muted downstream responses imply that long-term mechanisms—such as guaranteed offtake arrangements, ancillary-service pricing, and performance-based regulation—are needed to reinforce investment incentives in operation and maintenance activities. Overall, the heterogeneous contagion dynamics underscore that effective policy design should consider differentiated transmission pathways to enhance coordination across upstream manufacturing, midstream construction, and downstream operational segments of China’s wind power industry.
Overall, the contagion patterns identified in this study are broadly consistent with existing evidence on policy transmission in renewable energy markets. Prior research shows that upstream manufacturing tends to react more strongly to policy shocks because of immediate changes in investment expectations and material demand [6,11]. Our results reinforce this finding by demonstrating consistently higher sensitivity in carbon fiber, steel, and wind equipment sectors across almost all policy episodes. The dominance of higher-order co-moment channels is also aligned with studies emphasizing the nonlinear nature of renewable energy policy spillovers, particularly during periods of regulatory adjustment or market uncertainty. At the same time, our findings add nuance by showing that market-mechanism reforms generate far more systemic and nonlinear contagion than development or industry support policies—an aspect less documented in previous literature. These results indicate that policies shaping price signals and consumption guarantees play a disproportionately important role in coordinating investment and reducing risk across the wind power value chain. Taken together, the evidence suggests that China’s policy evolution—toward market-oriented and risk-sensitive governance—is reshaping the way shocks propagate through the wind power sector.

5. Conclusions and Policy Implications

This study advances the literature by analyzing the contagion effects of China’s wind power policies implemented between 2015 and 2024 across the upstream, midstream, and downstream segments of the wind power industry chain. Employing a VAR framework with six co-moment contagion tests and a policy sensitivity index, several key findings emerge. First, market mechanism reforms generate the strongest and most systemic contagion effects, reflecting their central role in deepening inter-sectoral linkages and shaping China’s market-oriented renewable energy transition. Development and construction policies rank second, producing broad but investment-driven contagion across manufacturing and project development stages, while industry support policies exert the weakest and most selective influence, primarily enhancing innovation and liquidity in technology-intensive sectors. Second, the effects differ markedly across the value chain. The upstream sector—including materials and equipment manufacturing—shows the highest policy sensitivity and volatility, reflecting its responsiveness to capital inflows and policy-induced demand. The midstream segment, represented by wind farm construction, exhibits more persistent but lagged responses consistent with project cycle dynamics. In contrast, the downstream sector, comprising power generation and operation & maintenance, demonstrates moderate yet stable contagion, largely driven by policies improving grid integration and market consumption guarantees. Overall, the results reveal a policy hierarchy where market reforms dominate systemic transmission, construction policies sustain broad contagion, and support policies reinforce technological upgrading within China’s wind power ecosystem.
Based on the empirical findings, three policy implications emerge. First, because policy transmission is most pronounced in upstream segments—particularly equipment manufacturing and raw-material industries—policymakers should strengthen the stability and predictability of market signals for upstream investment. Establishing multi-year tariff frameworks, maintaining consistent grid-parity rules, and improving quota transparency would reduce uncertainty and mitigate cyclical overcapacity in key components such as turbines, blades, and materials. Second, given that market-mechanism reforms generate the strongest contagion effects among the three policy types, future policy design should prioritize deeper price-based instruments that enhance efficiency, innovation, and risk management. Expanding green electricity trading, scaling up long-term power purchase agreements, and improving renewable portfolio standards would provide clearer demand expectations and reduce revenue volatility across upstream, midstream, and downstream segments. Third, because midstream construction and downstream operation and maintenance respond more moderately and gradually to policy shocks, targeted measures are needed to accelerate policy transmission beyond the upstream segment. Streamlining project approval and grid-connection procedures can reduce delays in the construction phase, while expanding guaranteed offtake arrangements, stabilizing ancillary-service pricing, and adopting performance-based incentives can enhance long-term revenue certainty for downstream operators.
This study has several limitations. First, due to data availability, the analysis focuses on wind power policies issued between 2015 and 2024, capturing only a relatively short policy cycle. Second, the empirical framework relies on sector-level stock indices as proxies for industry chain performance; although widely used, these measures do not fully reflect firm-level heterogeneity, cost structures, or physical deployment outcomes such as project delays and curtailment. Third, while ten representative subsectors are examined, China’s wind power supply chain is broader and increasingly integrated with emerging industries—such as energy storage, digitalized grid systems, and hydrogen—none of which are explicitly included in the current model. Fourth, the analysis does not incorporate exogenous shocks such as the COVID-19 pandemic, which has significantly affected renewable-energy investment, consumption, and supply chains; future research should account for these disruptions. Finally, the study evaluates eight historical policy episodes, yet forthcoming reforms—particularly those related to electricity market restructuring and deep decarbonization—may alter policy transmission dynamics in ways not captured here. These limitations suggest that future work should integrate firm-level microdata, develop structural or macro–sectoral models, broaden the industry boundary, and examine longer-term policy evolution as China’s energy transition accelerates.

Author Contributions

Conceptualization, C.Y.-L.H.; Methodology, C.Y.-L.H.; Software, C.Y.-L.H.; Formal analysis, H.L. and C.Y.-L.H.; Investigation, H.L. and C.Y.-L.H.; Data curation, H.L.; Writing—original draft, H.L., J.Z., C.Y.-L.H. and Y.-B.C.; Writing—review and editing, H.L., J.Z., C.Y.-L.H. and Y.-B.C.; Visualization, C.Y.-L.H.; Supervision, C.Y.-L.H. and Y.-B.C.; Project administration, C.Y.-L.H. and Y.-B.C.; Funding acquisition, Y.-B.C. All authors have read and agreed to the published version of the manuscript.

Funding

This research is supported by the Macao Polytechnic University project funding [Grant No. RP/CJT-01/2024].

Data Availability Statement

Dataset available on request from the authors.

Conflicts of Interest

The authors declare no conflict of interest.

References

  1. Zhuang, G.; Dou, X. Energy base for carbon peaking and carbon neutrality. In China’s Road to Carbon Peaking and Carbon Neutrality; Springer Nature: Singapore, 2023; pp. 61–86. [Google Scholar]
  2. Song, D.; Pei, H.; Liu, Y.; Wei, H.; Yang, S.; Hu, S. Review on legislative system of photovoltaic industry development in China. Energies 2022, 15, 306. [Google Scholar] [CrossRef]
  3. Wang, B.; Xing, Q. Evaluation of the wind power industry policy in China (2010–2021): A quantitative analysis based on the PMC Index Model. Energies 2022, 15, 8176. [Google Scholar] [CrossRef]
  4. Shi, J.; Zhao, Y. Challenges and Pathways for Tripling Renewable Energy Capacity Globally by 2030. Chin. J. Urban Environ. Stud. 2025, 13, 2550004. [Google Scholar] [CrossRef]
  5. REN21. Renewables 2025 Global Status Report Collection. 2025. Available online: https://www.ren21.net/gsr-2025/technologies/wind-power/?utm_source=chatgpt.com (accessed on 20 October 2025).
  6. Jiang, Z.; Shi, J. Government intervention and technological innovation in the wind power industry in China: The role of industrial environmental turbulence. Appl. Energy 2023, 344, 121265. [Google Scholar] [CrossRef]
  7. Li, A.; Sun, Y.; Song, X. Gradual improvement and reactive intervention: China’s policy pathway for developing the wind power industry. Renew. Energy 2023, 216, 119068. [Google Scholar] [CrossRef]
  8. Dai, J.; Yang, X.; Wen, L. Development of wind power industry in China: A comprehensive assessment. Renew. Sustain. Energy Rev. 2018, 97, 156–164. [Google Scholar] [CrossRef]
  9. Ren, Z.; Zhang, S.; Su, Y.; Yao, Z.; Huang, R.; Wang, P. Low-carbon policy simulation for offshore wind power development in China’s net-zero power sector. Energy Policy 2025, 205, 114700. [Google Scholar] [CrossRef]
  10. Hsiao, C.Y.L.; Sheng, N.; Fu, S.; Wei, X. Evaluation of contagious effects of China’s wind power industrial policies. Energy 2022, 238, 121760. [Google Scholar] [CrossRef]
  11. Dong, F.; Li, W. Research on the coupling coordination degree of “upstream-midstream-downstream” of China’s wind power industry chain. J. Clean. Prod. 2021, 283, 124633. [Google Scholar] [CrossRef]
  12. Li, C.B.; Chen, H.Y.; Zhu, J.; Zuo, J.; Zillante, G.; Zhao, Z.Y. Comprehensive assessment of flexibility of the wind power industry chain. Renew. Energy 2015, 74, 18–26. [Google Scholar] [CrossRef]
  13. Zhao, Z.Y.; Tian, Y.X.; Zillante, G. Modeling and evaluation of the wind power industry chain: A China study. Renew. Sustain. Energy Rev. 2014, 31, 397–406. [Google Scholar] [CrossRef]
  14. Lin, B.; Luan, R. Are government subsidies effective in improving innovation efficiency? Based on the research of China’s wind power industry. Sci. Total Environ. 2020, 710, 136339. [Google Scholar] [CrossRef]
  15. Yuan, J.; Sun, S.; Shen, J.; Xu, Y.; Zhao, C. Wind power supply chain in China. Renew. Sustain. Energy Rev. 2014, 39, 356–369. [Google Scholar] [CrossRef]
  16. Liu, Y.; Ren, L.; Li, Y.; Zhao, X.G. The industrial performance of wind power industry in China. Renew. Sustain. Energy Rev. 2015, 43, 644–655. [Google Scholar] [CrossRef]
  17. Kilinc-Ata, N.; Camkaya, S.; Akca, M.; Topal, S. The Impact of Uncertainty in Economic Policy on the Load Capacity Factors in China and the United States (US): New Evidence from Novel Fourier Bootstrap ARDL Approach. J. Sustain. Res. 2025, 7, e250002. [Google Scholar] [CrossRef]
  18. NEA, National Energy Administration. The Notice of the 2016 National Wind Power Development and Construction Plan. 2016. Available online: https://zfxxgk.nea.gov.cn/auto87/201603/t20160321_2212.htm (accessed on 20 October 2025).
  19. NEA, National Energy Administration. Notice on the Issuance of the 13th Five-Year Plan for Wind Power Development. 2016. Available online: https://www.nea.gov.cn/135867633_14804706797341n.pdf (accessed on 20 October 2025).
  20. Gosens, J.; Kåberger, T.; Wang, Y. China’s next renewable energy revolution: Goals and mechanisms in the 13th Five Year Plan for energy. Energy Sci. Eng. 2017, 5, 141–155. [Google Scholar] [CrossRef]
  21. NDRC, National Development and Reform Commission. Notice on Actively Promoting Subsidy-Free and Grid-Parity On-Grid Development of Wind and Solar Power. 2019. Available online: https://zfxxgk.ndrc.gov.cn/web/iteminfo.jsp?id=16074 (accessed on 20 October 2025).
  22. Yan, J.; Yang, Y.; Elia Campana, P.; He, J. City-level analysis of subsidy-free solar photovoltaic electricity price, profits and grid parity in China. Nat. Energy 2019, 4, 709–717. [Google Scholar] [CrossRef]
  23. NDRC, National Development and Reform Commission. Notice on Improving the Renewable Energy Power Consumption Guarantee Mechanism. 2020. Available online: https://www.ndrc.gov.cn/xxgk/zcfb/tz/202006/t20200601_1229674.html (accessed on 20 October 2025).
  24. NDRC, National Development and Reform Commission. Notice on Financial Support to Promote the Development of the Wind and Solar Power Industries. 2021. Available online: https://www.ndrc.gov.cn/xxgk/zcfb/tz/202103/t20210312_1269410.html (accessed on 20 October 2025).
  25. MIIT, Ministry of Industry and Information Technology. Notice on the Action Plan for Accelerating the Green and Low-Carbon Innovation and Development of Power Equipment. 2022. Available online: https://wap.miit.gov.cn/jgsj/zbes/wjfb/art/2022/art_8ae56b9599f64796a050d8480b9142d9.html (accessed on 20 October 2025).
  26. MIIT, Ministry of Industry and Information Technology. Notice on Issuing the Work Plan for Stabilizing Growth in the Power Equipment Industry (2023–2024). 2023. Available online: https://www.gov.cn/zhengce/zhengceku/202309/content_6901933.htm (accessed on 20 October 2025).
  27. NDRC, National Development and Reform Commission. Notice on Organizing and Implementing the “Wind Power Action for Thousands of Townships and Villages”. 2024. Available online: https://www.gov.cn/zhengce/zhengceku/202404/content_6943057.htm (accessed on 20 October 2025).
  28. Hsiao, C.Y.L.; Chiu, Y.B. Financial contagion and networks among the oil and BRICS stock markets during seven episodes of crisis events. J. Int. Money Financ. 2024, 144, 103081. [Google Scholar] [CrossRef]
  29. Hsiao, C.Y.L.; Chiu, Y.B.; Wang, Y. Assessing contagion risks of carbon reduction policies on the stock returns: Evidence from china’s energy markets. Emerg. Mark. Financ. Trade 2024, 60, 2783–2804. [Google Scholar] [CrossRef]
  30. Ou, Y.; Hsiao, C.Y.L.; Chui, C.M. How does the supply chain market respond to policy shocks? Evidence from solar photovoltaic sectors in China. Renew. Energy 2024, 232, 121129. [Google Scholar] [CrossRef]
  31. Fry, R.; Martin, V.L.; Tang, C. A new class of tests of contagion with applications. J. Bus. Econ. Stat. 2010, 28, 423–437. [Google Scholar] [CrossRef]
  32. Fry-McKibbin, R.; Hsiao, C.Y.L. Extremal dependence tests for contagion. Econom. Rev. 2018, 37, 626–649. [Google Scholar] [CrossRef]
  33. Forbes, K.J.; Rigobon, R. No Contagion, Only Interdependence: Measuring Stock Market Comovements. J. Financ. 2002, 57, 2223–2261. [Google Scholar] [CrossRef]
Figure 1. Installed wind capacity (2023) and new additions (2024) for the top ten countries and the rest of the world. Light bars represent 2023 capacity; dark bars represent 2024 additions.
Energies 18 06328 g001
Figure 2. China’s wind power industry chain sectors.
Energies 18 06328 g002
Figure 3. Daily closing price indices and returns of China’s wind power industry chain sectors from 2015 to 2024, covering eight episodes of wind power policies. The shaded areas refer to eight episodes of wind power policies, shown in Table 3.
Energies 18 06328 g003
Table 1. Classification of China’s wind power policies.
Policy CategoryRegulatory FunctionMain InstrumentsRepresentative Policies
1. Development & Construction PoliciesCapacity planning, project approval, grid coordinationInstallation quotas, siting rules, construction plans1. Notice on national wind power development and construction plan
2. Notice on the Action Plan for Accelerating Green and Development of Power Equipment
3. Notice on Implementing the Wind Power Action for Townships and Villages
2. Industry Support PoliciesManufacturing capability, financial stability, industrial upgradingFiscal support, credit policies, equipment upgrade programmes1. 13th Five-Year Plan for Wind Power Development
2. Notice on Financial Support the Wind and Solar Power Industries
3. Notice on Issuing the Work Plan for the Power Equipment Industry
3. Market Mechanism ReformsPrice signals, renewable consumption obligations, subsidy reductionGrid-parity rules, RPS obligations, electricity trading, quota mechanisms1. Notice on Promoting Subsidy-Free for Wind and Solar Power
2. Notice on Improving the Renewable Energy Power Consumption Guarantee Mechanism
Table 2. The details of China’s major wind power policies from 2015 to 2024.
PolicyIssued DateKey Targets
Notice of the 2016 national wind power development and construction plan17 March 2016
  • 30.83 GW national quota; suspend projects in high-curtailment provinces.
  • Local governments must release plans and complete approvals by 2016.
  • Distributed wind counted in provincial quotas; key bases are exempt and prioritized.
13th Five-Year Plan for Wind Power Development16 November 2016
  • Install 210 GW wind capacity (including 5 GW offshore).
  • Generate 420 TWh (≈6% of national electricity), with curtailment largely resolved.
  • Add 42 GW distributed wind; upgrade 35 GW in the Three North regions.
Notice on Promoting Subsidy-Free and Grid-Parity On-Grid Projects for Wind and Solar Power7 January 2019
  • Advance grid-parity and low-tariff projects without capacity limits, and cancel inactive projects to release market space.
  • Cut non-technical costs—such as land and resource fees—and remove local-content requirements.
  • Guarantee full grid integration, convert curtailment into tradable priority quotas, and expand green-certificate trading.
Notice on Improving the Renewable Energy Power Consumption Guarantee Mechanism18 May 2020
  • The 2020 framework assigns renewable-energy consumption responsibility weights to all provinces.
  • Provincial energy authorities must prepare implementation plans and submit verified compliance reports by February 2021.
  • Grid enterprises are accountable for renewable integration, cross-provincial transmission, and related documentation, with data due in January 2021.
Notice on Financial Support to Promote the Development of the Wind and Solar Power Industries24 February 2021
  • Financial institutions may extend or roll over loans and provide subsidy-backed credit using verified receivables, with all funds managed through closed repayment accounts.
  • Green certificates may be used to offset interest costs, and tariff surcharges must be fully collected and prioritized for grid-parity projects.
  • Pilot programs are encouraged to address subsidy shortfalls, reduce financial risks, and support the orderly expansion of wind and solar industries.
Notice on the Action Plan for Accelerating Green and Low-Carbon Innovation and Development of Power Equipment24 August 2022
  • Optimize the power equipment supply structure to improve transmission and distribution efficiency and support the development of a new-type power system.
  • By 2030, complete over 200 GW of coal-fired flexibility retrofits, ensure equipment capacity to support more than 1.2 TW of wind and solar installations, and provide nuclear equipment for 70 GW.
  • Promote green upgrading of generation, transmission, distribution, and end-use equipment, with targeted breakthroughs in core technologies and key components.
Notice on Issuing the Work Plan for Stabilizing Growth in the Power Equipment Industry9 August 2023
  • Target an annual growth rate of at least 9% in industry revenue and value added for 2023–2024.
  • Leverage major wind, solar, and nuclear power projects to accelerate the deployment of innovative equipment and ensure stable supply.
  • Promote internationalization of China’s power equipment—such as through the Pakistan nuclear project—and strengthen global standard alignment and technical cooperation.
Notice on Implementing the Wind Power Action for Townships and Villages1 April 2024
  • Develop village-level wind projects during the 14th Five-Year Plan, generally capped at 20 MW per village.
  • Pilot “village–enterprise cooperation” and “benefit-sharing” models to strengthen collective revenues and benefit farmers.
  • Streamline approvals, secure land through non-arable sites, and ensure guaranteed grid access and consumption.
Table 3. China’s Wind power policy timeline (pre-policy and policy periods).
Policy TypePre-Policy PeriodPolicy Period
Wind power development and construction
(i) Notice on national wind power development and construction plan8 May 2015–16 March 201617 March–20 July 2016
(ii) Notice on the Action Plan for Accelerating Green and Low-Carbon Innovation and Development of Power Equipment30 June 2021–23 August 202224 August–27 December 2022
(iii) Notice on Implementing the Wind Power Action for Townships and Villages13 December 2023–31 March 20241 April–2 August 2024
Wind power industry support
(i) 13th Five-Year Plan for Wind Power Development21 July–15 November 201616 November 2016–21 March 2017
(ii) Notice on Financial Support to Promote the Development of the Wind and Solar Power Industries19 September 2020–23 February 202124 February–29 June 2021
(iii) Notice on Issuing the Work Plan for Stabilizing Growth in the Power Equipment Industry28 December 2022–8 August 20239 August–12 December 2023
Wind power market mechanism reforms
(i) Notice on Promoting Subsidy-Free for Wind and Solar PowerMar 22, 2017–Jan 6, 20197 January–10 May 2019
(ii) Notice on Improving the Renewable Energy Power Consumption Guarantee Mechanism11 May 2019–17 May 2020 18 May–18 September 2020
Table 4. Descriptive statistics of China’s wind power industry sectors during the pre-policy and policy periods.
MeanStd. DevSkewnessKurtosis ρ ^ k ψ ^ k 12 ψ ^ k 21 ψ ^ k 13 ψ ^ k 31 ψ ^ k 22
Pre-policy is from 8 May 2015 to 16 March 2016
Up-Carbon fiber−0.05 3.35 −0.67 3.28 0.96 −0.67 −0.68 3.15 3.12 3.10
Electric wires & cables−0.13 3.58 −0.75 3.37 0.92 −0.73 −0.71 3.03 2.95 2.90
Fiberglass −0.05 3.33 −0.72 3.63 0.92 −0.69 −0.69 3.20 3.03 3.03
Polyvinyl chloride−0.03 0.99 0.10 7.71 0.28 −0.21 −0.29 2.36 0.91 1.50
Steel−0.28 3.81 −0.58 3.59 0.90 −0.62 −0.65 3.11 2.95 2.94
WP Equipment−0.16 4.00 −0.61 3.33 0.95 −0.62 −0.65 3.16 3.09 3.09
WP parts−0.17 4.32 −0.65 3.07 0.97 −0.66 −0.68 3.02 3.10 3.03
Mid-Wind farm construction−0.35 3.68 −0.42 4.17 0.80 −0.48 −0.52 3.21 2.78 2.93
Down-WP generation−0.12 3.56 −0.71 3.23 1.00 −0.71 −0.71 3.23 3.23 3.23
WP O&M−0.13 4.21 −0.40 3.28 0.82 −0.51 −0.56 2.71 2.75 2.65
Policy is from 17 March 2016 to 20 July 2016
Up-Carbon fiber0.16 1.70 −0.52 5.06 0.93 −0.54 −0.53 4.89 4.82 4.83
Electric wires & cables0.20 1.74 −0.28 4.94 0.93 −0.39 −0.47 4.76 4.74 4.70
Fiberglass 0.18 1.77 −0.32 4.92 0.86 −0.37 −0.40 4.20 4.23 4.02
Polyvinyl chloride0.05 1.16 0.45 3.07 0.03 −0.02 0.13 −0.09 0.32 1.20
Steel0.08 1.60 −0.54 5.26 0.81 −0.57 −0.52 4.41 4.36 4.27
WP Equipment0.15 1.69 −0.26 4.23 0.95 −0.38 −0.46 4.23 4.58 4.35
WP parts0.15 1.83 −0.37 4.95 0.95 −0.40 −0.44 4.69 4.67 4.60
Mid-Wind farm construction−0.07 1.18 −0.45 4.48 0.84 −0.60 −0.57 3.94 4.24 3.96
Down-WP generation0.13 1.55 −0.51 4.92 1.00 −0.51 −0.51 4.92 4.92 4.92
WP O&M0.06 1.61 −0.09 3.57 0.82 −0.36 −0.44 3.16 4.00 3.46
Notes: The policy is selected as Notice of the 2016 national wind power development and construction plan. Market dependence between wind power generation and selected sectors is measured using correlation ( ρ ^ ), co-skewness ( ψ ^ k 12 , ψ ^ k 21 ) from Equations (4) and (5), co-kurtosis ( ψ ^ k 13 , ψ ^ k 31 ) from Equations (7) and (8), and co-volatility ( ψ ^ k 22 ) from Equation (10).
Table 5. Policy contagion effects from the wind power generation to its 9 industry chain sectors under 3 wind power development and construction policies.
StreamSector (j)\Tests C R C S 12 C S 21 C K 13 C K 31 C V 22 S I j S I ¯
(i) Notice on national wind power development and construction plan
Up-Carbon fiber16.73 * 0.36 0.39 5.10 * 4.51 * 4.78 * 67
Electric wires & cables41.27 * 1.57 0.75 3.08 3.94 * 3.48 33
Fiberglass 20.75 * 1.68 1.19 0.56 1.51 0.65 17
Polyvinyl chloride0.51 0.13 1.71 4.97 * 0.00 1.33 17
Steel14.62 * 0.00 0.09 3.67 3.21 3.35 17
WP Equipment39.30 * 0.78 0.45 1.19 2.88 1.80 17
WP parts19.27 * 0.70 0.62 3.90 * 3.55 3.40 33
Mid-Wind farm construction42.53 * 0.00 0.00 0.04 1.42 0.20 17
Down-WP O&M33.67 * 0.47 0.29 0.01 1.04 0.11 17 26
(ii) Notice on the Action Plan for Accelerating Green and Low-Carbon Innovation
Up-Carbon fiber12.96 * 0.52 1.00 3.18 0.04 1.62 17
Electric wires & cables55.10 * 0.54 0.95 0.63 0.83 0.78 17
Fiberglass 0.12 0.75 0.67 7.68 * 0.32 3.20 17
Polyvinyl chloride0.21 3.43 0.02 3.93 * 7.09 * 9.19 * 50
Steel4.67 * 0.72 3.37 5.25 * 0.12 5.84 * 50
WP Equipment13.81 * 0.22 0.39 1.82 0.92 1.38 17
WP parts4.90 * 8.97 * 4.45 * 0.35 0.66 0.05 50
Mid-Wind farm construction11.56 * 0.05 0.28 0.06 0.16 0.01 17
Down-WP O&M0.07 0.61 0.66 0.14 0.12 0.00 0 26
(iii) Notice on Implementing the Wind Power Action for Townships and Villages
Up-Carbon fiber1.94 1.48 1.86 0.34 0.44 0.30 0
Electric wires & cables2.19 2.62 2.33 0.38 0.73 0.62 0
Fiberglass 0.28 9.89 * 6.97 * 0.00 0.11 0.01 33
Polyvinyl chloride1.38 2.12 0.19 4.76 * 0.04 0.00 17
Steel0.35 0.91 2.35 4.21 * 1.17 2.26 17
WP Equipment0.00 1.61 1.89 0.06 0.45 0.23 0
WP parts0.36 0.87 1.51 0.13 0.50 0.31 0
Mid-Wind farm construction5.70 * 0.54 1.50 2.43 0.80 0.88 17
Down-WP O&M2.63 2.65 1.98 0.00 0.24 0.06 0 9
Notes: C R , C S 12 , C S 21 , C K 13 , C K 31 , C V 22 represent contagion tests in (1), (3), (6), (9). The wind power generation as the source market. * denotes significance level at 5%. S I j refers to the policy sensitivity index in (11) and S I ¯ is the mean value of the policy sensitivity index.
Table 6. Policy contagion effects from the wind power generation to its 9 industry chain sectors under 3 wind power industry support policies.
StreamSector (j)\Tests C R C S 12 C S 21 C K 13 C K 31 C V 22 S I j S I ¯
(i) 13th Five-Year Plan for Wind Power Development
Up-Carbon fiber2.71 1.53 0.13 26.86 * 4.39 * 13.97 * 50
Electric wires & cables2.02 0.00 0.03 1.10 0.44 0.53 0
Fiberglass 0.00 0.98 0.19 2.29 0.38 0.07 0
Polyvinyl chloride0.81 0.43 12.08 * 0.04 50.98 * 8.87 * 50
Steel10.93 * 8.09 * 4.53 * 31.74 * 22.55 * 39.20 * 83
WP Equipment1.63 0.20 0.09 3.78 1.35 2.43 17
WP parts3.77 4.84 * 2.57 2.43 1.06 3.47 33
Mid-Wind farm construction4.82 * 6.86 * 0.10 0.02 4.84 * 0.65 50
Down-WP O&M4.56 * 2.08 0.01 0.05 6.83 * 4.90 * 50 37
(ii) Notice on Financial Support to Promote the Development of the Wind and Solar Power
Up-Carbon fiber0.93 2.48 3.61 0.07 0.01 0.01 0
Electric wires & cables0.37 0.00 0.32 1.51 0.61 0.10 0
Fiberglass 0.29 0.37 0.59 0.74 0.40 0.54 0
Polyvinyl chloride0.77 0.08 0.85 0.00 0.21 5.76 17
Steel0.06 0.19 5.95 * 0.33 0.19 0.02 17
WP Equipment1.68 7.51 * 5.87 * 1.79 1.64 1.97 33
WP parts2.57 5.38 * 4.93 * 3.11 2.26 3.12 33
Mid-Wind farm construction2.34 3.34 5.13 * 1.09 1.35 2.61 17
Down-WP O&M0.11 6.44 * 5.13 * 0.12 0.92 0.51 33 17
(iii) Notice on Issuing the Work Plan for Stabilizing Growth in the Power Equipment Industry
Up-Carbon fiber10.44 * 0.03 0.05 0.05 0.24 0.20 17
Electric wires & cables12.57 * 0.27 0.28 0.01 0.03 0.04 17
Fiberglass 0.21 0.75 0.24 1.42 0.00 0.06 0
Polyvinyl chloride5.17 * 0.00 0.04 0.02 0.06 0.71 17
Steel0.08 0.18 0.52 0.14 0.62 1.23 0
WP Equipment7.23 * 0.04 0.09 0.20 0.02 0.10 17
WP parts0.67 0.33 0.35 0.25 0.01 0.11 0
Mid-Wind farm construction9.15 * 0.02 0.01 0.01 0.29 0.16 17
Down-WP O&M0.01 0.38 0.09 0.05 0.42 0.58 0 9
Notes: C R , C S 12 , C S 21 , C K 13 ,   C K 31 , C V 22 represent contagion tests in (1), (3), (6), (9). The wind power generation as the source market. * denotes significance level at 5%. S I j refers to the policy sensitivity index in (11) and S I ¯ is the mean value of the policy sensitivity index.
Table 7. Policy contagion effects from the wind power generation to its 9 industry chain sectors under 2 wind power market mechanism reforms.
StreamSector (j)\Tests C R C S 12 C S 21 C K 13 C K 31 C V 22 S I j S I ¯
(i) Notice on Promoting Subsidy-Free for Wind and Solar Power
Up-Carbon fiber8.33 *1.07 1.64 9.35 *5.18 *6.33 *67
Electric wires & cables5.95 *2.08 2.30 2.40 4.10 *2.92 33
Fiberglass 13.61 *0.70 0.07 12.51 *0.17 6.33 *50
Polyvinyl chloride3.86 *0.87 0.22 0.21 24.30 *1.84 33
Steel0.22 1.08 0.00 16.88 *0.18 7.36 *33
WP Equipment5.22 *1.58 1.97 1.25 2.14 1.12 17
WP parts19.05 *2.12 2.72 13.03 *7.77 *10.19 *67
Mid-Wind farm construction0.25 0.02 0.11 21.79 *2.91 12.54 *33
Down-WP O&M0.42 1.98 1.21 0.18 0.02 0.02 0 37
(ii) Notice on Improving the Renewable Energy Power Consumption Guarantee Mechanism
Up-Carbon fiber14.72 *17.09 *18.70 *113.19 *128.29 *135.41 *100
Electric wires & cables8.74 *7.99 *12.80 *82.32 *108.39 *103.40 *100
Fiberglass 7.10 *19.88 *38.02 *106.66 *120.99 *109.98 *100
Polyvinyl chloride0.50 0.27 3.37 1.39 5.39 *38.02 *33
Steel8.24 *49.67 *34.75 *410.52 *206.13 *341.35 *100
WP Equipment1.56 18.14 *22.95 *54.65 *69.21 *64.33 *83
WP parts13.49 *21.90 *26.57 *33.41 *74.65 *60.71 *100
Mid-Wind farm construction5.61 *32.62 *37.15 *263.30 *188.96 *270.90 *100
Down-WP O&M0.14 21.46 *25.26 *38.55 *75.08 *63.52 *83 89
Notes: C R , C S 12 , C S 21 , C K 13 , C K 31 , C V 22 represent contagion tests in (1), (3), (6), (9). The wind power generation as the source market. * denotes significance level at 5%. S I j refers to the policy sensitivity index in (11) and S I ¯ is the mean value of the policy sensitivity index.
Disclaimer/Publisher’s Note: The statements, opinions and data contained in all publications are solely those of the individual author(s) and contributor(s) and not of MDPI and/or the editor(s). MDPI and/or the editor(s) disclaim responsibility for any injury to people or property resulting from any ideas, methods, instructions or products referred to in the content.