Abstract
Global efforts to achieve carbon neutrality increasingly rely on institutional green policy that reshape corporate environmental behavior. This study examines whether green policy improves corporate environmental performance (EP). Using panel data of the A-share listed firms from 2010 to 2022, we exploit the rollout of pilot cities as a quasi-natural experiment and apply a difference-in-differences (DID) framework, supplemented by double machine learning (DML) and robustness tests. The results show that the New Energy Demonstration City (NEDC) policy notably increases EP, with stronger effects for state-owned enterprises, large firms, and regulated industries. Mechanism analysis indicates that artificial intelligence innovation capacity and the stringency of regional environmental regulation amplify the policy’s effectiveness, revealing a “innovation–regulation” dual mechanism. By focusing on integrated EP rather than single outcomes, this paper extends the literature on green policy instruments. It demonstrates that structural policies combining fiscal incentives and regulatory constraints can correct market failures and foster long-term green transition. Beyond China, the findings provide insights for other developing economies where market-based instruments alone may be insufficient to trigger low-carbon transformation.
1. Introduction
Global climate change and environmental degradation have fundamentally reshaped the trajectory of economic and social development [1]. Rising greenhouse gas emissions not only accelerate global warming but also intensify extreme weather events. These trends pose long-term risks to food security, public health, and industrial resilience [2]. International institutions such as the Intergovernmental Panel on Climate Change (IPCC) and the International Energy Agency (IEA) consistently emphasize that achieving the Paris Agreement’s 1.5–2 °C target requires the deep decarbonization of the energy system and the large-scale deployment of renewable technologies [3,4]. Yet international evidence also reveals that market mechanisms alone are insufficient in the early stages of transition [5]. High capital intensity, technological uncertainty, and entrenched carbon pathways hinder firms’ willingness and ability to transform. These challenges underline the critical role of institutional green policies in correcting market failures, shaping long-term expectations, and guiding firms toward sustainable development [6].
Within this context, corporate EP has emerged as a central measure of gains in energy efficiency [7]. EP encompasses not only reductions in emissions but also improvements in energy efficiency, the adoption of cleaner processes, and the establishment of environmental management systems. Strong EP generates dual benefits: it alleviates local environmental stress while enhancing firms’ competitiveness through green total factor productivity (GTFP) [8]. However, in economies characterized by carbon dependency and weak regulatory enforcement, firms often face insufficient incentives to invest in environmental improvement [9]. This raises a critical academic and policy question: can institutional green policies effectively enhance corporate EP, and under what conditions are they most effective?
China offers a particularly salient case. Occupying the top position in both global energy use and carbon emissions, it has adopted a wide range of policy instruments to advance its “dual carbon” goals [10]. Among them, the NEDC policy represents a distinctive institutional innovation [11]. Launched in 2012 and expanded from 2014 onwards, the policy combines fiscal subsidies, tax incentives, and infrastructure investment with stricter emission standards and performance assessments [12]. Its dual design combines support to lower firms’ transition costs with sanctions to increase the penalties for non-compliance. Importantly, the rollout of pilot cities across regions generates quasi-experimental variation, providing an ideal setting for causal identification of policy impacts on corporate EP [13]. Beyond China, the global landscape of green transition has been shaped by landmark initiatives such as the European Union’s Green Deal and the United States’ Inflation Reduction Act. Both highlight large-scale investment, regulation, and industrial restructuring as key drivers of decarbonization. Yet debates remain over the balance between market-based instruments and institutional interventions. By situating the Chinese NEDC policy within this context, our study extends the literature on structural green policies and offers a comparative perspective on their role in global green transition.
Growing literature has examined the nexus between environmental regulation, green policies, and corporate outcomes [14]. Early studies highlighted the trade-off between compliance costs and competitiveness, while later research emphasized the “Porter Hypothesis,” suggesting that rigorous yet well-crafted regulation may foster innovation [15]. More recent work has diversified to include carbon emissions trading systems (ETS), renewable subsidies, green credit, and environmental taxes [16]. These studies show that policy effects are heterogeneous, shaped by institutional contexts, firm characteristics, and complementary governance arrangements. International evidence also indicates that policy packages combining market incentives with regulatory pressure—such as Germany’s Energiewende or the EU Renewable Energy Directive—are more effective than single-instrument approaches [17,18]. In developing economies, however, empirical evidence remains scarce, particularly at the firm level, where micro-responses to policy interventions determine the sustainable success of the green transition.
Despite these advances, three research gaps remain. First, the majority of prior studies concentrate on single outcomes such as innovation or emission reduction [19], overlooking EP as a multidimensional measure that integrates environmental governance, compliance, and green strategy. This narrow focus limits understanding of policy effectiveness. Second, while China’s ETS and green credit policies have been widely studied, systematic evaluations of the NEDC policy remain scarce, despite its broader structural orientation and integration of technology demonstration [20]. Third, the mechanisms conditioning policy effectiveness—especially the roles of firm-level technological capability and external regulatory environment—remain underexplored in the Chinese context, even though international experience highlights their importance. Addressing these deficiencies is crucial for advancing both theoretical understanding and policy design.
This paper contributes to filling these gaps by examining the impact of the NEDC policy on corporate EP using a quasi-natural experiment. Specifically, we address three questions: (1) Does the NEDC policy significantly improve corporate EP? (2) Does firms’ artificial intelligence (AI) innovation capacity amplify the policy’s effect? (3) Does the stringency of regional environmental regulation shape the boundaries of policy effectiveness? To answer these questions, we compile a firm–city panel dataset covering all Chinese A-share listed firms from 2010 to 2022. Employing a difference-in-differences (DID) framework, supplemented with double machine learning (DML) and extensive robustness tests, we identify the causal impact of the policy while accounting for complex confounders.
Our approach provides several contributions. First, we extend the evaluation of green policies by focusing on EP as an integrated outcome, moving beyond fragmented indicators. This offers a fuller understanding regarding the ways in which structural policies influence corporate environmental governance and strategy. Second, by exploiting the staggered implementation of the NEDC policy, we provide credible causal evidence of its effects at the firm level, complementing existing studies that rely primarily on aggregate data. Third, we develop a “policy–innovation–regulation” analytical framework that explains heterogeneous policy impacts: AI innovation enhances firms’ absorptive capacity—the ability to absorb and apply external knowledge or to translate external incentives into green upgrading—while regulatory stringency conditions the effectiveness of institutional arrangements. This perspective integrates the capability-based view with institutional complementarity theory, offering new perspectives on how internal and external factors interact to shape policy outcomes. Fourth, by situating the findings in international context, we highlight their broader relevance. Unlike price-based tools including market-based mechanisms like carbon trading and environmental taxation, the NEDC policy represents a structural and institutional approach particularly suitable for developing economies with incomplete markets. The Chinese experience thus provides valuable lessons for other countries seeking to balance growth with low-carbon transformation.
The remainder of the paper proceeds as follows. Section 2 introduces the policy context and develops theoretical hypotheses. Section 3 describes the empirical model, variable construction, and data. Section 4 reports empirical results. Section 5 discusses the theoretical contributions, limitations and future research, while Section 6 concludes with conclusions and policy implications.
2. Policy Context and Theoretical Hypothesis
2.1. Policy Context
China’s renewable energy policy has evolved through a gradual process of legal institutionalization, policy experimentation, and strategic upgrading [21]. The Renewable Energy Law of 2006 laid the legal foundation, followed by the Medium- and Long-Term Renewable Energy Development Plan and successive Five-Year Plans, which elevated renewable energy to a national strategic priority. These top-level designs not only signaled the government’s long-term commitment but also created institutional space for pilot-based experimentation. Within this trajectory, the NEDC policy, launched in 2012 and implemented in 2014, marked a critical institutional innovation. The policy approved 81 cities and 8 industrial parks as the first batch of pilots, adopting a “pilot first, phased expansion” approach [22]. The distribution map of NEDC policy is shown in Figure 1. The spatial distribution of New Energy Demonstration Cities exhibits the characteristics of ‘coastal concentration, inland inclusion, and gradual progression,’ which not only highlights the leading role of the eastern region but also promotes green transition in central and western areas.
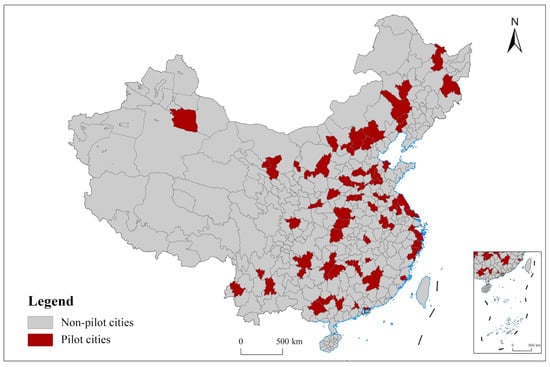
Figure 1.
NEDC policy distribution.
NEDC policy institutional logic combines incentives and constraints: On the incentive side, fiscal subsidies, tax relief, and infrastructure support lowered the threshold of adopting renewable energy and green technologies, thereby alleviating financing bottlenecks and reducing transition risks [23]. On the constraint side, stricter emission standards and environmental performance assessments increased compliance costs, compelling firms to strengthen environmental management, enhance energy efficiency, and upgrade production processes. This dual-track mechanism of “soft support with hard enforcement” provided both short-term motivation and long-term expectations for firms’ green transition. Importantly, the staggered rollout across regions was driven by national strategic considerations rather than firm-level conditions, generating exogenous variation that constitutes a quasi-natural experiment for identifying causal effects.
Internationally, the NEDC policy shares similarities with Germany’s Energiewende and the EU Renewable Energy Directive, both of which combine fiscal incentives with regulatory standards [24]. Yet it also reflects China’s unique institutional features: a strong state-led approach, heavy reliance on pilot experimentation, and integration of industrial restructuring with technology demonstration [25]. This makes the NEDC policy not only a domestic instrument for advancing the “dual carbon” goals but also a case with broader relevance for emerging economies where market-based instruments alone may be insufficient.
2.2. Theoretical Hypothesis
2.2.1. NEDC Policy and EP
In recent years, the global green transition has entered a deeper stage. As carbon reduction targets become increasingly stringent, how firms improve their EP under institutional constraints and market pressures has become a central concern for both scholars and policymakers [26]. Enhancing EP involves more than reducing pollutant emissions; it also entails improving energy efficiency, strengthening environmental management systems, and diffusing cleaner production practices. Such improvements alleviate local ecological pressures while boosting green total factor productivity (GTFP), thereby creating economic–environmental synergies. Yet firms often face a dilemma: on the one hand, green investments and technological transformation require substantial resources; on the other hand, market forces alone provide insufficient incentives at the early stage, leaving firms with little endogenous motivation to shoulder environmental responsibilities [27]. Whether institutional policies can correct such market failures is thus crucial for achieving sustained improvements in EP.
The NEDC policy was introduced in China precisely in this context. Unlike price-based tools such as emissions trading, the NEDC policy emphasizes structural guidance and institutional innovation to drive green transition. It lowers firms’ marginal costs of adopting clean energy through fiscal subsidies and tax incentives, while simultaneously increasing compliance costs through regulatory pressure, thereby forming a dual mechanism of supportive measures and regulatory pressure. This policy design not only creates external conditions for adopting green technologies but also provides stable expectations that guide firms to integrate green transition into long-term strategic planning [28]. NEDC policy helps firms internalize previously neglected environmental costs; from institutional theory [29], its stability and continuity create a predictable institutional environment, encouraging firms to regard green transition not as a short-term compliance task but as a strategic commitment. International experience supports this logic: Germany’s Energiewende and the EU Renewable Energy Directive both show that combining fiscal incentives with regulatory constraints significantly improves corporate environmental behavior. Accordingly, we propose:
H1:
The NEDC policy significantly improves environmental performance.
2.2.2. NEDC Policy, AI Innovation and EP
The effects of the NEDC policy are unlikely to be the same for all firms. The extent to which a firm can respond to external incentives depends heavily on its internal resources and capacities, particularly its level of technological innovation [30]. AI innovation is emerging as a key determinant of EP [31]. AI technologies have unique advantages in energy dispatch, production process optimization, and emission control. They can identify inefficiencies through real-time monitoring and algorithmic analysis, thereby achieving more efficient emission reductions at lower costs. More importantly, AI innovation alters firms’ ability to absorb and translate policy incentives into tangible outcomes [32]. From a capability-based view, firms’ dynamic capabilities determine whether they can convert external policy opportunities into sustained competitive advantages. Firms with stronger AI innovation are more likely to capitalize on the NEDC policy to develop green upgrading paths, whilst those lacking such capacity may fail to benefit or even face greater transformation risks.
International evidence reinforces this mechanism. The EU Green Deal highlights the synergy between digitalization and green policy, and Nordic countries have widely integrated AI into renewable energy and smart grid industries [33]. This digital–green integration has made the green transition not just a passive response to external pressure but an active strategic choice for firms. Thus, we hypothesize:
H2:
AI innovation moderates the relationship between the NEDC policy and environmental performance.
2.2.3. NEDC Policy, Environmental Regulation and EP
In addition to internal capabilities, the external institutional environment is a crucial boundary condition for policy effectiveness [34]. China’s regions vary considerably in regulatory stringency, creating a natural context to examine the interaction between policies and institutional environments. In regions with lax regulation, firms may retain free-riding incentives and fail to invest heavily in green transformation despite policy support. Conversely, in strictly regulated regions, higher compliance costs and reputational risks make green investment more urgent and necessary. When stringent regulation interacts with the NEDC policy, firms experience both external pressure and institutional support, which together create stronger incentives for deep green transformation [35].
This logic aligns with institutional complementarity theory [36], which posits that policy tools produce greater effects when they are complementary in objectives and mechanisms. It also resonates with institutional pressure theory, which suggests that regulatory, normative, and cognitive pressures can collectively transform firms’ environmental behaviors from short-term compliance to long-term strategic action. International evidence provides further support: studies of OECD countries show that strict regulation combined with green subsidies accelerates energy restructuring and cleaner production [37]. Whereas Germany’s Energiewende and Nordic carbon tax regimes illustrate that combining incentives with constraints is essential for sustained improvements in EP. In the Chinese context, we therefore expect:
H3:
Environmental regulation moderates the relationship between the NEDC policy and environmental performance.
In sum, this study develops a “policy–innovation–regulation” framework. Specifically, policy incentives stimulate firms’ innovation activities, while regulatory pressure enforces compliance and amplifies innovation effects. This dual mechanism of innovation and regulation helps explain the heterogeneous firm responses to green policies. The NEDC policy creates the external conditions for green transition through stimuli and pressures. Firms’ AI innovation determines their absorptive capacity to translate policy support into concrete performance improvements. Regional regulation defines the institutional boundary of effectiveness. The interaction of these three elements explains not only the average impact of the NEDC policy but also the heterogeneous outcomes across firms and regions. Figure 2 shows the mechanism diagram.
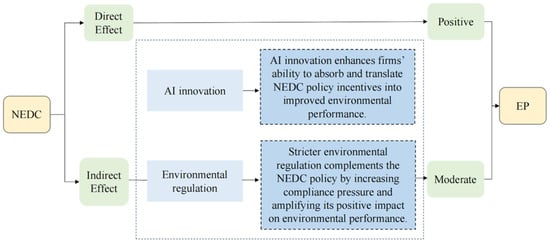
Figure 2.
Mechanism diagram.
3. Model and Variables
3.1. Variable Construction
3.1.1. Dependent Variable
The dependent variable is environmental performance (EP), which reflects the overall capacity of firms in environmental governance and green transition. EP is chosen because it provides a multidimensional measure of firms’ performance in environmental management, institutional development, and external certification. Compared with single indicators such as emission reductions or green patents, EP better captures the comprehensive responsibility and governance level of firms, aligning with this study’s focus on comprehensive performance.
Following prior research [38], we construct the EP index using the ENV database provided by CSMAR. A composite scoring method is applied, covering nine dimensions: (1) whether the firm has articulated an environmental protection philosophy; (2) whether it has set explicit environmental targets; (3) whether an environmental management system has been put in place; (4) whether it has carried out environmental training programs; (5) whether it has implemented specific environmental initiatives; (6) whether it has developed emergency response mechanisms for environmental incidents; (7) whether it complies with the “three simultaneities” requirement in project construction; (8) whether it has received honors or awards for environmental protection; and (9) whether it is certified under the ISO14001 environmental management system. Each dimension scores 1 if met and 0 otherwise, with the sum used as the proxy for firm-level EP.
The validity of this measure lies in its ability to cover key aspects of corporate environmental governance, ranging from philosophy and targets to institutional arrangements, emergency mechanisms, and external recognition. This provides a full chain of assessment from institutional design to implementation, avoiding the bias that may arise from relying solely on outcome-based indicators. Moreover, the index aligns well with international frameworks such as ISO14001 and the GRI standards, ensuring comparability and external validity in academic research. Therefore, using EP as the dependent variable ensures both consistency with frontier literature and relevance to the comprehensive impacts of the NEDC policy on firms’ environmental governance and green development [39]. To address potential measurement bias, we also conduct a robustness test using the Bloomberg ESG Environmental Responsibility Score, which reflects international disclosure standards and enhances external validity.
3.1.2. Independent Variable
The NEDC policy integrates both energy restructuring and green technology promotion. Compared with single policy instruments such as emissions trading systems (ETS) or environmental taxes, it more comprehensively reflects China’s green policy orientation under the dual carbon strategy and thus serves as a representative case for examining the micro-effects of structural green policies [40].
In constructing variables, we take the official list of pilot cities as the reference and industrial parks published by the National Energy Administration. Businesses entering the pilot program cities were coded as the treatment groups, while others were coded as controls. The policy dummy is equal to 1 in the year the city first included in the NEDC program and in all subsequent years, otherwise it is 0. The specification captures the staggered and regionally differentiated implementation of NEDC policies, creating the conditions for quasi-natural experimental design.
3.1.3. Moderating Variables
To explore the mechanisms and boundary conditions underlying the NEDC policy, we introduce two moderating variables.
Artificial intelligence innovation (AI): This variable is chosen because AI technologies play a distinctive role in energy monitoring, process optimization, and pollution abatement. AI not only reduces the marginal cost of green transition but also enhances firms’ ability to absorb and utilize external policy resources, making it a crucial capacity for translating policy incentives into improved EP [41]. Firms with stronger AI innovation are more likely to achieve rapid green upgrading under policy support, whereas those with weaker capabilities may struggle to fully benefit. To measure firms’ AI innovation capacity, we use the number of AI-related invention patents filed each year [42]. Specifically, we retrieve patents from the China National Intellectual Property Administration database, identifying those whose titles or abstracts contain keywords such as “artificial intelligence,” “deep learning,” or “image recognition,” and then aggregate them by firm-year and apply a logarithmic transformation. This measure effectively captures firms’ investment in and accumulation of AI research and application, serving as an important dimension of both technological capability and green transition potential.
Environmental regulation (Regulation): This variable reflects the external institutional environment, which shapes firms’ compliance boundaries and may significantly affect policy effectiveness [43]. Stringent regulation increases compliance costs and reputational risks, motivating firms to intensify environmental investment under policy incentives, while lax regulation may allow firms to free ride, even when receiving policy support. Thus, environmental regulation and the NEDC policy are complementary, jointly forming a dual mechanism of hard constraints with soft incentives. We measure regulation using a text-analysis approach [44]. Specifically, we calculate the frequency of environment-related terms (e.g., “pollution control,” “energy conservation and emission reduction,” “green development”) in provincial government work reports and divide it as a proportion of the report’s total word count. This measure captures the relative policy salience of environmental governance on the government agenda, thereby reflecting regulatory stringency at the regional level. Compared with traditional indicators such as environmental investment or emission standards, this text-based measure better captures dynamic changes in policy orientation and provides a closer approximation of institutional constraints faced by firms.
3.1.4. Control Variables
To limit omitted-variable bias, we control for firms’ financial status, growth characteristics, and corporate governance structure.
For financial status, we include leverage (Lev) and return on equity (ROE). Leverage is measured as the ratio of total liabilities to total assets. Highly leveraged firms may reduce environmental investment due to financial pressure, though debt constraints may also enforce stricter compliance [45]. ROE is measured as the ratio of net profit to shareholder equity, reflects firms’ financial health: more profitable firms usually possess stronger resources to invest in environmental governance [46].
For growth characteristics, we include the cash flow ratio (Cashflow), fixed asset ratio (Fixed), and revenue growth rate (Growth). Cashflow is defined as net cash flow from operating activities relative to total assets, reflecting liquidity and firms’ ability to finance green investment [47]. Fixed is measured as net fixed assets divided by total assets, capturing potential path dependence and transition costs in green upgrading [48]. Growth is measured as the increase rate of business revenue, accounting for the potential influence of business expansion on EP [49].
For the governance structure, we control for board size (Board), independent director ratio (Indep), CEO duality (Dual), management fee ratio (Fee), and shareholding ratio of the largest shareholder (Top1). Board is measured as the natural logarithm of board members, where larger boards may strengthen oversight but reduce decision efficiency [50]. Indep is defined as the proportion of independent directors relative to the total number of board members, reflecting the role of external monitoring in environmental responsibility [51]. Dual is a dummy equal to 1 if the chairman and CEO positions are held by the same person, otherwise 0, indicating potential concentration of power and weakened oversight [52]. Fee is measured as the ratio of management expenses to operating income, which may either crowd out environmental investment or indicate a stronger emphasis on institutionalized management [53]. Top1 is measured as the shareholding percentage of the largest shareholder divided by 100, which may exert either a positive monitoring effect or a negative tunneling effect [54]. Variable definitions are summarized in Table 1.

Table 1.
Variable definitions.
3.2. Data Specification
The sample covers all Chinese A-share listed firms from 2010 to 2022. Data for 2023–2024 were not fully available or contained missing values, making it difficult to ensure consistency. Moreover, given the lagged effects of the NEDC policy, a short observation window may underestimate its impact. Firm-level data are primarily sourced from the CSMAR database, with EP indicators constructed from its ENV sub-database and financial data drawn from the CSMAR financial statement database. Data on AI are collected from the China National Intellectual Property Administration patent database, while Regulation is measured through text analysis of provincial government work reports. City-level policy information is sourced from the official list of NEDC released by the National Energy Administration. Since the first batch of demonstration cities was approved in 2014, the policy has been gradually extended to other regions. Additional firm-level data are supplemented by the CSMAR and Wind databases. To mitigate the influence of outliers, we apply logarithmic transformation to part variables. All selected variables were tailed at the 1% level before regression.
3.3. Descriptive Statistics
Table 2 summarizes the descriptive statistics of the principal variables. The mean corporate EP is 1.807, with a maximum of 9, a minimum of 0, and a median of 1. This result implies that the general level of EP among Chinese firms remains relatively low, with substantial heterogeneity across firms. While a small number of firms demonstrate strong performance in environmental management, the majority remain at a modest level, underscoring the uneven distribution of green governance capacity. The NEDC variable has a mean of 0.28, suggesting that about 28% of firms fall within NEDC cities. This reflects the phased and regionally differentiated rollout of the policy, providing suitable conditions for a DID-based quasi-natural experiment. For the moderating variables, AI has a mean of 0.11 and a median of 0, suggesting that most firms have not accumulated significant AI-related patents, while a few exhibits clear technological advantages, creating a long-tail distribution. Regulation has a mean of 0.003, with a maximum of 0.006. Although the variation appears small in magnitude, it captures meaningful cross-regional differences in regulatory emphasis. Among control variables, Lev has a mean of 0.404, ROE has a mean of 0.072, and Cashflow has a mean of 0.047, all within reasonable ranges yet with notable dispersion, reflecting differences in firms’ financial soundness. Board size (Board) and the proportion of Indep comply with corporate governance norms of listed firms. Top1 averages 0.334, suggesting relatively high ownership concentration in most firms.
Table 2.
Descriptive statistics.
Overall, three key features emerge from the descriptive statistics: EP levels are generally low and highly heterogeneous, highlighting the necessity of policy intervention; AI innovation and environmental regulation exhibit structural disparities, laying the foundation for mechanism and heterogeneity analysis; and the distribution of control variables appears well balanced, enhancing the robustness of subsequent empirical estimates.
3.4. Model
3.4.1. Main Models
We exploit the rollout of the NEDC policy as a quasi-natural experiment and estimate its causal effect on EP using a difference-in-differences (DID) framework. The baseline model is specified as:
Specifically, and denote firm and year, respectively. represents the environmental performance of firm in year . The core explanatory variable is the NEDC policy, measured by the interaction term , where is a dummy equal to 1 if firm is located in an NEDC and 0 otherwise, and is a time dummy equal to 1 for years 2014 and onwards and 0 otherwise. Thus, takes the value of 1 if the policy is in effect in firm ’s location in year , and 0 otherwise. denotes a vector of control variables. , , and represent firm fixed effects, industry fixed effects, and year fixed effects, respectively, while the random error term.
3.4.2. Moderating Models
To examine moderating mechanisms, we extend the model as:
where represents either AI or Regulation. The coefficient captures the average effect of the NEDC policy on EP, while measures the direct effect of the . The key parameter of interest is , indicates whether these factors amplify the policy effect. Other terms are defined as in the baseline model.
4. Result Analysis
4.1. Baseline Regression
Table 3 reports the DID estimates of the NEDC policy on EP. Across all model specifications, the NEDC coefficient remains positive and significant. After controlling for firm, industry, and year fixed effects, the estimated effect stabilizes at around 0.159–0.167. This magnitude is economically meaningful. Considering that the mean EP score in our sample is 1.807, the policy effect corresponds to an improvement of nearly 9% relative to the baseline level. In other words, locating in an NEDC after policy implementation raises a firm’s probability of establishing environmental management systems, ISO certification, or green disclosure practices by a considerable margin. Such improvements reflect not only compliance adjustments but also strategic integration of environmental governance into corporate decision-making.
Table 3.
Benchmark regression results.
The results confirm H1: The NEDC policy significantly improves EP. Importantly, the positive effect persists across alternative specifications, indicating that the result is not driven by omitted firm-level characteristics or common shocks. The finding aligns with the “incentives with constraints” logic: fiscal subsidies and green finance reduce transition costs, while stricter regulatory pressure raises non-compliance costs, jointly creating a stable environment that motivates firms to upgrade environmental management and disclosure practices.
4.2. Parallel Trend Test
Before applying the DID approach for causal identification, it is essential to check if the treatment and control groups exhibited similar trends prior to the policy. To this end, we employ an event-study specification. We introduce time dummies for the years before and after the policy and plot the dynamic effects (see Figure 3). The results show that before the NEDC policy was introduced, all coefficients hover around zero, with confidence intervals mostly overlapping zero. Indicating an absence of significant differences in corporate EP trends prior to the policy between the two groups. This provides strong support in evidence of the DID design’s validity. Beginning with the policy implementation year, the coefficients steadily shift to significant positive values. This dynamic pattern confirms the credibility of the DID identification and further reveals the lagged effect of the green policy. In the short run, improvements are mainly realized through enhanced compliance and disclosure practices, while in the longer run they stem from increased green investment and technological upgrading. In sum, the parallel trend test not only validates the robustness of the identification strategy but also demonstrates that the NEDC policy exerts significant and persistent positive impacts on EP, thereby offering important temporal evidence for the subsequent mechanism analysis.
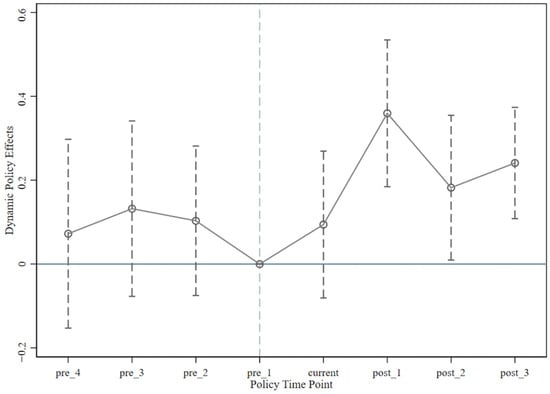
Figure 3.
Parallel trend test.
4.3. Placebo Test
To confirm that the baseline regression results are not driven by model specification or sample structure but are attributable to the NEDC policy, we conduct a placebo test. Specifically, we randomly reassign the treatment group and policy timing 500 times, re-estimate the policy effect, and plot the kernel density distribution of the simulated coefficients (see Figure 4). The results show that most randomized coefficients cluster symmetrically around zero, with a mean close to zero, suggesting that without actual policy intervention, no systematic or significant effect emerges. On the contrary, the true DID coefficient from the baseline regression lies far to the right of the simulated distribution, clearly separated from zero and located in the tail region. This divergence suggests that the positive association between the NEDC policy and EP is not randomly driven but reflects a genuine causal impact of the policy. Overall, the placebo test reinforces the robustness of the baseline findings, indicating that the NEDC policy has significantly improved firms’ EP through institutional incentives and the optimization of resource allocation.

Figure 4.
Placebo test.
4.4. Robustness Test
4.4.1. PSM-DID
To address possible estimation bias due to sample selection, we further apply the propensity score matching combined with difference-in-differences (PSM-DID) approach. Figure 5 illustrates the standardized bias of covariates before and after matching. Prior to matching, notable imbalances exist across covariates, whereas after employing nearest-neighbor, radius, and kernel matching, the standardized biases converge substantially toward zero, indicating that the comparability between the treatment and control groups is significantly improved. Table 4, Columns (1)–(3), report the PSM-DID estimation results. Across all three matching methods, the NEDC coefficients remain positive and statistically significant: 0.140 for nearest-neighbor matching (significant at the 5% level), and 0.167 and 0.168 for radius and kernel matching (both significant at the 1% level). These results are highly consistent with the baseline regressions, confirming that the NEDC policy robustly promotes improvements in EP. In sum, the PSM-DID test reaffirms the validity of the causal inference after addressing sample comparability, providing further support for H1.
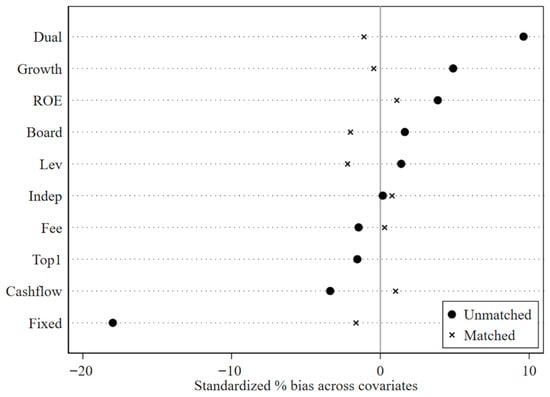
Figure 5.
Balance test.
Table 4.
Robustness test 1.
4.4.2. Removal of Policy Interference
To ensure that the identified effects are not confounded by other green policies, we control for two potentially overlapping interventions: the green credit policy (GRP) and the pilot emissions trading scheme (ETS). Results are presented in Table 4, Columns (4)–(6). Regardless of whether these policies are included, the NEDC coefficients remain positive and significant at the 1% level: 0.167 in Column (4), 0.168 in Column (5), and 0.156 in Column (6). Further inspection shows that the green credit variable does not exert a significant effect, implying limited direct influence on firm-level EP during the sample period. The ETS coefficient is positive but insignificant. This suggests that while market-based emission reduction mechanisms impose certain constraints, their marginal effect does not diminish the impact of the NEDC policy. These findings highlight the independent effectiveness of the NEDC policy in improving firms’ EP, even in the presence of concurrent policy regimes. More broadly, they provide empirical support for the policy’s structural and technological orientation and offer reference points for the coordination and integration of future green policies.
4.4.3. Alternative Variable Test
To further verify the robustness of the dependent variable, we adopt an alternative measure of EP from Bloomberg’s ESG database—specifically, the Environmental Responsibility Score. Compared with the CSMAR-ENV index, this measure reflects international disclosure standards and mitigates concerns about database-specific biases. Table 4, Column (7) reports the results using the alternative measure. The NEDC coefficient remains positive at 0.303 and significant at the 1% level, confirming that the estimated effect of the NEDC policy is robust to different measures of EP. This robustness check demonstrates that the policy enhances not only in emission reduction or innovation, but also in broader dimensions of environmental responsibility, including institutional building and external recognition.
These findings provide additional support for H1. They also resonate with international experience. OECD and EU studies suggest that when green policies simultaneously strengthen firms’ internal systems and external certifications, firms are more likely to form stable long-term expectations for green transition and receive positive signals from capital markets and the public. Thus, the alternative measure test provides strong evidence of the effectiveness of the NEDC policy, while offering valuable insights for other emerging economies: combining institutional constraints with practical incentives can generate greater improvements in corporate environmental outcomes and social legitimacy.
4.4.4. Alternative Estimation Methods
To further ensure the robustness of our findings, we re-estimate the policy effect using three double machine learning (DML) approaches: Random Forest, Lasso regression, and Gradient Boosting, based on the baseline DID framework. This approach is particularly suited to the research context for two reasons. First, the determinants of firms’ EP are complex and high-dimensional, encompassing financial conditions, corporate governance, industry characteristics, and macro-institutional factors. Traditional linear models may suffer from omitted variable bias or misspecification. Second, the transmission mechanisms of the NEDC policy may involve nonlinearities and variable interactions that conventional DID models cannot fully capture. DML approaches are advantageous in variable selection, dimensionality reduction, and nonlinear modeling, thereby offering more comprehensive control for potential confounders.
Table 5 reports the estimation results. Across all three methods, the NEDC coefficients remain significantly positive and consistent with the baseline regressions. Specifically, the estimated coefficients are 0.2888, significant at the 1% level for Random Forest, 0.1870, 1% level for Lasso regression, and 0.2601, 1% level for Gradient Boosting. These results indicate that the positive effect of the NEDC policy on EP is robust even under more flexible and complex estimation frameworks. Interestingly, the coefficients from Random Forest and Gradient Boosting are larger, suggesting that once potential nonlinearities and interaction effects are considered, the marginal impact of the policy may be further amplified. In comparison, the Lasso regression yields relatively smaller but still significant estimates, confirming the robustness of the findings under a sparse model specification. Overall, the DML results demonstrate that the conclusions of this study are not driven by specific model assumptions but are consistently supported across different estimation strategies. This reinforces the credibility of the causal identification and highlights the institutional effectiveness of the NEDC policy in promoting improvements in EP.
Table 5.
Robustness test 2.
4.5. Mechanism Analysis
To further identify the channels through which the NEDC policy enhances EP, we examine two moderating factors highlighted in the theoretical framework: firms’ endogenous innovation capability and the external institutional environment. Specifically, we focus on the role of artificial intelligence (AI) innovation and regional environmental regulation intensity (Regulation) in shaping policy effectiveness. This analysis uncovers the internal logic of policy transmission and explains the heterogeneous responses of firms across different contexts. The results are presented in Table 6.
Table 6.
Moderate regression results.
4.5.1. AI Innovation
Columns (1) and (2) show that AI innovation alone has a negative coefficient of –0.109 and is significant at the 5% level, whereas the interaction term NEDC × AI is positive with a coefficient of 0.378 and significant at the 1% level. This pattern of a negative main effect but positive interaction highlights the complexity of technological innovation in the context of green transition. The negative coefficient reflects the innovation conversion lag theory: AI R&D is inherently risky, capital-intensive, and characterized by long cycles. Without supportive policies, R&D investment may strain financial resources and crowd out short-term environmental investment, thereby weakening EP. This finding is consistent with the concept of absorptive capacity, which argues that technology investment translates into performance gains only when matched with an enabling institutional environment.
Relative to this, the significantly positive interaction suggests that policy provides the necessary conditions for technological conversion. The NEDC policy reduces the marginal cost of green transition through fiscal subsidies and green finance. At the same time, regulatory pressure creates stable demand for low-carbon production. Together, these factors accelerate the deployment of AI innovation in energy management, process optimization, and pollution abatement. In other words, the policy bridges the gap between “R&D and application,” turning AI from a short-term burden into a long-term dividend. This supports H2: AI innovation moderates the relationship between the NEDC policy and environmental performance.
From a managerial perspective, this implies that the effectiveness of green strategies depends not only on R&D intensity but also on aligning innovation activities with external policy frameworks. Firms that integrate AI into energy monitoring, emissions control, and supply chain optimization are better positioned to translate policy incentives into sustained EP improvements. Thus, AI innovation functions as a “policy accelerator,” transforming external incentives into internal drivers of green transition.
4.5.2. Environmental Regulation
Turning to columns (3) and (4), the results reveal that the coefficient of Regulation alone is –0.397 and significant at the 5% level, implying that stringent regulation without complementary policies may increase compliance costs and suppress firms’ environmental performance. More importantly, the coefficient of NEDC is –0.309 and significant at the 1% level when Regulation and its interaction are included, showing that in regions with lax regulation, the NEDC policy alone may fail to promote EP and could even generate negative effects. By contrast, the interaction between NEDC and Regulation is 1.492 and significant at the 1% level, demonstrating that once regulatory stringency increases, the overall impact of the NEDC policy turns strongly positive. This illustrates a dual mechanism: while regulation in isolation raises compliance costs and may suppress green investment, its combination with the NEDC policy creates a complementary framework of “hard constraints and soft incentives.” Under such conditions, firms benefit from policy resources while simultaneously facing higher penalties for non-compliance, resulting in stronger incentives for environmental investment and governance.
This finding confirms H3: Environmental regulation moderates the relationship between the NEDC policy and environmental performance. It also resonates with institutional complementarity theory, which argues that policies are most effective when supportive measures and regulatory enforcement are jointly applied. International experience, such as the OECD’s mixed use of subsidies and penalties or Germany’s Energiewende, similarly shows that green transformation is most successful when reward and sanction mechanisms operate in tandem. At the firm level, this suggests that green strategies should not rely solely on policy incentives but also account for the compliance pressures stemming from external regulation. In strictly regulated regions, firms need to anticipate and front-load green investments to convert policy incentives into competitive advantage. In more weakly regulated regions, however, over-reliance on policy incentives may lead to insufficient marginal effects, undermining transition progress.
Overall, the mechanism analysis reveals that the effectiveness of the NEDC policy in improving EP is jointly shaped by internal innovation capacity and the external regulatory environment. AI innovation, while potentially burdensome when undertaken in isolation, becomes a powerful amplifier of policy incentives under the right institutional setting. Similarly, strict environmental regulation, though costly on its own, magnifies the marginal effect of policy by reinforcing compliance incentives. Together, these factors form a “innovation–regulation” dual mechanism, referring to the joint effect of policy-induced innovation incentives and regulatory pressure, that enables both short-term compliance improvements and long-term green investments. This provides empirical support for H2 and H3 and highlights the broader implication that the success of green policies ultimately depends on the synergy between firms’ endogenous capabilities and external institutional arrangements.
4.6. Heterogeneity Analysis
Although the NEDC policy significantly improves EP on average, its effects are not evenly distributed across all firms. Differences in institutional attributes, resource endowments, and external regulatory environments shape the transmission of policy incentives, leading to heterogeneous outcomes. Such heterogeneity not only reveals the boundaries of policy effectiveness but also offers insights into the interaction between institutional design and firm behavior. From a practical perspective, identifying these heterogeneous responses is crucial for tailoring policies and avoiding “one-size-fits-all” approaches. Based on this logic, we examine heterogeneity along three dimensions: ownership type, firm size, and industry regulation. The results are reported in Table 7.
Table 7.
Heterogeneity analysis results.
4.6.1. Institutional Attributes
Ownership structure is a fundamental institutional attribute shaping firms’ environmental strategies [55]. State-owned enterprises (SOEs), under national strategic mandates, often bear stronger social responsibilities and act as exemplars in policy implementation, whereas non-SOEs are primarily constrained by market forces and profit incentives. Comparing these groups helps reveal how institutional attributes mediate policy effects. The results in columns (1) and (2) show that the policy coefficient for SOEs reaches 0.621, significant at the 1% level, much higher than the 0.221 for non-SOEs. This pattern reflects the “policy pressure–resource advantage” logic: SOEs benefit from stronger institutional pressure and lower financing costs, making them more responsive to policy incentives. Non-SOEs also respond positively, but their effect size is smaller, constrained by capital limitations and profitability concerns.
These findings suggest differentiated policy strategies. On the one hand, SOEs should continue to serve as green benchmarks to drive sector-wide upgrading. On the other hand, non-SOEs require additional financial and institutional support—such as green credit expansion, tax incentives, or subsidy programs—to lower transition costs and strengthen endogenous motivation. A dual approach of “demonstration by SOEs and incentives for non-SOEs” would ensure broader coverage and effectiveness of the NEDC policy.
4.6.2. Resource Endowments
Firm size reflects differences in resource endowments, organizational capacity, and absorptive ability [56]. Large firms, with greater capital reserves and managerial capacity, are better positioned to translate policy incentives into green investments and technological upgrading. By contrast, while smaller firms often face financing constraints and higher relative costs. Results in columns (3) and (4) indicate that the policy coefficient for large firms is 0.656, significant at the 1% level, substantially higher than the 0.155 observed for small firms. This suggests that the NEDC policy disproportionately benefits large firms, reinforcing the Matthew effect pattern.
From an economic perspective, firm size shapes the balance between policy incentives and market constraints. For large firms, the policy consolidates green competitive advantages, generating positive feedback between resource reallocation and market expansion. Small firms, however, may lack the absorptive capacity to capitalize on policy opportunities, leaving them vulnerable to a “policy underutilization” trap. This highlights the need for policies that balance these effects. In addition to leveraging the demonstration role of large firms, targeted support—such as green financing guarantees, shared technology platforms, or green supply chain alliances—should be provided to lower transition barriers for smaller firms, ensuring inclusivity and avoiding structural polarization in the green transition.
4.6.3. External Regulatory Environment
Differences in the external regulatory environment also play a critical role in shaping the effectiveness of green policies [57]. Unlike the intensity of environmental regulation at the regional level, industry control here mainly refers to the position of the industry itself in the national policy and regulatory system. Firms in regulated industries typically face stricter environmental standards and higher compliance costs, making their environmental behavior more responsive to both policy incentives and regulatory pressure. In comparison, firms in unregulated industries operate under relatively weaker external constraints and may therefore exhibit a lower level of responsiveness to policy interventions. Dividing the sample into regulated and unregulated industries allows us to examine whether the NEDC policy has a targeting effect.
Columns (5) and (6) of Table 7 show that the policy coefficient is 0.533 for regulated industries, significant at the 1% level, which is substantially higher than the coefficient of 0.211 for unregulated industries. This difference indicates that the NEDC policy generates stronger environmental performance improvements in regulated sectors, consistent with the theory of institutional complementarity: when policy tools and regulatory pressures align in their objectives and mechanisms, their joint effect exceeds that of either tool alone. The synergy between policy incentives and regulatory constraints effectively lowers the marginal cost of green transformation while raising the opportunity cost of non-compliance, thereby creating a dual “incentive + constraint” mechanism. In unregulated industries, however, the lack of mandatory enforcement and external pressure may result in a “policy vacuum,” delaying green transition. These findings suggest that future policy design should adopt a differentiated regulatory strategy: while regulated industries may continue to benefit from the combination of strong incentives and strict regulations, unregulated industries require additional incentive mechanisms to stimulate voluntary emission reduction and green investment, preventing divergence in the pace of transition.
Overall, the heterogeneity analysis across ownership structure, firm size, and regulated vs. unregulated industries reveals that the NEDC policy generates stronger environmental performance improvements in state-owned enterprises, large firms, and regulated industries, while its impact is relatively weaker in non-state-owned firms, smaller firms, and unregulated industries. This suggests that the effectiveness of green policies is not solely determined by institutional design but is also shaped by firm-specific characteristics and the external regulatory environment. From a policy perspective, optimizing the policy mix within the framework of “institutional guidance—innovation compensation—differentiated regulation” is essential. SOEs should continue to serve as role models, non-SOEs need more targeted financial and fiscal support, large firms should consolidate their green advantages while small firms require compensatory mechanisms to lower entry barriers. Regulated industries should maintain the dual-track strategy of strong regulation and incentives, whereas unregulated industries need strengthened incentive schemes to avoid lagging. Such a layered and differentiated policy design ensures a more balanced transmission of policy effects across different groups and promotes a steady and inclusive green transition.
It is worth noting that although layered and differentiated policy design can better align with the characteristics of different groups of firms, its implementation may indeed involve complexity and execution challenges. In practice, some regions in China have experimented with green credit programs that provide targeted support for small firms, lowering financing thresholds through fiscal guarantees and interest subsidies and thereby reducing transition costs. At the same time, SOEs have played a demonstrative role in sharing carbon reduction responsibilities, creating a benchmark effect. These cases suggest that layered governance is not infeasible; rather, its feasibility depends on designing a combined mechanism of incentives, constraints and complementary support. On the one hand, financial and institutional assistance should be directed toward small firms to prevent marginalization due to resource limitations. On the other hand, maintaining both incentives and constraints for large enterprises is essential to sustain their active engagement in green transition.
5. Discussion
5.1. Theoretical Contributions
This study makes four theoretical contributions:
First, it extends the evaluation of green policies from single-dimensional outcomes—such as emissions or patents—to a comprehensive measure of EP. By integrating multiple aspects of environmental governance, we demonstrate that structural policies like the NEDC can generate broad-based improvements, thereby enriching the literature on how institutional interventions affect firms’ overall environmental responsibility.
Second, it offers robust causal evidence of policy effectiveness by exploiting the rollout of the NEDC policy as a quasi-natural experiment. While most prior studies on China’s green transition focus on aggregate impacts or case-based analysis [58], our firm-level DID estimates—validated through placebo tests, PSM-DID, double machine learning and other robustness test—offer robust identification of policy effects. This methodological contribution addresses long-standing concerns about endogeneity and strengthens the empirical foundation for evaluating institutional innovations.
Third, it advances theoretical understanding of the mechanisms through which green policies operate. We show that internal innovation capacity and external regulatory pressure jointly amplify the effectiveness of green policies. This dual mechanism framework explains why firms and regions exhibit heterogeneous responses and moves the debate beyond the “compliance cost versus innovation compensation” dichotomy [59]. In doing so, the paper contributes to a more nuanced theory of policy effectiveness under diverse institutional contexts. Moreover, by comparing our findings with prior studies on alternative instruments such as emissions trading systems, green credit, and environmental taxation, we highlight how the NEDC policy complements and, in some respects, surpasses these tools by embedding both incentives and institutional constraints within a single framework. In doing so, the paper contributes to a more nuanced theory of policy effectiveness under diverse institutional contexts and clarifies its positioning within the broader literature on green policy instruments.
Finally, this study enhances external relevance by linking the Chinese experience to international debates on green policy design. For example, while the European Green Deal emphasizes large-scale regulatory and investment frameworks, our findings together with India’s renewable energy auction experience illustrate how institutional policies in emerging economies can provide complementary insights into alternative pathways of green transition.
5.2. Limitations and Future Research
Despite its contributions, this study has several limitations that should be acknowledged and can inspire avenues for future research.
First, the measure of EP is based on the ENV database, which captures firms’ environmental governance practices but may not fully reflect actual emission reductions or energy efficiency improvements. Future research could integrate multiple data sources, such as emission inventories, energy consumption data, or satellite-based pollution measures, to construct a more comprehensive indicator system.
Second, the proxy for environmental regulation relies on the frequency of environment-related terms in provincial government reports. While this approach reflects policy salience and agenda-setting, it may not perfectly capture enforcement intensity. Further studies could validate this measure by combining it with administrative data on inspections, fines, or pollution control investments, thereby linking policy attention with actual enforcement outcomes.
Third, although the DID framework supplemented by robustness checks and double machine learning enhances causal identification, certain limitations remain. Potential spillover effects across regions cannot be fully ruled out, as the mobility of capital, knowledge, and supply chains may transmit policy impacts to non-pilot areas, thereby attenuating or amplifying the estimated effects. Moreover, endogeneity concerns may persist despite our methodological efforts. Future research could address these issues by employing spatial DID approaches, incorporating firm-level supply chain network data, or applying alternative identification strategies such as instrumental variables, regression discontinuity designs, or natural experiments to further validate the robustness of causal effects.
Fourth, the heterogeneity analysis is limited to ownership, size, and industry regulation. Other dimensions—such as regional marketization, financial development, or integration into global value chains—could also shape policy effectiveness. Expanding heterogeneity tests along these lines would enrich understanding of how institutional and market contexts mediate policy outcomes.
Finally, this study centers on China’s NEDC policy. While the findings provide broader lessons, their generalizability may be constrained by China’s unique institutional environment. Regarding international applicability, our results imply different implications for developing and developed countries. For developing economies, the evidence underscores that institutional green policies are particularly valuable in compensating for incomplete markets and weak regulatory enforcement. For developed economies, where market-based instruments such as ETS, carbon taxes, or green finance are already mature, the Chinese experience should be seen as a complementary reference rather than a direct template. In this sense, the conclusions of this paper need to be adjusted according to national conditions, and future research should further validate these differentiated implications through cross-country comparative analysis.
6. Conclusions and Implications
6.1. Conclusions
Drawing on firm- and city-level panel data from 2010 to 2022, this paper treats the NEDC policy as a quasi-natural experiment to assess its causal impact on EP. The results show that the policy significantly improves EP, and this finding remains robust across a wide range of tests, including parallel trend validation, placebo tests, PSM-DID, alternative outcome measures, and double machine learning estimations. Mechanism analysis reveals that firm-level AI innovation and environmental regulation amplify the policy effect: AI innovation enhances firms’ ability to absorb and translate policy incentives into green practices, while stricter regulation increases compliance costs and reinforces the policy’s incentive effect through institutional complementarity. Heterogeneity analysis indicates that the policy effect is stronger in state-owned enterprises, large firms, and regulated industries, but weaker among non-state-owned firms, small firms, and unregulated industries. Overall, the results demonstrate that the NEDC policy strengthens corporate EP through both internal capability and external constraints, providing new empirical evidence on the institutional boundaries of green policy effectiveness in the context of China’s dual carbon strategy. It also provides reference experience for the green transformation of developing countries.
6.2. Policy Implications
Several implications can be drawn. First, the findings highlight the importance of moving from pilot experiments to the institutional mainstream. The effectiveness of the NEDC policy suggests that structural green policies can effectively complement market mechanisms in the early stages of green transition. Extending successful institutional arrangements nationwide would enhance firms’ EP while reducing uncertainty in green investment. Second, policy coordination across energy, technology, and finance is critical. The amplifying roles of AI innovation and regulatory intensity suggest that green policies should be coupled with R&D support for green and digital technologies and expanded green finance instruments such as loans and bonds, creating a systemic governance framework. Third, the structural nature of the NEDC policy makes it particularly relevant for developing economies, where market-based instruments alone may be insufficient. China’s institutional innovations can thus serve as a reference for other emerging economies in designing policies that combine incentives, technologies, and regulatory frameworks. Fourth, the integration of environmental goals with broader social sustainability objectives should not be overlooked. Green transition policies should be designed to foster job creation, industrial upgrading, and social equity, ensuring that the benefits of green transformation are broadly shared. Finally, differentiated governance strategies are essential. Beyond leveraging the demonstrative role of state-owned and large enterprises, targeted support for non-SOEs and small firms is essential to ensure inclusive policy outcomes. In practice, mechanisms such as green credit guarantees, fiscal subsidies, and shared technology platforms can help lower financing thresholds, reduce transition costs, and enhance technological absorptive capacity. These complementary measures would prevent policy benefits from concentrating disproportionately in large firms and SOEs, while enabling small firms and non-SOEs to participate more actively in the green transition.
Author Contributions
Conceptualization, R.L., Y.W. and C.L.; methodology, R.L. and Y.W.; software, R.L. and Y.W.; validation, R.L.; formal analysis, R.L.; investigation, R.L., Y.W. and C.L.; resources, C.L.; data curation, R.L.; writing—original draft, R.L.; writing—review & editing, R.L., Y.W. and C.L.; visualization, R.L.; project administration, C.L. All authors have read and agreed to the published version of the manuscript.
Funding
This research received no external funding.
Data Availability Statement
The original contributions presented in this study are included in the article. Further inquiries can be directed to the corresponding author.
Conflicts of Interest
The authors declare no conflict of interest.
References
- Yang, M.; Chen, L.; Wang, J.; Msigwa, G.; Osman, A.I.; Fawzy, S.; Rooney, D.W.; Yap, P.S. Circular economy strategies for combating climate change and other environmental issues. Environ. Chem. Lett. 2023, 21, 55–80. [Google Scholar] [CrossRef]
- Filonchyk, M.; Peterson, M.P.; Zhang, L.; Hurynovich, V.; He, Y. Greenhouse gases emissions and global climate change: Examining the influence of CO2, CH4, and N2O. Sci. Total Environ. 2024, 935, 173359. [Google Scholar] [CrossRef]
- Skea, J.; Shukla, P.; Al Khourdajie, A.; McCollum, D. Intergovernmental Panel on Climate Change: Transparency and integrated assessment modeling. Wiley Interdiscip. Rev. Clim. Change 2021, 12, e727. [Google Scholar] [CrossRef]
- Yu, Y.; Li, C.; Fu, Y.; Yang, W. A group decision-making method to measure national energy architecture performance: A case study of the international energy Agency. Appl. Energy 2023, 330, 120285. [Google Scholar] [CrossRef]
- Stechemesser, A.; Koch, N.; Mark, E.; Dilger, E.; Klösel, P.; Menicacci, L.; Nachtigall, D.; Pretis, F.; Ritter, N.; Schwarz, M.; et al. Climate policies that achieved major emission reductions: Global evidence from two decades. Science 2024, 385, 884–892. [Google Scholar] [CrossRef] [PubMed]
- Zhu, Z.; Tan, Y. Can green industrial policy promote green innovation in heavily polluting enterprises? Evidence from China. Econ. Anal. Policy 2022, 74, 59–75. [Google Scholar] [CrossRef]
- Chen, S.C.I.; Xu, X.; Own, C.M. The Impact of Green Finance and Technological Innovation on Corporate Environmental Performance: Driving Sustainable Energy Transitions. Energies 2024, 17, 5959. [Google Scholar] [CrossRef]
- Cheng, Z.; Kong, S. The effect of environmental regulation on green total-factor productivity in China’s industry. Environ. Impact Assess. Rev. 2022, 94, 106757. [Google Scholar] [CrossRef]
- Chen, H.; Deng, J.; Lu, M.; Zhang, P.; Zhang, Q. Government environmental attention, credit supply and firms’ green investment. Energy Econ. 2024, 134, 107547. [Google Scholar] [CrossRef]
- Wang, J.; Jia, L.; Wang, Y.; Wang, P.; Huang, L. Diffusion of “dual carbon” policies among Chinese cities: A network evolution analysis. Energy 2024, 300, 131514. [Google Scholar] [CrossRef]
- Jiang, W.; Du, L.; Wei, H.; Sun, H. The influence of urban new energy development orientation on new energy technology innovation in firms. Renew. Energy 2024, 237, 121873. [Google Scholar] [CrossRef]
- Hou, Y.; Yang, M.; Ma, Y.; Zhang, H. Study on city’s energy transition: Evidence from the establishment of the new energy demonstration cities in China. Energy 2024, 292, 130549. [Google Scholar] [CrossRef]
- Che, S.; Wang, J.; Chen, H. Can China’s decentralized energy governance reduce carbon emissions? Evidence from new energy demonstration cities. Energy 2023, 284, 128665. [Google Scholar] [CrossRef]
- Wu, T.; Wen, L.; Yi, M. Balancing growth targets and environmental regulations: An empirical analysis of dual policy impact on corporate environmental responsibility–insights from China. J. Environ. Manag. 2024, 355, 120500. [Google Scholar] [CrossRef]
- Shao, S.; Hu, Z.; Cao, J.; Yang, L.; Guan, D. Environmental regulation and enterprise innovation: A review. Bus. Strategy Environ. 2020, 29, 1465–1478. [Google Scholar] [CrossRef]
- Zhang, L.; Song, Y.; Zhang, M. The impact of carbon emissions trading policy on employment: Evidence from enterprises and cities. J. Clean. Prod. 2025, 520, 146176. [Google Scholar] [CrossRef]
- Radtke, J. E-participation in energy transitions: What does it mean? Chances and challenges within Germany’s Energiewende. Technol. Forecast. Soc. Change 2025, 210, 123839. [Google Scholar] [CrossRef]
- Skjærseth, J.B.; Rosendal, K. Implementing the EU renewable energy directive in Norway: From Tailwind to Headwind. Environ. Politics 2023, 32, 316–337. [Google Scholar] [CrossRef]
- Peng, X.; Li, J.; Tang, Q.; Lan, Y.C.; Cui, X. Do environmental scores become multinational corporations’ strategic “greenwashing” tool for window-dressing carbon reduction? A cross-cultural analysis. Bus. Strategy Environ. 2024, 33, 2084–2115. [Google Scholar] [CrossRef]
- Zhang, K.; Li, Y.; Qi, Y.; Shao, S. Can green credit policy improve environmental quality? Evidence from China. J. Environ. Manag. 2021, 298, 113445. [Google Scholar] [CrossRef]
- Zhao, H.; Yu, M.; Meng, J.; Jiang, Y. Examining the Spillover Effects of Renewable Energy Policies on China’s Traditional Energy Industries and Stock Markets. Energies 2024, 17, 2563. [Google Scholar] [CrossRef]
- Wang, Q.; Yi, H. New energy demonstration program and China’s urban green economic growth: Do regional characteristics make a difference? Energy Policy 2021, 151, 112161. [Google Scholar] [CrossRef]
- Liu, C.; Tang, C.; Liu, Y. Does the transformation of energy structure promote green technological innovation? A quasi–natural experiment based on new energy demonstration city construction. Geosci. Front. 2024, 15, 101615. [Google Scholar] [CrossRef]
- Nouri, A.; Khadem, S.; Mutule, A.; Papadimitriou, C.; Stanev, R.; Cabiati, M.; Keane, A.; Carroll, P. Identification of gaps and barriers in regulations, standards, and network codes to energy citizen participation in the energy transition. Energies 2022, 15, 856. [Google Scholar] [CrossRef]
- Zhang, L.; Lan, T. The new whole state system: Reinventing the Chinese state to promote innovation. Environ. Plan. A Econ. Space 2023, 55, 201–221. [Google Scholar] [CrossRef]
- Asiaei, K.; Bontis, N.; Alizadeh, R.; Yaghoubi, M. Green intellectual capital and environmental management accounting: Natural resource orchestration in favor of environmental performance. Bus. Strategy Environ. 2022, 31, 76–93. [Google Scholar] [CrossRef]
- Zhou, C.; Qi, S.; Li, Y. Environmental policy uncertainty and green transformation dilemma of Chinese enterprises. J. Environ. Manag. 2024, 370, 122891. [Google Scholar] [CrossRef] [PubMed]
- Yang, X.; Zhang, J.; Ren, S.; Ran, Q. Can the new energy demonstration city policy reduce environmental pollution? Evidence from a quasi-natural experiment in China. J. Clean. Prod. 2021, 287, 125015. [Google Scholar] [CrossRef]
- Risi, D.; Vigneau, L.; Bohn, S.; Wickert, C. Institutional theory-based research on corporate social responsibility: Bringing values back in. Int. J. Manag. Rev. 2023, 25, 3–23. [Google Scholar] [CrossRef]
- Hällerstrand, L.; Reim, W.; Malmström, M. Dynamic capabilities in environmental entrepreneurship: A framework for commercializing green innovations. J. Clean. Prod. 2023, 402, 136692. [Google Scholar] [CrossRef]
- Asiaei, K.; O’Connor, N.G.; Barani, O.; Joshi, M. Green intellectual capital and ambidextrous green innovation: The impact on environmental performance. Bus. Strategy Environ. 2023, 32, 369–386. [Google Scholar] [CrossRef]
- Liu, Q.; Du, S.; Li, M. Green Innovation Perspective: Artificial Intelligence and Corporate Green Development. Int. Rev. Econ. Financ. 2025, 102, 104345. [Google Scholar] [CrossRef]
- Boix-Fayos, C.; De Vente, J. Challenges and potential pathways towards sustainable agriculture within the European Green Deal. Agric. Syst. 2023, 207, 103634. [Google Scholar] [CrossRef]
- Ren, S.; Jiang, K.; Tang, G. Leveraging green HRM for firm performance: The joint effects of CEO environmental belief and external pollution severity and the mediating role of employee environmental commitment. Hum. Resour. Manag. 2022, 61, 75–90. [Google Scholar] [CrossRef]
- Wang, M.; Lin, N.; Dong, Y.; Tang, Y. How does new energy demonstration city policy promote urban land use efficiency in China? The mediating effect of industrial structure. Land 2023, 12, 1100. [Google Scholar] [CrossRef]
- Campbell, J.L. The US financial crisis: Lessons for theories of institutional complementarity. Socio-Econ. Rev. 2011, 9, 211–234. [Google Scholar] [CrossRef]
- Mahmood, N.; Zhao, Y.; Lou, Q.; Geng, J. Role of environmental regulations and eco-innovation in energy structure transition for green growth: Evidence from OECD. Technol. Forecast. Soc. Change 2022, 183, 121890. [Google Scholar] [CrossRef]
- Peiró-Signes, Á.; Cervelló-Royo, R.; Segarra-Ona, M. Can a country’s environmental sustainability exert influence on its economic and financial situation? The relationship between environmental performance indicators and country risk. J. Clean. Prod. 2022, 375, 134121. [Google Scholar] [CrossRef]
- Pinar, M. Sensitivity of environmental performance index based on stochastic dominance. J. Environ. Manag. 2022, 310, 114767. [Google Scholar] [CrossRef]
- Jiang, B.; Raza, M.Y. Research on China’s renewable energy policies under the dual carbon goals: A political discourse analysis. Energy Strategy Rev. 2023, 48, 101118. [Google Scholar] [CrossRef]
- Arroyabe, M.F.; Arranz, C.F.; De Arroyabe, I.F.; de Arroyabe, J.C.F. Analyzing AI adoption in European SMEs: A study of digital capabilities, innovation, and external environment. Technol. Soc. 2024, 79, 102733. [Google Scholar] [CrossRef]
- Zeng, H.; Li, X.; Zhou, Q.; Wang, L. Local government environmental regulatory pressures and corporate environmental strategies: Evidence from natural resource accountability audits in China. Bus. Strategy Environ. 2022, 31, 3060–3082. [Google Scholar] [CrossRef]
- Verendel, V. Tracking artificial intelligence in climate inventions with patent data. Nat. Clim. Change 2023, 13, 40–47. [Google Scholar] [CrossRef]
- Zhu, K.; Du, L.; Feng, Y. Government attention on environmental protection and firms’ carbon reduction actions: Evidence from text analysis of manufacturing enterprises. J. Clean. Prod. 2023, 423, 138703. [Google Scholar] [CrossRef]
- Górowski, I.; Kurek, B.; Szarucki, M. The impact of a new accounting standard on assets, liabilities and leverage of companies: Evidence from energy industry. Energies 2022, 15, 1293. [Google Scholar] [CrossRef]
- Bunea, O.I.; Corbos, R.A.; Popescu, R.I. Influence of some financial indicators on return on equity ratio in the Romanian energy sector-A competitive approach using a DuPont-based analysis. Energy 2019, 189, 116251. [Google Scholar] [CrossRef]
- Lee, C.C. Analyses of the operating performance of information service companies based on indicators of financial statements. Asia Pac. Manag. Rev. 2023, 28, 410–419. [Google Scholar] [CrossRef]
- Lin, B.; Xu, C. The effects of capital-biased tax incentives on firm energy intensity: Environmental dividend or consequence? J. Environ. Manag. 2023, 345, 118507. [Google Scholar] [CrossRef] [PubMed]
- Kumar, M.; Raut, R.D.; Mangla, S.K.; Ferraris, A.; Choubey, V.K. The adoption of artificial intelligence powered workforce management for effective revenue growth of micro, small, and medium scale enterprises (MSMEs). Prod. Plan. Control. 2024, 35, 1639–1655. [Google Scholar] [CrossRef]
- Chatjuthamard, P.; Jiraporn, P. Corporate culture, innovation and board size: Recent evidence from machine learning and earnings conference calls. Corp. Gov. Int. J. Bus. Soc. 2023, 23, 1361–1378. [Google Scholar]
- Liu, X.; Li, B.; Zhang, S.; Yang, Z. Does the resignation of an independent director affect audit fees? An empirical study based on Chinese A-share listed companies. Int. Rev. Financ. Anal. 2024, 92, 103075. [Google Scholar] [CrossRef]
- Bhaskar, R.; Bansal, S.; Pandey, D.K. CEO duality and corporate social responsibility: A moderation effect of founder CEO. Res. Int. Bus. Financ. 2024, 71, 102410. [Google Scholar] [CrossRef]
- Gârleanu, N.; Pedersen, L.H. Efficiently inefficient markets for assets and asset management. J. Financ. 2018, 73, 1663–1712. [Google Scholar] [CrossRef]
- Liu, T.; Zhang, Y.; Liang, D. Can ownership structure improve environmental performance in Chinese manufacturing firms? The moderating effect of financial performance. J. Clean. Prod. 2019, 225, 58–71. [Google Scholar] [CrossRef]
- Jan, A.A.; Lai, F.W.; Tahir, M. Developing an Islamic Corporate Governance framework to examine sustainability performance in Islamic Banks and Financial Institutions. J. Clean. Prod. 2021, 315, 128099. [Google Scholar] [CrossRef]
- Tang, Y.; Li, Q.; Zhou, F.; Sun, M. Does clan culture promote corporate natural resource disclosure? Evidence from Chinese natural resource-based listed companies. J. Bus. Ethics 2024, 192, 167–190. [Google Scholar] [CrossRef]
- Menguc, B.; Auh, S.; Ozanne, L. The interactive effect of internal and external factors on a proactive environmental strategy and its influence on a firm’s performance. J. Bus. Ethics 2010, 94, 279–298. [Google Scholar] [CrossRef]
- Bai, H.; Ma, X.; Lin, H.; Wu, Y.; Nan, Z. Comparative Analysis of Economic and Environmental Trade-Offs in Alfalfa Production in China: A Case Study. Sustainability 2025, 17, 4252. [Google Scholar] [CrossRef]
- Liu, B.; Cifuentes-Faura, J.; Ding, C.J.; Liu, X. Toward carbon neutrality: How will environmental regulatory policies affect corporate green innovation? Econ. Anal. Policy 2023, 80, 1006–1020. [Google Scholar] [CrossRef]
Disclaimer/Publisher’s Note: The statements, opinions and data contained in all publications are solely those of the individual author(s) and contributor(s) and not of MDPI and/or the editor(s). MDPI and/or the editor(s) disclaim responsibility for any injury to people or property resulting from any ideas, methods, instructions or products referred to in the content. |
© 2025 by the authors. Licensee MDPI, Basel, Switzerland. This article is an open access article distributed under the terms and conditions of the Creative Commons Attribution (CC BY) license (https://creativecommons.org/licenses/by/4.0/).