Article

Analysis of the Profitability of Heating a Retrofitted Building with an Air Heat Pump in Polish Climatic Conditions

by
Aleksander Iwaszczuk
1,
Jarosław Baran
2 and
Natalia Iwaszczuk
3,*
1
Cracow University of Technology, College of Social Sciences, Warszawska Str. 24, 31-155 Krakow, Poland
2
AGH University of Krakow, AGH Doctoral School, Mickiewicz Av. 30, 30-059 Krakow, Poland
3
AGH University of Krakow, Faculty of Management, Mickiewicz Av. 30, 30-059 Krakow, Poland
*
Author to whom correspondence should be addressed.
Energies 2025, 18(20), 5413; https://doi.org/10.3390/en18205413
Submission received: 3 September 2025 / Revised: 30 September 2025 / Accepted: 11 October 2025 / Published: 14 October 2025

Abstract

The transformation of energy systems towards low emission is one of the key assumptions of the climate and energy policy of the European Union and many countries around the world. These changes include not only the power and transport sectors but also the heating of residential buildings, which consume significant amounts of energy and emit large amounts of greenhouse gases. This article presents a detailed comparative analysis of the costs of heating using an air-to-water heat pump and a condensing gas boiler. The study concerned a retrofitted single-family building from the 1990s, located in southern Poland. The calculations were made taking into account daily meteorological data for two full heating seasons: 2022/2023 and 2023/2024. This approach made it possible to more precisely reproduce real operating conditions. The study was conducted for various configurations of the central heating system: surface and radiator. The following parameters were also taken into account: (1) variable heat pump parameters, such as supply temperature LWT and coefficient of performance COP; (2) current tariffs for electricity and natural gas; and (3) forecasted tariffs for electricity and natural gas in the conditions of market liberalization and phasing out of protective mechanisms. A comparison of the two heating seasons revealed lower costs with a heat pump. In some cases, the cost of heat generated by a gas boiler was over 100% higher than with a heat pump. This applies to both heating seasons. Under the current tariffs, the calculated gas cost for the first season was PLN 6856 (EUR 1605) (1 EUR = 4.27 PLN) compared to heat pump heating costs ranging from PLN 3191 to PLN 4576 (EUR 747 to 1072). For future gas and electricity tariffs, the costs were PLN 8227 (EUR 1926) for gas and PLN 3841 to PLN 5304 (EUR 899 to 1242) for a heat pump. Similarly, for the second heating season, these values were PLN 6055 (EUR 1418) for gas heating and PLN 2741–3917 (EUR 642–917) for a heat pump under the current tariffs, and PLN 7267 (EUR 1702) and PLN 3307–4540 (EUR 774–1064) under future tariffs. This means percentage savings of between approximately 33% and 55%, depending on the heating type and tariff. Therefore, the obtained results indicate the higher profitability of using an air heat pump compared to a gas boiler. This advantage was maintained in all the discussed scenarios, and its scale depended on the type of installation, supply temperature, and the selected electricity tariff. The highest economic profitability was noted for low-temperature systems. These results can provide a basis for making rational investment and design decisions in the context of the energy transformation of single-family housing.

1. Introduction

Recent years have been characterized by dynamic changes in the global economy and environment, including the severing or weakening of economic ties, disruptions in supply chains, geopolitical events, and global warming. All of this has a significant impact on most aspects of our lives. One of them is the changing narrative in the energy sector, including electricity and heating. In the context of these changes, the European Union must develop a strategy aimed at taking and implementing adequate actions in the field of environmental protection and ensuring living conditions for current and future generations [1]. At the same time, the EU must ensure economic comfort for the inhabitants of its countries.
Reducing the share of fossil fuels in the production of heat energy is one of the main priorities in the energy policy of the European Union, which requires taking appropriate actions. In the conditions of ongoing climate change and growing ecological awareness, the issues of building energy efficiency and appropriate heating systems are becoming a key element of sustainable development.
Poland, like other EU countries, faces the challenge of adapting to the requirements of climate policy, which aims to reduce greenhouse gas emissions and pollutants while simultaneously increasing the share of renewable energy sources (RES) in the energy mix. One of the most important areas of action is the thermal retrofitting of existing buildings and replacing of outdated heating systems with modern solutions that are characterized by low emissions of pollutants and greenhouse gases.
In the face of growing requirements for building energy efficiency and global efforts to reduce greenhouse gas emissions, the retrofitting of heating systems is becoming a key element of energy policy in many countries around the world, including the EU (and therefore Poland). This leads to the search for alternative, renewable energy sources. The implementation of EU directives, such as Directive 2010/31/EU on the energy performance of buildings (EPBD) [2], Directive 2018/844/EU [3], or the latest Directive 2023/1791 [4], further tightens energy efficiency goals. They also force EU countries to implement energy standards that will increase the energy efficiency of buildings. In order to reduce the financial pressure on households, support programs such as “Clean Air” [5] and “My Heat” [6] have been implemented in Poland.
There is also the possibility of obtaining tax relief, which promotes thermal retrofitting and the installation of heat pumps as an alternative to outdated coal boilers. Another important aspect is Poland’s energy policy, which has undergone significant transformations in recent years. Strategic documents, such as the Energy Policy of Poland until 2040 (PEP2040) [7]—especially after recent changes—or the National Energy and Climate Plan for 2021–2030 (KPEiK) [8], assume a gradual abandonment of coal in favor of “green energy” and improvement of energy efficiency in the construction sector.
These changes are the result not only of legal regulations but also of the growing ecological awareness of society and strictly economic benefits from reducing the operating costs of buildings. The cost of heating is often one of the main expenses in a household budget, and rising energy costs are increasingly leading to the expansion of the so-called energy poverty phenomenon, especially among the less affluent. Therefore, choosing the right heating system is very important both for heat users and for the environment.
Traditional heat sources (such as coal, oil, or natural gas boilers) generate significant emissions of carbon dioxide and other harmful substances, which contributes to the deepening of the greenhouse effect and air pollution. In this context, heat pumps are seen as one of the key technologies that can contribute to the implementation of changes aimed at moving away from fossil fuels. This type of heating is characterized by a lack of exhaust emissions, carbon dioxide (CO2), and other pollutants. At the same time, it allows for the use of electricity obtained from renewable energy sources, with the efficiency of these devices reaching several hundred percent. Heat pumps can be an energy-efficient and cost-effective alternative to traditional heat sources, especially in buildings subjected to thermal retrofitting.
The future cost of using high-emission energy carriers (e.g., coal and gas) is also not without significance. In just a few years, after the implementation of the ETS2 [9] fee system, heating bills with these raw materials may be much higher and, in the future, reach large amounts [10]. In addition, recent studies indicate that the estimated cost of CO2 emissions is underestimated due to incorrect calculation methodology, and the actual cost may be much higher—resulting in much greater benefits—in the case of reducing these emissions [11].
The use of heat pumps for heating buildings in Europe has been the subject of research by many scientists. For example, Ref. [12] was devoted to a review of the literature on what potential energy savings can be obtained by improving the energy efficiency of a building located in Central and Eastern Europe. Sewastianik and Gajewski [13] examined how much carbon dioxide is emitted by heat pumps operating in Polish climatic conditions. In Ref. [14], the authors assessed the impact of heat pumps on the environment (through the emissions of greenhouse gases and suspended dust) with their operation in all climate zones in Poland. The authors compared air-to-water, brine-to-water, and water-to-water devices among themselves.
Pater [15] presented the results of experimental research to use a hybrid installation for heating and cooling a building in southern Poland. Chwieduk and Chwieduk [16] focused on analyzing the work of a heat pump that was powered by electricity produced by a solar panel system, which was installed in a single-family building in Poland. In turn, Ref. [17] proposed a universal multi-stage procedure for supporting decisions regarding the choice of a heat pump that would be the most suitable for a given building.
Jędrzejuk and Chwieduk [18] analyzed the possibilities of retrofitting Warsaw residential buildings towards the standards of “Positive Energy District”. They emphasized the large variety of buildings, which forces the use of various approaches to improving the energy standard of buildings, including renewable energy sources.
Ref. [19] examined the benefits of the operation of heat pump systems in public buildings, as well as alternative systems using electricity, liquefied petroleum gas (LPG), and heating oil. The study was conducted for the Ruda-Huta municipality in Poland, which had no access to a heating system or network gas. The authors of Ref. [20] focused on the use of air–water heat pumps in the facilities of the Silesian Botanical Garden in Poland. They examined the impact of such a solution on improving the energy efficiency of objects, including energy consumption and carbon dioxide emissions. In turn, the authors of Ref. [21] considered the use of heat pumps in new housing estates being built in the suburbs of cities.
Ołtarzewska and Krawczyk [22] simulated the use of an integrated energy system (consisting of a heat pump and photovoltaic panels) in service rooms located in various climate zones in Poland. They took into account the following cities: Kolobrzeg, Poznań, Krakow, Warsaw, Mikolajki, and Suwalki. They estimated how many photovoltaic panels would be needed to ensure the operation of the heat pumps.
Witkowska and Krawczyk [23] compared the use of heat pumps for the heating and cooling of single-family houses located in different climatic conditions (Wroclaw, Poland; Cordoba, Spain). Based on their calculations, the authors selected a device that was suitable for the climatic conditions (air-to-water reverse heat pumps) and estimated the investment outlays for the purchase and installation of heat pumps, as well as their operation costs.
The authors of Ref. [24] focused on estimating the energy efficiency of heat pumps installed in residential buildings. Research based on real operational data has proved that pump performance does not always meet existing standards, and there is a need to use standard procedures to assess performance after installation of the pump.
Śliwa and Kotyza [25] discussed the use of geothermal heat from existing wells as a source of ground heat for heat pumps. The authors presented preliminary calculations of energy resources from closed wells in Poland and a simulation of heat exchange that could be obtained from exhausted oil wells. They also conducted an economic analysis of systems with heat pumps and deep wells as heat exchangers in drilling holes and indicated what factors affect the profitability of geothermal heat pumps in heating systems, as well as the unit cost of heat.
Ref. [26] presented an economic analysis and assessment of the time to return the investment in a heat pump integrated with PV installation using the example of a single-family house located in Poland. Ref. [27] examined the efficiency and economic performance of air–water heat pumps in four various European climate zones (Poland, Lithuania, Croatia, and Spain) with various energy prices. Ref. [28] presented an analysis of the modernization of heat pumps based on data for a residential building located in Germany. Parameters such as carbon dioxide emissions and economic profitability were taken into account. In turn, Ref. [29] presented an analysis of an environmental trace for home-type air-source heat pumps installed in Ireland.
The aim of this article is to provide a detailed analysis of the profitability of heat pump heating in thermally retrofitted buildings in Polish climatic conditions, using a specific example. For the purposes of this article, we simulated the heating costs of an existing building—using a heat pump and a gas boiler—in two variants of central heating (C.H.) installation: (1) underfloor heating; (2) radiator heating. We also took into account different tariffs for electricity in powering the heat pump. We based the study on the actual energy demand of the building, using the calculated heating power demand indicator and archived meteorological data (seasons 2022/2023 and season 2023/2024) for a given location. Unlike other studies, we decided to take into account daily (instead of monthly) temperature values. This allowed us to enter more detailed data into the model and obtain results close to real ones. Due to the dynamically changing prices of both electricity and natural gas, we decided on two cost variants: (1) current; (2) future. Finally, as a result of the analysis, we calculated the cost of heating the building with these energy carriers, taking into account their current and forecasted prices.
The authors of this article take an innovative approach to calculating the differences in heating costs for an existing building based on meteorological data recorded for that location from the two previous heating periods. Furthermore, the authors compared the heating costs of a gas boiler and a heat pump using different energy tariffs (current and future) and heating technologies (underfloor heating; radiators). This allowed us to obtain a wealth of data that demonstrates the differences in heating costs for various options, unlike other publications.

2. Materials and Methods

2.1. Factors Influencing the Cost of Heating a Building

In order to estimate heating costs, we will take into account the following factors:
  • Outdoor temperature (more precisely, the difference between the temperature in the rooms and the outdoor temperature);
  • Thermal insulation of the building (or, vice versa, thermal transmittance of external partitions);
  • Cost of thermal energy supplied to the building (regardless of the type of source, but taking into account the conversion efficiency);
  • Prices of the raw material/energy carrier;
  • Efficiency of the heating system.

2.1.1. Outdoor Temperature

Outdoor temperature depends on climatic conditions. Poland is located in a temperate climate zone of a warm transitional type, which is characterized by high weather variability and the occurrence of six thermal seasons [30]. Climatic conditions (including minimum and average temperature, amount of sunlight, and windiness) determine the selection of parameters for calculating the heat load, which will affect the designed heating systems for buildings. In Poland, there are currently five climate zones (I–V), for which different designs for outdoor temperatures are adopted. The following outdoor temperatures (design/average) have been assigned to each zone:
  • Zone I: −16 °C/7.7 °C;
  • Zone II: −18 °C/7.9 °C;
  • Zone III: −20 °C/7.6 °C;
  • Zone IV: −22 °C/6.9 °C;
  • Zone V: −24 °C/5.5 °C.
However, the application of the above standard (which has been significantly outdated by climate change [31]) in designed heating installations is currently being criticized by both industry representatives [32] and scientists. They indicate that it is necessary to change the values of the adopted assumptions regarding the design temperatures that will be used in the calculations, in accordance with the update of meteorological data [33]. At the same time, they emphasize that further climate changes may occur in the future, which should be gradually taken into account [34]. This is particularly important in central heating systems designed to work with a heat pump because failure to take into account actual data may result in the selection of a heat pump with inefficient parameters [35]. For example, between 1961 and 1970, the average temperature in Poland was 7.2 °C; in the period from 2001 to 2010, it increased to 8.4 °C; and between 2011 and 2020, it increased to 9.1 °C. This may mean an acceleration of climate change in this region.

2.1.2. Thermal Insulation of the Building

Thermal insulation has a direct impact on heating energy losses. The heating system must make up for these losses and supply heat to the building. The current national standards for building energy consumption (primary energy demand) and thermal transmittance parameters are called Technical Conditions 2021 (TC 2021) [36]. However, the current TC 2021 standard is another, but probably not the last. Over the decades, standards have changed, constantly increasing the technical parameters of the building (thermal insulation), which translates into a decrease in heat demand. This issue is very important because many buildings in Poland have undergone thermal retrofitting (to obtain appropriate parameters) in order to benefit from financial support programs (including the most popular government program, “Clean Air” [5]). This, in turn, translates directly into the consumption of thermal energy in the building or the heating power of the heat source. The latter parameter is key to the correct selection of a heat pump for an existing building, but the thermal retrofitting carried out affects another important aspect. In older buildings, the central heating system was based on high-temperature heat sources, such as solid fuel boilers (coal or wood) or gas. However, the efficiency of a heat pump (expressed as coefficient of performance, COP) decreases with the increase of the temperature of the water leaving the device (Leaving Water Temperature, LWT) that is supplied to the heating system (e.g., to radiators). Additionally, a decrease in the outdoor temperature causes a decrease in the COP coefficient. In unfavorable conditions, this may lead to inefficient pump operation and, in extreme cases, may result in the inability to achieve the set temperature in the heating circuit. Supplying radiators with a medium with temperatures similar to the previous ones (in old heating systems; e.g., 65–75 °C) is uneconomical and, for many heat pumps, impossible to achieve. Therefore, thermal retrofitting reduces the building’s thermal demand, allowing for a reduction in heating power. In addition, it helps to reduce the supply temperature (increasing the COP coefficient) due to the specific oversizing of receivers (usually radiators). Sometimes, it is even the only way to use a heat pump in an older building.

2.1.3. Cost of Thermal Energy Delivered to the Building

This cost is directly related to the energy source used and, indirectly, to the type of energy resource. Currently, in Polish residential buildings, the following heating techniques are most commonly used: district heating, solid fuel boilers (single- and double-function), natural gas boilers (single- and double-function), direct electric heating (radiators and heating mats), indirect electric heating (air and ground heat pumps), and fireplaces and stoves (both for solid fuels). For example, in 2021, solid fuels (in single-family buildings) and district heating (in multi-family buildings) were mainly used for space heating in Poland. District heating was used in almost 50% of all households [37]. Solid fuels were used by almost 33% of households, mainly hard coal and firewood. A smaller number of households used only coal (approx. 9% of households) or only wood (approx. 7% of households). Other fuels (other types of biomass, brown coal, coke) were used much less frequently. Third place (among energy carriers used for heating purposes) was occupied by natural gas, which was used in almost 15% of households. The next carriers used for heating buildings were electricity, liquid fuels, and other techniques. They were characterized by a marginal share. More recent data indicate that in 2023, there were almost 5 million gas boilers, almost 8 million solid fuel boilers and furnaces, and almost 350 thousand heat pumps in Poland. However, some households had more than one heat source [38]. The share of single-family buildings using only sources for solid fuels constituted over 56% of the total (approx. 3.39 million houses). In turn, the share of buildings using only low-emission sources constituted approx. 27% (over 1.6 million houses). Heat pumps (as the only source of heating) were used in 3.03% of single-family buildings (183,046 pcs.) [39]. According to the Central Statistical Office report (from 2021), heat pumps were used in only 0.8% of residential buildings in Poland [37].

2.1.4. Price of Energy Carriers

In recent decades (especially in the last few years), the price of energy carriers has been constantly rising. Each type (district heating, coal, wood, natural gas, and electricity) has become more expensive. For this reason, the government in Poland has applied various forms of support (albeit temporarily), such as subsidies for the purchase of coal (“coal allowance” [40]) and subsidies for energy (“energy voucher” [41]). It has also applied other measures, such as “freezing prices” of electricity and gas fuel. These prices have been changed several times. Currently, the price of electricity and natural gas is still regulated by law, but market tariffs are to be restored in the second half of 2025.

2.1.5. Efficiency of the Heating System

This efficiency is not constant, as it depends on various factors, depending on the type of heat source. The efficiency of a natural gas boiler ranges from about 80% in the case of older (“conventional”) devices to as much as 109% in the case of condensing furnaces. However, the actual efficiency of the system depends on the possibility of power modulation, heating parameters (e.g., whether the condensation process occurs), etc. This means that the actual seasonal efficiency is lower (up to several percentage points) [42]. These values are even lower for solid fuel boilers. They depend on the boiler class to which it has been assigned. The newest boilers (class V) should have an efficiency of no less than 88% (values for 10 kW) [43], class IV boilers should have 82%, and class III boilers should have 73% [44]. Older boilers, stoves, fireplaces, and other heating devices (especially “outside the class”) may be characterized by even lower efficiency. In extreme cases, the total efficiency of the heating system (installation) may even drop below 50%. In combination with poor-quality raw materials (e.g., coal), the cost of each kilowatt-hour of supplied heat may be much higher than in the case of other energy carriers. For example, in a modern heat pump, the seasonal efficiency coefficient (SCOP) can be as high as 3–5, depending on the supply temperature. This means that for every kilowatt-hour of electricity supplied to the device, it can produce 3–5 kWh of heat energy. In Poland, the vast majority (as much as 74%) are buildings constructed before 2002, which were designed based on older technologies and standards [45]. This means that their thermal insulation is lower; i.e., their energy consumption is higher.

2.2. Model Assumptions

In order for the research to reflect real conditions, we decided to perform calculations for an existing building (with real parameters) and not an “average” one for Poland. For this reason:
  • We did not use the Central Statistical Office data on average square footage and year of construction [46];
  • We did not assume an average location (usually Warsaw or central Poland);
  • We did not take into account the average meteorological data [46,47].
The main reason why we have abandoned calculations based on averaged data is their lack of reliability for a specific case. For example, during theoretical considerations, the “averaged” technology in which the house was built is taken into account, including the materials used, its insulation, etc. This, in turn, affects the energy consumption of the building. This is clearly visible in Table 1, where:
  • The primary energy indicator concerns the index of non-renewable energy used for heating, ventilation, and DHW;
  • The final energy indicator concerns the energy of the demand on the heating and ventilation and DHW.
As can be seen, there is a large difference in the demand for thermal energy in a building, depending on the year of its construction. This means that the adoption of “average values” can pose a significant problem for the correctness of further calculations. Therefore, we focused our attention on one specific example.

2.2.1. Building

The building is located in Bielsko-Biała (a city in southern Poland). It was built in the 1990s. In 2010, it underwent the first thermal retrofitting (insulation of external walls with 10 cm-thick polystyrene). The second thermal retrofitting (replacement of windows with triple glazing; insulation of the attic with 30 cm-thick mineral wool) took place in 2022. The building is single-story, without a basement, and with an unheated attic and an unheated garage.
The most important technical data are as follows: building area 112 m2; total area 224 m2; heated area (accepted for further calculations) 178 m2.
The volume was calculated based on the height of the rooms, which are 230 cm on the ground floor and 260 cm on the first floor. The walls were built using mixed technology, from solid ceramic bricks and “alpha” slag concrete blocks with an internal, non-ventilated air layer.
After thermal retrofitting (10 cm-thick polystyrene boards), the thickness of the walls is 53.3 cm, and the total permeability coefficient is 0.284 W/m2K (area approx. 280 m2). Windows have a permeability coefficient of 0.850 W/m2K (area approx. 38 m2). The floor on the ground is 112 m2, and the permeability is 0.369 m2K (5 cm-thick polystyrene boards). The roof is made of ceramic tiles (147 m2), insulated from the inside with two layers of mineral wool and a plasterboard. The roof has a permeability coefficient of 0.123 m2K.
Maintained indoor temperature during the heating season: ground floor (without garage) 19 °C, first floor 21 °C. For further calculations, we assumed an average value of 20 °C. The thermal energy demand (approx. 19,000 kWh) we calculated based on weather data from 1991 to 2020 for Bielsko-Biała. The calculated average daily thermal energy consumption in the heating season is 105 kWh, the maximum heating power is 9.6 kW, the average heating power is 4.4 kW, the heating power demand indicator is 54 W/m2, and the power at a bivalent temperature of −13 °C is 7.9 kW (in alternative mode), with a heat pump (HP) share of 99%. The two additional calculated indicators are:
  • EU ≈ 107 kWh/m2/year (usable energy demand indicator);
  • EP ≈ 88 kWh/m2/year (non-renewable energy demand indicator).
All the above data are based on calculations performed on the dedicated website [49]. To verify these data, we commissioned a building audit in the form of a CHD (Calculated Heat Demand) document. The calculated data differed by several percentage points. For example, the heating power demand indicator was 56 W/m2, and the values for the maximum and average heating power and heat energy consumption were correspondingly higher. For further calculations, we assumed an average result of 55 W/m2. We set the maximum heating power at 10 kW, and the pump power at a bivalent temperature of −13 °C was set to 8 kW.

2.2.2. Central Heating Installation

Currently, the house is heated by a dual-function condensing gas boiler, which will be a peak source; i.e., it will take over the heating function when the outdoor temperature is lower than the bivalent temperature for the heat pump. The heating in the building is based on oversized radiators, so the supply temperature can be low and range between 35 °C and 50 °C (heating curve) or 40 °C (constant operating mode). To carry out the calculations, we decided to assume three heating scenarios:
1.
Constant temperature 40 °C (for heating with oversized radiators);
2.
Constant temperature 30 °C (for surface heating, e.g., underfloor heating);
3.
Variable temperature between 35 °C and 50 °C (for heating with standard radiators, which are slightly oversized due to the thermal retrofitting of the building). The following supply temperatures were assumed, depending on the outdoor temperature (heating curve of the heat pump or gas boiler):
  • LWT 35 °C for temperatures 10…20 °C;
  • LWT 40 °C for temperatures 0…9 °C;
  • LWT 45 °C for temperatures −1…−9 °C;
  • LWT 50 °C for temperatures −10…−20 °C.
We decided to adopt certain simplifications that ultimately do not affect the correctness of the calculations. We assumed that the central heating system operates continuously—i.e., 24 h a day. Naturally, such a state occurs rarely, although it is most desirable for a system with a heat pump. However, even if it does not operate in this way, the average values will still be maintained because it does not matter much whether the system operates, for example, with a 15/15 min or 120/120 min cycle; the amount of heat energy supplied to the building and the installation will still have to be the same.
In addition to the above assumptions, we decided to assume a value of 100% efficiency for the gas boiler, which seems to be sufficient. Since for this type of heating there is a negligible difference in efficiency in the range of the above supply temperatures (i.e., 35–50 °C), we carried out the calculations for all values together; i.e., we used one calculation for all LWT, regardless of the temperature set on the boiler, in the range of 35–50 °C.
For the calculations, we selected a three-phase air-source heat pump of the monoblock type, LG Therma-V R290, with the designation HM093HFX UB60 and a heating capacity of 9 kW. The choice of the heat pump was dictated by the desire to use modern solutions based on the R 290 (propane) agent, whose GWP (Global Warming Potential) is the lowest among the currently used agents for heat pumps. In addition, the selected pump is characterized by high COP indicators, it is a high-temperature pump, and its heating capacity (9 kW) is maintained at LWT 50 °C at a temperature of −15 °C and at LWT 30 °C at −20 °C. The full heating efficiency table is available on the manufacturer’s website [50].
It is also significant that the manufacturer has provided tabular data, taking into account the defrosting process, which allows for obtaining results that are closer to reality. Failure to take this process into account may mean additional, significant (even several dozen percent) energy consumption, affecting the COP indicator.
Due to the fact that we are not able to check the actual parameters of the heat pump, we have adopted the values provided by the manufacturer in the heating efficiency table. Since the manufacturer stated that these values can be interpolated, we obtained COP data for each of the following temperatures: 30 °C, 35 °C, 40 °C, 45 °C, and 50 °C. Finally, we obtained a table with 1 °C steps for outdoor temperatures between −20 °C and 20 °C for the above-mentioned LWT temperature values (Appendix A). We used the obtained values for further calculations, in which we assigned the corresponding COP coefficient to specific outdoor temperatures and supply temperatures.
The basic assumption in these calculations is the use of COP coefficients declared by the heat pump manufacturer. For theoretical analyses, this is the only reliable basis for estimating the relationship between the amount of thermal energy produced by the heat pump and the electricity drawn from the grid, and therefore for determining its efficiency. Any deviations in the actual values from the manufacturer’s data will proportionally affect the final results. However, in the context of theoretical calculations, we determined that relying on LG data is the only possible and justified solution.
Other simplifications, such as the assumption of the continuous operation of a central heating system and a 100% gas boiler efficiency, do not significantly impact the final results. This means that the impact of these assumptions on the final calculations can be considered negligible. A detailed installation diagram with a description is given in Appendix B.

2.2.3. Climate Data

The house is located in climate zone III, in which the average monthly temperatures (climate norms) in the years 1991–2020 were as follows: January: −0.9 °C; February: 0.2 °C; March: 3.5 °C; April: 9 °C; May: 13.4 °C; June: 16.8 °C; July: 18.7 °C; August: 18.5 °C; September: 13.8 °C; October: 9.3 °C; November: 4.8 °C; December: 0.3 °C; Year average: 9.0 °C [51]. However, the use of average monthly temperatures is not accurate enough to estimate the actual demand for thermal energy to heat the building under study. For this reason, we decided to use existing data from the meteorological station located in Bielsko-Biała [52].
We took into account average daily temperatures, separately for the period 1 October 2022–30 April 2023 (season I) and for the period 1 October 2023–30 April 2024 (season II). In this way, we obtained data for 212 days from heating season I and 213 days from heating season II (the difference is due to the occurrence of a leap year in 2024). We chose these heating periods for several reasons. First of all, there are currently no legal regulations regarding the start and end of the heating season in multi-family buildings. Various approaches are used, based either on the outdoor temperature or on the wishes of heat users (e.g., housing cooperatives). In the case of single-family buildings, such regulations have no force at all. Additionally, there are often situations when, after a few days of heating, there is a break (due to warming) or vice versa; in April or May (after a few or a dozen days without the need for heating), there will be a large drop in temperature and the heating will be turned on again. Therefore, after analyzing the data from the weather station and taking into account our own experience, we decided to adopt the above heating period.
The temperatures entered into the model were rounded to full degrees Celsius. We assumed that daily temperatures of 20 °C meant the building’s demand for thermal energy was at the level of 0 kWh, so higher temperatures were taken into account as 20 °C (only one such situation occurred, on 8 April 2024). Appendix C presents the calculated values of heating power and daily thermal energy consumption individually for each temperature in the range of −20 °C…20 °C, with the following parameters: building area 178 m2; heat demand 55 W/m2.
The average daily temperatures are of course not as precise as their hourly distribution, for example. However, considering that we averaged the daily operation of the heat pump, it seems that using more precise data would introduce complications and possibly distortions. For example, if the heat pump worked in ON/OFF mode for 120/120 min, it would be impossible to estimate when the operating mode was activated (what time, corresponding temperature and COP). In our opinion, introducing daily data into the model is a big change compared to studies based on monthly data. As a result, we received a much better representation of real conditions and the accuracy of calculations.

2.2.4. Cost of Energy Carriers

To calculate the final heating cost, the amount of heat energy must be converted to the amount of energy delivered by a given carrier, which is then multiplied by the unit energy cost. In our study, we will focus on two carriers:
  • Electricity;
  • Natural gas.
In the last few years, the prices of both of these carriers have been growing rapidly. The support programs (form the Polish government) made it difficult for us to forecast heating costs after they are finished (announced for the second half of 2025) [53,54]. Additionally, we had to take into account the fact that rates for energy carriers and the fee for their distribution are charged separately. This applies to both electricity and natural gas.
In the case of Bielsko-Biała, PGNiG is the gas supplier and Tauron is the electricity supplier. Therefore, in the calculations, we had to include the prices of these two producers and suppliers. For gas fuel, we assumed two price components: the price of gas fuel and the distribution fee. Both price components depend on the amount of fuel used (kWh). We did not include fixed fees (subscription fees, etc.), which the recipient must pay anyway when using gas for other purposes (hot water, gas cookers, etc.).
Similarly, in the case of electricity, we did not include fixed charges, but the cost of each kilowatt-hour consists of more components, namely active energy charge, quality charge, network charge, RES charge (renewable energy sources), and cogeneration charge. The price of some components (such as RES, quality, and cogeneration charges) does not depend on the selected tariff, so we have no influence on this. The remaining components may differ depending on the selected tariff. For the our study, we selected three different tariffs from the Tauron offer:
  • G11: The same rate for electricity, regardless of the time of day;
  • G12: Cheaper electricity during the day from 1:00 p.m. to 3:00 p.m. and at night from 10:00 p.m. to 6:00 a.m.;
  • G12w: Cheaper electricity during the day from 1:00 p.m. to 3:00 p.m., at night from 10:00 p.m. to 6:00 a.m., on weekends, and on public holidays. Note: Despite similarities, there are differences in rates between the G12 and G12w tariffs.
In addition, there are also available tariffs (which will not be included in our study);
  • G13: Morning tariff (average price) from 7:00 to 13:00; afternoon tariff (highest price) in summer from 19:00 to 22:00, in winter from 16:00 to 21:00, other hours (lowest price) in summer from 13:00 to 19:00 and from 22:00 to 7:00, in winter from 13:00 to 16:00 and from 21:00 to 7:00, and on weekends;
  • G14 dynamic (appeared from 1 January 2025): Energy prices depend on market prices [55].
For further calculations, we adopted two price variants for energy carriers:
(a)
Current prices;
(b)
Future (forecasted) prices.
In the case of electricity, current and forecast prices are based on official data [56,57]. In the case of natural gas, we took the current prices from the price lists and estimated future prices based on probable values after the “unfreezing” of prices, i.e., an increase of about 19% (for simplicity, we took into account an increase of 20%) [58,59].
Due to the assumption of daily time periods (pump operation and temperatures), for the G12 and G12w tariffs, we took into account the appropriate proportions related to the validity of specific rates. For this purpose, in the calculations, we took into account the prices from a given tariff and the number of hours they were valid. On days when the lower rate in the G12w tariff was valid (i.e., Saturdays, Sundays, and holidays), we included all these days in further calculations. Gas prices calculated for the “GAS CURRENT” and “GAS NEXT” tariffs are presented in Table 2.
In Poland, the price of gas consists of two elements: a fuel fee and a distribution fee. Both net amounts were increased by VAT at the rate of 23%. As a result, we obtained the final price, which is the cost borne by the recipient (the GAS CURRENT total). Based on government declarations, we assumed an average increase (total for fuel and distribution) of 20% (final price for the “GAS NEXT” tariff). In turn, the final price of electricity consists of a larger number of components (described earlier). In Table 3, we presented calculations carried out for the G11 tariff, characterized by fixed rates.
We added VAT to the given net rates (Table 3), which gave us the final gross amount (to be paid by the recipient) for each kilowatt-hour. The G11 tariff does not require additional calculations because the unit price of energy does not change.
The G12 tariff price list consists of the same components (partial charges) as the G11 price list. Table 4 presents the calculations for the G12 tariff.
Unlike G11, the G12 tariff has two rates (dependent on the hours of electricity consumption) for each day:
  • For 14 h, the “peak rate” applies (more expensive);
  • For 10 h, the “off-peak tariff” applies (cheaper).
In our study (assuming daily settlement), it does not matter what hours these are. For the calculations, we used a 14:10 ratio in a 24 h period, obtaining the final, daily price. For the G12 CURRENT tariff, we assumed the applicable fees for active energy and distribution (taking into account the so-called “price freeze”, i.e., the statutory limit on the maximum price for energy). In turn, in the G12 NEXT tariff, we assumed the cost in accordance with the price list, which will be applicable in the future, without the regulation of the statutory limit of fees.
The G12w tariff is the most complicated offer among those included in our study. In Table 5, we present the calculations of electricity costs for this tariff.
Similarly to the G12 tariff, we made calculations by using the average rate per kilowatt-hour, with a 14:10 ratio on a daily basis. We assigned this price to working days. In turn, on weekends and public holidays, we applied the “off-peak tariff” rate for the entire day. Naturally, we made these calculations (according to the rules, as before) for the G12w CURRENT tariff and the G12w NEXT tariff.

2.3. Algorithm

We entered the aggregated data into the model and calculated the costs for different tariff options, both for electricity and gas. We took into account the future prices of these energy carriers, in relation to different heating options (LWT). To better present the relationships, we decided to compare heating costs separately:
(1)
Separately for the tested supply temperatures LWT;
(2)
Separately for the studied energy tariffs.
As a result, we received a more accurate and intuitive illustration of the obtained results, which made their interpretation easier. The research algorithm is presented in Figure 1.
The algorithm presents the sequence of steps and is based on an integrated simulation model. Its goal is to compare the economic efficiency of heating a building using a heat pump and a gas boiler in two heating seasons (2022/2023 and 2023/2024). It begins with an extensive analysis of the material (literature sources) and the collection of necessary data used for further calculations. The second step was to calculate the building’s initial parameters, including the thermal insulation value and the heat transfer coefficient. Based on this, we determined the thermal energy demand profile for various outdoor temperatures, ranging from −20 °C to +20 °C.
We introduced an actual climate data for Bielsko-Biała (from two consecutive heating seasons, 2022/2023 and 2023/2024) into the model. We also calculated the heat pump’s energy efficiency coefficients (COP) for various water temperatures feeding the heating system (LWT: 30, 35, 40, 45, and 50 °C). We then assigned these coefficients to specific temperature conditions, allowing for dynamic modeling of the device’s operation under changing climate conditions. Another essential element of the algorithm was the inclusion of energy tariffs. The model distinguishes between current and forecasted electricity and gas tariffs. Additionally, we assigned the day of the week and public holidays to the G12W tariff, enabling more accurate calculation of heat pump operating costs, given varying energy prices throughout the day.
In the next step, we introduced the integrated input data (climate, building parameters, heat pump performance characteristics, and energy tariffs) into the calculation module (MODEL), which allowed us to obtain accurate results for each heating season. The obtained results allowed us to compare the costs of heating the building with a heat pump and a gas boiler, given the specified tariff scenarios. The final step of the algorithm was to analyze the results and formulate conclusions, enabling us to assess the profitability of investing in a heat pump taking into account changing price and climate conditions.

3. Results

We decided to conduct analyses for two consecutive heating periods (Season I: 2022/2023 and Season II: 2023/2024), in which different climatic conditions occurred. This allowed us to compare the results obtained for different heating seasons.

3.1. Calculations for Season I

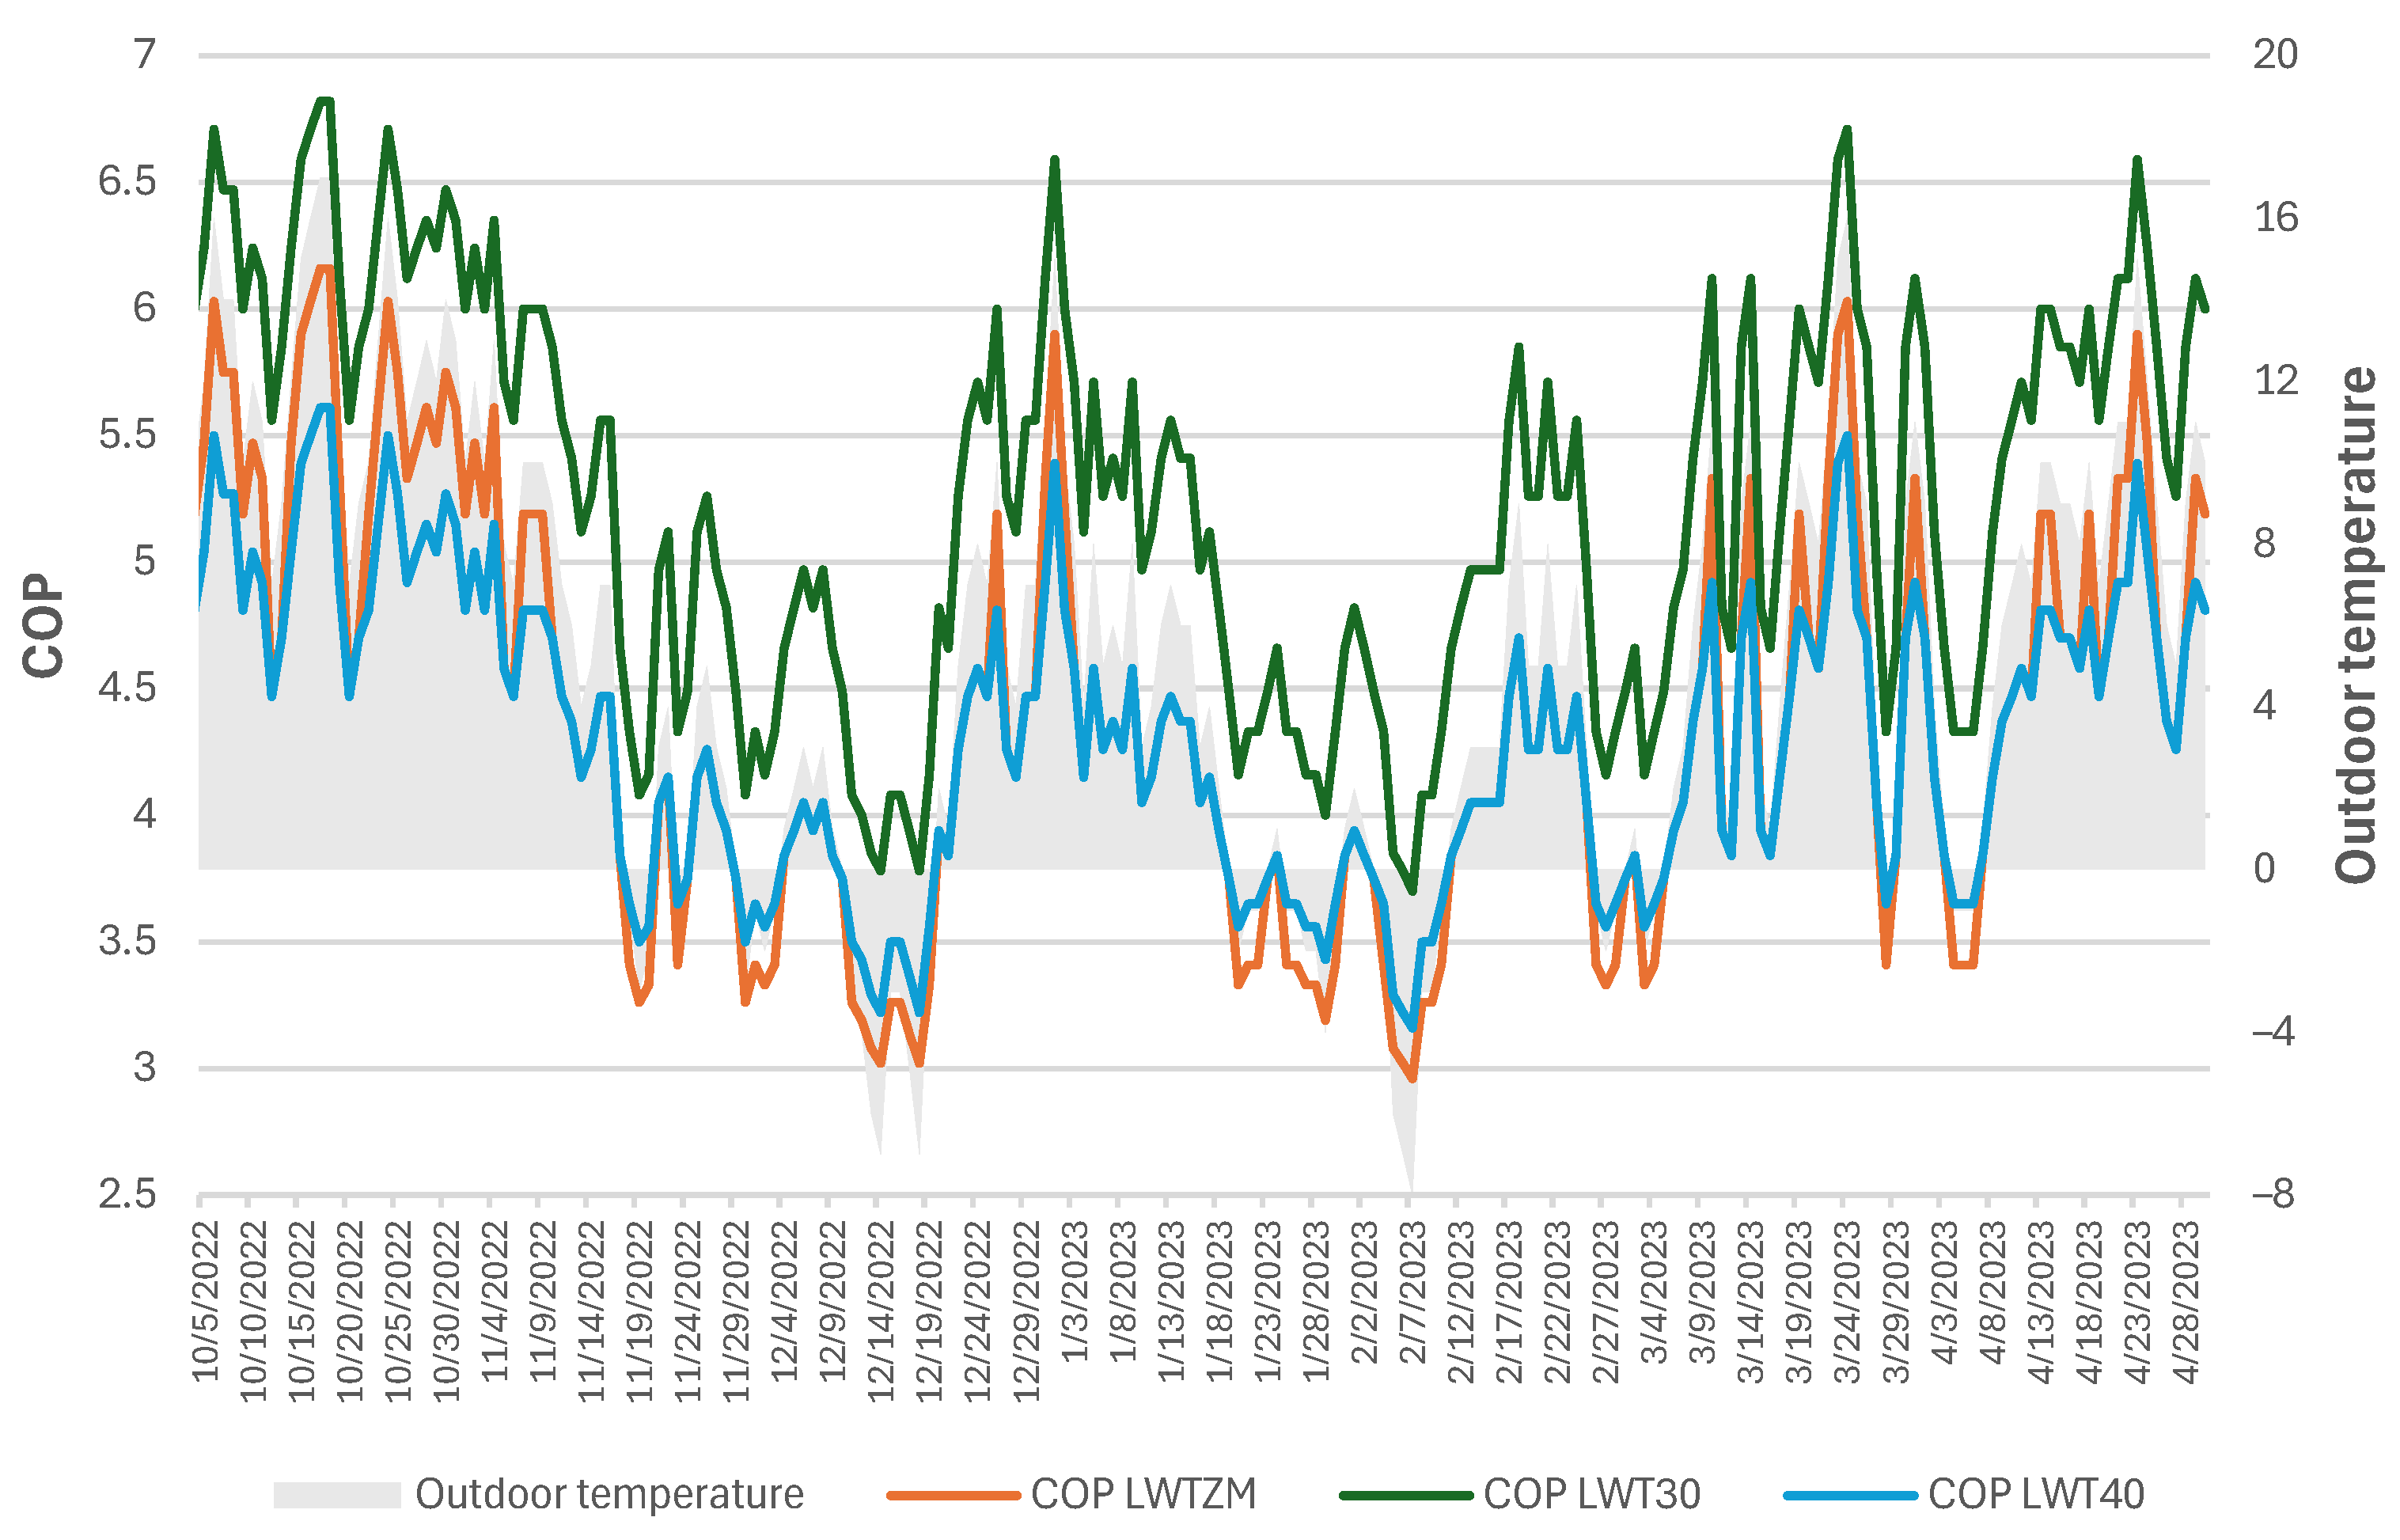
The graph for the outdoor temperature (against the background of the building’s demand for heat energy, day-to-day) in the analyzed period is presented in Figure 2. An inverse correlation is visible here between the previously calculated demand and the temperature. In turn, the correlation between the outdoor temperature and the COP coefficient achieved by the heat pump (for each of the LWT supply temperatures) is shown in Figure 3.
Naturally, the most advantageous is the supply with the lowest temperature (30 °C), i.e., LWT30. However, for the remaining parameters, there were periods in which LWTZM was more advantageous or LWT40 was more advantageous. At the same time, in a certain range of outdoor temperatures, both LWT parameters were characterized by an identical COP coefficient, which is consistent with the calculations (since LWTZM = LWT40 in a given temperature range). Additionally, it is worth noting that although the correlation between temperature and the obtained COP is understandable and obvious, the characteristics of these changes are not always the same, which in effect results in the occurrence of differences.
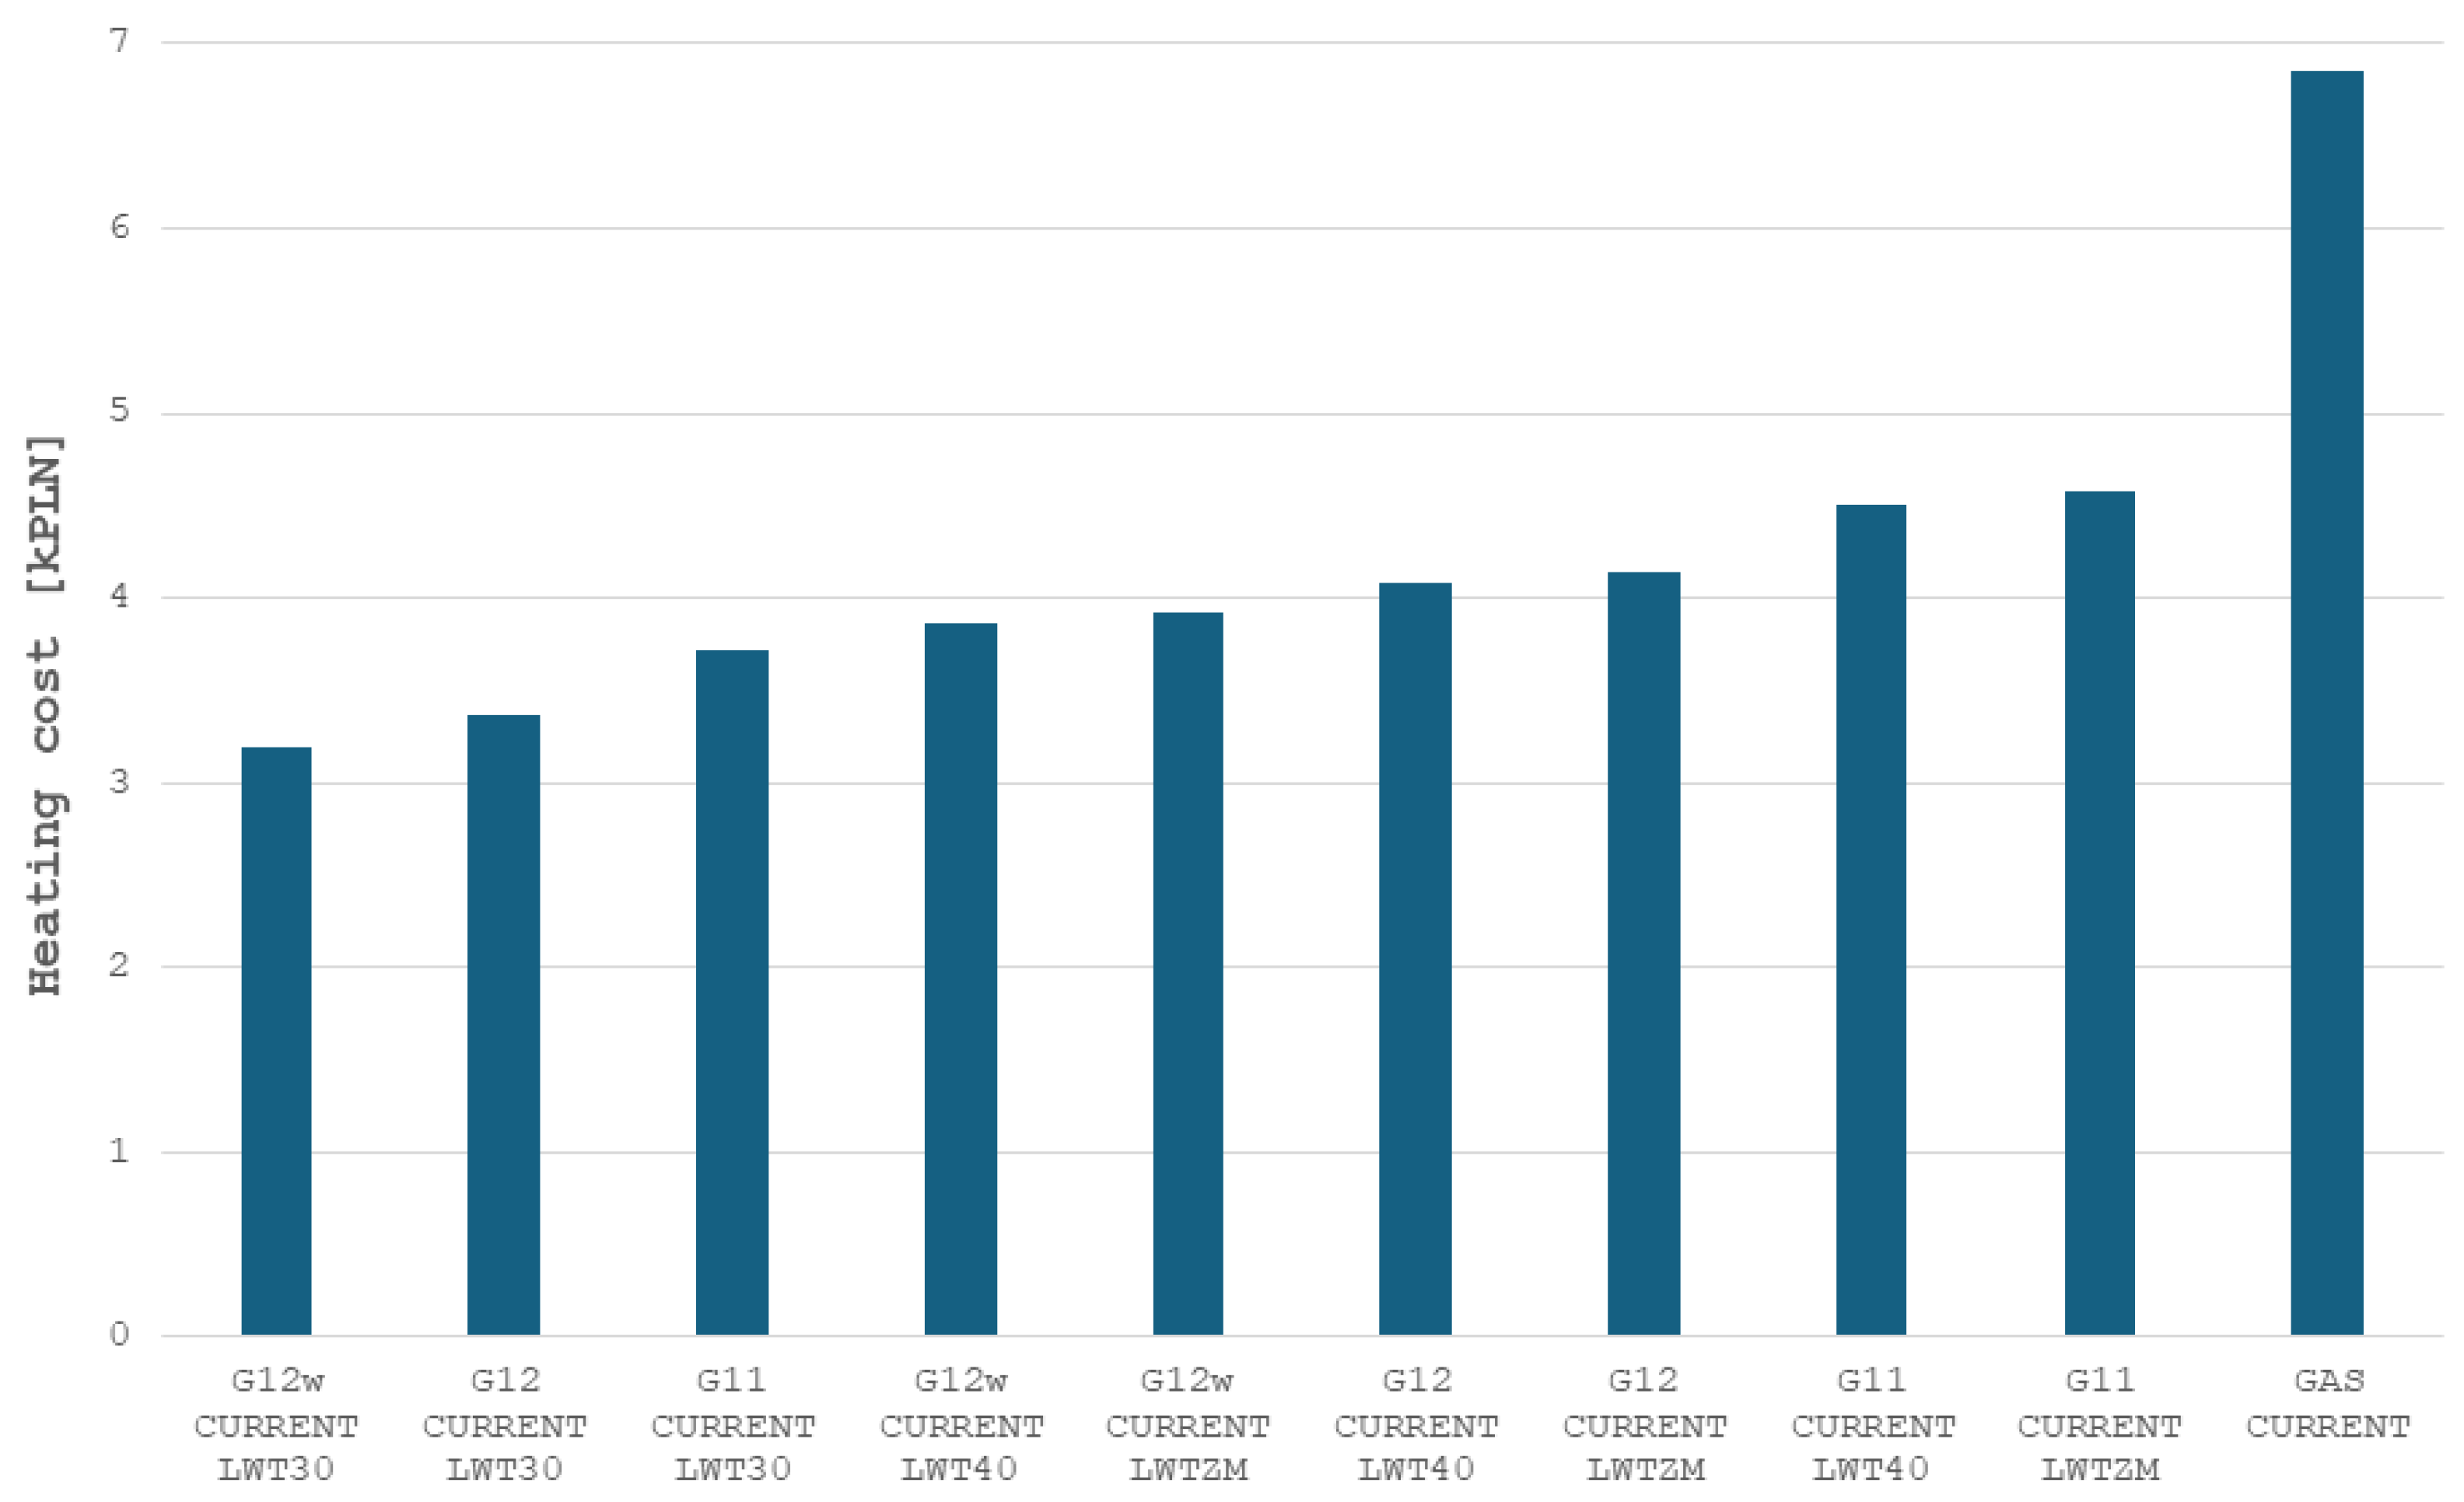
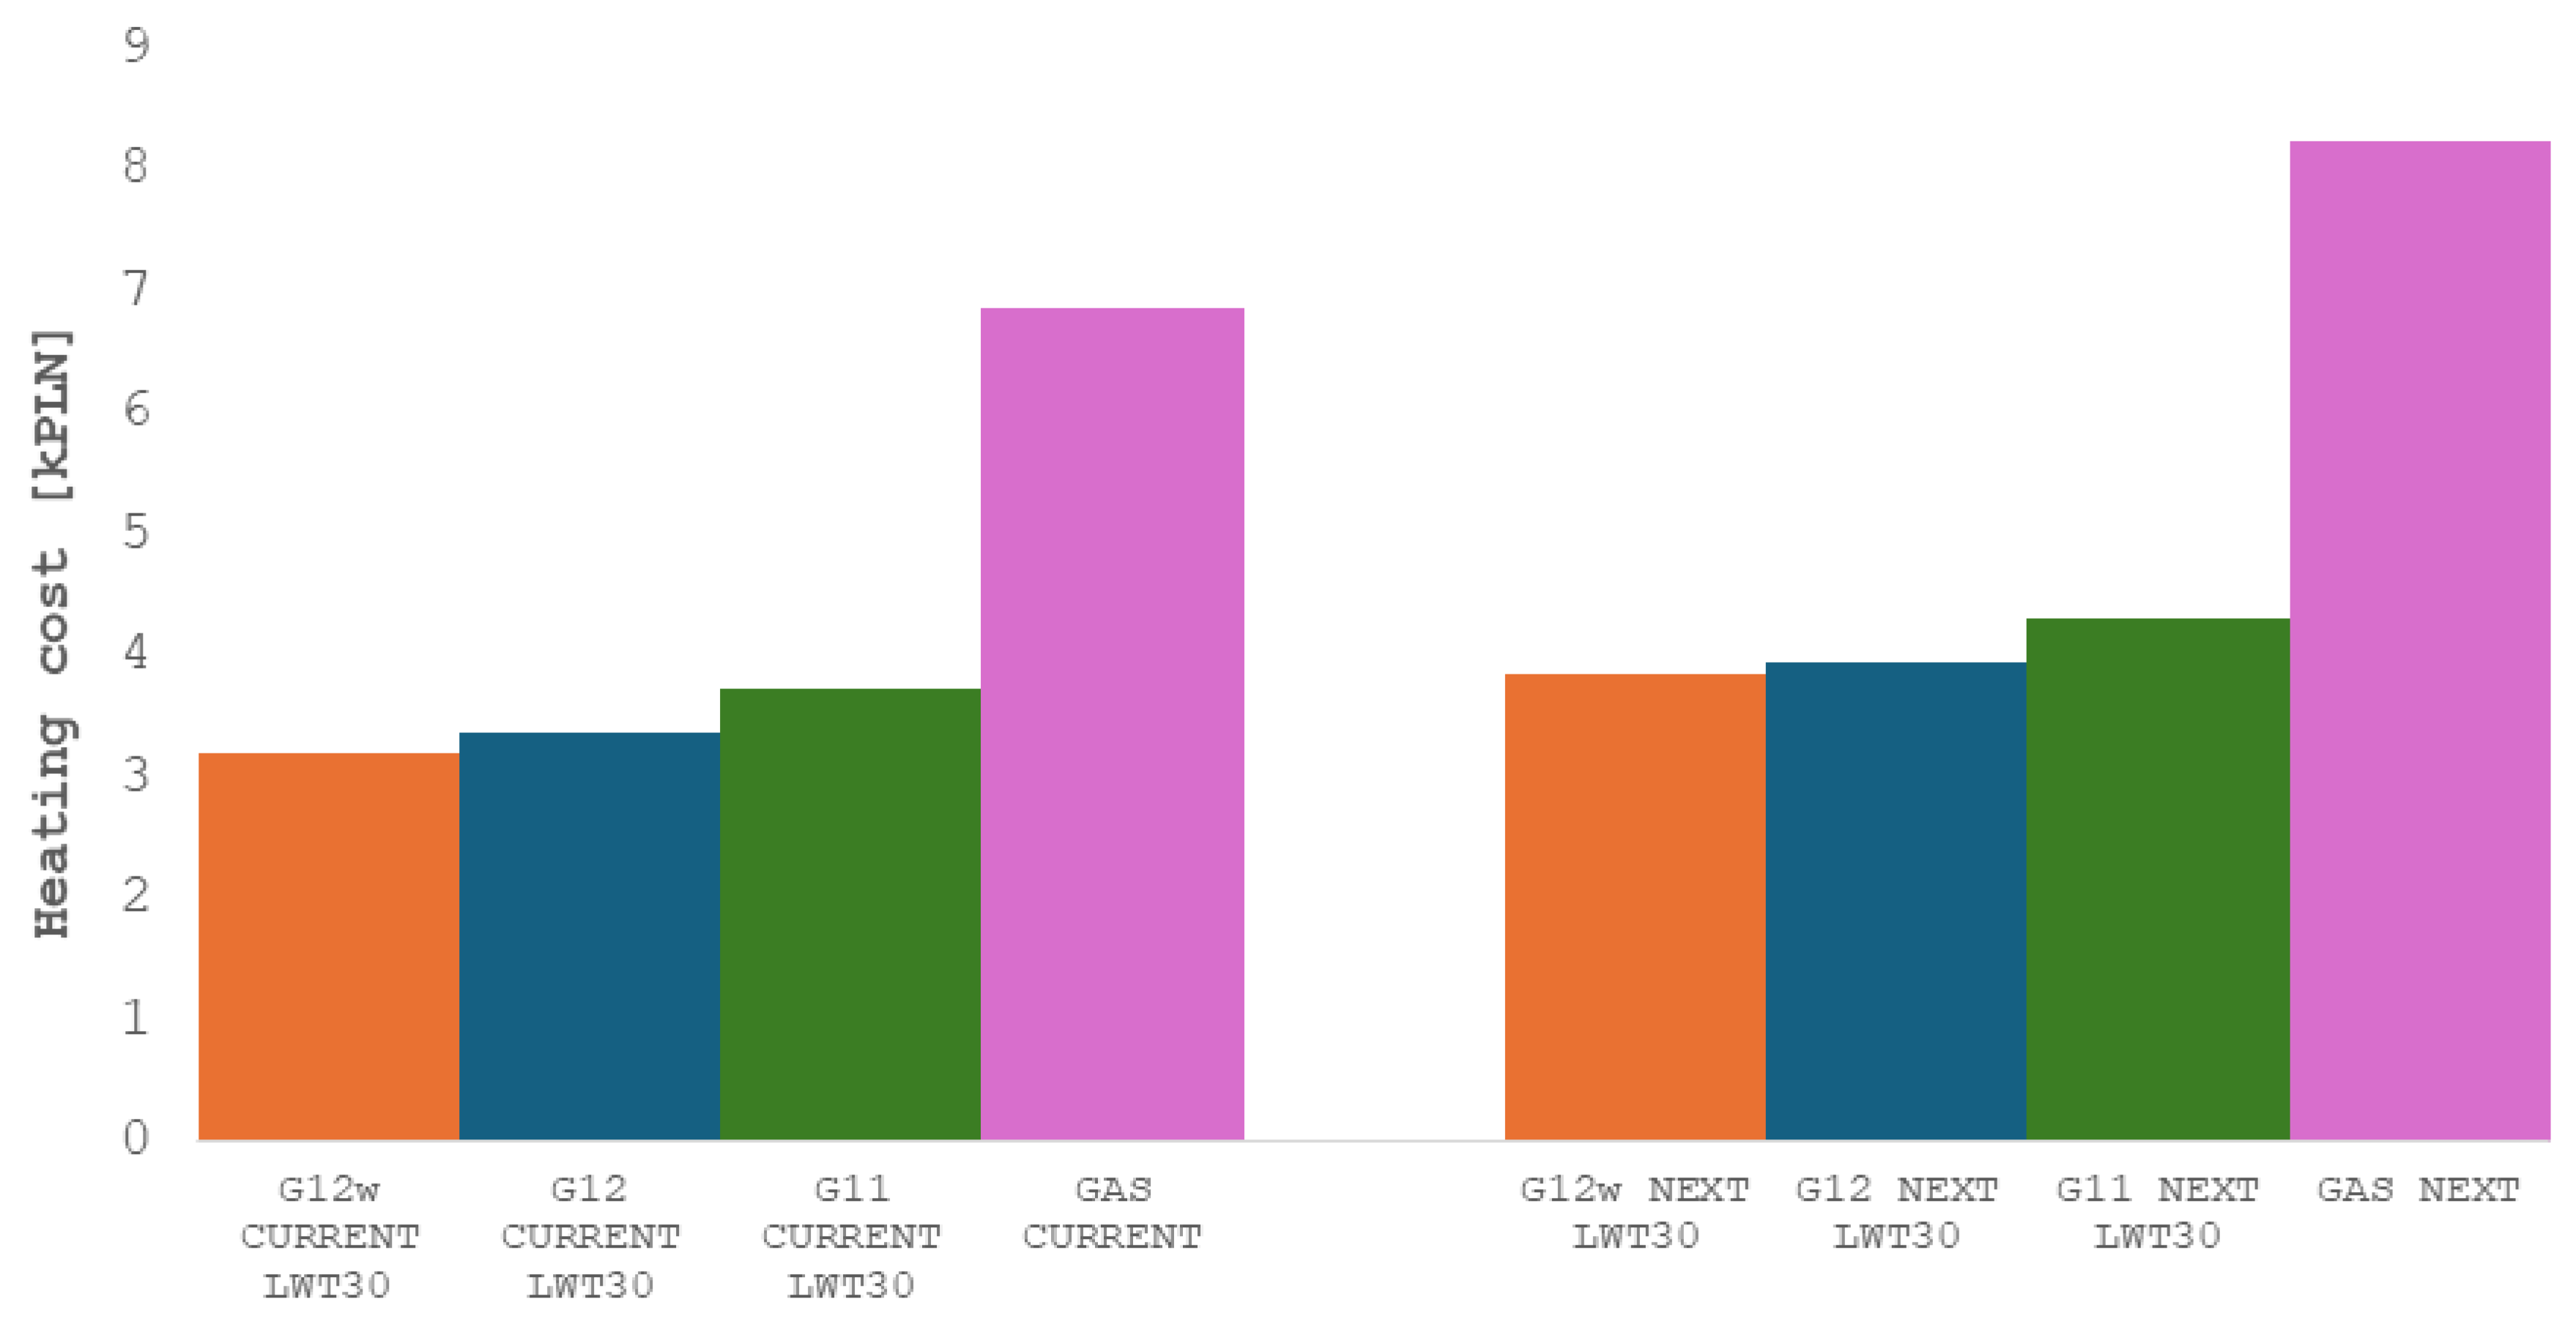
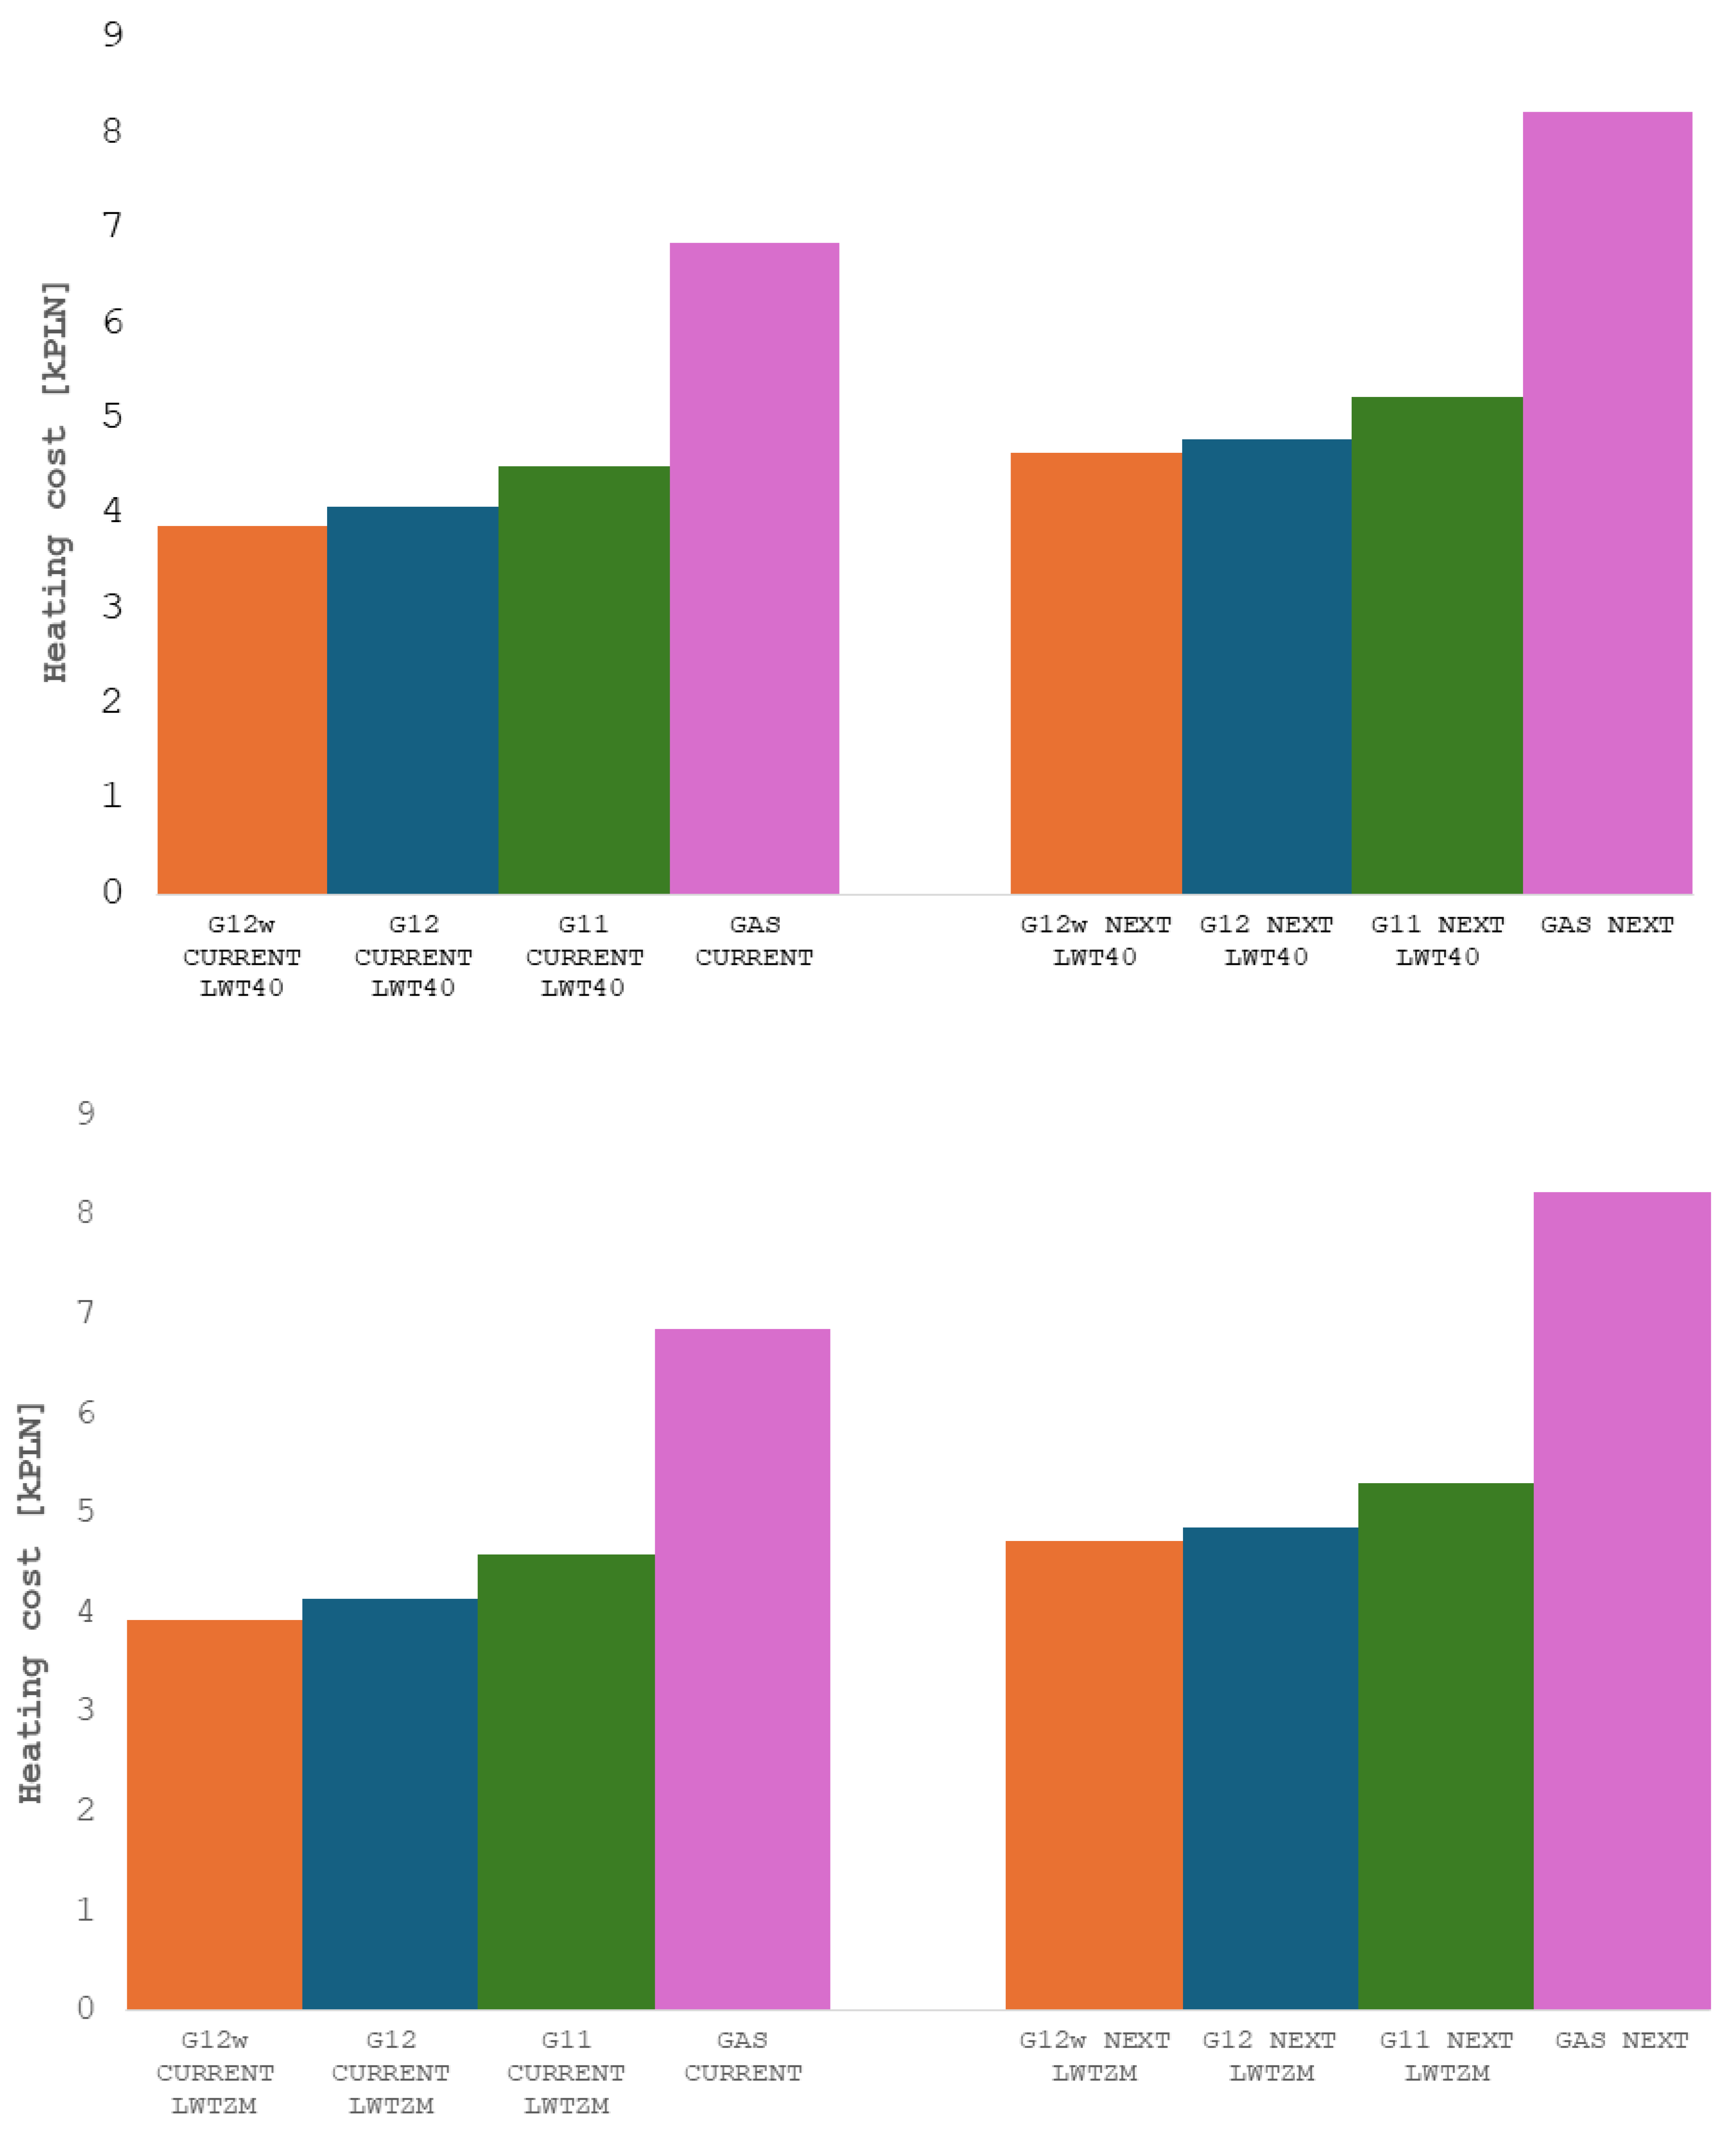
After entering all the necessary parameters into the model, we obtained a number of output data, which we grouped, taking into account the nature of the information. Table 6 presents the total cost of heating with all methods and technologies in the 2022/2023 season, which includes the tariffs currently in force. In turn, Table 7 presents the results calculated taking into account the future costs of energy carriers in Poland. The same heat pump heating techniques have been grouped into rows, i.e., for the parameters LWT30, LWT40, LWTZM, and (for comparison) the cost of gas heating. The columns present the cost of heating with a heat pump in various tariffs (G12w, G12, G11) and with natural gas.
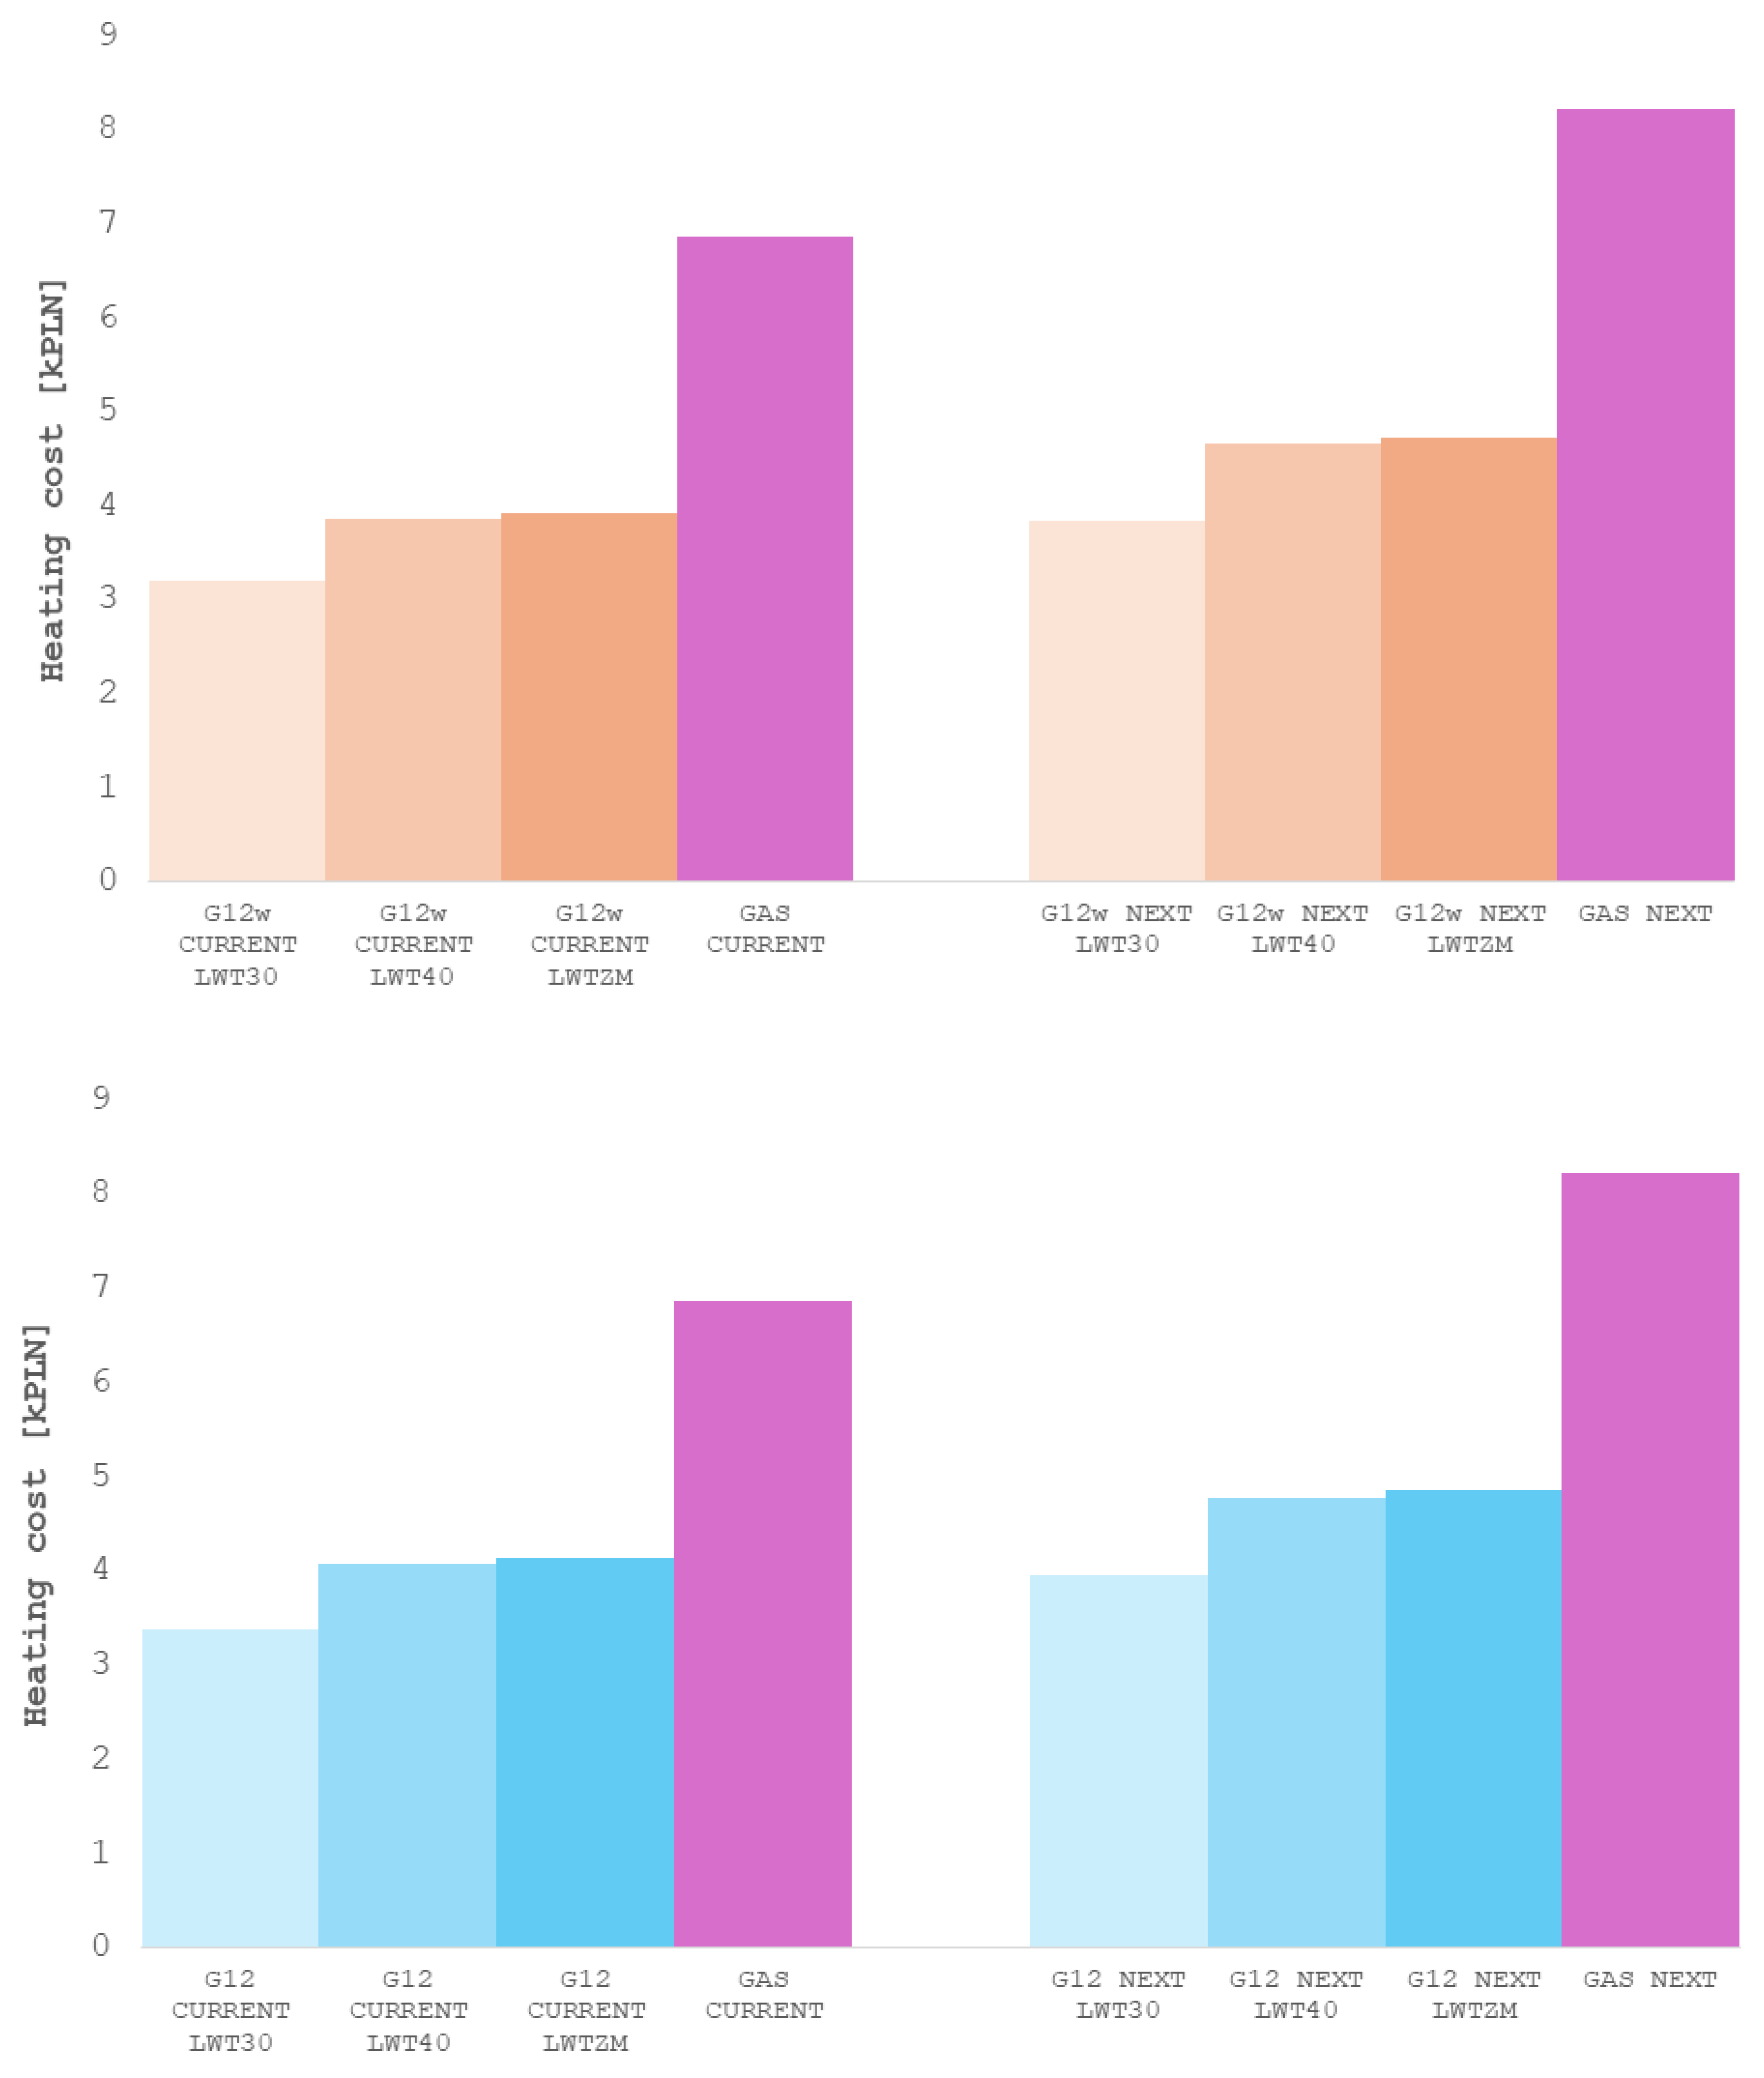
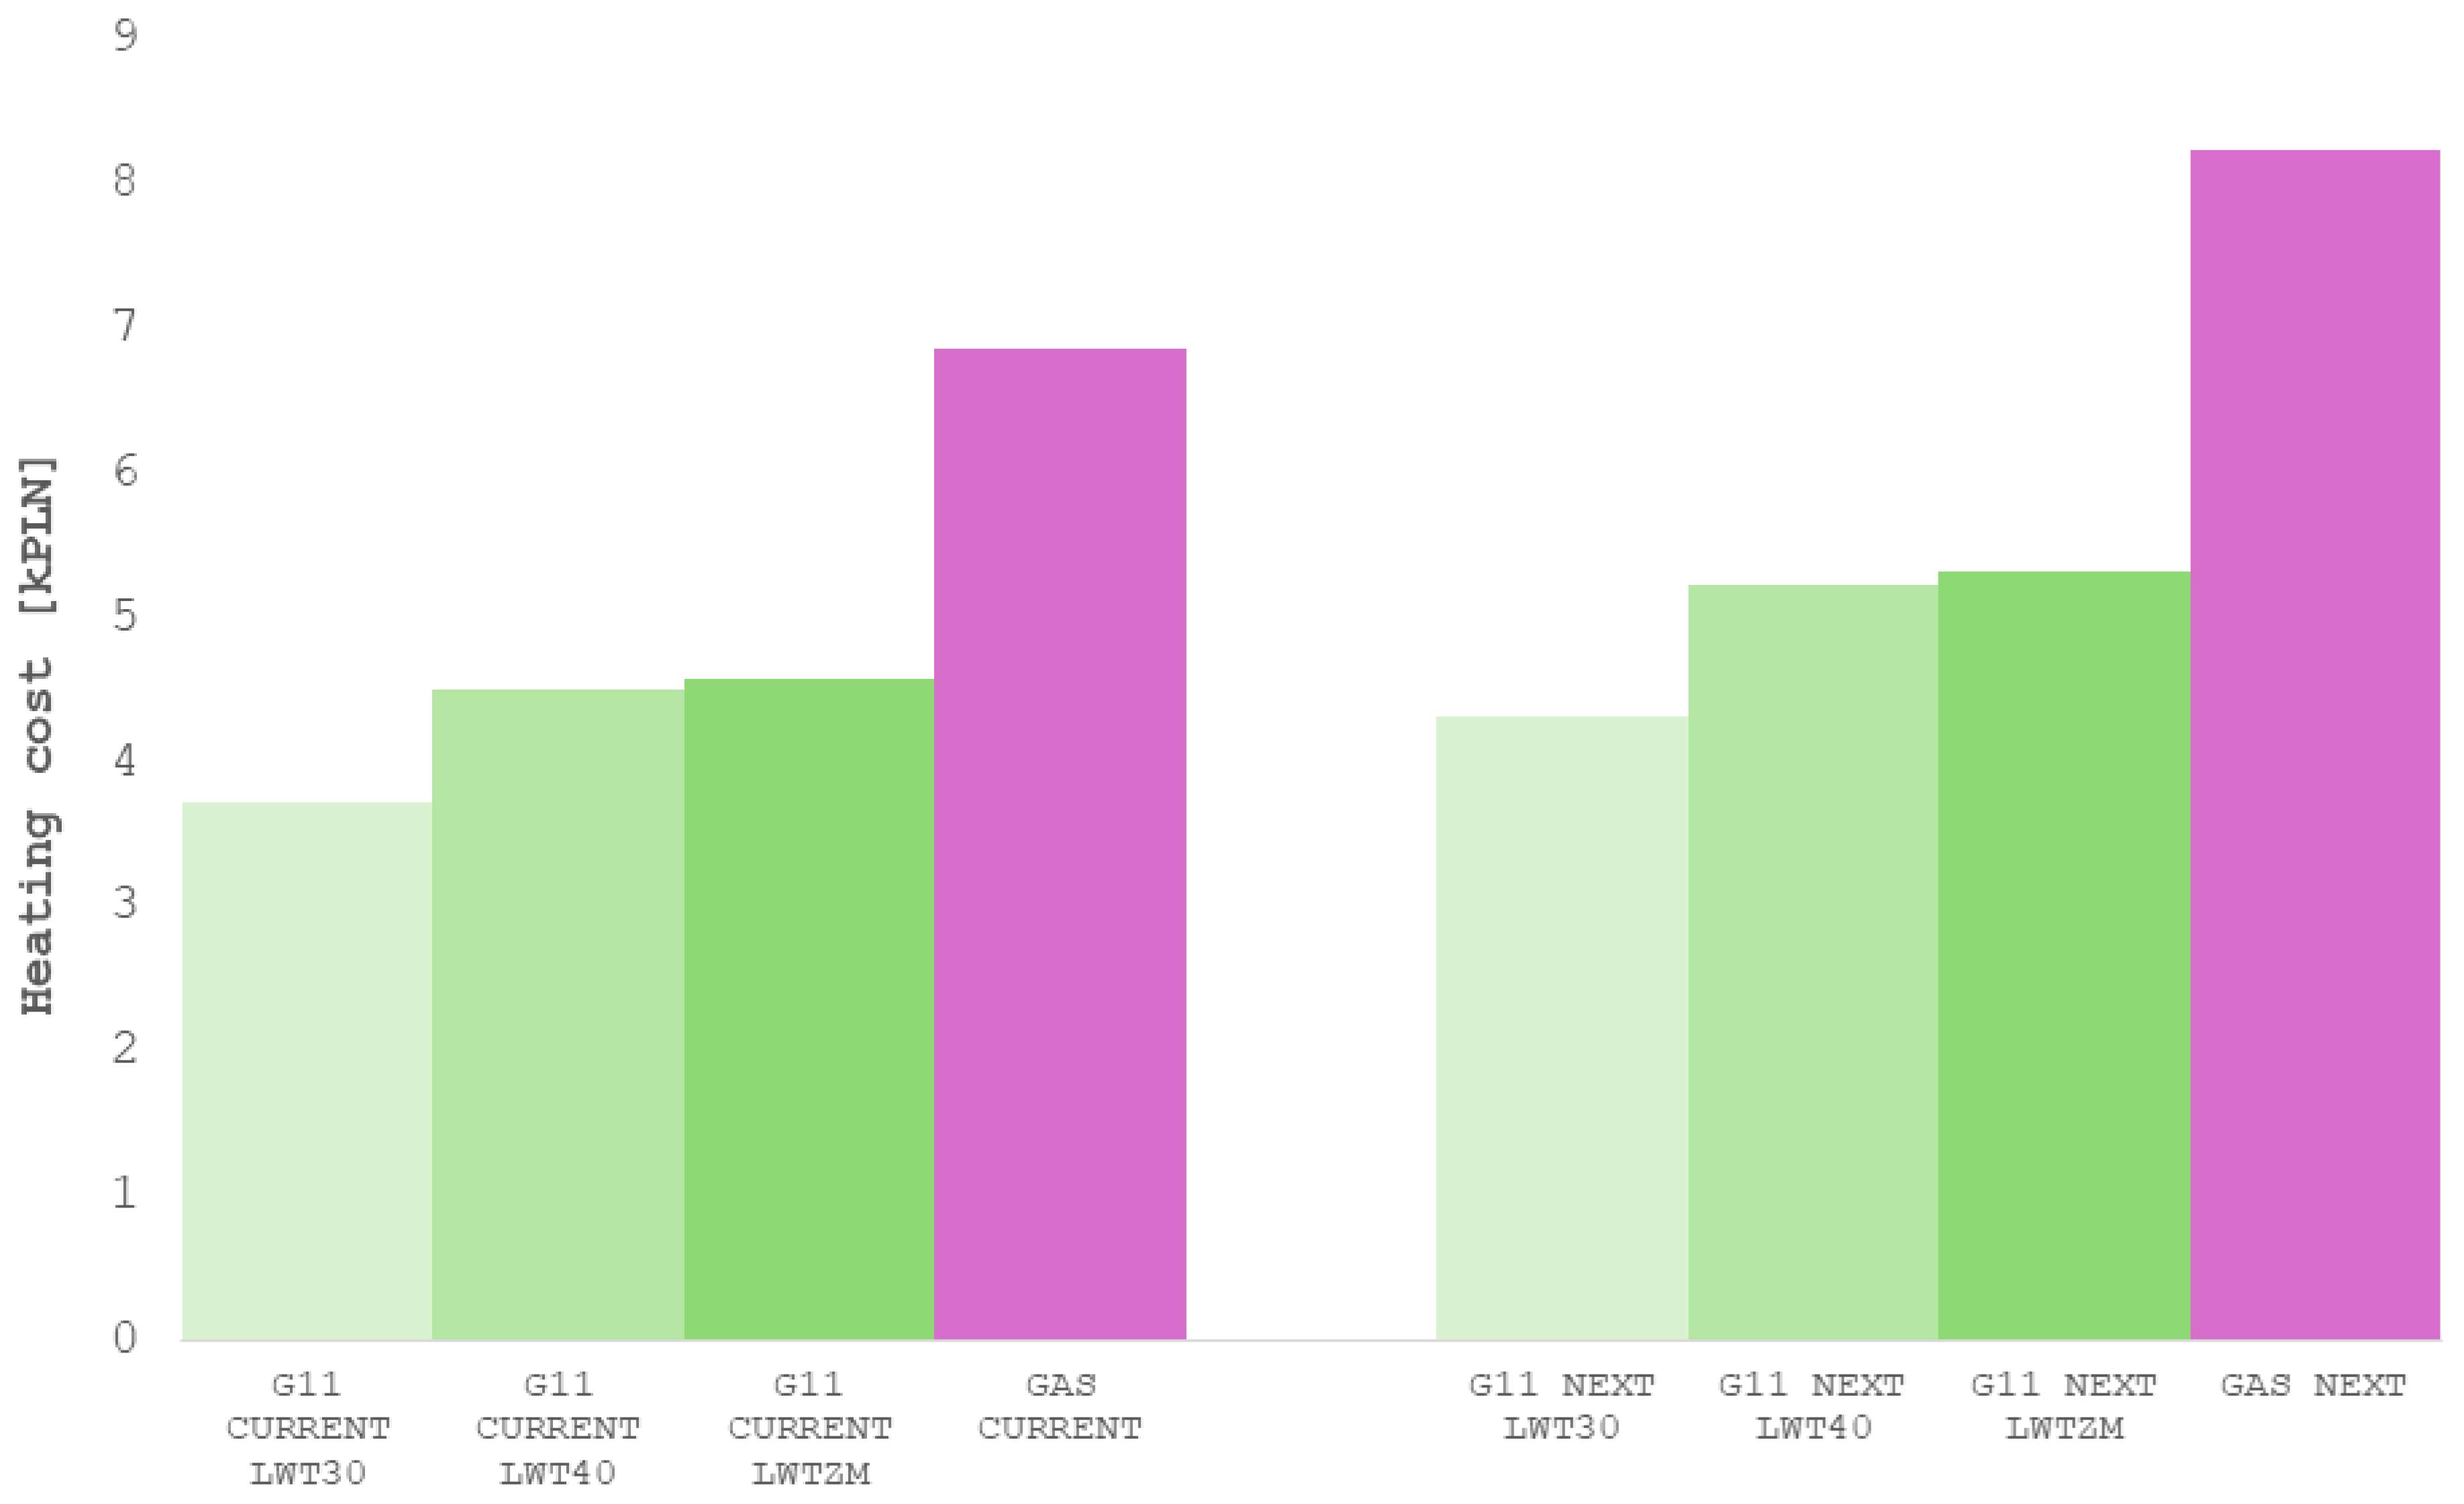
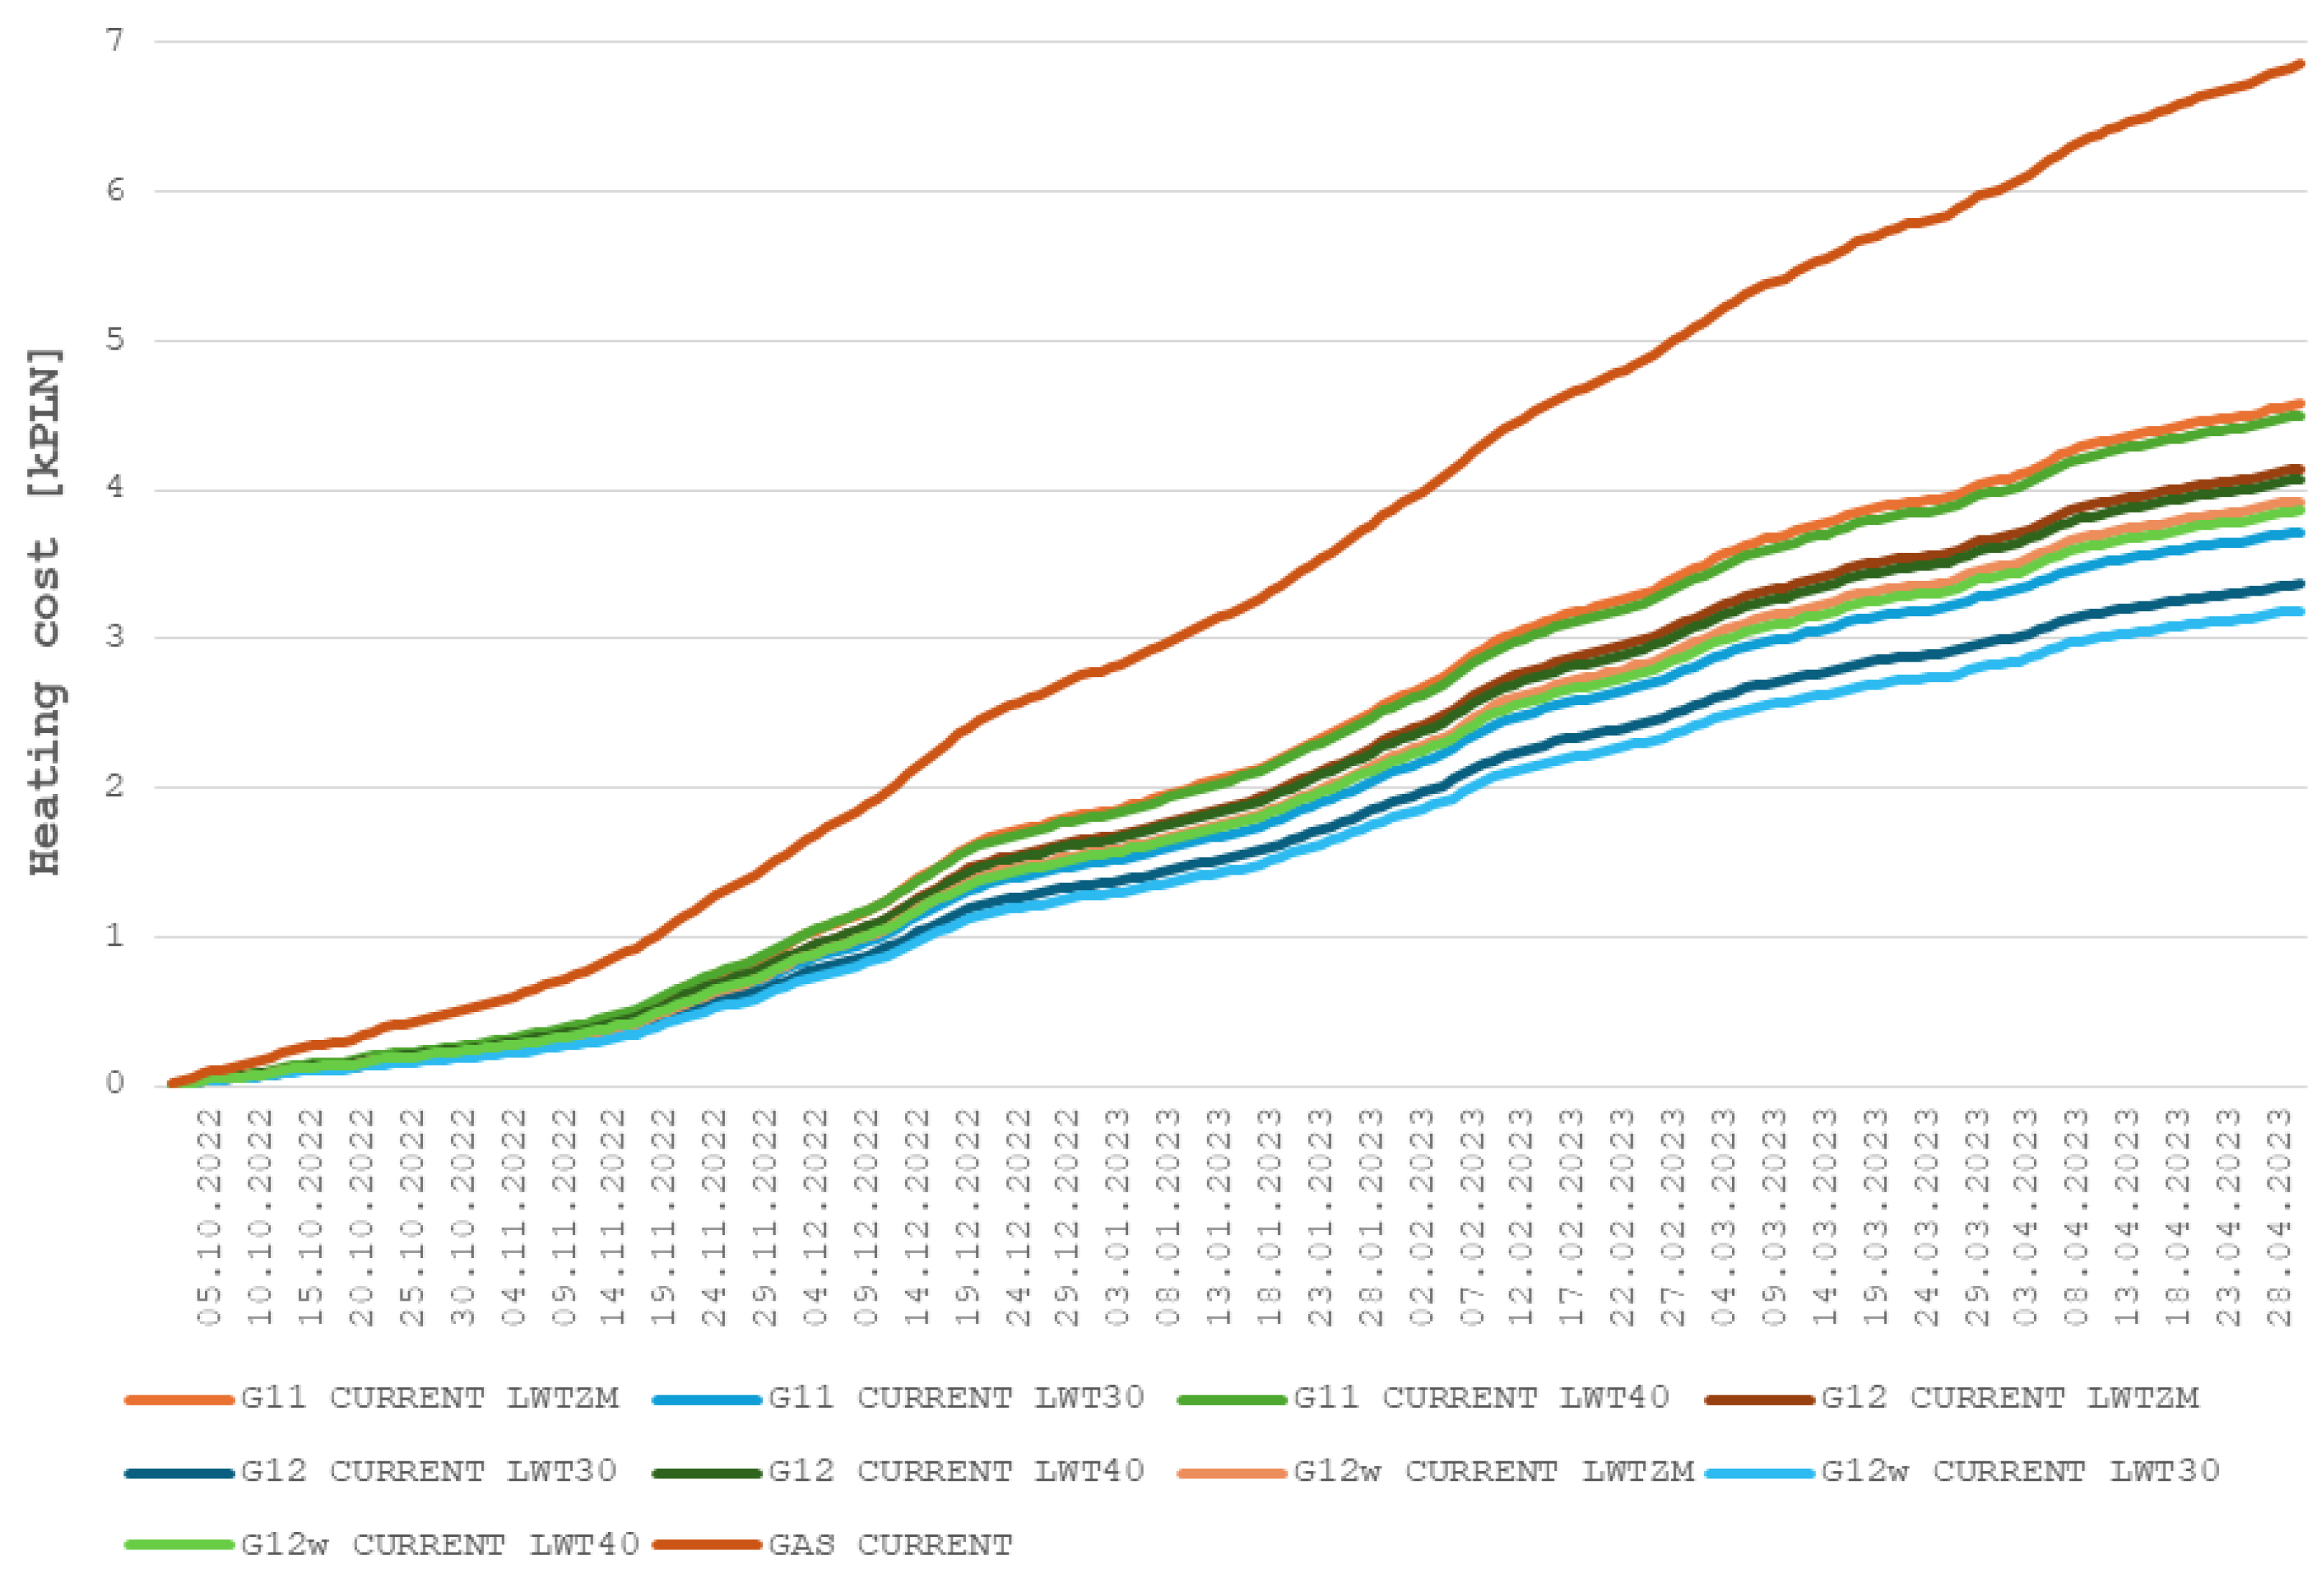
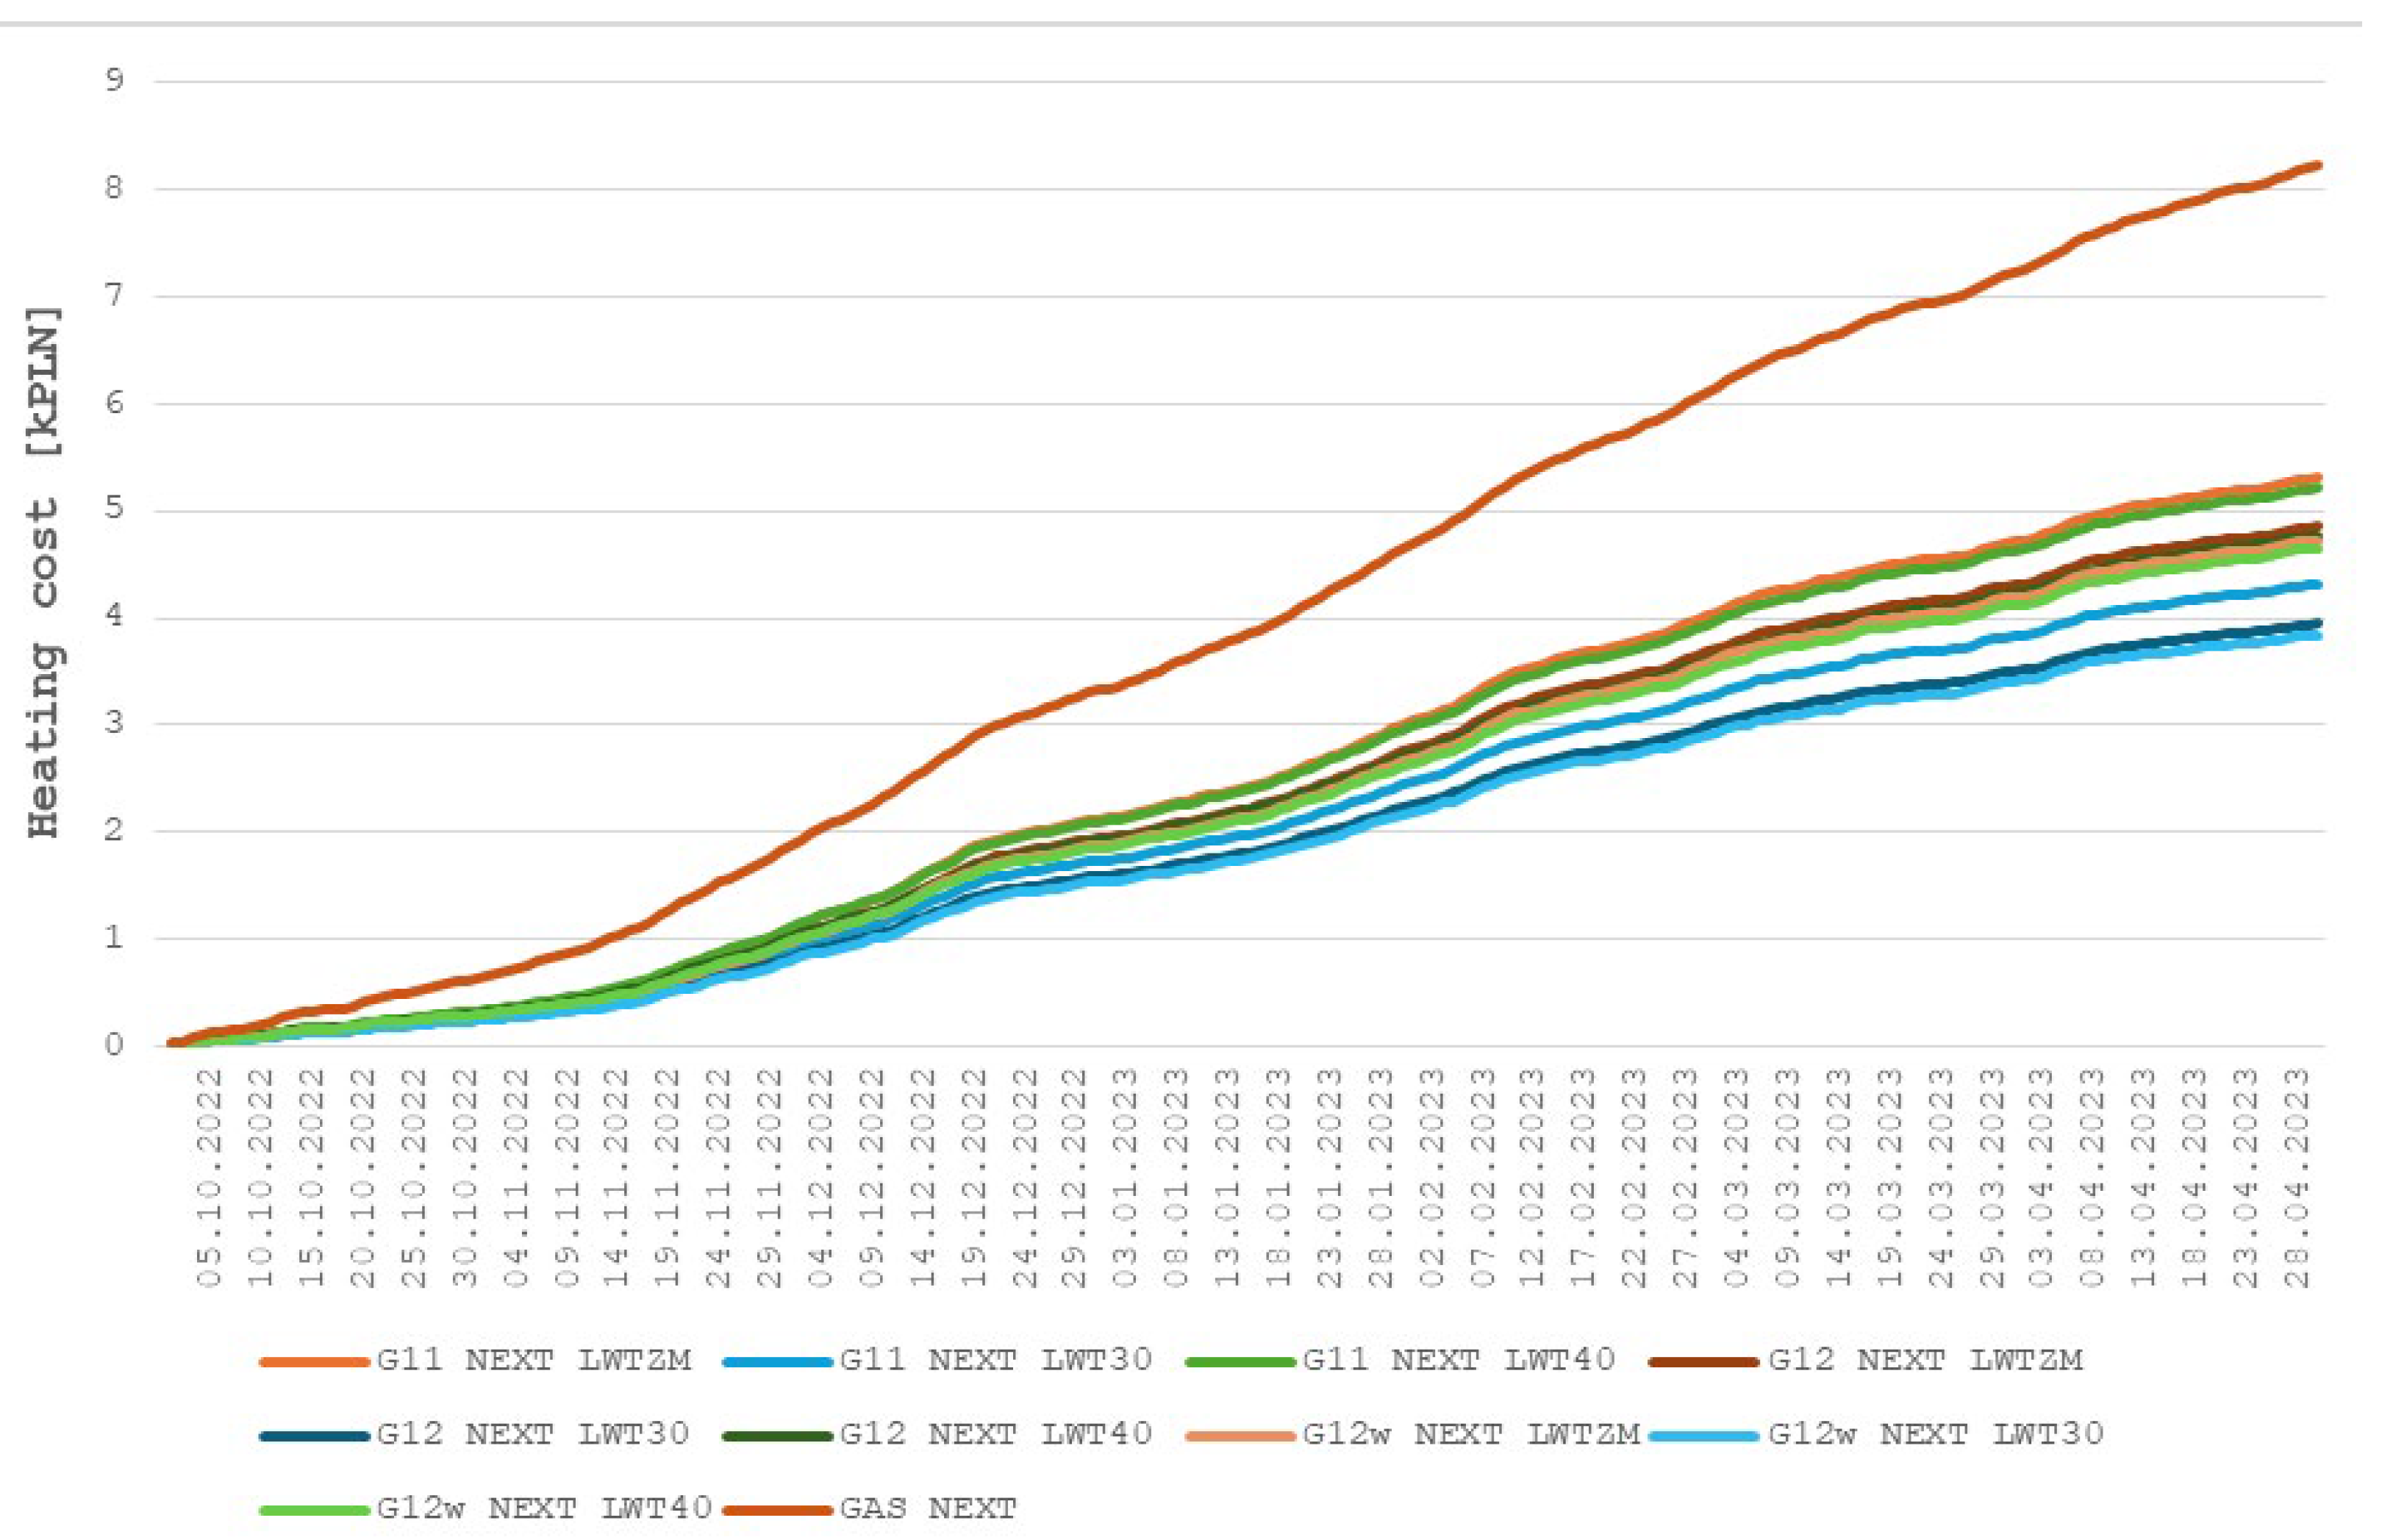
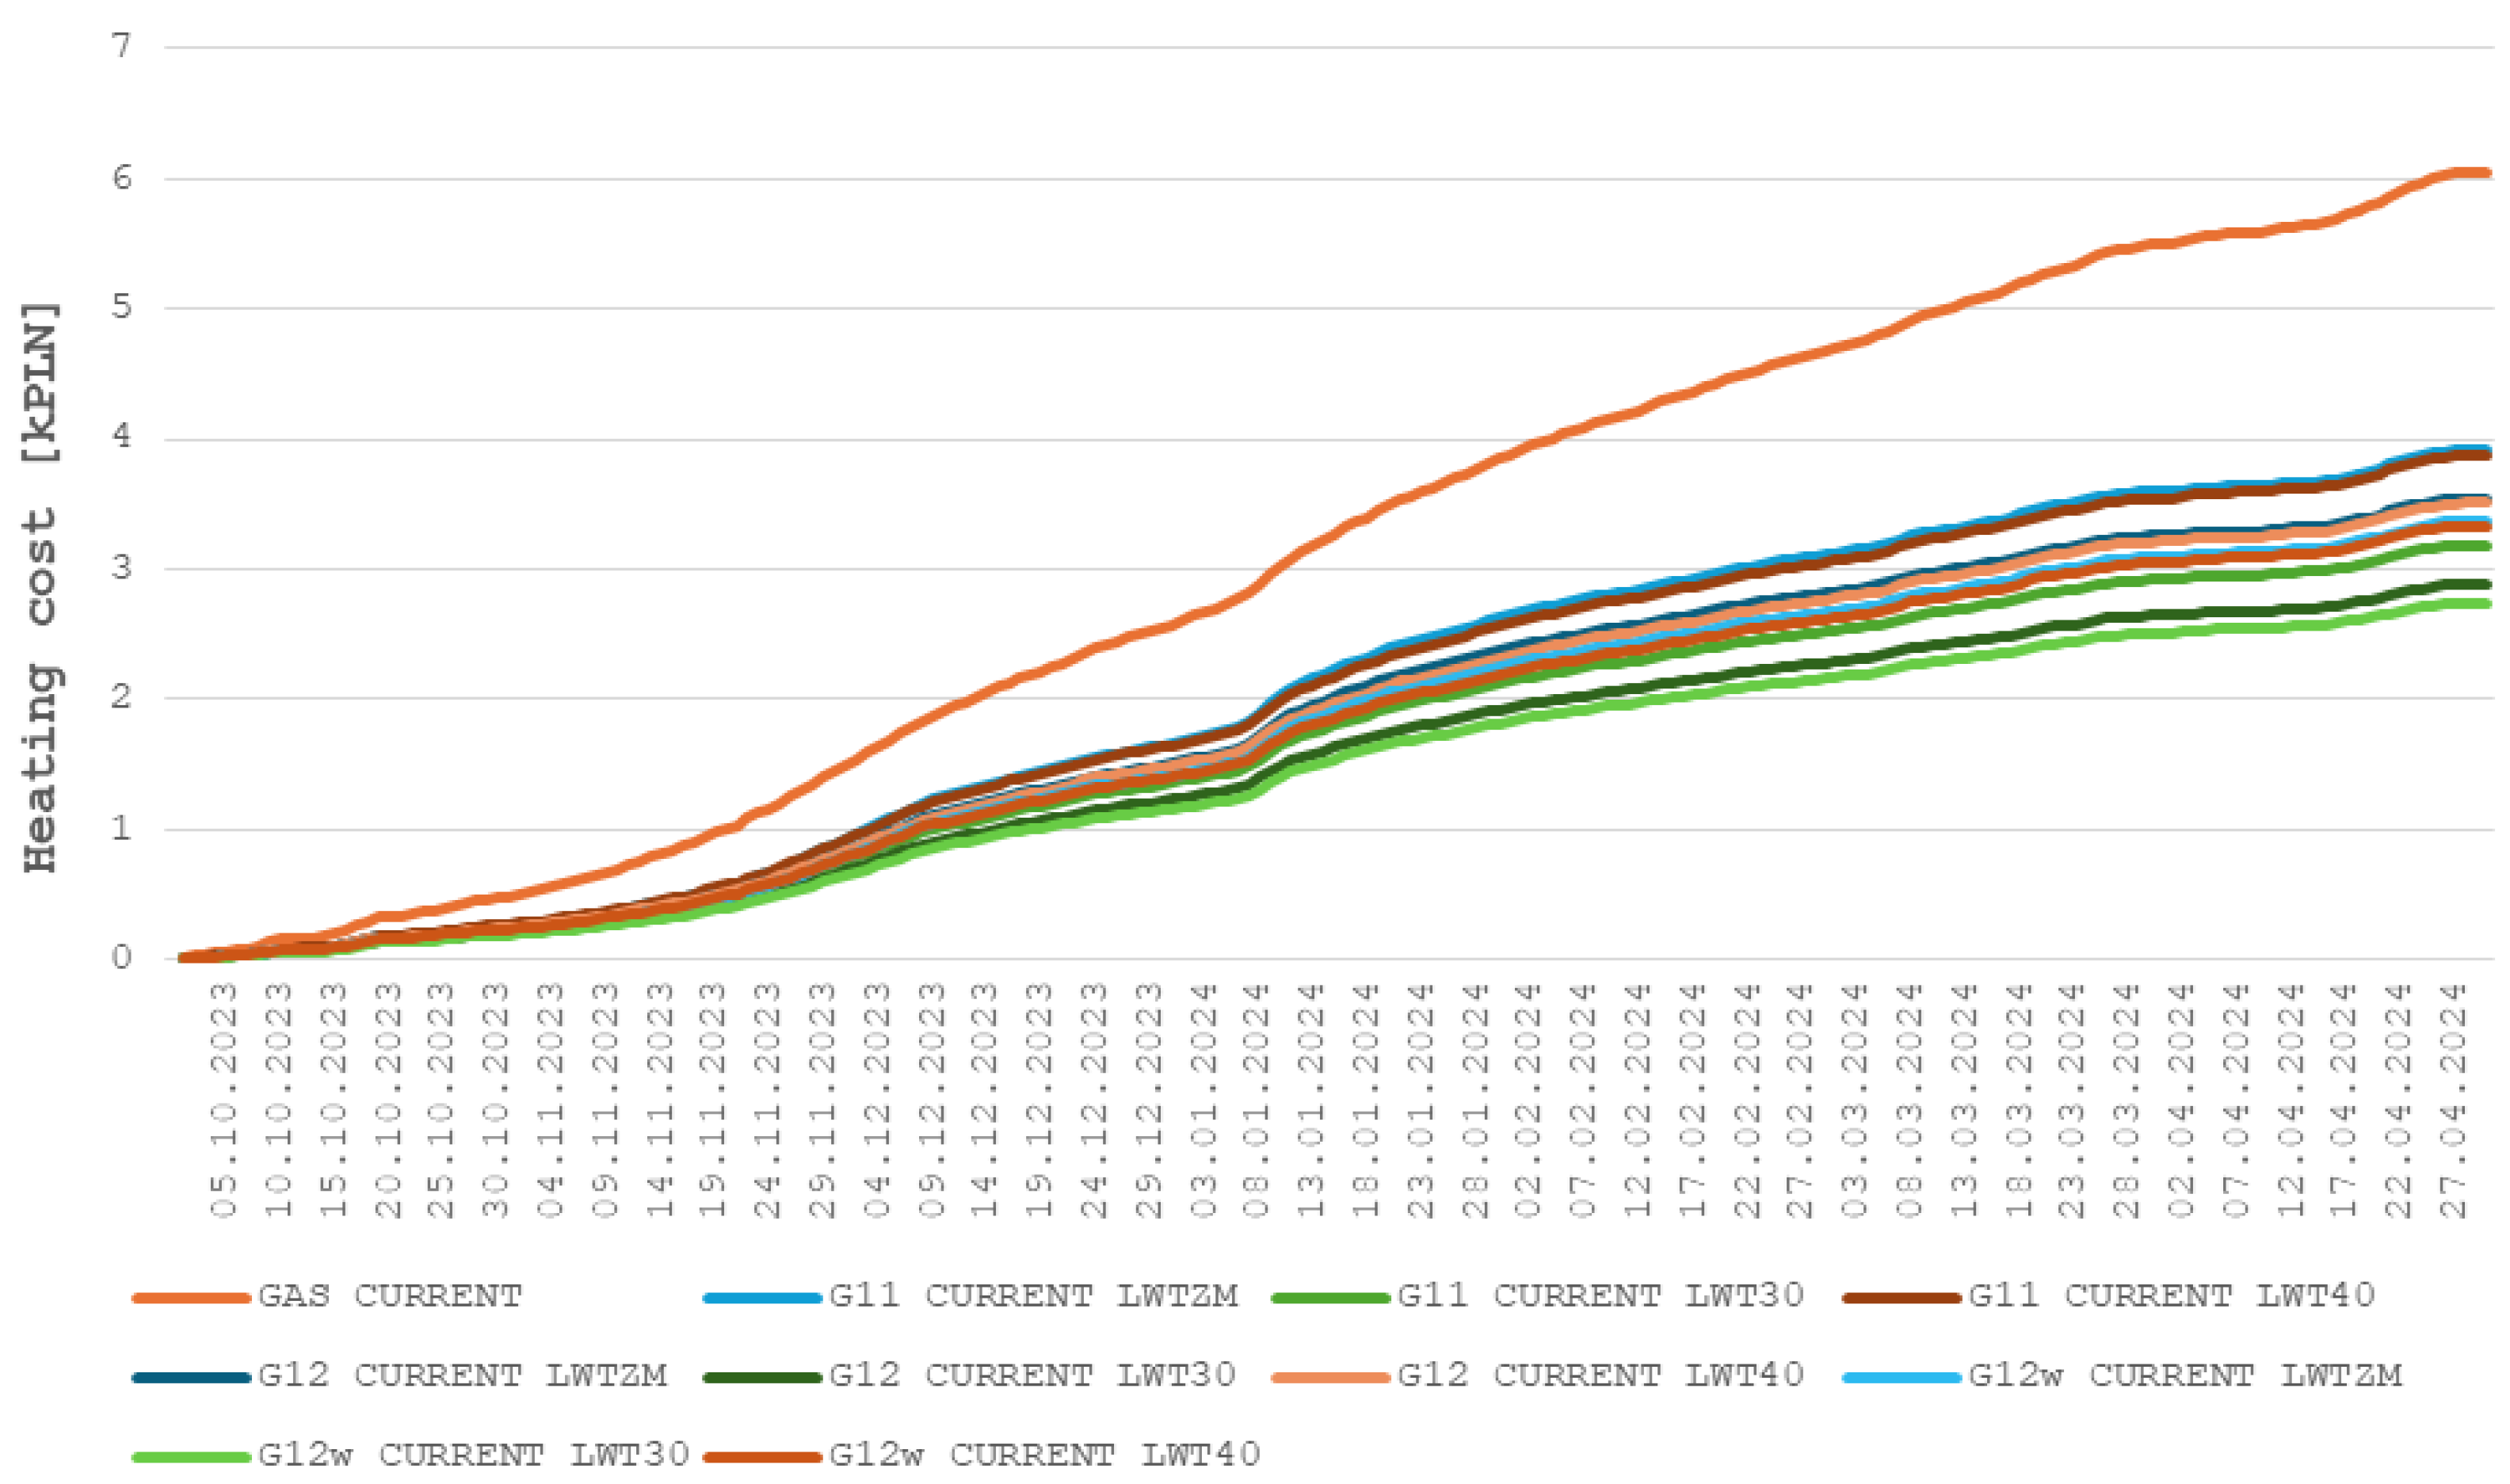
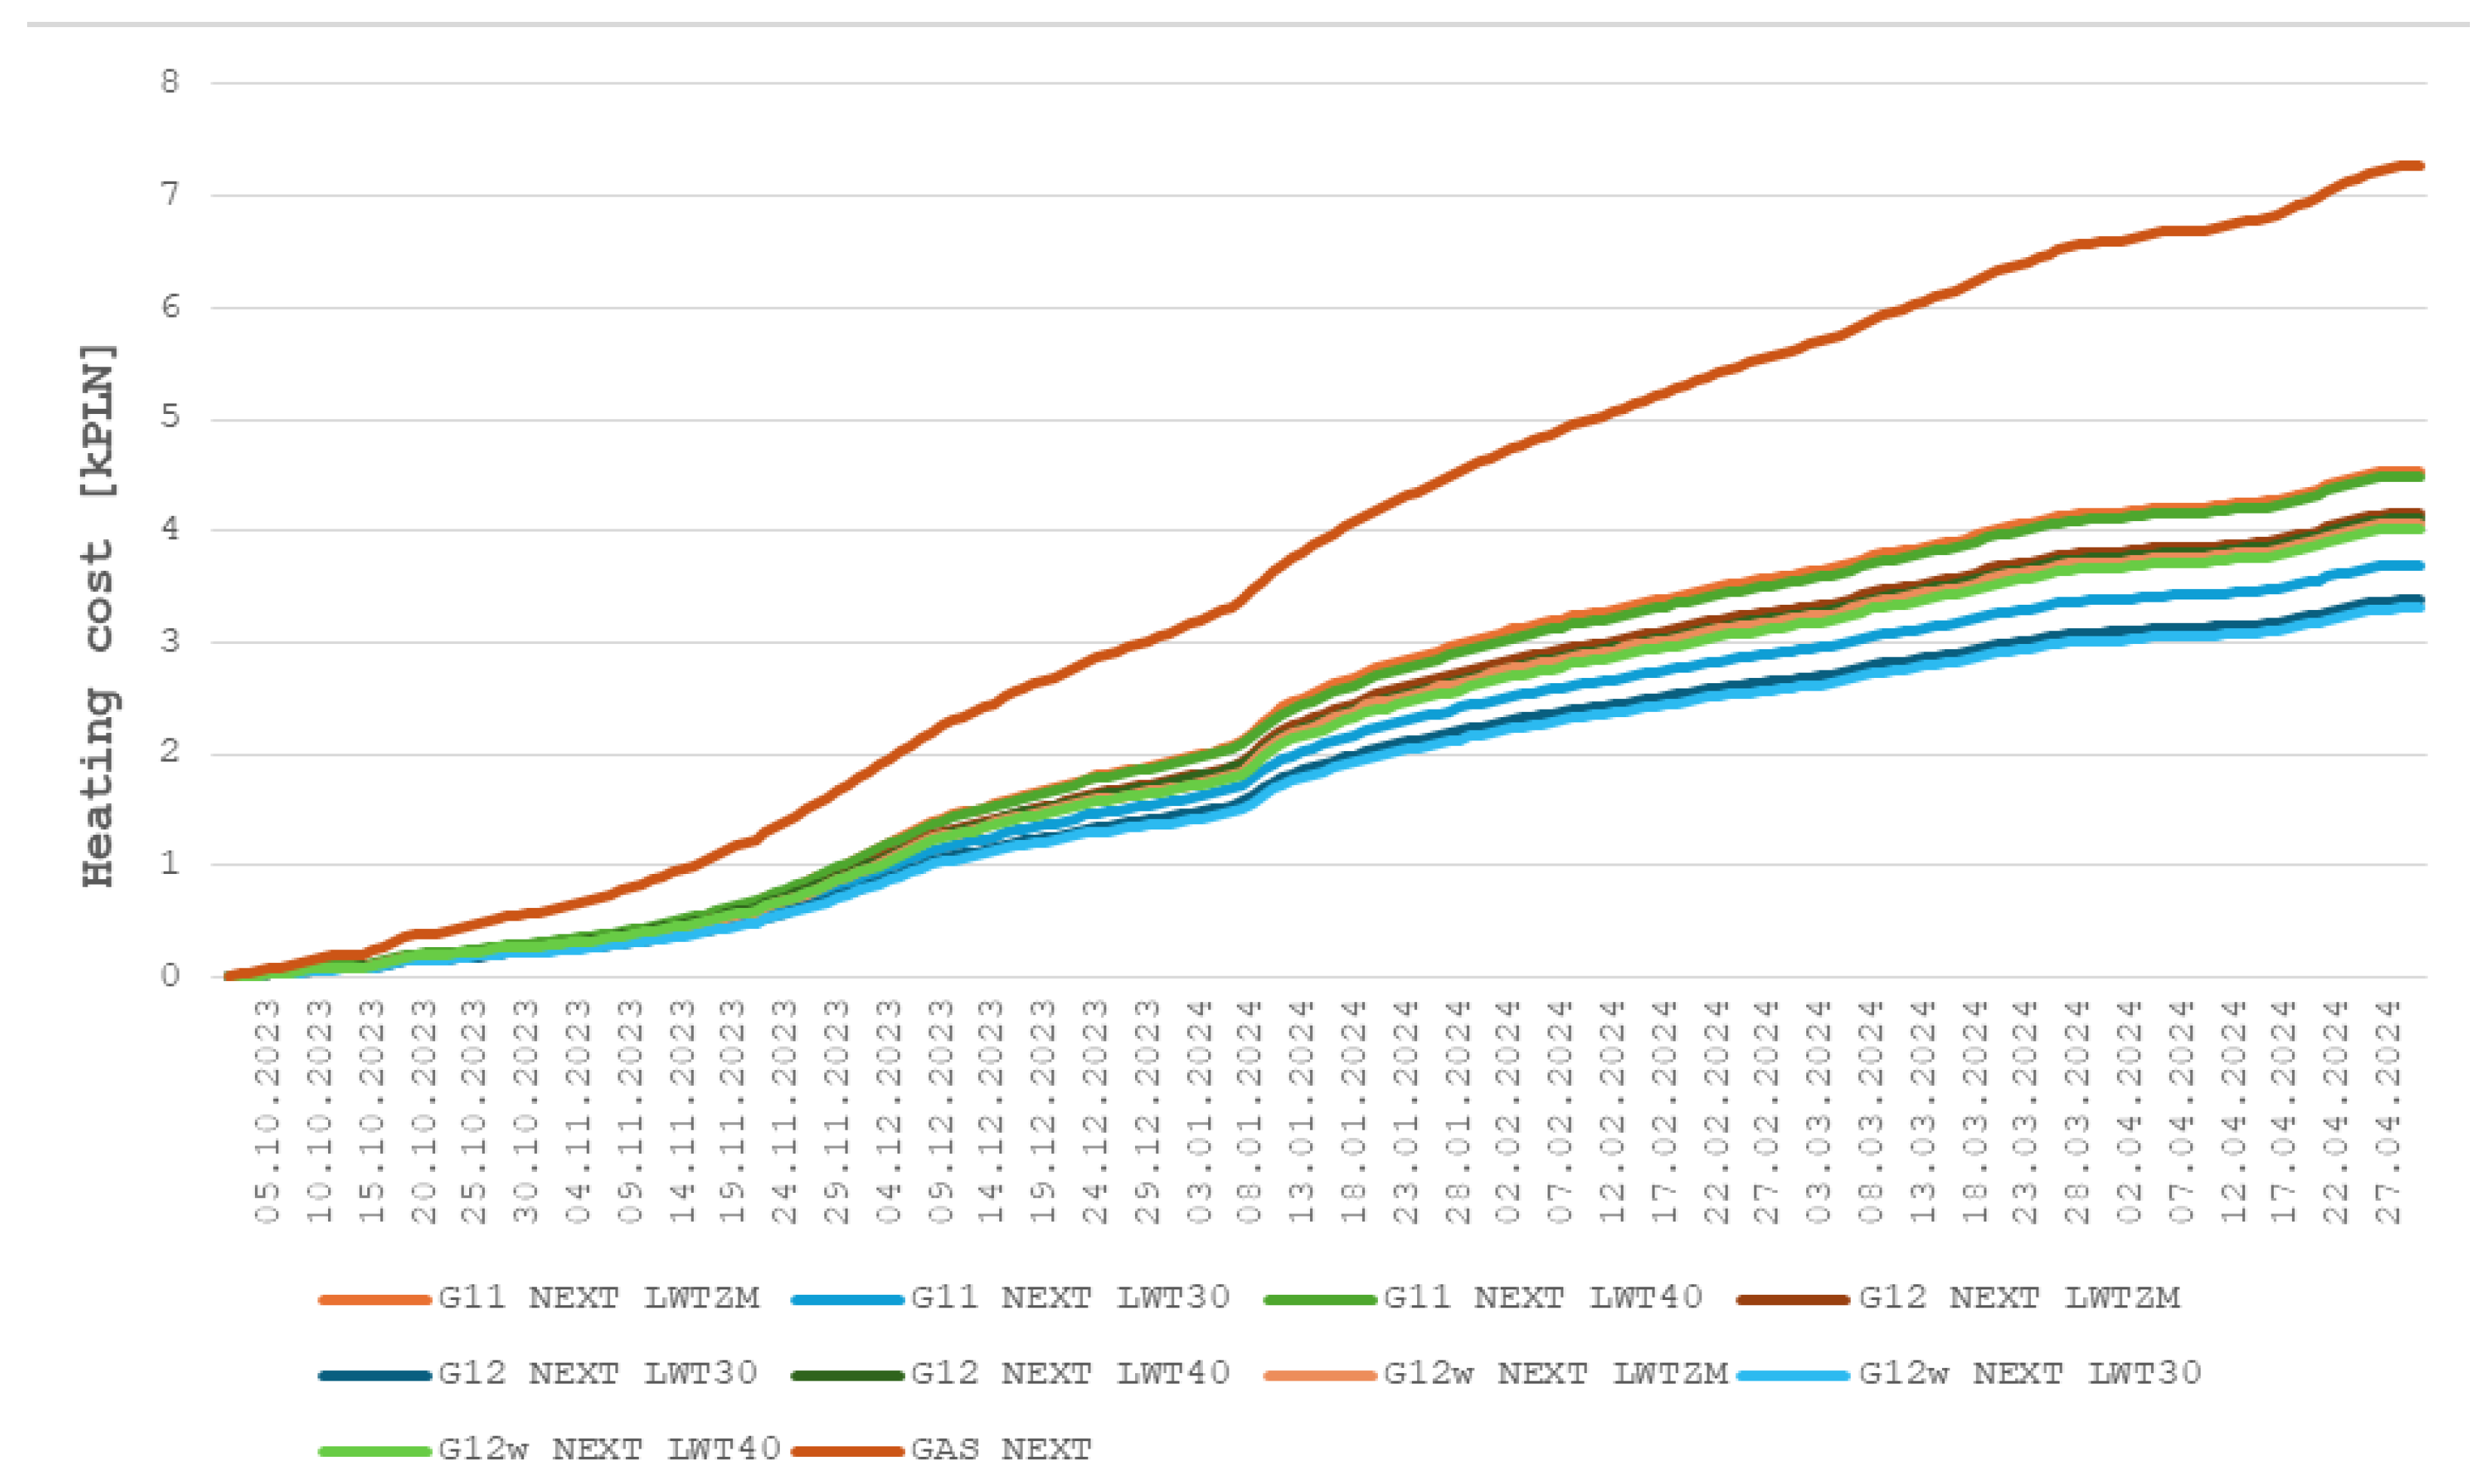
The results are also presented in the form of graphs, as seen in Figure 4 (current tariffs) and Figure 5 (future tariffs). Appendix D presents costs, grouped by technology and tariffs (current and future), similarly to Table 6 and Table 7. In turn, Figure 6 and Figure 7 present the increasing cost of heating with each technology and each tariff at current (Figure 6) and future (Figure 7) energy prices for the 2022/2023 season.
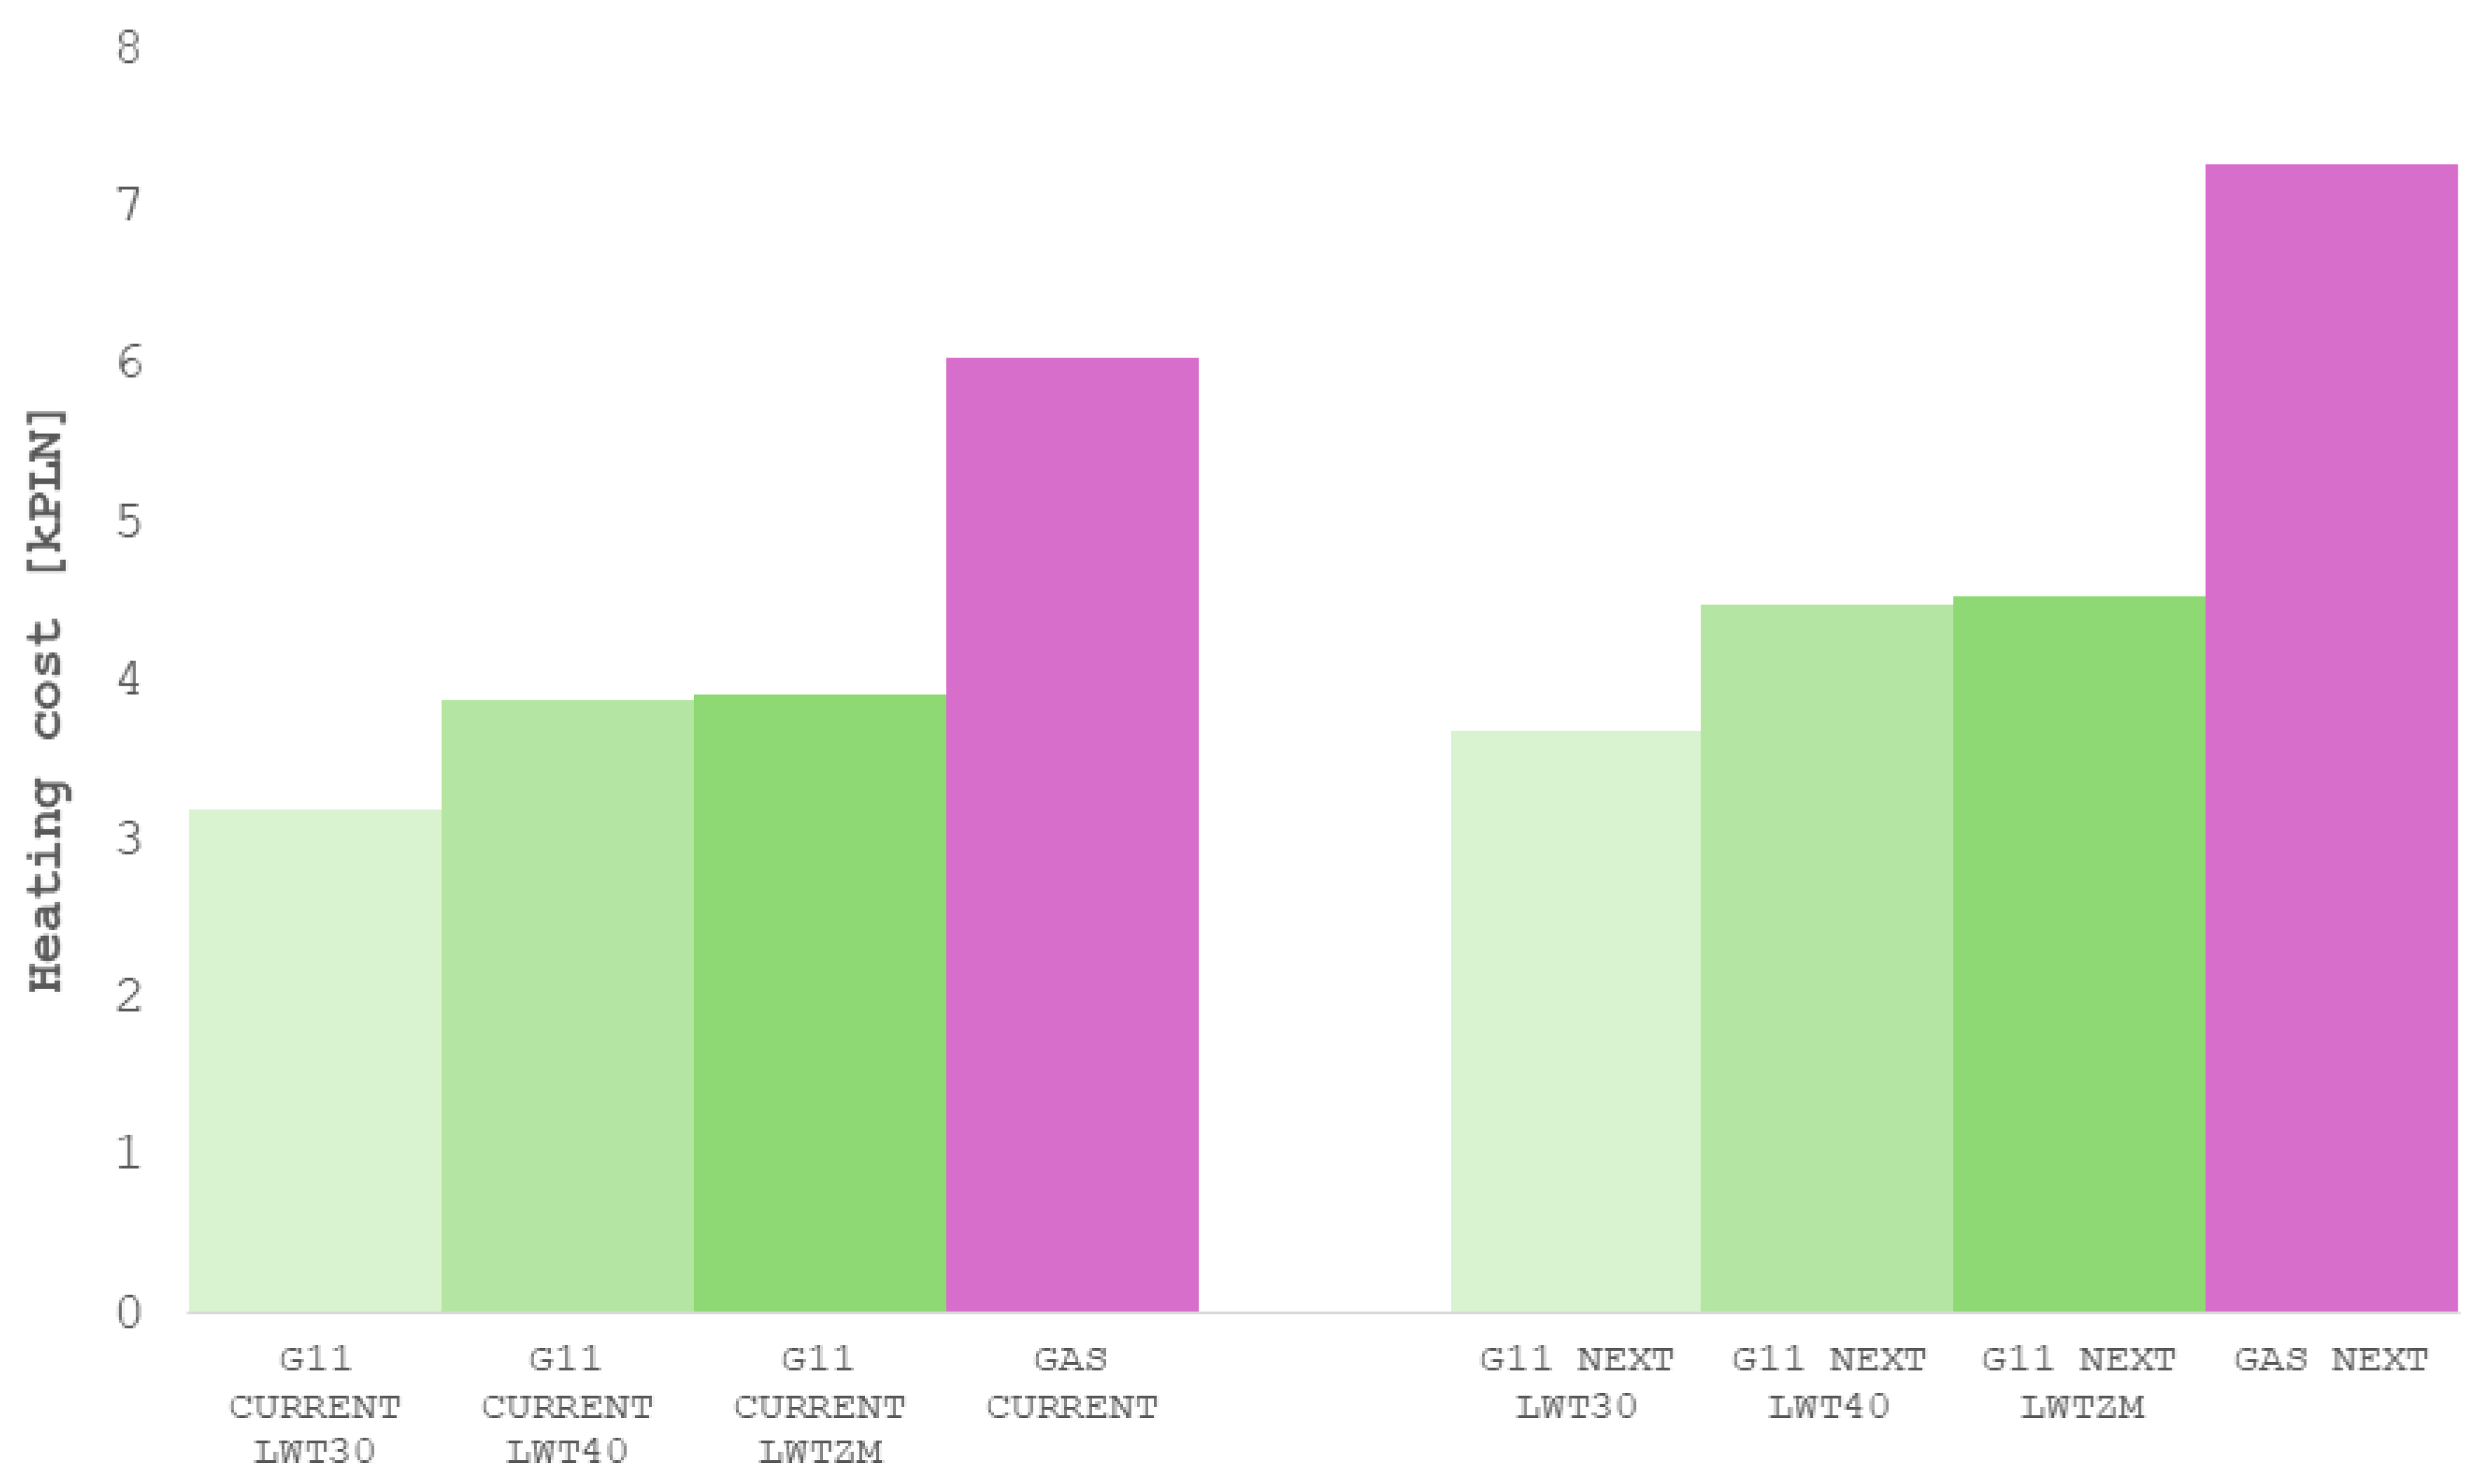
Analyzing the above data, we made the following conclusions from the conducted research: the average temperature in the period under review was 5.14 °C; the demand for thermal energy was 18,468 kWh. The average COP was 5.27 for technology LWT30, 4.37 for technology LWTZM, and 4.30 for technology LWT40. The demand for electricity was 3792 kWh for technology LWT30, 4590 kWh for technology LWT40, and 4663 kWh for technology LWTZM. Despite the better average COP (seasonal, SCOP) for the LWTZM technology, electricity consumption was lower in the LWT40 technology. The lowest heating cost was ensured by the LWT30 technology due to the highest pump efficiency (the most favorable operating conditions). The highest heating cost was seen when heating with a natural gas boiler, and the difference is the greater the lower the power parameter is compared in the heat pump. The G12w tariff was the cheapest for heating in this period, and the total cost of heating with gas (compared to this tariff) was higher by more than 100%—both for current and future energy prices. The cost of heating with the variable parameter technology (LWTZM) was slightly higher (a few percent) than heating with a constant temperature of 40 °C (LWT40) and several dozen percent (20–30%) higher than the low-temperature technology (LWT30). The cost of heating at a temperature of 40 °C (LWT40) was several dozen percent higher than the cost of heating with the LWT30 technology, similarly to the case with LWTZM.

3.2. Calculations for Season II

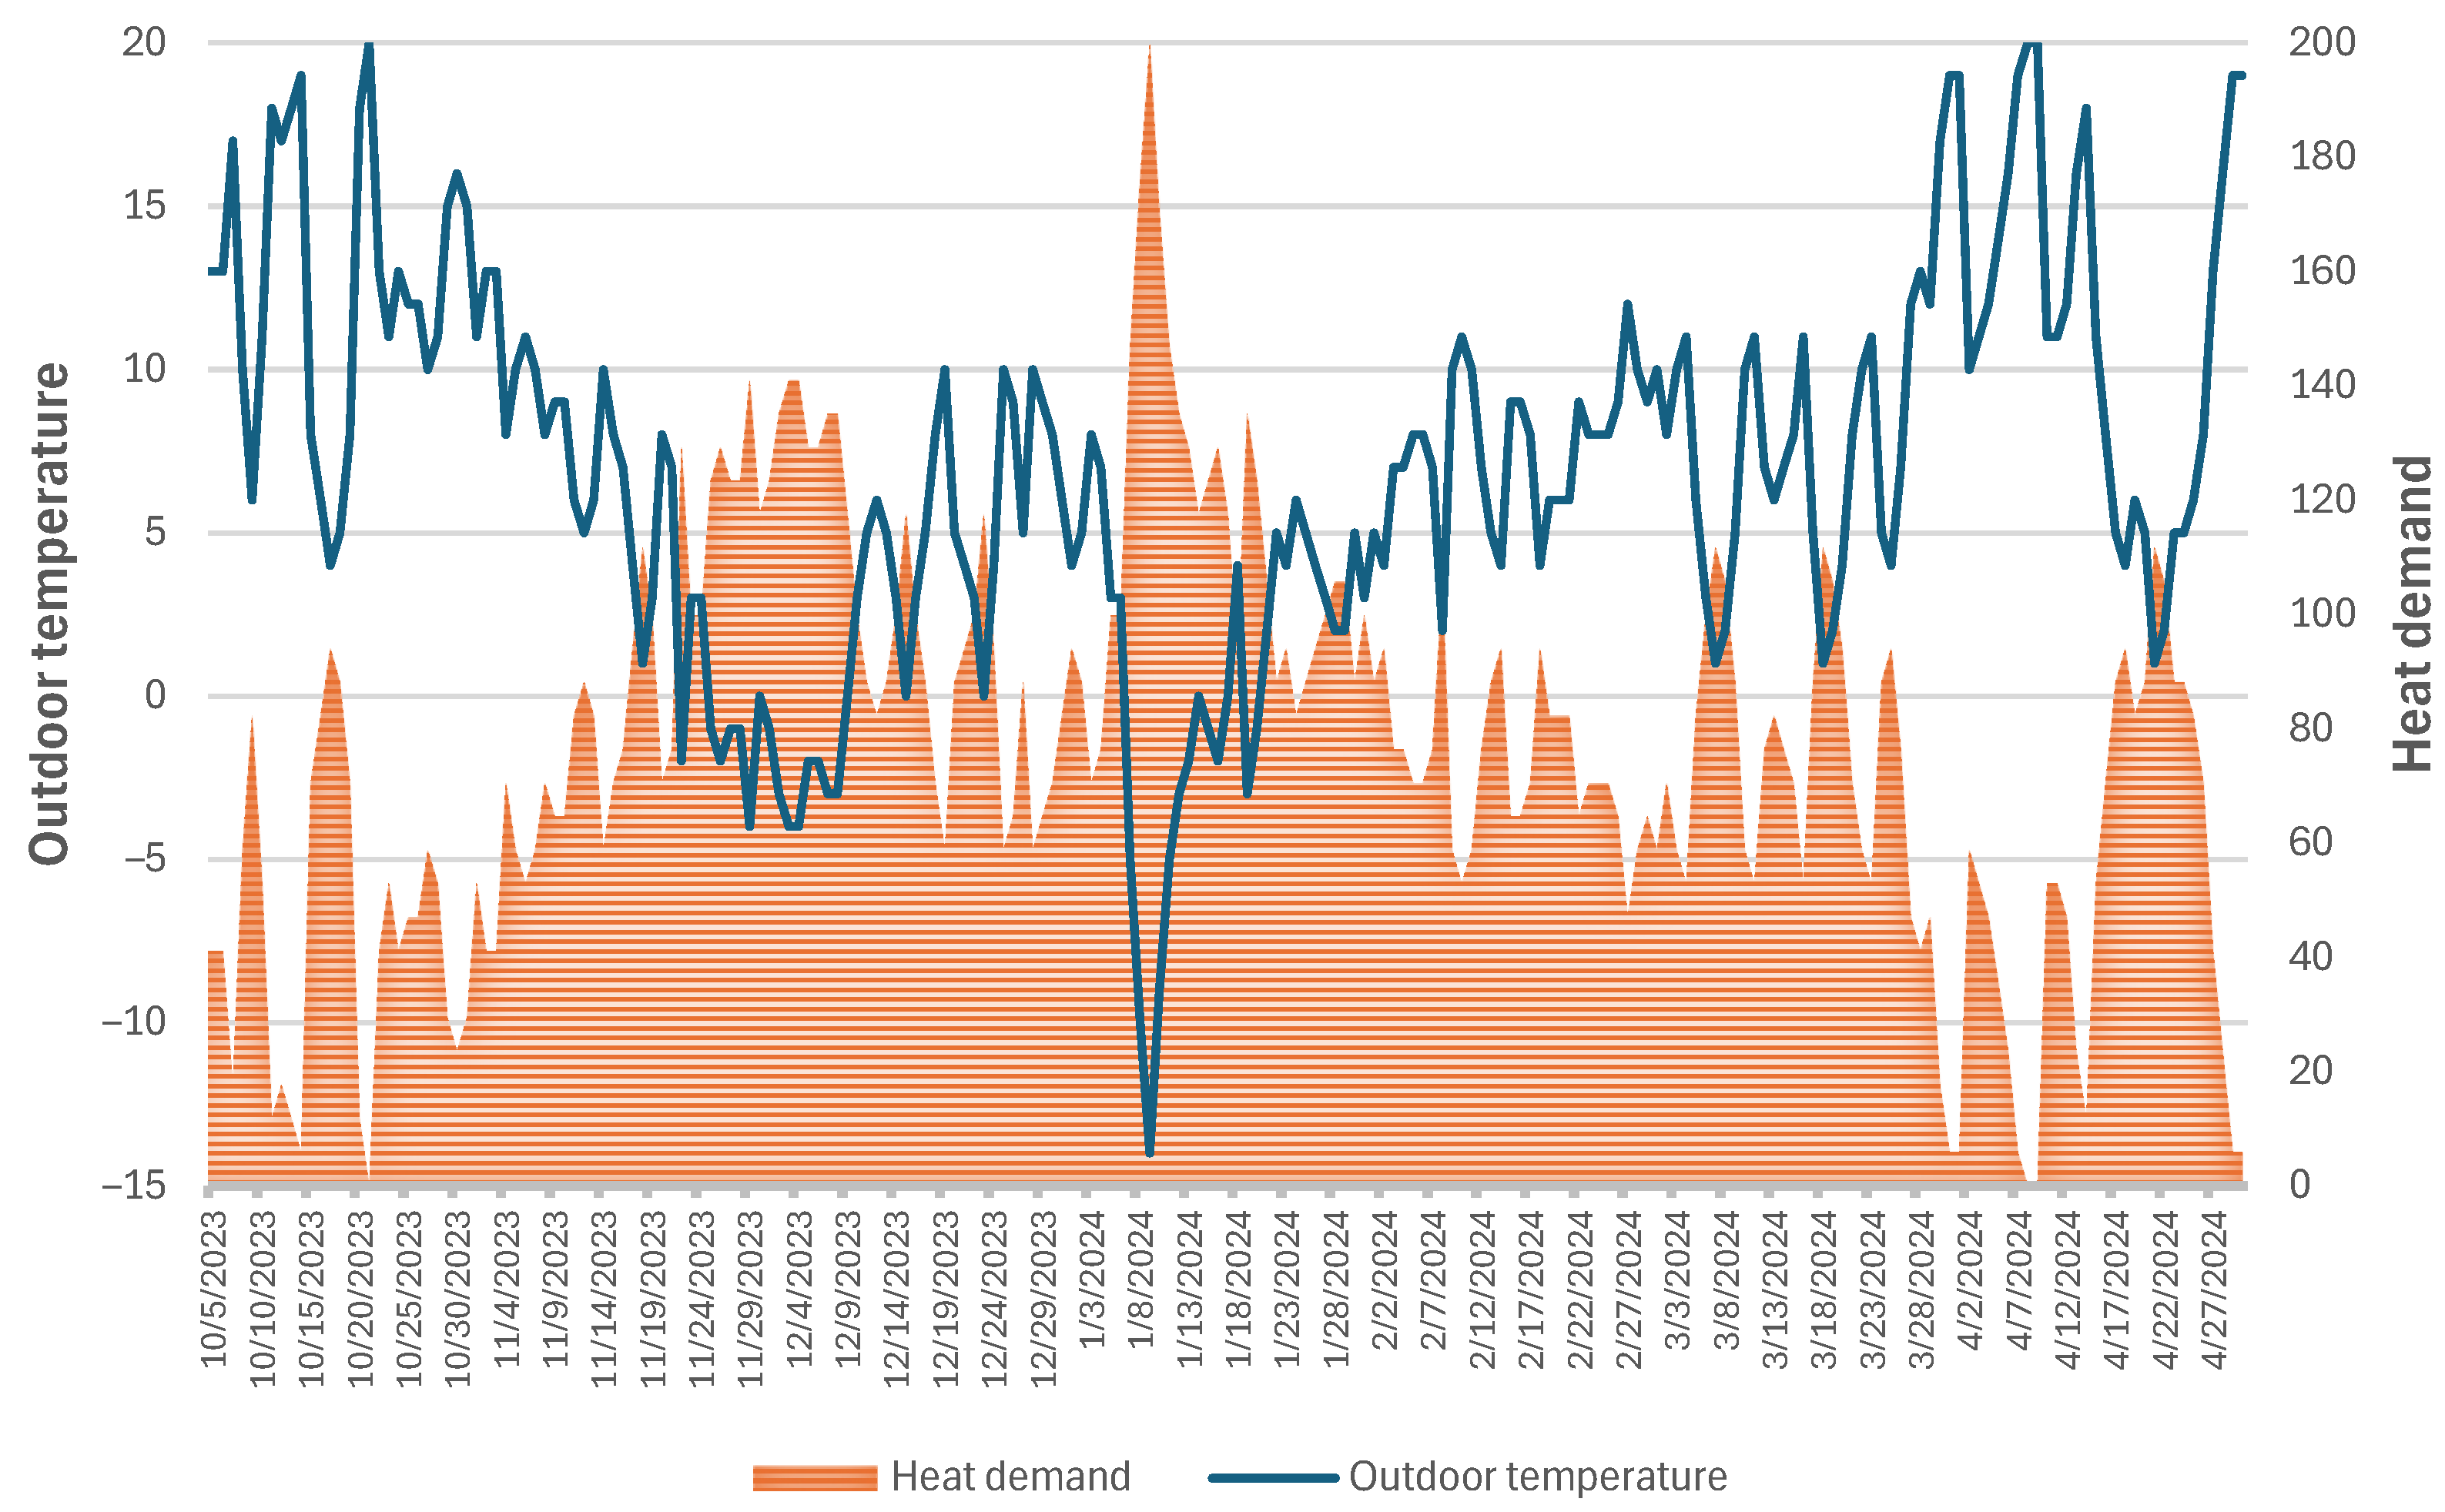
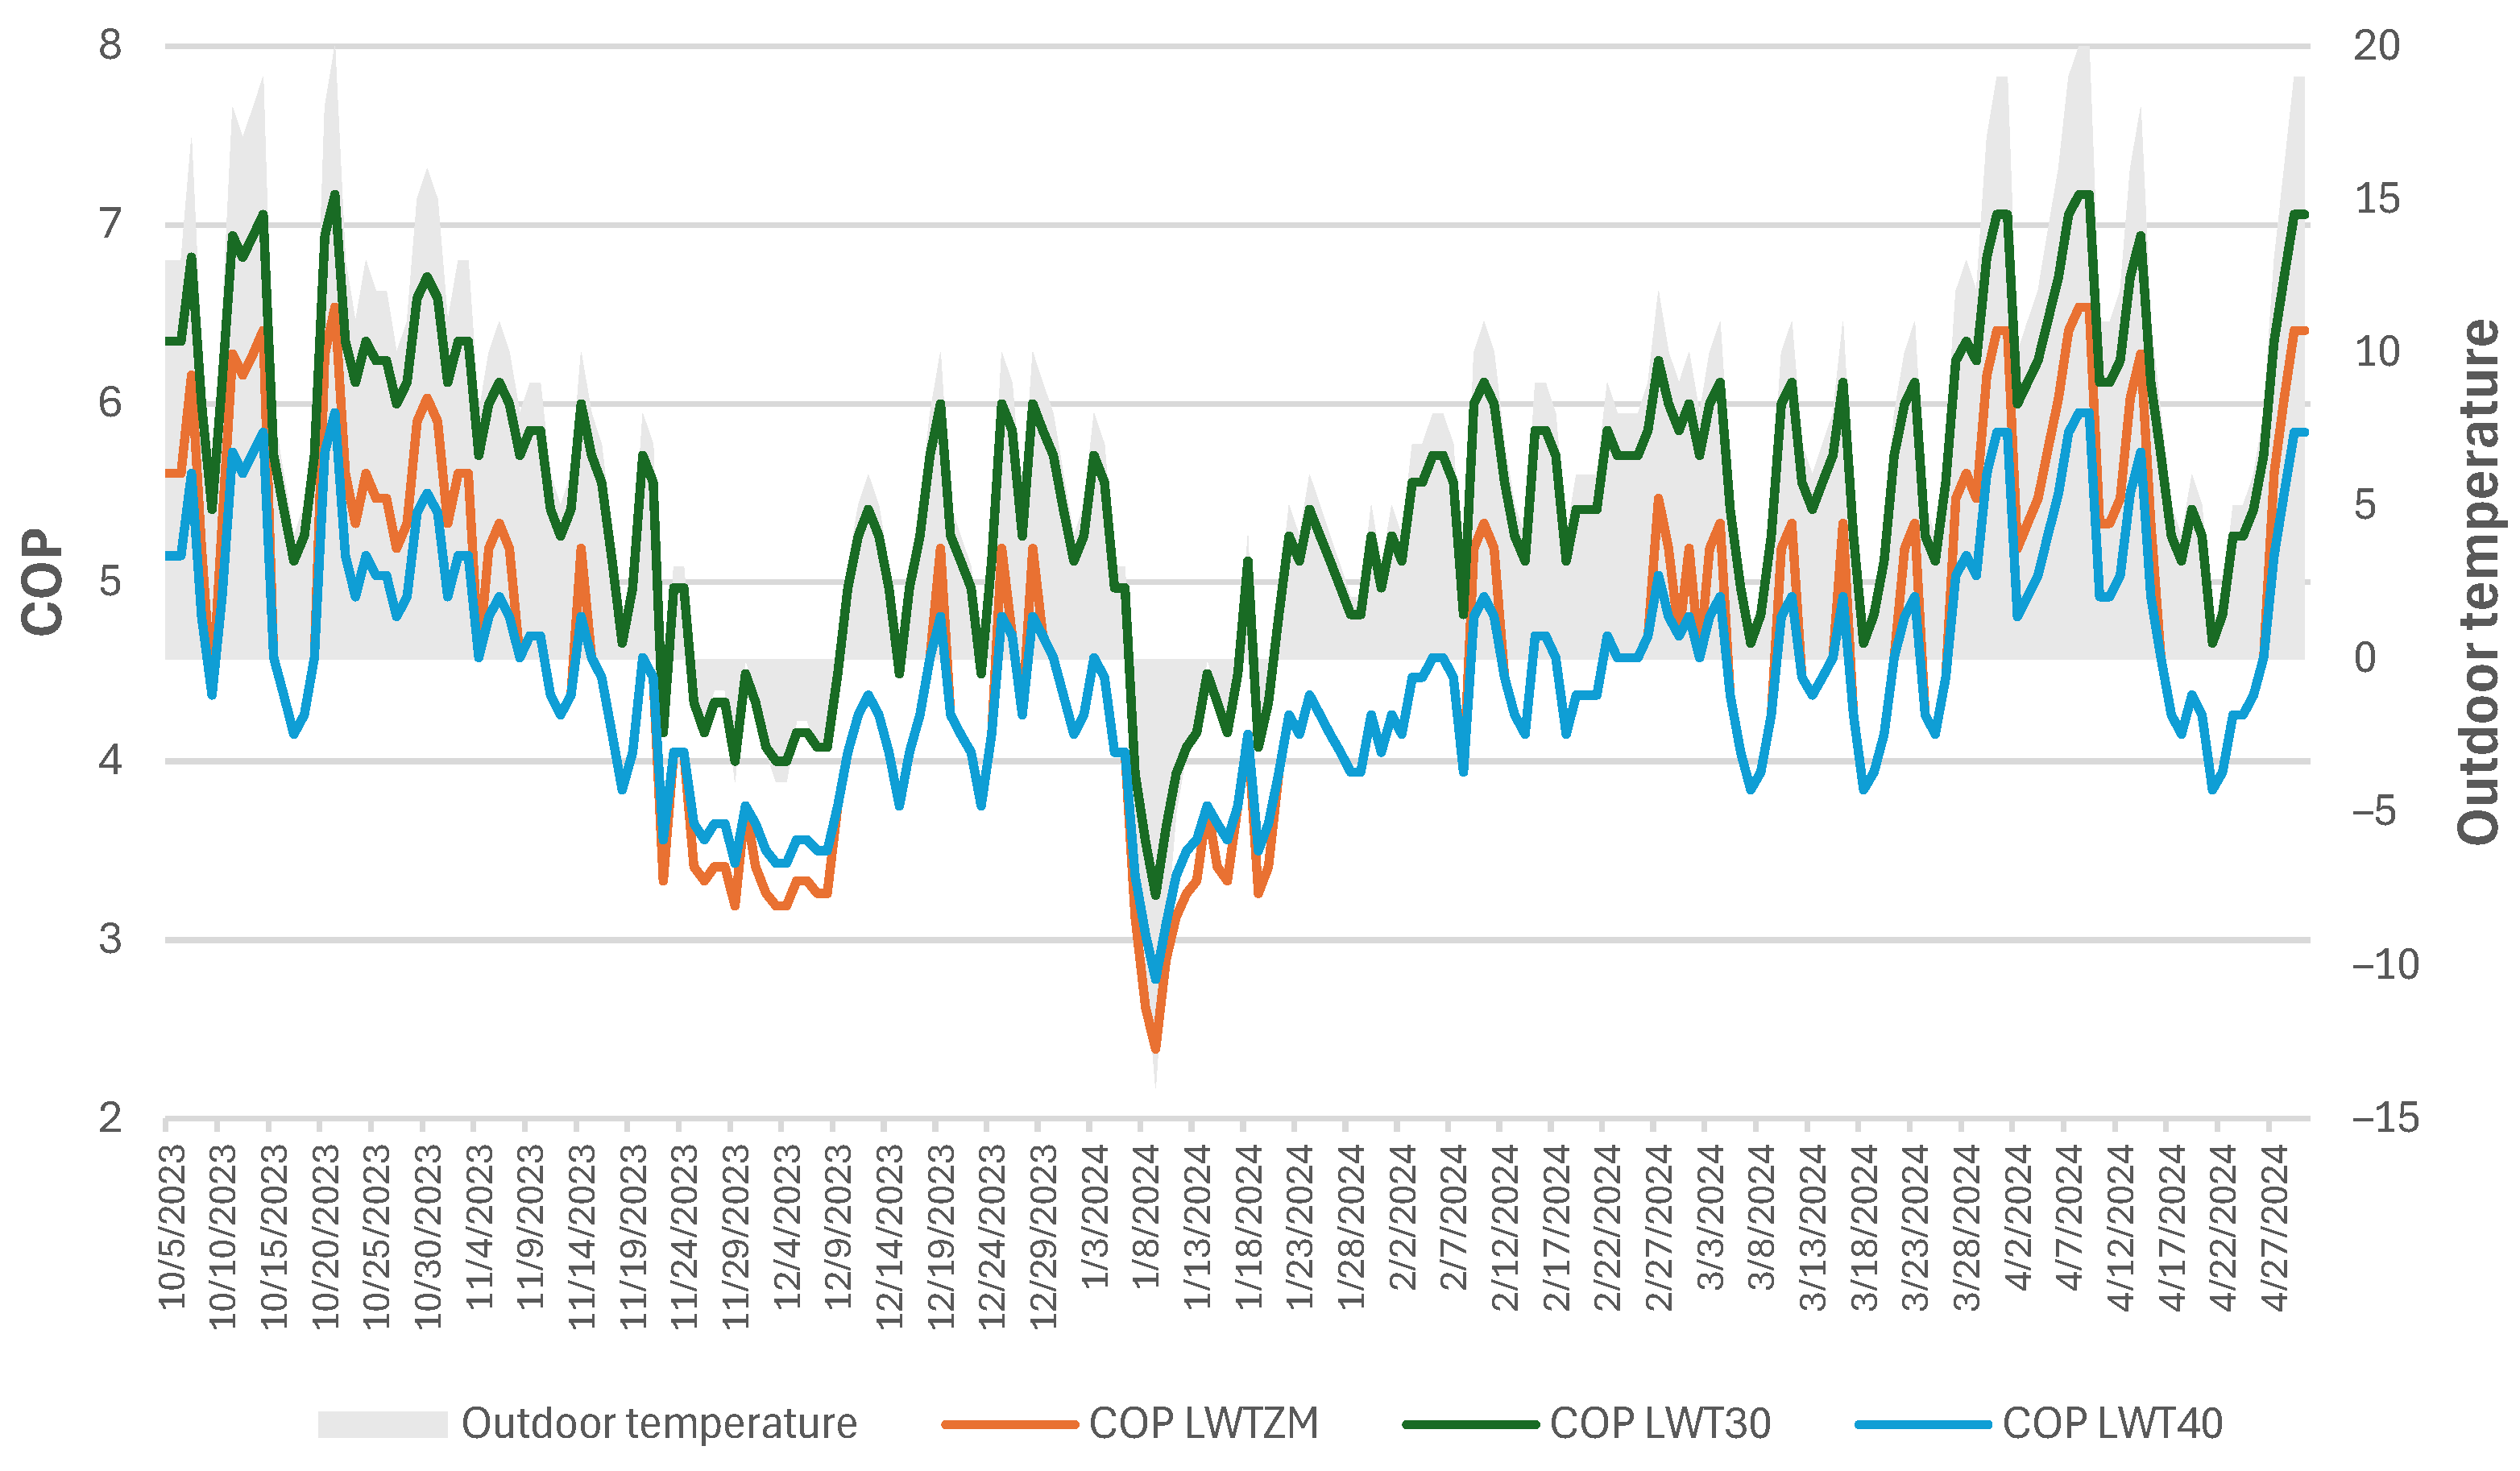
We conducted the tests for the next heating period in the same way as for season I. We entered all the necessary parameters into the model. We calculated these parameters based on climate data from the period 1 October 2023–30 April 2024. The outdoor temperature graph (against the background of the building’s day-to-day heat demand) in the analyzed period is illustrated in Figure 8. The correlation between the outdoor temperature and the COP coefficient achieved by the heat pump for each of the LWT supply temperatures is presented in Figure 9.
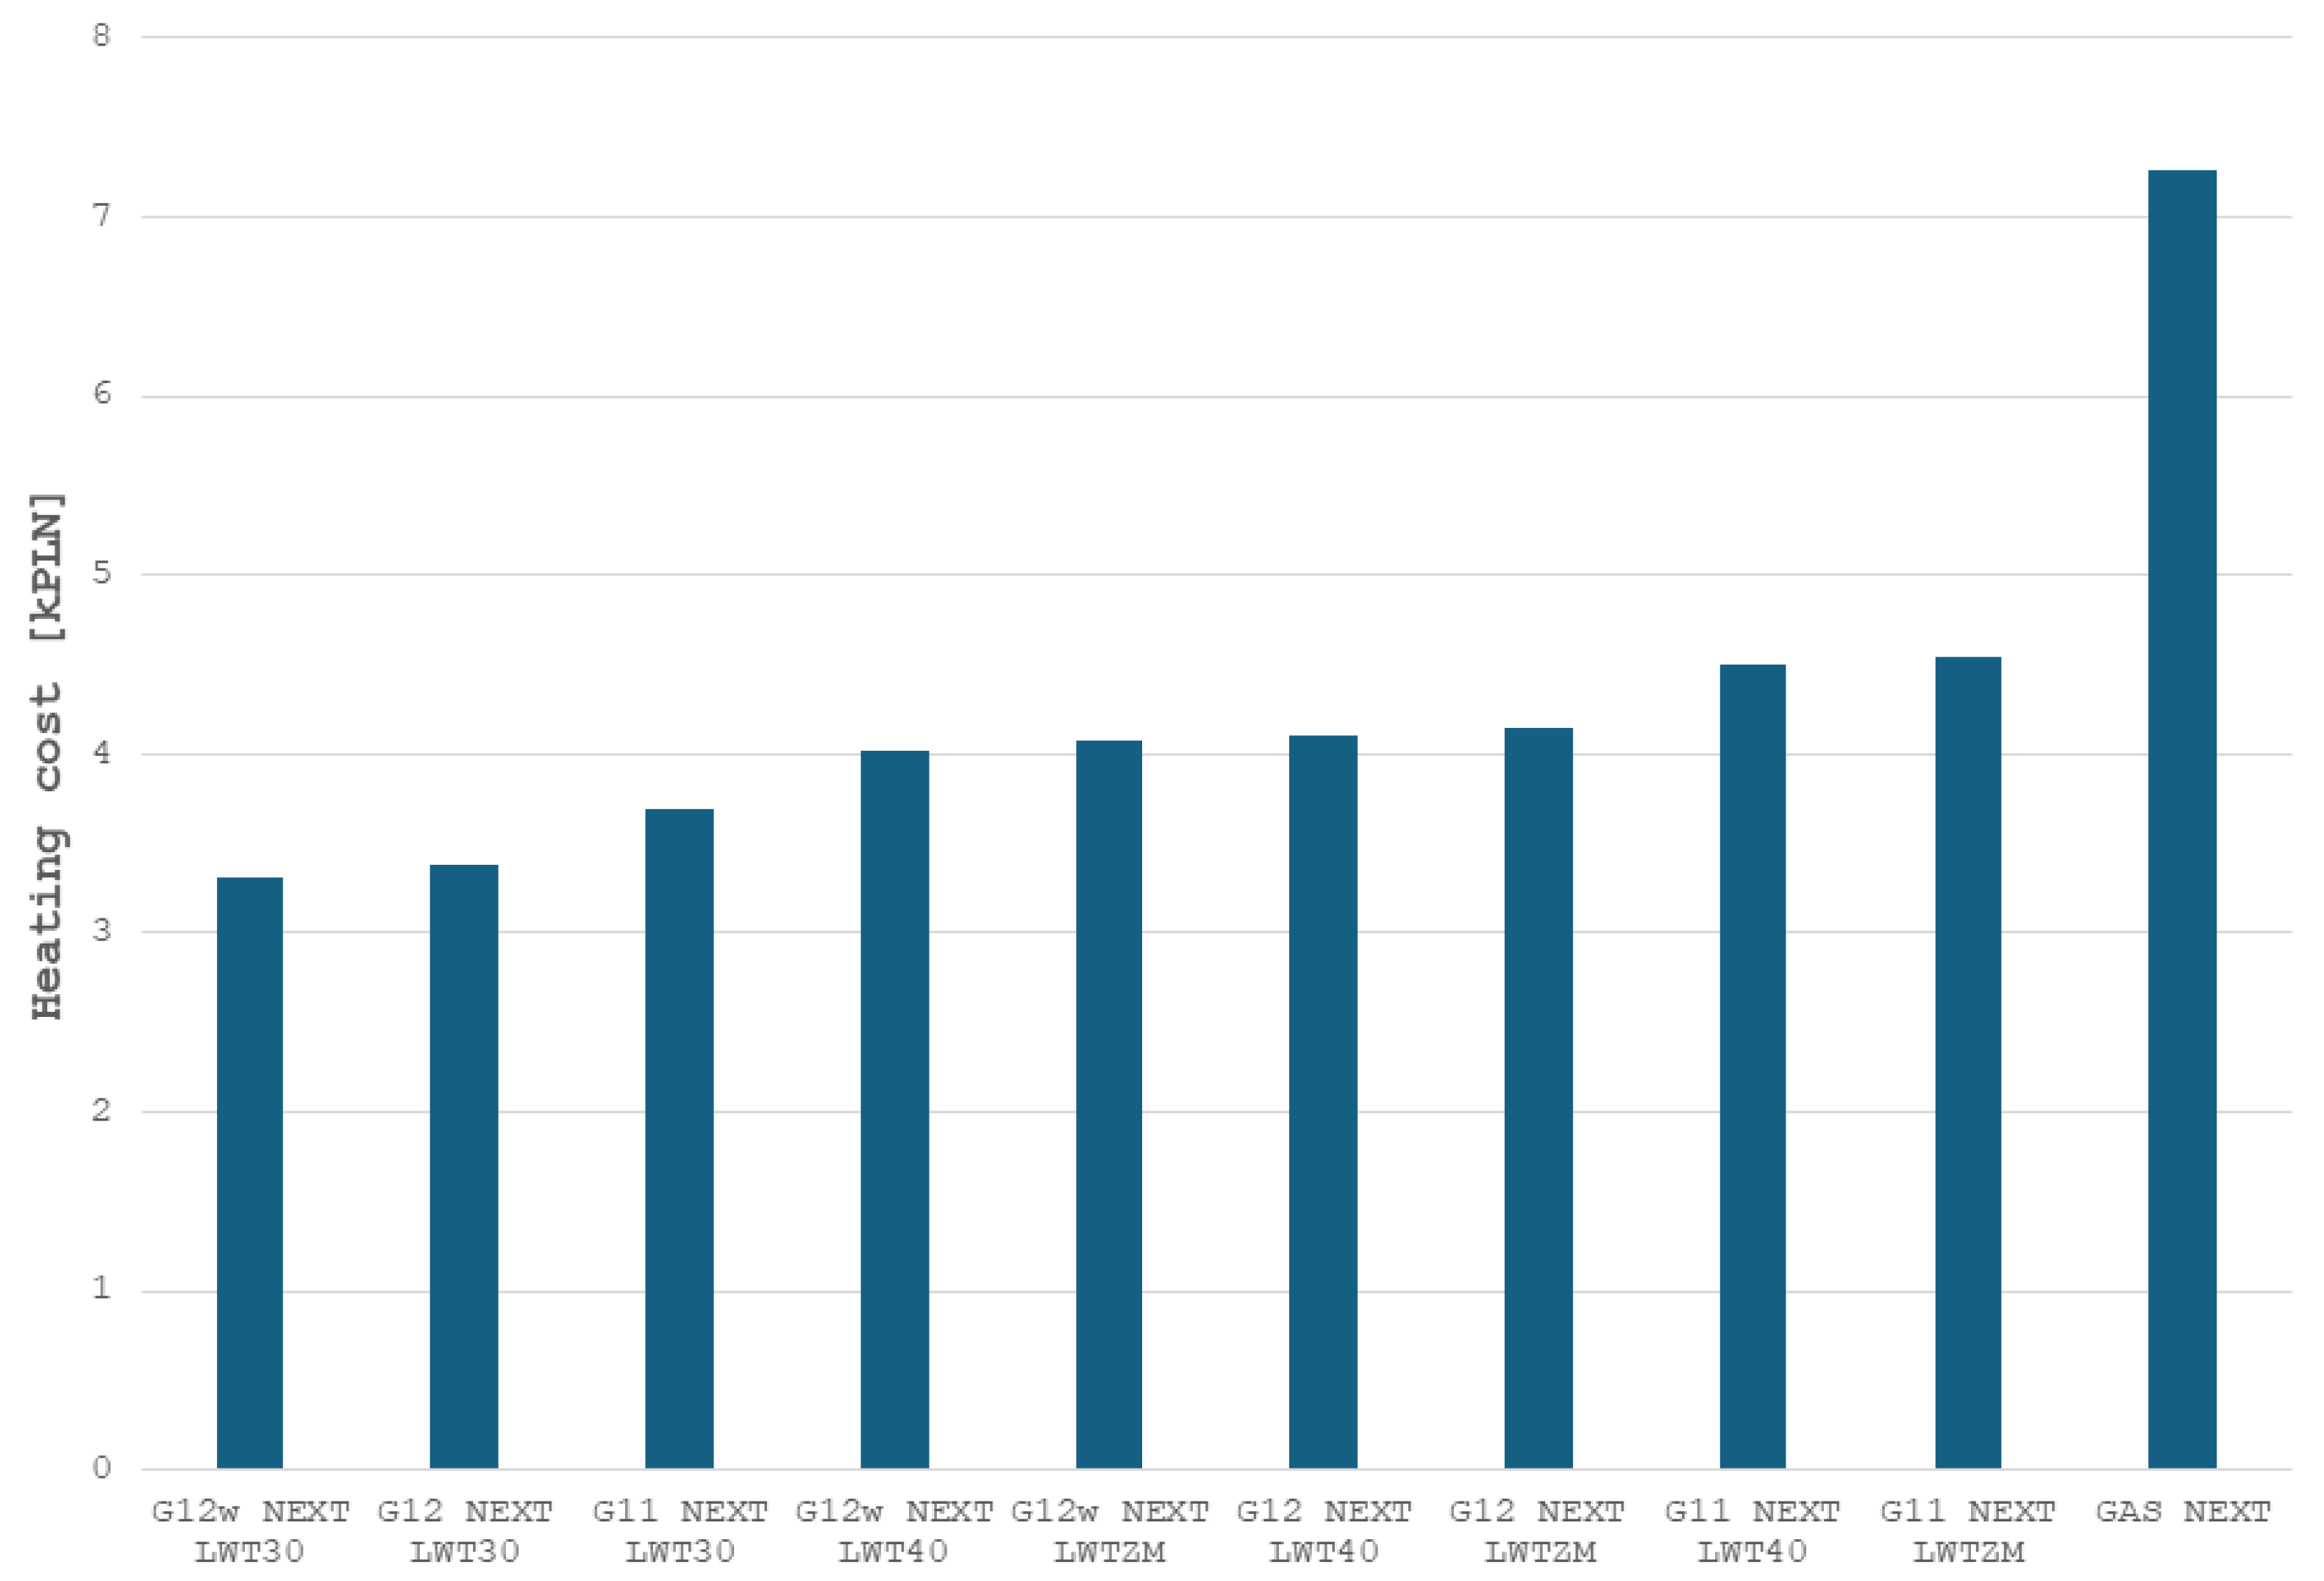
In Table 8 and Table 9, we present heating costs calculated for the 2023/2024 heating season, with current and future energy costs, respectively. We carried out the calculations according to the principles given in the description of season I. We show the graphical results in the charts in Figure 10 (current tariffs) and Figure 11 (future tariffs).
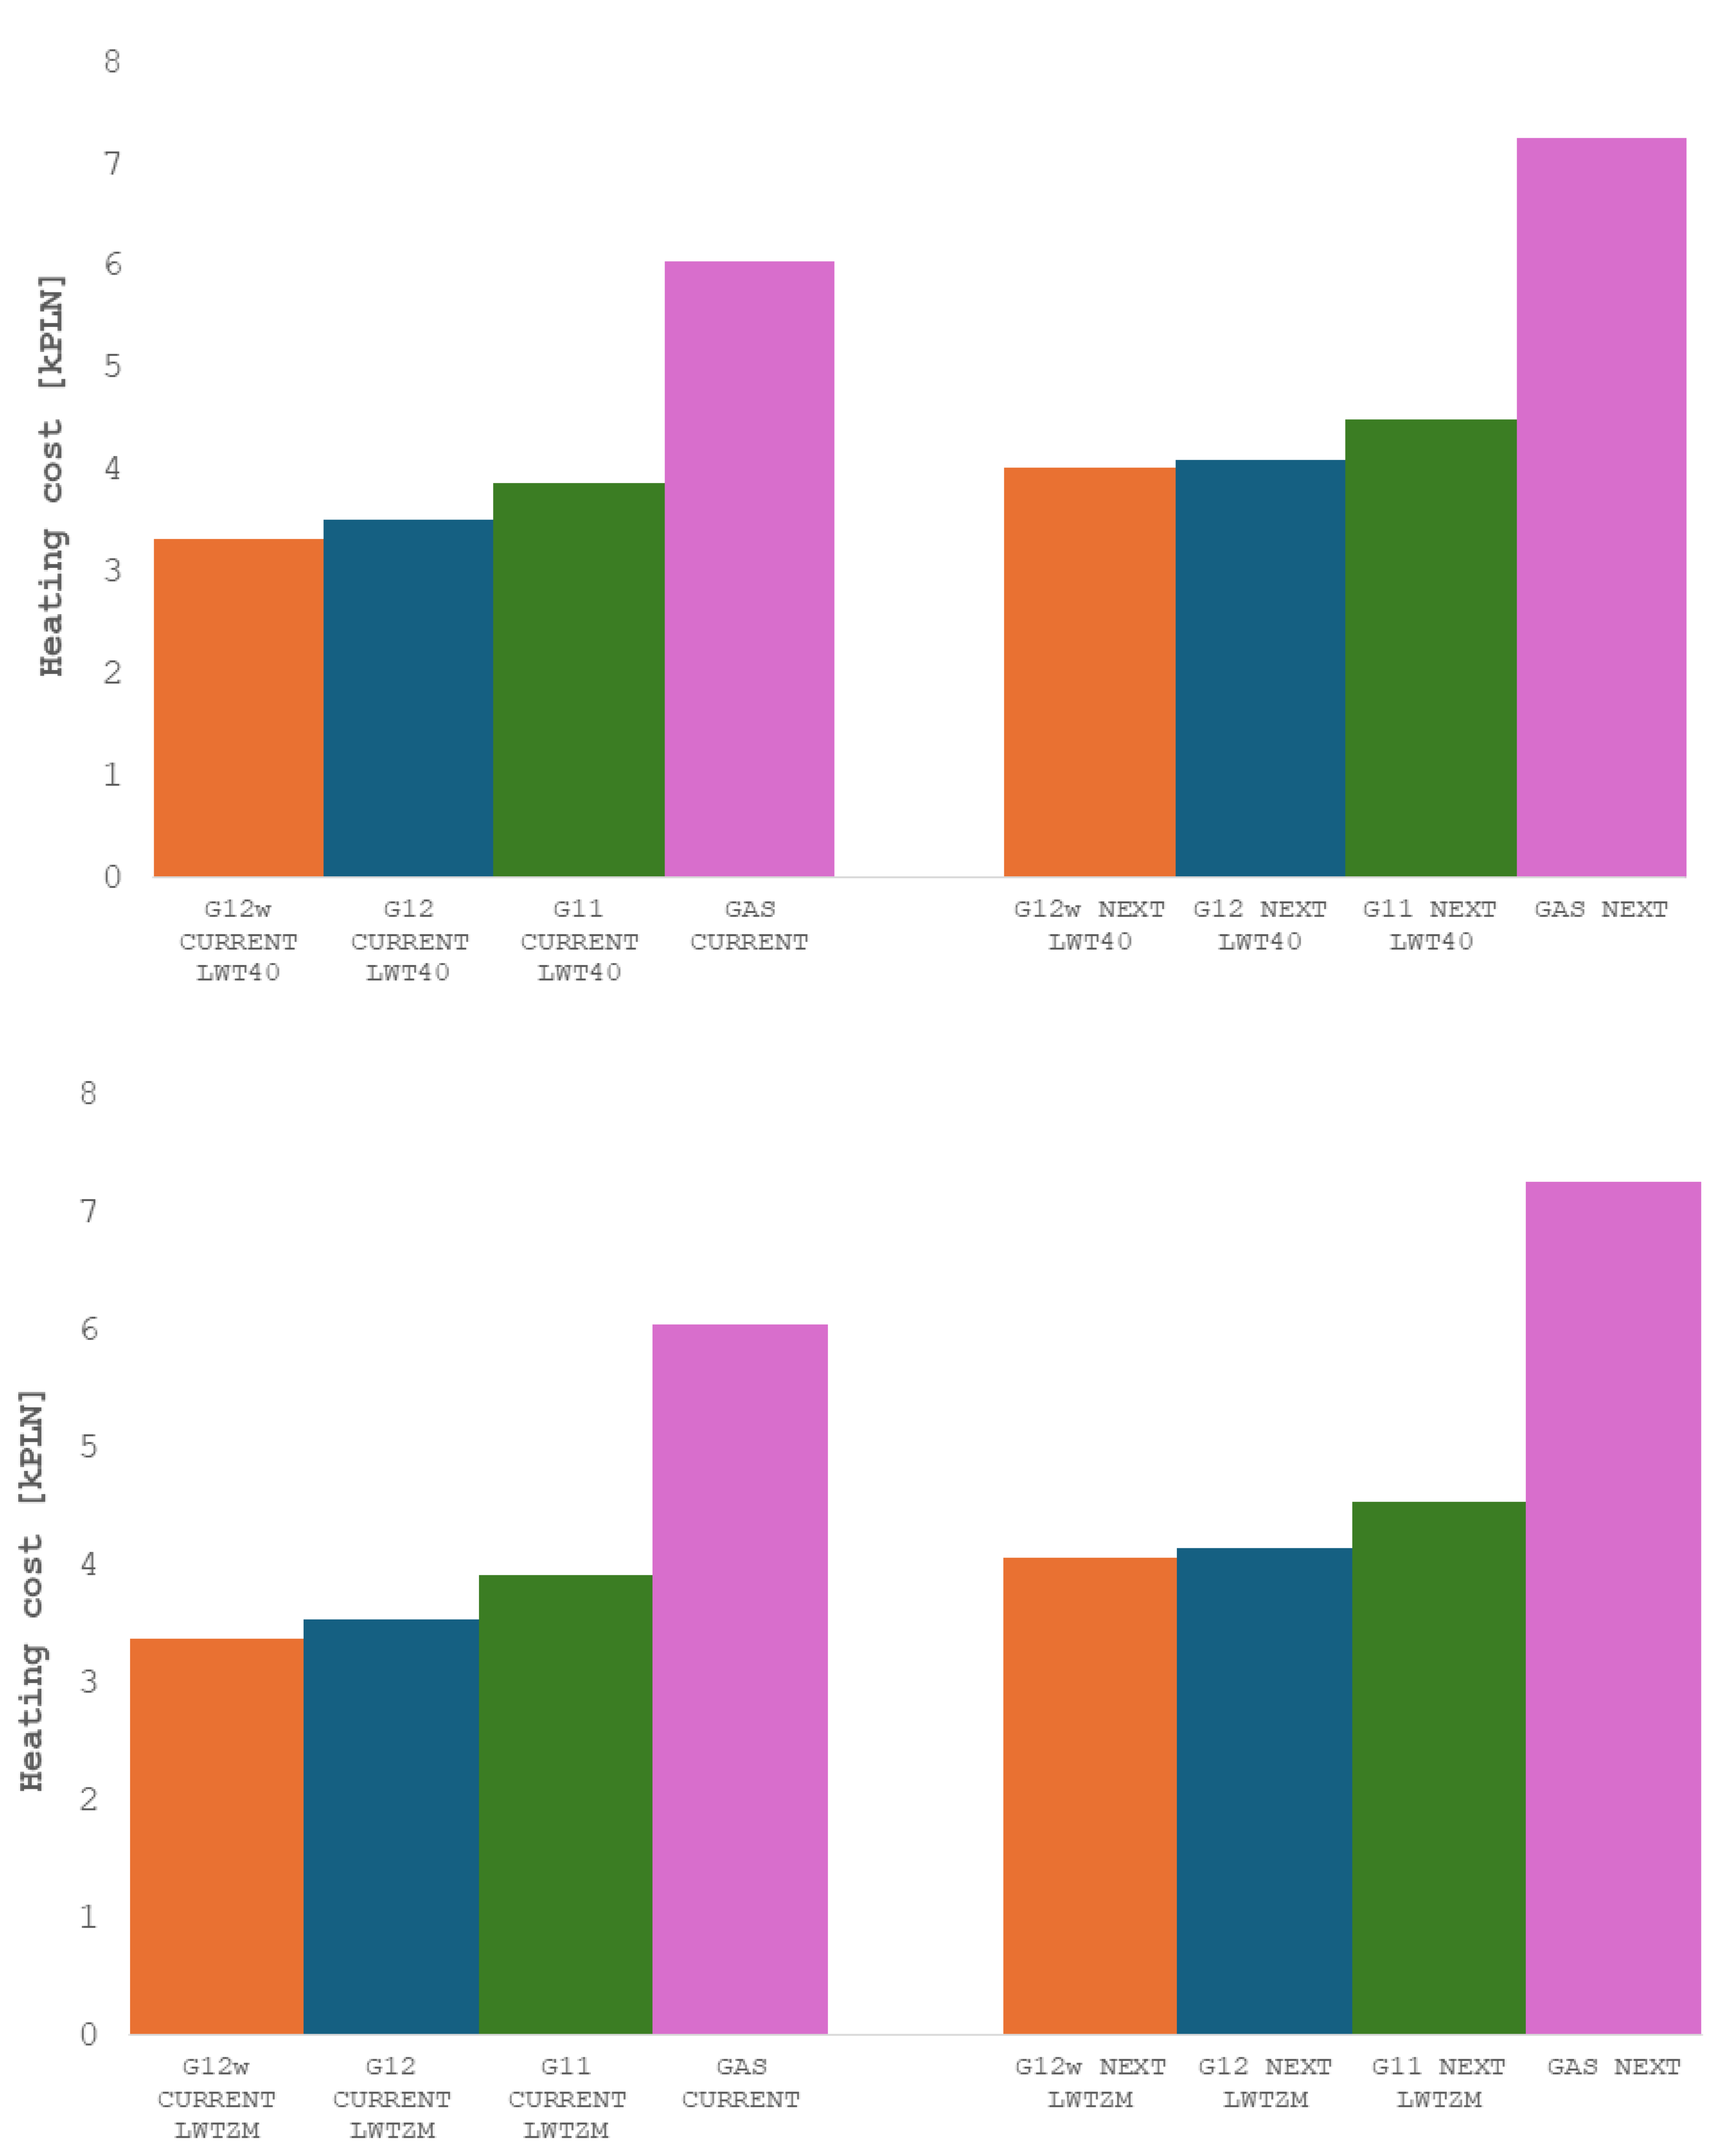
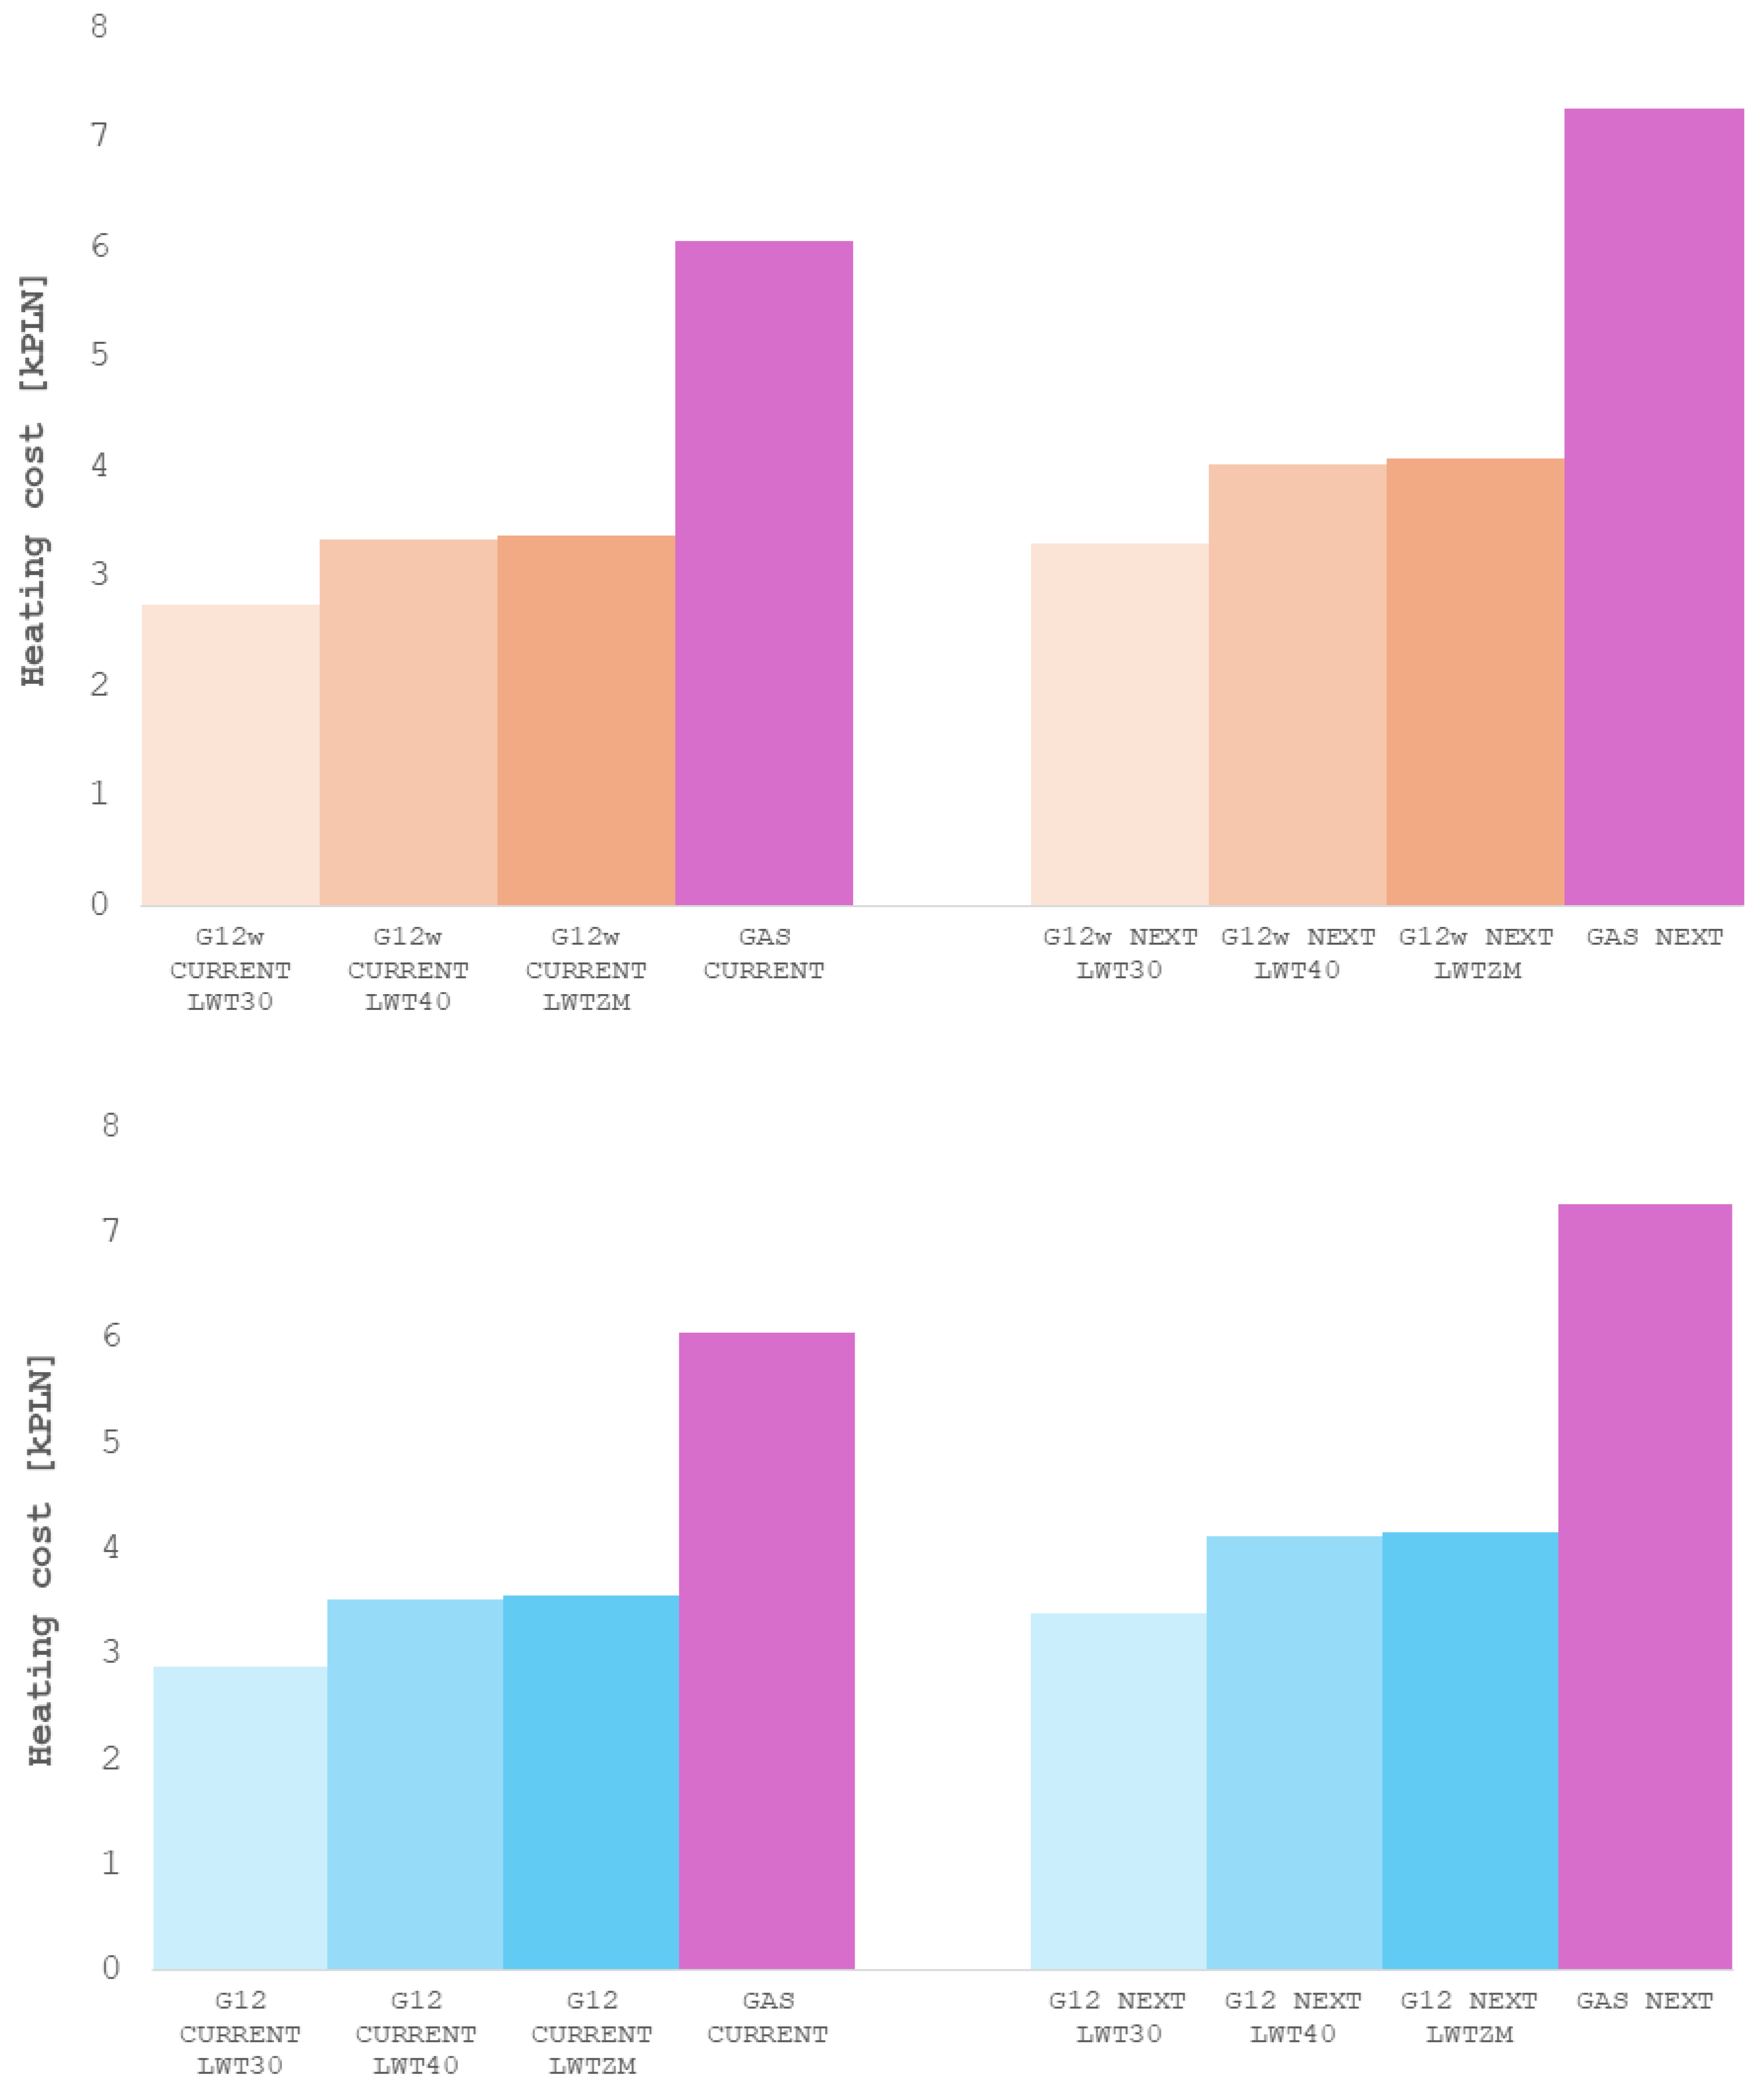
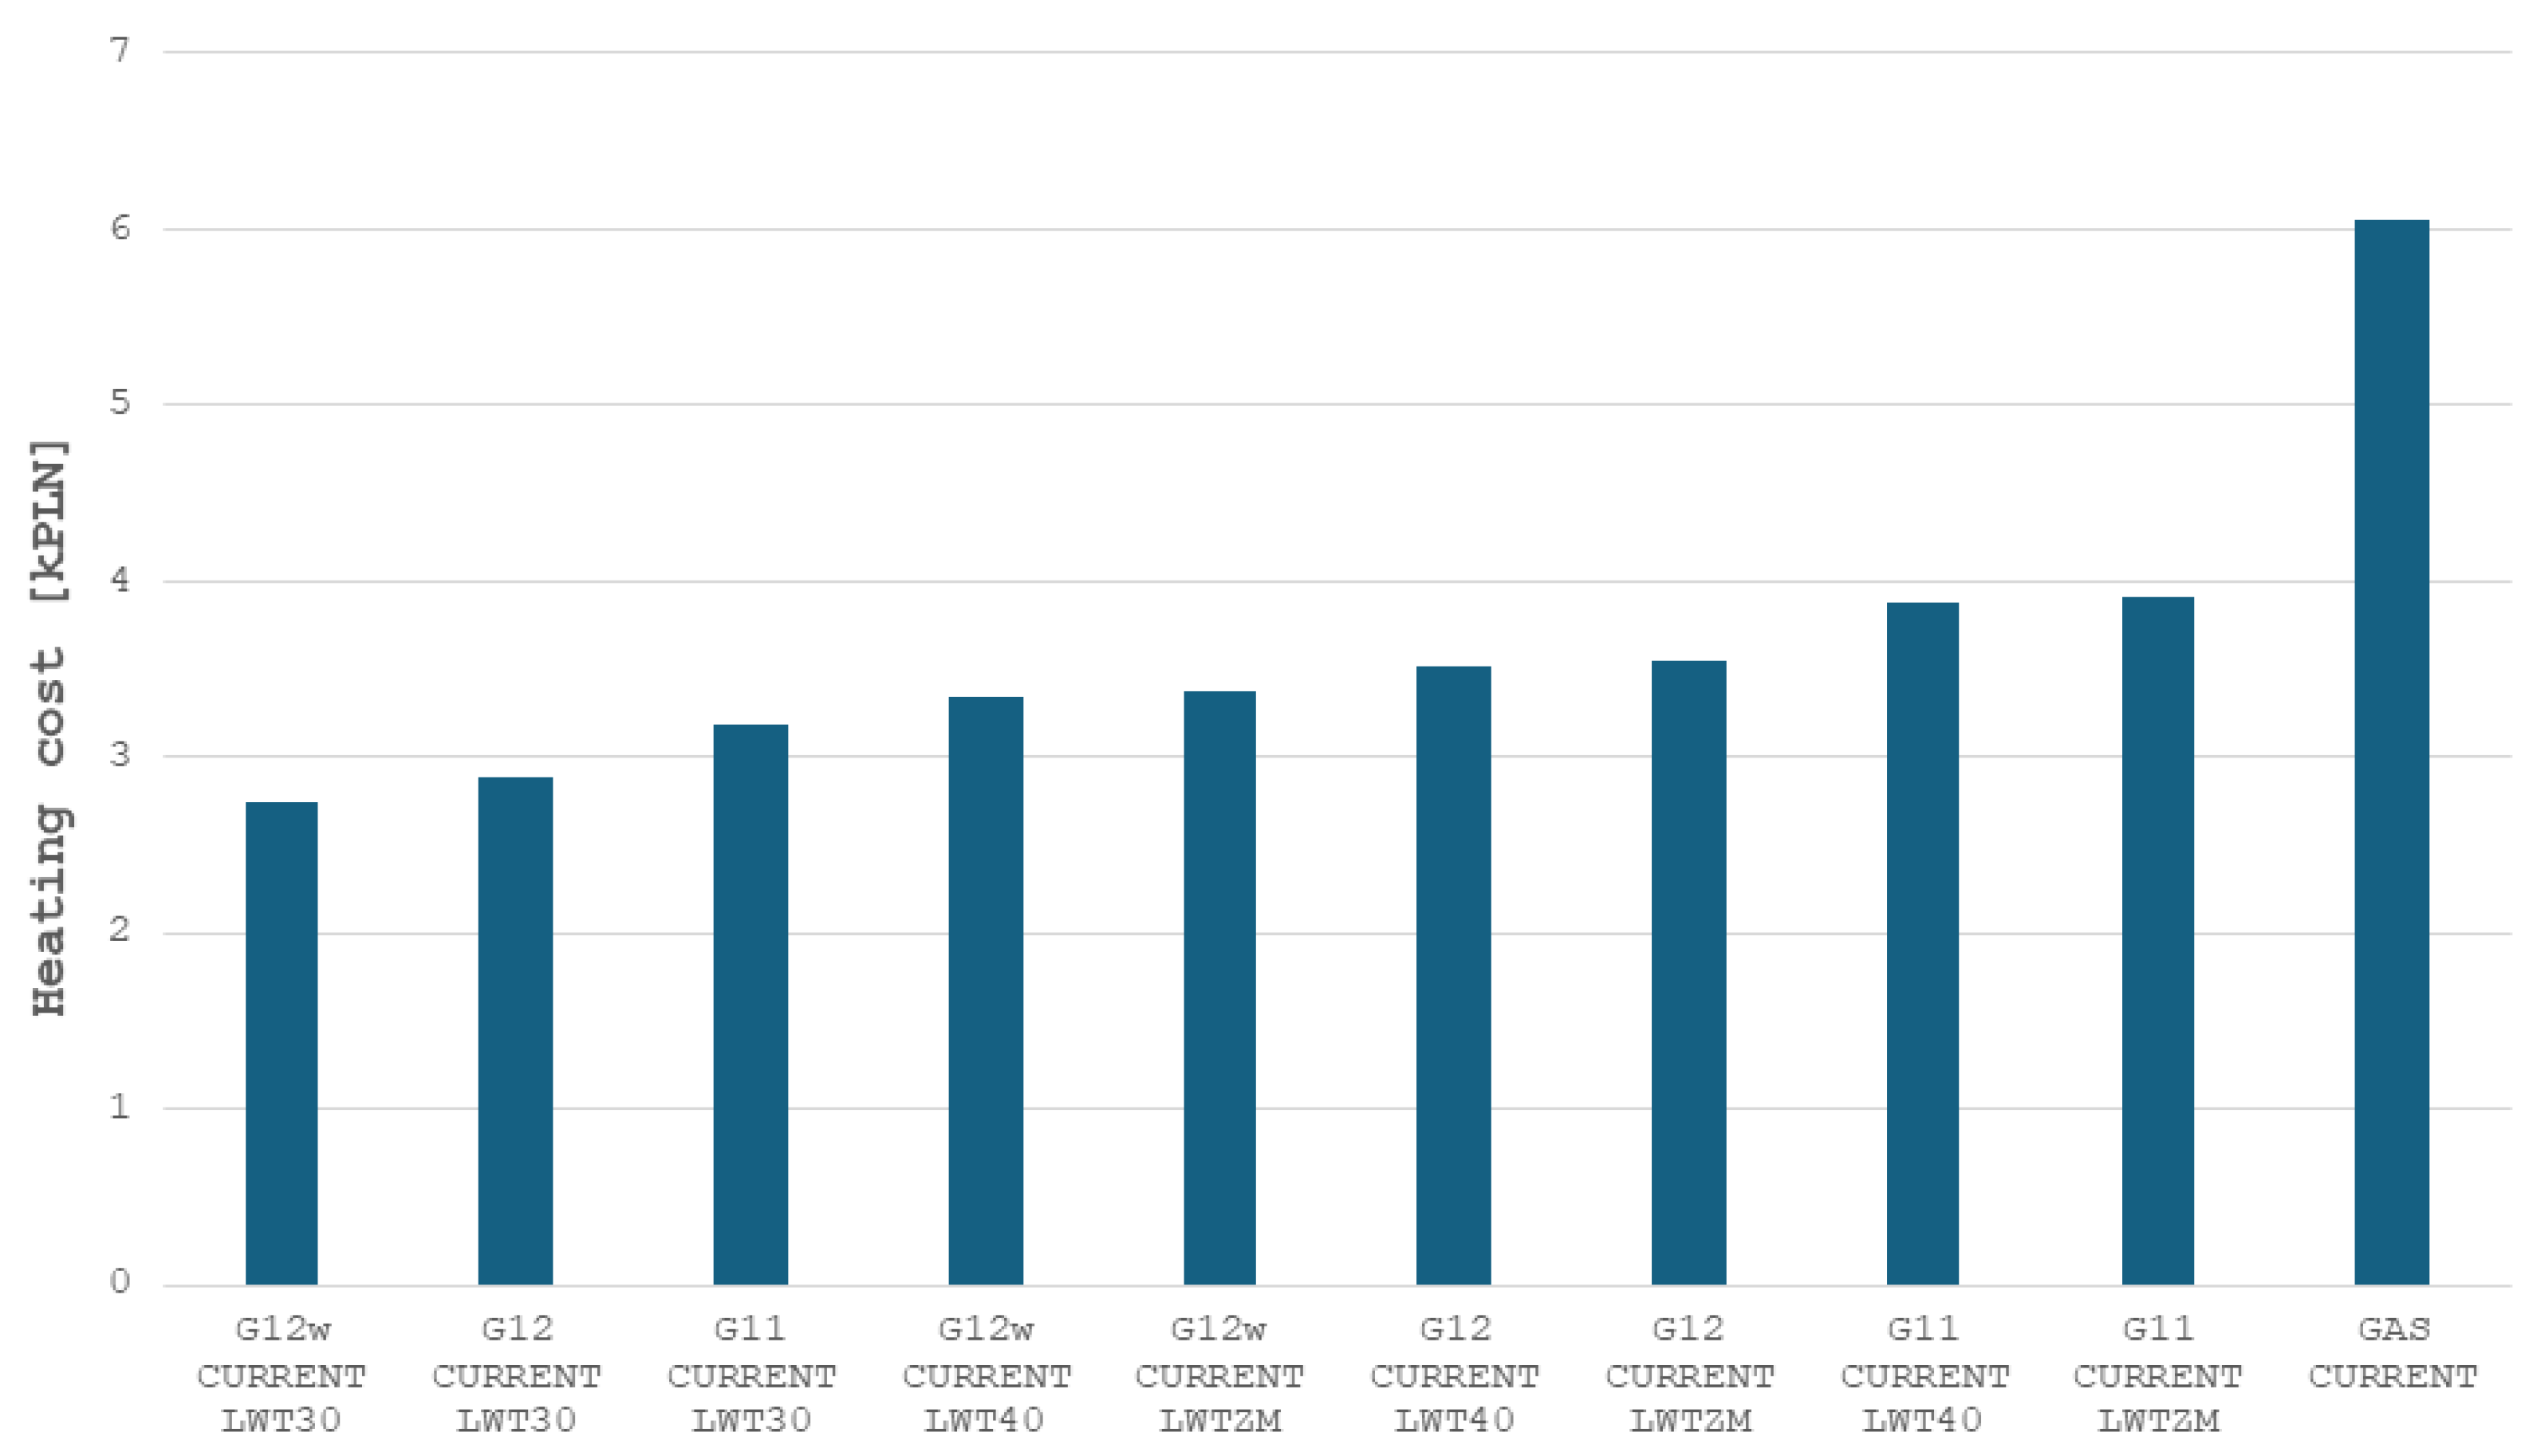
The size of the costs (depending on the technologies and tariffs used) is illustrated in Appendix E. In turn, the heating costs (ascending) for each technology and tariff at the current and future prices of energy carriers (for season II) are shown in Figure 12 and Figure 13, respectively.
Analyzing the above data, we made the following conclusions from the conducted research:
1.
The average temperature in the period under review was 6.97 °C;
2.
The demand for heat energy was 16,312 kWh;
3.
The average COP was
  • 5.53 for technology LWT30;
  • 4.63 for technology LWTZM;
  • 4.50 for technology LWT40.
4.
The demand for electricity was
  • 3246 kWh for technology LWT30;
  • 3950 kWh for technology LWT40;
  • 3991 kWh for technology LWTZM.
The remaining conclusions are the same as for season I (points 5–10). The differences occur only in terms of amounts and percentages for the selected heating techniques.

3.3. Results Summary

Taking into account two heating periods in the study allowed us to compare the results for real climate conditions. This is important because the outdoor temperature has a significant impact on the building’s energy needs and heating costs.
A comparison of the average temperatures in the analyzed heating seasons showed that the 2023/2024 season was warmer (by as much as 1.83 °C). This resulted in a decrease in the demand for thermal energy by 2156 kWh, which means a decrease of 11.67% compared to the 2022/2023 heating season. This is a very significant difference, confirming the occurrence of variable climatic conditions in our latitudes. This variability is additionally increased by climate change, which makes it difficult to forecast the energy and thermal demand for each building. This, in turn, affects the selection of parameters for heating installations in the building.
Table 10 presents the final differences (amounts and percentages) between the heating costs in the two seasons for all the heating techniques examined, taking into account the current tariffs. In turn, Table 11 shows the differences for future electricity and gas tariffs in Poland.
Analyzing the above data, it can be seen that the smallest difference concerns gas heating—less than 12%—and is the same for both current and future tariffs. The lack of differences between tariffs results from the fact that we have taken into account a 20% increase in prices for future costs, so the difference of 11.67% remained unchanged. In turn, the fact that this difference is the smallest for natural gas heating results from the fact that the efficiency remains unchanged, regardless of the outdoor temperature. This means that despite the highest heating costs, gas heating is the least susceptible to changing climatic conditions (due to its specificity of operation, i.e., the possibility of high-temperature heating without a decrease in efficiency).
For electricity tariffs, there is a greater seasonal difference but a relatively small percentage tariff disproportion (from 13.46% in the G12w NEXT LWT40 tariff to 14.42% in the G12 NEXT LWTZM tariff), which is less than a one percent difference. In terms of amounts, the highest disproportions apply to gas tariffs (PLN 800 for the GAS CURRENT tariff and PLN 960 for the GAS NEXT tariff), and the lowest differences apply to low-temperature power supply (LWT30) in the G12w tariffs (PLN 450 and PLN 534 for current and future prices, respectively).

4. Discussion

In our study, we focused on two heating media, natural gas and electricity. The first medium has been used in single- and double-function gas boilers for decades. After the introduction of solutions based on condensation, their efficiency has remained at the same level for a long time. This means that most boilers have similar parameters. However, the future of natural gas in European conditions (including Polish) is uncertain. Geopolitical conditions and climate policy are undoubtedly the main drivers of these changes. However, at present, we cannot clearly state what their pace and final direction will be. And this is what will ultimately affect the price of natural gas and the cost of heating. The second medium has also been used to heat buildings for a long time. However, the technologies used in the past (using electricity) were based on indirect (through an exchange medium) or direct heating using heating devices. At that time, there were radiators with heating coils, oil radiators, and forced air radiators, as well as heating mats (used as surface heating, usually floor heating and, less often, wall or ceiling heating). All of these devices were characterized by a low efficiency coefficient, which was a maximum of 100%, i.e., −1. This in turn meant that such systems were not very economical, especially in buildings with low thermal insulation.
Changes occurred when heat pumps appeared. At that time, the use of electricity became a cost-effective alternative to other heating sources, such as natural gas, fuel oil, coal, or wood. However, unlike other heating sources, heat pumps are evolving, and their parameters and efficiency are getting better and better. On the other hand, (unlike, e.g., gas boilers) there is a huge variation in the quality of these devices, which in turn translates into the parameters achieved, and the differences can reach even tens of percent, significantly changing the total cost of heating.
In our study, we deliberately limited ourselves to these two energy carriers. The need to move away from solid fuels (such as hard coal, peat, pellets, or wood, which emit significant amounts of pollutants) means that more and more emphasis is being placed on low-emission and zero-emission heat sources in the EU (and in Poland). This means that research should focus on those energy carriers that will be used in the future.
It should be noted that we deliberately did not examine the impact of the other two energy tariffs (Tauron: G13 and G14 dynamic) due to their complexity and the anticipated difficulties with data implementation. It is impossible to predict future energy costs for the G14 tariff, and we do not anticipate any significant benefits for the G13 tariff compared to the other tariffs. We also did not conduct research for other energy suppliers and other energy distributors, nor did we take into account promotional and special offers, because they are temporary and may not be available in future price lists. In addition, an increased number of tariffs would significantly increase the resulting data, effectively reducing their readability.
In addition, we have assumed that the radiator heating system allows for supplying water at a temperature of 35–50 °C. However, when the thermal power of the receivers is too small for such temperatures and a high-temperature supply is necessary (50–70 °C), an appropriate heat pump should be used. In this case, one should also consider a significant drop in efficiency, which may simultaneously increase the heating cost above the costs of other heat sources (e.g., a gas boiler).
The last caveat is related to the heat pump system tested. All of our calculations were based on the manufacturer’s (LG Electronics) data in the catalog cards. This means that when using other devices or other parameters, the results may differ from those presented here.
At the same time, our study can be a starting point for other studies, e.g., for other climate zones, buildings with different energy characteristics, or the use of other forms of heating. Despite the above limitations, in our opinion, the results of the conducted research can be helpful for all those who are considering the profitability of using the above sources and heating techniques in their (retrofitted) buildings.

5. Conclusions

The results of our research indicate that there is a significant difference between the cost of heating with a natural gas boiler and a heat pump. However, by selecting the appropriate power supply parameters (LWT) and electricity tariffs, the final cost of heat supplied to the building can be significantly reduced despite the fact that the amount of energy remains unchanged.
It is worth emphasizing that a better seasonal COP (SCOP) does not always mean a lower cost (for a given heating parameter), which additionally indicates the need to perform appropriate calculations for each tested object separately, after entering real data.
The importance of carrying out appropriate calculations before deciding on a heat source is demonstrated by another fact (often omitted in both research and installation practice) related to climate change. Namely, calculations for selecting a heat pump are often carried out for outdated climate data. This means that the device itself has too much power for a given building, which affects both the cost of the investment itself and the operating parameters of the unit (and the entire installation). This in turn translates into its durability (may affect failure rate) and the final cost of generating heat for the building.
To sum up, in all temperature conditions, this low-temperature power supply allows for the highest efficiency of the heat pump and the most economical operation. If this is not possible, it is worth considering the use of different energy tariffs, the specificity of which will allow for financial savings. The above studies show that the G12w tariff (both in the current and future prices) allows for the lowest heating costs (with other parameters unchanged) in both heating seasons. In turn, the highest costs are associated with the use of a natural gas boiler. However, this heating source is the least susceptible to the occurring climatic conditions, so it can also be used at low outdoor temperatures, while an air heat pump will achieve significantly lower efficiency in such conditions.

Author Contributions

Conceptualization, J.B. and A.I.; methodology, N.I.; software, J.B.; validation, N.I.; formal analysis, N.I.; investigation, A.I. and J.B.; resources, A.I.; data curation, J.B.; writing—original draft preparation, J.B. and A.I.; writing—review and editing, A.I. and N.I.; visualization, J.B.; supervision, N.I.; project administration, A.I.; funding acquisition, N.I. All authors have read and agreed to the published version of the manuscript.

Funding

This research was funded by the AGH University of Krakow, program “Excellence initiative—research university for the AGH University of Krakow”.

Institutional Review Board Statement

Not applicable.

Informed Consent Statement

Not applicable.

Data Availability Statement

The data presented in this study are available upon request from the authors.

Conflicts of Interest

The authors declare no conflicts of interest.

Appendix A

Table A1. Table of COP Values for Selected Outdoor Temperatures.
Outdoor Temp. (°C)COP (LWT 30 °C)COP (LWT 35 °C)COP (LWT 40 °C)COP (LWT 45 °C)COP (LWT 50 °C)
−202.792.562.362.151.94
−192.872.642.432.222.02
−182.932.722.502.292.10
−173.012.802.582.362.17
−163.082.882.652.432.25
−153.172.952.722.52.33
−143.253.012.782.572.39
−133.323.072.842.632.45
−123.403.132.912.702.51
−113.473.192.972.762.57
−103.553.253.032.832.62
−93.633.313.092.892.68
−83.703.373.162.962.74
−73.783.443.223.022.80
−63.853.513.293.082.86
−53.933.583.363.132.92
−44.003.643.433.192.98
−34.083.723.53.263.03
−24.163.793.563.333.08
−14.333.813.653.413.16
04.493.833.753.503.24
14.663.853.843.583.32
24.823.883.943.673.4
34.974.084.053.773.48
45.124.284.153.863.56
55.264.484.263.963.64
65.414.684.374.053.72
75.564.904.474.153.8
85.715.004.584.253.88
95.855.104.704.343.97
106.005.194.814.444.05
116.125.334.924.544.13
126.245.475.044.634.21
136.355.615.154.734.30
146.475.755.274.824.38
156.595.905.394.924.46
166.716.035.55.024.54
176.826.165.615.124.63
186.946.285.735.224.71
197.066.415.845.324.80
207.176.545.955.424.89
Source: Authors’ own calculation based on https://www.lg.com/content/dam/channel/wcms/pl/business/download/airsolution/LG_2024_Therma-V-R290-Monobloc_20240321_221354458_.pdf (accessed on 10 March 2025). Note: Bold values are manufacturer data; non-bold values are interpolated.

Appendix B. Simplified Installation Diagram

Energies 18 05413 i001
LEGEND:
Energies 18 05413 i002 circulation pump
Energies 18 05413 i003 power supply from the electricity grid
Energies 18 05413 i004 outdoor temperature sensor
Energies 18 05413 i005 220 L buffer tank
Energies 18 05413 i006 indoor electric heater 9 kW (peak source)
Energies 18 05413 i007 circuit 1 (radiators)
Energies 18 05413 i008 circuit 2 (surface heating)
DESCRIPTION:
We present a simplified diagram of the heating and measurement system of the discussed installation, built using an LG Therma V R290 monoblock 9 kW heat pump. We used the original diagram provided by the manufacturer. However, for greater clarity, we simplified the diagram by removing all components not essential to our research (including valves, safety systems, and control systems). The diagram illustrates the flow of water between the heating system components. Red represents hot water and blue represents cold water. Arrows indicate the water flow direction. Green indicates the control and purple indicates the power supply from the power grid. The measurement circuits are marked as follows: E1 (power supply to the outdoor unit), E2 (power supply to the indoor unit with the heater, which is the peak source), and C1 (the heat meter). We used separate electricity meters for the indoor and outdoor units to verify that the bivalence point was set correctly (i.e., that the heater’s share of the total electricity demand was not excessive). The heat meter records the amount of heat generated, as using data from the heat pump would be subject to a significant measurement error. Additionally, E2 measures the energy consumption of the circulation pump, which also affects the achieved COP. A buffer tank is an essential element in a heating system that includes radiators due to the required water volume in the circuit. An outdoor temperature sensor measures the ambient temperature, which allows for controlling the heating curve for use with the LWTZM option. LTW30 and LWT40 are the temperatures for surface heating and radiators, respectively. For a specific option (LWT30, LWT40), the following must be disabled from the system: circuit 1 and the temperature sensor (for the LWT30); circuit 2 and the temperature sensor (for the LWT40). For the LWTZM option, circuit 2 must be disabled, leaving the outdoor temperature sensor connected.

Appendix C. Thermal Demand of the Building for Outdoor Temperatures −20…20 °C

Outdoor Temperature [°C]ΔT [°C]Power [kW]Heat Consumption [kWh)
−20409.79234.96
−19399.55229.09
−18389.30223.21
−17379.06217.34
−16368.81211.46
−15358.57205.59
−14348.32199.72
−13338.08193.84
−12327.83187.97
−11317.59182.09
−10307.34176.22
−9297.10170.35
−8286.85164.47
−7276.61158.60
−6266.36152.72
−5256.12146.85
−4245.87140.98
−3235.63135.10
−2225.38129.23
−1215.14123.35
0204.90117.48
1194.65111.61
2184.41105.73
3174.1699.86
4163.9293.98
5153.6788.11
6143.4382.24
7133.1876.36
8122.9470.49
9112.6964.61
10102.4558.74
1192.2052.87
1281.9646.99
1371.7141.12
1461.4735.24
1551.2229.37
1640.9823.50
1730.7317.62
1820.4911.75
1910.245.87
2000.000.00

Appendix D. Heating Costs (Ranked in Ascending Order) [PLN Thousand] by Source in the 2022/2023 Season
Energies 18 05413 i009
Energies 18 05413 i010
Energies 18 05413 i011
Energies 18 05413 i012

Appendix E. Heating Costs (Ascending) [PLN Thousand] by Source in the 2023/2024 Season

Energies 18 05413 i013
Energies 18 05413 i014
Energies 18 05413 i015
Energies 18 05413 i016

References

  1. European Commission. The European Green Deal. Available online: https://commission.europa.eu/strategy-and-policy/priorities-2019-2024/european-green-deal_en (accessed on 3 March 2025).
  2. Directive 2010/31/EU of the European Parliament and of the Council of 19 May 2010 on the Energy Performance of Buildings (Recast). Available online: https://eur-lex.europa.eu/legal-content/EN/TXT/?uri=CELEX%3A32010L0031 (accessed on 4 March 2025).
  3. Directive 2009/28/EC of the European Parliament and of the Council of 23 April 2009 on the Promotion of the Use of Energy from Renewable Sources and Amending and Subsequently Repealing Directives 2001/77/EC and 2003/30/EC (Text with EEA relevance). Available online: https://eur-lex.europa.eu/legal-content/EN/TXT/?uri=CELEX%3A32009L0028 (accessed on 4 March 2025).
  4. Directive (EU) 2023/1791 of the European Parliament and of the Council of 13 September 2023 on Energy Efficiency and Amending Regulation (EU) 2023/955 (Recast) (Text with EEA Relevance). Available online: https://eur-lex.europa.eu/legal-content/EN/ALL/?uri=CELEX%3A32023L1791 (accessed on 3 March 2025).
  5. Clean Air, Czyste Powietrze. Available online: https://energetycznyprojekt.pl/dotacje-i-ulgi/program-czyste-powietrze-2/?utm_source=google&utm_medium=cpc&utm_campaign=%5BSearch%5D%20-%20Termomodernizacje&gad_source=1&gad_campaignid=21179132783&gbraid=0AAAAABOIBnzc3SEGa2-IXmF-vCwYULtao&gclid=Cj0KCQjwo63HBhCKARIsAHOHV_XG6psAdwdVa9WsP6laeknifubjawzqAQUqpFqA2Coz9xUkEk_XvcQaAvgxEALw_wcB (accessed on 4 March 2025).
  6. My Heat, Program Dofinansowania Pomp Ciepła. Available online: https://mojecieplo.gov.pl/ (accessed on 7 March 2025).
  7. Polityka Energetyczna Polski do 2040 r. (PEP2040). Available online: https://www.gov.pl/web/ia/polityka-energetyczna-polski-do-2040-r-pep2040 (accessed on 7 March 2025).
  8. Krajowy Plan w Dziedzinie Energii i Klimatu. Available online: https://www.gov.pl/web/klimat/krajowy-plan-na-rzecz-energii-i-klimatu (accessed on 14 March 2025).
  9. ETS—European Union Emissions Trading System. Available online: https://eur-lex.europa.eu/EN/legal-content/summary/eu-emissions-trading-system.html) (accessed on 17 March 2025).
  10. Zieniewicz, R. Przygotuj się na Gigantyczne Rachunki za Gaz po Wprowadzeniu Opłat za Emisję ETS2. 2025. Available online: https://www.farmer.pl/energia/przygotuj-sie-na-gigantyczne-rachunki-za-gaz-po-wprowadzeniu-oplat-za-emisje-ets2,155415.html (accessed on 17 March 2025).
  11. Bilal, A.; Känzig, D.R. Does Unilateral Decarbonization Pay For Itself? Working Paper 33364, National Bureau Of Economic Research, Cambridge. 2025. Available online: https://www.nber.org/system/files/working_papers/w33364/w33364.pdf (accessed on 17 March 2025).
  12. Mišík, M.; Oravcová, V.; Vicenová, R. Energy efficiency of buildings in Central and Eastern Europe: Room for improvement. Energy Effic. 2024, 17, 32. [Google Scholar] [CrossRef]
  13. Sewastianik, S.; Gajewski, A. Energetic and Ecologic Heat Pumps Evaluation in Poland. Energies 2020, 13, 4980. [Google Scholar] [CrossRef]
  14. Sewastianik, S.; Gajewski, A. An Environmental Assessment of Heat Pumps in Poland. Energies 2021, 14, 8104. [Google Scholar] [CrossRef]
  15. Pater, S. Field measurements and energy performance analysis of renewable energy source devices in a heating and cooling system in a residential building in southern Poland. Energy Build. 2019, 199, 115–125. [Google Scholar] [CrossRef]
  16. Chwieduk, B.; Chwieduk, D. Analysis of operation and energy performance of a heat pump driven by a PV system for space heating of a single family house in polish conditions. Renew. Energy 2021, 165 Pt 2, 117–126. [Google Scholar] [CrossRef]
  17. Ginda, G.; Iwaszczuk, N.; Dudek, M. Supporting Multi-Attribute, Non-Compensating Selection of the Right Heat Pump Device for a Residential Building, Considering the Limited Availability of the Necessary Resources. Energies 2022, 15, 5478. [Google Scholar] [CrossRef]
  18. Jędrzejuk, H.; Chwieduk, D. Possibilities of Upgrading Warsaw Existing Residential Area to Status of Positive Energy Districts. Energies 2021, 14, 5984. [Google Scholar] [CrossRef]
  19. Gradziuk, P.; Siudek, A.; Klepacka, A.M.; Florkowski, W.J.; Trocewicz, A.; Skorokhod, I. Heat Pump Installation in Public Buildings: Savings and Environmental Benefits in Underserved Rural Areas. Energies 2022, 15, 7903. [Google Scholar] [CrossRef]
  20. Ciuman, P.; Kaczmarczyk, J.; Jastrzębska, M. Simulation Analysis of Heat Pumps Application for the Purposes of the Silesian Botanical Garden Facilities in Poland. Energies 2023, 16, 340. [Google Scholar] [CrossRef]
  21. Chwieduk, D.; Chwieduk, B. Application of Heat Pumps in New Housing Estates in Cities Suburbs as an Means of Energy Transformation in Poland. Energies 2023, 16, 3495. [Google Scholar] [CrossRef]
  22. Ołtarzewska, A.; Krawczyk, D.A. Simulation and Performance Analysis of an Air-Source Heat Pump and Photovoltaic Panels Integrated with Service Building in Different Climate Zones of Poland. Energies 2024, 17, 1182. [Google Scholar] [CrossRef]
  23. Witkowska, A.; Krawczyk, D.A. Analysis of the Advisability of Using an Air-Source Heat Pump in a Single Family House in Poland and Spain. Proceedings 2020, 51, 11. [Google Scholar] [CrossRef]
  24. Brudermueller, T.; Potthoff, U.; Fleisch, E.; Wortmann, F.; Staake, T. Estimation of energy efficiency of heat pumps in residential buildings using real operation data. Nat. Commun. 2025, 16, 2834. [Google Scholar] [CrossRef]
  25. Śliwa, T.; Kotyza, J. Application of existing wells as ground heat source for heat pumps in Poland. Appl. Energy 2003, 74, 3–8. [Google Scholar] [CrossRef]
  26. Kijo-Kleczkowska, A.; Bruś, P.; Więciorkowski, G. Economic analysis of heat pump exploitation—A case study. Energy 2023, 280, 128184. [Google Scholar] [CrossRef]
  27. Masiukiewicz, M.; Tańczuk, M.; Anweiler, S.; Streckienė, G.; Boldyryev, S.; Chacartegui, R.; Olszewski, E. Performance variability of air-water heat pumps in cold and warm years across European climate zones. Energy 2025, 324, 136001. [Google Scholar] [CrossRef]
  28. Bayer, D.R.; Pruckner, M. Data-driven heat pump retrofit analysis in residential buildings: Carbon emission reductions and economic viability. Appl. Energy 2024, 373, 123823. [Google Scholar] [CrossRef]
  29. Khan, S.A.; O‘Hegarty, R.; Finn, D.; Kinnane, O. Environmental footprint analysis of domestic air source heat pumps, Resources. Conserv. Recycl. Adv. 2024, 22, 200217. [Google Scholar] [CrossRef]
  30. Duniec, G. Pory Roku Okiem Astronoma, Meteorologa i Agrometeorologa. Centrum Modelowania Meteorologicznego. 2024. Available online: https://modele.imgw.pl/?page_id=40550 (accessed on 17 March 2025).
  31. Narowski, P. Ewolucja Kryteriów Wyboru i Wartości Temperatury Obliczeniowej Powietrza Zewnętrznego dla Ogrzewnictwa w Polsce. Fiz. Budowli W Teor. I Prakt. 2011, VI, 61–67. [Google Scholar]
  32. Zmiany Klimatu w Polsce Wymagają Zmian w Projektowaniu Systemów Ogrzewania i Klimatyzacji. 2024. Available online: https://dobrymontaz.com/zmiany-klimatu-w-polsce-wymagaja-zmian-w-projektowaniu-systemow-ogrzewania-i-klimatyzacji/ (accessed on 14 March 2025).
  33. Projekty SKP2000 i TLM2000—Zmiany Klimatu w Polsce Wymagają Zmian w Projektowaniu Systemów HVAC. 2023. Available online: https://portpc.pl/projekty-skp2000-i-tlm2000%E2%88%92zmiany-klimatu-w-polsce-wymagaja-zmian-w-projektowaniu-systemow-hvac/ (accessed on 14 March 2025).
  34. Bazazzadeh, H.; Pilechiha, P.; Nadolny, A.; Mahdawinejad, M.; Hashemi Safaei, S. The Impact Assessment of Climate Change on Building Energy Consumption in Poland. Energies 2021, 14, 4084. [Google Scholar] [CrossRef]
  35. Lachman, P.; Djaków, P. Zmiany Klimatu i Ich Wpływ na Projektowanie Instalacji c.o. z Pompami Ciepła w Budynkach, Współczynnik SCOP Pomp Ciepła w Metodologii Wyznaczania Charakterystyki Energetycznej Budynków. PORT PC 2021. Available online: https://portpc.pl/pdf/9kongres/materialy/2021_Poradnik_Zmiany_klimatu.pdf (accessed on 17 March 2025).
  36. Obwieszczenie Ministra Rozwoju i Technologii z Dnia 15 Kwietnia 2022 r. w Sprawie Ogłoszenia Jednolitego Tekstu Rozporządzenia Ministra Infrastruktury w Sprawie Warunków Technicznych, Jakim Powinny Odpowiadać Budynki i ich Usytuowanie. Available online: https://isap.sejm.gov.pl/isap.nsf/DocDetails.xsp?id=WDU20220001225 (accessed on 14 March 2025).
  37. Zużycie Energii w Gospodarstwach Domowych w 2021 Roku. GUS. 2023. Available online: https://stat.gov.pl/obszary-tematyczne/srodowisko-energia/energia/zuzycie-energii-w-gospodarstwach-domowych-w-2021-roku,2,5.html (accessed on 17 March 2025).
  38. Czym Się Ogrzewają Polacy. Najnowsze Dane z Bazy CEEB. Magazyn Ciepła Systemowego, Izba Gospodarcza Ciepłownictwo Polskie. 2023. Available online: https://magazyncieplasystemowego.pl/cieplownictwo/czym-sie-ogrzewaja-polacy-najnowsze-dane-z-bazy-ceeb/ (accessed on 19 March 2025).
  39. CEEB GUNB. Available online: https://zone.gunb.gov.pl/ (accessed on 14 March 2025).
  40. Ustawa z Dnia 5 Sierpnia 2022 r. o Dodatku Węglowym, Dz.U. 2022 poz. 1692. Available online: https://isap.sejm.gov.pl/isap.nsf/DocDetails.xsp?id=WDU20220001692 (accessed on 19 March 2025).
  41. Ustawa o Bonie Energetycznym Oraz o Zmianie Niektórych Ustaw w Celu Ograniczenia cen Energii Elektrycznej, Gazu Ziemnego i Ciepła Systemowego. 2024. Available online: https://orka.sejm.gov.pl/proc10.nsf/ustawy/346_u.htm (accessed on 19 March 2025).
  42. Wolff, D.; Teuber, P.; Budde, J.; Jagnow, K. Abschlussbericht. 2004. Available online: https://opac.dbu.de/ab/DBU-Abschlussbericht-AZ-14133.pdf (accessed on 19 March 2025).
  43. PN EN 303-5:2012, Kotły Grzewcze na Paliwa Stałe z Ręcznym i Automatycznym Zasypem Paliwa o Mocy Nominalnej do 300 kW. Terminologia, Wymagania, Badania i Oznakowanie. 2023. Available online: https://kamen.com.pl/blog/norma-pn-en-303-5-co-musisz-wiedziec-o-normie-emisji-i-sprawnosci-dla-domowych-kotlow-na-wegiel/ (accessed on 14 March 2025).
  44. Foit, M. Kotły Węglowe na 5. Klasa w Teorii i Praktyce. Instal Reporter. 2016. Available online: https://instalreporter.pl/ogolna/kotly-weglowe-na-5-klasa-w-teorii-i-praktyce/ (accessed on 14 March 2025).
  45. Kwiatkowski, T. Współczynnik Przenikania Ciepła U–Według Norm, Według Obliczeń, Rockwool. Available online: https://www.rockwool.com/pl/inspiracje-baza-wiedzy/baza-wiedzy/efektywnosc-energetyczna/obliczanie-wspolczynnika-przenikania-ciepla/ (accessed on 19 March 2025).
  46. Dane do Obliczeń Energetycznych Budynków, Ministerstwo Inwestycji i Rozwoju. 2019. Available online: https://www.gov.pl/web/archiwum-inwestycje-rozwoj/dane-do-obliczen-energetycznych-budynkow (accessed on 14 March 2025).
  47. Statystyczne Dane Klimatyczne dla Obszaru Polski do Obliczeń Energetycznych Budynków, Ministerstwo Rozwoju i Technologii. 2024. Available online: https://dane.gov.pl/pl/dataset/797,typowe-lata-meteorologiczne-i-statystyczne-dane-klimatyczne-dla-obszaru-polski-do-obliczen-energetycznych-budynkow (accessed on 14 March 2025).
  48. Firląg, S.; Piasecki, M. NZEB Renovation Definition in a Heating Dominated Climate: Case Study of Poland. Appl. Sci. 2018, 8, 1605. [Google Scholar] [CrossRef]
  49. Ciepło Właściwie. Available online: https://cieplo.app/ (accessed on 4 March 2025).
  50. Pompy Ciepła dla Zrównoważonej Przyszłości, LG Business Solutions. 2024. Available online: https://www.lg.com/content/dam/channel/wcms/pl/business/download/airsolution/LG_2024_Therma-V-R290-Monobloc_20240321_221354458_.pdf (accessed on 7 March 2025).
  51. Normy Klimatyczne 1991–2020, Klimat IMGW-PIB. Available online: https://klimat.imgw.pl/pl/climate-normals/TSR_AVE (accessed on 9 March 2025).
  52. Pogoda i Klimat, Aktualne Dane Pomiarowe. 2025. Available online: https://meteomodel.pl/aktualne-dane-pomiarowe/?rodzaj=da&wmoid=12600 (accessed on 4 March 2025).
  53. Ceny Gazu w 2025 Roku dla Obiorców w Gospodarstwach Domowych–Taryfa PGNiG OD bez Zmian do Końca Czerwca, Rachunki Wyższe z Nowymi Opłatami Dystrybucyjnymi. PGNiG. 2024. Available online: https://pgnig.pl/aktualnosci/-/news-list/id/ceny-gazu-w-2025-roku-dla-obiorcow-w-gospodarstwach-domowych-taryfa-pgnig-od-bez-zmian-do-konca-czerwca-rachunki-wyzsze-z-nowymi-oplatami-dystrybucyjn/newsGroupId/10184 (accessed on 7 March 2025).
  54. Jakie Będą Ceny Prądu w 2025 Roku? Available online: https://lepiej.tauron.pl/bezpieczenstwo-i-finanse/jakie-beda-ceny-pradu-w-2025-roku/ (accessed on 9 March 2025).
  55. RCEm—Rynkowa Miesięczna Cena Energii Elektrycznej. Available online: https://www.pse.pl/oire/rcem-rynkowa-miesieczna-cena-energii-elektrycznej (accessed on 9 March 2025).
  56. Nowa Energia na Lata. Tauron. 2025. Available online: https://www.tauron.pl/dla-domu/prad/prad-z-usluga/nowa-energia?ef=O&o=9 (accessed on 7 March 2025).
  57. Nowa Taryfa TAURON Dystrybucji na 2025 rok. Tauron Dystrybucja. 2024. Available online: https://www.tauron-dystrybucja.pl/o-spolce/aktualnosci/2024/12/18 (accessed on 7 March 2025).
  58. Taryfa PGNiG Obrót Detaliczny sp. z o.o. w Zakresie Obrotu Paliwami Gazowymi nr 15, PGNiG, Grupa Orlen. Warszawa. 2024. Available online: https://pgnig.pl/documents/10184/45904/Taryfa+nr+15+PGNiG+obowi%C4%85zuj%C4%85ca+od+1+lipca+2024.pdf/1b47b2fd-e864-46f8-9358-999433e21f69 (accessed on 7 March 2025).
  59. Decyzja, Prezes Urzędu Regulacji Energetyki. Warszawa. 2024. Available online: https://pgnig.pl/documents/10184/45904/Taryfa+PSG+nr+13+obowi%C4%85zuj%C4%85ca+od+1+stycznia+2025.pdf/813a6214-4418-4fbf-a05a-bfb5b71fad42 (accessed on 7 March 2025).
Figure 1. The algorithm of the conducted research.
Energies 18 05413 g001
Figure 2. Outdoor temperature (left axis) and heat demand (right axis) in Season I.
Energies 18 05413 g002
Figure 3. Outdoor temperature (right axis) and COP coefficient for heat pump (left axis) in Season I.
Energies 18 05413 g003
Figure 4. Heating costs (ranked ascending) [PLN thousand] for tariffs in the 2022/2023 season.
Energies 18 05413 g004
Figure 5. Heating costs (ranked ascending) [PLN thousand] for future tariffs calculated for the 2022/2023 season.
Energies 18 05413 g005
Figure 6. Heating costs (cumulative) [PLN thousand] for tariffs applicable in the 2022/2023 season.
Energies 18 05413 g006
Figure 7. Heating costs (cumulative) [PLN thousand] for future tariffs calculated for the 2022/2023 season.
Energies 18 05413 g007
Figure 8. Outdoor temperature (left axis) and heat demand (right axis) in Season II.
Energies 18 05413 g008
Figure 9. Outdoor temperature (right axis) and COP coefficient for heat pump (left axis) in Season II.
Energies 18 05413 g009
Figure 10. Heating costs (in ascending order) [PLN thousand] for tariffs applicable in the 2023/2024 season.
Energies 18 05413 g010
Figure 11. Heating costs (in ascending order) [PLN thousand] for future tariffs calculated for the 2023/2024 season.
Energies 18 05413 g011
Figure 12. Heating costs [PLN thousand] (cumulative) for tariffs applicable in the 2023/2024 season.
Energies 18 05413 g012
Figure 13. Heating costs [PLN thousand] (cumulative) for future tariffs calculated for the 2023/2024 season.
Energies 18 05413 g013
Table 1. Average energy consumption values, depending on the year of construction (building without thermal retrofitting).
Year of ConstructionPrimary Energy (kWh/m2a)Final Energy (kWh/m2a)
Before 1918>350>300
1918–1944300–350260–300
1945–1970250–300220–260
1971–1978210–250190–220
1979–1988160–210140–190
1989–2002140–180125–160
2003–2010100–15090–120
Source: Own study based on Ref. [48].
Table 2. Calculations for the gas tariff.
Fee Components/Gas FeeNet Price
[PLN/kWh]
Gross Price
[PLN/kWh]
Final Price
[PLN/kWh]
GAS CURRENT fuel0.239650.294770.37123
GAS CURRENT distribution0.062160.07646
GAS CURRENT total0.301810.37123
GAS NEXT total0.44547
Source: Own study based on Refs. [58,59].
Table 3. Calculations for the G11 tariff.
Fee Components/Electricity Fee in the G11 TariffNet Price [PLN/kWh]Gross Price [PLN/kWh]Final Price [PLN/kWh]
G11 CURRENT active0.505000.621150.98117
G11 CURRENT quality0.032100.03948
G11 CURRENT network0.254100.31254
G11 CURRENT RES0.003500.00431
G11 CURRENT cogeneration0.003000.00369
G11 CURRENT total0.797700.98117
Forecast
G11 NEXT active0.632000.777361.13738
G11 NEXT quality0.032100.03948
G11 NEXT network0.254100.31254
G11 NEXT RES0.003500.00431
G11 NEXT cogeneration0.003000.00369
G11 NEXT total0.924701.13738
Source: Own study based on Refs. [56,57].
Table 4. Calculations for the G12 tariff.
Fee Components/Electricity Fee in the G12 TariffZone I (Peak)Zone II (Off-Peak)Zone Final Price [PLN/kWh]
Net Price [PLN/kWh]Gross Price [PLN/kWh]Final Price [PLN/kWh]Net Price [PLN/kWh]Gross Price [PLN/kWh]Final Price [PLN/kWh]
G12 CURRENT active0.505000.621151.0252050.467000.574410.6965514 h peak zone, 10 h off-peak zone
G12 CURRENT quality0.032100.039480.032100.03948
G12 CURRENT network0.289900.356580.060900.07491
G12 CURRENT RES0.003500.004310.003300.00406
G12 CURRENT cogeneration0.003000.003690.003000.00369
G12 CURRENT total0.833501.025210.566300.696550.88827
Forecast
G12 NEXT active0.717000.881911.2859650.467000.574410.965514 h peak zone, 10 h off-peak zone
G12 NEXT quality0.032100.039480.032100.03948
G12 NEXT network0.289900.356580.060900.07491
G12 NEXT RES0.003500.004310.003300.00406
G12 NEXT cogeneration0.003000.003690.003000.00369
G12 NEXT total1.045501.285970.566300.696551.04038
Source: Own study based on Refs. [56,57].
Table 5. Calculations for the G12w tariff.
Fee Components/Electricity Fee in the G12 TariffZone I (Peak)Zone II (Off-Peak)Zone Final Price [PLN/kWh]
Net Price [PLN/kWh]Gross Price [PLN/kWh]Final Price [PLN/kWh]Net Price [PLN/kWh]Gross Price [PLN/kWh]Final Price [PLN/kWh]
G12w CURRENT active0.505000.621151.0709610.467000.574410.6856014 h peak zone, 10 h off-peak zone
G12w CURRENT quality0.032100.039480.032100.03948
G12w CURRENT network0.327100.402330.051800.06371
G12w CURRENT RES0.003500.004310.003500.00431
G12w CURRENT cogeneration0.003000.003690.003000.00369
G12w CURRENT total0.870701.070960.557400.685600.91039
Forecast
G12w NEXT active0.849001.044271.4940810.467000.574410.6856014 h peak zone, 10 h off-peak zone
G12w NEXT quality0.032100.039480.032100.03948
G12w NEXT network0.327100.402330.051800.06371
G12w NEXT RES0.003500.004310.003500.00431
G12w NEXT cogeneration0.003000.003690.003000.00369
G12w NEXT total1.214701.494080.557400.685601.15721
Source: Own study based on Refs. [56,57].
Table 6. Calculation of heating costs for tariffs applicable in the 2022/2023 season.
TariffG12w CURRENT LWT30G12 CURRENT LWT30G11 CURRENT LWT30GAS CURRENT
Price [PLN]3191336837216856
TariffG12w CURRENT LWT40G12 CURRENT LWT40G11 CURRENT LWT40GAS CURRENT
Price [PLN]3864407745046856
TariffG12w CURRENT LWTZMG12 CURRENT LWTZMG11 CURRENT LWTZMGAS CURRENT
Price [PLN]3925414245766856
Table 7. Heating costs for future tariffs calculated for the 2022/2023 season.
TariffG12w NEXT LWT30G12 NEXT LWT30G11 NEXT LWT30GAS NEXT
Price [PLN]3841394543138227
TariffG12w NEXT LWT40G12 NEXT LWT40G11 NEXT LWT40GAS NEXT
Price [PLN]4650477652218227
TariffG12w NEXT LWTZMG12 NEXT LWTZMG11 NEXT LWTZMGAS NEXT
Price [PLN]4724485253048227
Table 8. Calculation of heating costs for tariffs applicable in the 2023/2024 season.
TariffG12w CURRENT LWT30G12 CURRENT LWT30G11 CURRENT LWT30GAS CURRENT
Price [PLN]2741288431866055
TariffG12w CURRENT LWT40G12 CURRENT LWT40G11 CURRENT LWT40GAS CURRENT
Price [PLN]3336351038776055
TariffG12w CURRENT LWTZMG12 CURRENT LWTZMG11 CURRENT LWTZMGAS CURRENT
Price [PLN]3372354639176055
Table 9. Heating costs for future tariffs calculated for the 2023/2024 season.
TariffG12w NEXT LWT30G12 NEXT LWT30G11 NEXT LWT30GAS NEXT
Price [PLN]330733,77536937267
TariffG12w NEXT LWT40G12 NEXT LWT40G11 NEXT LWT40GAS NEXT
Price [PLN]4024411044947267
TariffG12w NEXT LWTZMG12 NEXT LWTZMG11 NEXT LWTZMGAS NEXT
Price [PLN]4069415245407267
Table 10. Comparison of heating costs between the 2022/2023 and 2023/2024 heating seasons for current tariffs.
Cost difference between seasons for different tariffsG12w CURRENT
LWT30
G12 CURRENT
LWT30
G11 CURRENT
LWT30
GAS
CURRENT
amount difference450 PLN484 PLN535 PLN800 PLN
percentage difference14.11%14.38%14.38%11.67%
Cost difference between seasons for different tariffsG12w CURRENT
LWT40
G12 CURRENT
LWT40
G11 CURRENT
LWT40
amount difference528 PLN568 PLN627 PLN
percentage difference13.65%13.92%13.92%
Cost difference between seasons for different tariffsG12w CURRENT
LWTZM
G12 CURRENT
LWTZM
G11 CURRENT
LWTZM
amount difference553 PLN596 PLN659 PLN
percentage difference14.09%14.40%14.40%
Table 11. Comparison of heating costs between the 2022/2023 and 2023/2024 heating seasons for future tariffs.
Cost difference between seasons for different tariffsG12w NEXT
LWT30
G12 NEXT
LWT30
G11 NEXT
LWT30
GAS
NEXT
amount difference534 PLN568 PLN620 PLN960 PLN
percentage difference13.91%14.40%14.38%11.67%
Cost difference between seasons for different tariffsG12w NEXT
LWT40
G12 NEXT
LWT40
G11 NEXT
LWT40
amount difference626 PLN666 PLN727 PLN
percentage difference13.46%13.94%13.92%
Cost difference between seasons for different tariffsG12w NEXT
LWTZM
G12 NEXT
LWTZM
G11 NEXT
LWTZM
amount difference655 PLN699 PLN764 PLN
percentage difference13.86%14.42%14.40%
Disclaimer/Publisher’s Note: The statements, opinions and data contained in all publications are solely those of the individual author(s) and contributor(s) and not of MDPI and/or the editor(s). MDPI and/or the editor(s) disclaim responsibility for any injury to people or property resulting from any ideas, methods, instructions or products referred to in the content.