Article

Forecasting Installation Demand Using Machine Learning: Evidence from a Large PV Installer in Poland

Faculty of Management, AGH University of Krakow, al. A. Mickiewicza 30, 30-059 Krakow, Poland
*
Author to whom correspondence should be addressed.
Energies 2025, 18(18), 4998; https://doi.org/10.3390/en18184998
Submission received: 19 August 2025 / Revised: 12 September 2025 / Accepted: 15 September 2025 / Published: 19 September 2025

Abstract

The dynamic growth of the photovoltaic (PV) market in Poland, driven by declining technology costs, government support programs, and the decentralization of energy generation, has created a strong demand for accurate short-term forecasts to support sales planning, logistics, and resource management. This study investigates the application of long short-term memory (LSTM) recurrent neural networks to forecast two key market indicators: the monthly number of completed PV installations and their average unit capacity. The analysis is based on proprietary two-year data from one of the largest PV companies in Poland, covering both sales and completed installations. The dataset was preprocessed through cleaning, filtering, and aggregation into a consistent monthly time series. Results demonstrate that the LSTM model effectively captured seasonality and temporal dependencies in the PV market, outperforming multilayer perceptron (MLP) models in forecasting installation counts and providing robust predictions for average capacity. These findings confirm the potential of LSTM-based forecasting as a valuable decision-support tool for enterprises and policymakers, enabling improved market strategy, optimized resource allocation, and more effective design of support mechanisms in the renewable energy sector. The originality of this study lies in the use of a unique, proprietary dataset of over 12,000 completed PV micro-installations, rarely available in the literature, and in its direct focus on market demand forecasting rather than energy production. This perspective highlights the practical value of the model for companies in sales planning, logistics, and resource allocation.

1. Introduction

The dynamic development of the photovoltaic (PV) market in Poland, Europe, and worldwide, as part of the broader trend of global energy transition, poses significant challenges in forecasting demand and planning the expansion of energy infrastructure. Accurate prediction of the number of new PV installations and their average capacity has become crucial not only for companies operating in the renewable energy sources (RES) sector but also for distribution system operators, public institutions, and policymakers responsible for energy strategies. In response to these emerging challenges, analytical tools based on artificial intelligence (AI), particularly machine learning (ML) methods, are gaining increasing importance, enabling the modeling of complex market phenomena and the analysis of large datasets. In the scientific literature, the application of ML in the energy sector is increasingly discussed—ranging from forecasting energy production based on meteorological data, through demand analysis and investment potential assessment, to grid management and fault detection [1,2,3]. Particular attention has been drawn to sequential models, such as long short-term memory (LSTM) neural networks, due to their ability to capture temporal dynamics and long-term trends that are characteristic of energy and market data.
The primary objective of this study is to forecast the number of new photovoltaic installations and the average capacity of a single PV installation using an LSTM model trained exclusively on empirical data from one of the largest PV installers in Poland. This methodology allows for capturing the actual variability of the market and accurately reflecting its dynamics.
The results of the analysis indicate that the application of LSTM models enables effective representation of demand fluctuations in the PV sector, providing businesses and decision-makers with a tool to support sales management, distribution network development, and strategic planning. This approach also opens new perspectives for using predictive modeling in the context of energy planning, logistics, and low-emission transition—as a tool supporting the energy transformation process. Compared with existing research, which predominantly focuses on electricity generation forecasting, this study emphasizes the forecasting of market demand—namely, the number of completed PV installations and their average unit capacity. This distinction represents an important novelty, as it directly addresses the decision-making needs of enterprises and market operators rather than purely technical aspects of generation.

1.1. The Photovoltaic Market in Poland and Europe

Over the past two decades, the photovoltaic (PV) market has undergone a profound transformation, both in terms of the geographical structure of production and the pace of technological advancement. At the beginning of the 21st century, China and Taiwan assumed a dominant position in PV cell production, and since 2008, their output has exceeded that of all other regions worldwide. This trend has persisted to the present day. In Poland, by 2023, nearly all newly installed PV systems were based on monocrystalline modules. The share of polycrystalline modules declined virtually to zero, most likely due to the utilization of existing warehouse inventories [4]. The European PV industry—with the exception of support structure manufacturing—remained active until mid-2023; however, in the first half of 2024, it had almost entirely ceased operations. The current market situation clearly highlights both the decisive role of large-scale subsidization of the Chinese PV industry and the serious issue of oversupply: in 2024, global production capacity exceeded 1 TW, while worldwide demand was more than two times lower.
In the face of such significant oversupply and mounting price pressure, the importance of precise production planning, logistics, and supply chain management is steadily increasing. In this context, analytical tools based on machine learning (ML) and artificial intelligence (AI) are playing an increasingly critical role, enabling demand forecasting, operational process optimization, and adaptation to changing market conditions. The application of these technologies supports PV component manufacturers and distributors in making more informed decisions regarding resource allocation, production and delivery scheduling, as well as mitigating the risks associated with inefficient oversupply management.
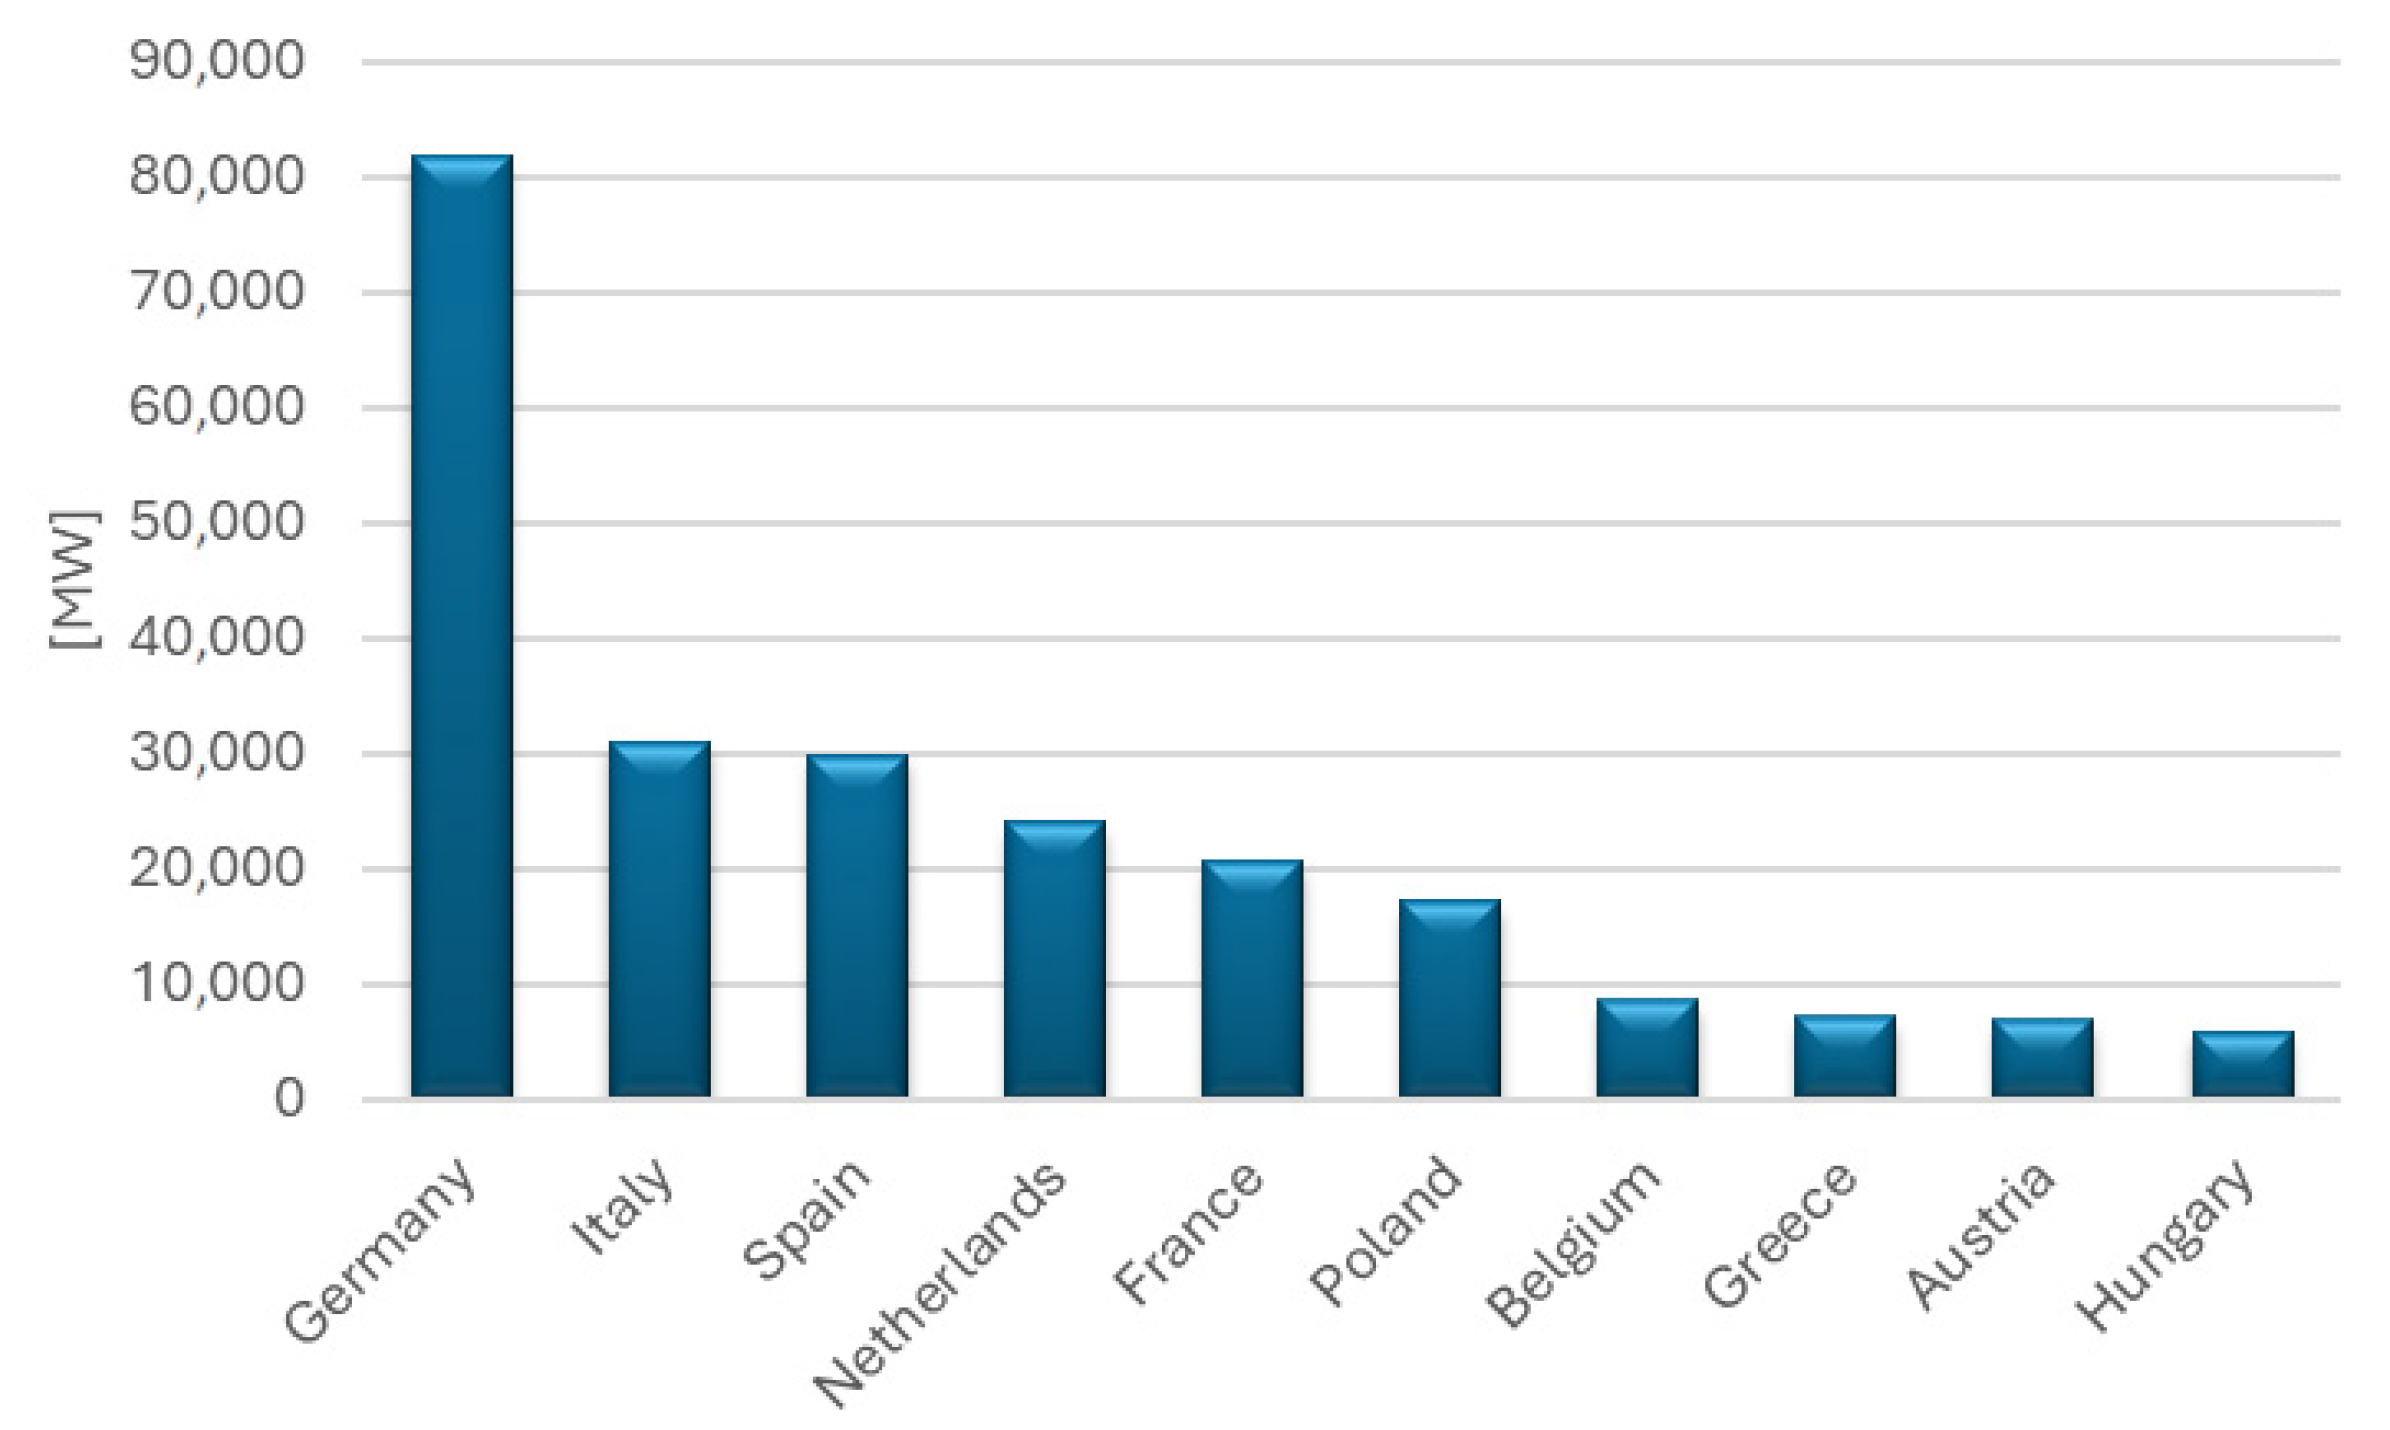
At the end of 2023, the total installed capacity of photovoltaic (PV) systems in the European Union reached 257 GW, representing an increase of 51 GW compared to the previous year. The growth rate remained at 25%, similar to that observed in 2021–2022. However, the pace of PV market development in the EU was lower than in Poland, where the increase amounted to 38%. Germany holds the largest installed capacity (81.7 GW), followed by Spain (31 GW) and Italy (29.8 GW) (Figure 1). A reversal in ranking between Spain and Italy compared to 2022 resulted primarily from revised data on Spain published in the IRENA report. As in the previous year, Poland remains the only Central and Eastern European country to rank among the top six EU member states in terms of total installed PV capacity [5].
In terms of annual capacity additions in 2023, Poland ranked fourth in the European Union, behind Germany, Spain, and Italy. Germany once again recorded the highest increase—over 14.2 GW—which was nearly double the value achieved in 2022 (4.8 GW) [5]. The annual growth dynamics of the Polish PV market have remained at a double-digit level for the past eight years. This has enabled Poland to remain among the leading European countries in terms of newly installed capacity, and forecasts indicate the continuation of this trend in the coming years. In 2008, the total installed PV capacity in Poland amounted to only 800 kW, of which 600 kW was off-grid installations. By 2010, this figure had risen to 1.1 MW (including 0.8 MW off-grid), and in 2012 it reached 3.6 MW, with 2.2 MW accounted for by off-grid systems. According to data from the Energy Regulatory Office (URE) as of March 2015, there were 119 photovoltaic installations operating in Poland with a combined capacity of 21 MWp.
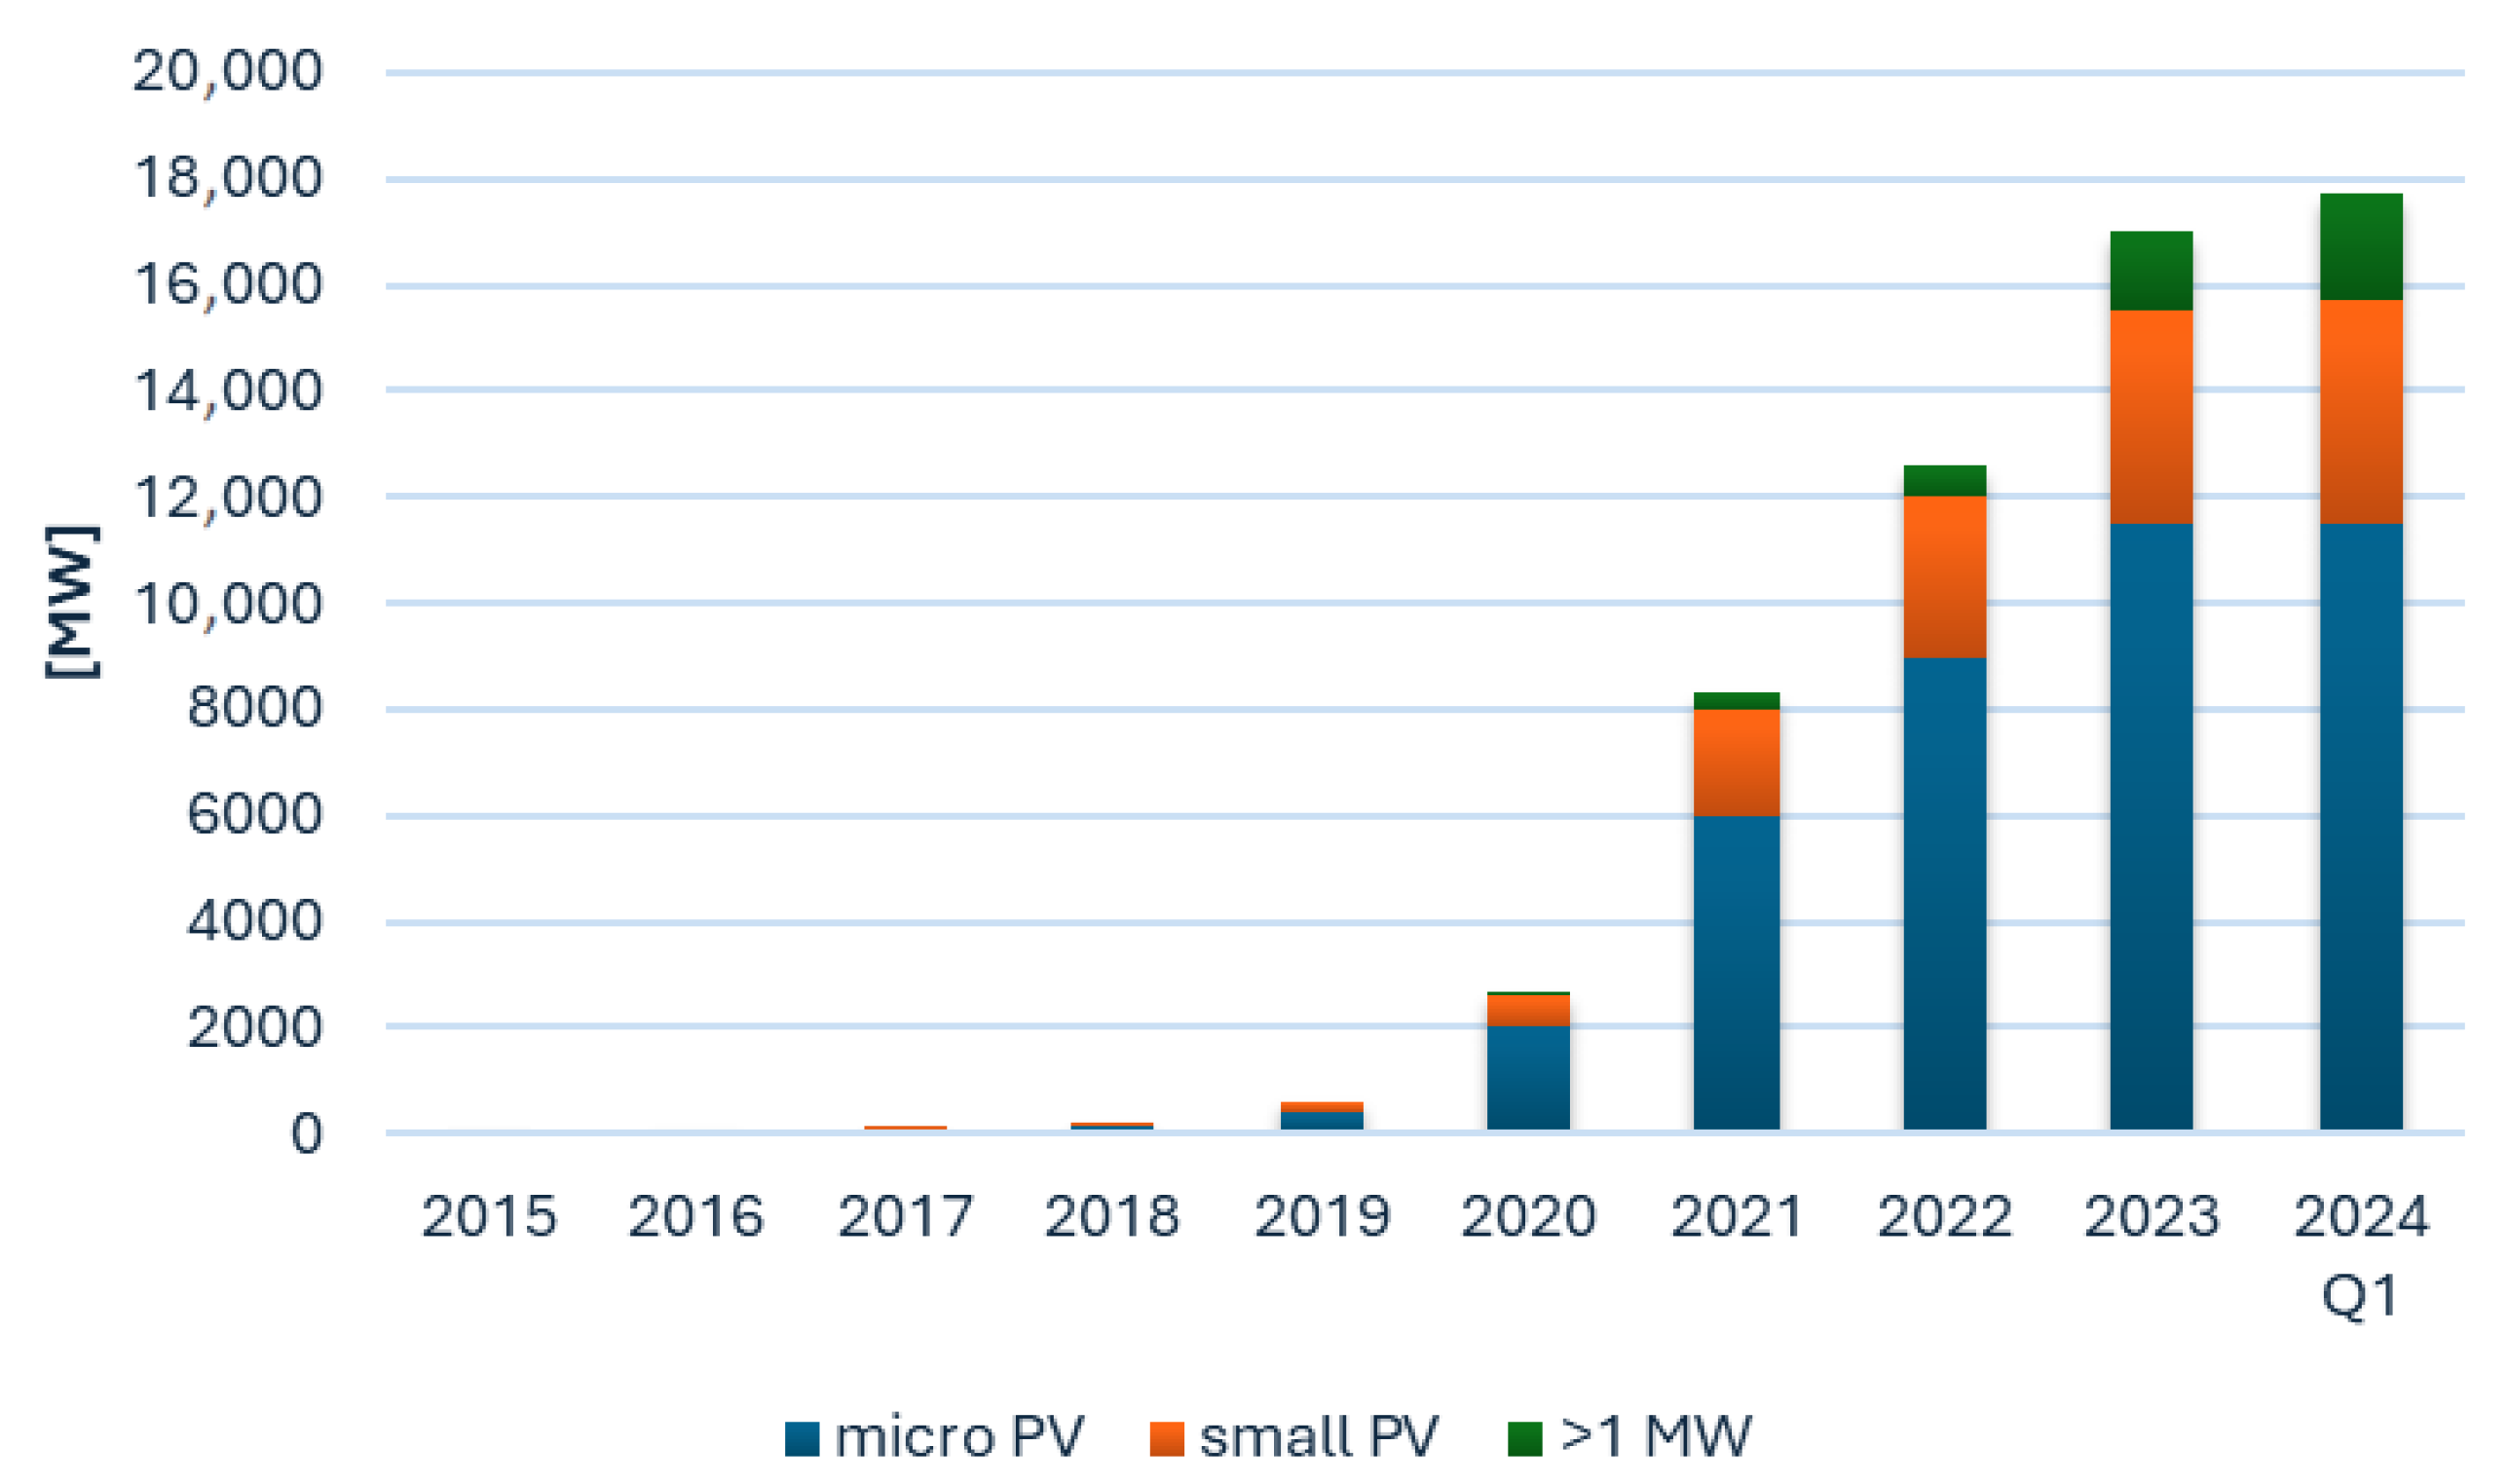
Currently, the photovoltaic market in Poland is developing at an exceptionally rapid pace, reaching successive records of installed capacity. By the end of 2023, the total installed PV capacity amounted to approximately 17.08 GW, increasing to 17.73 GW by the end of the first quarter of 2024. For comparison, in 2020, this value was only 2.9 GW [6] (Figure 2). Such a rapid expansion in the scale of investments and the number of new PV installations brings growing challenges in demand forecasting, resource management, and infrastructure planning. In this context, the application of machine learning- and artificial intelligence-based tools becomes crucial to ensuring operational efficiency and market stability.
An important factor influencing the development of renewable energy in Poland, particularly in the field of photovoltaics, is the phenomenon of so-called prosumer energy. The term “prosumer” was introduced in the 1980s by futurist Alvin Toffler as a combination of the words producer and consumer. In the field of information technology, the term describes software users who not only consume free software but also actively co-create it by adding their own code fragments or developing new programs. Other interpretations of the concept link it with the terms professional and consumer, referring to advanced users of electronic equipment, or pro-active and consumer, defining individuals who consciously select high-quality products, actively compare offers, and optimize their purchases.
In the context of energy, prosumers play a crucial role in the development of the photovoltaic market in Poland. They are simultaneously producers and consumers of electricity generated from renewable sources. By installing PV micro-installations on the rooftops of their homes, they contribute to the increase in the total installed photovoltaic capacity in the country. Their active involvement enables the decentralization of energy production, which helps to reduce the load on the power grid and strengthens local supply sources. Prosumers often benefit from support programs such as subsidies or net metering schemes, which further encourage investments in renewable energy. As a result, their activity accelerates Poland’s energy transition, increasing the share of renewable energy in the national energy mix and supporting sustainable development.
Currently, prosumer micro-installations dominate the market structure, accounting for approximately 66% of new installed capacity in 2023. In the same year, capacity additions amounted to 2022 MW, which, compared to 3217 MW in 2022, represents a clear decline in the growth rate from 69% to 43%. The reasons for this phenomenon can be attributed to the limited forms of support available to customers [4].
In the face of a growing number of prosumers and evolving regulatory conditions, forecasting market behavior and the demand for PV micro-installations has become a significant analytical challenge. Machine learning and artificial intelligence tools are playing an increasingly important role in this area, as they enable the analysis of large datasets, the identification of trends, and the modeling of the impact of various support scenarios on the development of the prosumer market. This, in turn, allows for improved public policy planning, the adjustment of market offerings, and the optimization of energy management at both the local and national levels.
It is also worth noting that Poland ranks fourth in the world in terms of installed PV capacity per capita. On a per capita basis, Poland possesses nearly twice the PV capacity of China. These figures confirm that countries previously lagging in the energy transition are now investing intensively in solar power. However, such dynamic development of the PV sector in Poland is associated with challenges, such as grid connection refusals and administrative barriers, which may hinder further market growth [6].
In summary, at the end of 2023, prosumer micro-installations accounted for 66.3% of total PV capacity, representing a slight decline compared to a 75% share in 2022. Among these installations were not only household systems but also installations owned by enterprises, mounted on service facilities, commercial buildings, and religious structures, operated by so-called autoproducers.
The installed capacity structure of PV systems in Poland at the end of 2023 consisted of the following (Figure 3):
  • Micro-installations (up to 50 kW), constituting the prosumer segment, with a total capacity of over 11.3 GW;
  • Small installations with capacities between 50 kW and 1 MW, totaling 4.1 GW;
  • Photovoltaic farms with capacities exceeding 1 MW, with a total capacity of 1.6 GW.
The total installed capacity of photovoltaic systems at the end of 2023 amounted to 17,057 MW.
In light of the presented information on the dynamic development of the photovoltaic market in Poland, Europe, and worldwide, the use of modern analytical tools in managing this sector becomes particularly important. Such tools can support not only demand forecasting but also production planning, logistics, and infrastructure development. The integration of machine learning and artificial intelligence into management processes is becoming essential for the efficient growth of the photovoltaic sector and for mitigating investment risk.

1.2. The Importance of Data Analytics and Artificial Intelligence in the Renewable Energy Sector

In the digital era, where data constitutes the foundation of most economic sectors, the energy industry—particularly the renewable energy segment—is increasingly dependent on advanced analytical tools and artificial intelligence technologies. The growing number of photovoltaic installations, the rise of prosumer energy models, and the proliferation of distributed energy generation have resulted in the generation of vast volumes of data, both in real time and as historical records. These data originate from diverse sources, including PV modules, inverters, monitoring systems, weather forecasts, Internet of Things (IoT) devices, grid management systems, and satellite and geospatial platforms.
A key application of AI in photovoltaics is energy production forecasting, which also encompasses the use of artificial neural networks to estimate the number of installed PV systems and the average capacity of individual installations. Advanced machine learning models enable the generation of highly accurate forecasts of electricity generation based on meteorological parameters, seasonal variations, panel tilt angles, and shading effects. Such models facilitate improved balancing of energy systems, particularly in the context of microgrids, PV farms, and smart grids. Under conditions of high solar irradiance variability, AI algorithms are capable not only of predicting production fluctuations but also of responding to them in real time via dynamic load management, energy source switching, or energy storage control.
Consequently, data analytics serves not only as a tool supporting operational management of installations but also as a foundation for strategic planning, optimization, and automation of entire energy systems. Artificial intelligence acts as a catalyst in the energy transition process by enabling rapid and precise analysis of large datasets (Big Data), forecasting complex phenomena, and supporting decision-making under uncertainty.
An important application of AI is the condition monitoring of photovoltaic installations. Through analysis of data collected from sensors and SCADA systems, AI can detect operational irregularities, diagnose faults, and localize performance degradation caused by soiling, module aging, mechanical damage, or inverter malfunction. When combined with imaging technologies—such as thermal imaging from drones or industrial cameras—AI can automatically identify defective cells, hot spots, and other anomalies that are otherwise time-consuming and costly to detect using traditional methods.
AI is also extensively employed in energy storage management, a critical component of renewable energy systems. Decision-making algorithms analyze forecasts of production and demand, market prices, and grid conditions to determine optimal battery charge and discharge times, as well as the proportion of energy to inject into the grid versus retain for self-consumption. Such intelligent optimization enhances the economic viability of installations and improves overall system stability.
Another significant application concerns the planning and optimization of PV investments. AI leverages spatial data (GIS), land use information, slope, insolation, historical weather data, and local infrastructure constraints to identify optimal locations for new PV installations. It also models investment profitability by considering dynamic tariffs, energy prices, component costs, and evolving technology trends. These capabilities underpin solar potential mapping tools increasingly utilized by municipalities and energy developers.
Moreover, AI supports automatic management of energy networks with high shares of renewable sources by addressing generation variability and grid instability. Algorithms predict local overloads, analyze energy flows in real time, control power dispersion, and autonomously manage energy distribution and balancing within the grid.
AI applications extend beyond technical domains to include social sentiment analysis and regulatory risk assessment, for instance, through social media monitoring, public consultation analysis, and legislative trend evaluation. This enables modeling of social acceptance levels for renewable energy projects, a critical factor in regional and national infrastructure development.
Despite its immense potential, AI implementation in the renewable energy sector faces challenges. Data quality remains a primary limitation, as imprecise, incomplete, or inconsistent data can lead to inaccurate conclusions and suboptimal decisions. Additionally, successful AI deployment requires adequate infrastructure—including computational resources, data storage capabilities, and skilled analytical and technical personnel. Ethical and legal considerations also arise, notably regarding algorithmic transparency, auditability, data privacy, and accountability for decisions made by autonomous systems.
Nevertheless, AI continues to be a pivotal driver of renewable energy development. When combined with cloud computing, IoT, blockchain technology, and 5G networks, AI forms the backbone of the modern digital energy paradigm, wherein intelligent data analysis is as critical as the physical energy infrastructure itself [7]. Within photovoltaics, this translates into better-designed, more reliable, efficient, and economically viable systems capable of not only producing energy but also dynamically responding to the requirements of users, grids, and markets.
In this context, AI facilitates the creation of flexible, self-learning predictive models that integrate historical, meteorological, behavioral, and economic data to forecast future energy consumption at system, regional, household, or individual site levels. Machine learning enables the development of increasingly complex and accurate models capable of accommodating typical and unforeseen demand fluctuations. Demand forecasting in photovoltaics is intrinsically linked to production forecasting—estimating daily energy output based on weather forecasts, seasonality, or geographic factors—thus enabling integrated energy balancing. These approaches also encompass forecasting of PV installation sales in specific regions, serving as decision-support tools for sales departments. Neural network architectures such as LSTM, ensemble methods like XGBoost, and hybrid models combining multiple techniques generate highly accurate short- and long-term forecasts, thereby supporting improved energy system management, optimized operation of energy storage, electric vehicle chargers, and flexible demand-side management and sales strategies.
As a result, AI has become an indispensable instrument for stakeholders across the energy value chain—from prosumer micro-installations, through commercial enterprises, to transmission system operators and policymakers responsible for energy governance.
The development of renewable energy sources, including photovoltaics, represents a fundamental pillar in the transition towards a sustainable and low-carbon energy system. The increasing deployment of PV installations and their growing share in the energy mix drive the demand for advanced methods of management, forecasting, and operational optimization. Within this context, artificial intelligence techniques, particularly machine learning, have gained significant attention due to their capability to efficiently process and analyze large volumes of data generated by PV systems.
Machine learning, as a subfield of AI, enables the construction of models that learn autonomously from input data without explicit programming of decision rules. In recent years, ML methods have been widely applied across various facets of PV system operation, including short-term energy yield forecasting, fault detection and anomaly diagnosis, maximum power point tracking (MPPT), and energy storage management.
The integration of ML in photovoltaics not only enhances the energy efficiency and reliability of PV systems but also facilitates improved grid integration and operational optimization under variable weather conditions and dynamic load profiles. Advances in ML algorithms—such as artificial neural networks (ANNs), convolutional neural networks (CNNs), long short-term memory (LSTM) networks, ensemble methods (e.g., XGBoost, random forest), reinforcement learning (RL), and automated machine learning (AutoML)—offer novel opportunities for automation and intelligent energy management.
Among the most extensively researched and implemented ML applications in PV is the forecasting of electricity generation. Accurate power forecasting is critical for efficient grid management, supply–demand balancing, and optimization of energy storage systems. Especially in decentralized renewable energy systems, short-term forecasts (ranging from minutes to several hours) reduce energy losses and enhance supply stability.
To elucidate the potential and diversity of AI and ML applications in the PV sector, a comprehensive review of recent studies is indispensable. Current research highlights the predominance of deep learning algorithms, notably LSTM, recurrent neural networks, and CNNs, alongside ensemble learning techniques such as XGBoost and random forest. For instance, in [8], the deep extreme learning machine (DELM) model coupled with the novel ECBO-VMD (enhanced chaotic bat optimization–variational mode decomposition) signal decomposition method demonstrated accurate PV production forecasts within a 15 min to 4 h horizon, characterized by significantly reduced training times compared to traditional deep learning models.
AutoML-based frameworks for automatic model and feature selection, as presented in [9], further advance forecasting capabilities. The authors developed a multi-model predictive system combining ElasticNet regression, gradient boosting, and random forest algorithms, with input variable optimization via a genetic algorithm. This approach was successfully validated across diverse Japanese regions, exhibiting robustness even with limited historical data.
In [10], the fusion of LSTM networks with wavelet packet decomposition enabled the capture of both local and global temporal features in PV generation data. Another promising strategy described in [11] employed transfer learning, facilitating knowledge transfer from solar irradiance time series datasets to PV power generation, which is particularly advantageous in data-scarce new locations.
Probabilistic forecasting methods have garnered growing interest due to their capacity to provide not only point estimates but also uncertainty quantification. The quantile CNN model proposed in [12] offers interval forecasts alongside reliability metrics such as prediction interval normalized average width (PINAW) and prediction interval coverage probability (PICP), supporting improved risk management in renewable energy systems. Other studies [13,14] implemented Gaussian process regression (GPR) and LSTM models with bootstrap-derived confidence intervals to similar effect.
Furthermore, ML solutions optimized for deployment in resource-constrained environments are critical for practical adoption. The edge computing system described in [15], operating on a Raspberry Pi platform, integrates LightGBM with temporal pattern optimization and weather data clustering via tree-structured self-organizing maps (TS-SOM), achieving a favorable balance of accuracy and computational efficiency.
Beyond forecasting, ML techniques are extensively applied in fault detection, anomaly diagnostics, MPPT tracking, and PV system design and management optimization. The inherent variability of environmental conditions, process nonlinearity, and evolving data distributions constitute challenges well-suited for ML approaches, underscoring their relevance in advancing PV technology and grid integration.
One of the key practical applications of machine learning in photovoltaic systems is fault and anomaly detection. Due to the large number of measurement sensors and the availability of thermographic (IR) and electroluminescence (EL) imaging, PV systems generate data that can be analyzed for early detection of defects such as shading, hot spots, cracks, soiling, and module degradation. The authors of the review [16] presented a model based on support vector machines (SVMs) utilizing 41 features extracted from IR images to classify modules as healthy, affected by harmless hot spots, or actually faulty. In study [17], a long short-term memory model supported by discrete wavelet transform (DWT) was employed for detecting various types of faults in PV systems, achieving superior results compared to classical algorithms such as SVM or decision trees. An interesting approach was applied in [18], where one-dimensional measurement data were transformed into two-dimensional scalogram images and subsequently analyzed using a pretrained AlexNet network. The use of transfer learning enabled the model to achieve high accuracy in classifying multiple fault types, including arc faults, partial shading, and open/short circuits.
It is important to note that many PV installations—particularly industrial ones—have limited labeled fault cases. Therefore, researchers increasingly adopt unsupervised learning and clustering techniques. For instance, in [19], an anomaly detector based on an auto-Gaussian mixture model (Auto-GMM) was proposed to identify deviations from normal operation in measurement data, followed by classification of fault types using an XGBoost classifier based on frequency-domain features (Fourier spectrum). The authors emphasize the importance of the local anomaly index (LAI) for precise fault identification.
Another significant ML application in photovoltaics is maximum power point tracking. Under conditions such as partial shading, variable temperature, or module soiling, the voltage-current characteristic of a PV system may exhibit multiple local maxima, only one of which is the global maximum power point (GMPP). Traditional tracking algorithms, such as perturb and observe or incremental conductance, may fail under these circumstances, creating opportunities for intelligent adaptive algorithms. A comprehensive review [20] presents a wide range of ML-based approaches, including artificial neural networks (ANN), fuzzy logic control (FLC), swarm intelligence (PSO) algorithms, genetic algorithms (GAs), and increasingly, reinforcement learning (RL). RL methods enable dynamic adaptation to variable PV system operating conditions by learning control strategies based on feedback (rewards) without requiring explicit physical modeling of the system. These approaches have demonstrated particular effectiveness in unstable and unpredictable environments and can be implemented in embedded systems with limited computational resources.
In recent work [21], a hybrid machine learning and bootstrap approach has been applied to probabilistic demand forecasting in the Southeast region of the Mexican power system in 2024. This method provides not only accurate point forecasts but also well-calibrated prediction intervals, explicitly addressing the uncertainty inherent in energy demand data. Such probabilistic forecasting has been shown to deliver more reliable information for system operators and decision-makers, especially under conditions of variability and market risk, compared with deterministic approaches.
In this latest study [22], the authors developed an optimized LSTM model for forecasting short-term electricity consumption under dynamic pricing and demand response schemes in smart grids. The proposed approach emphasizes integrating forecasting accuracy with practical application in flexible tariff systems, where precise demand forecasting is essential for pricing and load-shifting strategies. The results demonstrate that the optimized LSTM model significantly reduces forecasting errors compared to conventional statistical techniques and alternative neural network models, thereby increasing the efficiency of load management and system balancing. Furthermore, the study highlights the potential of such forecasting methods in supporting energy suppliers and system operators in their decision-making processes under dynamically changing market conditions.
The aforementioned examples illustrate the broad and diverse applications of ML in PV systems. Machine learning not only facilitates more accurate energy production forecasting but also automates fault diagnosis, enhances system efficiency through adaptive MPPT, and supports decision-making under uncertainty. The ongoing development of these technologies clearly indicates the growing role of ML as an integral component of future intelligent renewable energy systems. Thus, ML holds significant potential to become one of the pillars of modern intelligent energy systems based on photovoltaics. However, fully realizing this potential requires further advancement of methodologies, access to high-quality data, and close collaboration between academia, industry, and the public sector. Such an integrated approach also contributes to optimizing the operational costs of PV solutions. To provide a clearer overview of the use of AI methods in photovoltaic systems, a comparative table was prepared that summarizes the most important issues and contributions of selected studies analyzed (Table 1).
Based on the comparative table, and as will be described in detail in the following sections, the modeling approach presented in this study distinguishes itself from previous studies primarily in terms of data coverage and application area. Most previous work focused on forecasting photovoltaic energy production using meteorological and generation data. In contrast, our study focuses on the installation market, forecasting the number of completed micro-installations and their average unit power. The analysis is based on a unique, confidential dataset from one of the largest photovoltaic installers in Poland, covering over 12,000 micro-installations implemented over 24 months. This approach enables direct support for sales planning, logistics, and resource management within the company, rather than simply estimating energy production. The contribution of this study is therefore (i) the application of ML models in a new context—forecasting market demand rather than energy production; (ii) the use of a unique business dataset; and (iii) providing empirical evidence for the superiority of sequential modeling (LSTM) over conventional modeling (MLP) in this scenario.
Given the increasing importance of PV as an energy source for households, enterprises, and entire regions, economic and operational analyses are gaining particular significance in determining the viability of PV installation deployment and operation. Evaluations encompassing both investment and operational perspectives form the basis for rational decision-making in the renewable energy sector. Automation of processes, improved energy production forecasts, and early fault detection contribute to reducing operational losses, lowering maintenance costs, and enhancing energy consumption and sales planning. Consequently, ML-based technologies provide tangible support in achieving economic and managerial benefits.
It should be noted that explainability (XAI) techniques, which have become an important trend in recent forecasting studies, were not applied in the present work. The main objective of this study was to evaluate and compare forecasting performance between LSTM and MLP models using real-world company-level data. Nevertheless, incorporating explainability into future analyses is considered a promising extension of this research.
1.3. Economic and Operational Aspects of PV Installations

The economic and operational efficiency of photovoltaic installations is a key criterion determining the justification for their implementation, both in the case of prosumer micro-installations and large industrial farms. Besides initial costs and technical parameters of the system, digital tools supporting the optimization of installation operation—particularly machine learning technologies—are gaining increasing importance. Their application enables not only increased productivity of PV systems but also a reduction in operational costs and improvement of the overall investment profitability.
One of the key areas of artificial intelligence use in the PV sector is energy production forecasting, which, in the context of this study, also includes the use of artificial neural networks to predict the number of installed PV systems and the average power of individual installations. Such an approach supports better infrastructure development planning, allows for more effective adaptation of market and operational strategies, and thus contributes to increasing the economic efficiency of the entire sector.
There is growing interest in the literature in applying machine learning methods to investment analyses in the renewable energy sector, especially concerning photovoltaic installations. The authors of [1,2] present different but complementary approaches to using ML in assessing profitability and risks related to investments in PV.
The authors of [2] present a case study from Greece where ML algorithms (categorical regression, decision trees, support vector machines) were used to identify factors influencing farmers’ willingness to invest in PV farms. Based on survey data, it was established that the type of crop (e.g., cotton) can be a significant predictor of investment decisions. ML proved to be an effective tool for modeling complex decision-making dependencies, considering both economic aspects (income, farm size) and social factors (education, environmental attitudes). It was indicated that using ML can support policymakers in designing strategies that promote the sustainable development of rural areas, especially in the context of conflicts between agricultural and energy production.
In contrast, another study [3] proposed a hybrid methodology combining statistical analysis and ML to classify investment risk for renewable energy technologies, including PV, at an international level. Using macroeconomic variables (gross domestic product fluctuations, inflation, energy demand and prices, and CO2 emissions), countries were assessed for investment attractiveness. The application of ML allowed for accurate identification of areas with low and high investment risks, as well as consideration of uncertainty and variability in historical data (including analysis of standard deviations). Results emphasized the importance of variability in PV energy production and energy price fluctuations, which directly affect project profitability.
Both studies highlight the growing role of ML as a tool supporting investment decisions in renewable energy. Machine learning methods enable the identification of nonlinear relationships, the prediction of investor behavior, and the assessment of economic and technological risks. In the context of PV installations, these methods can improve the accuracy of operational and economic analyses, support resource allocation, and optimize support policies.
From an economic perspective, ML thus acts as a technology supporting both revenue enhancement from energy and optimization of lifecycle costs of installations. This allows for achieving more favorable financial indicators and more flexible responses to changing market and technological conditions. Given the increasing volatility of energy prices, pressure for energy independence, and the need to enhance system resilience to disruptions, machine learning becomes a key tool that raises the economic and operational value of photovoltaic investments.

2. Materials and Methods

The aim of this study is to forecast the number of completed or sold photovoltaic PV installations, as well as the average installed capacity of a single PV system. The objective is to evaluate the effectiveness of machine learning models—particularly long short-term memory neural networks—in predicting market behavior based on real-world data obtained from one of the largest PV installation companies in Poland.
The preceding sections of this work, which cover the technological background, characteristics of the PV market, and the role of artificial intelligence in the renewable energy sector, provide the theoretical foundation that justifies the chosen methodology. In particular, it is emphasized that the rapid development of prosumer energy systems and the growing demand for analytical and predictive tools create a tangible need for the implementation of AI-based solutions.
In this context, the use of data-driven predictive models such as LSTM networks not only enables the forecasting of market trends but also supports business decision-making, operational planning, and strategic resource management in the renewable energy industry.

2.1. Dataset Description

Real-world data used in this study were obtained from a leading company in Poland that has been operating in the renewable energy sector since 2013. The data provider is listed on the NewConnect market, which operates within the Warsaw Stock Exchange. Due to confidentiality and limited access, the data on which our research is based are rarely made available to researchers. Their use represents a significant strength of this study.
The dataset covers the period from 2023 to 2024 and includes nearly 40,000 records describing the company’s product sales, including photovoltaic installations, energy storage systems, EV chargers, charging stations, electricity sales, and ancillary products such as air conditioning systems and thermal modernization services. From this dataset, entries describing events relevant to the purpose of the study were extracted by narrowing the scope to PV installations, either with or without energy storage systems.
The temporal coverage of the dataset is limited to the years 2023–2024. This restriction results from the introduction of a new CRM system in the company that provided the data, which made consistent data available only for this period.
The reduced dataset, consisting of over 20,000 records, was further refined by removing approximately 7000 entries related to cases where potential customers withdrew from signed contracts or were unable to obtain government funding (dedicated programs) for the installation of PV systems. As a result, during the preprocessing stage, we obtained a dataset of 13,300 records describing actual, completed photovoltaic installations in Poland.
The final dataset, which includes, among other attributes, a unique installation identifier, installation date, installed PV panel capacity, and installation location, underwent preprocessing. During this stage, the data were cleaned: records with missing values (e.g., postal codes) and outliers were removed. In addition, the dataset was limited to micro-installations, which are the focus of this study. According to Polish regulations, micro-installations are defined as systems with a capacity not exceeding 50 kW.
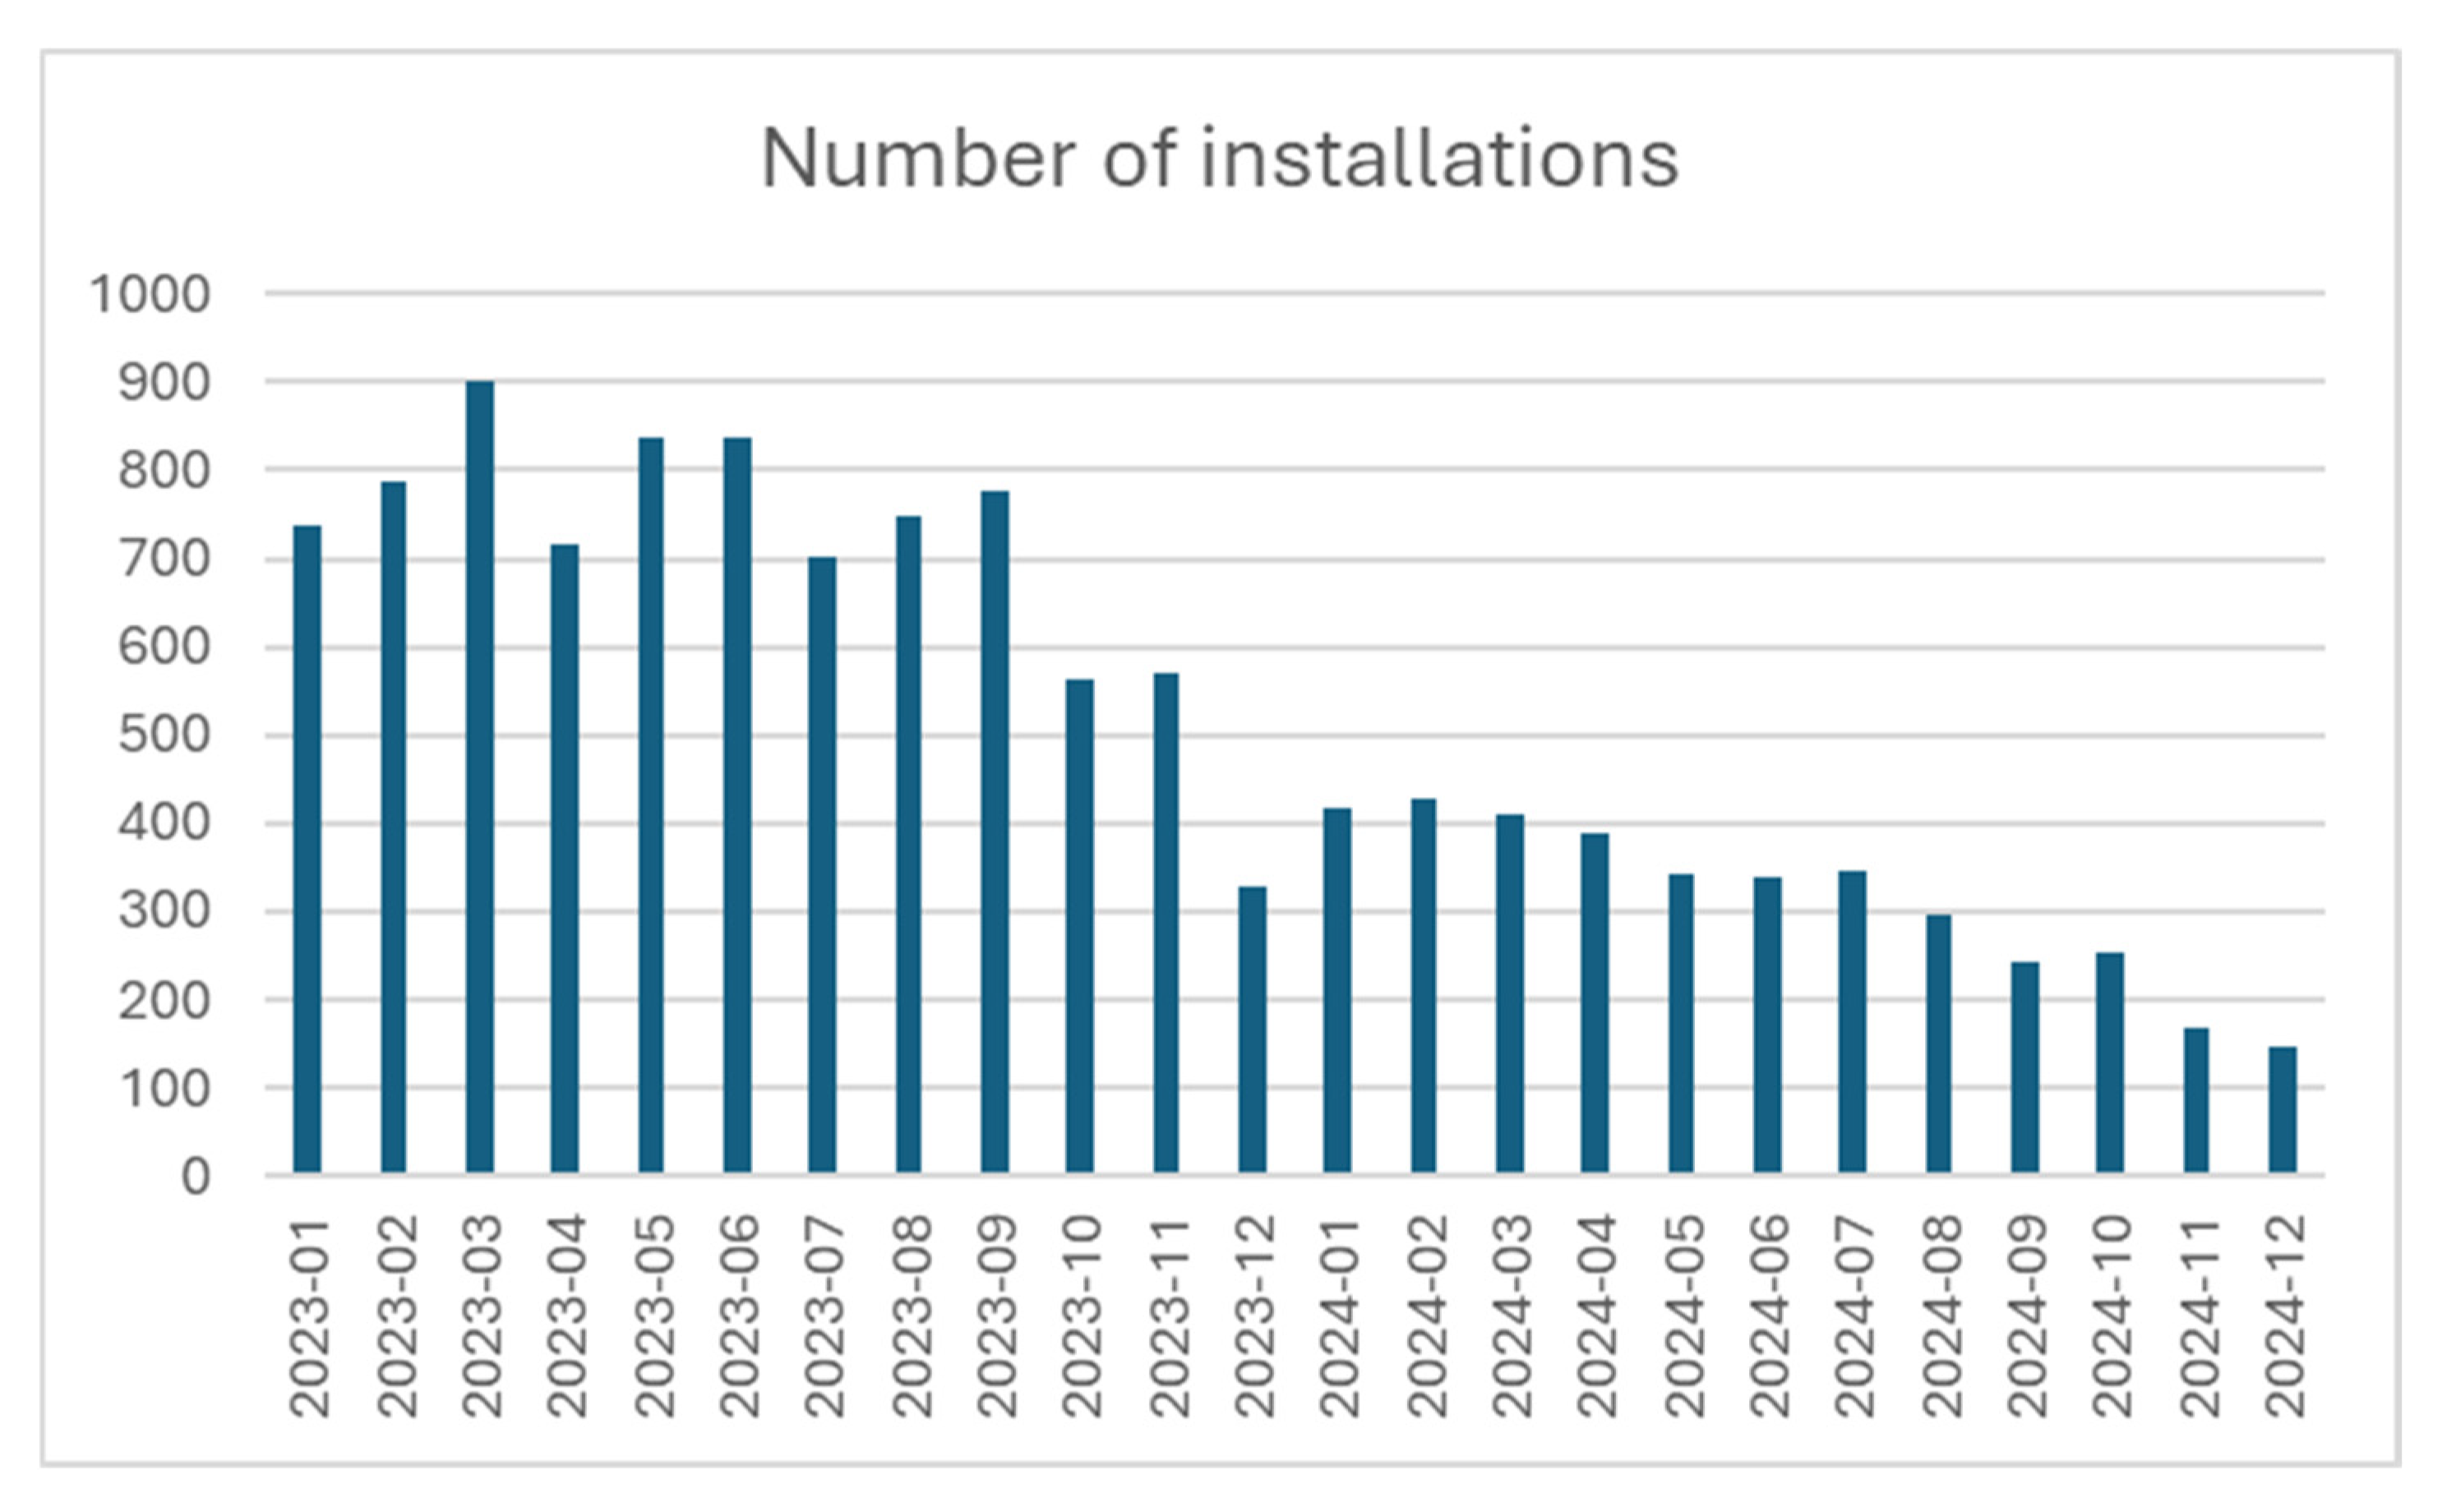
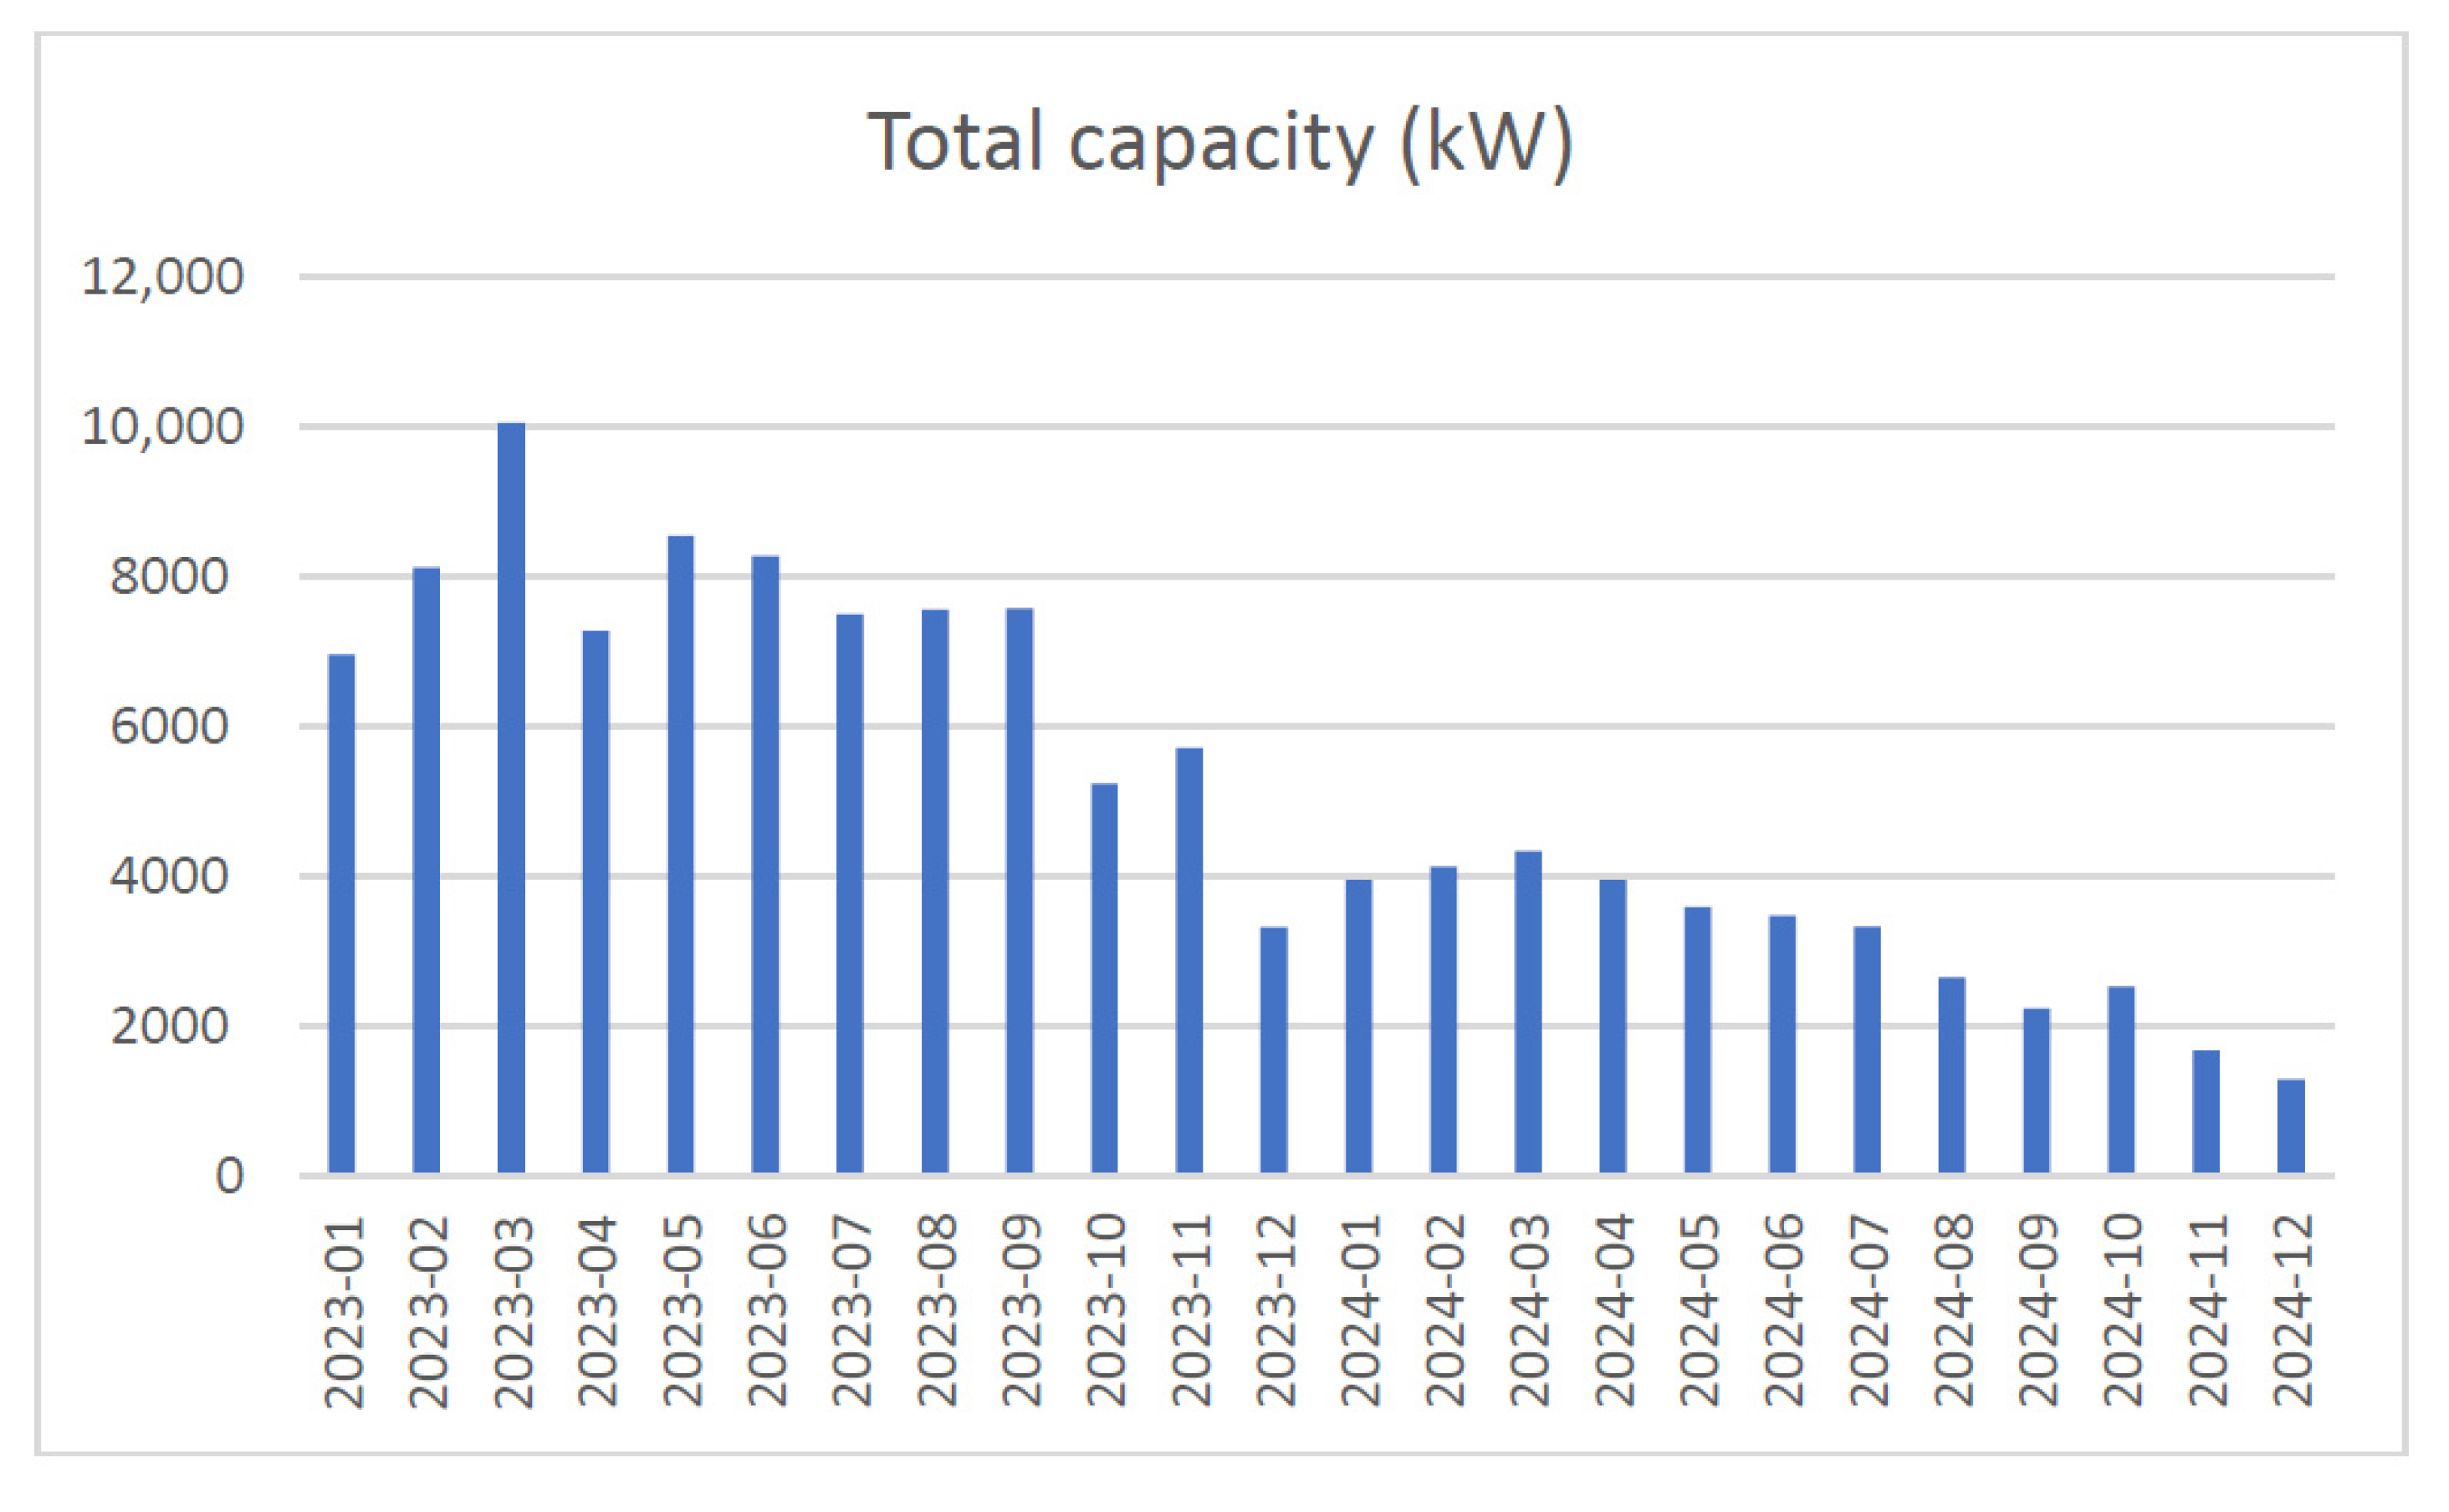
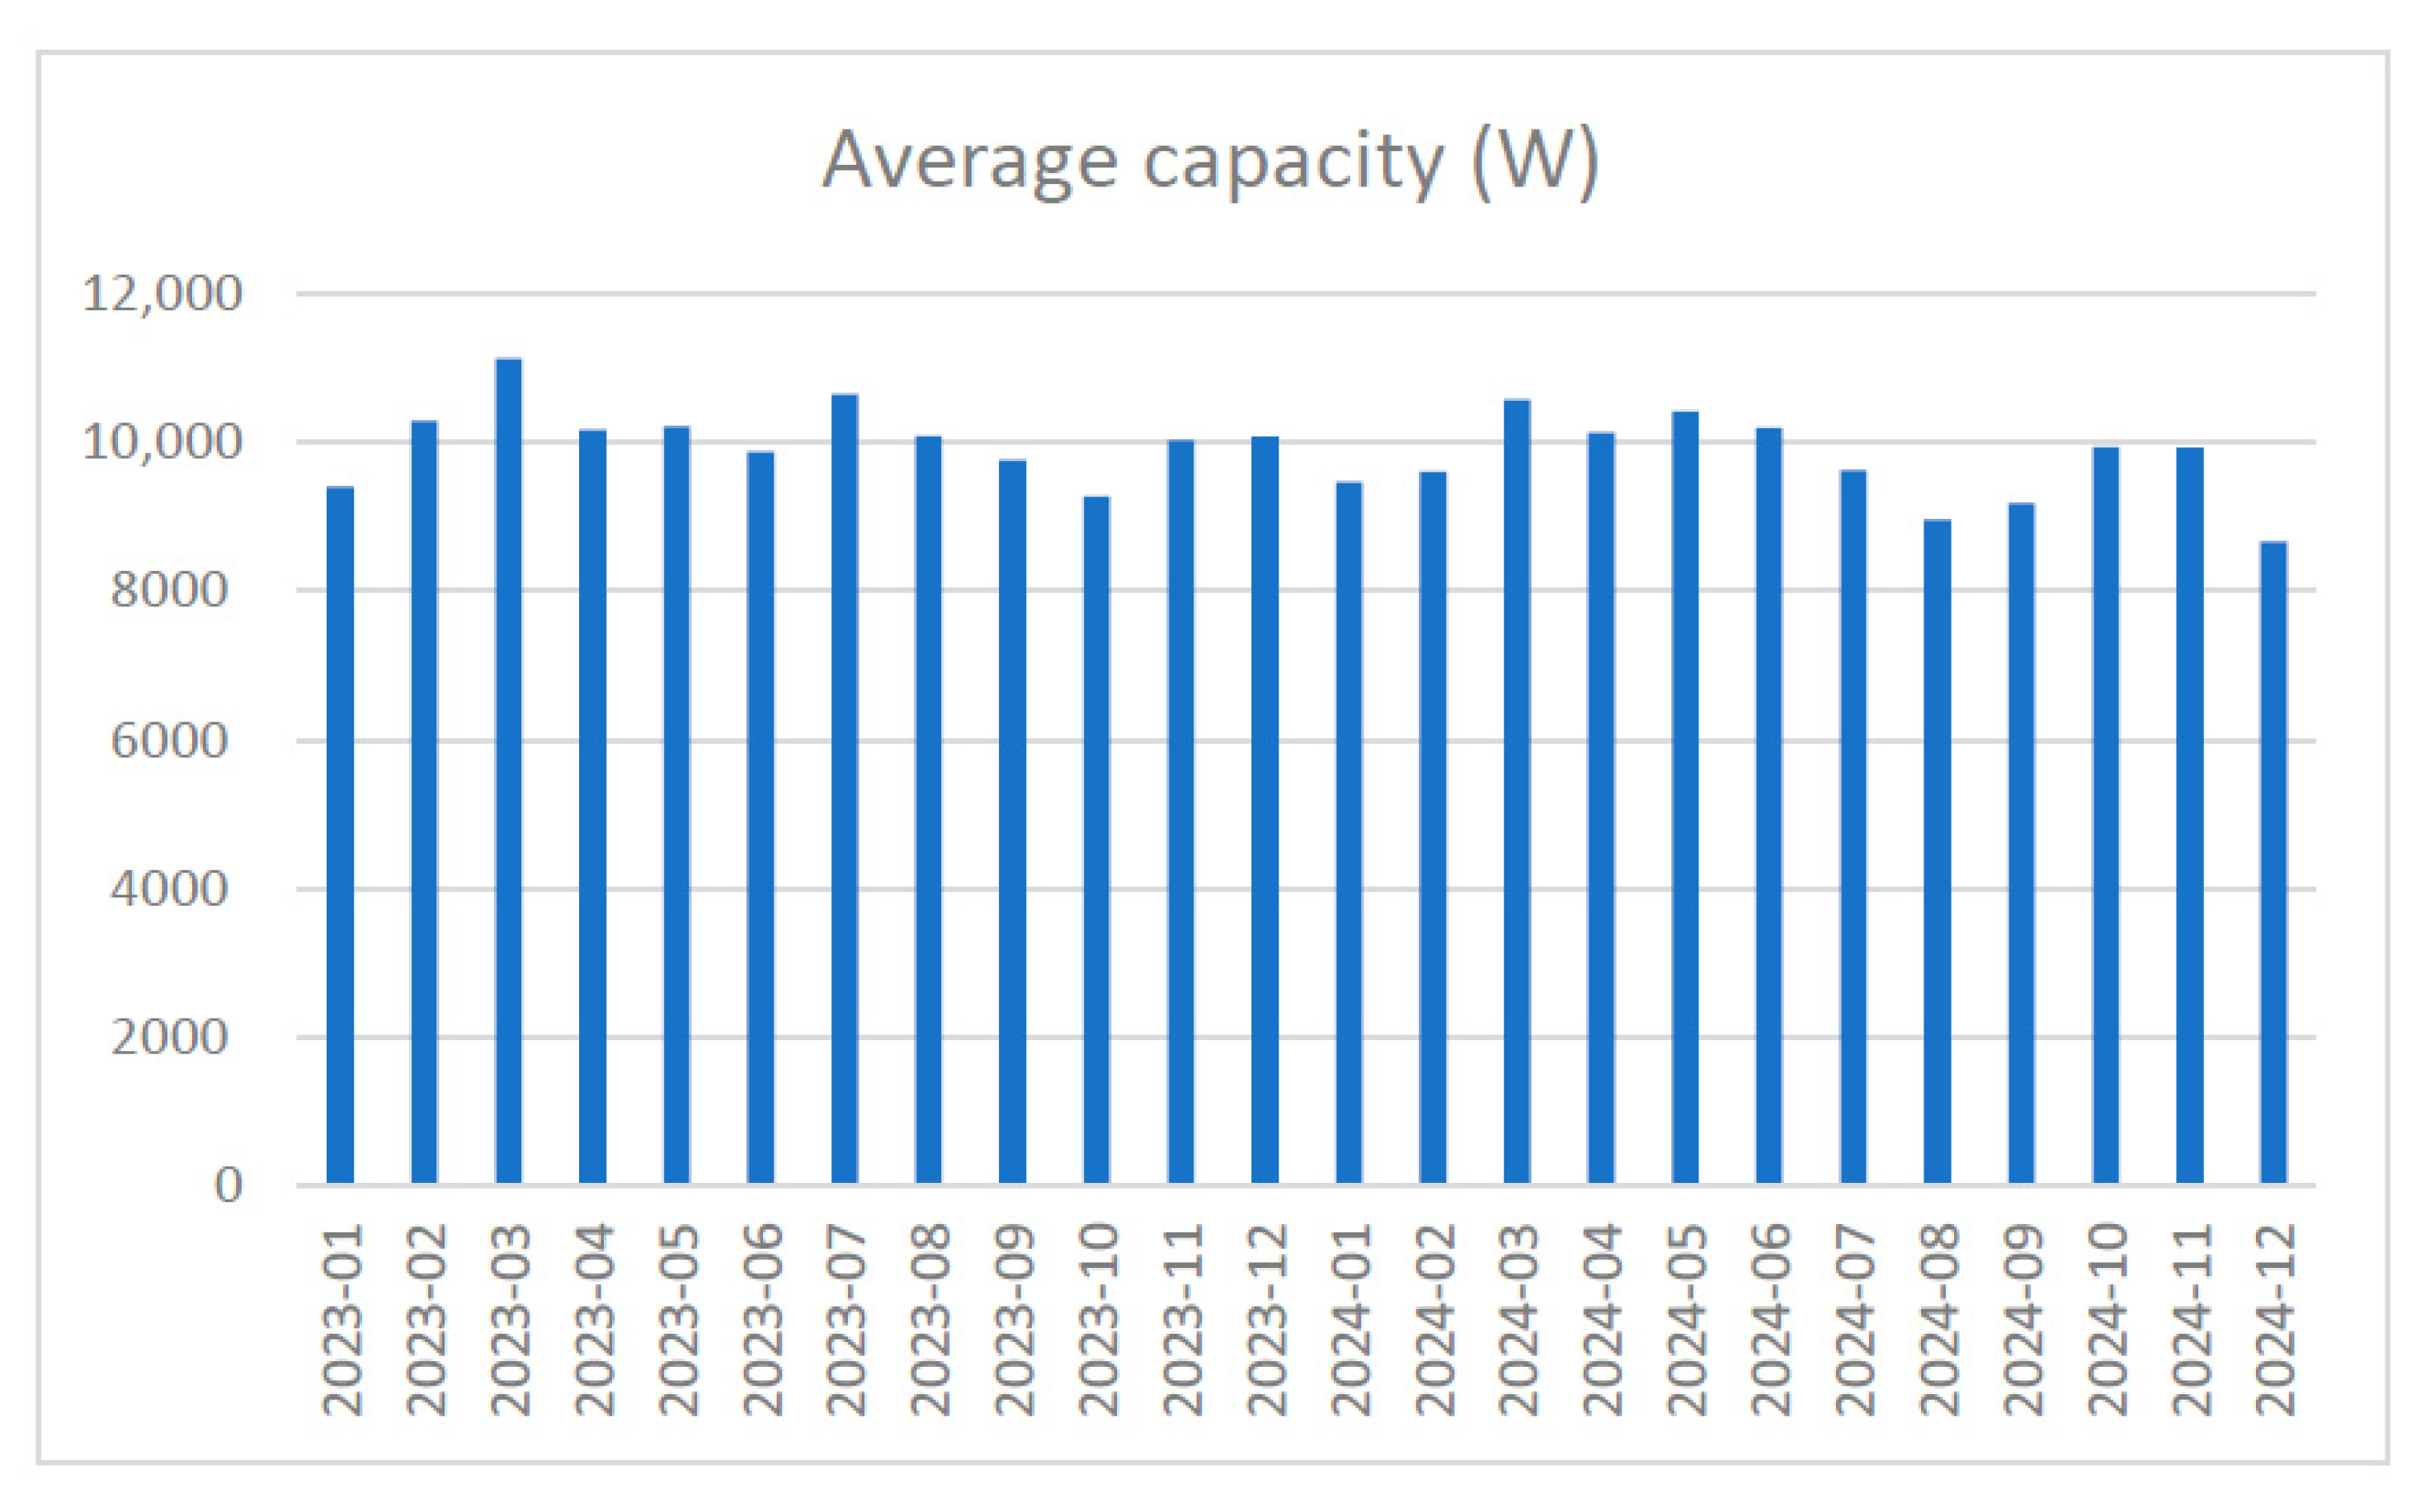
After the preprocessing stage, a total of 12,291 records remained and were used in the forecasting process. Selected feature distributions are presented in Figure 4, Figure 5 and Figure 6.
For clarity and transparency, we also provide a statistical summary of the dataset. The monthly number of new installations in the analyzed period (2023–2024) ranged from 148 to 903 units, with an average of 512.1 installations per month and a standard deviation of 237.6 (N = 24). This confirms the strong variability in installation dynamics across months. Regarding the average installed capacity of individual systems, based on 12,291 records, the values ranged from 0.37 kW to 49.95 kW. The weighted mean capacity amounted to 10.02 kW with a weighted standard deviation of 7.39 kW, indicating relatively large diversity among individual installations.

2.2. Preprocessing

During the data processing stage, the attribute storing postal codes was transformed into a region identifier by extracting the first digit of each postal code. This allowed for the classification of installations into ten geographic areas, each corresponding to a digit representing one of the official postal code zones used in Poland. The transformed variable reflects the regional location of the executed photovoltaic installation.
The regional assignment was carried out as follows:
  • 0—Warsaw District (Warsaw Voivodeship);
  • 1—Olsztyn District (Olsztyn and Białystok Voivodeships);
  • 2—Lublin District (Lublin and Kielce Voivodeships);
  • 3—Kraków District (Kraków and Rzeszów Voivodeships);
  • 4—Katowice District (Katowice and Opole Voivodeships);
  • 5—Wrocław District (Wrocław Voivodeship);
  • 6—Poznań District (Poznań and Zielona Góra Voivodeships);
  • 7—Szczecin District (Szczecin and Koszalin Voivodeships);
  • 8—Gdańsk District (Gdańsk and Bydgoszcz Voivodeships);
  • 9—Łódź District (Łódź Voivodeship).
A summary of the installed PV systems by geographic region is presented in Table 2.
To ensure compatibility with the requirements of the applied forecasting models, the dataset underwent a series of preprocessing steps. These transformations aimed to improve data quality, enhance model performance, and enable proper temporal forecasting. The following procedures were applied:
  • Temporal aggregation: Raw records were aggregated to a monthly frequency, allowing for trend stabilization and the reduction in short-term noise.
  • Feature scaling: Continuous numerical variables were normalized using min–max scaling to ensure a uniform value range and support model convergence.
  • Geographic encoding: Postal codes were reduced to their first digit, representing major geographic regions based on Poland’s postal zone system. The resulting categorical feature was encoded using one-hot encoding.
  • Cyclical encoding: The month variable, representing a cyclical time feature, was encoded using sine and cosine transformations (i.e., sin(2π·month/12) and cos(2π·month/12)). This approach enables the model to learn seasonal patterns without artificial discontinuity between December and January.
  • Train–test split: The final dataset was split into training and testing sets in an 80:20 ratio, maintaining the chronological order of records to preserve temporal dependencies.
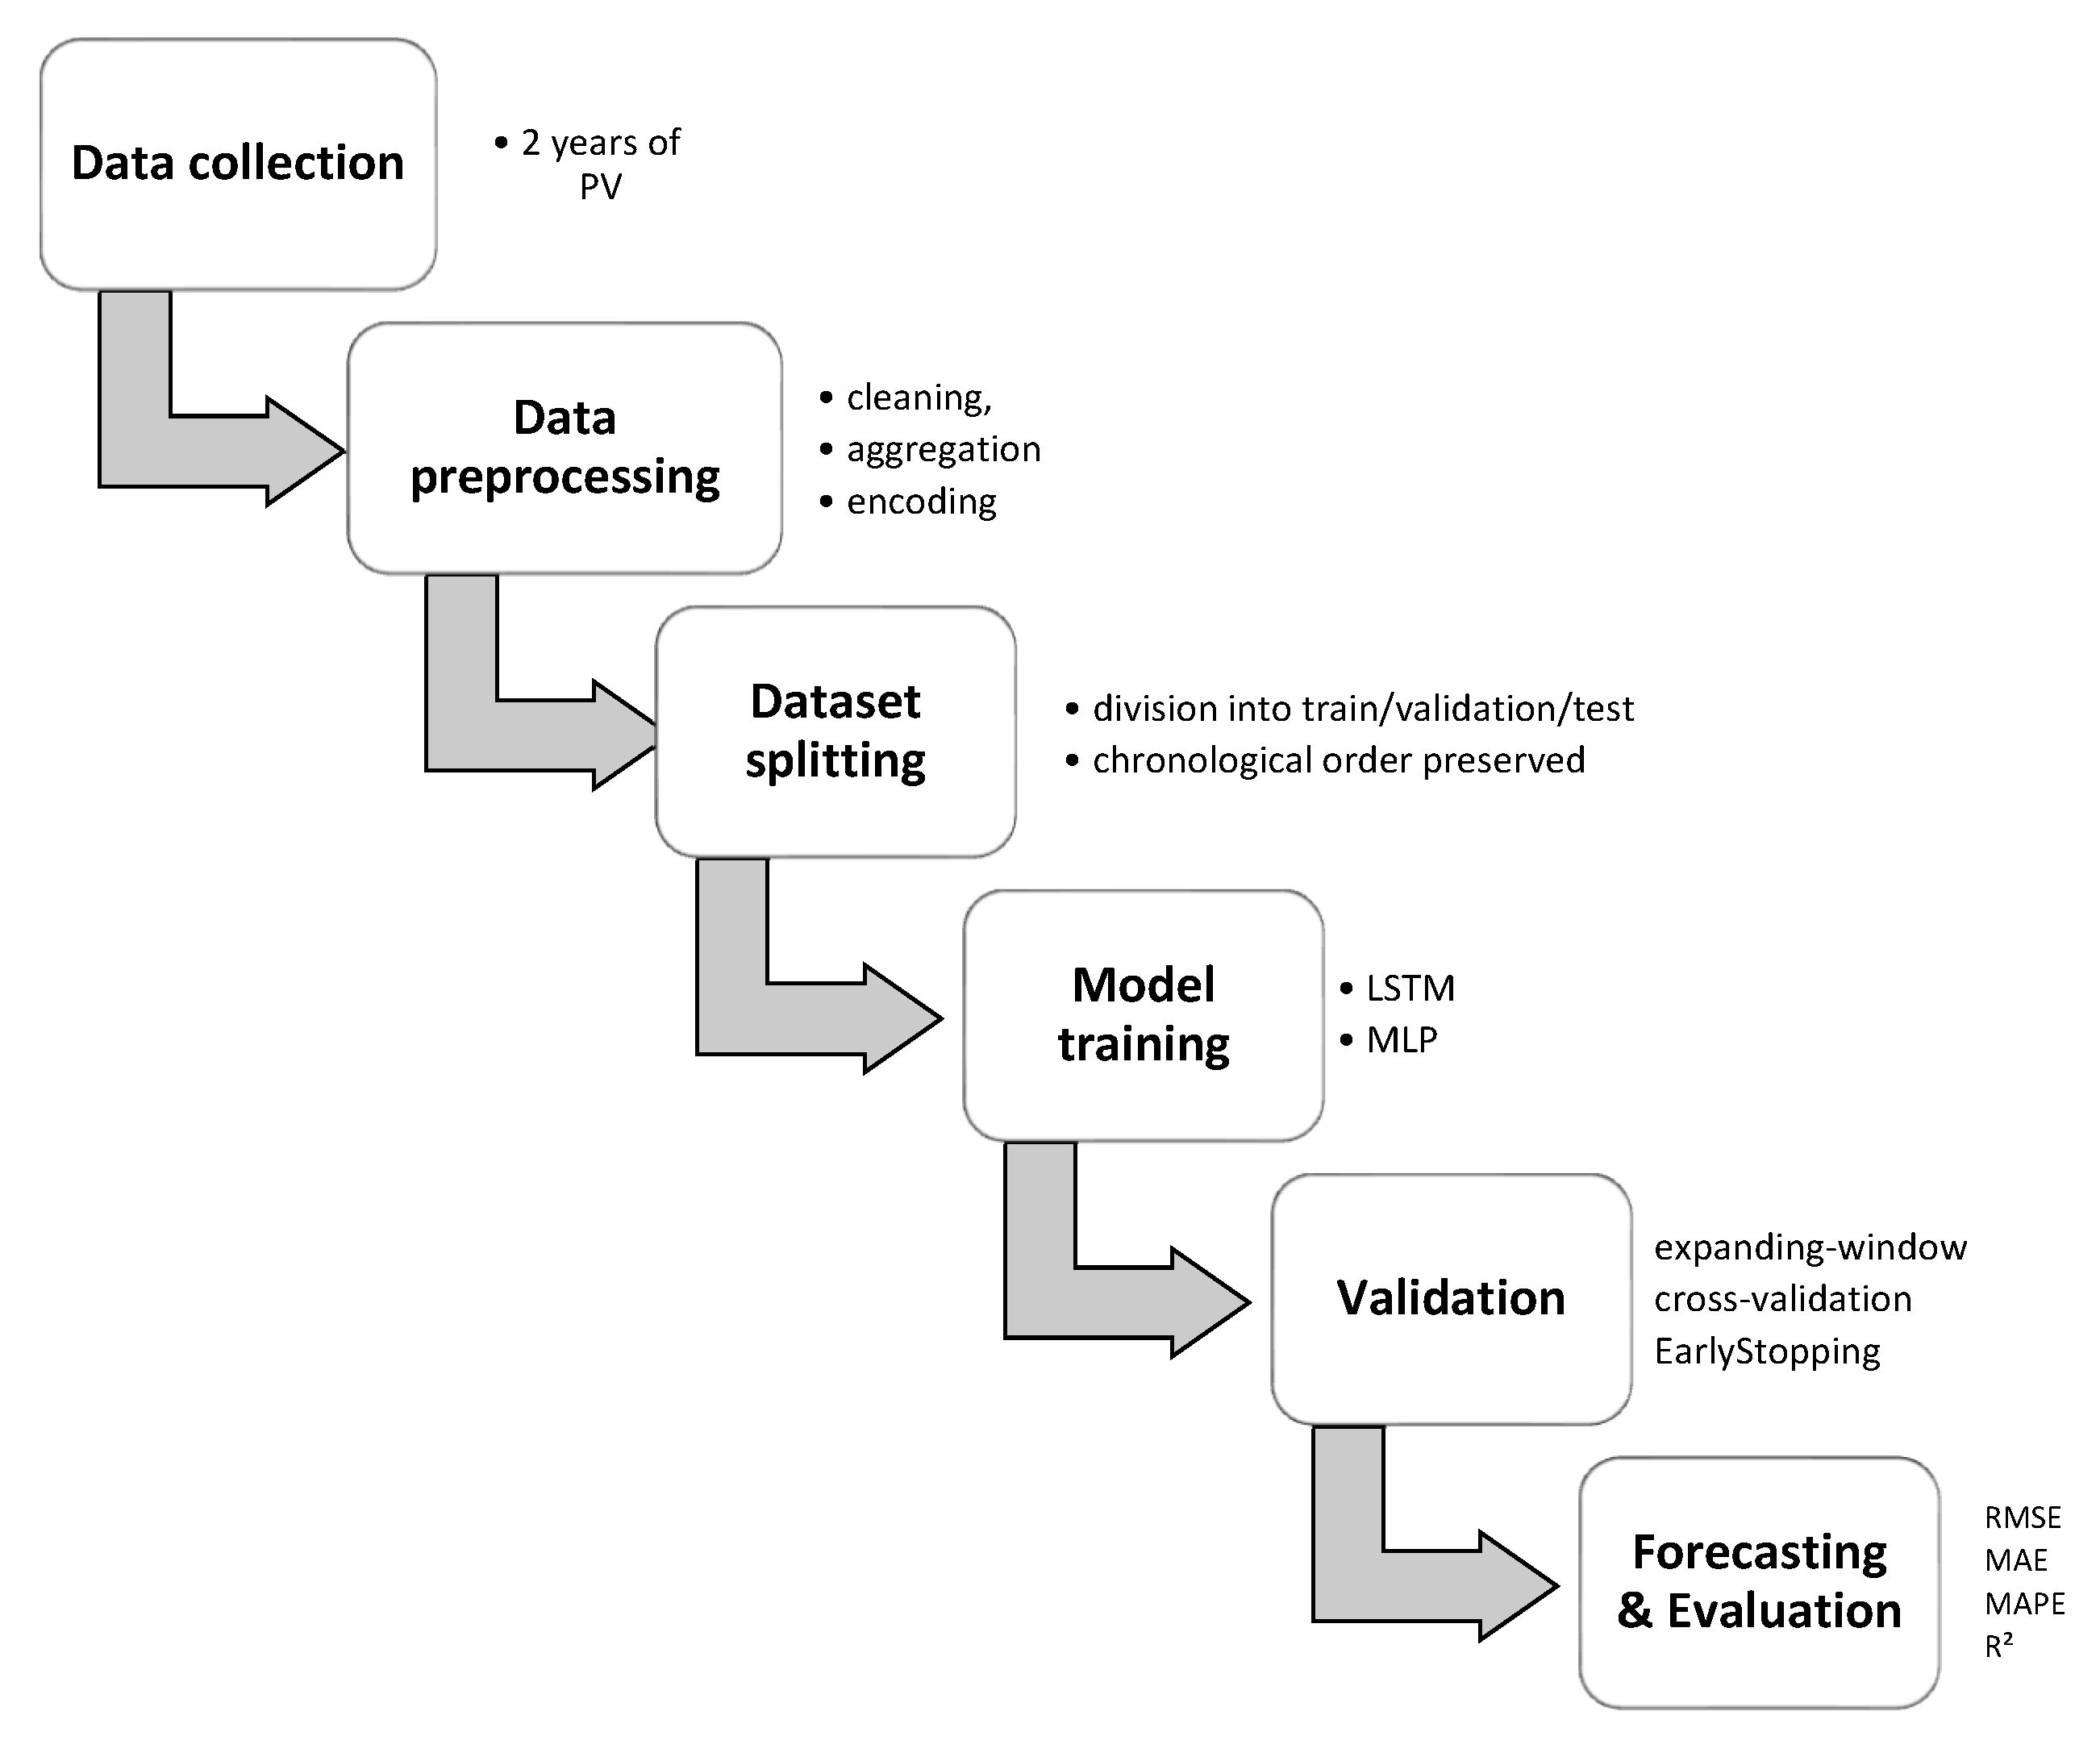
To further improve the clarity of the methodology, a schematic diagram is presented in Figure 7 to illustrate the sequential workflow of the study.
The data transformations described above were specifically tailored to prepare the dataset for use with the LSTM (long short-term memory) network, which was selected as the primary forecasting method in this study. Preprocessing procedures applied to other machine learning algorithms used for comparison purposes are not discussed here, as they fall outside the main scope of the research.

2.3. Forecasting Model, Performance Metrics, and Software

The primary forecasting objective was to predict both the number of newly installed photovoltaic systems and the average capacity of a single installation. To achieve this, an LSTM-based model was implemented. LSTM networks belong to the class of recurrent neural networks (RNNs) and are designed for modeling sequential data and capturing long-term temporal dependencies.
The long short-term memory architecture extends the classical recurrent neural network by introducing a memory cell and three gating mechanisms: the forget gate, the input gate, and the output gate. These gates regulate the flow of information and allow the network to capture both short- and long-term temporal dependencies [23,24,25,26].
The forget gate determines which parts of the previous cell state C t 1 are retained. The forget gate does not directly compute the cell state but generates a filter vector (1), which determines how much of the previous cell state will be carried over to the next step.
f t = σ W f · h t 1 , x t + b f
The input gate regulates the incorporation of new information into the cell state. It consists of two components: the gate vector i t   ( 2 ) and the candidate state C t (3).
i t = σ W i · h t 1 , x t + b i
C t ~ = t a n h W C · h t 1 , x t + b C
The actual update of the memory cell occurs in (4). Here, the forget gate f t   scales the previous cell state C t 1 , while the input gate i t controls how much of the candidate state C t ~ is added.
C t = f t C t 1 + i t C t ~
The output gate then determines which part of the updated cell state C t is exposed as the hidden state h t . Equations (5) and (6).
o t = σ W o · h t 1 , x t + b o
h t = o t t a n h C t
where x t is the input vector at time t; h t is the hidden state; C t   is the cell state; C t ~ is the candidate cell state; σ   denotes the sigmoid activation function, and   is the Hadamard product. The matrices W and vectors b represent trainable parameters of the model.
Their application is particularly well-suited for time series datasets, such as monthly variations in the number of PV installations, which typically exhibit delays, seasonality, and long-term trends.
In contrast to traditional feedforward models, such as multilayer perceptrons (MLPs), LSTM networks incorporate an internal memory mechanism that allows them to learn complex relationships between past and future values without requiring manual construction of lagged variables. As a result, LSTM models offer a more accurate and realistic representation of the dynamics of energy-related processes.
Due to the nature of this study, which is focused on evaluating predictive performance, a detailed presentation of model training procedures and hyperparameter tuning was intentionally omitted. Instead, the emphasis was placed on the presentation and comparison of final forecasting results obtained from different network architectures.
Further details of the training procedure and hyperparameter tuning are provided in Appendix A.
This approach enables the reader to directly assess the effectiveness of each solution.
All performance metrics (RMSE, MAE, MAPE, and R2) were calculated using the historical data from 2023–2024, where actual observations were available for comparison. Since real data for 2025 were not yet available at the time of the study, no error metrics were reported for the six-month forecast horizon. These forecasts are presented as model-based projections only. The forecasted levels were cross-checked against internal records and confirmed to be accurate; however, these proprietary data cannot be publicly disclosed at the request of the data provider.
To comprehensively assess the predictive performance of the proposed models, several standard evaluation metrics were employed. Their definitions and intuitive interpretations are summarized below.
  • Root Mean Square Error: RMSE measures the square root of the average squared differences between the predicted and actual values. It penalizes larger deviations more strongly, making it particularly sensitive to occasional large errors in prediction.
  • Mean Absolute Error: MAE is the mean of the absolute differences between predicted and observed values. It provides a straightforward interpretation as the average magnitude of the prediction errors, regardless of their direction.
  • Mean Absolute Percentage Error: MAPE expresses the absolute prediction error as a percentage of the observed value, averaged over all observations. It facilitates comparison across datasets of different scales, although it can be sensitive to very small denominators.
  • Coefficient of Determination: R2 quantifies the proportion of variance in the observed data that is explained by the model. Values closer to 1 indicate that the model captures the variability of the target variable more effectively, while values closer to 0 indicate poor explanatory power.
Although technical aspects of model construction are important during the development phase, they were not the primary objective of this research. The main focus remained on the accuracy and practical relevance of the obtained forecasts.
Readers interested in the detailed characteristics of LSTM models, including their architecture and practical applications—particularly in the context of energy forecasting—are referred to well-established studies in the literature, including [26,27,28,29,30,31,32].
The implementation of the forecasting models was conducted using the Python programming language. Among the libraries used, the most essential were TensorFlow (for building the LSTM model) and scikit-learn (for data preprocessing and model evaluation). Only the key packages relevant to the core research tasks are listed here.
In addition, selected statistical analyses supporting the data exploration phase were performed using the Statistica software package.

3. Results

In this study, a forecasting horizon of six months was adopted, generating predictions for the number of PV installations (i.e., sales/completions) and the average installed capacity of a single installation for the period from January to June 2025. The choice of this forecasting horizon was influenced by several factors, the most important of which was the need to achieve a balance between the length of the prediction window and the accuracy of the forecast, the ratio of the forecasting period to the amount of historical data available, and the generalization capabilities of LSTM networks.
Given that the dataset covered a relatively short historical period of 24 months, selecting a six-month forecasting horizon was deemed reasonable. This decision was supported by experimental tests that involved extending the horizon to 9 and then 12 months, as well as shortening it to 3 months. The six-month horizon provided the most favorable trade-off, allowing for high predictive accuracy while maintaining a reasonable balance between input window size and forecast length.
From a business perspective, the six-month forecasting horizon is also considered practical, given the typical decision-making and operational cycles of companies operating in the renewable energy sector. A six-month period is long enough to support effective planning of resources, procurement, production, and marketing activities, while remaining short enough for forecasts to stay relevant and resilient to significant market or regulatory changes.

3.1. Forecasting the Number of PV Installations and Evaluation of Forecast Quality

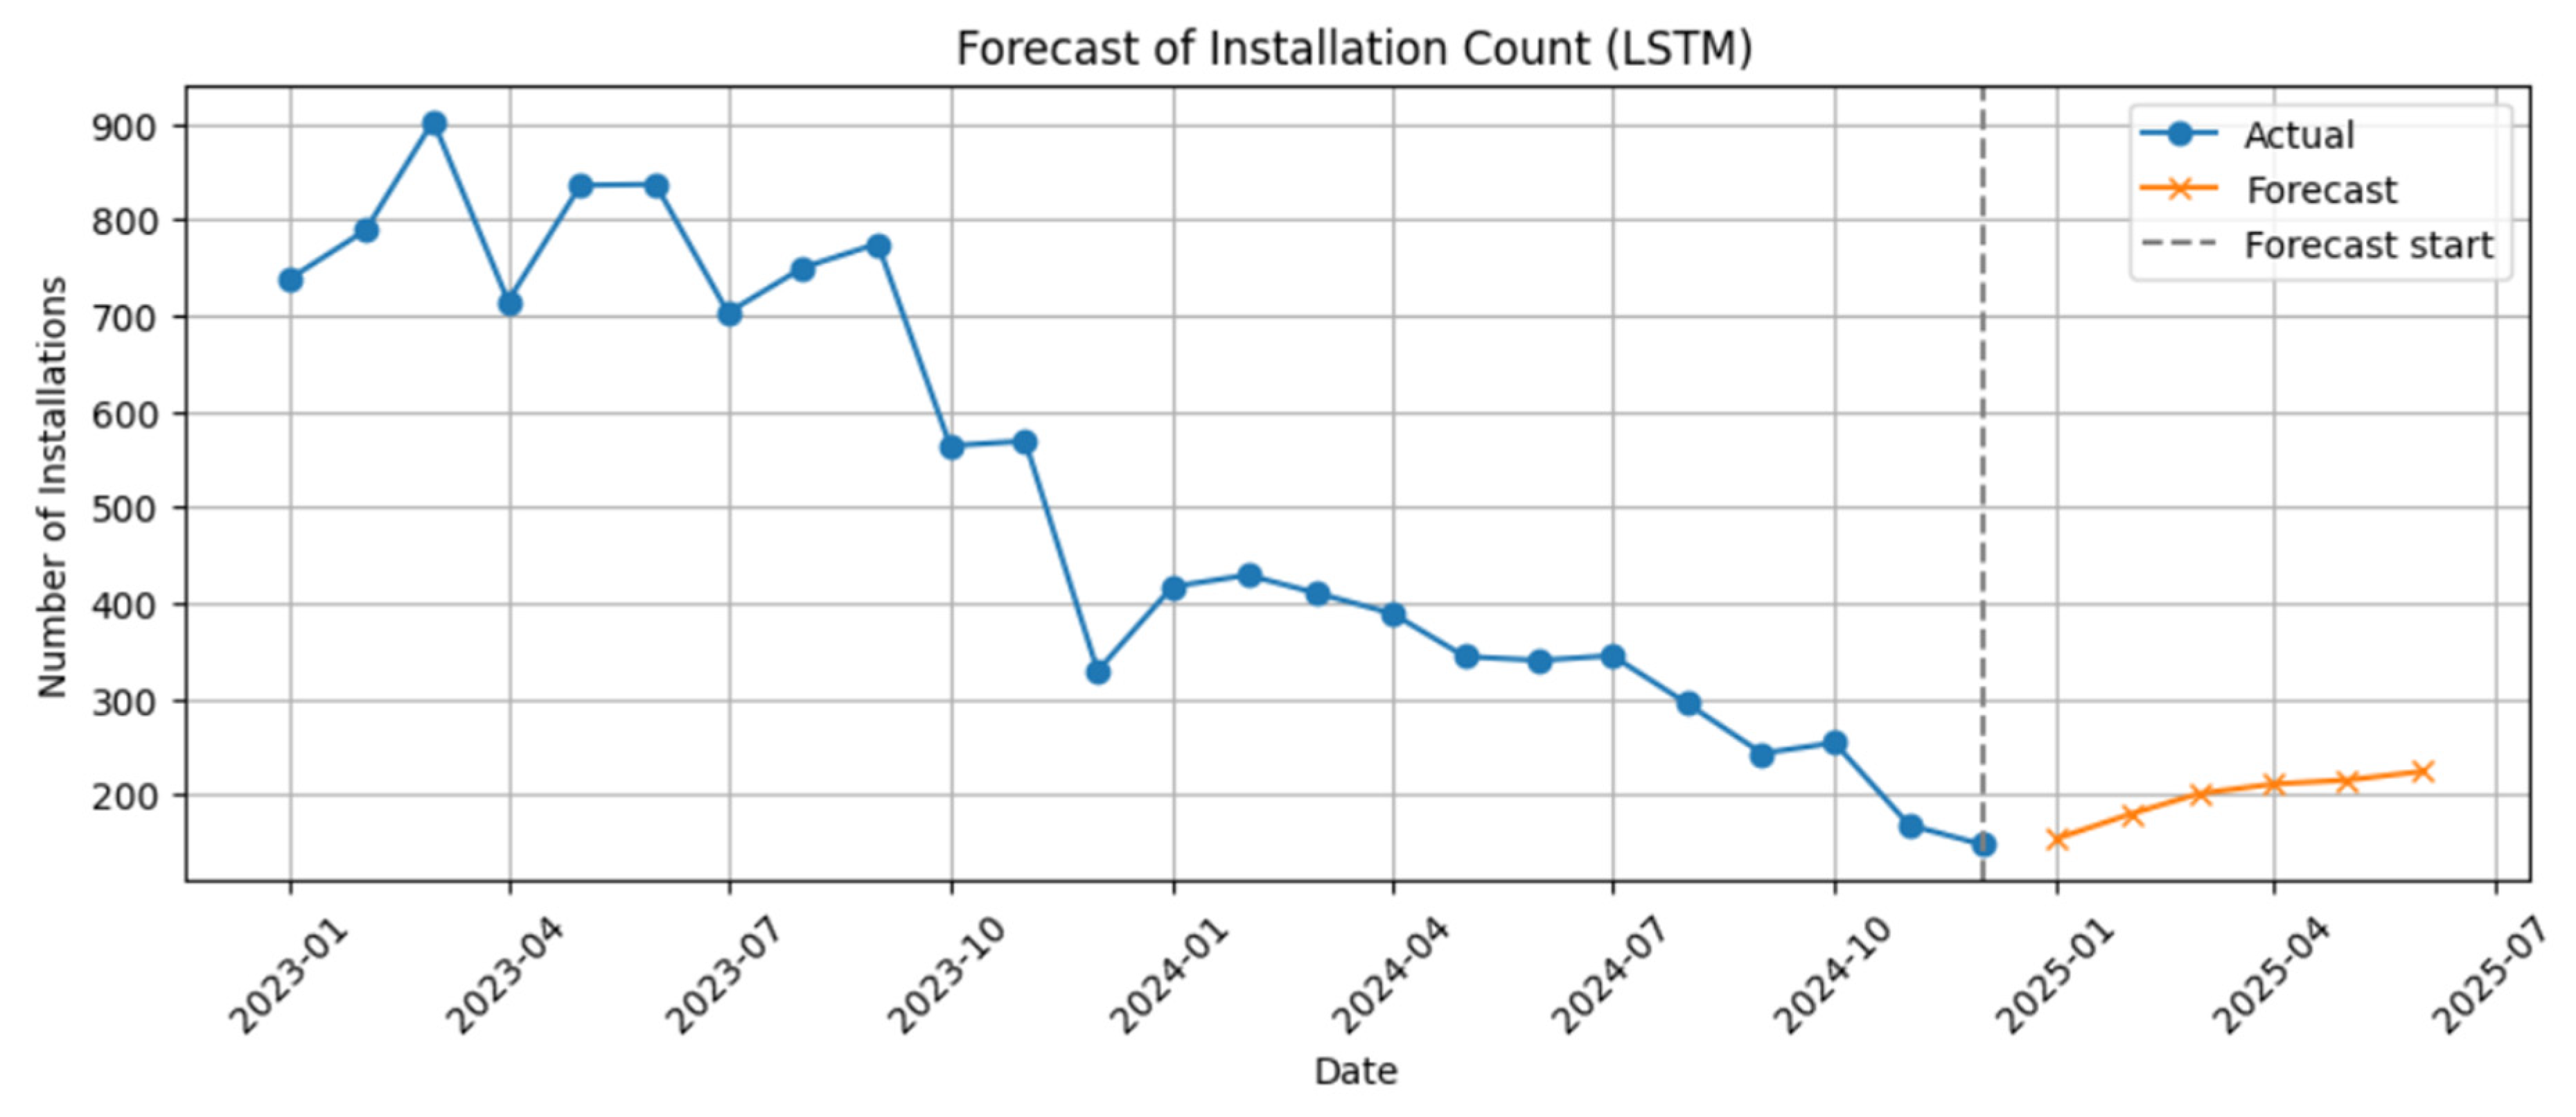
The use of the LSTM model enabled the generation of forecasts for both the number of photovoltaic installations sold by the data-providing company and the estimation of the average capacity of the sold installations. The forecast for the number of PV installations sold during the period from January to June 2025 is presented in Figure 8 and Table 3.
The accuracy of the forecasts was evaluated using commonly applied error metrics: mean absolute error (MAE), root mean squared error (RMSE), and mean absolute percentage error (MAPE). The coefficient of determination (R2) was included only as a supplementary indicator due to its limited interpretability in the context of time series forecasting, particularly in the presence of seasonality and autocorrelation.
A summary of the applied error metrics is presented in Table 4.
The obtained results, RMSE (14.843), MAE (11.931), MAPE (4.406%), and R2 (0.973), clearly indicate the high predictive accuracy achieved by the applied model. The relatively low values of MAE and RMSE suggest that the average forecast error remains small in relation to the observed values and that the model effectively minimizes large deviations between the predictions and actual outcomes. In particular, the favorable MAPE result of 4.41% confirms that the model maintains a high level of accuracy also in relative terms, which is especially important when forecasting time-dependent variables such as the number of newly sold or installed photovoltaic systems.
Moreover, the coefficient of determination indicates that the model explains as much as 97.3% of the variance in the observed data. However, due to the specific nature of time series forecasting—including seasonality and autocorrelation—this value is treated as a supplementary indicator in this study. The primary evaluation is based on direct error metrics.
Overall, the results clearly confirm the effectiveness of the LSTM model in short-term forecasting of the number of PV installations, within a six-month forecasting horizon.

3.2. Forecasting the Average Capacity of a Single PV Installation and Evaluation of Forecast Quality

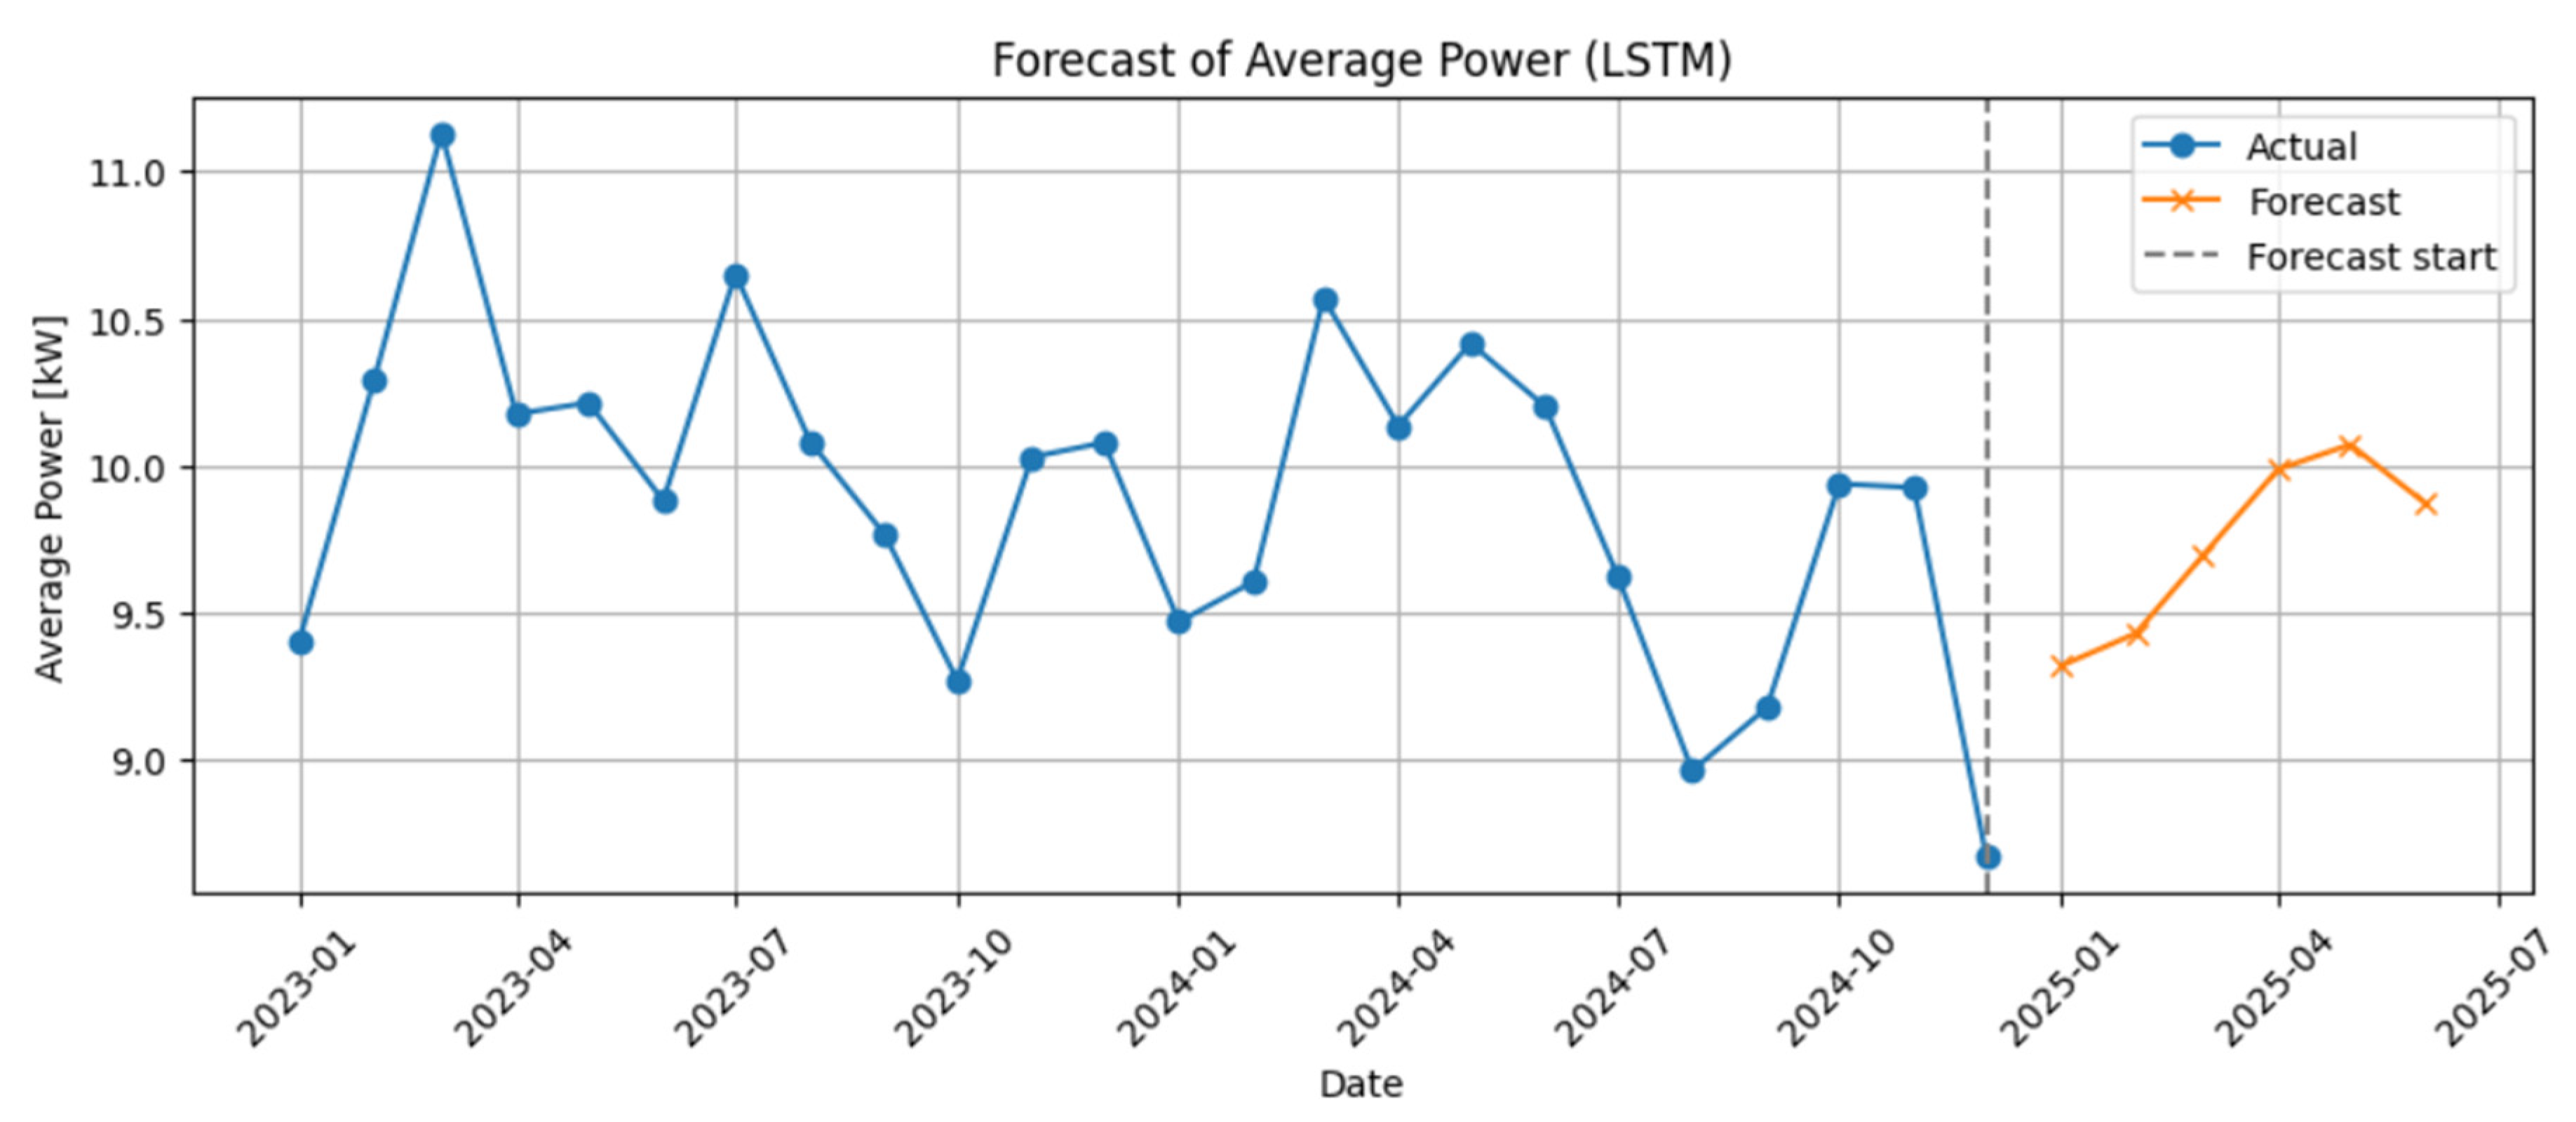
In the next stage of the study, a monthly forecast of the average capacity of a single photovoltaic installation was developed for the same forecasting horizon (January–June 2025). The results are presented in Figure 9 and Table 5.
The objective of this forecast was to capture potential changes in the trend of average installation capacity, which may result from technological advancements, shifting investor preferences, or the evolution of support schemes. The model was trained on historical data covering an equivalent time span of 24 months, and its predictive accuracy was evaluated using the same error metrics as in the case of forecasting the number of PV installations.
A summary of the performance metrics is presented in Table 6.
The obtained values of RMSE (0.340), MAE (0.285), MAPE (2.977%), and R2 (0.631) indicate a satisfactory level of forecast quality, particularly in the context of the low relative error. An MAPE below 3% confirms that the model produces accurate percentage-based forecasts, which is especially important when analyzing a variable with a relatively narrow scale, such as the average installed capacity expressed in kilowatts.
The lower R2 value compared to the previous forecast of installation count may be attributed to greater variability and reduced regularity in the data related to individual system capacities. These may be more strongly influenced by investor-specific decisions, local technical conditions, or project-specific characteristics.
Nevertheless, the remaining performance metrics suggest that the LSTM model maintains sufficient predictive precision to be considered a useful tool for short-term forecasting of this variable.
When analyzing the forecast results for both the number of installations and the average installed capacity together, it was observed that the average capacity does not follow the same trend as the number of installations. An increase in the number of installations does not necessarily correspond to an equivalent increase in total installed capacity.
For instance, in June, the number of installations was the highest, yet the average capacity decreased—likely due to a larger share of smaller systems being installed during that month, which lowered the overall average. This demonstrates that average capacity does not grow linearly with the number of installations. The disruption of this linear relationship explains the relatively lower coefficient of determination (R2 = 63.1%) observed for the average capacity model.
In summary, the main reason for this discrepancy appears to be the heterogeneous structure of newly sold PV systems, with varying sizes and technical specifications across installations.

3.3. LSTM Model Training and Learning Process

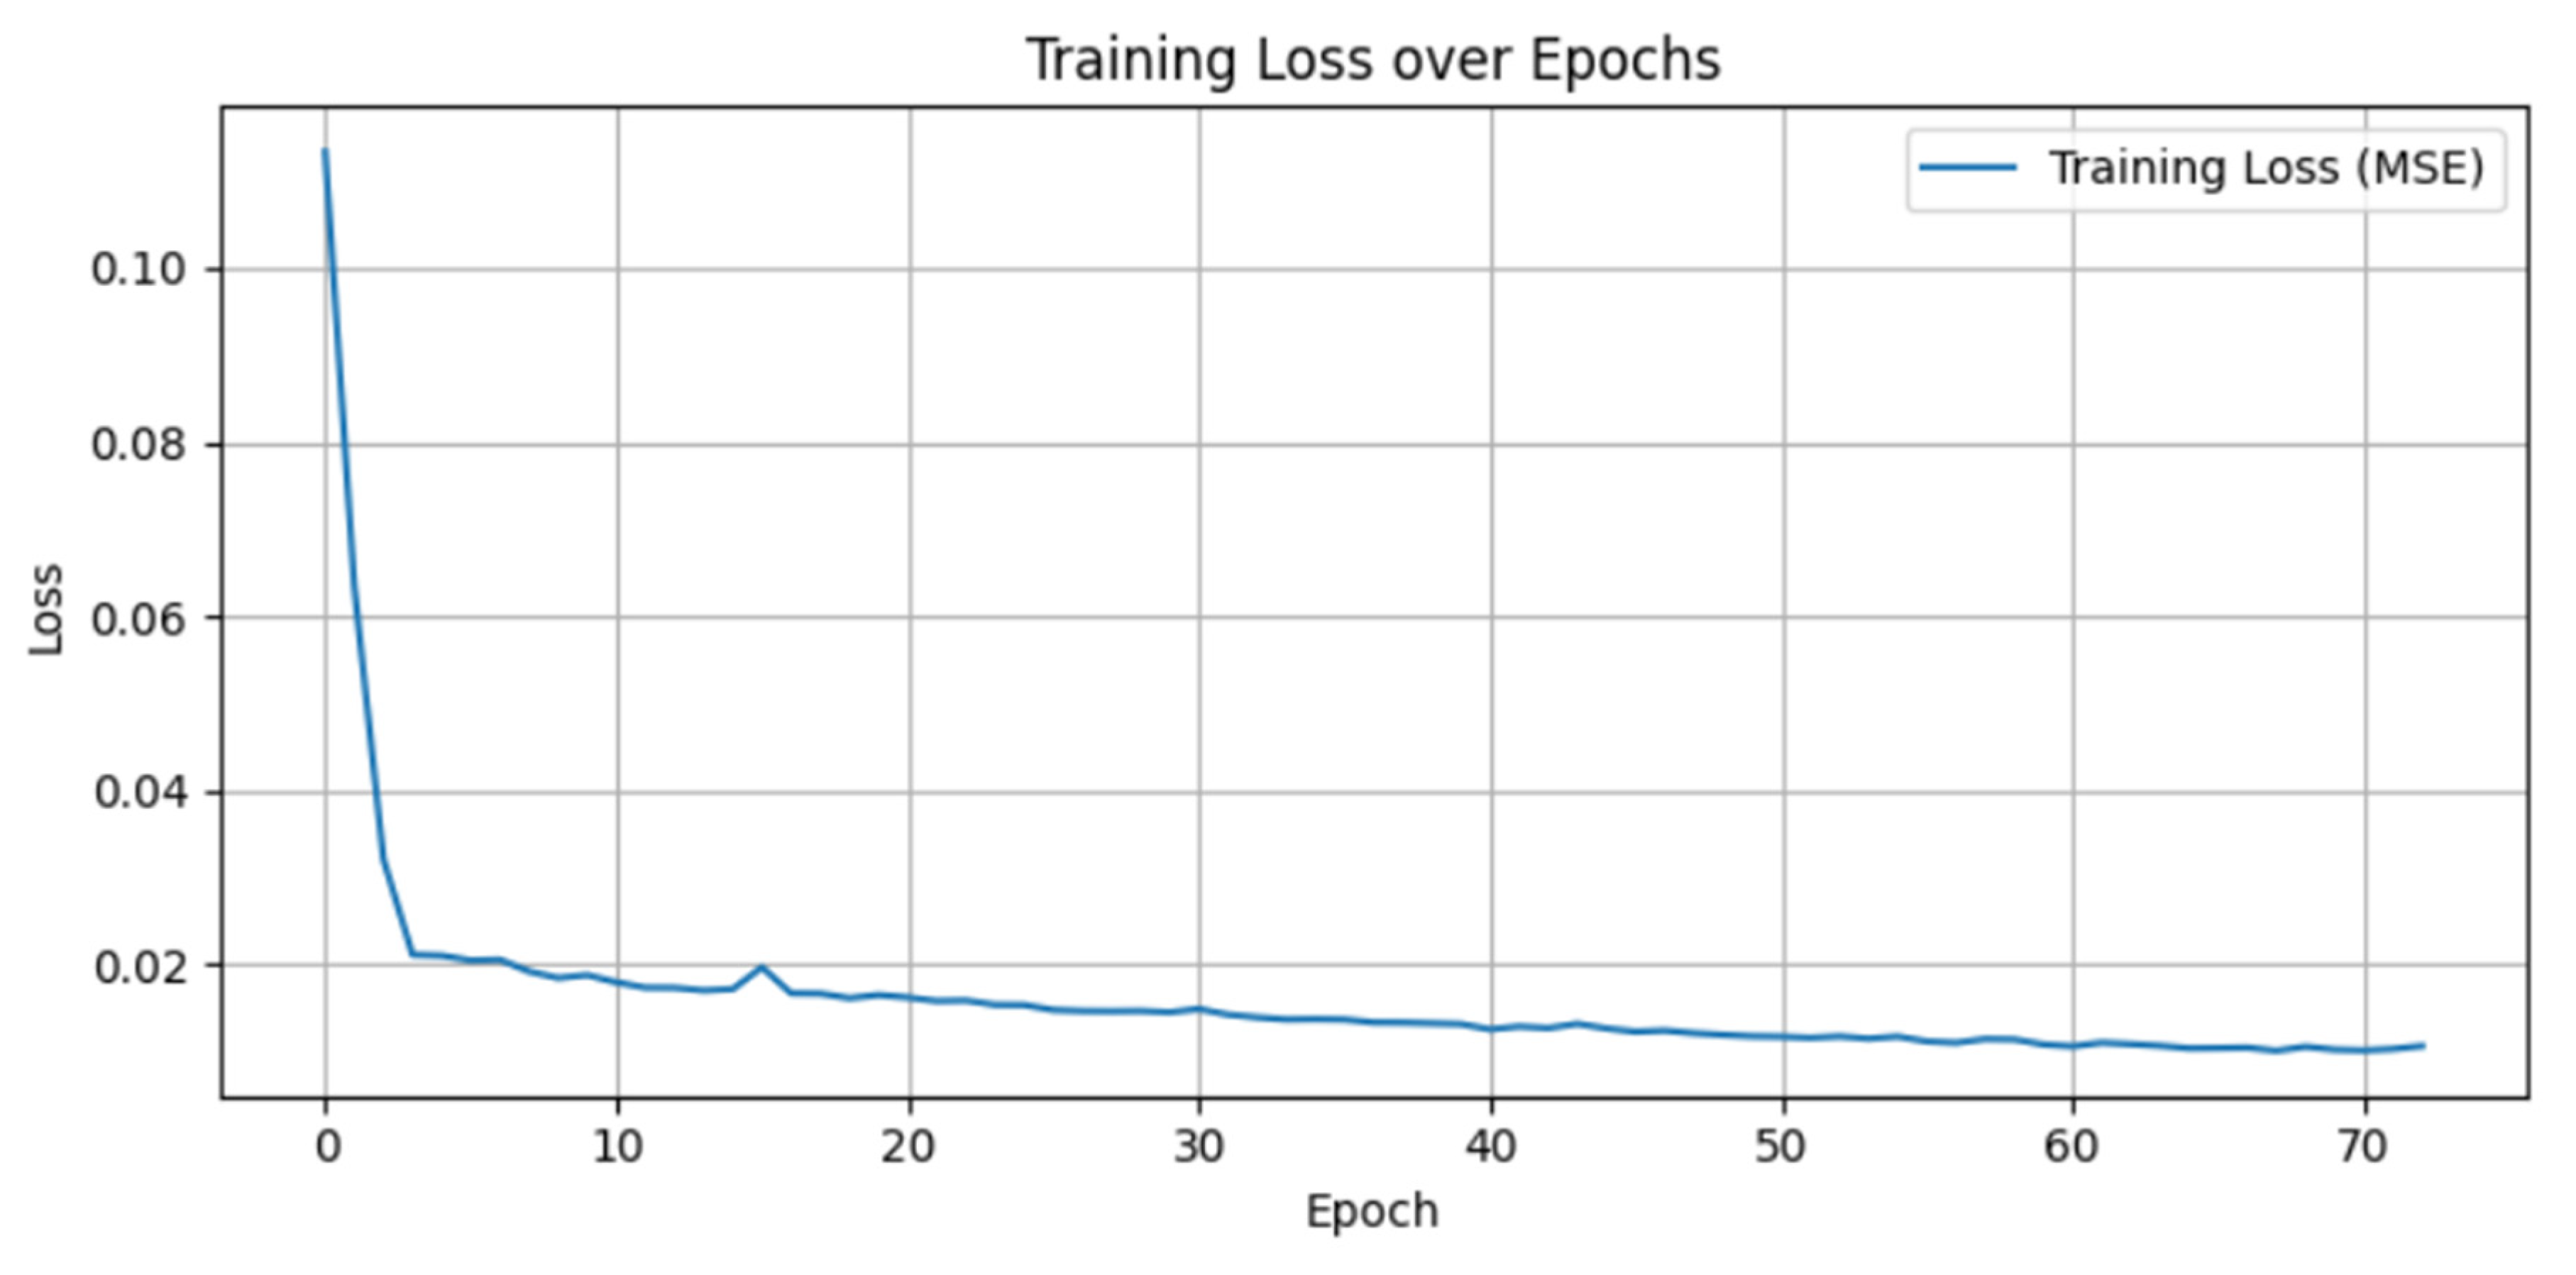
During the LSTM network training process, the mean squared error (MSE) was monitored after each epoch on the training dataset. Figure 10 illustrates the evolution of the loss function (MSE) over the course of training, presented in terms of epochs.
The initial sharp decline in error (from approximately 0.11 to ~0.02 within the first five epochs) indicates that the model quickly adapted to the dominant patterns present in the training data. After around 10 epochs, the rate of decrease slowed down, and the curve assumed a stable, asymptotic shape, suggesting that the model reached a local minimum. The absence of an increasing trend in the loss function in subsequent epochs indicates that the model did not experience overfitting during training.
The final MSE value stabilized around 0.015, which—given the prior min–max normalization of data to the [0, 1] range—reflects a low average deviation of predictions from actual values. The stabilization of error in later epochs could justify the use of an early stopping strategy to avoid unnecessary iterations without improvement in model performance.
The shape of the loss curve suggests that the LSTM model successfully captured the nonlinear temporal dependencies present in the data. Evaluation on an independent test set yielded a comparable level of error to the training set, confirming the model’s good generalization capability and robustness against overfitting.
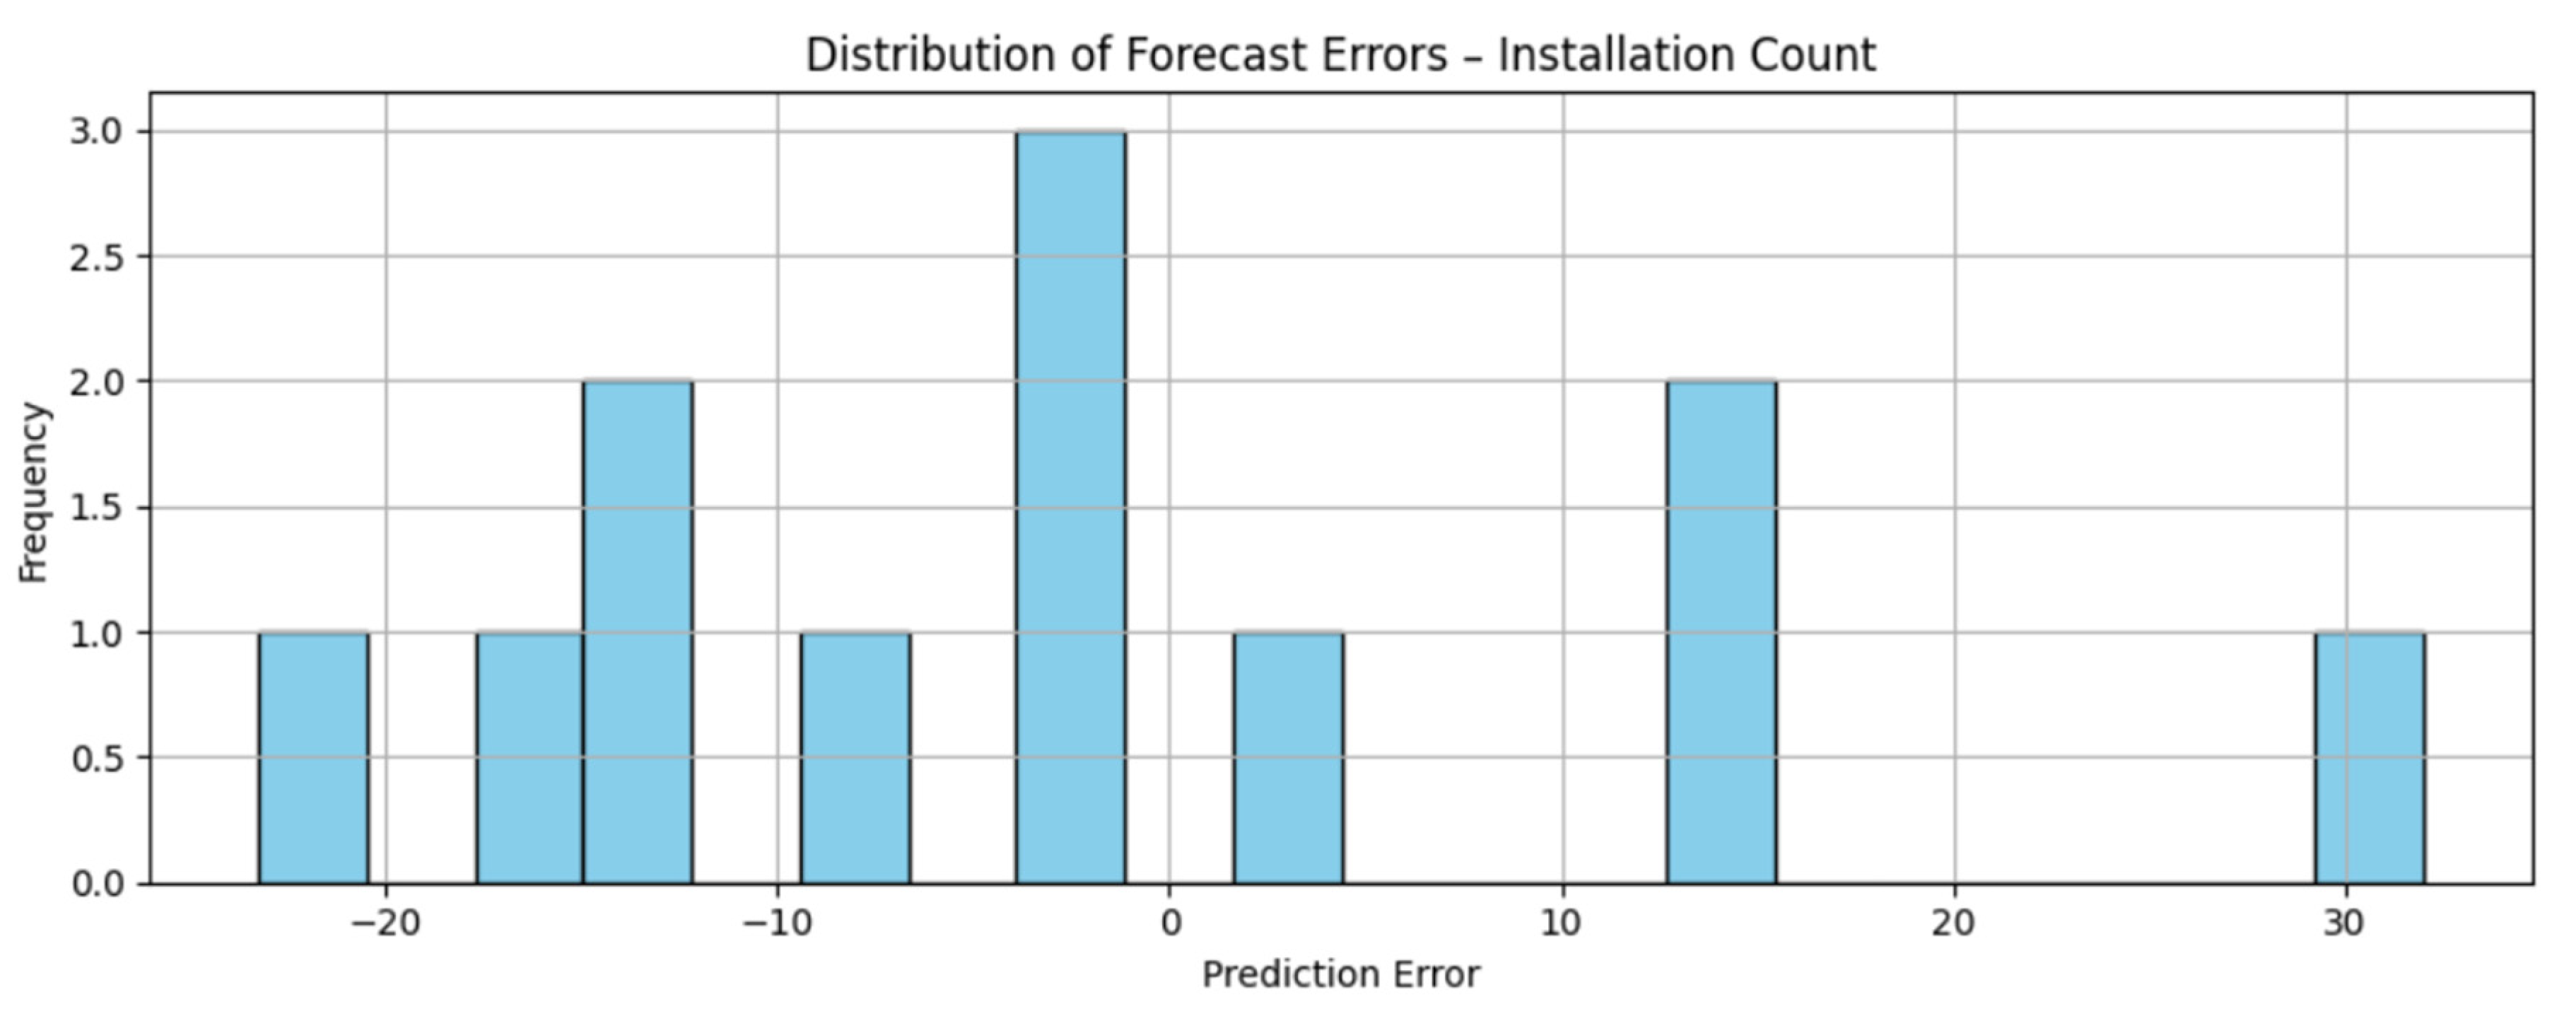
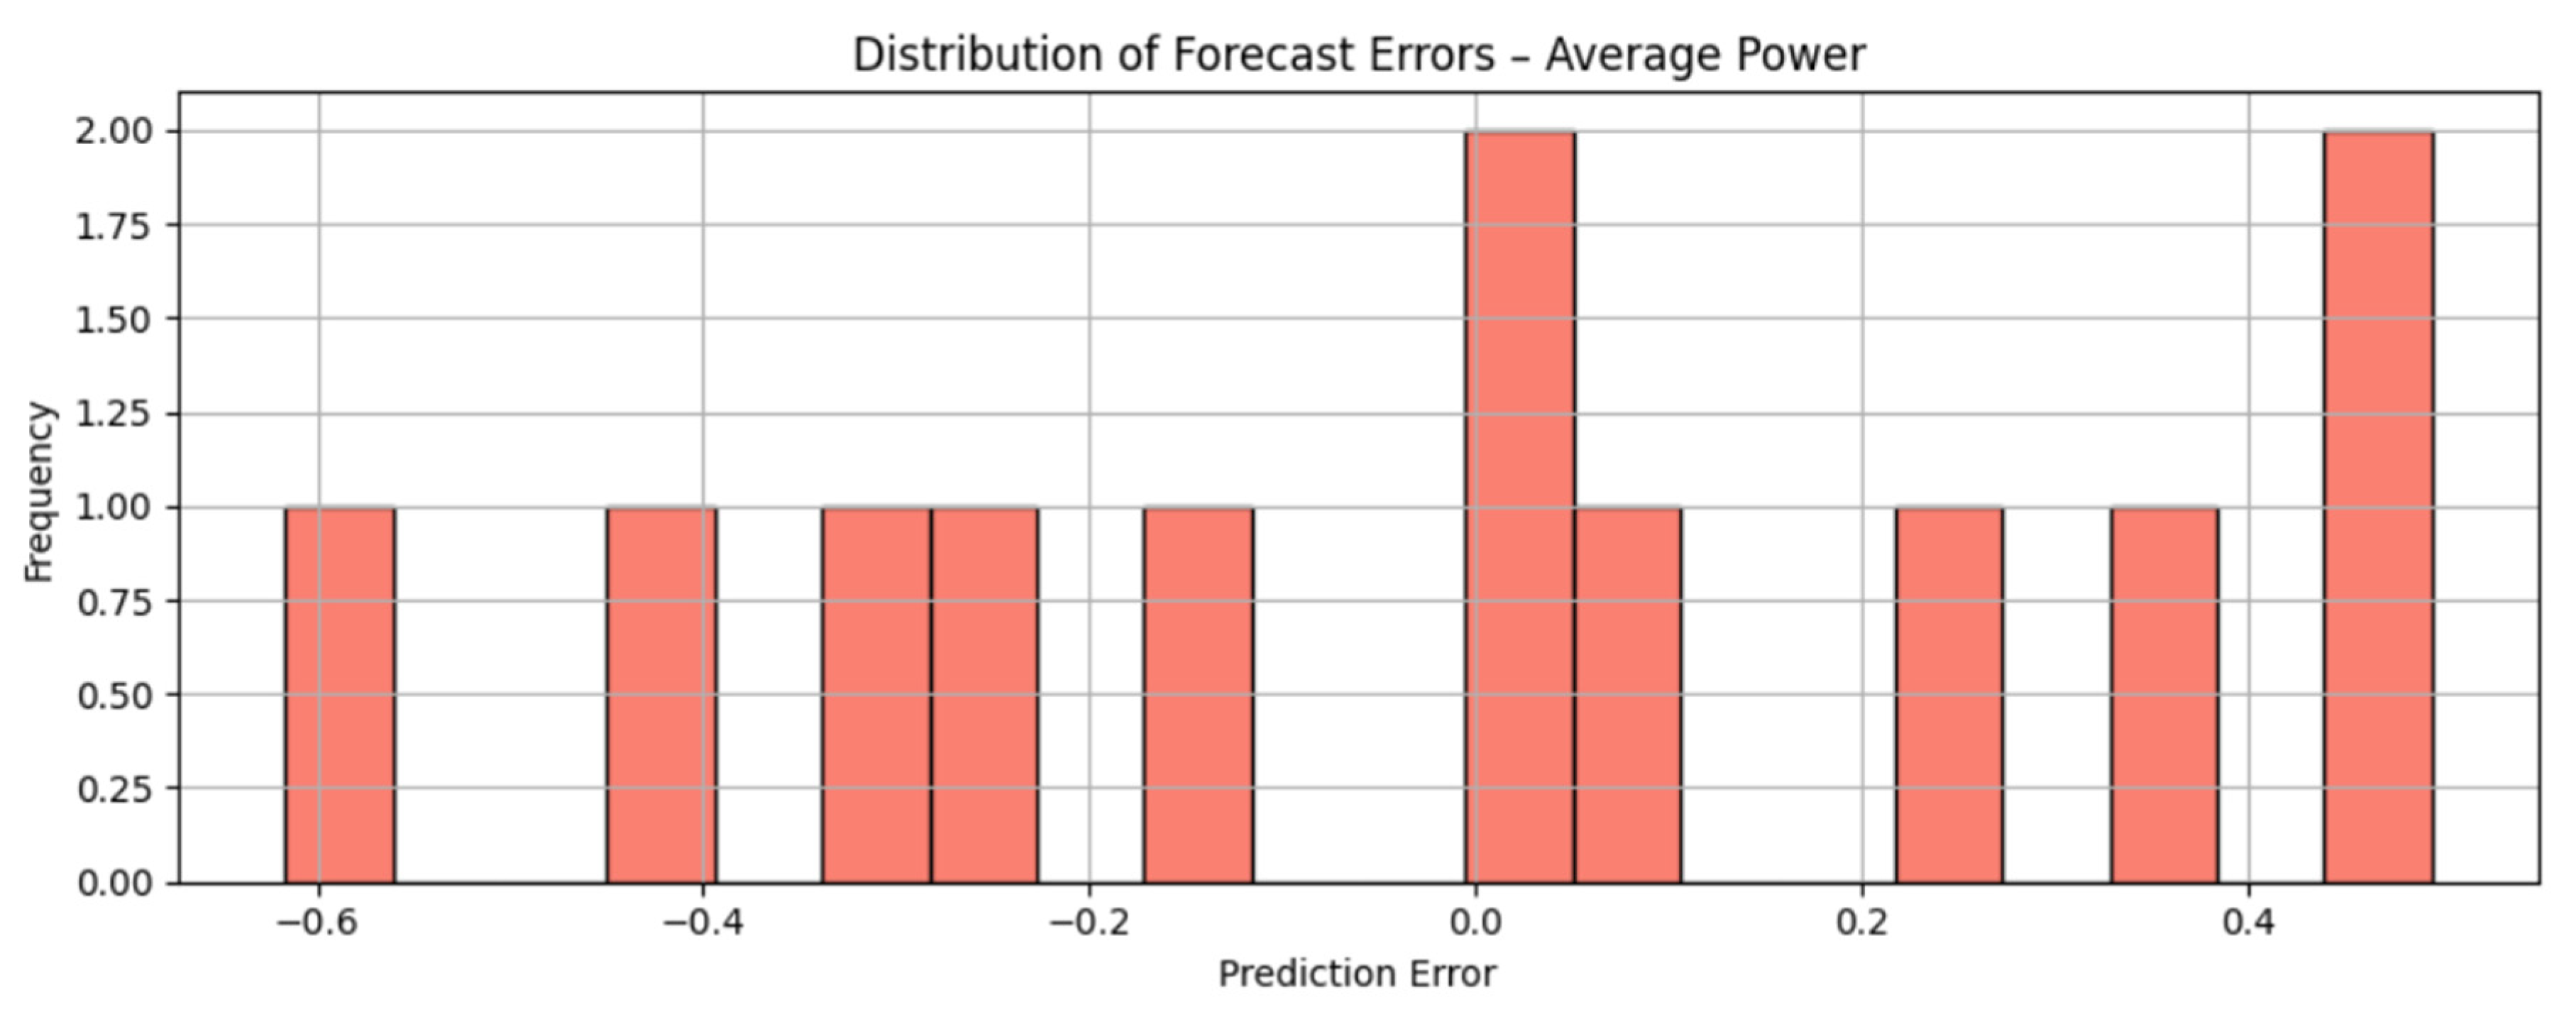
To further assess the distribution and nature of the forecast errors, histograms of prediction errors were generated separately for (i) the number of installations (in absolute values) and (ii) the average installation capacity (in normalized units). These error histograms are shown in Figure 11 and Figure 12, respectively.
The histogram of forecast errors for the number of PV installations (Figure 11) shows that most errors fall within the range of −20 to +30, with the highest number of occurrences (3) observed near zero error. The distribution appears relatively symmetrical, with no dominant outliers, indicating that the model does not exhibit a systematic tendency to overestimate or underestimate the number of PV systems sold. The presence of a few larger errors (±30) may be attributed to local anomalies in the test data that were not captured by the model (e.g., sudden demand surges or the launch of subsidy programs).
The histogram of forecast errors for the average installation capacity (Figure 12) spans from −0.6 to +0.5 in normalized units. The distribution is symmetrical and nearly uniform, without distinct concentrations of extreme errors. The two tallest bars (frequency of 2) correspond to bins centered around 0 and approximately +0.5, which may reflect seasonal variation in installed capacity observed in the empirical data.
The error distributions for both target variables exhibit typical characteristics of a well-calibrated regression model: no significant bias, relative symmetry, and a limited number of extreme errors. Based on these patterns, it can be concluded that the LSTM model does not suffer from overfitting or systematic prediction bias.

3.4. Comparison with Alternative MLP Models

To assess the effectiveness of the proposed LSTM model, its results were compared with those of an alternative reference model—a multilayer perceptron (MLP). The predictions obtained using the MLP model are presented in Table 7. The table is organized to highlight the activation functions used in both the hidden and output layers. For example, the label MLP (Linear-Exp.) refers to an MLP model that uses a linear activation function in the hidden layer and an exponential activation function in the output layer.
To assess the impact of activation function configurations on the quality of forecasts generated by the MLP model, a series of validation experiments was conducted using various combinations of activation functions in the hidden and output layers. The coefficient of determination (R2) values on the validation set ranged from 0.8069 to 0.8318, indicating a generally good model fit.
The highest R2 score (0.8318) was achieved when a linear activation function was used in both the hidden and output layers. A very similar result (0.8311) was obtained with a linear function in the hidden layer and an exponential function in the output layer. Slightly lower performance was observed for more nonlinear configurations, such as tanh in the hidden layer and logistic in the output layer (0.8187), and exponential–exponential (0.8167). The lowest performance was recorded for the linear–tanh combination, where R2 dropped to 0.8069.
For comparison, the LSTM network achieved a coefficient of determination of 0.973, highlighting its superior ability to model complex temporal dependencies in the data.
The observed differences may suggest that, in the analyzed case, the data did not require complex nonlinear modeling, and that simple transformations or even the absence of transformation were sufficient to achieve satisfactory predictive results. It can be assumed that the characteristics of the dataset favored the effective performance of simpler activation architectures.
A particularly interesting observation emerged when comparing the forecasting behavior of the MLP and LSTM models. The analysis revealed a significant difference in the nature of the predictions generated by the two approaches. The LSTM model produced forecasts that exhibited a consistent upward trend over the forecast horizon, whereas the MLP model showed an initial increase during the first 2–3 forecast periods, followed by a downward trend. This divergence suggests that the two models represent temporal patterns differently.
The MLP, as a classical feedforward network, relies on a fixed set of input features—often including lagged variables—but lacks any internal mechanism for modeling temporal context. In contrast, the LSTM network includes a memory mechanism and is capable of capturing long-term sequential dependencies. As a result, it may interpret trends and cyclical patterns in the data differently from MLP.
The opposite forecast directions observed between the models may be explained by their differing sensitivities to seasonal variables or their treatment of time-lagged inputs. Notably, the LSTM network models time dynamics explicitly through its memory cells and gating mechanisms, allowing it to detect seasonality, delays, and long-term effects. Meanwhile, the MLP “sees” the data in a flattened form and cannot incorporate contextual time information, leading to structurally different forecast outputs.
In addition to the direction of the forecasts, the predicted values themselves differed substantially. The forecasts generated by the MLP model were significantly overestimated in comparison to those produced by the LSTM model. To better understand these differences, the forecast directions were compared with actual data for the first half of 2025. The analysis showed that the real trend of increasing PV installations from January to June was consistent with the LSTM-based forecast and aligned with both model outputs and intuitive expectations. However, the MLP-based predictions substantially overestimated the actual number of installations, further emphasizing the limitations of the feedforward architecture in modeling temporal dynamics.
Analogously to the forecasting of the number of PV installations, predictions of the average installed capacity of PV systems were generated for the same period using MLP (Multilayer Perceptron) networks. A summary of the results is presented in Table 8.
The analysis of forecasts for the average capacity of a single photovoltaic installation shows that, regardless of model configuration, the predicted values generally range between 9.5 and 10.3 kW. The differences between models are more subtle than those observed for the number of installations, although notable discrepancies between MLP and LSTM are still present.
All MLP configurations produced highly consistent forecasts. Most predicted values fall within the 9.5–10.3 kW range. The highest forecasts were generated by models with nonlinear output activation functions, such as Tanh → Logistic (up to 10.32 kW in February) and Exp. → Exp. (up to 10.31 kW in February), possibly indicating a greater sensitivity to local maxima. In contrast, configurations with linear activation functions (e.g., Linear → Linear, Linear → Exp.) showed greater stability and produced lower forecast values. For example, the Linear → Linear configuration remained within the range of 9.42–10.05 kW.
The LSTM model, as was the case for forecasting the number of installations, produced different forecasts in this scenario as well, although not necessarily lower. In the early months of the year, LSTM predictions were noticeably lower (e.g., 9.32 kW in January), while in May and June, the predicted values were higher than those of most MLP models (10.07 kW and 9.87 kW, respectively).
The analysis of validation results showed that the best-performing MLP configuration was Linear (hidden) → Tanh (output), achieving an R2 of 0.765. This suggests that the combination was most effective in capturing the structural relationships in the data, while providing a nonlinear output mapping without the range saturation commonly associated with exponential or logistic activation functions.
Following this configuration, the next best-performing models were Exponential → Exponential (R2 = 0.690), Tanh → Logistic (R2 = 0.689), and Linear → Exponential (R2 = 0.687). Despite its simplicity, the Linear → Linear configuration achieved a validation score of 0.668, which may indicate its limited ability to model nonlinear dependencies present in the data.
For comparison, the LSTM model yielded an R2 of 0.631 in this forecasting task. This result suggests that the underlying nonlinear relationships were difficult to fully capture in both MLP and LSTM architectures, possibly due to the inherent variability or limited volume of training data.
For clarity, a comparative summary of the performance of the LSTM and baseline MLP models is presented in Table 9, which shows both accuracy and computational efficiency aspects.
Table 9 presents a comparative summary of the predictive performance of the LSTM and MLP baseline models. For forecasting the number of installations, the LSTM achieved the highest accuracy (R2 = 0.973, MAPE = 4.41%), significantly outperforming the MLPs. For average installed capacity, the MLPs achieved slightly higher R2 (up to 0.765), although the LSTM maintained a very low percentage error (MAPE = 2.98%). In terms of computational efficiency, the LSTM model required longer training time due to its sequential architecture, but thanks to the applied computing infrastructure and the EarlyStopping mechanism, training was still performed efficiently and within a reasonable timeframe.

4. Discussion

Forecasting in the renewable energy sector, and particularly in the photovoltaic market, is widely recognized as a key tool for optimizing operational efficiency, planning infrastructure development, and supporting decision-making in energy policy. The dynamic growth of installed PV capacity, driven by declining module costs, support programs, and the ongoing decentralization of energy production, has generated a growing demand for advanced forecasting methods capable of capturing complex temporal patterns and market variability.
Machine learning methods, especially recurrent neural networks (RNNs) with a long short-term memory architecture, are increasingly applied in energy-related forecasting due to their ability to capture seasonality and long-term dependencies in time series data. Numerous studies have shown the superiority of LSTM models over traditional statistical methods and feedforward networks in tasks such as forecasting energy demand, PV generation, and peak power. In particular, hybrid LSTM approaches that integrate signal decomposition or additional exogenous data (e.g., meteorological variables) have proven effective in significantly reducing forecast errors.
Beyond predicting energy generation, recent literature has increasingly explored the application of ML to market-level indicators, such as the number of new PV installations, their average capacity, and investment trends. These applications are particularly relevant in markets characterized by strong seasonal effects and demand shaped by public policy instruments, as in the case of the Polish prosumer segment. The use of actual sales and installation data enables the creation of high-value forecasts that can support both business strategies and the design of support mechanisms.
Despite their advantages, forecasting models in the PV domain face limitations related to data availability and quality. Access to large, high-resolution, and accurately labeled datasets is often restricted due to commercial confidentiality, which limits broad empirical validation. Therefore, studies that leverage proprietary market data from operating enterprises, such as the present work, are of particular value, as they allow for testing advanced algorithms under real-world conditions and generating forecasts with direct implementation potential.
It is worth emphasizing that the obtained results can also be referred to the Polish Energy Policy until 2040 (PEP2040), which sets a target of approximately 23–25 GW of installed RES capacity by 2030 and foresees an increase in the renewable share in the energy mix to around 32%. In more ambitious scenarios, up to 45 GW of solar PV capacity could be reached by 2040. Data from the Institute for Renewable Energy further indicate that by the end of 2024, Poland had already achieved nearly 21 GW of installed PV capacity, with around 4 GW added in that year alone [33]. Although our forecasts focus on the number of completed micro-installations and their average unit capacity, they clearly demonstrate that the development of RES is highly dynamic and represents the leading trend in the Polish energy market. Our forecasts confirm this dynamic: the observed upward trends are consistent with market development strategies but reflect a unique, company-level perspective that reveals prosumer activity and real market demand. Compared to national documents, which refer to total installed capacity and energy production, our approach provides practical insights for sales planning, logistics, and supply management in the installation sector.
The results obtained in this study confirm the high effectiveness of the LSTM model in short-term forecasting of both the number of PV installations and the average capacity of individual systems. For installation counts over the January–June 2025 horizon, the model achieved RMSE = 14.84, MAE = 11.93, MAPE = 4.41%, and R2 = 0.973. Such low error levels indicate that the average deviation from actual values remained below 5% in relative terms, providing a strong argument for the model’s usefulness in sales planning, logistics, and resource management. For average installation capacity, the model produced RMSE = 0.34, MAE = 0.28, and MAPE = 2.98%, with R2 = 0.631. While the relative accuracy is high, the lower R2 suggests greater variability in this parameter, likely arising from investor-specific decisions, local technical conditions, or differences in product offerings.
When compared with MLP models, the LSTM architecture demonstrated a clear advantage in forecasting installation counts, with an R2 difference of approximately 14 percentage points (0.973 vs. 0.832 for the best-performing MLP). This confirms that recurrent neural networks more effectively capture the dynamics of markets characterized by seasonality and delayed demand responses. In the case of average capacity forecasts, the LSTM’s advantage was less pronounced, and it was outperformed by the best MLP configuration (0.631 vs. 0.765), suggesting that in this scenario, the inclusion of additional exogenous predictors would be beneficial.
It must be noted that the dataset covers only two years (2023–2024), which restricts the generalization of the results to longer-term horizons. This limitation is due to the introduction of a new CRM system in the company that provided the data, which made consistent records available only for this period. To address this constraint, the forecasts were deliberately restricted to a six-month horizon to ensure robustness. Future studies based on extended datasets will allow more reliable long-term modeling and validation under evolving market and regulatory conditions. The relatively short time span also had methodological consequences. In particular, the LSTM model was not exposed to a sufficient variety of long-term seasonal cycles or structural changes in the PV market. As a result, the forecasts should be interpreted as robust only within a short horizon and under stable market conditions. Nevertheless, the sequential architecture of LSTM enabled the model to effectively capture intra-annual seasonality and short-term fluctuations, which was the main objective of this study.
This empirical validation on proprietary, large-scale business data strengthens the contribution of the study. While the superiority of LSTM over classical models has been noted in energy production forecasting, our results provide novel evidence in the context of market demand forecasting, thus filling a gap in the literature and confirming the practical value of sequential models for enterprise-level decision support.
Trend analysis indicates that the LSTM accurately reproduced the increasing volume of installations during the forecast period (from 154 in January to 224 in June 2025), consistent with the historical growth trajectory of the PV market in Poland. At the same time, the forecasted average capacity remained within the range of 9.3–10.1 kW and did not directly correlate with the number of installations. For example, in June, when the number of installations was highest, the average capacity declined to 9.87 kW, likely due to a higher share of smaller prosumer systems.
These findings are consistent with earlier studies that highlight the advantages of LSTM in modeling sequential energy phenomena, as well as with research emphasizing the importance of real-world data for generating forecasts with high implementation value.
From the perspective of energy policy and system management, the ability to forecast both installation numbers and capacities can support distribution system operators in grid capacity planning and assist policymakers in designing support programs and anticipating seasonal demand fluctuations, especially when generalized to other entities operating in the same market.
Beyond accuracy metrics, the superior performance of the LSTM compared to the MLP can be explained by its ability to capture temporal dependencies, seasonality, and anomalies. LSTM retains information across multiple time steps through memory cells, while MLP treats input vectors independently. As a result, LSTM more effectively exploited intra-annual seasonal patterns (supported by sine–cosine month encodings) and provided robustness against short-term irregularities, whereas MLP tended to overfit such fluctuations. These theoretical advantages translated into lower forecast errors and highlight the practical relevance of LSTM for short-horizon PV demand forecasting.
For future research, it would be appropriate to extend LSTM models with additional input variables, such as weather forecasts, energy prices, or demographic data, and to apply hybrid approaches that combine recurrent networks with probabilistic models to quantify forecast uncertainty. In practical terms, a similar methodology could be adapted to forecast sales of complementary products, such as energy storage systems or heat pumps, thereby creating integrated predictive tools for the entire distributed energy ecosystem, or on a narrower scale for the needs of an individual enterprise.
The study also has certain limitations that need to be acknowledged. The dataset covers only 24 months, which may restrict the generalizability of the results, as longer time series are often required to capture structural changes, regulatory shifts, or different phases of market development. While the obtained results confirm the usefulness of LSTM models in short-term forecasting of PV installation demand, extending the dataset in future research would provide a more comprehensive representation of long-term market dynamics.
Another limitation is that the analysis was restricted to point forecasts, which, although informative, do not account for the uncertainty inherent in forecasting. In the literature, probabilistic approaches based on prediction intervals—such as in [34]—have been shown to better capture variability and risk. Building on these insights, further research will be directed toward integrating uncertainty modeling into the forecasting framework, which could improve the robustness and decision-making value of the results.
Taking the above facts, opinions, and results into account, the conducted study demonstrates that forecasting the number of completed photovoltaic micro-installations and their average unit capacity represents a novel and valuable approach, clearly differing from the dominant analyses in the literature, which primarily focus on forecasting energy production. The analysis was based on a unique, confidential company dataset covering more than 12,000 micro-installations in Poland, which made it possible to capture real market demand and prosumer activity. The results clearly indicate the superiority of sequential LSTM models over classical MLP networks, confirming the higher effectiveness of deep learning methods in handling time series describing the development of the PV market. The obtained forecasts can be directly applied in the practice of installation companies—particularly in sales planning, logistics, and resource management—by providing information that supports decision-making processes. Importantly, these forecasts remain consistent with national renewable energy development trends while complementing them with a practical and business-oriented dimension, which is crucial for the further growth of the photovoltaic sector in Poland.

Author Contributions

Conceptualization, A.Z. and R.J.; methodology, A.Z. and R.J.; software, A.Z. and R.J.; validation, A.Z. and R.J.; formal analysis, A.Z. and R.J.; investigation, A.Z. and R.J.; resources, A.Z. and R.J.; data curation, A.Z. and R.J.; writing—original draft preparation, A.Z. and R.J.; writing—review and editing, A.Z. and R.J.; visualization, A.Z. and R.J.; supervision, A.Z. and R.J.; project administration, A.Z. and R.J.; funding acquisition, A.Z. and R.J. All authors have read and agreed to the published version of the manuscript.

Funding

The APC was funded under subvention funds for the Faculty of Management and by the program “Excellence Initiative–Research University” for the AGH University of Krakow.

Data Availability Statement

The data presented in this study are only available upon request from the corresponding author due to restrictions resulting from the signed confidentiality agreements. The data are not publicly available due to the sensitive nature of the collected information, which is protected by the non-disclosure agreement signed between the parties.

Conflicts of Interest

The authors declare no conflict of interest.

Appendix A

LSTM Training and Hyperparameters
Although the main text of the article only mentioned that the forecasting model was based on an LSTM architecture, for reproducibility, we now provide the details of model training and hyperparameter tuning. The LSTM model was designed to forecast two monthly indicators: the number of new installations and the average installed capacity. The input data included historical time series observations, complemented by calendar features encoded using the sine–cosine transformation of the month. The network architecture consisted of LSTM layers followed by a final dense layer with two linear output neurons corresponding to the predicted variables.
Hyperparameter tuning was carried out using an expanding-window cross-validation scheme, which is suitable for time series data as it reflects the realistic scenario of forecasting the future based on the past. In successive folds, the training set was gradually expanded with additional observations, while validation was performed on later months. Each configuration was trained with the EarlyStopping mechanism, monitoring the mean squared error (MSE) on the validation set. The maximum number of epochs was set to 200; however, due to early stopping, the actual training usually terminated earlier.
The ranges of tested hyperparameters included input sequence length (3–24 months), number of LSTM units (8–64), dropout value (0–0.3), Adam (Adaptive Moment Estimation) learning rate (0.0001–0.001), L2 regularization strength (0–0.0001), and batch size (1–16).
Based on the validation results, the final model was configured as follows: one or two hidden LSTM layers with 64 units each and tanh activation, with sigmoid gates; Adam optimizer with learning rate = 0.001; batch size = 32; maximum number of epochs = 200; loss function = MSE. Thanks to early stopping, training typically terminated before reaching the maximum epoch count, which prevented overfitting.
The final model was retrained on the full training–validation set and evaluated on the test set. To assess the quality of forecasts, RMSE, MAE, MAPE, and R2 metrics were calculated, providing a comprehensive evaluation of both accuracy and stability.
Based on the tuning process, the final model used an input sequence length of 12 months, one LSTM layer with 16 units (tanh activation), and a Dense output layer with two linear neurons. No dropout or L2 regularization was applied. The model was trained with the Adam optimizer (learning rate = 0.001), batch size = 1, for up to 200 epochs with EarlyStopping (patience = 5, monitoring training MSE). The loss function was MSE. Forecasts were generated recursively for six months ahead.

References

  1. APS News. A Publication of the American Physical Society; APA: College Park, MD, USA, 2009; Volume 18. [Google Scholar]
  2. U.S. Department of Energy. Solar Energy Technologies Office. Solar Energy Research Area. Photovoltaics. Available online: https://www.energy.gov/eere/solar/photovoltaics (accessed on 30 July 2025).
  3. BP. Statistical Review of World Energy; BP: London, UK, 2014; Available online: https://www.bp.com (accessed on 6 March 2015).
  4. Instytut Energetyki Odnawialnej. Rynek Fotowoltaiki w Polsce 2024; IEO: Warszawa, Poland, 2024; Available online: https://ieo.pl/raporty (accessed on 30 July 2025).
  5. International Renewable Energy Agency (IRENA). Renewable Capacity Statistics 2025; IRENA: Abu Dhabi, United Arab Emirates, 2025; ISBN 978-92-9260-652-7. Available online: https://www.irena.org/Publications/2025/Mar/Renewable-capacity-statistics-2025 (accessed on 30 July 2025).
  6. Polska Fotowoltaika Nadal Się Prężnie Rozwija. Magazyn Ciepła Systemowego. Available online: https://magazyncieplasystemowego.pl/rynek/polska-fotowoltaika-nadal-sie-preznie-rozwija/?utm_source=chatgpt.com (accessed on 30 July 2025).
  7. Zielińska, A. Possibilities of Using Blockchain Technology in the Area of Electricity Trade Settlements. Przegląd Elektrotechniczny 2021, 97, 32. [Google Scholar] [CrossRef]
  8. Li, Q.; Zhang, X.; Ma, T.; Jiao, C.; Wang, H.; Hu, W. A Multi-Step Ahead Photovoltaic Power Prediction Model Based on Similar Day, Enhanced Colliding Bodies Optimization, Variational Mode Decomposition, and Deep Extreme Learning Machine. Energy 2021, 224, 120094. [Google Scholar] [CrossRef]
  9. Zhao, W.; Zhang, H.; Zheng, J.; Dai, Y.; Huang, L.; Shang, W.; Liang, Y. A Point Prediction Method Based on Automatic Machine Learning for Day-Ahead Power Output of Multi-Region Photovoltaic Plants. Energy 2021, 223, 120026. [Google Scholar] [CrossRef]
  10. Li, P.; Zhou, K.; Lu, X.; Yang, S. A Hybrid Deep Learning Model for Short-Term PV Power Forecasting. Appl. Energy 2020, 259, 114216. [Google Scholar] [CrossRef]
  11. Zhou, S.; Zhou, L.; Mao, M.; Xi, X. Transfer Learning for Photovoltaic Power Forecasting with Long Short-Term Memory Neural Network. In Proceedings of the 2020 IEEE International Conference on Big Data and Smart Computing (BigComp 2020), Busan, Republic of Korea, 19–22 February 2020; pp. 125–132. [Google Scholar]
  12. Huang, Q.; Wei, S. Improved Quantile Convolutional Neural Network with Two-Stage Training for Daily-Ahead Probabilistic Forecasting of Photovoltaic Power. Energy Convers. Manag. 2020, 220, 113085. [Google Scholar] [CrossRef]
  13. Najibi, F.; Apostolopoulou, D.; Alonso, E. Enhanced Performance Gaussian Process Regression for Probabilistic Short-Term Solar Output Forecast. Int. J. Electr. Power Energy Syst. 2021, 130, 106916. [Google Scholar] [CrossRef]
  14. du Plessis, A.A.; Strauss, J.M.; Rix, A.J. Short-Term Solar Power Forecasting: Investigating the Ability of Deep Learning Models to Capture Low-Level Utility-Scale Photovoltaic System Behaviour. Appl. Energy 2021, 285, 116395. [Google Scholar] [CrossRef]
  15. Chang, X.; Li, W.; Zomaya, A.Y. A Lightweight Short-Term Photovoltaic Power Prediction for Edge Computing. IEEE Trans. Green Commun. Netw. 2020, 4, 946–955. [Google Scholar] [CrossRef]
  16. Ali, M.U.; Khan, H.F.; Masud, M.; Kallu, K.D.; Zafar, A. A Machine Learning Framework to Identify the Hotspot in Photovoltaic Module Using Infrared Thermography. Sol. Energy 2020, 208, 643–651. [Google Scholar] [CrossRef]
  17. Veerasamy, V.; Wahab, N.I.A.; Othman, M.L.; Padmanaban, S.; Sekar, K.; Ramachandran, R.; Hizam, H.; Vinayagam, A.; Islam, M.Z. LSTM Recurrent Neural Network Classifier for High Impedance Fault Detection in Solar PV Integrated Power System. IEEE Access 2021, 9, 32672–32687. [Google Scholar] [CrossRef]
  18. Aziz, F.; Ul Haq, A.; Ahmad, S.; Mahmoud, Y.; Jalal, M.; Ali, U. A Novel Convolutional Neural Network-Based Approach for Fault Classification in Photovoltaic Arrays. IEEE Access 2020, 8, 41889–41904. [Google Scholar] [CrossRef]
  19. Zhao, Y.; Liu, Q.; Li, D.; Kang, D.; Lv, Q.; Shang, L. Hierarchical anomaly detection and multimodal classification in large-scale photovoltaic systems. IEEE Trans. Sustain. Energy 2019, 10, 1351–1361. [Google Scholar] [CrossRef]
  20. Tina, G.M.; Ventura, C.; Ferlito, S.; De Vito, S. A State-of-the-Art Review on Machine-Learning Based Methods for PV. Appl. Sci. 2021, 11, 7550. [Google Scholar] [CrossRef]
  21. Bernal Lara, I.I.; Gómez Gómez, O.L.; Núñez Bravo, A.Y.; Hernández Guerrero, I.A.; Rosas, R.M. Probabilistic Demand Forecasting in the Southeast Region of the Mexican Power System Using Machine Learning Methods. Forecasting 2025, 7, 39. [Google Scholar] [CrossRef]
  22. Palaniyappan, B.; Mohideen, S.K.; Arul, R.; Gnanasekaran, T. Optimized LSTM-Based Electric Power Consumption Forecasting for Dynamic Electricity Pricing in Demand Response Scheme of Smart Grid. Energy Rep. 2025, 11, 3542–3555. [Google Scholar] [CrossRef]
  23. Graves, A.; Mohamed, A.-R.; Hinton, G. Speech Recognition with Deep Recurrent Neural Networks. In Proceedings of the 2013 IEEE International Conference on Acoustics, Speech and Signal Processing (ICASSP), Vancouver, BC, Canada, 26–31 May 2013; pp. 6645–6649. [Google Scholar] [CrossRef]
  24. Greff, K.; Srivastava, R.K.; Koutník, J.; Steunebrink, B.R.; Schmidhuber, J. LSTM: A Search Space Odyssey. IEEE Trans. Neural Netw. Learn. Syst. 2017, 28, 2222–2232. [Google Scholar] [CrossRef]
  25. Yu, Y.; Si, X.; Hu, C.; Zhang, J. A Review of Recurrent Neural Networks: LSTM Cells and Network Architectures. Neural Comput. 2019, 31, 1235–1270. [Google Scholar] [CrossRef] [PubMed]
  26. Hochreiter, S.; Schmidhuber, J. Long Short-Term Memory. Neural Comput. 1997, 9, 1735–1780. [Google Scholar] [CrossRef] [PubMed]
  27. Ioannou, K.; Karasmanaki, E.; Sfiri, D.; Galatsidas, S.; Tsantopoulos, G. A Machine Learning Approach for Investment Analysis in Renewable Energy Sources: A Case Study in Photovoltaic Farms. Energies 2023, 16, 7735. [Google Scholar] [CrossRef]
  28. Izanloo, M.; Aslani, A.; Zahedi, R. Development of a Machine Learning Assessment Method for Renewable Energy Investment Decision Making. Appl. Energy 2022, 327, 120096. [Google Scholar] [CrossRef]
  29. Marino, D.L.; Amarasinghe, K.; Manic, M. Building Energy Load Forecasting Using Deep Neural Networks. In Proceedings of the IECON 2016–42nd Annual Conference of the IEEE Industrial Electronics Society, Florence, Italy, 23–26 October 2016; pp. 7046–7051. [Google Scholar] [CrossRef]
  30. Merma Yucra, J.P.P.; Cerezo Quina, D.J.; Echaiz Espinoza, G.A.; Valderrama Solis, M.A.; Yanyachi Aco Cardenas, D.D.; Ortiz Salazar, A. Design and Implementation of an LSTM Model with Embeddings on MCUs for Prediction of Meteorological Variables. Sensors 2025, 25, 3601. [Google Scholar] [CrossRef] [PubMed]
  31. Abumohsen, M.; Owda, A.Y.; Owda, M. Electrical Load Forecasting Using LSTM, GRU, and RNN Algorithms. Energies 2023, 16, 2283. [Google Scholar] [CrossRef]
  32. Salamanis, A.; Xanthopoulou, G.; Kehagias, D.; Tzovaras, D. LSTM-Based Deep Learning Models for Long-Term Tourism Demand Forecasting. Electronics 2022, 11, 3681. [Google Scholar] [CrossRef]
  33. Ministerstwo Klimatu i Środowiska. Polityka Energetyczna Polski do 2040 r. (PEP2040); Ministerstwo Klimatu i Środowiska: Warszawa, Poland, 2021. Available online: https://www.gov.pl/web/klimat/polityka-energetyczna-polski-do-2040-r-pep2040 (accessed on 1 September 2025).
  34. Qu, K.; Si, G.; Wang, Q.; Xu, M.; Shan, Z. Improving Economic Operation of a Microgrid Through Expert Behaviors and Prediction Intervals. Appl. Energy 2025, 383, 125391. [Google Scholar] [CrossRef]
Figure 1. Installed photovoltaic capacities in the EU at the end of 2023 [MW] [4].
Energies 18 04998 g001
Figure 2. Cumulative installed photovoltaic power capacity in Poland as of May 2024 [4].
Energies 18 04998 g002
Figure 3. Installed photovoltaic power capacity structure in Q1 2024 [4].
Energies 18 04998 g003
Figure 4. Number of photovoltaic installations sold in 2023–2024.
Energies 18 04998 g004
Figure 5. Total capacity of photovoltaic installations sold in 2023–2024.
Energies 18 04998 g005
Figure 6. Average capacity of photovoltaic installations sold in 2023–2024.
Energies 18 04998 g006
Figure 7. Methodological workflow of the study. The diagram illustrates the sequential steps: data collection (PV and meteorological data), preprocessing, chronological dataset splitting, model training (LSTM and MLP), validation using expanding-window and EarlyStopping, and final forecasting with evaluation metrics (RMSE, MAE, MAPE, and R2).
Energies 18 04998 g007
Figure 8. Forecasted number of photovoltaic installations sold.
Energies 18 04998 g008
Figure 9. Forecasted average capacity of photovoltaic installations sold in the period January–June 2025.
Energies 18 04998 g009
Figure 10. Training loss (mean squared error, MSE) over epochs for the LSTM model.
Energies 18 04998 g010
Figure 11. Distribution of forecast errors for the number of PV installations.
Energies 18 04998 g011
Figure 12. Distribution of forecast errors for the average capacity of PV installations.
Energies 18 04998 g012
Table 1. Selected studies on the use of AI in energy forecasting.
ReferencesTask/Target VariableData (Scope, Source)Method/ArchitectureHorizon and ResolutionKey Results/Novelty
[8]PV power forecastingPV generation data + signal decompositionDELM + ECBO-VMD15 min–4 hFaster training than classical DL; improved accuracy
[9]Day-ahead PV power forecasting for multiple farmsData from different regions (Japan)AutoML (ElasticNet, GBM, RF) + GA1 day aheadRobustness with limited historical data
[10]Short-term PV power forecastingPV power dataLSTM + Wavelet PacketShort horizonCombining local and global temporal features
[21]Probabilistic demand forecastingData from the Southeast region of MexicoML + bootstrap (hybrid approach)Short- and medium-termAccurate point forecasts and reliable intervals
[22]Consumption forecasting for dynamic pricing and DRConsumption data in the smart gridOptimized LSTMShort-/medium-termError reduction vs. classical models; supports dynamic tariffs
This StudyMarket demand forecasting: installations and average unit capacityConfidential company data (Poland), 24 months, 12,291 micro-installations; monthly aggregationLSTM (compared with MLP)6-month horizon; monthly dataMAPE: 4.41% (installations), 2.98% (capacity); R2: 0.973 and 0.631; real data; application
Table 2. Characteristics of photovoltaic installations by region.
(ZIP Prefix)Number of InstallationsTotal Capacity (kW)
07128342.32
17007340.24
25895844.08
3128513,420.59
4212120,074.77
5170816,076.45
6155716,309.75
79839155.88
8190119,084.94
97357482.56
Table 3. Monthly forecast of the number of photovoltaic (PV) installations for the first half of 2025.
Forecast PeriodForecasted Number of PV Installations
2025-01154
2025-02180
2025-03201
2025-04211
2025-05215
2025-06224
Table 4. Summary of forecast performance metrics.
MetricValue
RMSE14.843
MAE11.931
MAPE (%)4.406
R20.973
Table 5. Forecasted average installed capacity of photovoltaic (PV) systems for the period January–June 2025.
Forecast PeriodForecasted Mean PV System Capacity (kW)
2025-019.32
2025-029.43
2025-039.69
2025-049.99
2025-0510.07
2025-069.87
Table 6. Summary of forecast performance metrics for average PV installation capacity.
MetricValue
RMSE0.340
MAE0.285
MAPE (%)2.977
R20.631
Table 7. Forecast of the number of photovoltaic (PV) installations using MLP models.
Forecast PeriodMLP (Linear → Exp.)MLP (Tanh →
Logistic)
MLP (Exp. → Exp.)MLP (Linear → Tanh)MLP (Linear → Linear)LSTM
2025-01327326317335379154
2025-02345335357356395180
2025-03339339338352395201
2025-04328337310341389211
2025-05309317255313369215
2025-06293299215286347224
Table 8. Forecasted average power of PV installations [kW] for different model configurations (January–June 2025).
Forecast PeriodMLP (Linear → Exp.)MLP (Tanh →
Logistic)
MLP (Exp. → Exp.)MLP (Linear → Tanh)MLP (Linear → Linear)LSTM
2025-019.8410.0810.149.819.899.32
2025-029.8810.3210.319.9510.059.43
2025-039.8610.2610.229.889.969.69
2025-049.8410.1210.099.779.859.99
2025-059.809.819.809.569.6310.07
2025-069.779.629.539.379.429.87
Table 9. Comparative performance of LSTM and MLP baseline models in forecasting PV installation counts and average installed capacity.
ModelForecasting TargetR2MAPE (%)Notes
LSTMInstallation counts0.9734.41Higher accuracy, but more computationally expensive
MLP (best)Installation counts0.832-Simpler, faster training
LSTMAverage capacity0.6312.98Competitive, low relative error
MLP (best)Average capacity0.765-Slightly better fit (R2)
Disclaimer/Publisher’s Note: The statements, opinions and data contained in all publications are solely those of the individual author(s) and contributor(s) and not of MDPI and/or the editor(s). MDPI and/or the editor(s) disclaim responsibility for any injury to people or property resulting from any ideas, methods, instructions or products referred to in the content.