Article

Comparative Evaluation of Performance Parameters of Conventional and Waste Fuels for Diesel Engines Towards Sustainable Transport

1
Faculty of Mechanical Engineering, Bialystok University of Technology, 45 Wiejska Str., 15-351 Bialystok, Poland
2
Faculty of Mechanical Engineering and Aeronautics, Rzeszow University of Technology, 12 Powstancow Warszawy Str., 35-959 Rzeszow, Poland
3
Faculty of Mechanical Engineering, Lublin University of Technology, 36 Nadbystrzycka Str., 20-618 Lublin, Poland
*
Author to whom correspondence should be addressed.
Energies 2025, 18(19), 5081; https://doi.org/10.3390/en18195081
Submission received: 22 August 2025 / Revised: 11 September 2025 / Accepted: 22 September 2025 / Published: 24 September 2025

Abstract

Sustainable development and growing energy demand require the search for alternative fuels, especially for heavy transport. The study compared diesel fuel (DF), hydrogenated vegetable oil (HVO) and fuels from the pyrolysis of polypropylene (PPO), polystyrene (PSO) and car tyres (TPO). The lowest cold filter plugging point values were obtained for HVO (−38 °C) and PSO (−29 °C). TPO and DF were in the moderate range, while PPO achieved the worst result (−10 °C). Only DF met the EN 590 standard requirements for density at 15 °C (0.820–0.845) g/cm3. HVO and PPO were approx. 5% below the lower limit, while PSO and TPO exceeded the upper limit. All samples except PPO, which was below the lower limit, met the kinematic viscosity requirement according to the same standard at 40 °C (2.0–4.5) mm2/s. Based on a series of tribological tests, it was found that DF (400 µm) had the lowest lubricity expressed by the WSD index, while PSO (246 µm) had the highest. All samples tested met the requirements of EN 590, ASTM D975 and the Worldwide Fuel Charter in this respect. The results provide valuable information for engine technology, enabling more accurate durability predictions and fuel mixture optimization.

1. Introduction

Since the widespread use of combustion engine vehicles began in 1950 [1], environmental concerns have led to successive waves of legal regulations. The first were the American air pollution regulations of 1970 [2]. Despite numerous modifications, global road transport still accounts for approximately 12% of total CO2 emissions [3], which directly influences climate policy [4] through international regulations on greenhouse gases [5], the Fit-for-55 package [6] and the EU Green Deal [7]. At the same time, technological and behavioral solutions have been introduced, such transition road transport to cleaner modes, predominantly electric or hydrogen [8], improved combustion and exhaust systems [2,9], start & stop systems [10], “free-wheeling” [11], car sharing and eco-driving [12,13], which, however, are not sufficient to achieve climate targets [14]. Although electrification, especially the implementation of BEVs and PHEVs, as exemplified by Norway [15], is progressing, combustion engines still dominate transport, particularly in heavy-duty applications, where their share of energy consumption is expected to increase to 50% by 2040 [16]. With the increase in demand for diesel and the stagnation of oil production, the market share of liquid alternative fuels is expected to increase to 15% by 2040 [17], but this will only partially meet the growing demand for energy [18]. This highlights the inadequacy of current strategies to achieve the sustainable development goals set out in the Paris Agreement [19].
In recent years, a novel fuel, hydrotreated vegetable oil (HVO), has emerged in the liquid fuel market for diesel engines, complementing diesel fuel (DF). This fuel is increasingly available in distribution networks of selected concerns. Although HVO was previously in the process of gaining technology readiness levels (TRLs), it has now attained commercial fuel status. Depending on the specific production process, the HVO is characterised by low energy density [20]. Numerous studies on this fuel have substantiated its applicability [21]. The energy density of HVO was 5% lower than that of DF; however, its higher cetane number altered the combustion process. Consequently, this improves cold starting, ensures lower noise levels, and reduces engine emissions [22]. Another well-established fuel that can be produced from vegetable oil, similar to HVO, is fatty acid methyl ester (FAME). These were obtained through transesterification of oil using methanol. Nevertheless, this fuel exhibits inferior performance compared to that of HVO relative to DF. Both FAME and HVO are classified as second-generation fuels and thus do not compete with food production [23]. An alternative application in diesel engines involves the use of pure vegetable oil (PVO) [24]. However, this fuel is closely associated with the food and food processing industries. The PVO demonstrates implementation potential and has been successfully tested in agricultural applications [25]. Notable disadvantages of PVO include its phosphorus content and low resistance to low temperatures.
As previously discussed, the increasing demand for diesel fuels conflicts with global decarbonisation legislation. Consequently, significant expectations are placed on the utilisation of fuels derived from waste [26]. For application in diesel engines, fuels primarily obtained from plastics and tyres have garnered increased attention. Their production employs pyrolysis [27], wherein conversion efficiencies exceeding 90% can be achieved using an appropriate process configuration [28]. The most prevalent plastics in this domain are high-density polyethylene (HDPE), low-density polyethylene (LDPE), polypropylene (PP) and polystyrene (PS) [29]. Although fuels produced from plastics and tyres exhibit lower energy performance, higher emissions, and elevated aromatic hydrocarbon content [28,30], they compare favourably when juxtaposed with greenhouse gases through a closed-loop economy [31]. The fuel obtained through this method is not extracted in the same manner as conventional fuels; however, the combustion process itself has a detrimental effect on environmental exergy [32]. The widespread use of such fuels is invariably associated with the necessity to meet numerous legislative standards [33].
At present, the potential fuels for use in diesel engines, in addition to DF, FAME, and HVO, include oils derived from waste, primarily plastics and tyres, such as PPO, PSO, and TPO. The primary challenge associated with waste-derived fuels is the variability in manufacturing processes, which significantly influences their properties. Of considerable importance is the presence of additives that affect the functional qualities of plastic products, which may subsequently be present in the oil-containing fuel. Regarding the performance parameters of these fuels, it has been observed that the majority of scientific studies have focused on energy and emission factors. There is a paucity of comprehensive studies analysing the performance parameters of fuels in relation to processes in the working systems of engines. These include the fuel pumping process and the lubrication properties (tribology). The energy properties and emissivity can represent the engine’s potential, pumping ability, and tribology, which are indicative of engine longevity. Parameters related to the cold filter plugging temperature, density, viscosity, and lubricity should be considered the most critical from an operational perspective. The determination of these parameters predominantly involves standard procedures, although not all legislations strictly apply to fuels. A significant aspect in this regard is the stability of waste fuels, which necessitates long-term research.
Determination of the cold filter plugging point (CFPP) is a critical factor for engine operation at low temperatures. Laboratory tests of engines fuelled with various fuels have predominantly been conducted in environments with positive temperatures exceeding 20 °C. Legislation on CFPP categorises fuels into DF and FAME [34]. Consequently, the configuration of fuel blends, particularly those containing waste oils, is challenging. Both DF and HVO exhibited CFPP temperatures that were in compliance with legislation, with HVO demonstrating lower temperatures [35]. In [36], a synthetic fuel derived from the pyrolysis of plastics, referred to as Cyn-diesel, was examined. The results indicate that mixing DF with Cyn-diesel lowered the CFPP temperature. Furthermore, blending DF with up to 40% Cyn-diesel met the specifications of EN 590 [34]. However, certain plastic pyrolysis oils (PCPW and PWPW) met most of the automotive standards after distillation in the DF range, with the exception of the cold filter plugging point [37]. The literature frequently reports a tendency to mix multiple fuels and oils, thus creating compositions that are energy or emission-compatible with DF. In [38], a three-component blend of DF, PVO, and TPO was evaluated, revealing that the addition of TPO improved CFPP, thus mitigating the effect of PVO’s proportion of PVO in the blend. Pure vegetable oils (PVOs) were predominantly characterised by CFPP above the standards set for DF and FAME. In contrast, mahua fruit contains 35–40% oil in its kernels. This oil can serve as a viable source of biodiesel and, as demonstrated in [39], meet the temperature requirements of CFPP.
The possible DF density ranges contained in EN 590 provide a basis for comparisons with alternative fuels, both plant-based and diverse wastes. Density directly affects the mass of fuel injected at the same feed pulse adjustments and is often overlooked in analyses in favour of engine energy and emission parameters. Vegetable fats extracted from freshly pressed seeds (PVO) and those extracted from waste can rival FAMEs, although they are characterised by higher density. Subjecting vegetable oil to a hydrotreating process (HVO) achieved most DF parameters with a higher density [35]. This difference was attributed to the presence of the vegetable oils. A similar situation was observed with the gradual addition of diverse vegetable oils (sunflower, rapeseed, soybean, cottonseed, corn, and waste palm oil) to DF. Gradually increasing the volumetric proportion (2–75)% resulted in an increase in the density and viscosity of the mixtures [40]. For fuels (oils) extracted from plastics, it was possible to achieve a density in accordance with the EN-590 standard, but this depended directly on the course of the extraction process. The most common pyrolysis method used for this purpose converts waste to liquid fuel through thermal degradation [41]. A previous study [42] comprehensively reviewed the potential of pyrolysis to convert a plastic waste stream consisting of a mixture of high-density polyethylene (HDPE), low-density polyethylene (LDPE), polypropylene (PP), and polystyrene (PS) into fuel and value-added products (VAPs). Attempts have frequently been made to create blends of various waste oils that can ultimately approach DF in terms of performance. In [43], oils derived from polyethylene terephthalate (PET), PP, HDPE, PS, LDPE, and polyvinyl chloride (PVC) were mixed with distilled Dunlop waste tyre oil (TPO) in various proportions. In addition to the energy analysis of the engine, the density of the resulting mixtures was identified as a significant parameter that determines the mass of fuel delivered to the cylinder under the same feed pulse conditions. The selection of the thermal and catalytic tyre pyrolysis processes resulted in changes in the density of the resulting oil, placing it above the conventional DF [44].
The viscosity of the fuel influences the lubrication of the moving components in the engine’s fuel system, the fuel atomisation process, fuel consumption, and corrosion protection [45]. Insufficient viscosity results in inadequate lubrication and increased engine wear, whereas excessive viscosity impedes oil flow, which also leads to inadequate lubrication [46,47]. Furthermore, viscosity affects the resistance to fuel flow through the power system, potentially increasing the fuel consumption if excessively high. Appropriate viscosity also facilitates the transport of contaminants to the fuel filter, preventing clogging of injectors [48,49]. Common fuel additives, such as depressants, anti-wear agents, corrosion inhibitors, and detergents, can significantly alter their viscosity. Depressants lowered the freezing point of oil, anti-wear agents, and corrosion inhibitors enhanced engine protection, and detergents maintained the cleanliness of internal engine components [50]. These additives improve fuel performance under various operating conditions. Contemporary commercial fuels have been enhanced using a variety of additives to modify their properties and energy efficiency. Two key areas in which the use of additives has been particularly significant are waste recycling and the use of renewable energy sources. The recycling of waste materials such as plastics, rubber, and used oils has enabled efficient management. Additives of vegetable origin, such as vegetable oils, are crucial for the development of renewable energy sources. However, the use of additives is associated with alterations in the properties of the modified fuels, including their viscosity. Numerous studies have reported the viscosities of both commercial [51] and modified liquid fuels [51,52,53,54,55,56]. In [51], the viscosities and densities of various diesel oils were obtained from British refineries at elevated pressures up to 500 MPa and temperatures ranging from 298 K to 373 K. Similar studies on modified diesel fuels containing higher concentrations of paraffin, aromatics, or reduced sulphur were presented in [52]. The authors of [53] determined the kinematic viscosity of several fuel blends (DF–biodiesel–bioethanol) at standard temperatures of 40 °C and 100 °C and assessed its effect on engine performance. The viscosity of fuels obtained by combining bio-oil with other additives has also been the subject of numerous investigations. Blends of DF with sunflower oil [54], fish oil ethyl esters [55], and bio-oil and alcohol [56] have been examined. These studies found that the viscosity of fuels was dependent on the additives used and increased exponentially with increasing pressure and decreasing temperature.
An important feature of each fuel is its effect on the tribological parameters of fuel system components [57]. The increasing requirements for reducing exhaust emissions have necessitated the use of increasingly higher injection pressures. Currently, this value has reached 3000 bar [58]. Maintaining such high values requires high precision in the manufacturing of individual components. This in turn significantly increases production costs [59,60]. Therefore, from an economic perspective, costly repairs must occur as infrequently as possible. The most effective way to achieve long-term trouble-free operation is to reduce friction and, thus, wear [25]. The fuel acts in part as a lubricant in the fuel supply systems of compression-ignition engines. It was introduced between the mating parts to form a lubricating film. The strength of this thin film depends on its properties and decreases as the contact pressure increases. This phenomenon prevents direct contact between parts, which should eliminate dry friction from the system and thus reduce abrasive wear [61,62]. One available method for measuring lubricating film durability is the four-ball contact method implemented on a four-ball rig (FBR) [63]. This method is commonly used to test liquid lubricants [64,65], but, in selected cases, fuels of vegetable origin were also tested [66]. The FBR method has the advantages of short measurement time and high repeatability of results. Standardisation allows for comparative studies of different fuels. Vegetable oil tests [66] demonstrated improved fuel lubricity according to the FBR by adding PVO to the DF. Waste fuels are not a common subject of FBR, ball-on-three seats (BOTSs), ball-on-three discs (BOTDs), or scuffing load ball-on-cylinder lubricity evaluator (SLBOCLE) tests [67]. Fuel lubricity tests were most often carried out using the high-frequency reciprocating rig (HFRR) method, which is dedicated to this in accordance with EN 590. It was observed that a 7% addition of bio-components to DF increased the lubricity relative to the fuel without additives [29]. The study also indicated that PPO provided the best lubricity, which was higher than that provided by DF. PSO and HDPE were located below the DF. The differences between HDPE and PPO amounted to 10%, to the former’s disadvantage, despite the fact that both fuels had carbon distributions in the DF range. A higher kinematic viscosity than DF and sulphur content, which provided a thicker oil film, were cited as the reasons for PPO’s increased lubricity of PPO. Additionally, the alkanes contained in PPO, which have a saturated hydrocarbon structure with only single covalent bonds between carbon atoms, guarantee greater stability and less reactivity than alkenes. This stability allowed the formation of strong boundary layers, which reduced friction and wear [68]. Tests of the coefficient of friction and abrasive wear rate coefficient can be performed using the ball-cratering method. This method was developed to measure the microabrasive wear of samples, including those coated with various coatings [69,70]. As demonstrated in [71,72], a proper design of the experiment allows for qualitative results with a low absolute error. This method has not yet been utilised for the in-service evaluation of engine fuels.
An analysis of the literature reveals a research gap. Numerous studies, such as [29], have evaluated liquid alternative fuels for diesel engines in a selective manner, predominantly focusing on the energy and emission aspects. Fuel performance parameters affecting the durability of the fuel system, and ultimately the entire engine, have been investigated; however, a comprehensive evaluation in this area is lacking. This study aims to address this gap by compiling the performance parameters of DF, HVO, PPO, PSO, and TPO, which appear to be necessary at present. To achieve this objective, it was determined that a range of standard test methods would be employed, some of which have hitherto been unutilised for these fuels.
The scientific contribution of the manuscript will be to add to the state of the art in the area of waste fuels with values and functions describing the variability of their performance. This is essential when converting an engine to run on an alternative fuel of pure waste fuel or mixtures thereof with DF or HVO. Currently, the authors are researching the development of a mixture of waste fuels with HVO, which will ultimately provide not only comparable energy but also operational parameters to DF. The innovative approach proposed in this study, which involves determining trends in changes in selected operating parameters of various fuels as a function of temperature, will form the basis for future analyses of correlations between chemical composition, combustion characteristics and operating properties. This will enable the refinement of criteria that can be applied on an industrial scale.
This study’s research and analysis are part of a widespread trend pertaining to the reduction in the carbon footprint in conjunction with increasing demand for diversified fuels. This issue has been deemed highly significant in the domain of alternative fuels, particularly those derived from waste materials. This aligns with the EC initiatives for a circular economy and attainment of SDGs.

2. Materials and Methods

2.1. Tested Fuels

Two commercial fuels were utilised in this study: diesel fuel (DF) as a reference and hydrotreated vegetable oil (HVO). The study employed oils derived from polypropylene (PPO), polystyrene (PPS), and used car tyres (TPO) as alternatives to these fuels.
The DF was a commercial diesel fuel with 5% added biocomponents procured from ORLEN in Poland. In contrast, HVO, with the commercial designation Neste MY Renewable Diesel, was obtained from the NESTE network in Lithuania.
The PPO and PSO fuels were produced via pyrolysis in a fixed-bed reactor with resistance heaters. The feedstock, in the form of 2 kg pellets, was subjected to rapid thermal decomposition at temperatures of (400–500) °C in an oxygen-free environment without inert gas. The resultant gas-oil mixture was discharged into a condensation system and subsequently condensed. Details of a similar process are described in [28]. The oils used in the study were crude pyrolysis products collected directly from the condenser.
The TPO fuel was produced in an industrial-scale rotary kiln reactor (with a capacity of 8 t). The feedstock, comprising compressed and packaged automobile tyres, was fed intermittently directly into the reactor without preprocessing. The evaporated oil discharged from this process undergoes condensation and two-stage filtration. The details of TPO production are described in [73]. For the four-band distillation process, TPO from two ranges, situated in the middle (220–280) °C and (280–330) °C, were utilised for the study.
Prior to commencing the primary research, it was necessary to determine the fundamental physical and chemical characteristics of the fuels under investigation. In this study, specialised equipment and test methods were employed, the accuracy of which is presented in Table A1. Owing to the extensiveness of the subject matter, a detailed description of the equipment operation and methods for interpreting the results was omitted, as this was not the primary focus of the research. The physical and chemical characteristics of the samples are shown in Table 1.

2.2. Experimental Methodology and Measurement Equipment

To determine the cold filter plugging point (CFPP), an FPP 5Gs apparatus compliant with the EN 116 standard [74] operating in the temperature range of (−95–35) °C with automatic detection of discontinuity in filling the measuring cell with the fluid under examination was utilised. In this assessment, a fuel sample at a specified temperature was drawn into the pipette through a standardised filter under controlled vacuum conditions. The procedure was repeated in 1 °C increments starting from the temperature of the initial determination (15 °C). The tests were iterated until the quantity of compounds emitted in successive temperature reductions caused the fuel under examination to decelerate or cease the flow. The criterion for this was established as either a pipette filling time exceeding 60 s or the failure of the fuel to flow completely back into the test vessel after cooling by 1 °C.
The density was ascertained using the oscillation method with a DMA 4100 M apparatus operating in accordance with the ASTM D4052 standard [75] in the range of (0–3) g/cm3, with a measurement repeatability of 0.00005 g/cm3. The density test employed a pulse excitation method that simultaneously applied corrections to the viscosity of the liquids under examination. The preparation and execution procedures were monitored using an integrated camera within the apparatus. Density tests were conducted at temperatures ranging from (−5–80) °C at intervals of 5 °C.
The dynamic viscosity was studied to reflect the fluid’s resistance to flow under an applied shear stress. For this purpose, a Brookfield DV-II+ Pro rotational viscometer operating in accordance with ISO 2555 [76] was utilised, with a measuring range of (1–4.8 × 10⁶) mPa × s with a repeatability of ±0.2%. During the operation, this apparatus measured the torque required to rotate a spindle immersed in the liquid under test. Torque was evaluated by deforming the spring that transmitted the drive to the spindle. A critical aspect of the measurements was the appropriate selection of the spindle speed in the possible range of (0.01–200) r./min and the type of spindle. Following a series of tests to prevent turbulent flows and vortices, the DIN85 spindle speed was set to 60 r./min. Dynamic viscosity tests were conducted at temperatures of (−5–80) °C in 5 °C increments, for which an ultrathermostat was responsible.
Lubricity tests were conducted utilising two methodologies. The first was the four-ball rig (four-ball rig, FBR) method, employing a T-02 apparatus operating in accordance with ISO 20623 [77] and ASTM D 2783 standards [78]. The apparatus utilised the rotational movement of a steel ball (1/2” diameter) placed on three identical stationary balls that were immersed in the fluid under examination. The 1/2” diameter test balls were fabricated from LH15 bearing steel with a hardness of (62–66) HRC and roughness of Ra = 0.032 µm. The balls were thoroughly degreased before testing. The tests were conducted at approximately 20 °C. Mechanically, the upper ball was set in motion (a constant rotational speed of 1450 r./min) and pressure was applied to the lower balls. The pressure arm could realise the variable required standard load on the balls in the range of (156.91–1961.40) N (values converted to SI). The results of the measurements were the diameters of the scars formed on the three lower balls and the load at which welding occurred. According to the standards indicated, the definition of lubricity in this case was the maximum non-scuffing, scar, and welding loads. Lubricity tests were performed in individual load ranges for each fuel. The lowest load in each case, below which no measurements were made, was the load at which no signs of wear were visible. The highest load limit was the permanent connection (welding) of the balls in the device. The ball-and-test plate method was adopted as the second methodology for evaluating the lubricity. Fuel lubricity tests were performed using an HFRR system from PCS Instruments. The testing conditions were selected according to the guidelines outlined in ISO 12156-1 [79], and the key test parameters are listed in Table A2. The essential components of the testing apparatus, along with a schematic illustrating their interconnections, are provided in the reference standard. These components include a tribological test assembly consisting of a ball and disc, container for the fuel sample, electrically heated block, loading system for the friction assembly, and electromagnetic vibrator for the test ball holder, which generates an oscillating motion with a specified frequency and amplitude. During the measurements, the mechanical system of the apparatus was housed in a chamber where the air temperature and relative humidity were controlled. The control system of the measuring device was connected to a computer using HFRPC software version 2.14. This software was utilised to input the measurement parameters and archive the results. Additionally, the HFRPC software enabled the calculation of the average friction coefficient and average percentage of lubricating film thickness. In this method, an established criterion for fuel lubricity is the wear scar diameter on the test ball of the tribological test assembly. Immediately prior to measurement, the components of this assembly, the test disc and ball, and other elements in contact with the fuel samples were cleaned in toluene and subsequently in acetone using an ultrasonic bath. For all the fuel samples tested, measurements were conducted at a temperature of 60 °C. According to [34,80], 60 °C is the standard temperature for determining the lubricity of diesel fuels. Upon completion of the 75-min test, the ball from the tribological assembly, along with its holder, was placed in the holder of the ML7000/SP measurement microscope from MEIJI Techno Co., Ltd., which was equipped with a PCS Instruments camera. Following the calibration of the optical system of the measuring device, a wear scar was displayed on the monitor screen. Wear scar measurements on the test balls were conducted according to the test procedure by measuring the scar length in the X and Y directions. The X-direction was perpendicular to the oscillation direction of the test ball, and the Y-direction was parallel to the oscillation direction. The WSD parameter was calculated as the arithmetic mean of the wear scar lengths in the X- and Y-directions, with the notation:
WSD = X + Y \ 2 ,   μ m
where X is scar dimensions perpendicular to oscillation direction; Y is scar dimensions parallel to oscillation direction.
For each test, the friction coefficient between the test ball and disc was also recorded, along with the electrical resistance between them, as a criterion for the percentage thickness of the lubricating film. An AFP value of 0% indicates direct contact between the ball and disc, whereas a value of 100% indicates complete separation by a lubricating layer. The AFC and AFP values were calculated upon completion of the test. The described HFRR testing procedure was employed by the authors in previous studies on fuel lubricity [67,81].
Additionally, a T-20 stand based on the ball-on-disc (BOD) method was used to evaluate the tribological parameters in the form of the friction coefficient and abrasive wear rate coefficient. In this apparatus, the test specimen, a cylinder with a diameter of 1” and height of 10 mm, was mounted in a holder positioned on the vertical arm of a rotary lever, and its mass was counterbalanced by a weight placed on one end of the horizontal arm lever. At the opposite end of the lever, a weighing pan was suspended, upon which a load was applied to ensure the pressure of the sample on the counter-sample (a sphere with a diameter of 1”). The lengths of the rotating arms of the lever are equivalent. Thus, the pressure force corresponded to the gravitational force resulting from the pressure of a given load on the pan. The counter-sample was mounted on an electric motor shaft at an adjustable speed. The sphere rotated relative to the sample in the test fuel environment, and a scar was generated owing to friction. After the sphere was cleaned, scar diameters were measured in two planes to determine the friction wear intensity factor. A strain gauge sensor located above the specimen holder facilitated the direct measurement of frictional force during the test.
Throughout the experimental procedures, meticulous attention was given to adhering to the testing protocols stipulated by individual standards as well as the guidelines provided by the manufacturers of the testing equipment. A comprehensive summary of the apparatus used in these experiments was presented in Table A3.

3. Results and Discussion

3.1. Cold Filter Plugging Point

The cold filter plugging point (CFPP), determined in accordance with EN 116 for three repetitions, demonstrated the lowest temperature for the HVO fuel sample (Figure 1). According to EN 590, this fuel in temperate climates was below the required last grade F temperature of −20 °C, whereas in Arctic climates, it was proximate to penultimate grade 3, where the temperature was −38 °C. A value similar to that of the HVO sample was observed in the PSO sample (−29 °C). Proximate to the limit of the temperate climate standard of 20 °C was also found in the TPO sample (−18.5 °C). The DF sample, which served as the reference fuel, was procured during the summer season; thus, the CFPP temperature of −11.5 °C indicates grade D. A PPO sample (−10.0 °C) was situated in close proximity to the DF sample. The results obtained for the HVO and TPO samples do not differ significantly from those presented in [22,73], which corroborates the accuracy of the sampling and, consequently, the accuracy of the determination of the PPO and PSO samples. The error bars for the PSO sample exhibited a noticeable scatter, whereas, in the other cases, it was minimal. Referring to the test results in Table 1, it is challenging to correlate the CFPP results with water (H2O) content. The HVO fuel sample, which exhibited the lowest CFPP temperature, had the lowest water content (17 ppm), whereas the PSO sample, whose CFPP temperature was only marginally higher, contained 576 ppm H2O. A similar pattern was observed for the PPO sample (123 ppm H2O) and TPO (827 ppm H2O) samples, which were substantially higher than that of the DF reference fuel sample (38 ppm H2O).
The results for the CFPP temperatures presented in Figure 1 are applicable to the formation of mixtures, wherein the initial energy or emission parameters are frequently considered as determinants. It is evident that the DF in the Arctic version would achieve significantly lower CFPP temperatures than those examined. Disregarding the potential for chemical reactions between the components of the individual fuels comprising the blends, it was observed that the HVO+PSO blend demonstrated the capacity to remain unfrozen at the lowest temperatures (below −20 °C) of temperate climates, which may have implications for seasonal or global location applications. The −10.0 °C temperature for the PPO sample indicates that, as a stand-alone fuel, it can be utilised in temperate climates to a limited extent. In summary, the CFPP temperatures of the waste fuels tested, except for PPO, exceed their reference DF value.

3.2. Density

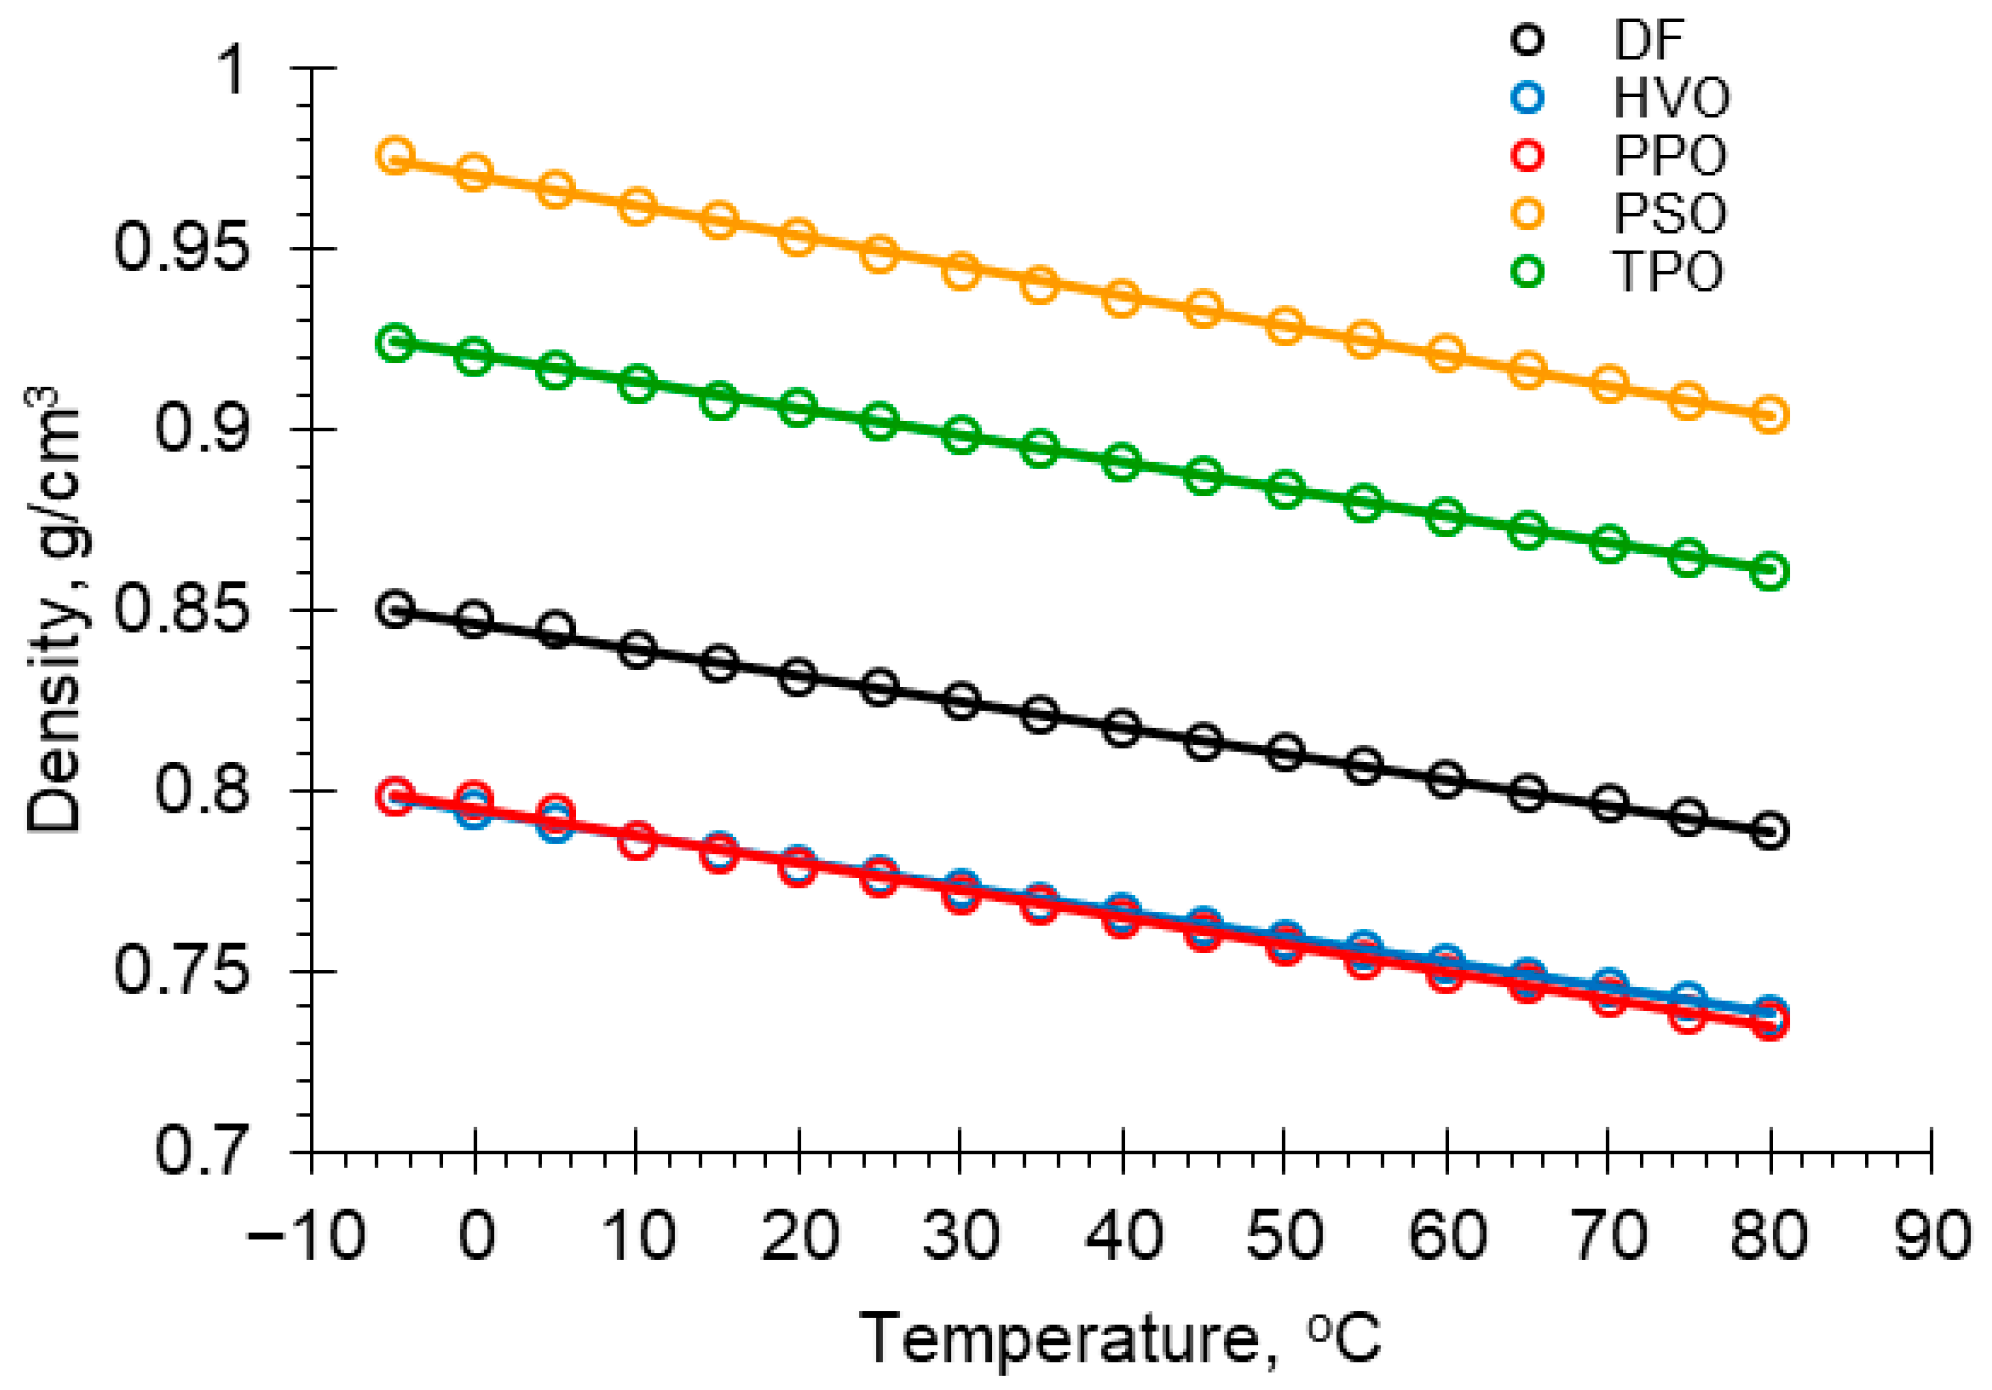
The densities of the fuel samples, determined by the oscillation method in accordance with ASTM D4052, were confirmed only for the DF sample (Figure 2, Table A4), the fulfilment of the EN 590 standard, wherein the density at 15 °C should be within the range, after conversion to units of the measuring apparatus, of (0.820–0.845) g/cm3. The density of the HVO sample at the reference temperature of 15 °C was approximately 5% lower than that of the standard. A comparable difference was observed for the PPO sample, which did not meet the requirements of the EN 590. The PSO and TPO samples exceeded the upper limits of this standard by more than 13% and 8%, respectively. In comparison with the results reported in the literature, the densities determined in this study at a temperature of 15 °C were 0.6% higher for the HVO sample than those in [22], 0.6% higher for the PPO sample, 1.6% higher for the PSO sample than in [28], and 4.8% higher for the TPO sample than those presented in [30]. The obtained densities of the PPO and PSO samples were comparable to those presented in [29], notwithstanding the slightly different method of fuel production.
Upon examination of the density test results presented in Table 1, it is evident that the high density values observed in the PSO and TPO samples can be attributed to two primary factors: the carbon content, which exceeded 90% by weight in both cases, and the substantial presence of aromatic compounds. The TPO sample exhibited an aromatic content of 54.8% by weight, whereas the PSO sample exhibited a remarkably high aromatic content of 98% by weight. Although a comprehensive analysis of the aromatic compounds was not conducted, it was noted that these compounds may significantly influence the density of fuels, particularly those derived from waste sources. A reference temperature of 15 °C has significant applicability compared with a benchmark. In an operational approach, where a highly variable temperature necessitates adjustments to the load on the delivery pump or injection capacity, it is essential to demonstrate the trend of the changes.
As the standard deviation was 0.008 g/cm3 in only one case (considerably lower in others), the error bars are not depicted. In all cases examined, the density increased linearly with a similar gradient towards lower temperatures. The highest density values were observed for PSO fuel samples. Samples of TPO and DF, which served as reference fuels, were positioned below this. The PPO and HVO samples exhibited similar values. The determined densities should be considered valuable for configuring and adjusting the operating parameters of fuel apparatus. Variations in the densities of the tested fuels resulted in the delivery of different target fuel masses with identical volumetric efficiencies of the pumping and injection units. This has implications for the energy and emission parameters. An increase in density presents challenges for droplet breakdown, vaporisation, and combustion. Conversely, an excessively low density improves droplet breakdown but may increase fuel consumption [38]. For a more comprehensive analysis, the measurement points were fitted to theoretical lines, whose indices provided the basis for quantitative evaluation.
To address the research gap identified in the introduction, the variation in density as a function of temperature was approximated by a linear trend line, expressed as:
ρ = a T + b
where ρ is the density, T is the temperature of the test fuel, a is the directional coefficient of the trend line, and b is the point of intersection of the trend lines.
Calculations were performed using a spreadsheet, minimising the objective function, which was the sum of the squares of deviations. The coefficient of determination R2 was employed to quantitatively evaluate the fit of the model to the experimental results was presented in Table 2.
In all the cases studied, within the temperature range of (−5–80) °C, the directional coefficients of the approximating straight lines (a) were −0.0007 and −0.0008, indicating a consistent response to temperature variation. The small directional coefficient value further corroborates the minimal slope of the straight line relative to the temperature axis. This demonstrates that, over the examined temperature range, the density of the fuel samples varied by approximately 0.075 g/cm3. This situation differs for the intersection points at 0 °C. The highest density at this point, 0.9706 g/cm3, was observed for the PSO fuel sample, representing a 12.75% increase compared to that of the DF sample. The density of the TPO sample (0.9206 g/cm3) is 8% higher than that of the DF sample. The reference fuel sample DF exhibited a density of 0.8468 g/cm3 at 0 °C. An approximately 6% decrease in density relative to the reference fuel sample (DF) was observed in the HVO and PPO samples at 0.7942 g/cm3 and 0.7948 g/cm3, respectively. The varying values of the intercepts (b) were a consequence of the chemical and fractional compositions of the tested fuel samples. In all the cases examined, the coefficient of determination exceeded 99.6%, indicating a highly accurate correlation between the test points and the theoretical line adopted by the functional notation. Considering the simplifications presented in the CFPP descriptions in the formulation of the fuel blends, the potential of HVO+PSO is evident, wherein appropriate proportions may yield parameters comparable to those of the DF reference fuel.

3.3. Viscosity

To ascertain the dynamic viscosity from the results of the tests conducted using a rotational viscometer operating in accordance with ISO 2555, it was necessary to employ a relationship with the notation:
η = K s p T % n ,     mPa   s
where η is the dynamic viscosity, K is the calibration constant depending on the spindle used, T% is the torque readout in % (0–100), and n is the rotational speed.
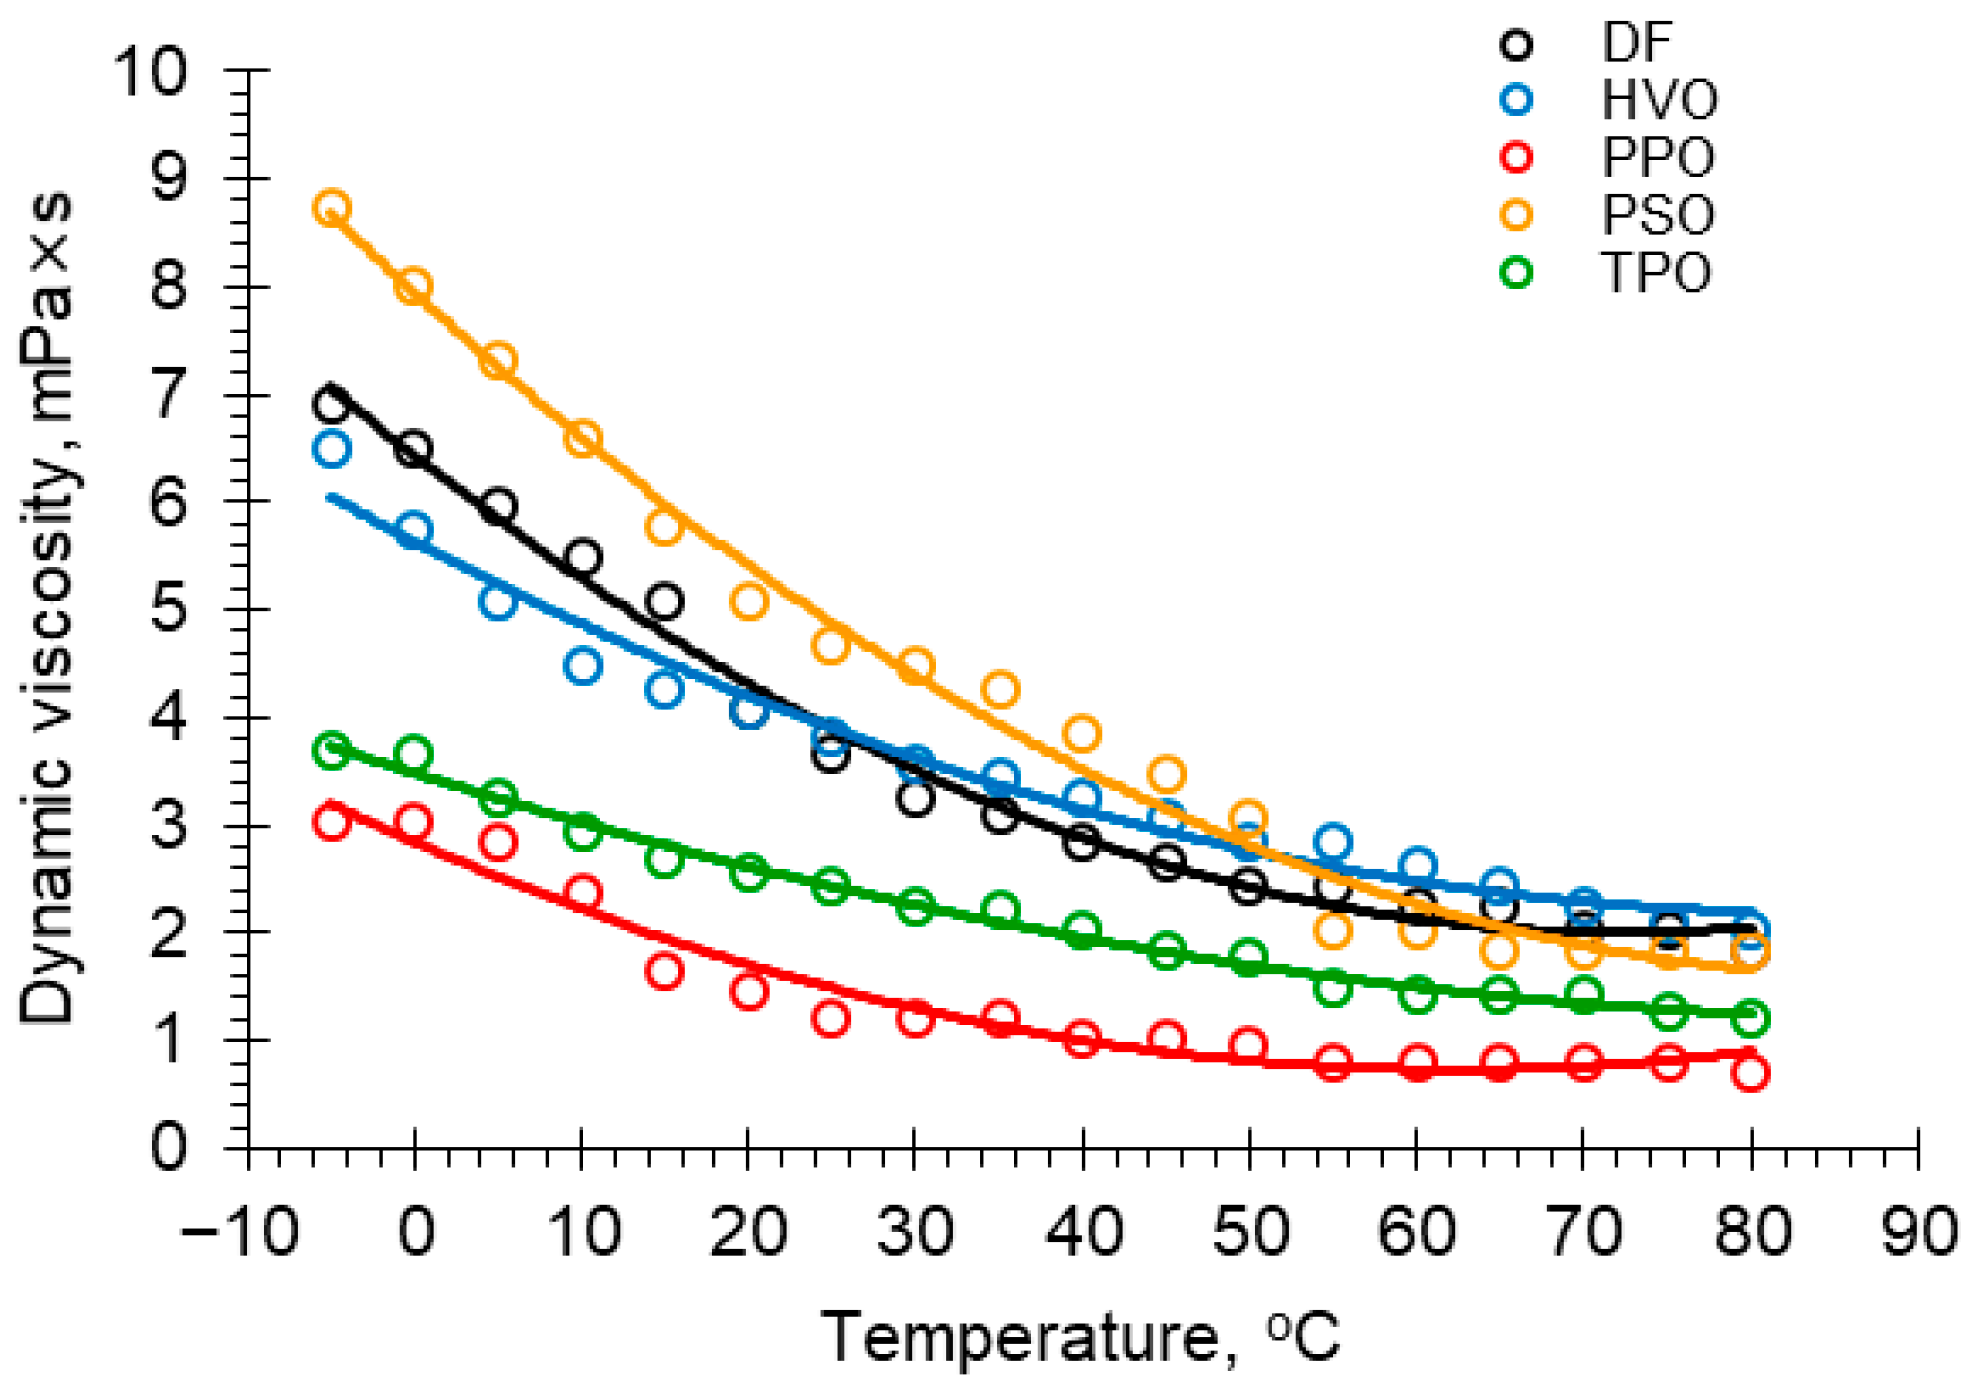
During the measurement procedure, approximately 30 s were required to stabilise the torque. Each measurement was repeated five times, and the resultant values were averaged. Deviations of 0.10 mPa × s were observed in a limited number of instances; however, in the majority of tests, they did not exceed 0.05 mPa × s. The results of the dynamic lightness tests are listed in Table A5, and the graphical interpretation is shown in Figure 3. Because of the minimal dispersion of the results, the error bars were omitted. It is evident that the dynamic viscosity decreased as the temperature of the tested fuel samples increased. The nature of these changes is not as consistent as that observed in the density results, particularly for HVO and TPO, in comparison to the other samples tested. In the majority of the cases studied, the dynamic viscosity stabilised after the temperature exceeded 65 °C. Given the paucity of literature reports in the area of determining the dynamic viscosity of fuel samples, it was challenging to compare the results of this study with those of other researchers.
An analysis of the variation in dynamic lightness as a function of temperature for the tested fuel samples indicated the selection of a trend line in the form of a second-degree polynomial with the following notation:
η = a T 2 + b T + c
where η is the dynamic viscosity, T is the temperature of the test fuel sample, a and b are the coefficients of the polynomial, and c is a free expression.
As in the determination of trend lines relating to changes in viscosity, the trend of changes in dynamic viscosity was ascertained using the least squares method (LSM), whereas the qualitative assessment of the fit was determined by the value of the coefficient of determination R2 (Table 3).
In all cases studied, the coefficient of the theoretical function placed at the highest power a was in the range (0.0003–0.0009) and was positive, indicating a positive asymptote. Expression b was negative, resulting in inflections directed towards the temperature axis. The inflections exhibited diverse morphologies, suggesting different responses to temperature changes among the tested fuel samples. The points of intersection of c with the axis at 0 °C vary considerably. The lowest value c was obtained for the PPO sample (2.8505), which, coupled with a low value b of −0.0680, indicated minimal sensitivity to temperature variations. The TPO sample demonstrated an even greater resistance to temperature changes, with the coefficient b reaching a value of −0.0486. The PSO sample exhibited the greatest variability within the range of tested temperatures, where the coefficient b was −0.1427. Furthermore, the PSO sample displayed the highest cut-point value, c, approaching 8.000. In comparison to the changes in the dynamic viscosity of the DF reference fuel sample, none of the other tested fuel samples exhibited a similar behaviour. Only the PSO sample demonstrates a comparable relationship, albeit positioned significantly below the DF sample.
Using the values of dynamic viscosity η (Table A5) and densities of the tested fuel samples ρ (Table A4), their kinematic viscosities ν were determined according to EN ISO 3104 [82]:
v = η ρ ,       mm 2 / s
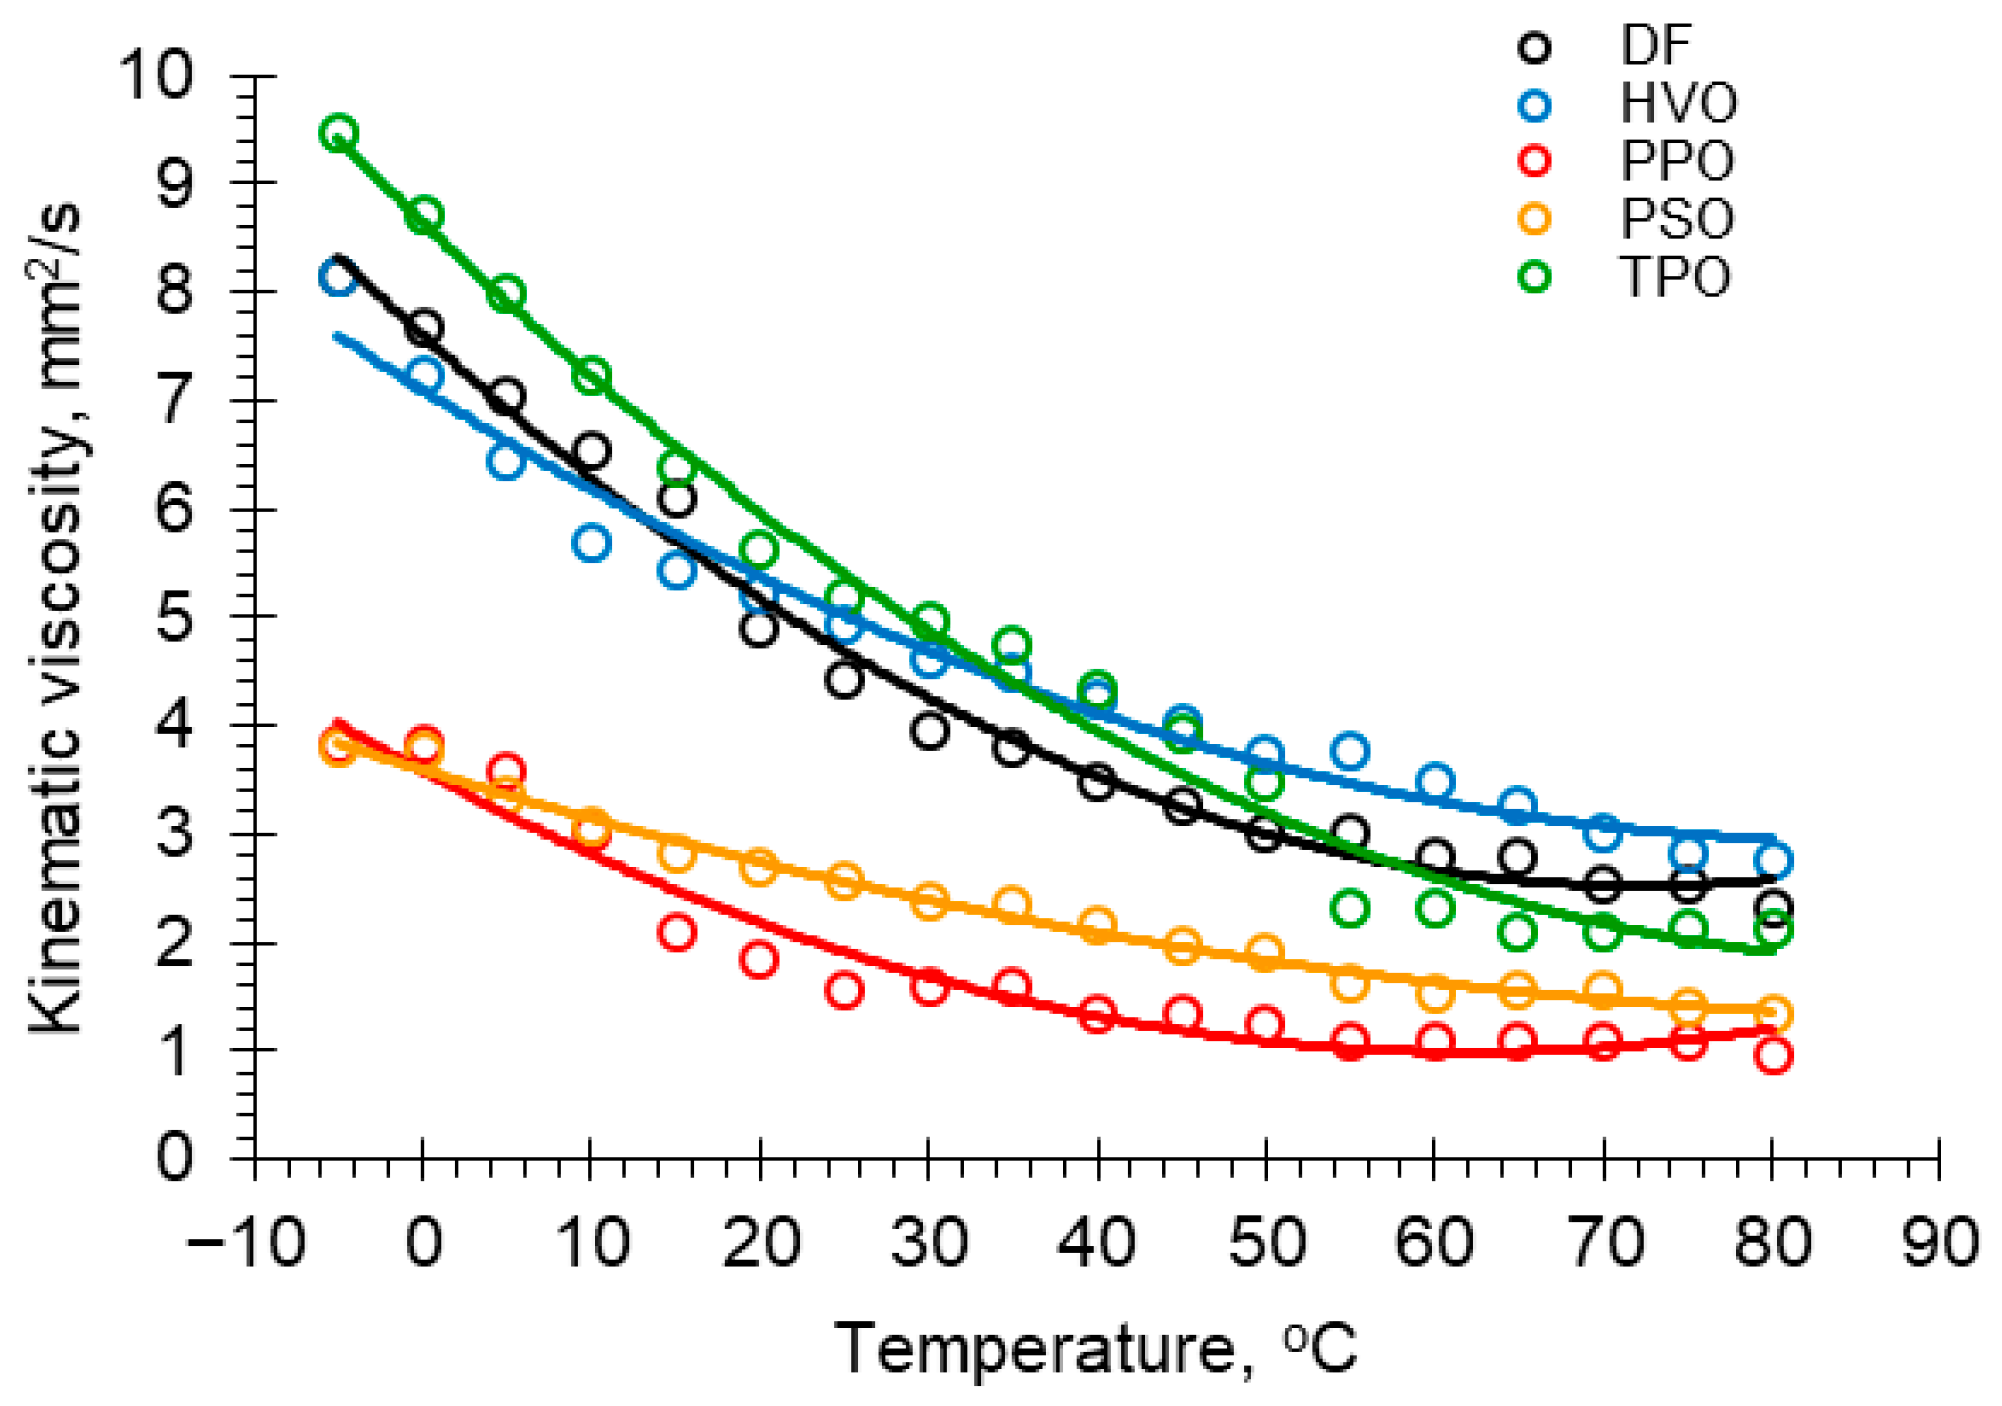
The results of the kinematic viscosity calculations are listed in Table A6, and the graphical interpretation is shown in Figure 4. The TPO fuel sample exhibited the highest gradient of kinematic viscosity increase in the range of lowest temperatures tested. Basic element tests (Table 1) demonstrated high sulphur (5000 mg/kg) and carbon (95.76 %wt) contents. Furthermore, the density tests revealed some of the highest values (Table A5) among the fuel samples examined. The HVO fuel sample achieved similar kinematic viscosity values but with a smaller gradient, indicating greater resistance to temperature changes. This fuel, in comparison with the TPO sample, had a lower carbon content (83.99 %wt) and low sulphur content (<1 mg/kg), as shown in Table 1. The HVO sample, as shown in [83], exhibited a lubricity problem in its pure form; consequently, a number of additives were utilised that had no effect on viscosity or other tribological parameters.
As previously mentioned, based on the results of the kinematic viscosity (ν) calculations (Table A6), the trend lines in the form of a second-degree polynomial were determined using LSM:
ν = a T 2 + b T + c
The values of the coefficients of the polynomials fitting the kinematic viscosity and the values of the coefficients of determination R2 are given in Table 4. Because the densities of the tested fuel samples had comparable characteristics of change with respect to temperature (Figure 2) but were located differently, it caused a change in the location of the curves of kinematic viscosity ν (Figure 4) with respect to dynamic viscosity η (Figure 3).
Relating the obtained results (Table A6) to the EN 590 standard, which stipulates that the kinematic viscosity at 40 °C should be within the range of (2.0–4.5) mm2/s, the values for DF, HVO, and TPO fuel samples were found to be in compliance. A value 33.5% below the threshold of the lower range of the standard was obtained for the PPO sample. Below 40 °C, the TPO fuel sample exhibited the highest upward trend in kinematic viscosity, surpassing the reference DF in this regard. The PSO sample, which demonstrated the highest dynamic viscosity, shifted significantly towards lower kinematic viscosities with an apparent flattening of shape after accounting for density (the highest among those tested).
By comparing the calculated kinematic viscosity values with those in the literature, discrepancies were observed. The DF sample yielded a value 34% higher and the PPO sample 27% lower, whereas the PSO sample yielded a 43% higher viscosity than the fuel samples tested in [28]. In relation to the results of [29] and those in this study, the DF sample showed a 12.4% increase, the PPO sample showed a 100% decrease, and the PSO sample showed a 24% increase. The HVO fuel sample achieved a 32.66% higher kinematic viscosity relative to [22], whereas the TPO sample achieved a 19.26% higher value than that determined in [30]. A potential explanation for this discrepancy could be differences in the fractional and chemical compositions of individual fuel samples due to manufacturing processes, particularly those derived from waste such as PPO, PSO, and TPO, as well as research methodologies that differ from those presented in the literature.
To determine kinematic viscosities, dedicated measuring instruments complying with the EN 590 standard are predominantly utilised. In this study, a rotational viscometer was employed, wherein it was possible to determine dynamic viscosities through the selection of an appropriate spindle and rotational speed. In this instance, the procedure was not encompassed by the EN 590 standard. Subsequent consideration of the fuel densities may have resulted in under- or overestimated kinematic viscosity results. The approach presented in this paper differs from the commonly employed methodology. In addition to kinematic viscosity, it provides information on dynamic viscosity, which is often overlooked in fuel sample testing. Dynamic viscosity elucidates the nature of the formation of an oil film, or lack thereof, which consequently determines the lubrication process of the mating components in the engine fuel system and its accessories. Viscosity and density are the two primary factors influencing the execution of the injection process.

3.4. Lubricity and Coefficient of Friction

3.4.1. Four-Ball Method

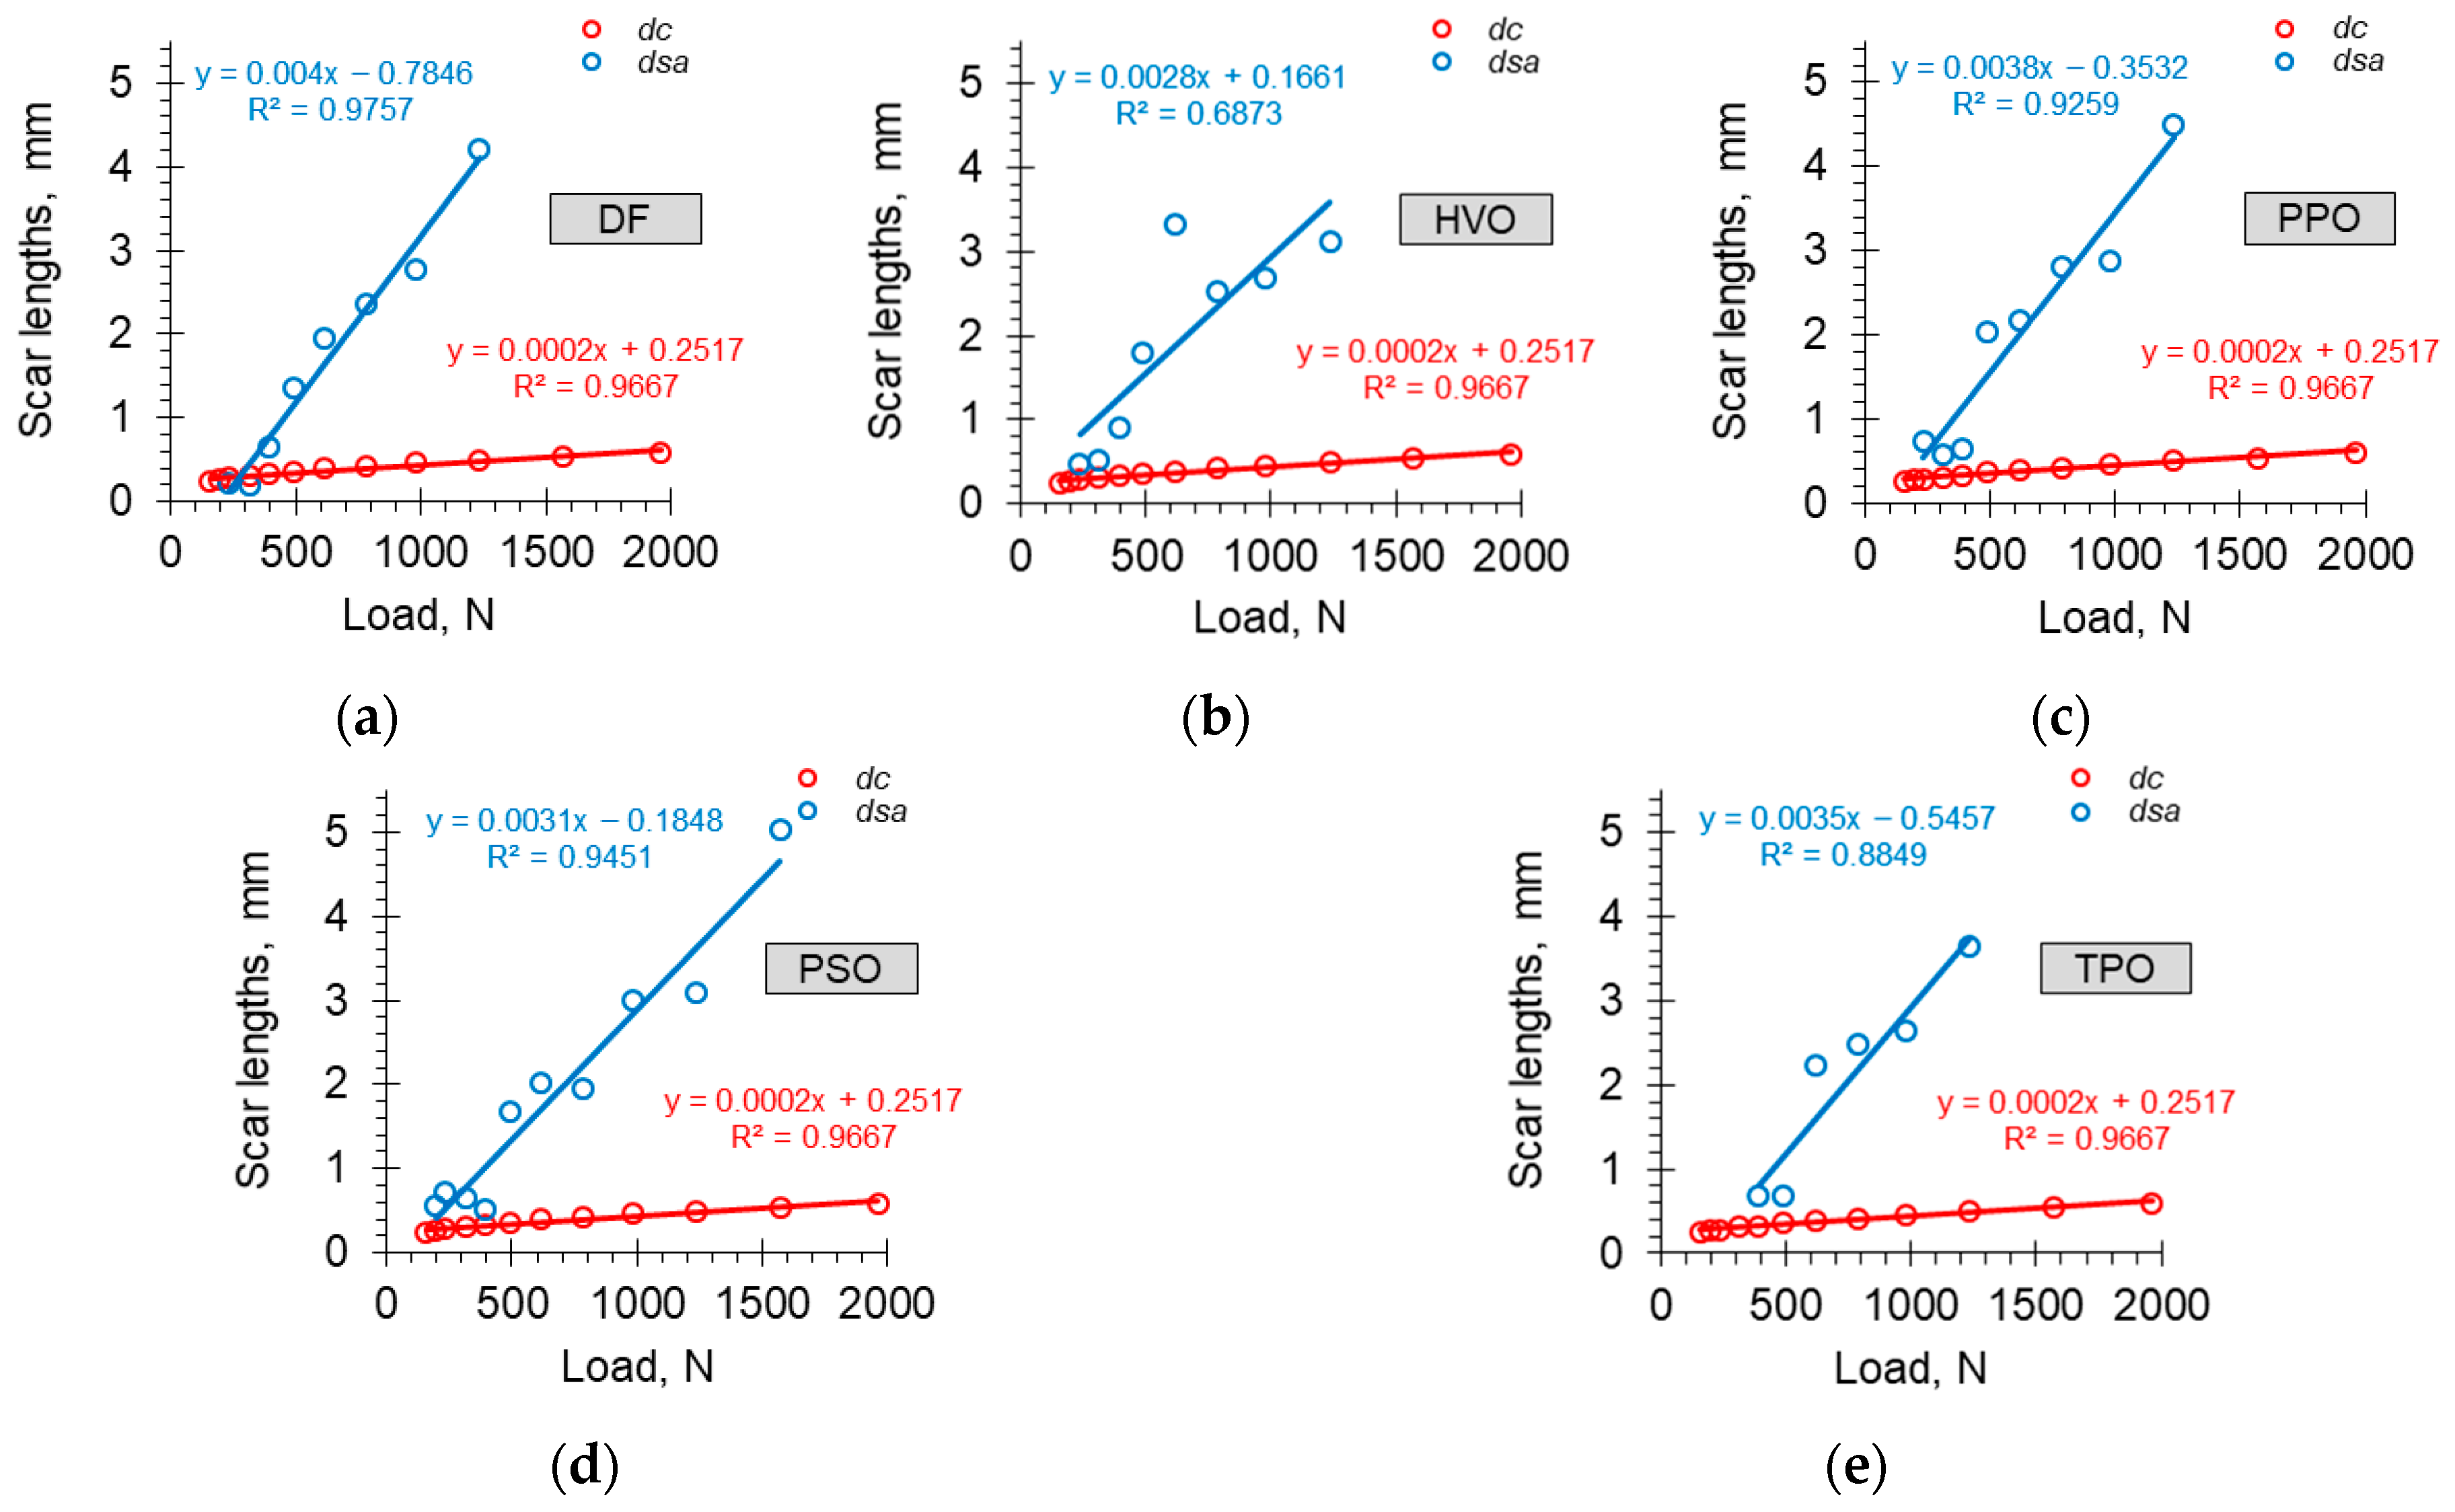
Lubricity tests utilising the T-02 apparatus (four-ball rig, FBR) consistently employed four 1/2” diameter steel balls in accordance with the ISO 20623 and ASTM D 2783 standards. This methodology is frequently characterised by the physical rupture of a lubricating film at a concentrated contact point. Considering the definition of lubricity, which encompasses the maximum non-latching load, seizure load, and welding load, the results are summarised in Table A7, with salient points highlighted. A graphical representation of the lubricity test results obtained using the four-ball apparatus was presented in Figure 5. Lubricity tests were conducted within the individual load range of (156.91–1961.40) N for each fuel sample. Owing to the low lubricity values observed, delineating the characteristic zones was not feasible, as specified in the ISO 20623 and ASTM D 2783 standards. For this reason, the compensated dc and results averaged from three balls dsa scars were approximated to straight trend lines using LSM with the values of the function coefficients (a over b) and coefficients of determination R2. In the graphs (Figure 5), the trend line dc represents the values derived from the ASTM D 2783 standard.
The avoidance of obliteration was identified by the observation that the value of dsa reached values lower than dc, which was achieved only for the first two loads on the sample DF. At a load of 235.37 N, dc = 0.28 mm, dsa = 0.23 mm; subsequently, at 313.82N, these values were 0.31 mm and 0.19 mm, respectively. Considering the entire test range of dsa, the lowest value of directional coefficient a was obtained for the HVO sample, although the result at a load of 617.84 N of 3.32 mm is considered an outlier. The value of a indicates the resistance to an increasing load. The lower the value of a, the smaller the size dsa. The results of the sulphur and carbon content tests (Table 1) revealed discrepancies among the various fuel samples tested. The carbon content ranged from 86.70 %wt for the DF sample to 95.76 %wt for the TPO sample, while the sulphur content varied. The sample with the most favourable lubricity was TPO, which contained 5000 mg/kg of sulphur, whereas the least favourable was the DF sample, which contained 7.51 mg/kg. For the HVO sample, which had a sulphur content of less than 1 mg/kg, the higher lubricity may be attributed to the presence of lubricating additives and high viscosity. These additives are necessary to meet the EN 590 standards; however, their composition is protected by trade secrets [83]. All tested fuel samples exhibited similar values of directional coefficient a in the range (0.0028–0.0040) but different intercepts b (0.1661–0.7846).
The results obtained from the lubricity tests conducted on a four-ball apparatus demonstrated that all tested fuel samples exhibited inadequate lubricity. Seizure, defined as the rupture of the lubricating film at concentrated contact, occurred in all cases at a load of approximately 196.14 N. The TPO sample is an exception, with seizures occurring at 392.28 N. Notably, as the load increased further, each of the fuel samples exhibited consistent behaviour: stabilisation occurred shortly after the commencement of the test, and welding did not occur for an extended period. This phenomenon can be attributed to the fact that, as the size of the ball scar increased, the contact area also increased. Consequently, the contact pressure decreased and stabilised as the loading force remained constant. For the fuel samples tested, a permanent connection occurred at approximately 1961.40 N. These values are comparable to those obtained by motor oils, as demonstrated in numerous studies [84,85]. This should be considered a favourable result. Among the waste fuels tested, the TPO sample performed optimally, exhibiting scars at 392.28 N and welding at 1569.12 N. A potential explanation for this performance is the highest sulphur and carbon content among the fuel samples tested (Table 1), which inhibits contact between the surfaces of the elements in contact. Kinematic viscosity was also a significant factor (Table A6). The lubricity of rapeseed oil-based fuel samples [86] in an FBR apparatus at a constant load of 200 N resulted in smaller scars on the balls than those obtained in this study. This observation was also confirmed for the case + PVO mixtures [66]. Based on these findings, it can be concluded that the fuel samples tested in this study exhibit inferior lubricity compared to those based on canola oil using the same test method (FBR). Owing to the lack of literature reports on the results of testing samples of publicly available fuels and those extracted from waste on a four-ball rig, comprehensive comparisons were not feasible.

3.4.2. HFRR Method

Figure 6 illustrates the wear scars on the test balls recorded for each tested fuel sample. A common characteristic of wear scars is the notably elongated mark in the X direction, which is perpendicular to the direction of the force inducing the oscillatory motion of the ball.
The most extensive wear scar in the X-direction was observed for sample DF, which was approximately 60% longer than the X value recorded for sample PSO, where this value was the smallest at 285 μm. The wear scar length in the Y-direction was also the greatest for DF and was approximately 73% higher than that in PSO. The lowest X and Y values for the PSO sample resulted in the smallest wear area on the test ball calculated as the product of these parameters. The primary criterion for evaluating the lubricity of fuels intended for diesel engines is WSD. The WSD values for the analysed fuel samples are shown in Figure 7a. A comparison of the WSD values indicates that among the tested samples, conventional diesel fuel exhibited the least favourable lubricity. The lowest WSD value was recorded for the PSO sample, which was marginally higher than that obtained for the PPO sample. The superior lubricity conditions observed for the pyrolysis oil derived from polystyrene are attributed to its relatively high sulphur content and substantial proportion of aromatic hydrocarbons. The enhanced lubricity of aromatic hydrocarbons is primarily due to their chemical structure. Aromatics contain double bonds and benzene rings, which facilitate the formation of stronger interactions between the metal surfaces under frictional conditions, thereby reducing wear. Additionally, their higher polarity promotes the formation of a more stable lubricating layer on the metal surfaces.
The lubricating properties of hydrocarbons with different chemical structures have been discussed in detail in [87]. Notably, the lowest kinematic viscosity values at the lubricity testing temperature were recorded for the PPO and PSO samples (Figure 4), indicating that in these fuels, the dominant factor for favourable lubrication conditions in the tested tribological assembly was the presence of sulphur in the fuel. The beneficial effect of the sulphur content on fuel lubricity was confirmed in [62]. In the case of the PSO sample, the improved lubricity was also influenced by the high mass content of aromatic hydrocarbons, which was the highest among the analysed fuel samples. Intermediate WSD values in relation to DF, PPO, and PSO were obtained for hydrogenated vegetable oil and oil derived from the pyrolysis of used car tyres. The lubricity results for the PPO and PSO samples are consistent with the findings in [29], where favourable lubricating properties were confirmed under HFRR testing conditions. Among the waste fuels, the highest WSD value was observed for the HVO sample, indicating the lowest lubricity. This fuel exhibited the highest kinematic viscosity at 60 °C, but consisted almost entirely of paraffinic hydrocarbons, which are simple alkyl chains. These hydrocarbons possess lower polarity than aromatic hydrocarbons, resulting in a reduced propensity to form a stable lubricating layer. Furthermore, the HVO fuel contained no sulphur, which additionally contributed to the decreased lubricity relative to the sulphur-containing fuels. The TPO fuel demonstrated lower lubricity than the other pyrolysis-derived fuels, PPO, and PSO, despite having a significantly higher sulphur content, higher viscosity, and a relatively high proportion of aromatic hydrocarbons. In this case, the reduced lubricity may be attributed to the high water content (Table 1). It is also plausible that the TPO fuel contained higher concentrations of contaminants from the tyre production process, which could have resulted in greater degradation of metal surfaces within the contact area of the tribological node.
Figure 7b,c illustrate the AFC and AFP parameters obtained for each fuel sample. Upon comparison of these data with the WSD parameter values, no correlation was observed between the friction coefficient and the lubricating film thickness with the wear scar on the ball in the tribological test assembly. This lack of correlation was particularly evident for the PPO and PSO samples, where the smallest WSD values and similar AFC values were recorded; however, the AFP value for PSO was significantly higher. When comparing the data for all three types of pyrolysis oils, it was evident that the TPO sample exhibited the lowest AFC and a marginally lower average AFP than the PSO sample. However, in this case, the WSD parameter was the highest. Overall, the comparison of the data presented in Figure 7 suggests that, for the analysed samples, the WSD parameter remains the most suitable comparative criterion for assessing lubricity.
Considering the normative requirements, all analysed samples met the lubricity standards specified in EN 590 [34] and ASTM D975 [80], which establish the permissible WSD values at 460 µm and 520 µm, respectively. Furthermore, all analysed waste fuels complied with the requirements for all five categories defined for diesel fuel in the Worldwide Fuel Charter [88], wherein the maximum allowable WSD value was 460 µm for categories 1, 2, and 3, and 400 µm for categories 4 and 5.

3.4.3. Ball-on-Disc Method

Input parameters for ball-on-disc (BOD) testing were determined using the Taguchi process optimisation method. The aim of this method was to determine such input parameters that would ensure obtaining the best quality results with the adopted criterion “the smaller the better” described by the formula:
η = 10 log 10 1 n y i 2
where η is signal to noise function (S/N), y is the single test result, n is number of tests.
The above criterion allows for minimizing changes in the output (tested) value as a response to the action of factors influencing the course of the process. During the implementation of the tests, it was ascertained that the optimal repeatability of the results could be obtained with the following input parameters: load of 6 N, friction path of 150 m and counterexample speed of 150 r./min. The direct results recorded by the measuring system of the apparatus are the frictional force values. The recording frequency was set at 2 Hz, which yielded approximately 1500 measurement points for each measurement. Taking into account the mean measured values of the friction forces and predetermined loads, the values of the friction coefficients were calculated for each test in the presence of fuels as well as without them (dry). Columbus’s law of friction was employed for this purpose, and the results are shown in Figure 8.
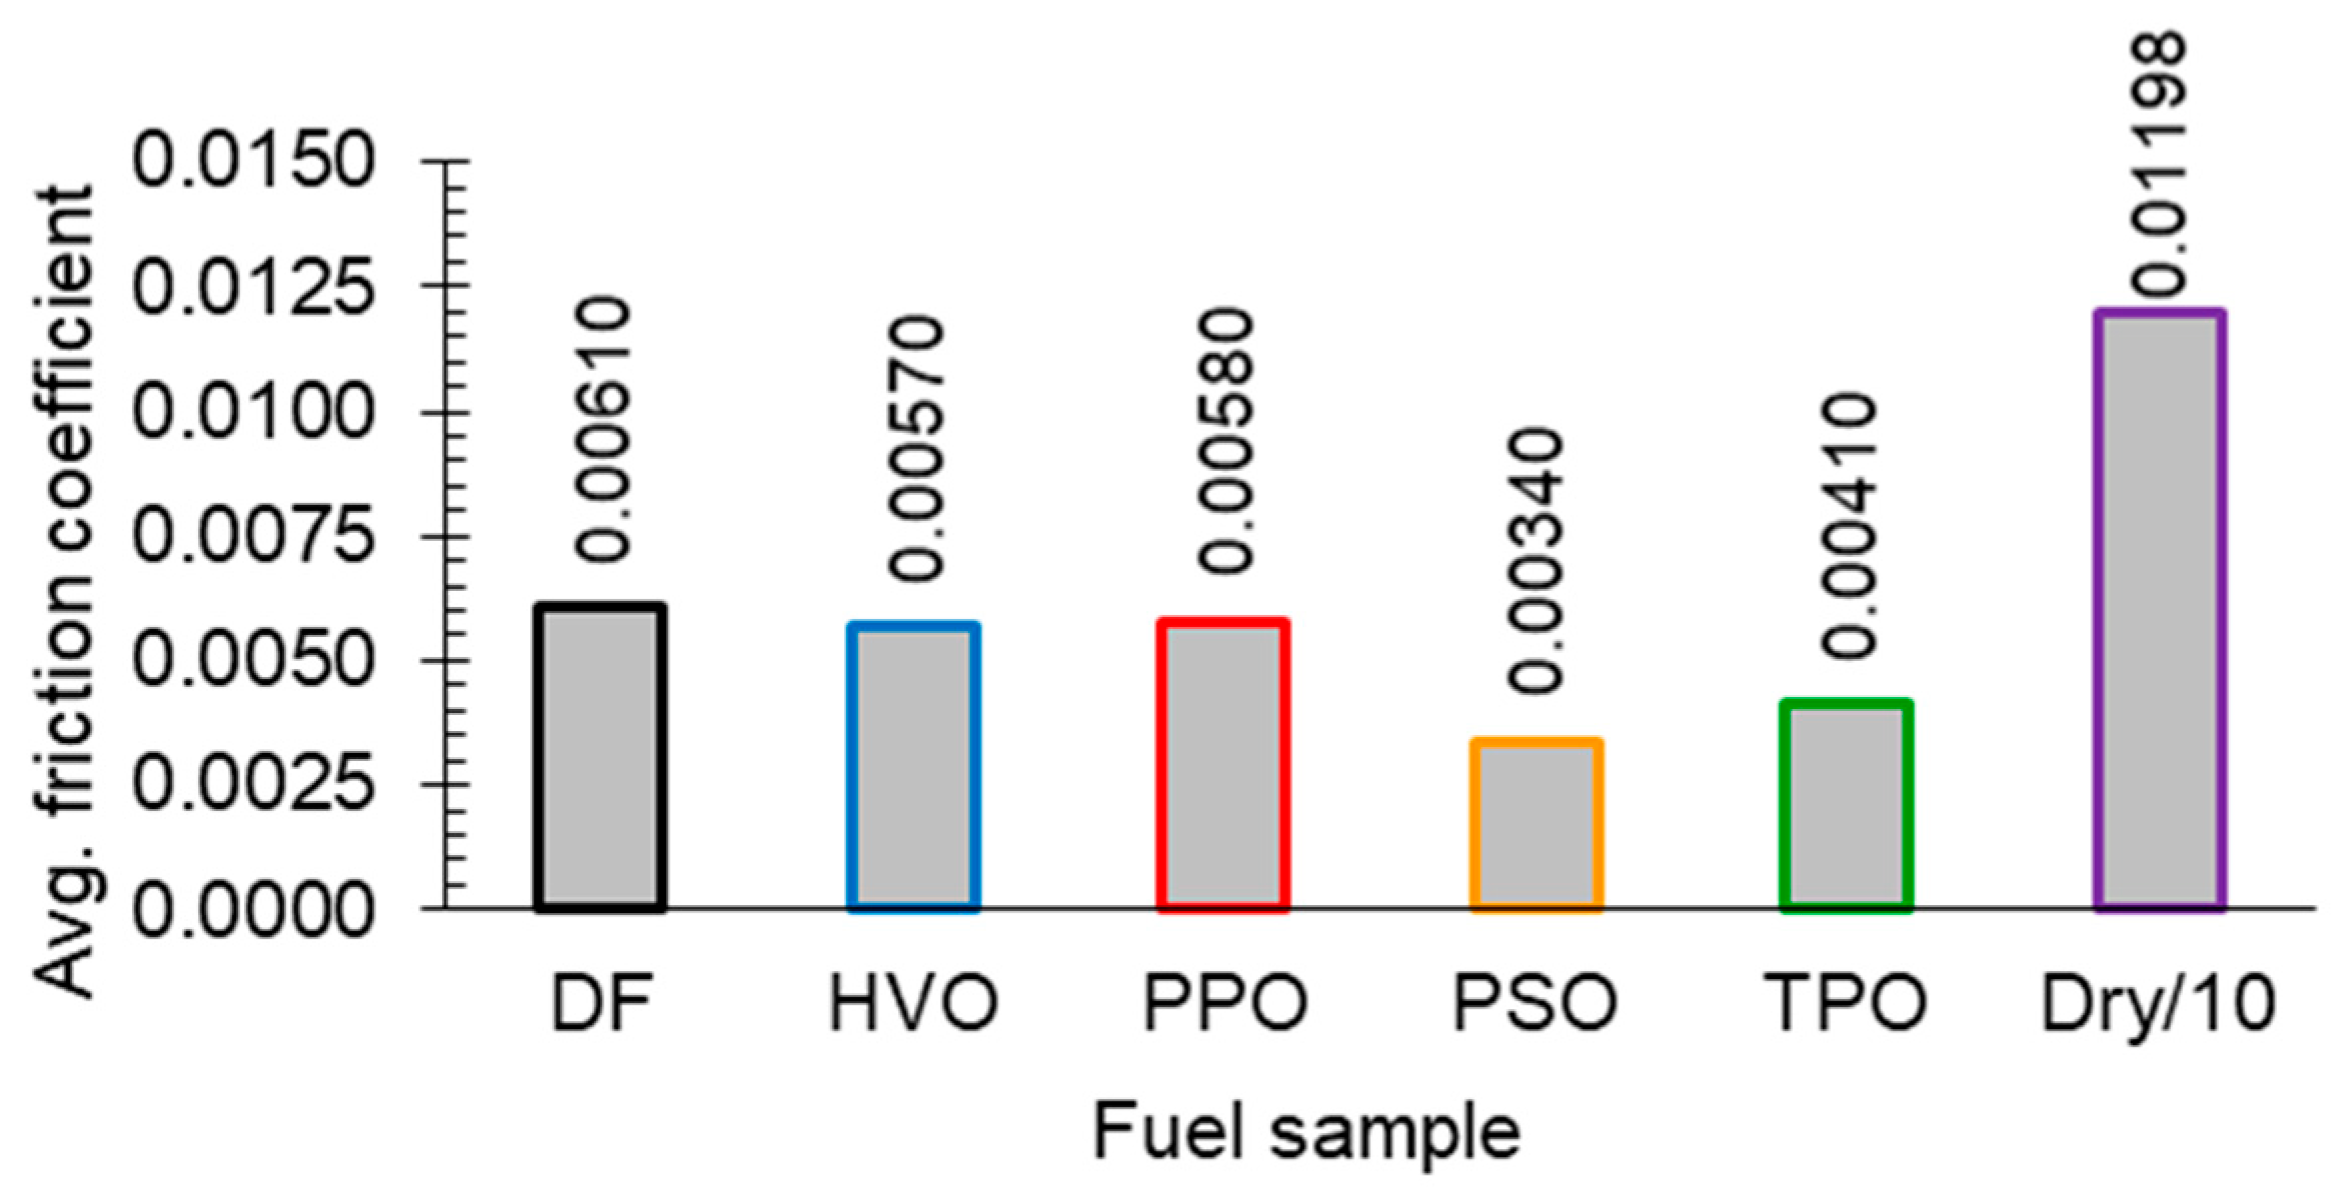
The results obtained (Figure 8) demonstrate that all the tested fuel samples facilitate a reduction in the friction coefficient value at the tribological junction under the limited ball-on-disc test method relative to dry friction. The highest friction coefficient of 0.00610 among the tested fuel samples was observed for the DF sample. This is likely attributable to the low sulphur content of 7.51 %wt. (Table 1), with comparable carbon contents for all the tested fuel samples. In the case of the PPO sample with a sulphur content of 16.79 %wt, the friction coefficient decreased to 0.0058. For the HVO sample, where sulphur was <1 %wt, the friction coefficient is influenced by the additives [83], as previously discussed in this paper.
The significantly lower friction coefficient of 0.0041 for the TPO sample is a consequence of its high sulphur content (5000 mg/kg). The lowest friction coefficient value was observed for the PSO sample (0.0034), where in addition to the sulphur content of 13.04 %wt, the content of aromatic components (98 %wt) was significant. Although the POD tests were conducted under considerably lower load conditions than the FBR, correlations between the results in Figure 8 and those obtained in Table A7 are evident. Low friction coefficient values for the TPO sample relative to the others were also demonstrated by the HFRR test (Figure 7b), although no correlation could be established for the other fuel samples because of the different test courses. It was observed that, even at low contact pressures, the compensated values were exceeded, indicating that the lubricating film ruptured and scuffing occurred.
Comparable results to Figure 8 were obtained in studies on fuel samples produced using biomass [89]. Significantly higher values of the friction coefficients in the presence of diesel fuel were observed in [90]. In the study described therein, the ball-on-disc (BOD) method or a different type of contact was utilised, which accounted for the discrepancy.
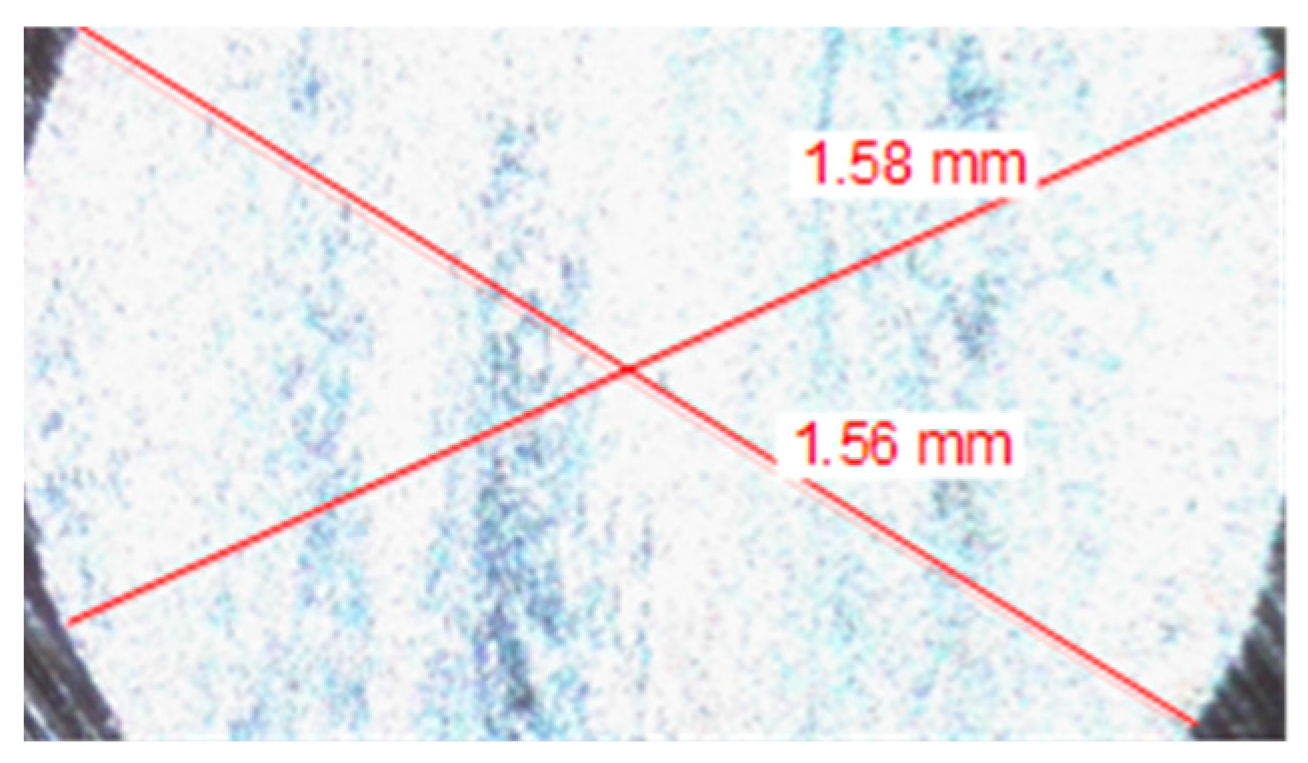
Because of friction, scars were formed on the contact surfaces, the dimensions of which are illustrated for the individual BOD tests in Figure 9 and Figure 10. A Delta Optical 300 laboratory microscope was used to measure the scars.
According to Archard’s law, the coefficient of abrasive wear can be written as:
K c = π b 4 64 R N S ,           m 3 / N   m
where N is the load applied in the test, S is the friction path, R is the radius of the ball (counter-sample), and b is the arithmetic mean of the crater-size measurements taken in two perpendicular directions.
The coefficient of abrasive wear directly affects the service life of the fuel system components. The scan magnitudes and calculated Kc values are presented in Table 5.
The results in Table 5 demonstrate the influence of the various fuel samples on the wear process within a tribological node. Notably, despite exhibiting the highest coefficient of friction (Figure 8), the DF reference fuel Figure 8 did not produce the most significant wear. The highest coefficient of abrasive wear was observed for the PPO sample (excluding dry friction). This phenomenon has potentially detrimental implications for the longevity of the fuel system, which may necessitate costly repairs in the event of a failure. Conversely, the TPO sample exhibited the lowest friction-pair wear. Comparable research findings were presented in [91], where the obtained Kc values were approximately two-fold higher. However, this discrepancy can be attributed to the utilisation of samples coated with a layer of carbon compounds, which substantially alters the tribological properties. The HVO fuel sample, notwithstanding the presence of numerous additives [83], demonstrated high Kc values, which may contribute to the excessive wear of the friction pairs in engine fuel systems.

4. Conclusions

In the present study, a comparative evaluation of fuels used in diesel engines was undertaken, encompassing conventional diesel fuel (DF), HVO, and waste-derived fuels obtained via pyrolysis (PPO, PSO, TPO). Whereas previous research has predominantly focused on energy and environmental aspects, this work extends the scope by analysing the durability of the fuel system through measurements of parameters such as the cold filter plugging point (CFPP), density, and tribological properties (including viscosity, lubricating characteristics, friction coefficient, film thickness, and wear).
The investigations revealed that HVO fuel is characterised by the lowest CFPP (approximately −35 °C), whereas DF and PPO exhibit less favourable results (ranging from approximately −11.5 °C to −10 °C). Density analysis demonstrated that only DF complied with the EN 590 standard at the reference temperature, whereas HVO and PPO fell below the lower limit, and PSO and TPO exceeded the upper limits. With regard to dynamic and kinematic viscosity, most fuels (DF, HVO, PSO, and TPO) conform to the EN 590 standards, with the exception of PPO, which shows a value significantly below the required range.
An innovative assessment of lubricating properties using the FBR method indicated that TPO fuel possesses the best lubricating characteristics, whereas DF exhibits the poorest characteristics. Additional tests employing the HFRR and BOD methods confirmed that, despite DF having the highest friction coefficient, it did not result in the greatest wear; in contrast, the highest wear was recorded for PPO. Nonetheless, all samples met the lubricity standards established by EN 590 and the requirements of the World Fuel Charter.
Overall, these findings confirm that fuels obtained from plastic and tyre waste can partially replace diesel fuel and help meet energy demand while aiding waste management, provided that their shortcomings (e.g., poor cold-flow properties or low lubricity in certain cases) are mitigated through blending or additive use.

5. Future Research

Further research on liquid alternative fuels, including pyrolytic fuels, will focus on an in-depth analysis of the correlation between key parameters such as chemical composition, physicochemical properties and combustion characteristics. It will be particularly important to develop comprehensive methods for the identification and quantitative assessment of individual fractions present in fuels and their mixtures. The use of a range of research methods will enable detailed mapping of the chemical structure. It is also considered important to systematically study the reactivity of pyrolytic fuels and their mixtures with other fuels under controlled conditions and in actual operating processes. As a result, this will allow for the development of precise criteria necessary for the creation of fuel mixtures that can be used on an industrial scale. This will increase the applicability of the analyses carried out and strengthen the role of pyrolytic fuels as a promising source of energy.

Author Contributions

Conceptualization of the article, literature review, analysis of results, figures, diagrams, original version of the manuscript, revision of the final version, D.S.; preparation of test site and equipment, research, analysis of results, literature review, proofreading of final version, A.B.; preparation of test site and equipment, research, analysis of results, literature review, proofreading of final version, G.M.; preparation of test site and equipment, research, analysis of results, literature review, proofreading of final version, H.K.; preparation of test site and equipment, research, analysis of results, literature review, correction of final version, A.J.; analysis of results, corrections and additions, proofreading of final version, J.H. All authors have read and agreed to the published version of the manuscript.

Funding

The research leading to these results has received funding from the commissioned task entitled “Polytechnic Network VIA CARPATIA named after President of the Republic of Poland Lech Kaczynski”, financed by a special purpose grant from the Minister of Science contract no: MEiN/2022/DPI/2575, MEiN/2022/DPI/2577, MEiN/2022/DPI/2578, activity “ISKRA—building inter-university research teams”.

Data Availability Statement

The datasets generated during and/or analyzed during the current study are available from the corresponding author upon reasonable request.

Conflicts of Interest

The authors declare no conflicts of interest. The funders had no role in the design of the study; in the collection, analyses, or interpretation of data; in the writing of the manuscript; or in the decision to publish the results.

Abbreviations

The following abbreviations are used in this manuscript:
BEVsbattery electric vehicles
BOTDball-on-three discs
BOTSball-on-three seats
CFPPcold filter plugging point
DFdiesel fuel
FAMEfatty acid methyl ester
FBRfour-ball rig
HFRRhigh-frequency reciprocating rig
HPDEhigh-density polyethylene
HVOhydrotreated vegetable oil
LPDElow-density polyethylene
PETpolyethylene terephthalate
PHEVsplug-in hybrid electric vehicles
BODball-on-disc
PPpolypropylene
PPOpolypropylene oil
PSpolystyrene
PSOpolystyrene oil
PVCpolyvinyl chloride
PVOpure vegetable oil
SDGsSustainable Development Goals
SLBOCLEscuffing load ball-on-cylinder lubricity evaluator
TPOautomobile tyre oil
TRLstechnology readiness levels
VAPsvalue-added products
VOvegetable oil

Appendix A

Technical specifications of scientific equipment.
Table A1. Overview of apparatus used in preliminary physical and chemical testing of fuels.
ParameterAnalyzerMethodUnitAccuracy
Nitrogen contentKjeldahl FoodAlyt D5000, OMNILAB, Bremen, GermanyKjeldahla methodmg/kg1%
Sulphur contentS2 PICOFOX, Bruker, Berlin, GermanyX-ray fluorescencemg/kg0.3%
Carbon content TOC multi N/C3100 TOC, Analytik Jena, Jena, GermanyNDIR detector%wt.0.69%
Hydrogen contentUNICUBE analytic functional testing, Elementar Analysensysteme, Langenselbold, Germanydirect TPD technology%wt.0.3%
Total aromatics contentERASPEC, Eralytics GmbH, Vienna, Austriamid-FTIR%wt.0.3%
FAME contentERASPEC, Eralytics GmbH, Vienna, AustriaEN 14078 [92]%v0.2%
Water contentTitro Line 7500 KF TRACE, SI Analytics/Xylem Analytics, Weilheim, GermanyEN 61326-1 [93]ppm0.3%
Derived cetane numberCID 510 Herzog (PAC Group), Paris, FranceASTM D7668 [94]-0.6%
Lower heating valuePARR 6100, Parr Instrument Company, Moline, IL, USAASTM D240 [95], ASTM D4809 [96]MJ/kg0.2%
Flash pointNPM 450, Normalab, Valliquerville, FrancePensky-Martens ASTM D 93 [97]°C0.3%
Table A2. Lubricity test conditions (HFRR method).
ParameterUnitValue
Volume of fuel samplecm32.0 ± 0.2
Stroke lengthmm1.00 ± 0.02
FrequencyHz50 ± 1
Fuel sample temperature°C60 ± 2
Test massg200 ± 1
Test durationmin75.0 ± 0.1
Table A3. Technical characteristics of research equipment.
ParameterAnalyzerMethod/StandardUnitAccuracy
Cold filter blocking tendencyFPP 5Gs, ISL (PAC Group), Paris, FrancePN-EN 116 [74]°C1
DensityDMA 4100 M, Anton Paar, Graz, AustriaASTM D4052 [75]g/cm30.0001
Dynamic viscosityBROOKFIELD DV-II+ Pro, AMETEK Brookfield, Middleborough, MA, USAISO 2555 [76]mPa × s±1%
LubricityT-02, Instytut Technologii Eksploatacji–PIB (ITeE), Radom, PolandFour-ball method ISO 20623 [77], ASTM D 2783 [78]kg
μm
0.1 to 1.0
0.1
Lubricity and coefficient of frictionPSC, PCS Instruments, London, UKHFRR method: ISO 12156 [79], ASTM D6079 [98]kg
μm
0.1 to 1.0
0.5
Coefficient of frictionT-20, Instytut Technologii Eksploatacji–PIB (ITeE), Radom, PolandBall-on-disc method
Ball-cratering
N
mm
0.01
0.01

Appendix B

Tabular presentation of research results and calculations.
Table A4. Determined average values of density of fuel samples in temperature ranges from (−5–80) °C.
T,
°C
Density ρ, g/cm3
Fuel Sample
T,
°C
Density ρ, g/cm3
Fuel Sample
DFHVOPPOPSOTPODFHVOPPOPSOTPO
−50.85040.79850.79870.97580.9244400.81740.76610.76430.93660.8911
00.84760.79450.79730.97110.9208450.81400.76260.76050.93330.8873
50.84460.79050.79360.96680.9167500.81040.75920.75650.92900.8836
100.83880.78670.78580.96240.9130550.80690.75570.75310.92480.8798
150.83550.78340.78220.95830.9086600.80340.75220.74980.92090.8760
200.83180.77970.77840.95320.9058650.79980.74870.74610.91680.8722
250.82850.77680.77540.94910.9021700.79630.74520.74260.91270.8685
300.82460.77300.77150.94430.8986750.79280.74170.73780.90840.8646
350.82090.76950.76850.94040.8948800.78920.73820.73640.90430.8608
Table A5. Determined average values of dynamic viscosities of the tested fuel samples in the temperature range from (−5–80) °C.
T,
°C
Dynamic Viscosities η, mPa × s
Fuel Sample
T,
°C
Dynamic Viscosities η, mPa × s
Fuel Sample
DFHVOPPOPSOTPODFHVOPPOPSOTPO
−56.9136.5073.058.7433.694402.8473.2531.0173.8632.033
06.5075.7513.058.0203.660452.6433.0731.0173.4811.830
55.9565.0832.8477.3123.253502.4402.8470.9433.0701.772
105.4904.4732.3726.5882.948552.4402.8470.8132.0331.491
155.0834.2701.6515.7882.690602.2372.6280.8132.0331.423
204.0674.0671.4465.0832.567652.2372.440.8131.8421.423
253.663.8361.2204.6852.44702.0332.2520.8131.8301.423
303.2533.5651.2204.4732.237752.0192.0930.8131.8301.280
353.1083.4571.2204.2552.210801.8302.0330.7021.8301.220
Table A6. Determined average values of calculated values of kinematic viscosities of the tested fuel samples in the temperature range from (−5–80) °C.
T,
°C
Kinematic Viscosities ν, mm2/s
Fuel Sample
T,
°C
Kinematic Viscosities ν, mm2/s
Fuel Sample
DFHVOPPOPSOTPODFHVOPPOPSOTPO
−58.1308.1493.8193.7859.458403.4834.2471.3302.1714.335
07.6777.2393.8253.7698.710453.2474.0291.3371.9613.923
57.0526.4313.5873.3657.977503.0113.7501.2461.9073.475
106.5455.6863.0193.0647.216553.0243.7671.0801.6122.311
156.0845.4512.112.8076.37602.7843.4931.0851.5462.321
204.8895.2161.8582.6935.612652.7973.2591.091.5532.112
254.4184.9381.5732.5715.194702.5533.0221.0951.5592.107
303.9454.6121.5812.3694.978752.5462.8221.1021.4092.117
353.7864.4921.5882.3504.756802.3192.7540.9541.3492.126
Table A7. Scar lengths compensated (dc) and averaged from 3 balls (dsa).
F,
N
Fuel Sample
Stand.DFHVOPPOPSOTPO
dc, mmdsa, mmdsa, mmdsa, mmdsa, mmdsa, mm
156.910.25---no scars-
196.140.27no scarsno scarsno scars0.56-
235.370.280.230.480.730.71-
313.820.310.190.510.570.66no scars
392.280.330.660.900.650.520.68
490.350.361.351.802.041.670.68
617.840.391.963.322.182.022.23
784.560.422.372.532.821.962.48
980.700.462.782.692.873.002.65
1235.680.504.213.124.503.093.64
1569.120.54weldedweldedwelded5.02welded
1961.400.59---welded-

References

  1. Walsh, M. Global trends in motor vehicle use and emissions. Annu. Rev. Energy 1990, 15, 217–243. [Google Scholar] [CrossRef]
  2. Kalghatgi, G.; Agarwal, A.K.; Leach, L.; Senecal, L. Engines and Fuels for Future Transport; Springer: Berlin/Heidelberg, Germany, 2022; ISBN 9789811687167. [Google Scholar]
  3. Ritchie, H. A Global Breakdown of Greenhouse Gas Emissions by Sector. Available online: https://www.visualcapitalist.com/cp/a-global-breakdown-of-greenhouse-gas-emissions-by-sector/ (accessed on 8 March 2023).
  4. Robiou du Pont, Y.; Meinshausen, M. Warming assessment of the bottom-up Paris Agreement emissions pledges. Nat. Commun. 2018, 9, 4810. [Google Scholar] [CrossRef]
  5. Clairotte, M.; Suarez-Bertoa, R.; Zardini, A.A.; Giechaskiel, B.; Pavlovic, J.; Valverde, V.; Ciuffo, B.; Astorga, C. Exhaust emission factors of greenhouse gases (GHGs) from European road vehicles. Environ. Sci. Eur. 2020, 32, 125. [Google Scholar] [CrossRef]
  6. Schlacke, S.; Wentzien, H.; Thierjung, E.-M.; Köster, M. Implementing the EU Climate Law via the ‘Fit for 55’ package. Oxf. Open Energy 2022, 1, oiab002. [Google Scholar] [CrossRef]
  7. European Parliament. BRIEFING EU Legislation in Progress-Revising the Energy Efficiency Directive: Fit for 55 Package; BRIEFING EU Legislation in Progress; European Parliament: Strasbourg, France, 2021. [Google Scholar]
  8. Council of the European Union. Council Directive 2014/94/EU of 22 October 2014 on the deployment of alternative fuels infrastructure. Off. J. Eur. Union 2014, 307, 1–20. [Google Scholar]
  9. Szpica, D. Combustion Systems and Fuels Used in Engines—A Short Review. Appl. Sci. 2023, 13, 3126. [Google Scholar] [CrossRef]
  10. Kremer, M.; Hulshorst, T. In-Market Application of Start-Stop Systems in European Market; FEV Group Ltd.: Aachen, Germany, 2011. [Google Scholar]
  11. Mueller, N.; Strauss, S.; Tumback, S.; Goh, G.C.; Christ, A. Next Generation Engine Start/Stop Systems: “Free-Wheeling”. SAE Int. J. Engines 2011, 4, 874–887. [Google Scholar] [CrossRef]
  12. Bucsky, P.; Juhász, M. Is car ownership reduction impact of car sharing lower than expected? A Europe wide empirical evidence. Case Stud. Transp. Policy 2022, 10, 2208–2217. [Google Scholar] [CrossRef]
  13. Caban, J.; Vrábel, J.; Šarkan, B.; Ignaciuk, P. About eco-driving, genesis, challenges and benefits, application possibilities. Transp. Res. Procedia 2019, 40, 1281–1288. [Google Scholar] [CrossRef]
  14. Mustayen, A.G.M.B.; Rasul, M.G.; Wang, X.; Hazrat, M.A.; Negnevitsky, M.; Jahirul, M.I. Impact of waste-plastic-derived diesel on the performance and emission characteristics of a diesel engine under low load conditions. Energy Convers. Manag. 2023, 283, 116936. [Google Scholar] [CrossRef]
  15. Diouf, B. The electric vehicle transition. Environ. Sci. Adv. 2024, 3, 332–345. [Google Scholar] [CrossRef]
  16. ExxonMobil Energy Demand: Three Drivers|ExxonMobil. Available online: https://corporate.exxonmobil.com/what-we-do/energy-supply/global-outlook/energy-demand (accessed on 20 January 2023).
  17. British Petroleum. The Energy Outlook Explores the Forces Shaping the Global Energy Transition out to 2040 and the Key Uncertainties Surrounding That; BP Energy Outlook 2019 Edition; British Petroleum: London, UK, 2019; pp. 22–24, 72–76, 144–148. [Google Scholar]
  18. Koszalka, G.; Hunicz, J. Comparative study of energy losses related to the ring pack operation in homogeneous charge compression ignition and spark ignition combustion. Energy 2021, 235, 121388. [Google Scholar] [CrossRef]
  19. European Commission. CO2 emission performance standards for cars and vans. Eur. Comm. 2020, 2, 02019R0631-20201119. [Google Scholar]
  20. Vásquez, M.C.; Silva, E.E.; Castillo, E.F. Hydrotreatment of vegetable oils: A review of the technologies and its developments for jet biofuel production. Biomass Bioenergy 2017, 105, 197–206. [Google Scholar] [CrossRef]
  21. Aatola, H.; Larmi, M.; Sarjovaara, T.; Mikkonen, S. Hydrotreated vegetable Oil (HVO) as a renewable diesel fuel: Trade-off between NOx, particulate emission, and fuel consumption of a heavy duty engine. SAE Int. J. Engines 2009, 1, 1251–1262. [Google Scholar] [CrossRef]
  22. Hunicz, J.; Matijošius, J.; Rimkus, A.; Kilikevičius, A.; Kordos, P.; Mikulski, M. Efficient hydrotreated vegetable oil combustion under partially premixed conditions with heavy exhaust gas recirculation. Fuel 2020, 268, 117350. [Google Scholar] [CrossRef]
  23. Bezergianni, S.; Dimitriadis, A. Comparison between different types of renewable diesel. Renew. Sustain. Energy Rev. 2013, 21, 110–116. [Google Scholar] [CrossRef]
  24. Chiaramonti, D.; Prussi, M. Pure vegetable oil for energy and transport. Int. J. Oil Gas Coal Technol. 2009, 2, 186–198. [Google Scholar] [CrossRef]
  25. Gil, L.; Pieniak, D.; Walczak, M.; Ignaciuk, P.; Sawa, J. Impact of acid number of fuels on the wear process of apparatus fuel injection in diesel engines. Adv. Sci. Technol. Res. J. 2014, 8, 54–57. [Google Scholar] [CrossRef]
  26. Kumar, J.S.; Bapu, B.R.R.; Sivasaravanan, S.; Prabhu, M.; Kumar, S.M.; Abubacker, M.A. Experimental studies on emission reduction in a DI diesel engine by using a nano catalyst coated catalytic converter. Int. J. Ambient. Energy 2019, 43, 1241–1247. [Google Scholar] [CrossRef]
  27. Al-Rumaihi, A.; Shahbaz, M.; Mckay, G.; Mackey, H.; Al-Ansari, T. A review of pyrolysis technologies and feedstock: A blending approach for plastic and biomass towards optimum biochar yield. Renew. Sustain. Energy Rev. 2022, 167, 112715. [Google Scholar] [CrossRef]
  28. Januszewicz, K.; Hunicz, J.; Kazimierski, P.; Rybak, A.; Suchocki, T.; Duda, K.; Mikulski, M. An experimental assessment on a diesel engine powered by blends of waste-plastic-derived pyrolysis oil with diesel. Energy 2023, 281, 128330. [Google Scholar] [CrossRef]
  29. Pumpuang, A.; Klinkaew, N.; Wathakit, K.; Sukhom, A.; Sukjit, E. The influence of plastic pyrolysis oil on fuel lubricity and diesel engine performance. RSC Adv. 2024, 14, 10070–10087. [Google Scholar] [CrossRef]
  30. Mikulski, M.; Ambrosewicz-Walacik, M.; Hunicz, J.; Nitkiewicz, S. Combustion engine applications of waste tyre pyrolytic oil. Prog. Energy Combust. Sci. 2021, 85, 100915. [Google Scholar] [CrossRef]
  31. Hamid, M.; Wesołowski, M. Waste-to-energy technologies as the future of internal combustion engines. Combust. Engines 2023, 193, 52–63. [Google Scholar] [CrossRef]
  32. Ferdoush, M.R.; Al Aziz, R.; Karmaker, C.L.; Debnath, B.; Limon, M.H.; Bari, A.B.M.M. Unraveling the challenges of waste-to-energy transition in emerging economies: Implications for sustainability. Innov. Green Dev. 2024, 3, 100121. [Google Scholar] [CrossRef]
  33. Muthukumar, K.; Kasiraman, G. Utilization of fuel energy from single-use Low-density polyethylene plastic waste on CI engine with hydrogen enrichment—An experimental study. Energy 2024, 289, 129926. [Google Scholar] [CrossRef]
  34. EN 590; Automotive Fuels—Diesel—Requirements and Test Methods. European Committee for Standardization: Brussels, Belgium, 2022.
  35. Zeman, P.; Hönig, V.; Kotek, M.; Táborský, J.; Obergruber, M.; Mařík, J.; Hartová, V.; Pechout, M. Hydrotreated vegetable oil as a fuel from waste materials. Catalysts 2019, 9, 337. [Google Scholar] [CrossRef]
  36. Murphy, F.; Devlin, G.; Mcdonnell, K. The evaluation of flash point and cold filter plugging point with blends of diesel and Cyn-diesel pyrolysis fuel for automotive engines. Open Fuels Energy Sci. J. 2013, 6, 1–8. [Google Scholar] [CrossRef][Green Version]
  37. Gala, A.; Guerrero, M.; Guirao, B.; Domine, M.E.; Serra, J.M. Characterization and Distillation of Pyrolysis Liquids Coming from Polyolefins Segregated of MSW for Their Use as Automotive Diesel Fuel. Energy Fuels 2020, 34, 5969–5982. [Google Scholar] [CrossRef]
  38. Ambrosewicz-Walacik, M.; Wierzbicki, S.; Mikulski, M.; Podciborski, T. Ternary fuel mixture of diesel, rapeseed oil and tyre pyrolytic oil suitable for modern CRDI engines. Transport 2018, 33, 727–740. [Google Scholar] [CrossRef]
  39. Acharya, N.; Nanda, P.; Panda, S.; Acharya, S. Analysis of properties and estimation of optimum blending ratio of blended mahua biodiesel. Eng. Sci. Technol. Int. J. 2017, 20, 511–517. [Google Scholar] [CrossRef]
  40. Alptekin, E.; Canakci, M. Determination of the density and the viscosities of biodiesel-diesel fuel blends. Renew. Energy 2008, 33, 2623–2630. [Google Scholar] [CrossRef]
  41. Setiawan, A.; Setiani, V.; Mazdhatina, O.S. Characterization of fuel oil from pyrolysis waste light density polyethylene (LDPE) and polypropylene (PP). IOP Conf. Ser. Mater. Sci. Eng. 2021, 1034, 012069. [Google Scholar] [CrossRef]
  42. Kartik, S.; Balsora, H.K.; Sharma, M.; Saptoro, A.; Jain, R.K.; Joshi, J.B.; Sharma, A. Valorization of plastic wastes for production of fuels and value-added chemicals through pyrolysis—A review. Therm. Sci. Eng. Prog. 2022, 32, 101316. [Google Scholar] [CrossRef]
  43. Oni, B.A.; Sanni, S.E.; Olabode, O.S. Production of fuel-blends from waste tyre and plastic by catalytic and integrated pyrolysis for use in compression ignition (CI) engines. Fuel 2021, 297, 120801. [Google Scholar] [CrossRef]
  44. Shehata, M.; Okeily, M.A.; Hammad, A.S. Valorisation of shredded waste tyres through sequential thermal and catalytic pyrolysis for the production of diesel-like fuel. Results Eng. 2024, 21, 101718. [Google Scholar] [CrossRef]
  45. Ghurri, A.; Kim, J.D.; Kim, H.G.; Jung, J.Y.; Song, K.K. The effect of injection pressure and fuel viscosity on the spray characteristics of biodiesel blends injected into an atmospheric chamber. J. Mech. Sci. Technol. 2012, 26, 2941–2947. [Google Scholar] [CrossRef]
  46. Knothe, G.; Steidley, K.R. Kinematic viscosity of biodiesel fuel components and related compounds. Influence of compound structure and comparison to petrodiesel fuel components. Fuel 2005, 84, 1059–1065. [Google Scholar] [CrossRef]
  47. Tate, R.E.; Watts, K.C.; Allen, C.A.W.; Wilkie, K.I. The viscosities of three biodiesel fuels at temperatures up to 300 °C. Fuel 2006, 85, 1010–1015. [Google Scholar] [CrossRef]
  48. Tesfa, B.; Mishra, R.; Gu, F.; Powles, N. Prediction models for density and viscosity of biodiesel and their effects on fuel supply system in CI engines. Renew. Energy 2010, 35, 2752–2760. [Google Scholar] [CrossRef]
  49. Cristofaro, M.; Edelbauer, W.; Koukouvinis, P.; Gavaises, M. Influence of Diesel Fuel Viscosity on Cavitating Throttle Flow Simulations under Erosive Operation Conditions. ACS Omega 2020, 5, 7182–7192. [Google Scholar] [CrossRef]
  50. Soudagar, M.E.M.; Nik-Ghazali, N.N.; Abul Kalam, M.; Badruddin, I.A.; Banapurmath, N.R.; Akram, N. The effect of nano-additives in diesel-biodiesel fuel blends: A comprehensive review on stability, engine performance and emission characteristics. Energy Convers. Manag. 2018, 178, 146–177. [Google Scholar] [CrossRef]
  51. Schaschke, C.; Fletcher, I.; Glen, N. Density and viscosity measurement of diesel fuels at combined high pressure and elevated temperature. Processes 2013, 1, 30–48. [Google Scholar] [CrossRef]
  52. Rowane, A.J.; Mahesh Babu, V.; Rokni, H.B.; Moore, J.D.; Gavaises, M.; Wensing, M.; Gupta, A.; McHugh, M.A. Effect of Composition, Temperature, and Pressure on the Viscosities and Densities of Three Diesel Fuels. J. Chem. Eng. Data 2019, 64, 5529–5547. [Google Scholar] [CrossRef]
  53. Bietresato, M.; Bolla, A.; Caligiuri, C.; Renzi, M.; Mazzetto, F. The kinematic viscosity of conventional and bio-based fuel blends as a key parameter to indirectly estimate the performance of compression-ignition engines for agricultural purposes. Fuel 2021, 298, 120817. [Google Scholar] [CrossRef]
  54. Robertson, L.X.; Schaschke, C.J. Combined high pressure and low temperature viscosity measurement of biodiesel. Energy Fuels 2010, 24, 1293–1297. [Google Scholar] [CrossRef]
  55. Joshi, R.M.; Pegg, M.J. Flow properties of biodiesel fuel blends at low temperatures. Fuel 2007, 86, 143–151. [Google Scholar] [CrossRef]
  56. Ding, H.; Wang, C.; Zhu, X. Estimation of the kinematic viscosities of bio-oil/alcohol blends: Kinematic viscosity-temperature formula and mixing rules. Fuel 2019, 254, 115687. [Google Scholar] [CrossRef]
  57. Sudan Reddy Dandu, M.; Nanthagopal, K. Tribological aspects of biofuels—A review. Fuel 2019, 258, 116066. [Google Scholar] [CrossRef]
  58. Shatrov, M.G.; Golubkov, L.N.; Dunin, A.U.; Yakovenko, A.L.; Dushkin, P.V. Influence of high injection pressure on fuel injection perfomances and diesel engine worcking process. Therm. Sci. 2015, 19, 2245–2253. [Google Scholar] [CrossRef]
  59. Lu, X.; Zhao, J.; Markov, V.; Wu, T. Study on precise fuel injection under multiple injections of high pressure common rail system based on deep learning. Energy 2024, 307, 132784. [Google Scholar] [CrossRef]
  60. Petrea, N.D.; Bujoreanu, C. Importance of Fuel Injection System for Low Emissions, Combustion Noise and Low Fuel Consumption. IOP Conf. Ser. Mater. Sci. Eng. 2018, 444, 042020. [Google Scholar]
  61. Hazrat, M.A.; Rasul, M.G.; Khan, M.M.K. Lubricity Improvement of the Ultra-low Sulfur Diesel Fuel with the Biodiesel. Energy Procedia 2015, 75, 111–117. [Google Scholar] [CrossRef]
  62. Barbour, R.H.; Rickeard, D.J.; Elliott, N.G. Understanding Diesel Lubricity; SAE Technical Papers; SAE International: Warrendale, PA, USA, 2000. [Google Scholar]
  63. Zulkifli, N.W.M.; Kalam, M.A.; Masjuki, H.H.; Shahabuddin, M.; Yunus, R. Wear prevention characteristics of a palm oil-based TMP (trimethylolpropane) ester as an engine lubricant. Energy 2013, 54, 167–173. [Google Scholar] [CrossRef]
  64. Kaminski, P. Investigation Lubricity Performance of Lubricating Oil Used in Marine Diesel Engine—Fuel Injection Pump. Appl. Sci. 2024, 14, 6148. [Google Scholar] [CrossRef]
  65. Chodkiewicz, A.; Kałdoński, T. Analysis of standards for testing lubricity properties on a four-ball apparatus used in Poland. Bull. Mil. Univ. Technol. 2020, 69, 129–152. [Google Scholar] [CrossRef]
  66. Szpica, D.; Czaban, J.; Banaszuk, P.; Weresa, E. The diesel and the vegetable oil properties assessment in terms of pumping capability and cooperation with internal combustion engine fuelling system. Acta Mech. Autom. 2015, 9, 14–18. [Google Scholar] [CrossRef]
  67. Kuszewski, H.; Jakubowski, M.; Jaworski, A.; Lubas, J.; Balawender, K. Effect of temperature on tribological properties of 1-butanol–diesel fuel blends—Preliminary experimental study using the HFRR method. Fuel 2021, 296, 120700. [Google Scholar] [CrossRef]
  68. Jenkins, R.W.; Moore, C.M.; Semelsberger, T.A.; Chuck, C.J.; Gordon, J.C.; Sutton, A.D. The Effect of Functional Groups in Bio-Derived Fuel Candidates. ChemSusChem 2016, 9, 922–931. [Google Scholar] [CrossRef] [PubMed]
  69. Priyan, M.S.; Hariharan, P. Abrasive wear modes in ball-cratering test conducted on Fe73Si15 Ni10Cr2 alloy deposited specimen. Tribol. Ind. 2014, 36, 97–106. [Google Scholar]
  70. Gee, M.G.; Gant, A.; Hutchings, I.M.; Bethke, R.; Schiffman, K.; Van Acker, K.; Poulat, S.; Gachon, Y.; von Stebut, J. Measurement Good Practice Guide No 57—Ball Cratering or Micro-Abrasion Wear Testing of Coatings; Measurement Good Practice Guide; NPL Publications: Teddington, UK, 2002. [Google Scholar]
  71. Borawski, A. Impact of operating time on selected tribological properties of the friction material in the brake pads of passenger cars. Materials 2021, 14, 884. [Google Scholar] [CrossRef] [PubMed]
  72. Borawski, A.; Szpica, D.; Mieczkowski, G. Research on Tribological Features of Brake Friction Materials-Comparison of the Results Obtained with the Pin-On-Disc and Ball-Cratering Methods. Mechanika 2022, 28, 317–322. [Google Scholar] [CrossRef]
  73. Mikulski, M.; Hunicz, J.; Duda, K.; Kazimierski, P.; Suchocki, T.; Rybak, A. Tyre pyrolytic oil fuel blends in a modern compression ignition engine: A comprehensive combustion and emissions analysis. Fuel 2022, 320, 123869. [Google Scholar] [CrossRef]
  74. EN 116; Diesel and Domestic Heating Fuels-Determination of Cold Filter Plugging Point-Stepwise Cooling Bath Method. European Committee for Standardization (CEN): Brussels, Belgium, 2015.
  75. ASTM D4052; Standard Test Method for Density, Relative Density, and API Gravity of Liquids by Digital Density Meter. American Society for Testing and Materials: West Conshohocken, PA, USA, 2022.
  76. ISO 2555; Plastics—Resins in the Liquid State or as Emulsions or Dispersions-Determination of Apparent Viscosity Using a Single Cylinder Type Rotational Viscometer Method. International Organization for Standardization: Geneva, Switzerland, 2018.
  77. ISO 20623; Petroleum and Related Products—Determination of the Extreme-Pressure and Anti-Wear Properties of Lubricants—Four-Ball Method (European Conditions). International Organization for Standardization: Geneva, Switzerland, 2017.
  78. ASTM D 2783; Standard Test Method for Measurement of Extreme-Pressure Properties of Lubricating Fluids (Four-Ball Method). American Society for Testing and Materials: West Conshohocken, PA, USA, 2021.
  79. ISO 12156-1; Diesel Fuel—Assessment of Lubricity Using the High-Frequency Reciprocating Rig (HFRR)—Part 1: Test Method. ISO: Geneva, Switzerland, 2023.
  80. ASTM D975; Standard Specification for Diesel Fuel. American Society for Testing and Materials: West Conshohocken, PA, USA, 2023.
  81. Kuszewski, H.; Jaworski, A.; Ustrzycki, A. Lubricity of ethanol–diesel blends—Study with the HFRR method. Fuel 2017, 208, 491–498. [Google Scholar] [CrossRef]
  82. EN ISO 3104; Petroleum Products—Transparent and Opaque Liquids—Determination of Kinematic Viscosity and Calculation of Dynamic Viscosity. International Organization for Standardization: Geneva, Switzerland, 2023.
  83. Hartikka, T.; Kuronen, M.; Kiiski, U. Technical Performance of HVO (Hydrotreated Vegetable Oil) in Diesel Engines; SAE Technical Papers; SAE International: Warrendale, PA, USA, 2012; Volume 9. [Google Scholar]
  84. Malinowska, M.; Zera, D. Analiza zmian smarności oleju silnikowego stosowanego w silniku Cegielski-Sulzer 3AL25/30. Zesz. Nauk. Akad. Morskiej W Gdyni 2016, 96, 93–104. [Google Scholar]
  85. Lewalski, M.; Muślewski, Ł.; Landowski, B.; Gniot, M. Optymalizacja doboru _rodka smarnego na podstawie diagnozy stanu wybranego układu mechanicznego. Stud. Proc. Pol. Assoc. Knowl. Manag. 2016, 79, 132–144. [Google Scholar]
  86. Szczypiński-Szala, W. Ocena własności smarnych paliw rzepakowych. Czas. Techniczne. Mech. 2012, 109, 279–286. [Google Scholar]
  87. Dodos, G.S.; Vassileiou, F.; Karonis, D. Lubricity of Diesel Fuel Hydrocarbons and Surrogate Fuels; SAE Technical Papers; SAE International: Warrendale, PA, USA, 2017. [Google Scholar]
  88. Worldwide Fuel Charter 2019. In Gasoline and Diesel Fuel, 6th ed.; ACEA: Brussels, Belgium, 2019.
  89. Song, R.; Yu, H.; Song, H. Tribological Behavior of Biomass Fast Pyrolysis Fuel and Diesel Blends. Appl. Sci. 2022, 12, 2540. [Google Scholar] [CrossRef]
  90. Gil, L.; Pieniak, D.; Kozłowski, E.; Selech, J. Impact of selected biofuels and diesel as lubricants on the statistical distribution and course of sliding friction coefficients for the kinematic pair 100Cr6-100Cr6. Tribologia 2019, 288, 17–23. [Google Scholar] [CrossRef]
  91. Huynh, K.K.; Pham, S.T.; Tieu, K.A.; Wan, S. Tribocatalysis Induced Carbon-Based Tribofilms—An Emerging Tribological Approach for Sustainable Lubrications. Lubricants 2023, 11, 327. [Google Scholar] [CrossRef]
  92. EN 14078; Liquid Petroleum Products-Determination of Fatty Acid Methyl Ester (FAME) Content in Middle Distillates-Infrared Spectrometry Method. European Committee for Standardization: Brussels, Belgium, 2014.
  93. EN 61326-1; Electrical Equipment for Measurement, Control and Laboratory Use-EMC Requirements-Part 1: General Requirements. European Committee for Standardization: Brussels, Belgium, 2006.
  94. ASTM D7668; Standard Test Method for Determination of Derived Cetane Number (DCN) of Diesel Fuel Oils—Ignition Delay and Combustion Delay Using a Constant Volume Combustion Chamber Method. American Society for Testing and Materials: West Conshohocken, PA, USA, 2010.
  95. ASTM D240; Standard Test Method for Heat of Combustion of Liquid Hydrocarbon Fuels by Bomb Calorimeter. American Society for Testing and Materials: West Conshohocken, PA, USA, 2019.
  96. ASTM D4809; Standard Test Method for Heat of Combustion of Liquid Hydrocarbon Fuels by Bomb Calorimeter (Precision Method). American Society for Testing and Materials: West Conshohocken, PA, USA, 2013.
  97. ASTM D 93; Standard Test Methods for Flash Point by Pensky-Martens Closed Cup Tester. American Society for Testing and Materials: West Conshohocken, PA, USA, 2020.
  98. ASTM D6079; Standard Test Method for Evaluating Lubricity of Diesel Fuels by the High-Frequency Reciprocating Rig (HFRR). ASTM International: West Conshohocken, PA, USA, 2022.
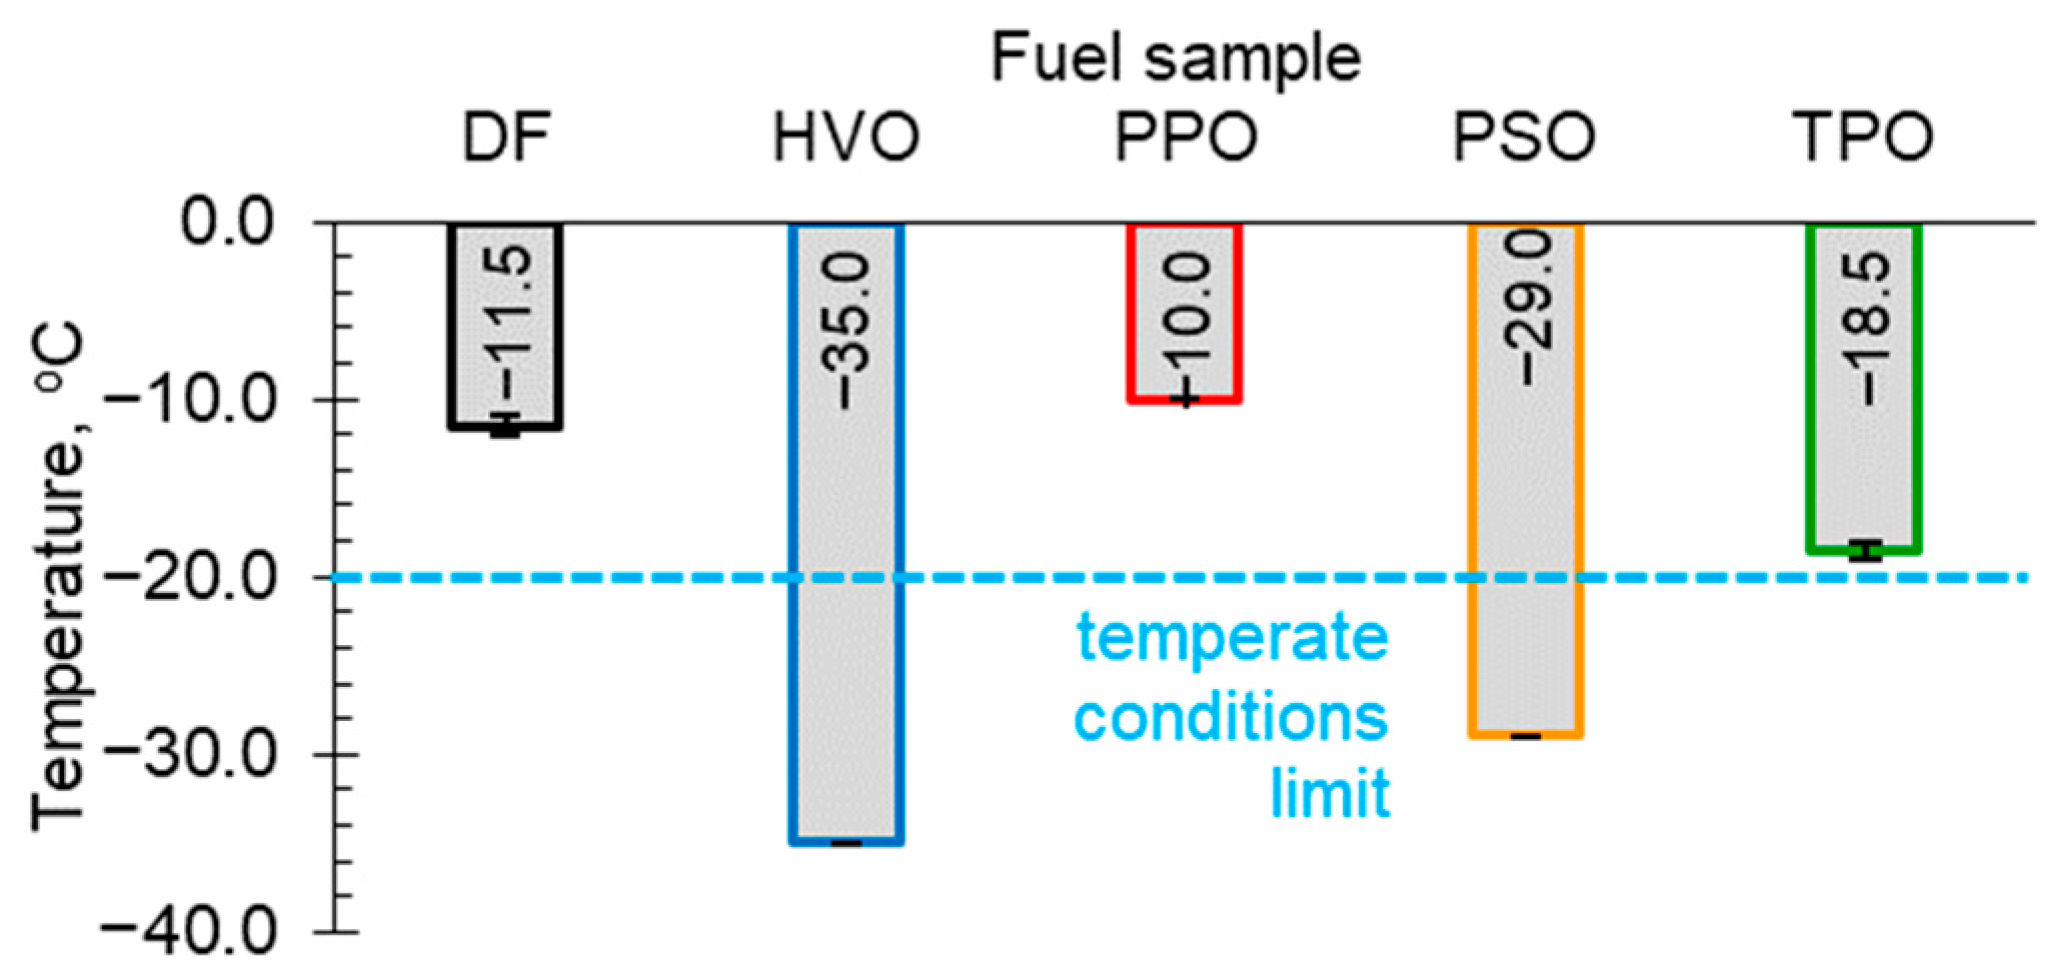
Figure 1. Cold filter blocking tendency for tested fuel samples.
Energies 18 05081 g001
Figure 2. Density dependence of the tested fuel samples on their temperature.
Energies 18 05081 g002
Figure 3. Dependence of dynamic viscosities of tested fuel samples on their temperature.
Energies 18 05081 g003
Figure 4. Dependence of kinematic viscosities of tested fuel samples on their temperature.
Energies 18 05081 g004
Figure 5. Scar lengths for tested fuel samples DF (a), HVO (b), PPO (c), PSO (d) and TPO (e): compensated (dc); averaged from 3 balls (dsa).
Energies 18 05081 g005
Figure 6. Wear scars on the test balls for each fuel sample.
Energies 18 05081 g006
Figure 7. The WSD (a), avg. friction coefficient (b) and avg. film percentage (c) for all analyzed fuel samples.
Energies 18 05081 g007
Figure 8. Determined coefficient of friction values for tested fuel samples.
Energies 18 05081 g008
Figure 9. Measurement of the size of a scar formed as a result of friction in the presence of sample fuels.
Energies 18 05081 g009
Figure 10. Measurement of the size of a scar formed as a result of dry friction.
Energies 18 05081 g010
Table 1. Results of basic physical and chemical tests of fuels.
ParameterUnitDFHVOPPOPSOTPO
Nitrogen contentmg/kg57.0024.00600.00932.007763.00
Sulphur contentmg/kg7.51<1.0016.7913.045000.00
Carbon content %wt.86.7083.9984.6091.1095.76
Hydrogen content%wt.13.1014.2115.208.205.40
Total aromatics content%wt.26.70<1.001.5098.0054.80
FAME content%v6.350.380.000.000.00
Water contentppm38.0017.00123.00576.00827.00
Derived cetane number-55.2974.7027.54<15.0032.33
Lower heating valueMJ/kg42.5543.9044.8640.5542.58
Flash point°C66.8078.20<24.0032.0057.50
Table 2. Coefficients of the trend lines describing the dependence of the density of the tested fuel samples on their temperature.
Fuel
Sample
Coefficients of the Trend Function
abR2
DF−0.00070.84680.9993
HVO−0.00070.79420.9998
PPO−0.00080.79480.9965
PSO−0.00080.97060.9992
TPO−0.00070.92060.9998
Table 3. Determined values of trend line parameters with coefficients of determination—dynamic viscosity.
Fuel
Sample
Coefficients of the Trend Function
abcR2
DF0.0009−0.12296.43410.9894
HVO0.0005−0.08165.63860.9757
PPO0.0005−0.06802.85050.9536
PSO0.0008−0.14277.95130.9888
TPO0.0003−0.04863.48740.9906
Table 4. Determined values of trend line parameters with determination coefficients—kinematic viscosity.
Fuel
Sample
Coefficients of the Trend Function
abcR2
DF0.0010−0.14087.60070.9886
HVO0.0006−0.09737.09690.9742
PPO0.0007−0.08363.58450.9519
PSO0.0002−0.04743.59240.9894
TPO0.0008−0.15028.64230.9875
Table 5. Summary of crater size measurement results and calculated value of the abrasive wear rate coefficient.
Fuel
Sample
b1,
mm
b2,
mm
ba,
m
Kc,
m3/(N × m)
DF0.250.220.0002354.17 × 10−18
HVO0.280.240.0002606.25 × 10−18
PPO0.420.630.0005251.04 × 10−16
PSO0.220.260.0002404.54 × 10−18
TPO0.230.330.0002808.40 × 10−18
Dry1.561.580.0015708.31 × 10−15
Disclaimer/Publisher’s Note: The statements, opinions and data contained in all publications are solely those of the individual author(s) and contributor(s) and not of MDPI and/or the editor(s). MDPI and/or the editor(s) disclaim responsibility for any injury to people or property resulting from any ideas, methods, instructions or products referred to in the content.