Article

Research on Power Transmission Capacity of Transmission Section for Grid-Forming Renewable Energy via AC/DC Parallel Transmission System Considering Synchronization and Frequency Stability Constraints

1
Inner Mongolia Power (Group) Co., Ltd., Inner Mongolia Electric Power Research Institute Branch, Hohhot 010020, China
2
Electrical Engineering College, Xi’an Jiaotong University, Xi’an 710049, China
*
Author to whom correspondence should be addressed.
Energies 2025, 18(15), 4202; https://doi.org/10.3390/en18154202
Submission received: 2 July 2025 / Revised: 30 July 2025 / Accepted: 1 August 2025 / Published: 7 August 2025

Abstract

AC/DC parallel transmission is a critical approach for large-scale centralized transmission. Existing assessments of power transfer capability in AC/DC corridors rarely incorporate comprehensive security and stability constraints, potentially leading to overestimated results. This paper investigates a grid-forming renewable energy system integrated via AC/DC parallel transmission. First, the transmission section’s power transfer limit under N-1 static security constraints is determined. Subsequently, analytical conditions satisfying synchronization and frequency stability constraints are derived using the equal area criterion and frequency security indices, revealing the impacts of AC/DC power allocation and system parameters on transfer capability. Finally, by integrating static security, synchronization stability, and frequency stability constraints, an operational region for secure AC/DC power dispatch is established. Based on this region, an optimal power allocation scheme maximizing the corridor’s transfer capability is proposed. The theoretical framework and methodology enhance system transfer capacity while ensuring AC/DC parallel transmission security, with case studies validating the theory’s correctness and method’s effectiveness.

1. Introduction

With global warming and the proposal of “carbon peak and carbon neutrality” targets, the development and utilization of renewable energy has become an inevitable trend in the global energy sector [1,2,3]. China has established the world’s largest hybrid AC/DC grid with the highest voltage levels [4,5,6]. Transmitting renewable energy through AC/DC hybrid systems has proven an effective solution to address the reverse distribution between China’s load demand and energy resources. However, existing research on power transmission limits in AC/DC hybrid systems rarely considers the dynamic coupling between AC and DC transmission lines during faults. Relying solely on steady-state power flow solutions to determine the transmission limits of the AC/DC transmission section may lead to distortion in the feasible power transfer region, posing instability risks under fault conditions. Therefore, this study comprehensively evaluates the impact of various stability constraints on power transmission limits in AC/DC systems, reveals the dynamic coupling relationship between AC and DC transmission capacities, and ultimately maximizes the utilization of hybrid transmission capabilities to enhance system power transmission limits.
Current research on calculation methods for the power transmission limits of transmission systems primarily falls into four categories: Repeated Power Flow (RPF) [7,8], Continuation Power Flow (CPF) [9], Optimal Power Flow (OPF) [10], and Sensitivity Analysis methods [11,12]. Both RPF and CPF determine the system’s power transmission limit by progressively increasing the transmission power of lines until security and stability constraints are triggered. However, the power growth path in these methods is artificially defined, potentially introducing subjectivity and lacking a conservative assessment. OPF employs optimization algorithms to determine the power transmission limit under constraints by constructing an optimization model. Nevertheless, studies have shown that OPF suffers from long computation times and poor convergence when numerous constraints are considered, as in [13]. Sensitivity Analysis methods simplify nonlinear terms in the network through linearization, making power transmission limit calculations more efficient and convergent, albeit at the cost of some accuracy. In recent years, significant research has been conducted in these areas. Reference [14] proposed an improved CPF model incorporating the prediction of inter-regional tie-line transmission power, enhancing the accuracy of distributed power transmission limit calculations for multi-area interconnected grids. Reference [15] investigated calculation methods based on active power flow sensitivity and comprehensive sensitivity for transmission section power limits, utilizing particle swarm optimization for transmission section over-limit control. However, these methods are largely applicable to steady-state scenarios and fail to adequately account for the impact of transient stability constraints under fault conditions on system power transmission limits. Moreover, being predominantly based on numerical computation, they struggle to mechanistically reveal the influence of various security and stability constraints on system power transmission limits.
In fact, with the increasing complexity of grid structures and numerous integrations of power electronic devices, AC/DC hybrid systems face significant stability challenges under fault conditions [16,17,18]. The power transmission capacity is constrained by various transient stability limitations. Reference [19] investigated hybrid AC/DC grids with high-penetration renewable energy, analyzing its impact and highlighting that security and stability issues become more pronounced when significant changes occur in the generation mix. To address potential low-frequency operation risks in AC systems under severe faults of large-capacity hydropower delivery channels, Reference [20] proposed coordinated AC/DC control strategies from a frequency stability perspective, thereby enhancing grid operational security. Reference [21] established electromagnetic transient simulation models of hybrid AC/DC grids incorporating large-scale photovoltaics and energy storage under different DC operating modes. This study examined the stable operating characteristics of AC/DC grids under these modes, validating the effectiveness of related control measures in enhancing stability for weak systems. Considering the impact of wind power uncertainty on the maximum transmission capacity of hybrid AC/DC transmission systems, Reference [22] introduced an assessment method for evaluating the maximum transmission capacity of “sandy-gobi-desert” hybrid AC/DC transmission systems, accounting for renewable generation uncertainty. While these studies discuss the security and stability challenges in AC/DC hybrid systems, they lack analysis of how transient stability constraints influence power transmission limits. Therefore, it is imperative to reveal the underlying mechanisms through which transient stability constraints impact the power transmission limits of AC/DC systems, providing theoretical guidance for secure and stable grid planning.
In conclusion, current research on power transmission limits of transmission systems predominantly focuses on steady-state operation and numerical computation, lacking consideration of multiple transient stability constraints and struggles to mechanistically reveal the influence of relevant factors on power transmission limits. Moreover, current analyses of AC/DC transient stability rarely incorporate their impact on system power transmission limits and lack strategic measures for enhancing these limits. To address these gaps, in Chapter 2, a mathematical model for the AC/DC parallel transmission system is established. In Chapter 3, starting from the N-1 static security constraints of the AC/DC parallel transmission system, the analytical conditions that the AC/DC transmission power needs to satisfy under synchronous stability constraints and frequency stability constraints are further derived. This reveals the key factors affecting the transmission capacity of the AC/DC parallel transmission system. In Chapter 4, a method for distributing the AC/DC transmission power to maximize the transmission capacity of the system’s transmission section is proposed, which achieved an improvement in the system’s transmission power limit while also considering system safety and stability. In Chapter 5, the validity of the theory is verified through a case analysis based on MATLAB/Simulink. Chapter 6 concludes the paper.

2. System Model

This study focuses on an AC/DC parallel transmission system where a grid-forming renewable energy plant at the sending end delivers power through parallel VSC-HVDC and AC transmission lines. Its equivalent model is illustrated in Figure 1. The renewable energy plant is represented as a grid-forming renewable energy unit connected to the Point of Common Coupling (PCC) via a reactor X p r . The PCC voltage is defined as U p θ p . The receiving-end grid, characterized by high strength, is modeled as an infinite bus with voltage U s θ s . Additionally, X l 1 denotes the equivalent line reactance between the PCC and the sending-end converter station. X l 2 denotes the equivalent reactance of the AC transmission line connecting the sending-end and receiving-end systems. X T 1 and X T 2 denote the equivalent reactance of the sending-end and receiving-end transformers, respectively. P D C and P A C denote the active power transmitted through the DC line and AC line, respectively.
Given the absence of synchronous units in the sending-end system, the renewable energy plant employs Virtual Synchronous Generator (VSG) control to provide frequency and inertial support when necessary, with its control block diagram depicted in Figure 2.
The dynamic equations of the renewable energy plant can be expressed as follows:
d θ 1 d t = ω 1 J d ω 1 d t = P r e f 1 P c D 1 ( ω 1 ω r e f )
where θ 1 denotes the power angle of the renewable energy plant; ω 1 represents its angular frequency; ω r e f is the system reference angular frequency; J 1 indicates the inertia constant; P r e f 1 denotes the active power reference; P c denotes the output active power; and D 1 denotes the damping coefficient.
The control strategies for the VSC-based sending-end converter station primarily include V-F control and VSG control. While V-F control eliminates frequency issues at the sending end, it transfers all power disturbances entirely to the receiving end, jeopardizing grid security. To leverage frequency regulation resources at the sending end, this paper implements VSG control on the sending-end converter. Its dynamic equations are
d θ 2 d t = ω 2 J 2 d ω 2 d t = P r e f 2 P D C D 2 ( ω 2 ω r e f )
where θ 2 denotes the converter’s power angle; ω 2 represents its angular frequency; ω r e f is the system reference angular frequency; J 2 indicates the inertia constant; P r e f 2 corresponds to the active power reference; P D C signifies the output active power; and D 2 denotes the damping coefficient.
Based on the above models of the renewable energy unit and sending-end converter, the active power P transmitted through the AC transmission line is derived from the power flow equation as follows:
P = U 1 U 2 X l sin θ 12
where U 1 and U 2 are voltage magnitudes at both ends; X l is the line reactance; and θ 12 denotes the voltage phase-angle difference.
The DC line’s transmitted power is governed by the sending-end converter’s power reference. Under steady-state conditions, the active power balance in Figure 1 satisfies
P c = P r e f 1 P D C = P r e f 2 P c = P A C P D C

3. Investigation of Factors Affecting Power Transfer Capability in AC/DC Parallel Transmission Section

3.1. Static Power Transmission Limit of Transmission Section Subject to N-1 Static Security Constraints

The N-1 criterion constitutes a fundamental technical requirement for secure power system operation. The static security constraints for a transmission section satisfying this criterion are defined as follows [23,24]:
  • Under given corridor power flow constraints, all remaining lines remain within thermal limits after disconnecting any single line in the section during normal operation;
  • The section power flow constraint represents the maximum allowable flow during normal operation.
For the AC/DC parallel transmission system in Figure 1, we investigate the static power transmission limit under N-1 static security constraints, ensuring system stability after an AC line outage or DC block.
The post-contingency equivalent model after an AC line outage is shown in Figure 3. The sending-end converter maintains normal operation with VSG-based constant-voltage control stabilizing its voltage magnitude. The equivalent line reactance between the PCC and the converter is denoted as X Σ 1 = X l 1 + X T 1 . Due to the electrical isolation characteristics of VSC-HVDC between sending-end and receiving-end systems, the static transmission limit is governed by the AC line connecting the renewable unit and converter station. According to Equation (3), the AC line reaches its maximum power transfer when the voltage phase-angle difference θ 12 = π / 2 . Thus, the post-contingency static transmission limit is expressed as
P c max = U p U l X l 1 + X T 2 = U p U l X Σ 1
The equivalent system model following a DC blocking event is depicted in Figure 4. Here, the grid-forming renewable energy unit directly connects to the receiving-end grid via the AC transmission line, with equivalent reactance X Σ 2 = X l 1 + X T 1 + X l 2 + X T 2 between the PCC and the receiving-end grid. Similar to the AC outage analysis, the post-contingency static transmission limit can be expressed as
P c max = U p U s X l 1 + X T 1 + X l 2 + X T 2 = U p U s X Σ 2
As indicated by Equations (5) and (6), the larger equivalent reactance following DC blocking reduces the static transmission limit. To ensure no overloads occur on remaining lines after disconnecting any line in the hybrid AC/DC corridor, the post-blocking static transmission limit (defined in Inequality (7)) is adopted as the static security constraint for the transmission corridor.
P c max min U p U l X Σ 1 , U p U s X Σ 2

3.2. Impact of Synchronization Stability Constraints on Transmission Section Transfer Capability

AC/DC parallel transmission systems may experience synchronization instability between sending-end and receiving-end grids during DC blocking or AC line outages. Post-DC blocking, power originally transmitted through the DC line shifts entirely to the AC line, causing a sudden increase in the AC line’s reference power at the sending end. Excessive power transfer may trigger loss of synchronism.
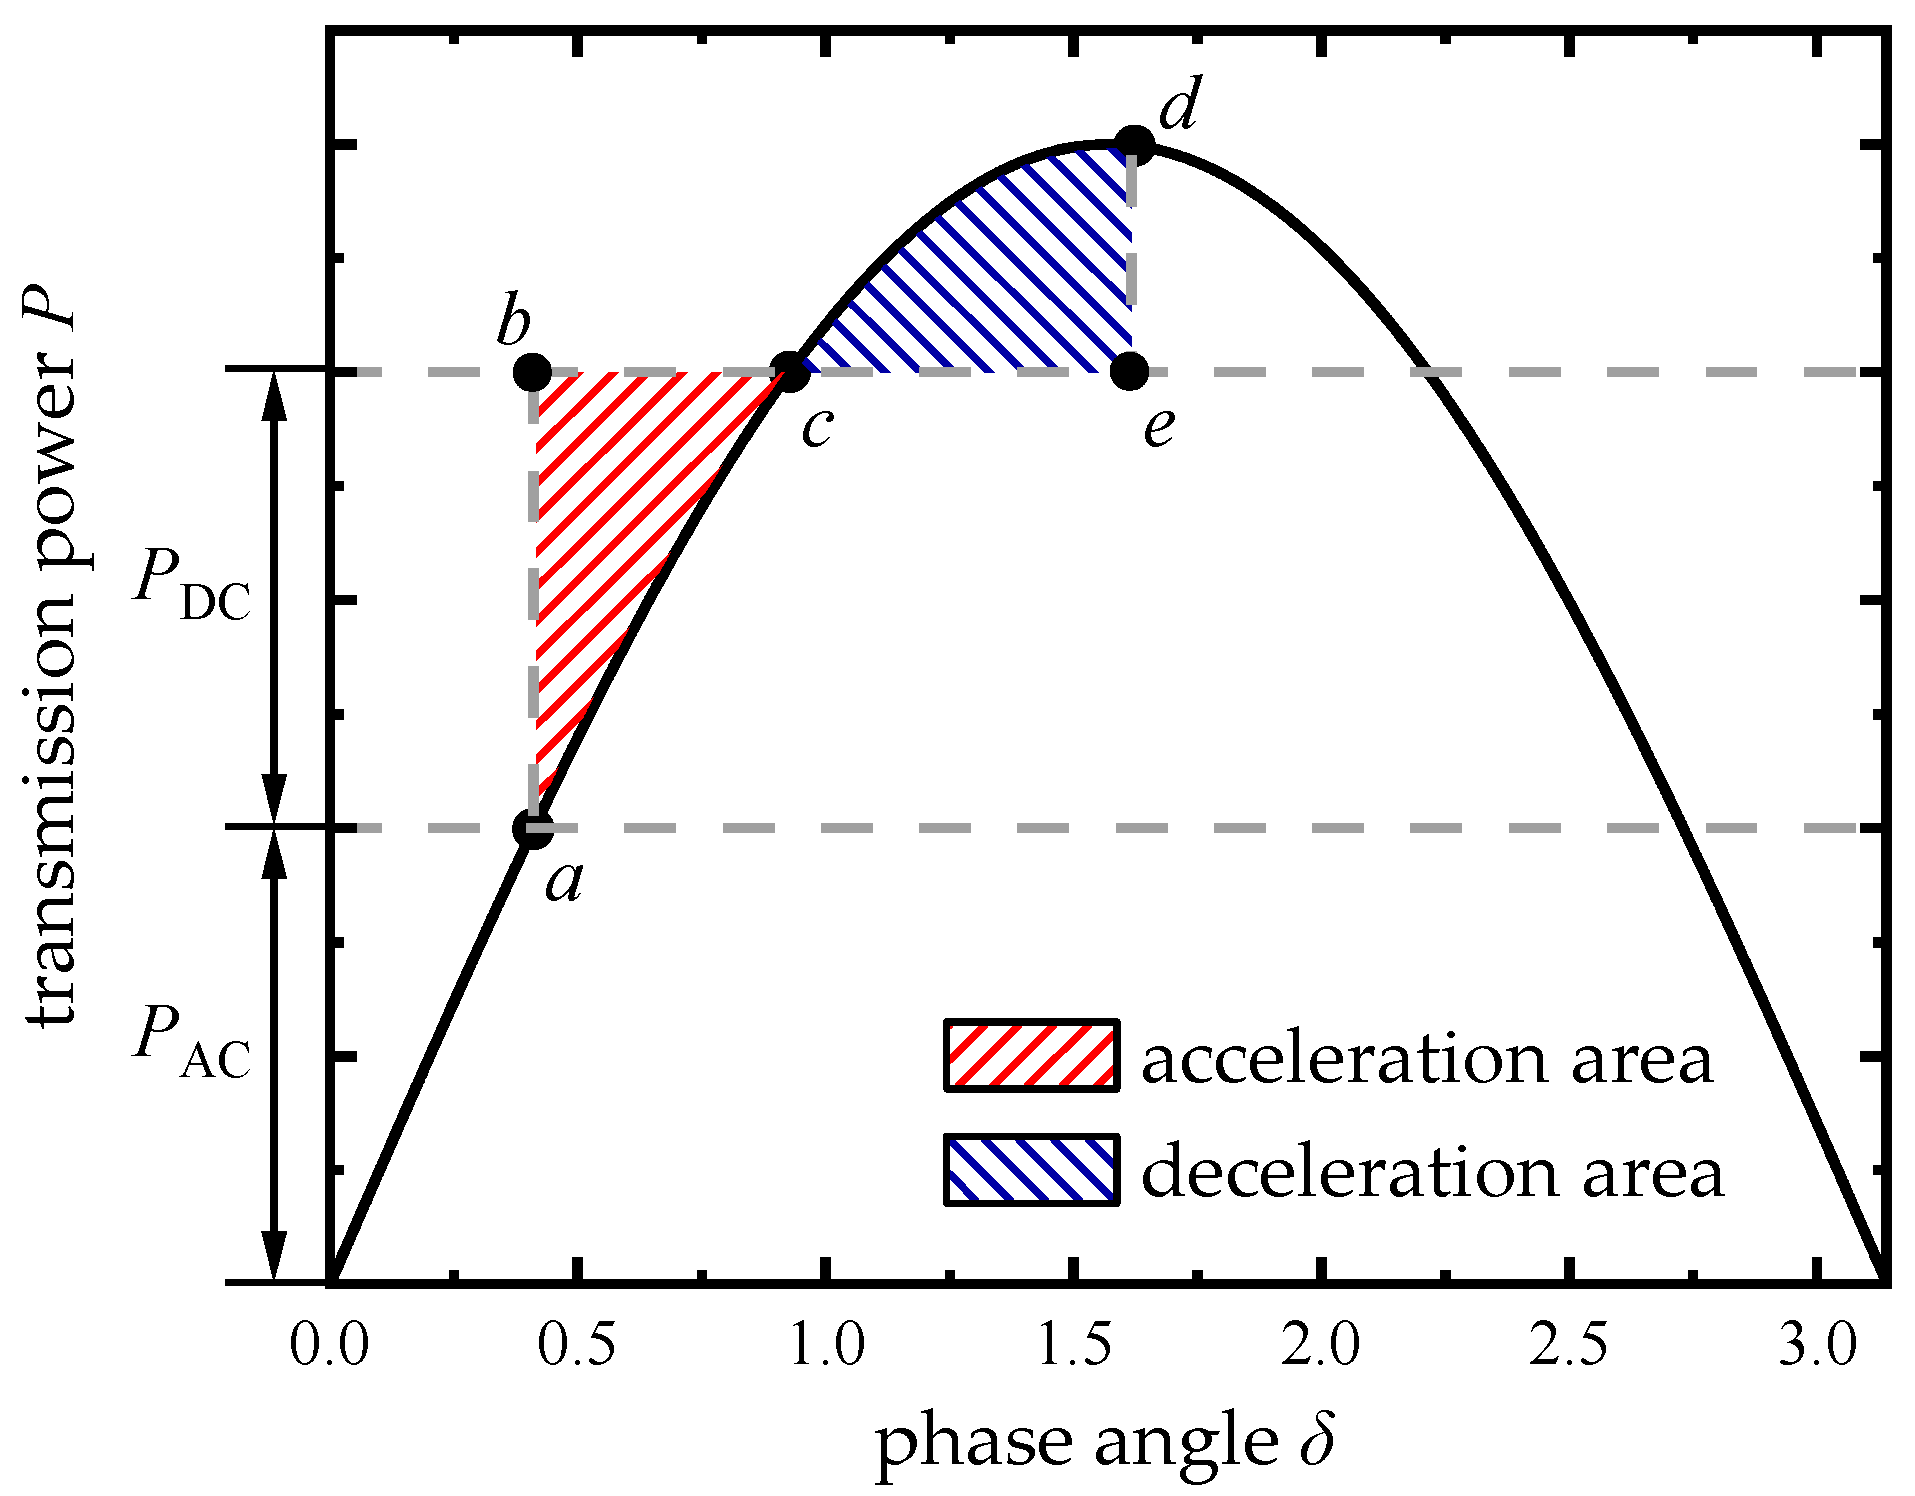
The acceleration and deceleration areas of the system following a DC block are illustrated in Figure 5. Under normal operating conditions, the reference power from the sending-end system to the AC transmission line is the line’s transmission power P D C , with the system’s stable equilibrium point located at point a in Figure 5. After the DC block, the power previously transmitted by the DC line is transferred to the AC line, causing an abrupt increase in the reference power from the sending-end system to the AC transmission line. The magnitude of this increase equals the original DC transmission power P D C . Consequently, the reference power becomes P A C + P D C , exceeding the actual transmission capacity of the AC line. This imbalance accelerates the sending-end system, leading to an increase in the phase angle until it surpasses the post-fault stable equilibrium point c. If the deceleration area beyond point c is insufficient to reduce the sending-end frequency back to the synchronous frequency, the system faces the risk of loss of synchronism between the sending-end and receiving-end systems.
To satisfy the stability constraint for maintaining synchronism between the sending-end and receiving-end systems following a DC block, the transmission power of the DC line P D C and the transmission power of the AC line P A C must satisfy a specific relationship. According to the equal area criterion, ensuring the system’s transient stability requires that the acceleration area be less than or equal to the maximum deceleration area:
S a S d δ a δ c P AC + P DC U 1 U 2 X Σ 2 sin δ d δ δ c δ e U 1 U 2 X Σ 2 sin δ P AC + P DC d δ
where S a represents the acceleration area, S d represents the deceleration area, and X Σ 2 = X l 1 + X T 1 + X l 2 + X T 2 .
Rearranging Inequality (8) yields the following relationship:
P AC + P DC δ e δ a + U 1 U 2 X Σ 2 cos δ e cos δ a 0
where δ e = π sin 1 P AC + P DC X Σ 2 U 1 U 2 and δ a = sin 1 P AC X Σ 2 U 1 U 2
Substituting δ e and δ a into Inequality (9) yields the relationship between the DC transmission power P D C and the AC transmission power P A C that satisfies the synchronism stability constraint for the sending-end and receiving-end systems:
P AC + P DC π sin 1 P AC + P DC X Σ 2 U 1 U 2 sin 1 P AC X Σ 2 U 1 U 2 U 1 U 2 X l 1 P AC + P DC X Σ 2 U 1 U 2 2 + 1 P AC X Σ 2 U 1 U 2 2 0
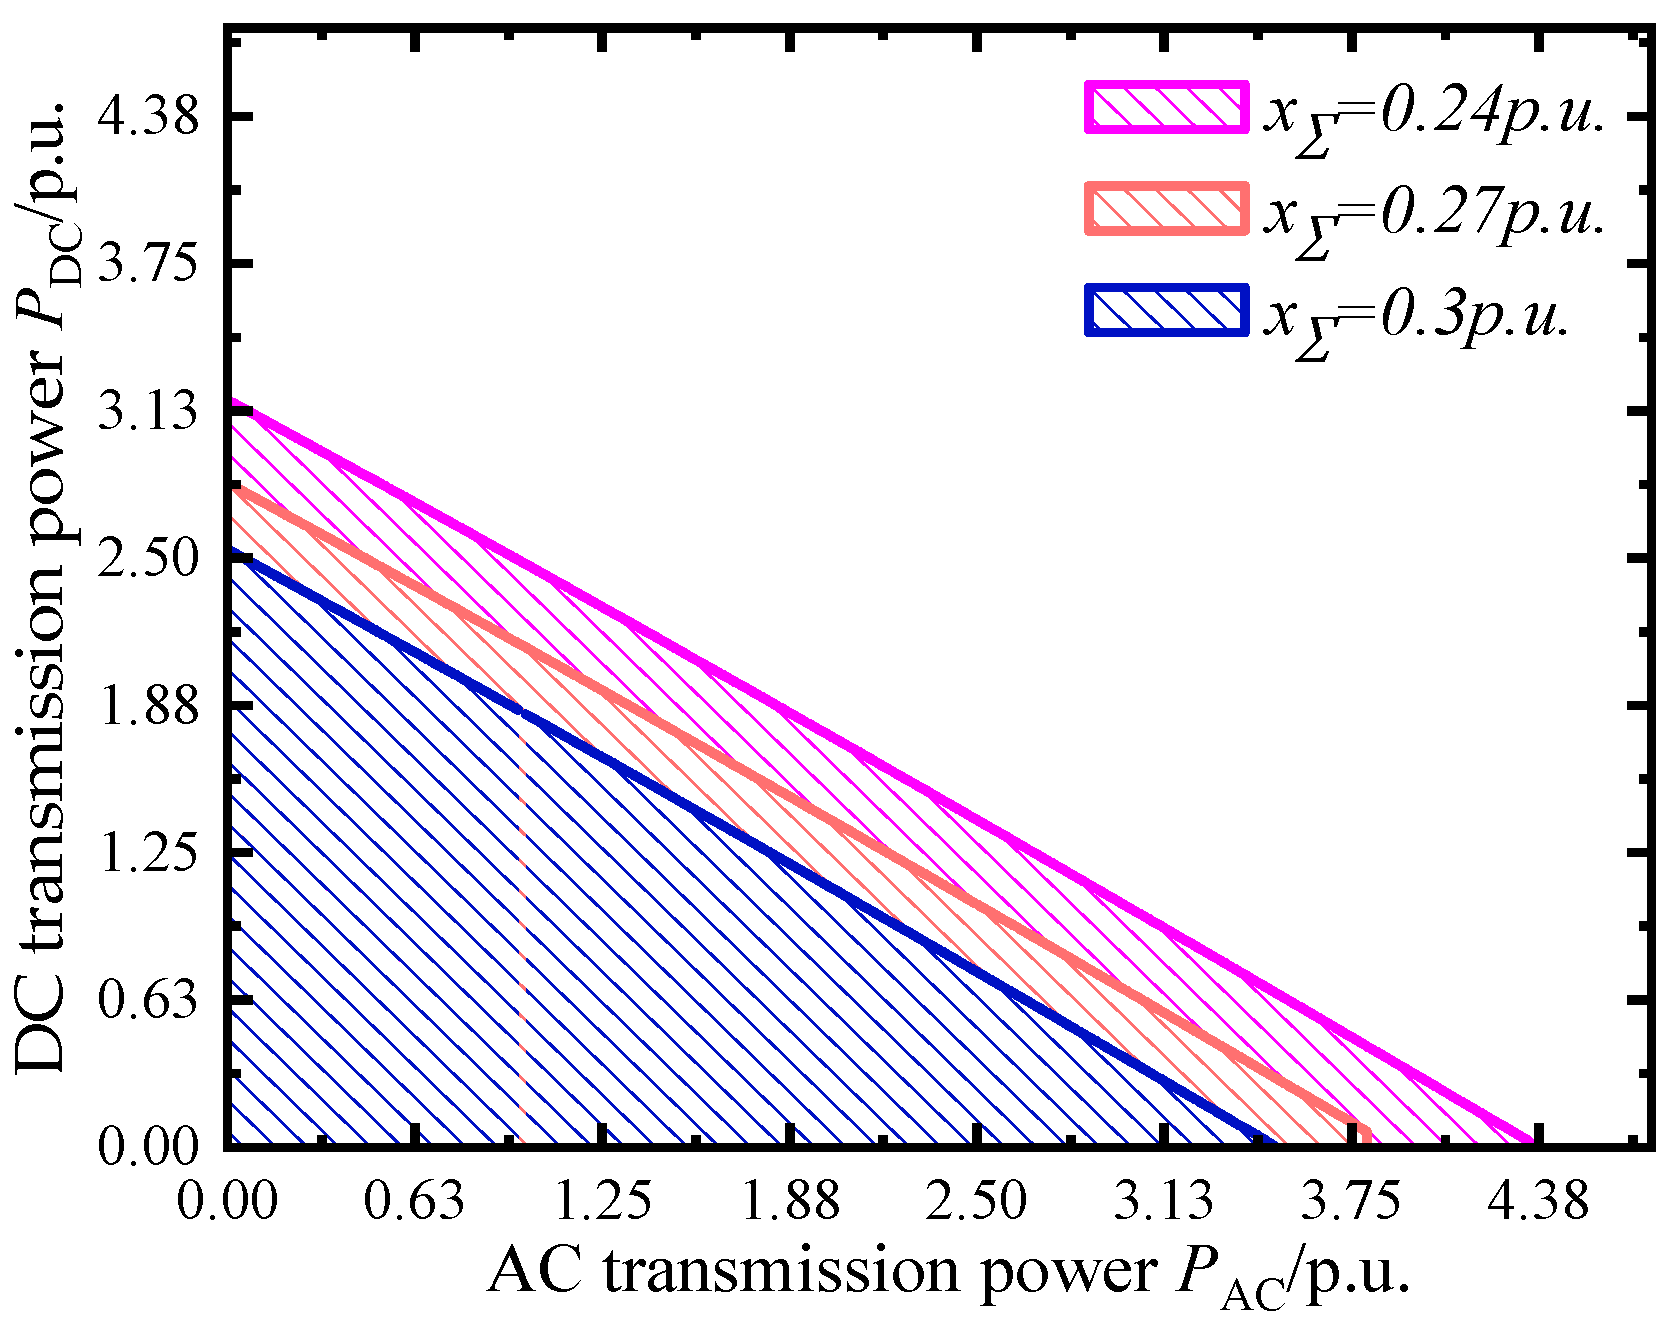
It should be noted that Inequality (10) describes the operational region for P D C and P A C under the synchronism stability constraint, which is illustrated by the blue area in Figure 6. When the operating point ( P A C , P D C ) lies within this region, synchronism stability between the sending-end and receiving-end systems is guaranteed. Furthermore, based on Inequality (10), the extent of the stable operational region satisfying the synchronization stability constraint depends on the transmission line reactance. Specifically, a higher AC transmission line reactance results in a smaller stable operational region, causing the blue area to shift downward in Figure 6.

3.3. Impact of Frequency Stability Constraints on the Transmission Capability of the Transmission Section

Frequency stability issues in the power flow section of AC/DC parallel transmission systems primarily occur in the sending-end system following an AC line outage. Due to the slow adjustment of the converter station’s reference power post-fault, the sending-end converter station maintains its pre-outage reference power level after the AC line outage. This prevents the power originally transmitted through the AC line from being delivered, resulting in a significant active power surplus at the sending end and ultimately triggering frequency stability problems. To ensure that the frequency deviation and Rate of Change of Frequency (ROCOF) at the sending end remain within acceptable limits after an AC line outage, the transferred power caused by the outage—i.e., the pre-outage AC transmission power—must satisfy specific constraints.
Following an AC line outage, simultaneously solving Equations (1) and (2) yields
( J 1 + J 2 ) d ω d t = ( J 1 + J 2 ) d ( ω ω r e f ) d t = ( J 1 + J 2 ) d Δ ω d t = P A C ( D 1 + D 2 ) Δ ω
Let J Σ = J 1 + J 2 and D Σ = D 1 + D 2 . After Laplace transform and rearrangement, the following can be obtained:
Δ f ( s ) = Δ ω ( s ) = P A C J Σ s 2 + D Σ s
Applying the inverse Laplace transform to Equation (12) yields the time-domain expression of the system frequency deviation as follows:
Δ f ( t ) = P A C D Σ ( 1 e D Σ J Σ t )
As indicated by Equation (13), the frequency response of the studied system is a monotonic function of time, with the maximum frequency deviation occurring at t = + . Therefore, to ensure the sending-end frequency deviation remains within acceptable limits, the power imbalance P A C imposed on the sending-end system must satisfy
P A C D Σ Δ f max
According to Equation (11), the initial ROCOF of the sending-end system during the transient fault is
d Δ f d t = P A C J Σ
To ensure the ROCOF at the sending end remains within acceptable limits, the power imbalance P A C imposed on the sending-end system must satisfy
R O C O F max P A C J Σ P A C J Σ R O C O F max
According to system frequency security criteria, Inequalities (14) and (16) must be simultaneously satisfied. Consequently, the frequency security constraint for the maximum permissible power imbalance—corresponding to the maximum transferable AC power—is given by
P AC max = min D Σ Δ f max , J Σ R O C O F max

4. Optimal Configuration Scheme Maximizing the Transmission Capability of the AC/DC Transmission Section

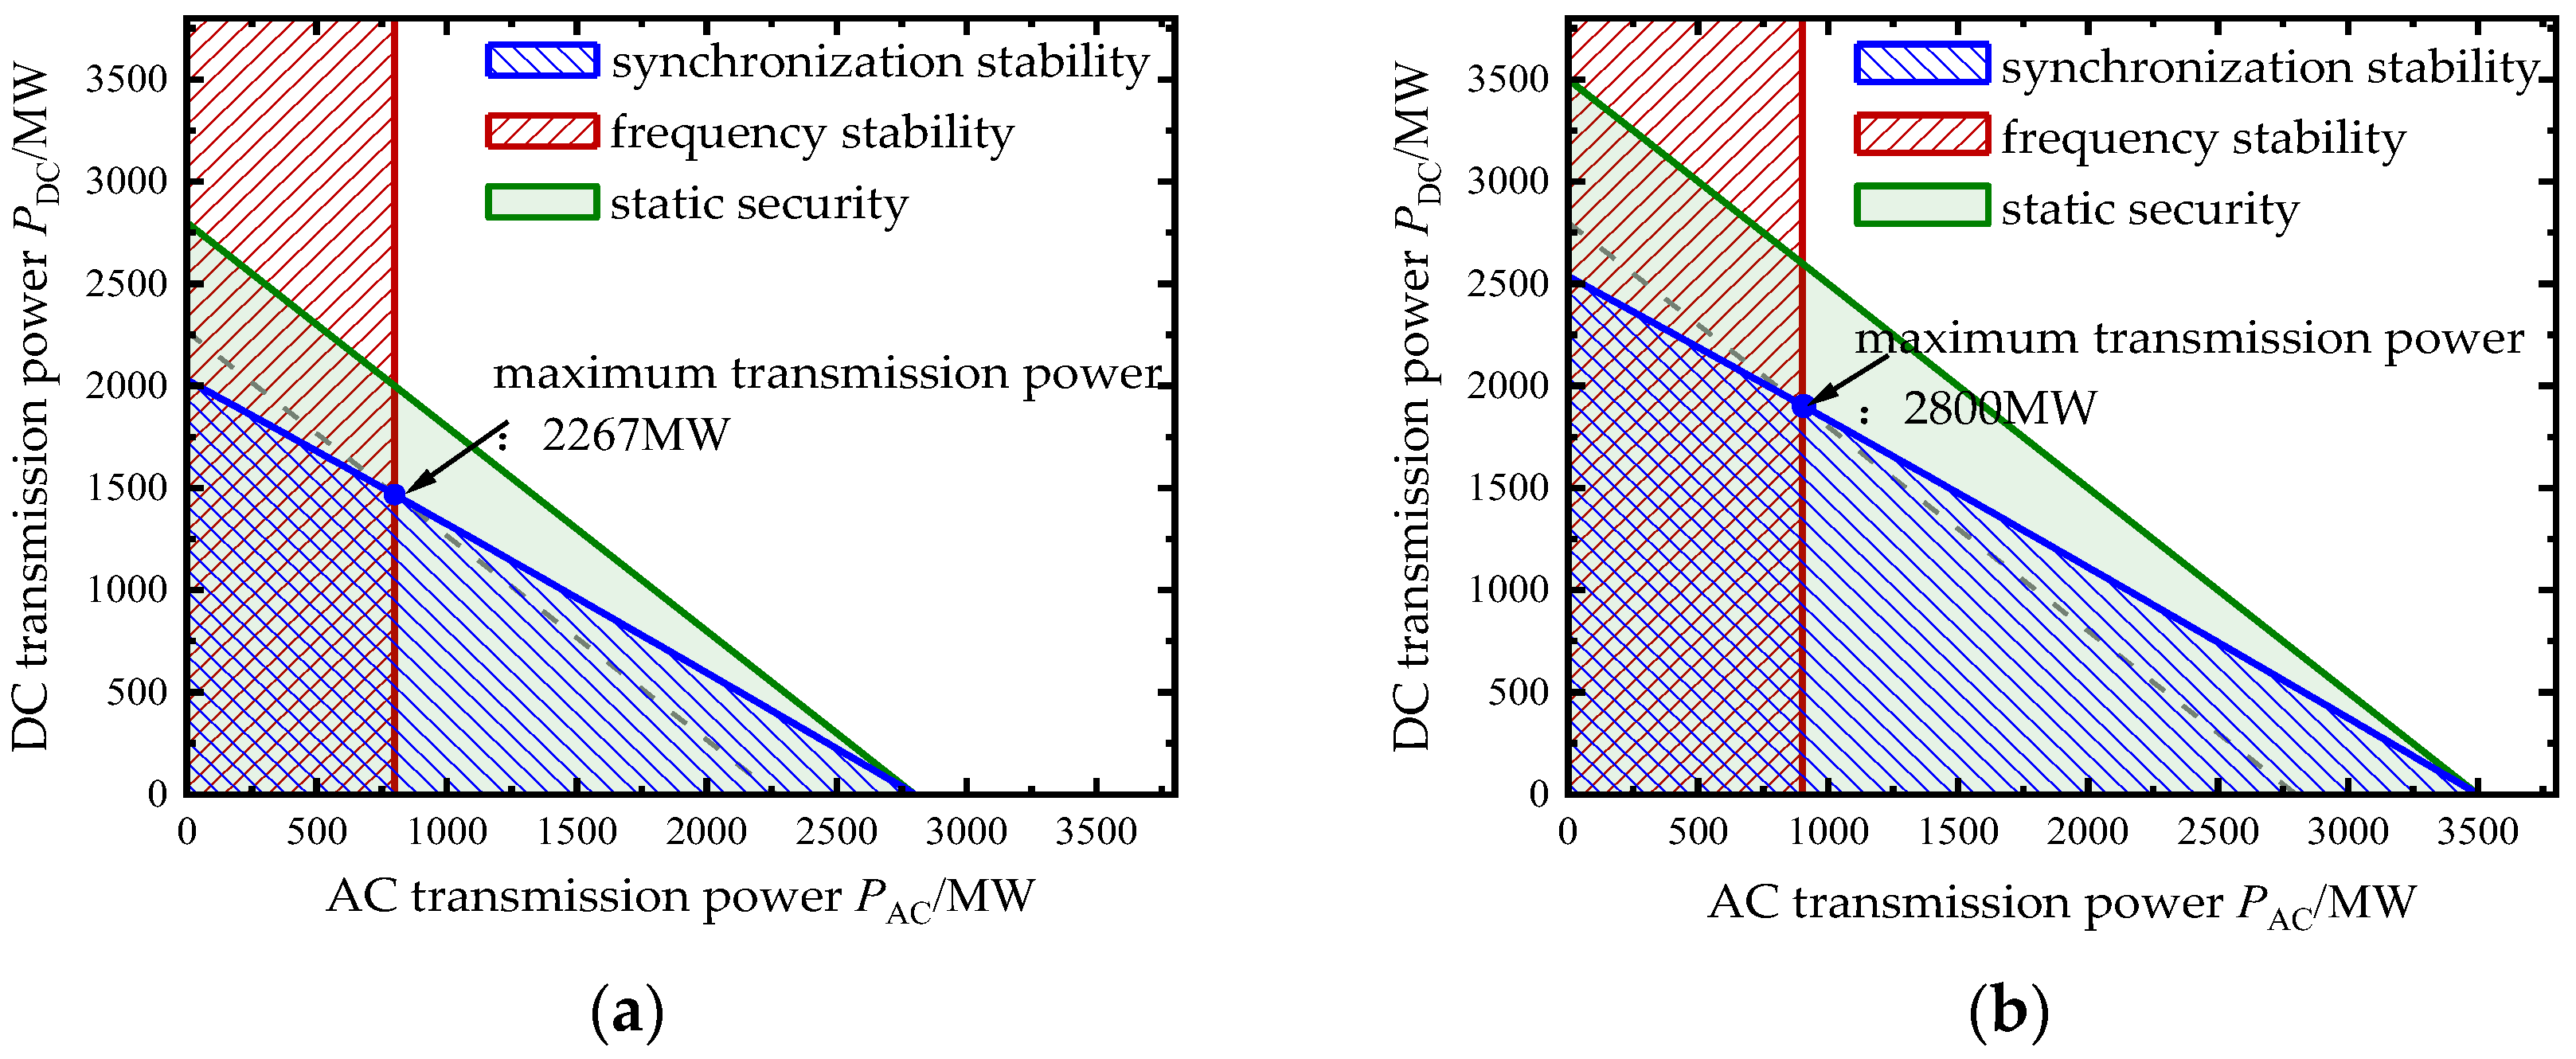
Integrating the aforementioned static security constraints and dynamic (synchronization and frequency stability) constraints, Figure 7 visually depicts the operational regions corresponding to each constraint. Within the composite operational region of AC/DC transmission power satisfying both static and dynamic constraints, an optimal power configuration scheme maximizing the transmission capability of the AC/DC transmission section is identified.
Figure 7 illustrates the operational region for AC/DC transmission power considering both static and dynamic constraints. The green area represents the operational region under static N-1 security constraints; the blue area denotes the operational region constrained by synchronization stability constraints; the red area corresponds to the operational region bounded by frequency stability constraints. The intersection of these three regions defines the final permissible operational region for AC/DC transmission power. The configuration maximizing transmission capability occurs at the boundary point of this intersection region where the sum P A C + P D C achieves its maximum value.
Notably, according to Equations (6), (10), and (17), the extent of the AC/DC transmission power operational region depends on line reactance, sending-end damping, and sending-end inertia. A higher AC transmission line reactance reduces the synchronization-stable region (the blue area shifts downward in the diagram); lower sending-end damping and inertia decrease the frequency-stable region (the red area shifts leftward); greater transmission line reactance diminishes the static security region (the green area shifts downward).

5. Case Study

To validate the accuracy of the aforementioned theoretical analysis and the effectiveness of the optimal AC/DC transmission power configuration scheme, a case study of the system, shown in Figure 1, was performed using MATLAB/Simulink. The simulation type of the time block used (PowerGui) is discrete, and the sample time is 8e-6 (s). Key simulation parameters are presented in Table 1.
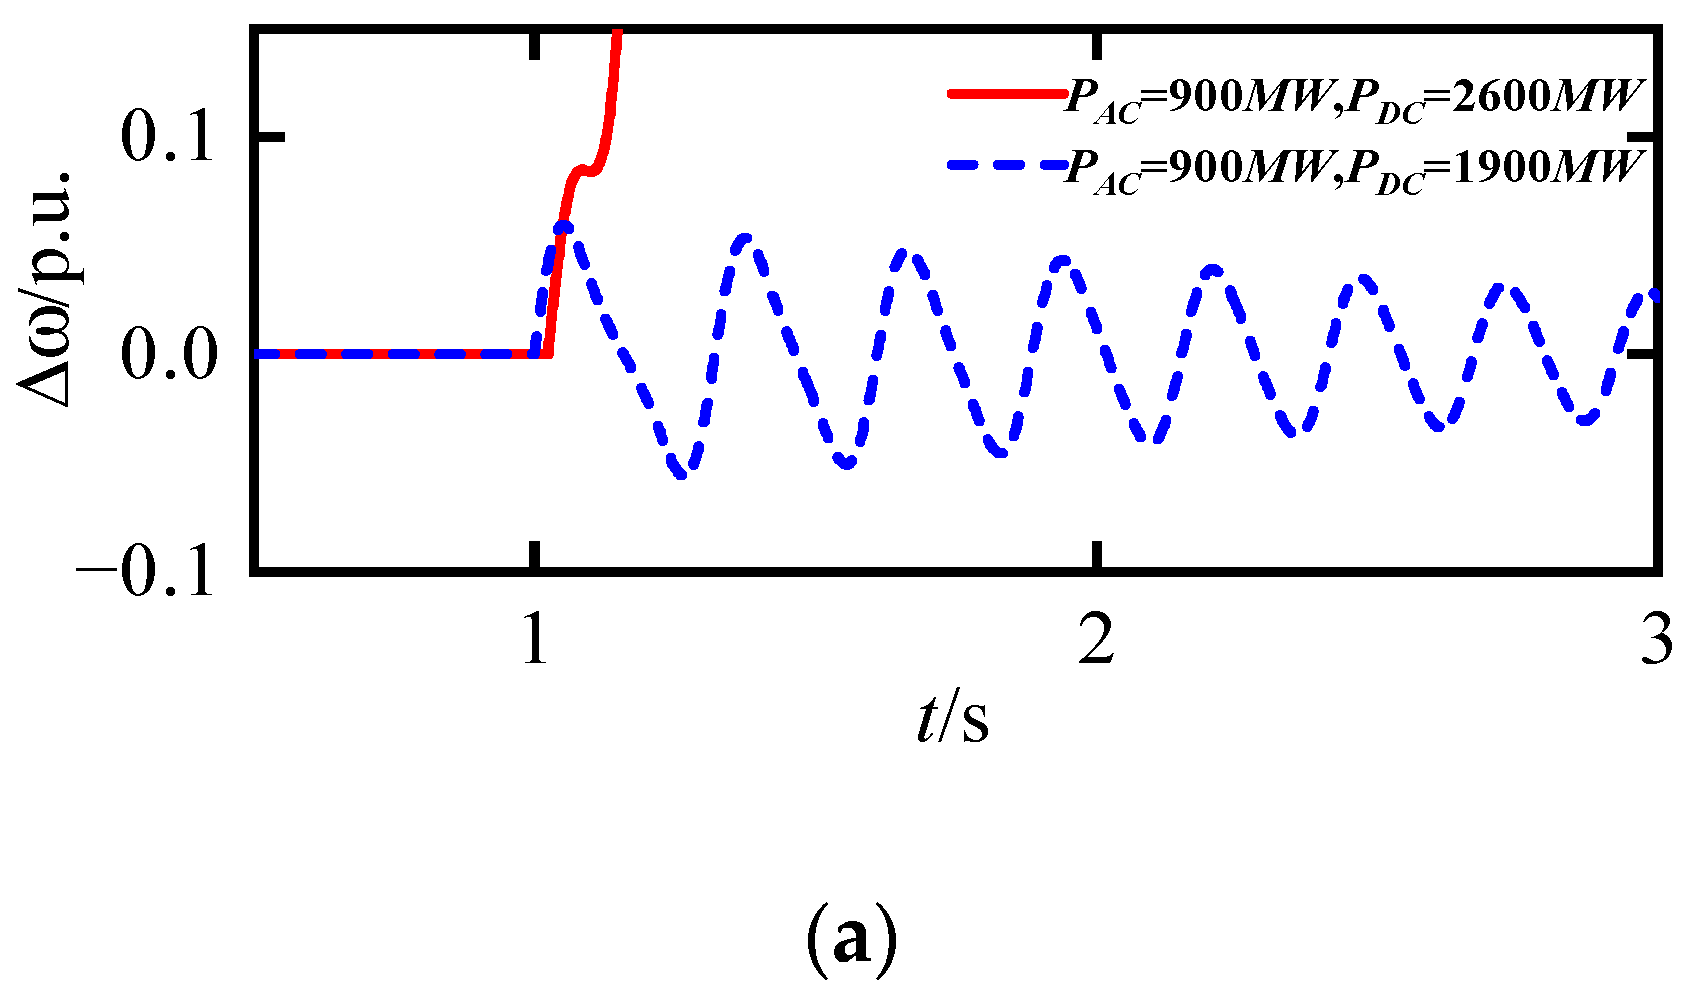
Figure 8 compares the post-fault dynamic responses of an AC/DC parallel transmission system under two scenarios: the traditional consideration of a single constraint (using a single frequency constraint as an example) and the consideration of both synchronization and frequency constraints proposed in this paper. When considering only the frequency constraint, the optimal power configuration for the AC transmission line is the same as that of the scheme proposed in this paper, both being P A C = P A C o p t = 900   MW , and the sending-end frequency metrics satisfy requirements after an AC line outage. However, due to the lack of consideration for the system synchronization stability constraint in the traditional approach, the transmission power on the DC line is excessively large. This results in a loss of synchronism at both the sending end and receiving end following a DC block, as shown by the red curves in Figure 8a,b. The AC/DC transmission line power configuration scheme considering both synchronism and frequency constraints proposed in this paper can simultaneously satisfy the system frequency and synchronism stability requirements, as indicated by the blue dashed curves in Figure 8. The above case analysis verifies the accuracy of the theory proposed in this paper.
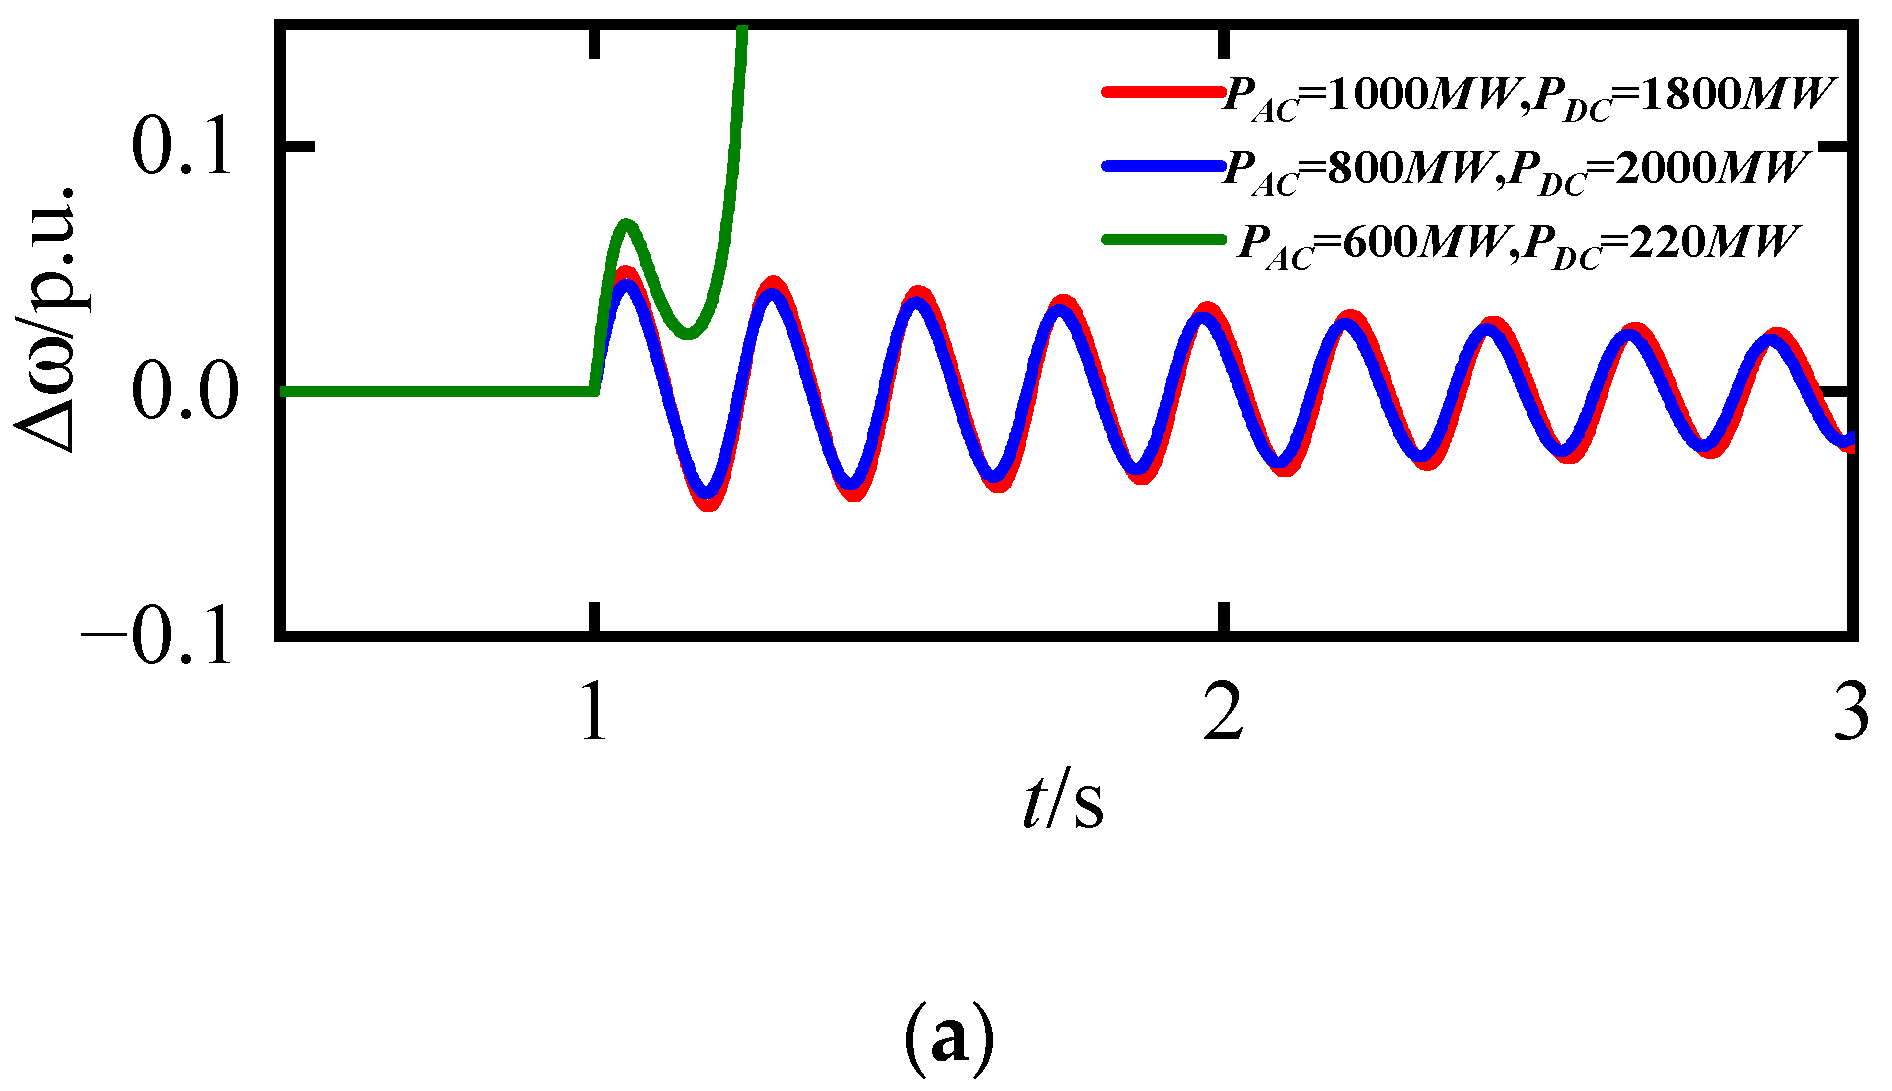
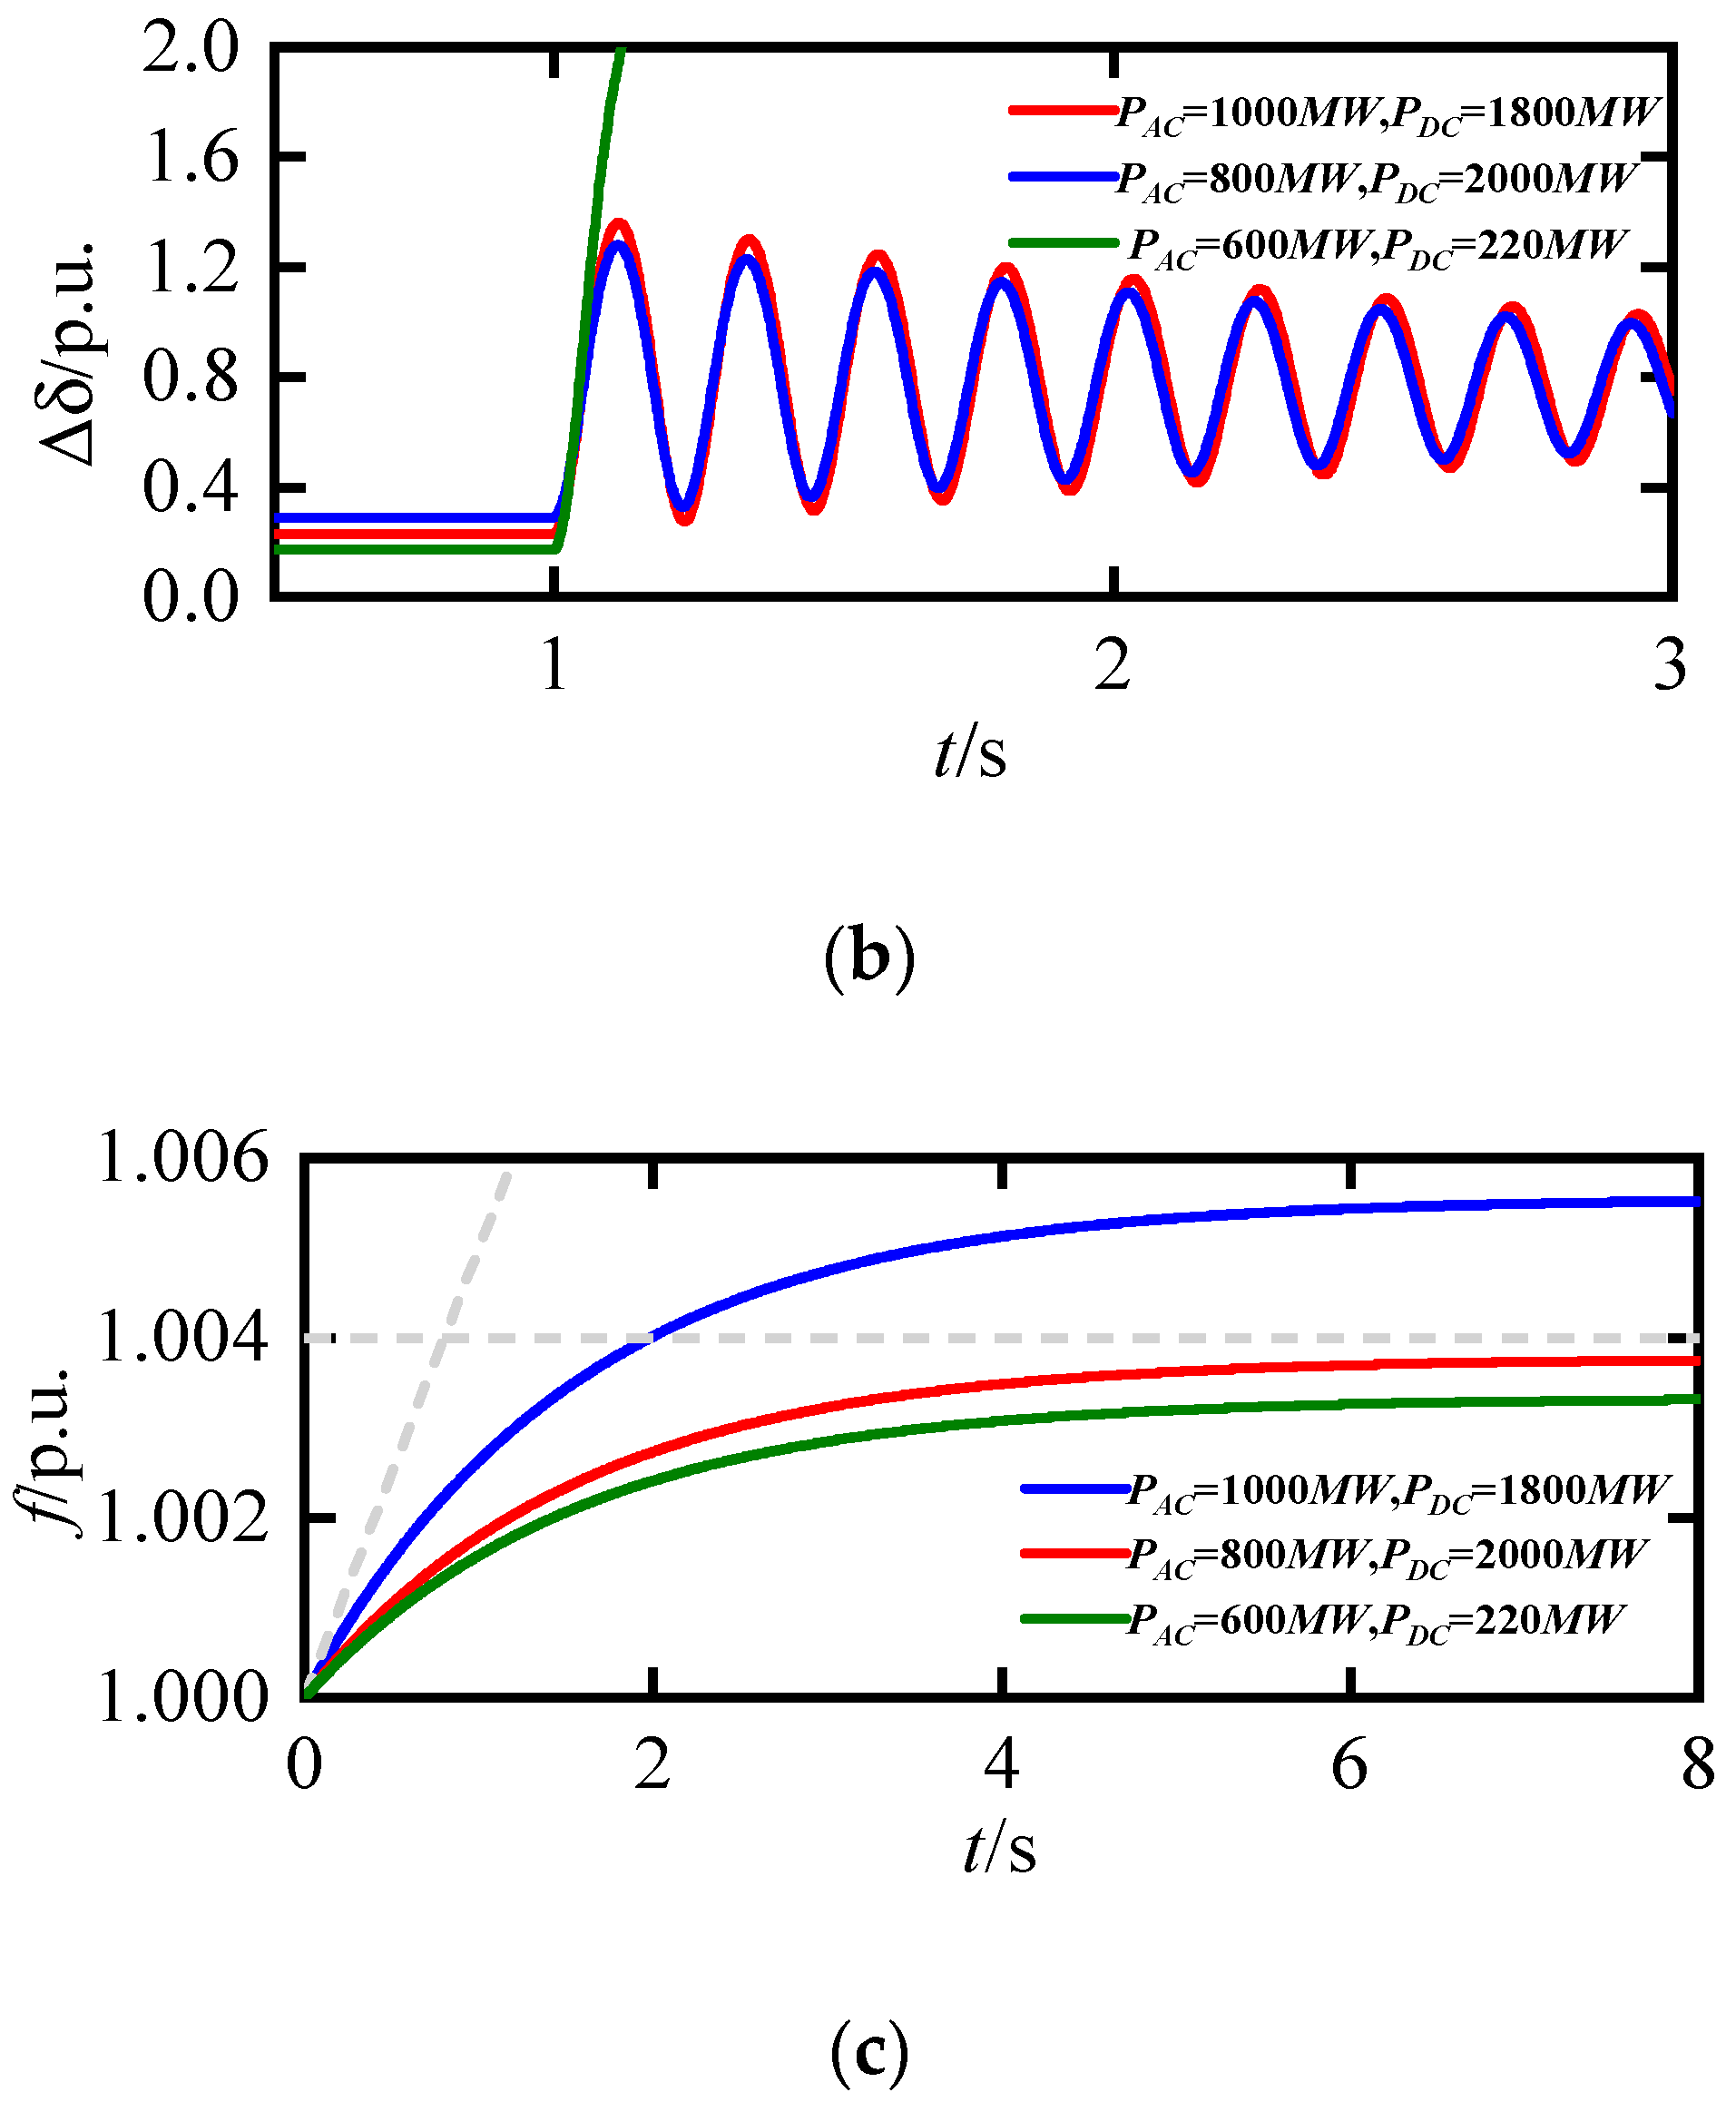
Figure 9 demonstrates the dynamic responses of the system under different AC/DC transmission power configuration schemes after faults. It can be seen from the figure that under the same system delivery power, i.e., PAC + PDC = 2800 MW, the dynamic responses of the AC/DC parallel transmission system under faults differ under different AC/DC transmission power configuration schemes. When configuring AC transmission power PAC = 1000 MW and DC transmission power PDC = 1800 MW, the system satisfies synchronization stability constraints but experiences frequency limit violations during AC line outage faults, as shown by the blue curve in Figure 9c; when PAC = 600 MW and PDC = 2200 MW, the system meets frequency constraints but suffers loss of synchronization between the sending end and receiving end during DC block faults, as shown by the green curves in Figure 9a,b. Under the proposed optimal AC/DC transmission power configuration scheme, i.e., PAC = 900 MW, PDC = 1900 MW, the system simultaneously satisfies both synchronism stability and frequency stability constraints, as shown by the red curve in Figure 9. This case analysis demonstrates that the proposed optimal AC/DC transmission power configuration scheme enhances the transmission capability of the AC/DC parallel system while ensuring system synchronization and frequency stability, and this conclusion verifies the effectiveness of the proposed method.
Table 2 illustrates the impact of system parameters and control parameters on the optimal power configuration and maximum transmission capability of the AC/DC parallel system. As shown in Table 2, the optimal AC transmission power P A C o p t increases with the total damping D Σ of the renewable energy plant and sending-end converter station. Notably, as indicated by Equation (17), P A C o p t adopts a conservative value constrained by frequency deviation and ROCOF limits. Consequently, within the parameter range of Table 2, the total inertia J Σ is not a determining factor for optimal transmission power P A C o p t . The optimal DC transmission power P D C o p t is jointly determined by equivalent reactance X Σ 2 from the PCC to the receiving-end grid, system inertia J Σ , and system damping D Σ . Lower X Σ 2 , higher J Σ , and higher D Σ yield a larger P D C o p t . Simultaneously, the system’s maximum transmission capability P c max is co-determined by P A C o p t and P D C o p t . Lower X Σ 2 , higher J Σ , and higher D Σ enhance transmission capability.

6. Conclusions

This paper focuses on grid-forming renewable energy via AC/DC parallel transmission systems. By comprehensively considering N-1 static security constraints, synchronization stability constraints, and frequency stability constraints on the transmission section, we propose a method to characterize the operational region of AC/DC transmission power accounting for synchronization and frequency stability. This approach reveals key factors influencing the transmission capability of AC/DC hybrid systems and develops an optimal power allocation scheme to maximize transmission capacity. The main conclusions are as follows:
  • Analytical conditions satisfying N-1 static security, synchronism stability, and frequency stability constraints for AC/DC transmission lines are derived, clarifying critical determinants of system transmission capability. Lower AC line reactance and higher sending-end damping/inertia enhance transmission capability.
  • Integrating N-1 static security, synchronism stability, and frequency stability constraints yields the operational region for AC/DC transmission power. The optimal power allocation scheme maximizing transmission capability is subsequently obtained. This solution enhances transmission capacity while ensuring system security and stability, providing a theoretical basis for secure operation and grid planning of hybrid AC/DC transmission systems.

Author Contributions

Conceptualization, Z.T. and J.L.; investigation, Z.T., S.D. and X.W.; methodology, Z.T., S.D., X.W. and J.L.; software, Z.T., S.D. and X.W.; resources, Z.G., L.W., H.W. and Y.L.; writing—original draft preparation, Z.T., S.D., X.W. and J.L.; writing—review and editing, Z.T., S.D., X.W. and J.L.; supervision, Z.G.; project administration, Z.G., L.W., H.W. and Y.L.; funding acquisition, Z.G., L.W., H.W. and Y.L. All authors have read and agreed to the published version of the manuscript.

Funding

This research was funded by the National Key Research and Development Program under grant number 2023YFB2405901.

Data Availability Statement

The raw data supporting the conclusions of this article will be made available by the authors on request.

Acknowledgments

We would like to thank the Inner Mongolia Power (Group) Co., LTD. Inner Mongolia Electric Power Research Institute Branch and Xi’an Jiaotong University for supporting this research.

Conflicts of Interest

Authors Zhengnan Gao, Liqiang Wang, and Haiyan Wu were employed by the Inner Mongolia Power (Group) Co., LTD. Inner Mongolia Electric Power Research Institute Branch. The remaining authors declare that the research was conducted in the absence of any commercial or financial relationships that could be construed as a potential conflict of interest. The funders had no role in the design of the study; in the collection, analyses, or interpretation of data; in the writing of the manuscript; or in the decision to publish the results.

References

  1. Zhigang, Z.; Chongqing, K. Challenges and Prospects for Constructing the New-type Power System Towards a Carbon Neutrality Future. Proc. CSEE 2022, 42, 2806–2819. [Google Scholar] [CrossRef]
  2. Xiaoqing, H.; Tingjun, L.; Dongxia, Z.; Xin, Z. New Issues and Key Technologies of New Power System Planning Under Double Carbon Goals. High Volt. Eng. 2021, 47, 3036–3046. [Google Scholar] [CrossRef]
  3. Shaobo, Y.; Xuekai, H.; Zengze, T.; Rui, Y.; Yufei, Z.; Jiapeng, L.; Lei, W.; Liang, M. A Distributed Photovoltaic Aggregation Method Considering Photovoltaic Output Characteristics and Active Voltage Sensitivity. Electronics 2025, 14, 917. [Google Scholar]
  4. Yingying, W.; Yong, L.; Huixin, L.; Lei, C.; Yifei, L.; Hongkun, C. Snow ablation-based risk assessment method for cascading failures in an AC-DC hybrid power grid. Power Syst. Prot. Control 2025, 53, 37–47. [Google Scholar] [CrossRef]
  5. Jianbo, X.; Chengxiang, Y.; Zhan, S.; Bo, Z.; Wei, Y.; Yanhong, C.; Jinyu, W. Identification of critical lines in AC/DC hybrid large power grid based on steady-state security region. Power Syst. Prot. Control 2020, 48, 165–172. [Google Scholar] [CrossRef]
  6. Ting, L.; Weiting, X.; Xianglong, L.; Yue, X.; Junyong, L.; Mi, Z.; Xinting, Y.; Ao, L. Review on planning technology of AC/DC hybrid system with high proportion of renewable energy. Power Syst. Prot. Control 2019, 47, 177–187. [Google Scholar] [CrossRef]
  7. Holguin, J.P.; Celeita, D.; Ramos, G. Reverse Power Flow (RPF) Detection and Impact on Protection Coordination of Distribution Systems. In Proceedings of the 2019 IEEE Industry Applications Society Annual Meeting, Baltimore, MD, USA, 29 September–3 October 2019; pp. 1–6. [Google Scholar]
  8. Kenedy, M.; Naresh, R.; Chauhan, R. An efficient Repeated Power Flow approach to evaluate Available Transfer Capability considering power systems security. In Proceedings of the 2023 Second International Conference on Electrical, Electronics, Information and Communication Technologies, Tamil Nadu, India, (ICEEICT), 5–7 April 2023; pp. 1–5. [Google Scholar]
  9. Wang, T.; Wang, S.; Ma, S.; Guo, J.; Zhou, X. An Extended Continuation Power Flow Method for Static Voltage Stability Assessment of Renewable Power Generation-Penetrated Power Systems. IEEE Trans. Circuits Syst. II: Express Briefs 2024, 71, 892–896. [Google Scholar] [CrossRef]
  10. Dan, X.; Qiang, D.; Xingyu, L.; Yanting, L.; Junjie, T. Probabilistic optimal power flow calculation method based on a discrete Fourier transformation matrix. Power Syst. Prot. Control 2021, 49, 9–16. [Google Scholar] [CrossRef]
  11. Lin, Z.; Zhonghao, S.; Li, F.; Xuewei, S.; Lin, Z.; Chenggang, S.; Yong, Z. Study on causes of limited transmission capacity of Sichuan-Chongqing powergrid based on DC-sensitivity. Power Syst. Prot. Control 2015, 43, 67–73. [Google Scholar]
  12. Tang, L.; Sun, W. An Automated Transient Stability Constrained Optimal Power Flow Based on Trajectory Sensitivity Analysis. IEEE Trans. Power Syst. 2017, 32, 590–599. [Google Scholar] [CrossRef]
  13. Geng, G.; Jiang, Q.; Sun, Y. Parallel Transient Stability-Constrained Optimal Power Flow Using GPU as Coprocessor. IEEE Trans. Smart Grid 2017, 8, 1436–1445. [Google Scholar] [CrossRef]
  14. Dong, X.; Hao, X.; Chen, Q.; Wang, C.; Wang, M. A Distributed Power Transfer Limit Calculation Method for Multi-Area Interconnection Power Networks. IEEE Trans. Power Syst. 2021, 36, 4723–4732. [Google Scholar] [CrossRef]
  15. Zhengqing, X.; Yanwei, X.; Qunshan, L.; Shuqin, S.; Wenli, Y.; Chenyue, W. Comparative study based on sensitivity and particle swarm optimization algorithm for powerflow over-limit control method of transmission section. Power Syst. Prot. Control 2020, 48, 177–186. [Google Scholar] [CrossRef]
  16. Yan, J.; Ke, P.; Xueshen, Z.; Songhan, J. Transient Stability Analysis of AC/DC Distribution System Based on Nonlinear Decoupling Method. Autom. Electr. Power Syst. 2024, 48, 56–65. [Google Scholar]
  17. Haitao, Z.; Zihao, S.; Wei, W.; Jizhi, H.; Ruxi, Z.; Xiuli, W.; Xifan, W. Hybrid AC/DC Admittance Modeling of MMC and Stability Analysis of Grid-Tied System with Consideration of AC/DC Coupling. Power Syst. Syst. Technol. 2024, 12, 1–11. [Google Scholar] [CrossRef]
  18. Zhiyuan, T.; Xin, C.; Donghui, Z. Modeling and Stability Analysis of Unified Immittance Network for AC/DC Hybrid System. Trans. China Electro. Soc. 2025, 40, 2864–2879. [Google Scholar] [CrossRef]
  19. Xin, Z.; Yuanyuan, L.; Ping, J. A Planning Approach for AC/DC Hybrid Power Grid with High Proportion of Renewable Energy. J. Glob. Energy Interconnect. 2021, 4, 372–381. [Google Scholar] [CrossRef]
  20. Hanxiong, C.; Ting, L.; Ao, L. Study on AC/DC system coordinated control strategy for grid operation performance enhancement. Power Syst. Prot. Control 2021, 49, 123–134. [Google Scholar] [CrossRef]
  21. Lin, L.; Haofang, L.; Yiying, Z.; Xiao, L.; Xiaobei, F.; Xiaoli, Z.; Huan, M.; Cheng, W. Simulation Study on the Stable Operation Characteristics and Improvement Measures of the Power Grid with Large-scale Photovoltaic Power Stations and Energy Storage Stations. Power Syst. Syst. Technol. 2024, 2024, 1–10. [Google Scholar] [CrossRef]
  22. Yan, Z.; Xu, Z.; Jingyi, Z.; Pan, G.; Chunming, L.; Shanhe, L. Evaluation of Total Transmission Capacity of AC–DC Hybrid Delivery System in Desert New Energy Base Considering the Uncertainty of Wind Power. Electr. Power Constr. 2024, 45, 174–186. [Google Scholar]
  23. Xiang, L.; Zhizhong, G. Analysis of Network Transmission Capability Based on N-1 Principle. Autom. Electr. Power Syst. 2004, 28, 28–30. [Google Scholar]
  24. Yan, X.; Jing, Z.; Xianghui, W. Evaluation on Thermal Stability Power Limit of Transmission Section Based on N-1 Principle. Proc. CSU-EPSA 2017, 29, 13–17. [Google Scholar]
Figure 1. Renewable energy via AC/DC parallel transmission system.
Energies 18 04202 g001
Figure 2. Control diagram of VSG. (a) VSG active power control loop; (b) VSG reactive power control loop.
Energies 18 04202 g002
Figure 3. Equivalent system model after an AC line outage.
Energies 18 04202 g003
Figure 4. Equivalent system model after a DC block.
Energies 18 04202 g004
Figure 5. Acceleration and deceleration areas.
Energies 18 04202 g005
Figure 6. Operational region under synchronism stability constraints.
Energies 18 04202 g006
Figure 7. Operational region of AC/DC transmission power. (a) X Σ = 0.3 ,   J Σ = 350 ,   D Σ = 200 ; (b) X Σ = 0.24 ,   J Σ = 350 ,   D Σ = 225 .
Energies 18 04202 g007
Figure 8. Dynamic response comparison: single-frequency-constrained vs. synchronism-and-frequency-constrained AC/DC parallel transmission system. (a) Angular frequency curve after a DC block; (b) power angle curve after a DC block; (c) frequency curve after an AC line outage.
Energies 18 04202 g008aEnergies 18 04202 g008b
Figure 9. Post-fault dynamic responses under different AC/DC power configurations. (a) Angular frequency curve after a DC block; (b) power angle curve after a DC block; (c) frequency curve after an AC line outage.
Energies 18 04202 g009aEnergies 18 04202 g009b
Table 1. System simulation parameters.
ParameterValue (Per Unit)
Equivalent   reactance   X l 1 of line between PCC and sending-end converter station0.03
Equivalent   reactance   X l 2 of AC transmission line between sending-end and receiving-end systems0.03
Equivalent   reactance   X T 1 of sending-end transformer0.11
Equivalent   reactance   X T 2 of receiving-end transformer0.07
Total   inertia   J Σ of renewable energy plant and sending-end converter station350
Total   damping   D Σ of renewable energy plant and sending-end converter station225
Table 2. Optimal AC/DC power configurations and maximum transmission capability under different parameters.
X Σ 2 (p.u.) J Σ (p.u.) D Σ (p.u.) P A C o p t (MW) P D C o p t (MW) P c max (MW)
0.335020080014672267
0.2735020080016942494
0.2435020080019762776
0.2435022590019002800
0.24350250100018402840
0.24325250100018402840
0.24300250100018402840
Disclaimer/Publisher’s Note: The statements, opinions and data contained in all publications are solely those of the individual author(s) and contributor(s) and not of MDPI and/or the editor(s). MDPI and/or the editor(s) disclaim responsibility for any injury to people or property resulting from any ideas, methods, instructions or products referred to in the content.