Article

Integration of Daylight in Building Design as a Way to Improve the Energy Efficiency of Buildings

Division of Air Conditioning and Heating, Faculty of Environmental Engineering, Warsaw University of Technology, Nowowiejska 20, 00-653 Warsaw, Poland
*
Author to whom correspondence should be addressed.
Energies 2025, 18(15), 4113; https://doi.org/10.3390/en18154113 (registering DOI)
Submission received: 25 June 2025 / Revised: 28 July 2025 / Accepted: 31 July 2025 / Published: 2 August 2025

Abstract

According to the United Nations Environment Programme reports, buildings are responsible for nearly 40% of energy-related emissions; therefore, energy-optimized building design is crucial to reduce the reliance on non-renewable energy sources as well as greenhouse gas emissions. The OECD reports indicate the use of Building Information Modelling (BIM) as one of the effective strategies for decarbonization of buildings, since a 3D digital representation of both physical and functional characteristics of a building can help to design a more efficient infrastructure. An efficient integration of solar energy in building design can be vital for the enhancement of energy performance in terms of heating, cooling, and lighting demand. This paper presents results of an analysis of how factors related to the use of daylight, such as automatic control of artificial lighting, external shading, or the visual absorptance of internal surfaces, influence the energy efficiency within an example room in two different climatic zones. The simulation was conducted using Design Builder software, with predefined occupancy schedules and internal heat gains, and standard EPW weather files for Warsaw and Genua climate zones. The study indicates that for the examined room, when no automatic sunshades or a lighting control system is utilized, most of the final energy demand is for cooling purposes (45–54%), followed by lighting (42–43%), with only 3–12% for heating purposes. The introduction of sunshades and/or the use of daylight allowed for a reduction of the total demand by up to half. Moreover, it was pointed out that often neglected factors, like the colour of the internal surfaces, can have a significant effect on the final energy consumption. In variants with light interior, the total energy consumption was lower by about 3–4% of the baseline demand, compared to their corresponding ones with dark surfaces. These results are consistent with previous studies on daylighting strategies and highlight the importance of considering both visual and thermal impacts when evaluating energy performance. Similarly, possible side effects of certain actions were highlighted, such as an increase in heat demand resulting from a reduced need for artificial lighting. The results of the analysis highlight the potential of a simulation-based design approach in optimizing daylight use, contributing to the broader goals of building decarbonization.

1. Introduction

Buildings are responsible for nearly 40% of energy-related emissions [1]; therefore, energy-optimized building design is crucial to reduce the reliance on non-renewable energy sources as well as greenhouse gas emissions. The OECD reports indicate the use of BIM as one of the ways for decarbonization of buildings [2], as a 3D digital representation of both physical and functional characteristics of a building can help to design a more efficient infrastructure. An efficient integration of solar energy in building design can be essential for the enhancement of energy performance in terms of heating, cooling, and lighting demand [3,4,5]. One of the most important building components that shape the energy efficiency of buildings is windows. Many researchers pointed out that heat gains through windows have a significant impact on both heating and cooling demand [6,7,8,9], and they also provide a valuable source of daylight that can reduce the need for artificial lighting and improve indoor environment quality [10,11,12]. The issue of the dual role of windows is even more complicated if we consider that the construction of windows itself is not the only factor that can shape the daylight availability and solar energy utilization. Other important factors include the geometry and orientation of the openings [13,14,15], optical and thermal properties of indoor surfaces [16,17], or the thermal mass of heated/cooled rooms [18], as well as occupancy schedules and occupant behaviour [19,20]. The commonly used approach, based solely on chosen parameters that describe the energy performance of individual parameters, limits the possibilities of improving the energy performance of buildings. For instance, the lowest heat transfer coefficient U of windows does not guarantee the best energy balance, as windows with a low U-value often limit solar heat gains and the availability of daylight. The use of BIM in the early design phase can significantly improve the performance of a building, as it allows taking into account interdependencies between various factors that have an impact on heating, cooling, and lighting energy demand [21,22,23].
Up-to-date research on energy efficiency often focuses on selected efficiency areas, such as the efficiency of using daylight to reduce the demand for artificial lighting [24,25,26] or the management of solar heat gains to reduce the demand for heating and/or cooling [27,28,29].
The tools available for designers provide various models for computer simulations. However, the results obtained by these models can differ in various ways depending on many factors [30,31]. The problem of calculation accuracy is even more complicated when it comes to overall energy simulations, as the computational process for complex simulations of lighting, heating, and cooling demand often includes many simplifications [32,33].

2. The Method

2.1. General Approach

The aim of the study was to investigate how the integration of daylight in building design can help improve energy efficiency. The first step of the analysis was to investigate to what extent the available numerical model allows for taking into account the availability of daylight in the room. Next, the numerical model was used to analyse the impact of several different factors on the energy demand for lighting, heating, and cooling. In order to generalize the analysis for different climatic conditions, calculations were performed for two different locations.
The study was carried out in an educational building belonging to the Faculty of Environmental Engineering (Wydział Inżynierii Środowiska) at the Warsaw University of Technology. Located in the central part of the university campus, the building contains 335 rooms serving various functions, including classrooms, laboratories, technical facilities, and offices. It accommodates more than 2,000 users daily. Originally constructed in the 1970s, the building has undergone only partial modernization.

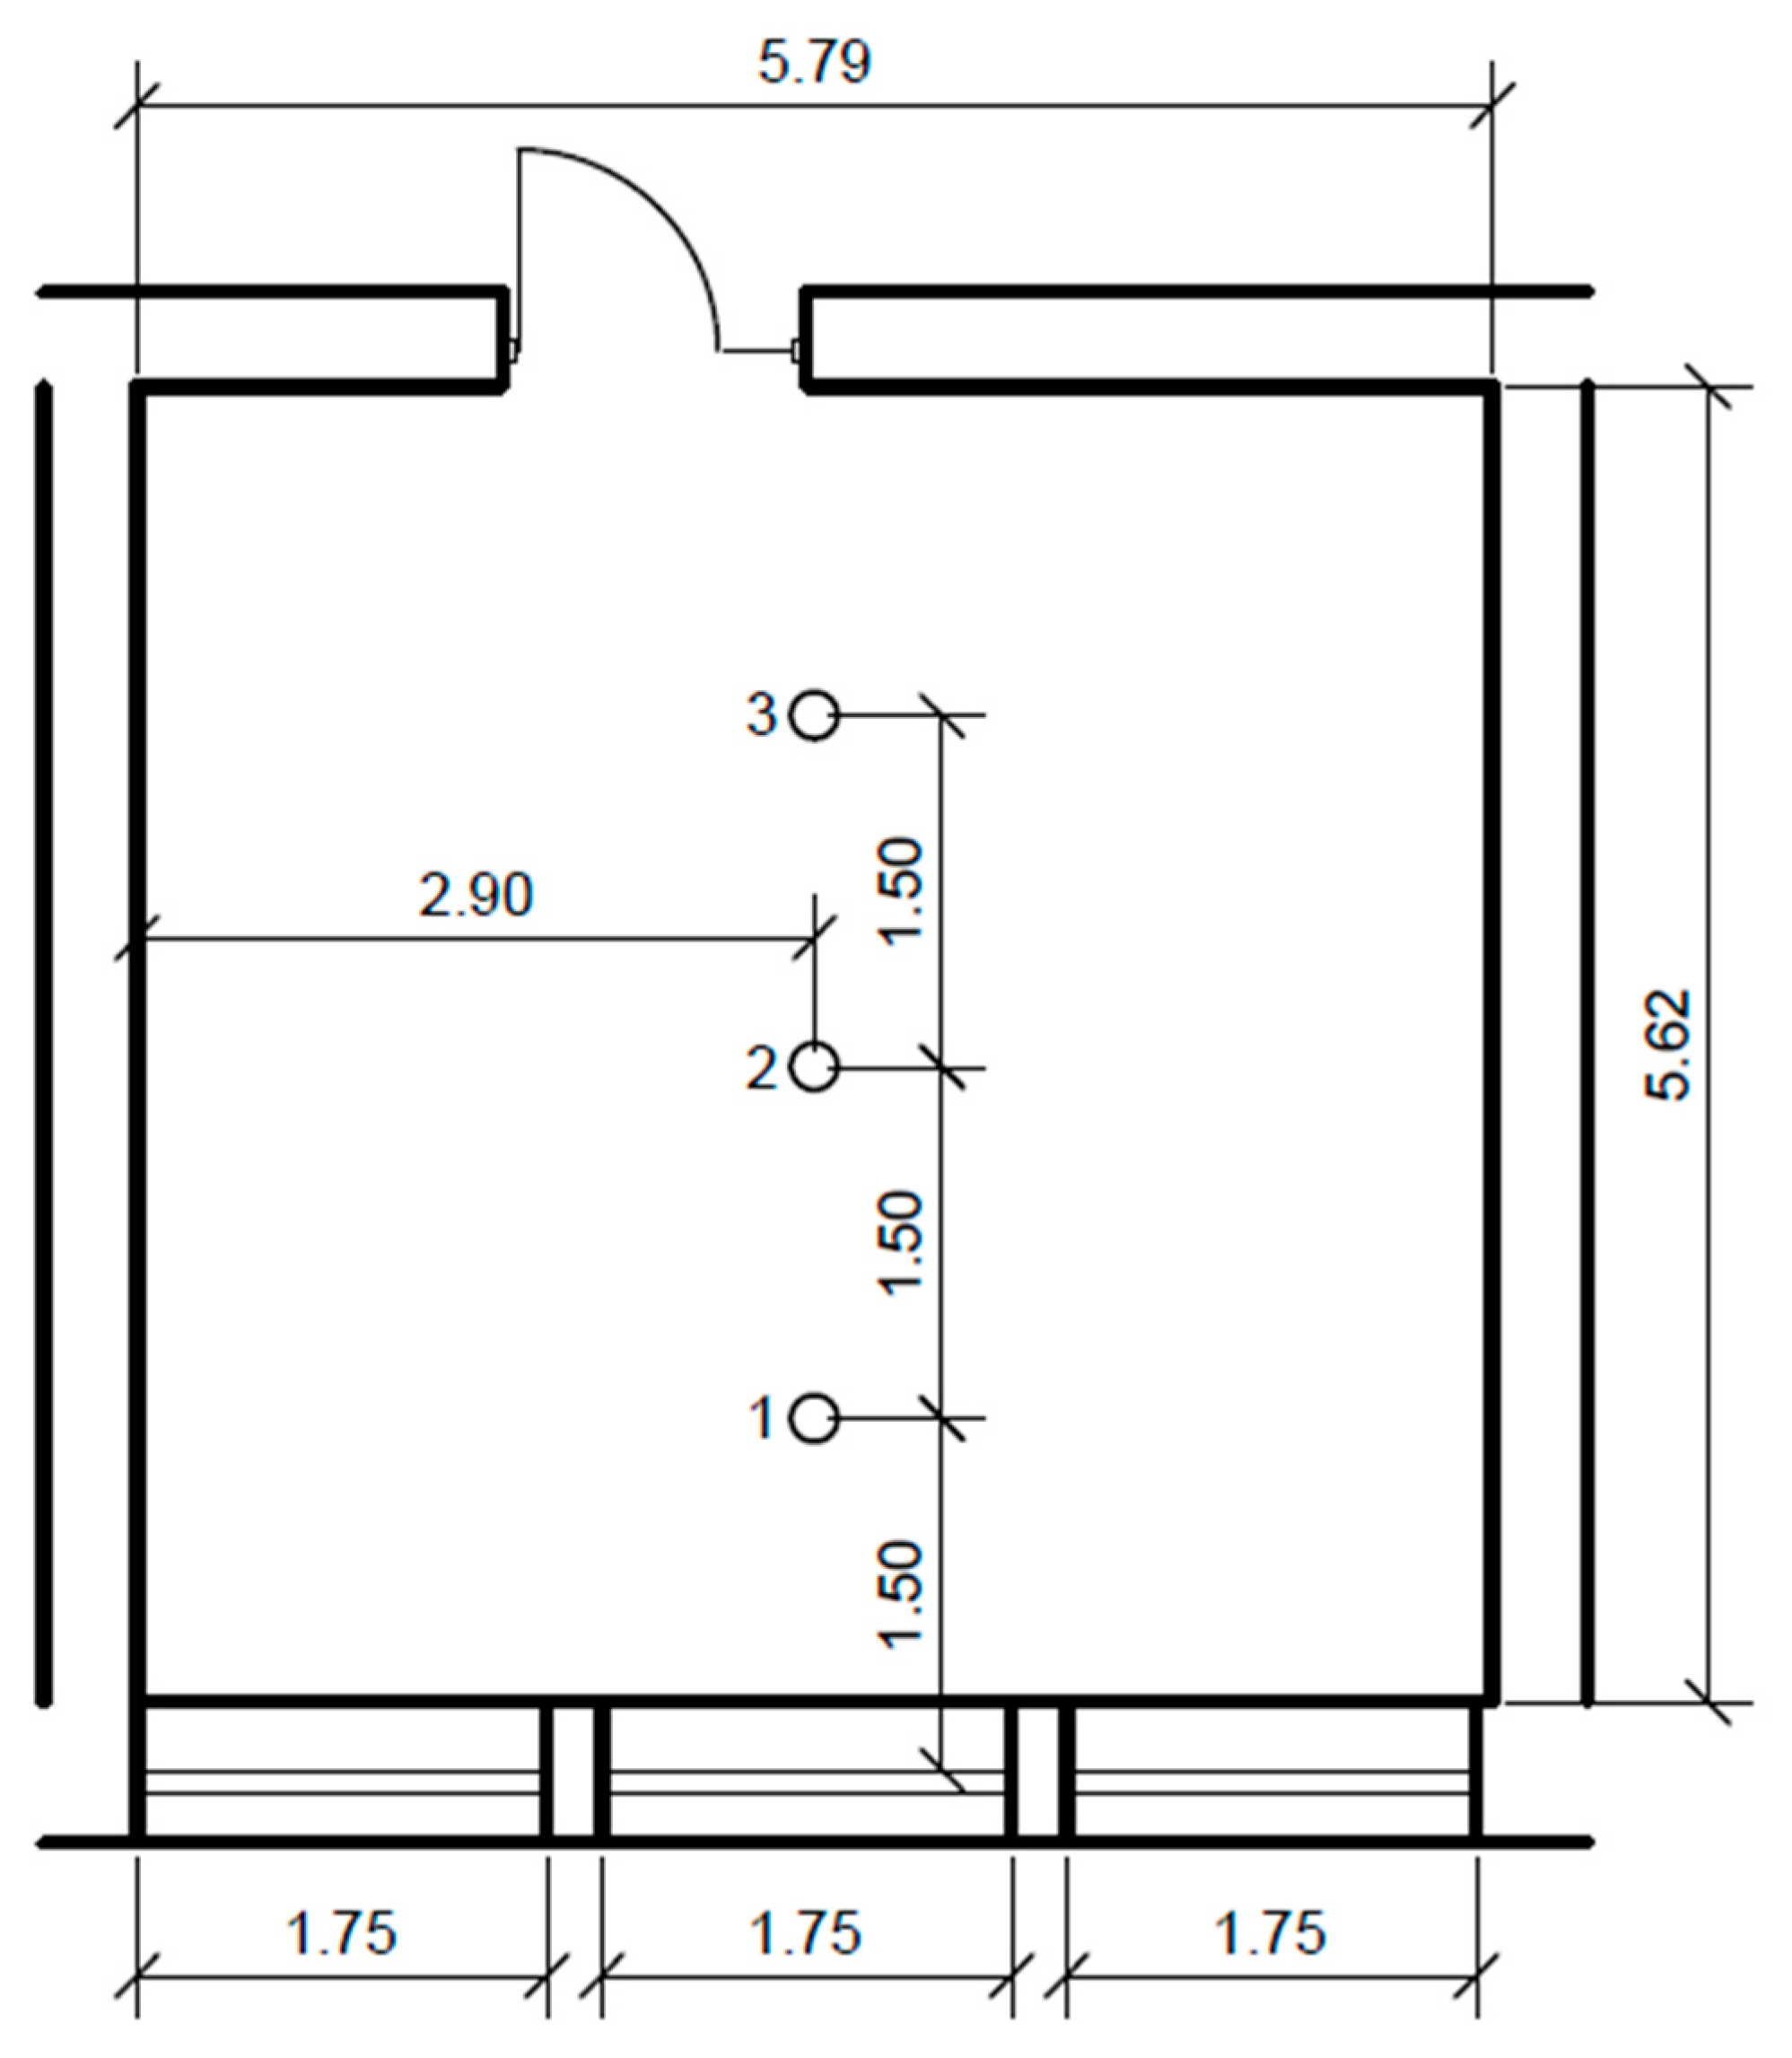
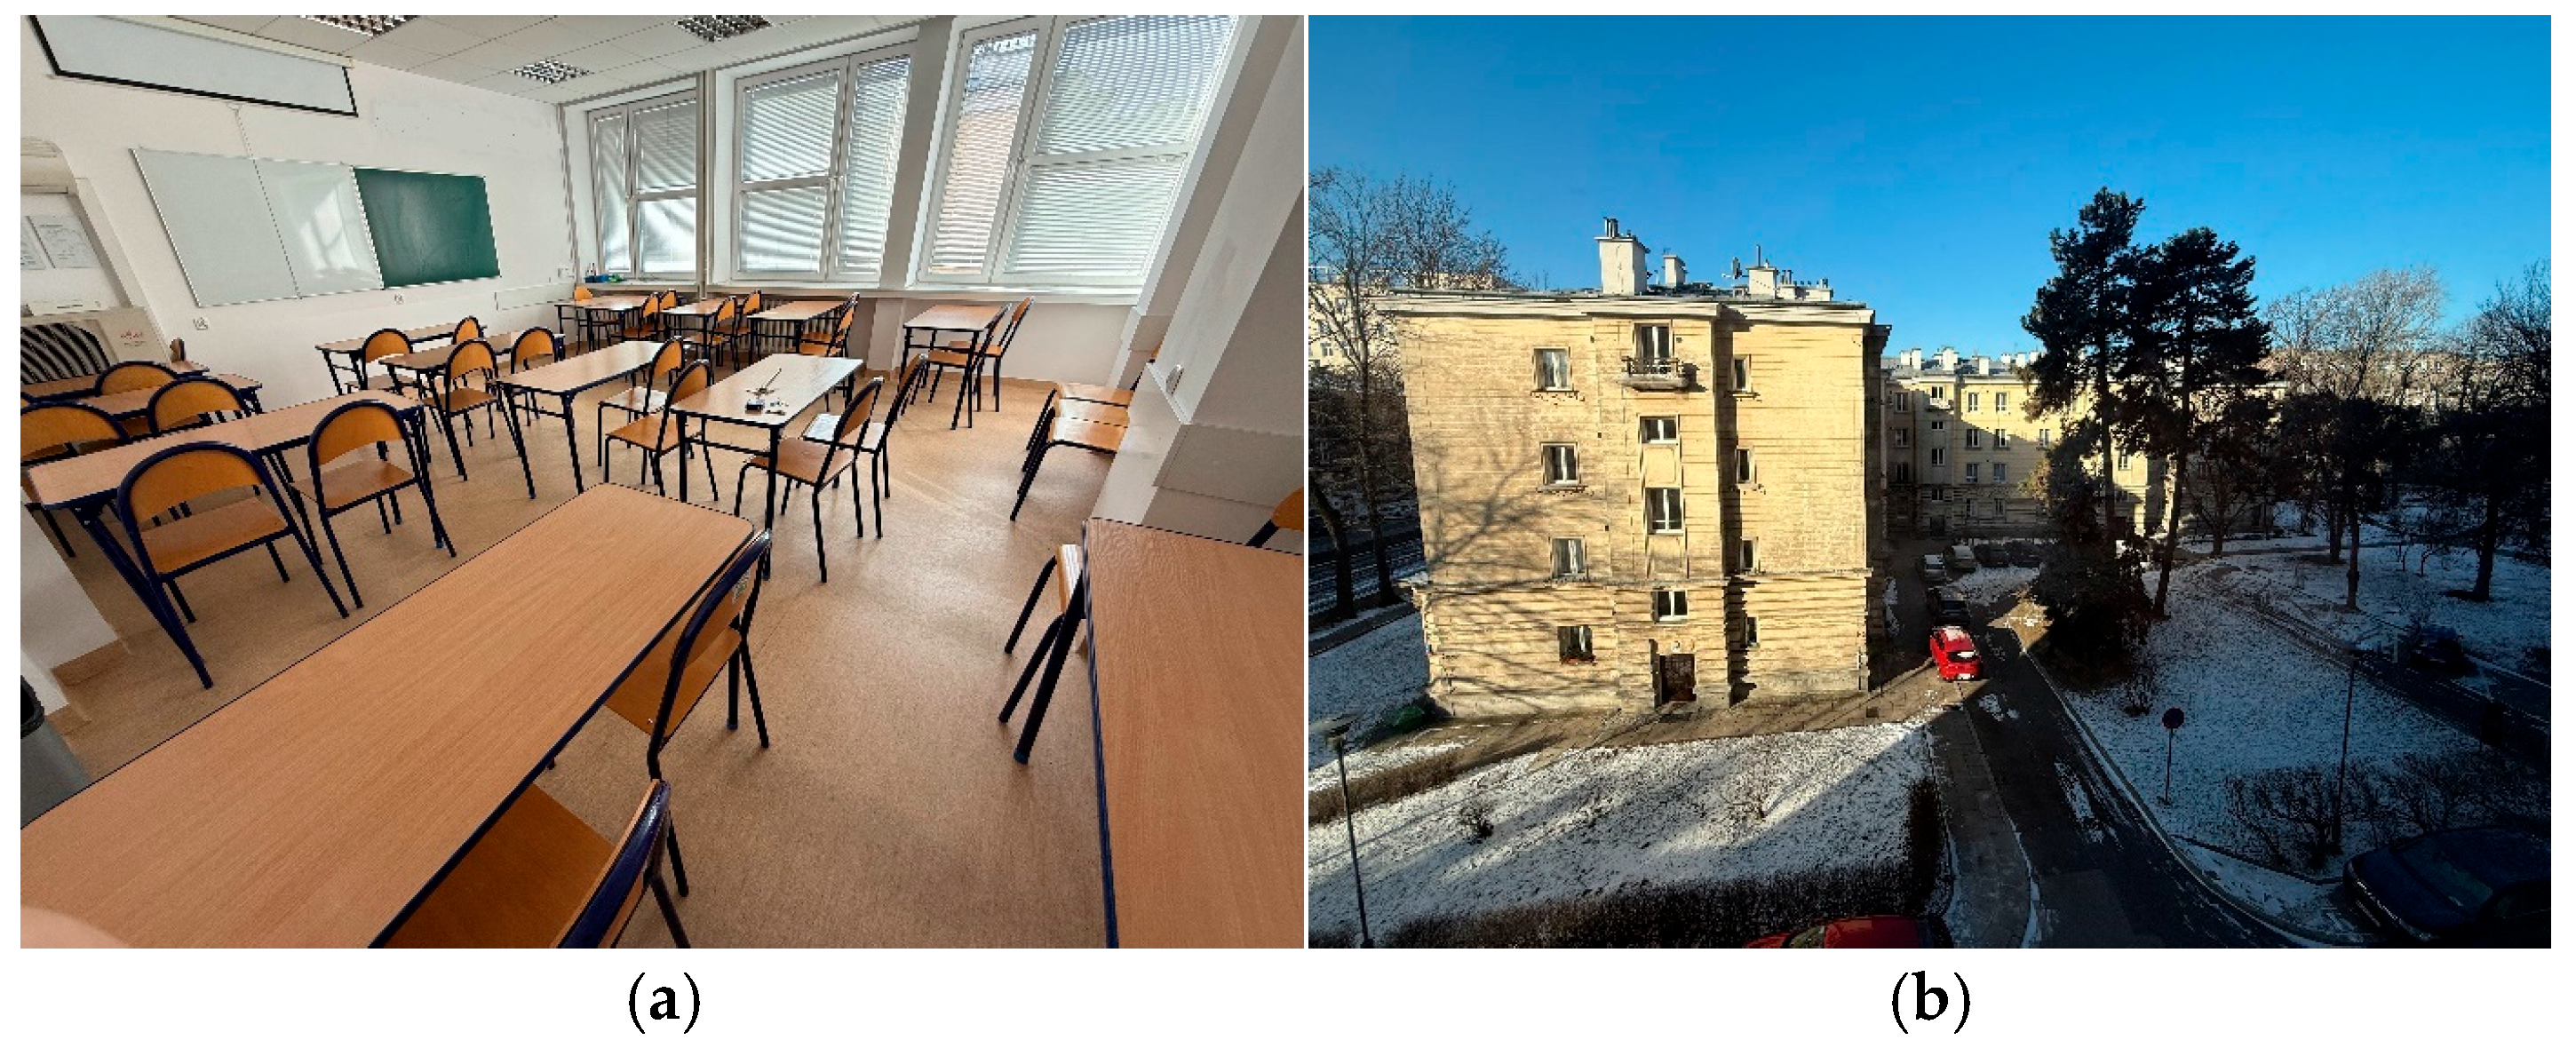
2.2. Field Measurements

In order to validate the daylight availability model used in further analyses, illumination measurements were carried out in the analysed room. The measurements were conducted from January to May 2021 and included simultaneous measurement of illumination at three selected points in the room (Figure 1), as well as measurements of solar irradiation on the roof.
The following sensors were used for the illumination measurements:
  • Two Testo 160 THL data loggers with integrated illumination sensors (DIN 5032-7 C class with accuracy of ±3.0 Lux or ±3.0 % and 0.1 lux resolution) point 1 and 3,
  • One Testo 160 THE data logger with an external illumination sensor (DIN 5032-7 C class with accuracy of ±3.0 Lux or ±3.0 % and 0.1 lux resolution) point 2.
The measurement points were placed in the middle of the width of the room, with a distance between sensors of 1.5m.
External solar irradiation was measured with a datalogger HD 2102.2 with a pyrometer sensor LP471 PYRA 02 (Class B). Both illumination and irradiation were measured with a time step of 1 min, which was averaged for further analysis to 1 h.

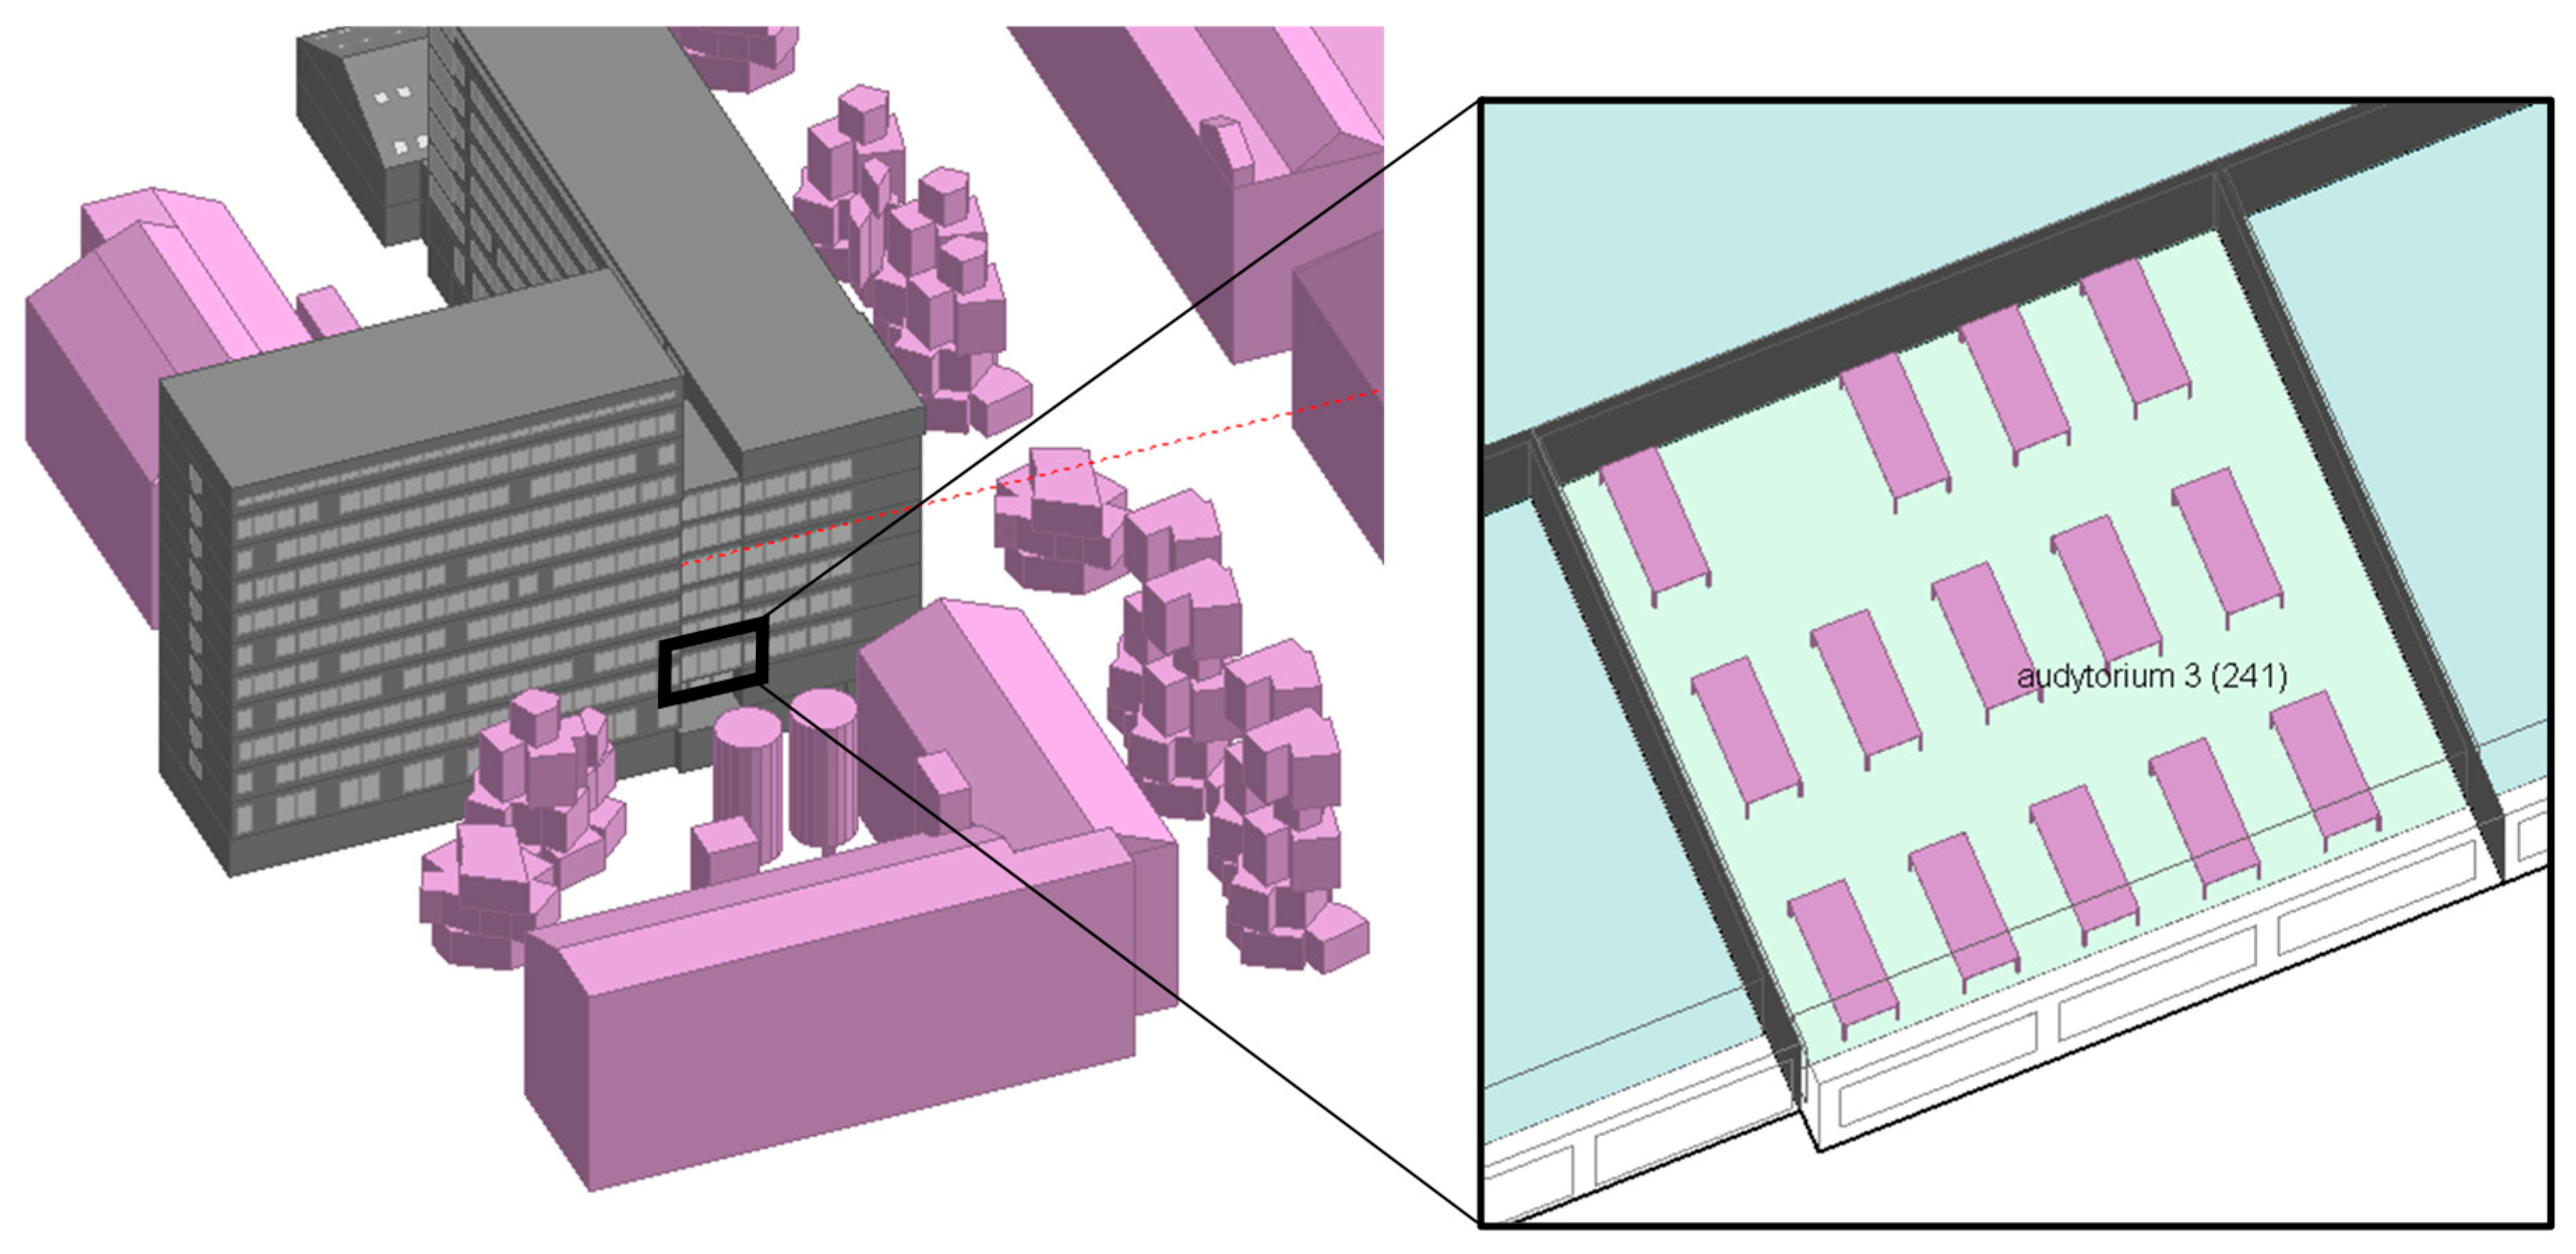
2.3. Numerical Simulations

Numerical simulations were performed using a model of the entire building in which the analysed room is located, along with its surroundings. The model was developed using the Design Builder 4.7.0.027 software, which integrates the EnergyPlus 8.3.0 simulation engine for the energy calculations. The EnergyPlus daylighting model is based on a simplified method that uses pre-calculated daylight factors. These factors are interpolated dynamically during the simulation, based on the sun’s position and sky conditions at each time step. Queiroz et. al. compared this model with the Radiance model that uses a ray tracing method [34]. Their analysis indicated that EnergyPlus gives results with a high correlation to the Radiance results; however, in the case of a significant interreflection of the light on the interior surfaces, there were noticeable differences for regions far from the windows. The 3 points selected for measurements allowed for observing the change in daylight availability as the distance from the window increased.
For the energy calculations, the model does not simulate the spatial distribution of daylight, but instead calculates illuminance at a single reference point (usually placed in the centre of the room, which corresponds to the practice of placing light intensity sensors), which is then used to control artificial lighting. Solar irradiation data from standard weather files served as the primary input for daylight availability, without the need for detailed sky models.
A visual representation of the facility and its surroundings is shown in Figure 2.
As the first step of the analysis, the model was investigated for the quality of the daylight distribution. For this purpose, simulation calculations of hourly profiles of daylight intensity were performed for the three reference points in the room, for which the measurements were carried out. The visual properties of the surfaces in the room were set based on the available literature data (Table 1) [35].
In this step, actual external solar radiation data obtained from the measurements were used as the input data in the model. The measurements provided data on global solar radiation ( I G ), while EnergyPlus requires solar data divided into direct and diffuse fractions, therefore, the diffuse fraction of the radiation ( I D ) was estimated with a correlation provided by Muneer [36]:
I D I G = 1.006 0.317 K t + 3.1241 K t 2 12.7616 K t 3 + 9.7166 K t 4
The Clearness Index (Kt) required for the calculations was determined based on the ratio of the measured solar radiation value to its theoretical value for a perfectly clear sky.
Next, the energy performance simulations were carried out for two different locations, therefore, two different sets of thermal transmittance values were used to reflect the requirements for new buildings in two different climates:
  • The first location chosen for analysis was the actual location of the building (Warsaw in Poland). For this location, a high level of thermal insulation appropriate for cold temperate climates was used.
  • The second location represents warm climates (Genoa, Italy). For this location, the same building layout was used, but the thermal properties of the envelope were adjusted to represent U-values that are comparable to those required for new buildings in warm climates.
The selected climatic data and building characteristics allowed for it to reflect the differences in the impact of the use of natural light on the energy efficiency for various locations. Thus, the simulation approach allows a realistic comparison of energy performance under climate-responsive design assumptions.
The values of the main parameters characterising the building are presented in Table 2.
The analysis was carried out for a single educational room (room 241–Figure 3) located on the second floor of the educational building (Figure 2). The room has one external wall, all three windows (each 1.75 × 2.00 m) are placed on the west-facing façade, covering 49% of its surface. The room dimensions are 5.79 m in length, 5.62 m in width, and 2.9 m in height. The first variant used in the analysis reflects the current existing state of the room. A contrasting variant with light-coloured surfaces (Table 3) was also examined in order to evaluate the influence of surface absorptance on indoor daylight availability.
Educational facilities represent a category that has a major social responsibility and often requires urgent and comprehensive modernization in terms of energy efficiency [37]. Due to lower energy efficiency standards, high occupancy rates, and long hours of daytime use, such buildings offer significant potential for improving indoor environmental quality and reducing energy consumption. The results obtained for an educational building cannot be directly transferred to other types of buildings, such as offices, residential units, or commercial facilities, due to fundamental differences in usage patterns, operational schedules, internal heat gains, and lighting requirements. However, these potential differences indicate the importance of performing comprehensive energy analyses for all building types in order to improve their energy efficiency.
Limiting the analysis to a single room allowed a more accurate analysis of the selected factors on the energy performance by eliminating the interactions between processes in surrounding rooms.
In the analysed energy model of the educational room, detailed usage schedules were defined for three main categories: lighting, occupancy, and electrical equipment (including auxiliary devices such as laptops). Lighting power was set at 6 W/m2, reflecting typical consumption levels in modern educational buildings. According to the defined schedule, lighting operates from 9:00 a.m. to 5:00 p.m. on weekdays, while remaining off outside these hours and during weekends and holidays.
Occupant density was defined at 0.43 persons/m2, corresponding to a maximum of 14 users. The occupancy schedule accounts for daily variation—starting with partial presence in the morning (e.g., 0.25 at 8:00 a.m., 0.5 at 9:00 a.m.) and reaching full occupancy between 12:00 p.m. and 5:00 p.m. Occupancy is set to zero during weekends and public holidays.
Energy use by electrical equipment was assumed at 1 W/m2. The schedule reflects full usage during working hours (9:00 a.m. to 5:00 p.m.), while outside them, devices enter standby mode, corresponding to approximately 5% of peak consumption. Standby operation is also applied throughout weekends and holidays.
The assumed internal heat gains reflect typical usage patterns in educational buildings and include occupancy and equipment usage during the summer period, when classes and other academic activities may still be held.

3. Results

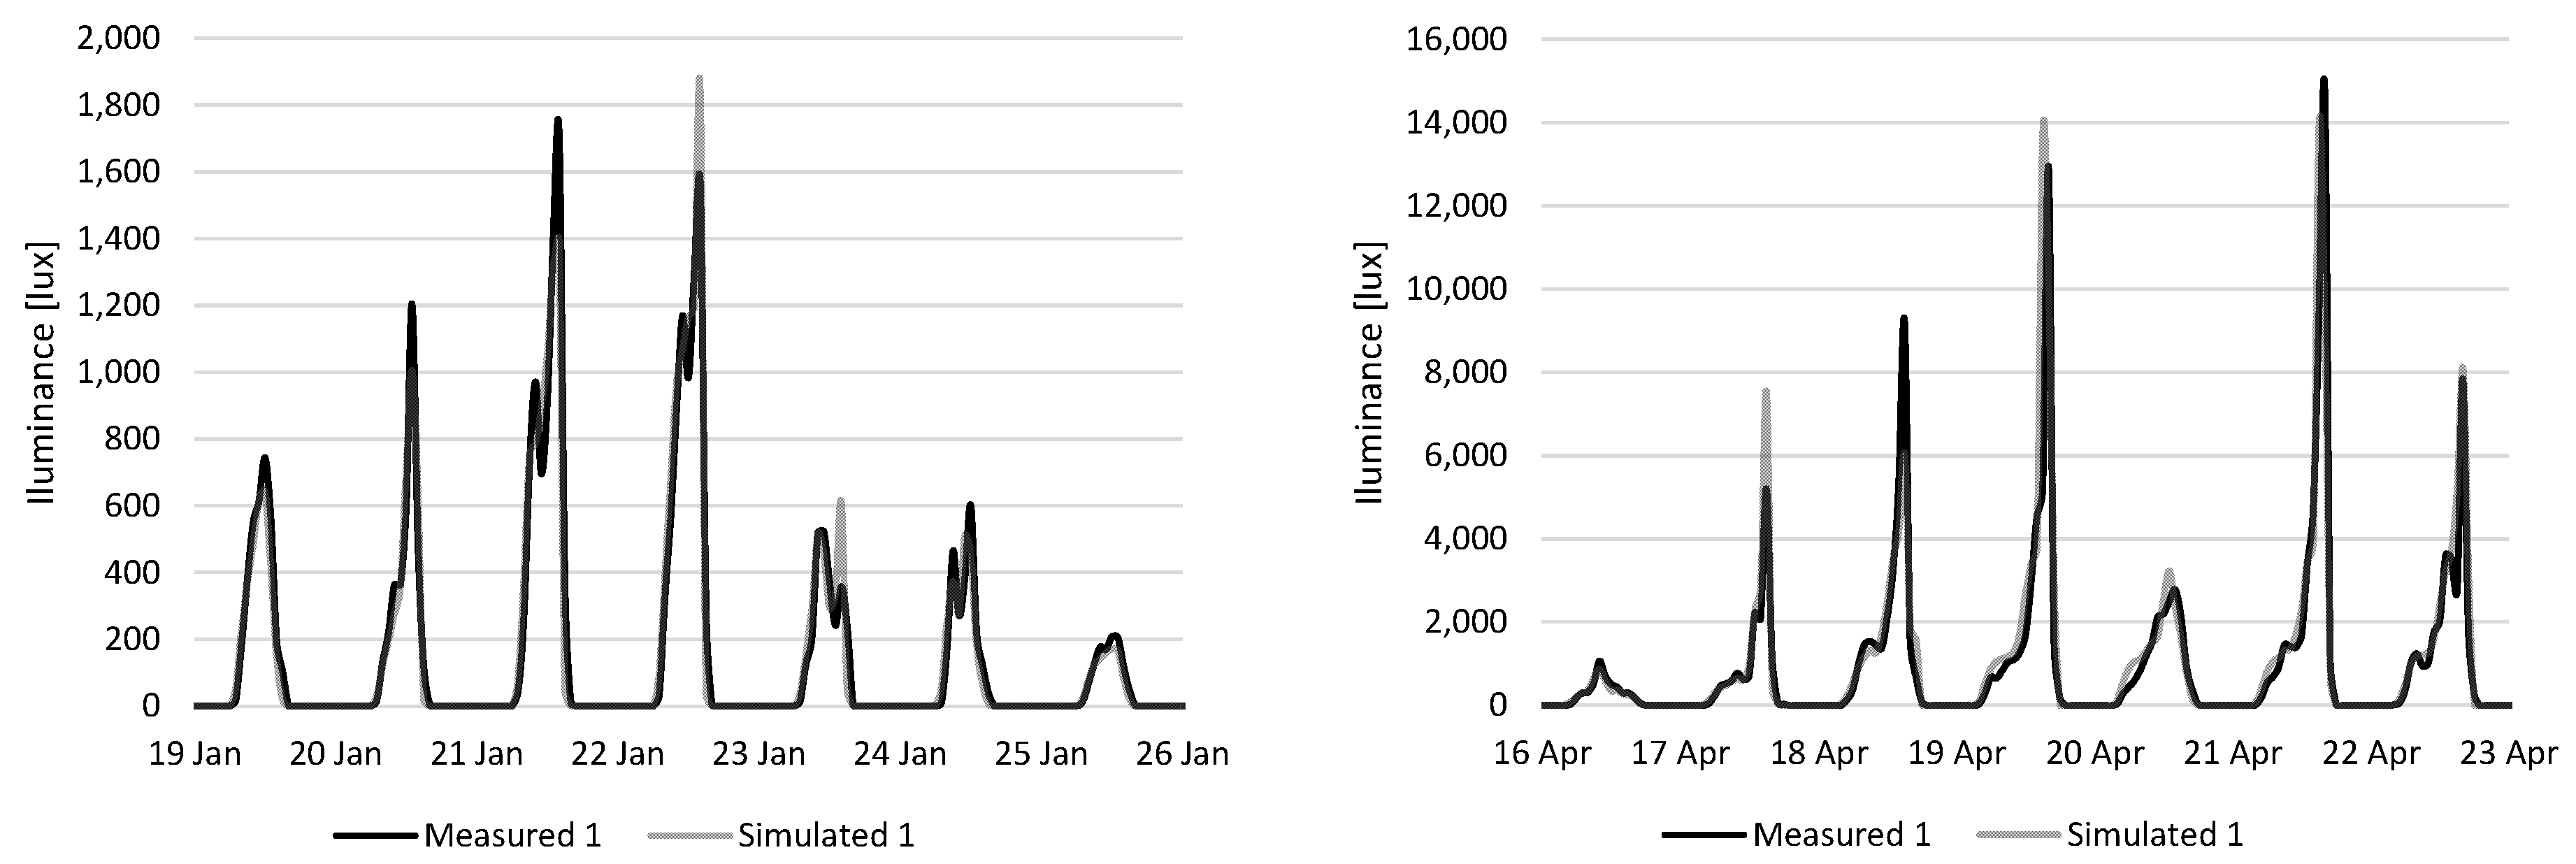
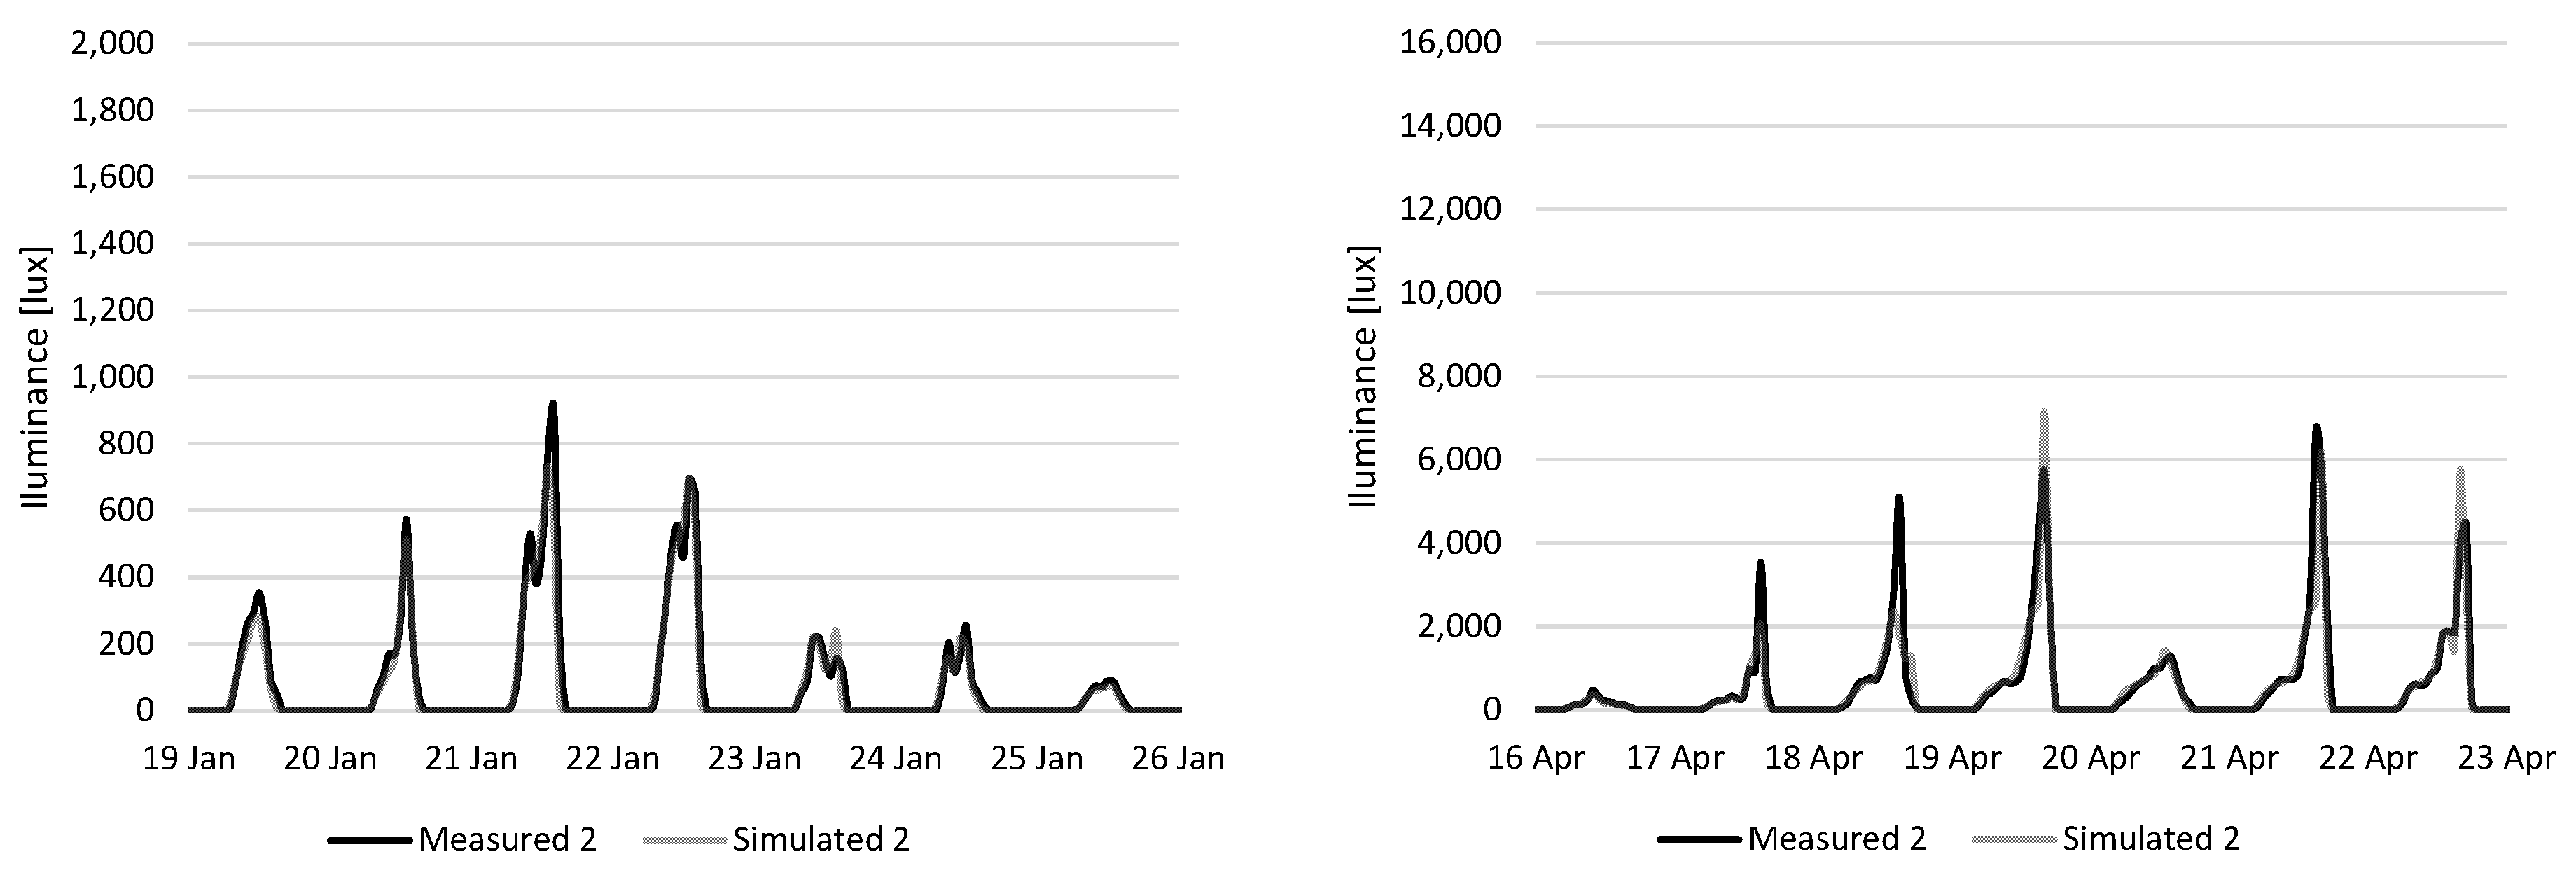
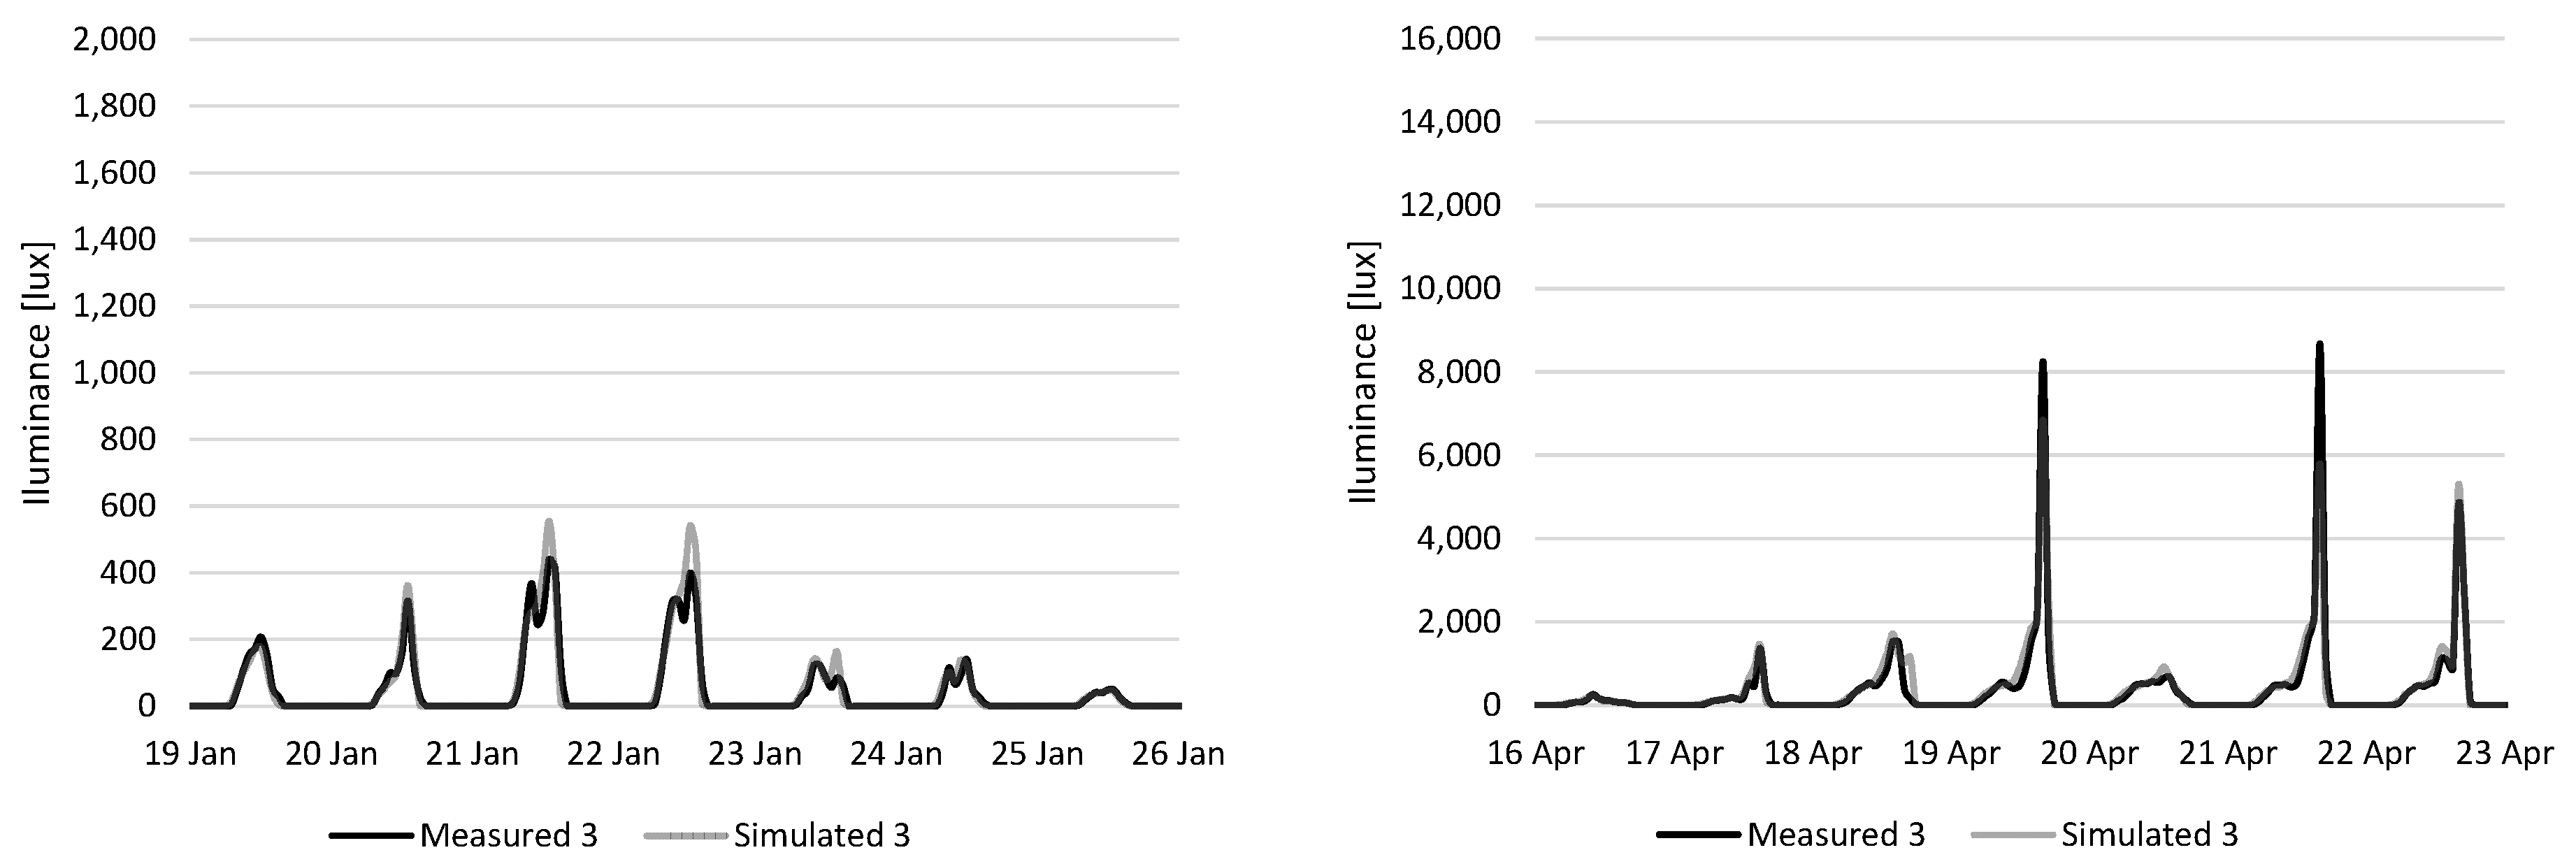
3.1. Quality of the Daylight Model

The measurement data on illuminance for the three reference points were used to create hourly profiles for selected periods with various solar irradiation characteristics, to include periods with direct and diffuse solar radiation of different intensities. These profiles were compared with the illuminance profiles obtained for the same 3 points, received from hourly simulations made with the EnergyPlus model that used the solar external irradiation data obtained from measurements as input data (Figure 4, Figure 5 and Figure 6).
To describe the quality of the model, a value of the correlation coefficient R2 and the average percentage deviation of the simulated from the measured illuminance were used.
According to the results (Table 4), for both periods, the average percentage deviation of the illumination value, determined using the numerical model from the measured values, was in the range between −10 and +8%. This means that the model gives a fairly accurate estimation of the level of daylight availability in a room. In most cases, the correlation coefficient values were above 0.93, which indicates a good representation of the important factors. A lower value of the correlation coefficient (R2 = 0.79) was achieved for points located closer to the windows during the period of intense solar radiation. In these cases, deviations may result from the accuracy of mapping the geometry of the direct radiation reflection, but a visual assessment of the illumination profiles indicates a similar course of the profiles determined on the basis of simulations and measurements. Therefore, the analysis confirmed the results of previous studies, which pointed out the limitations in spatial accuracy of the simplified model used in EnergyPlus energy calculations. However, taking into account that the deviations were both positive and negative for different points in the room, the impact of this inaccuracy can be limited as the daylight availability is averaged in terms of both time and space.

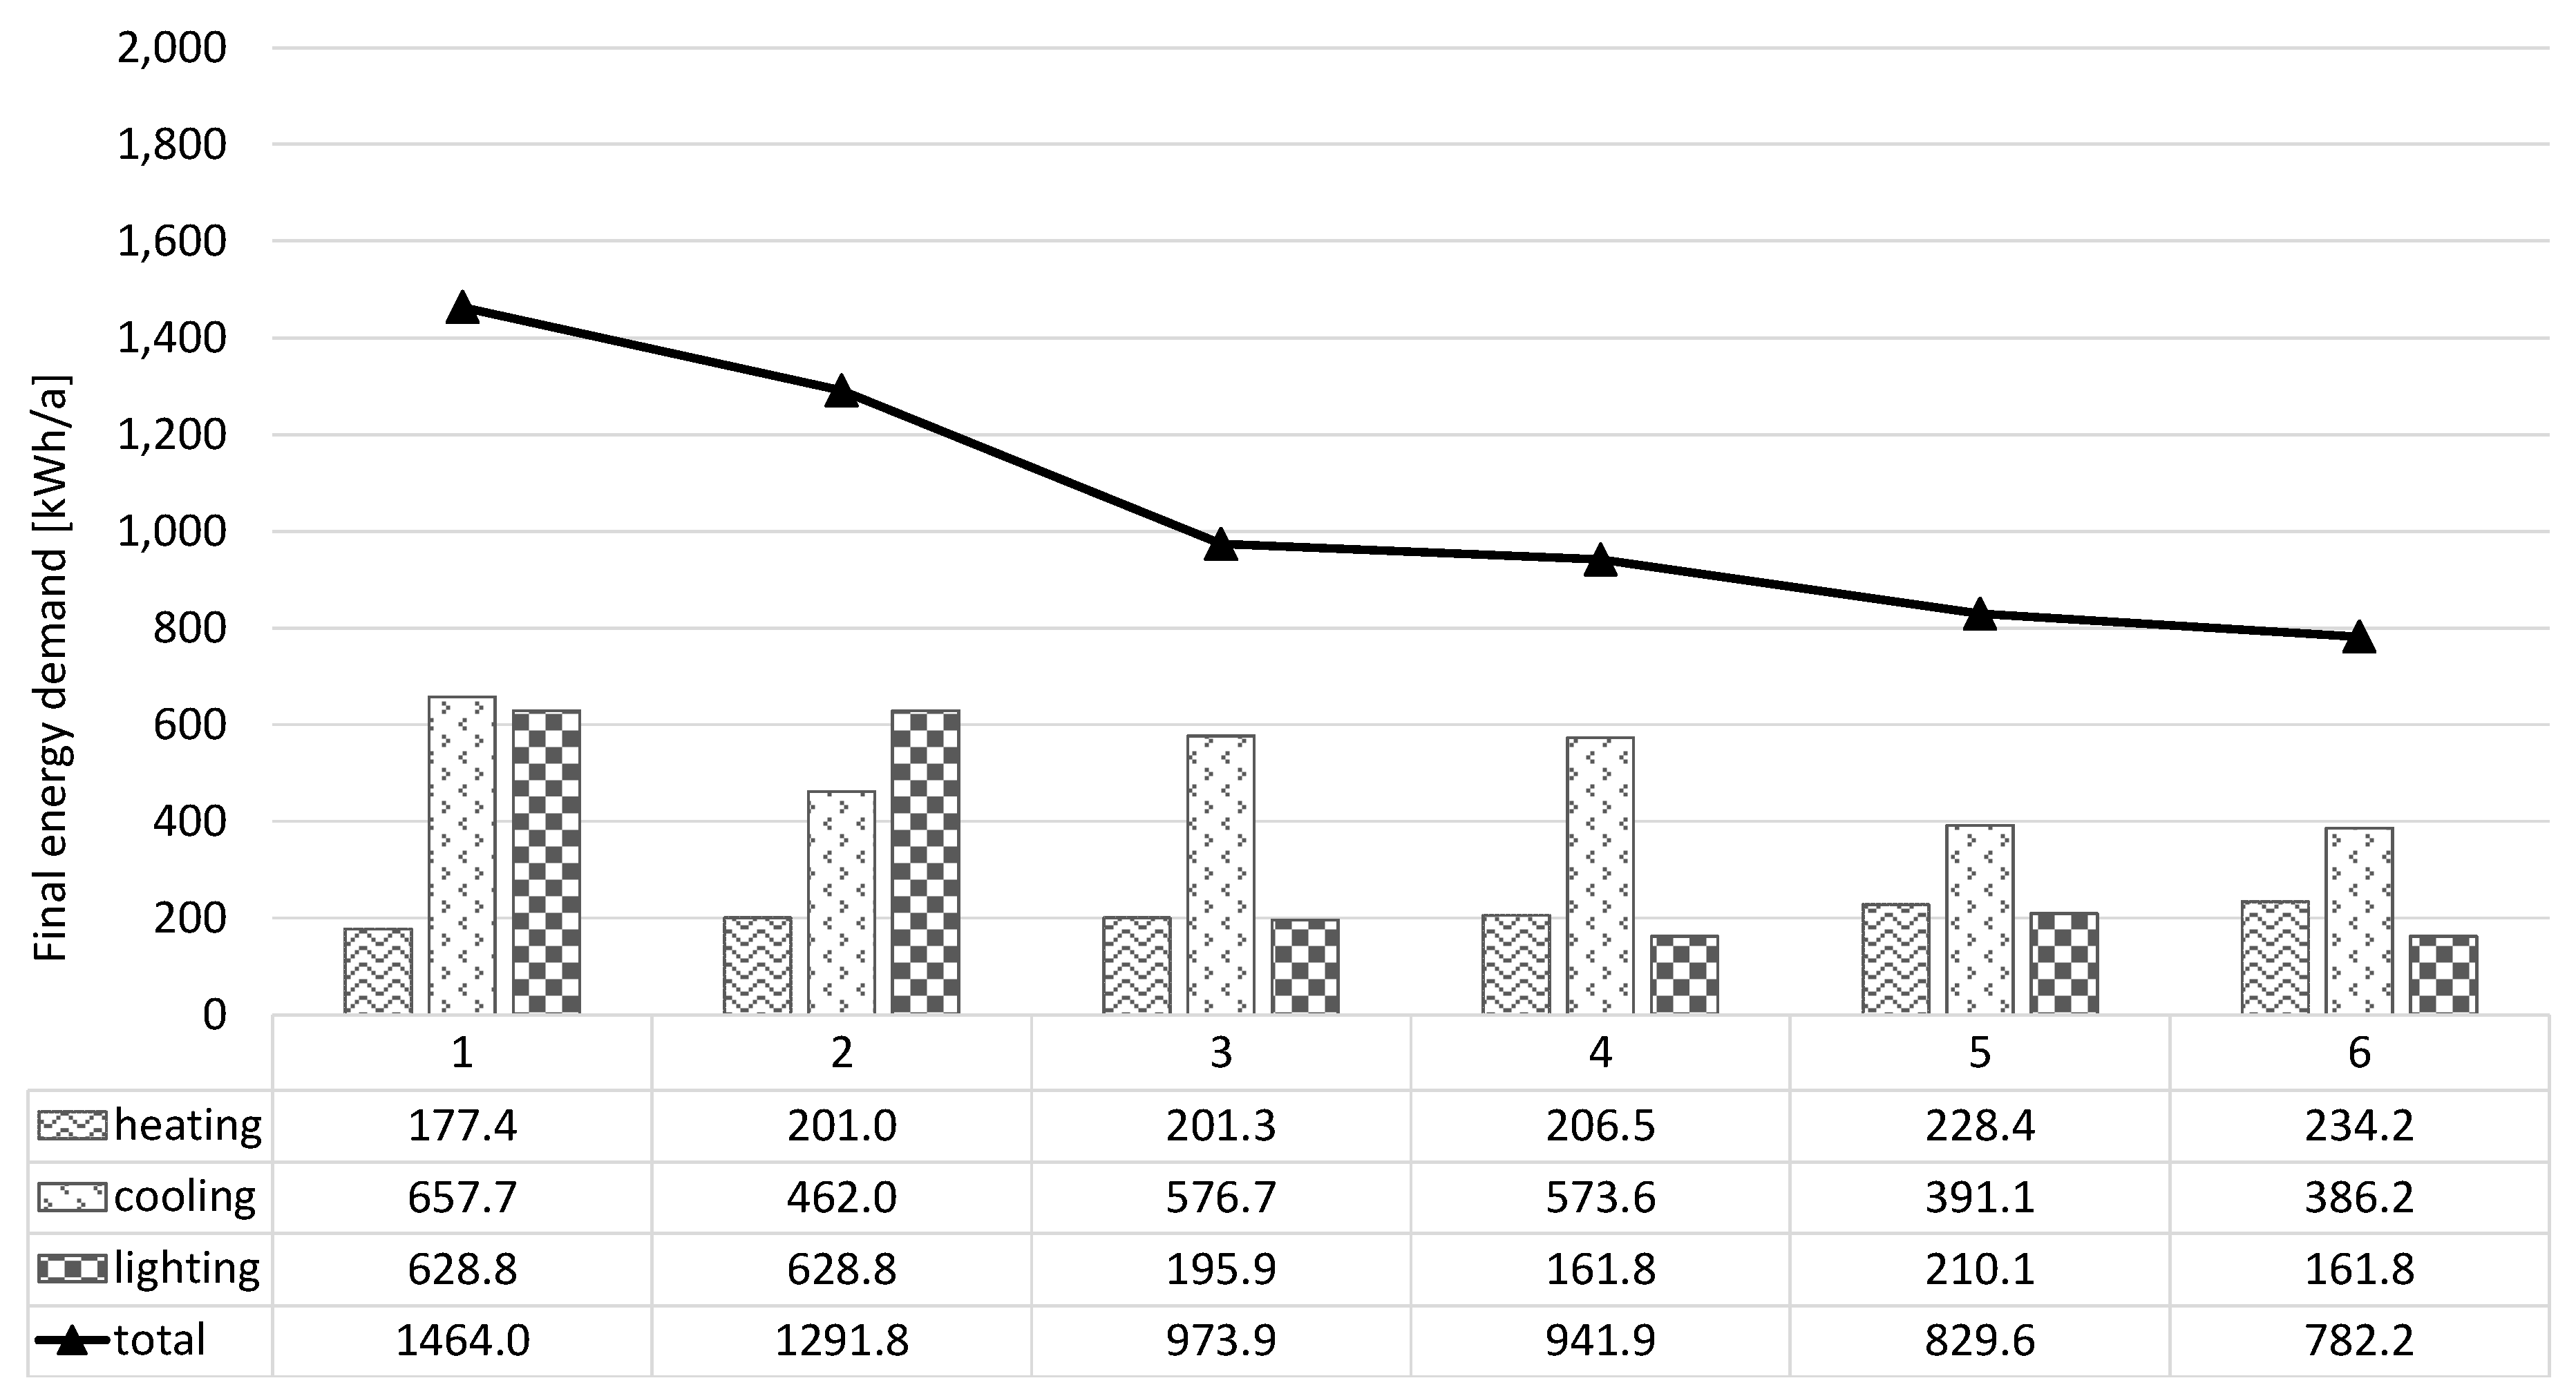
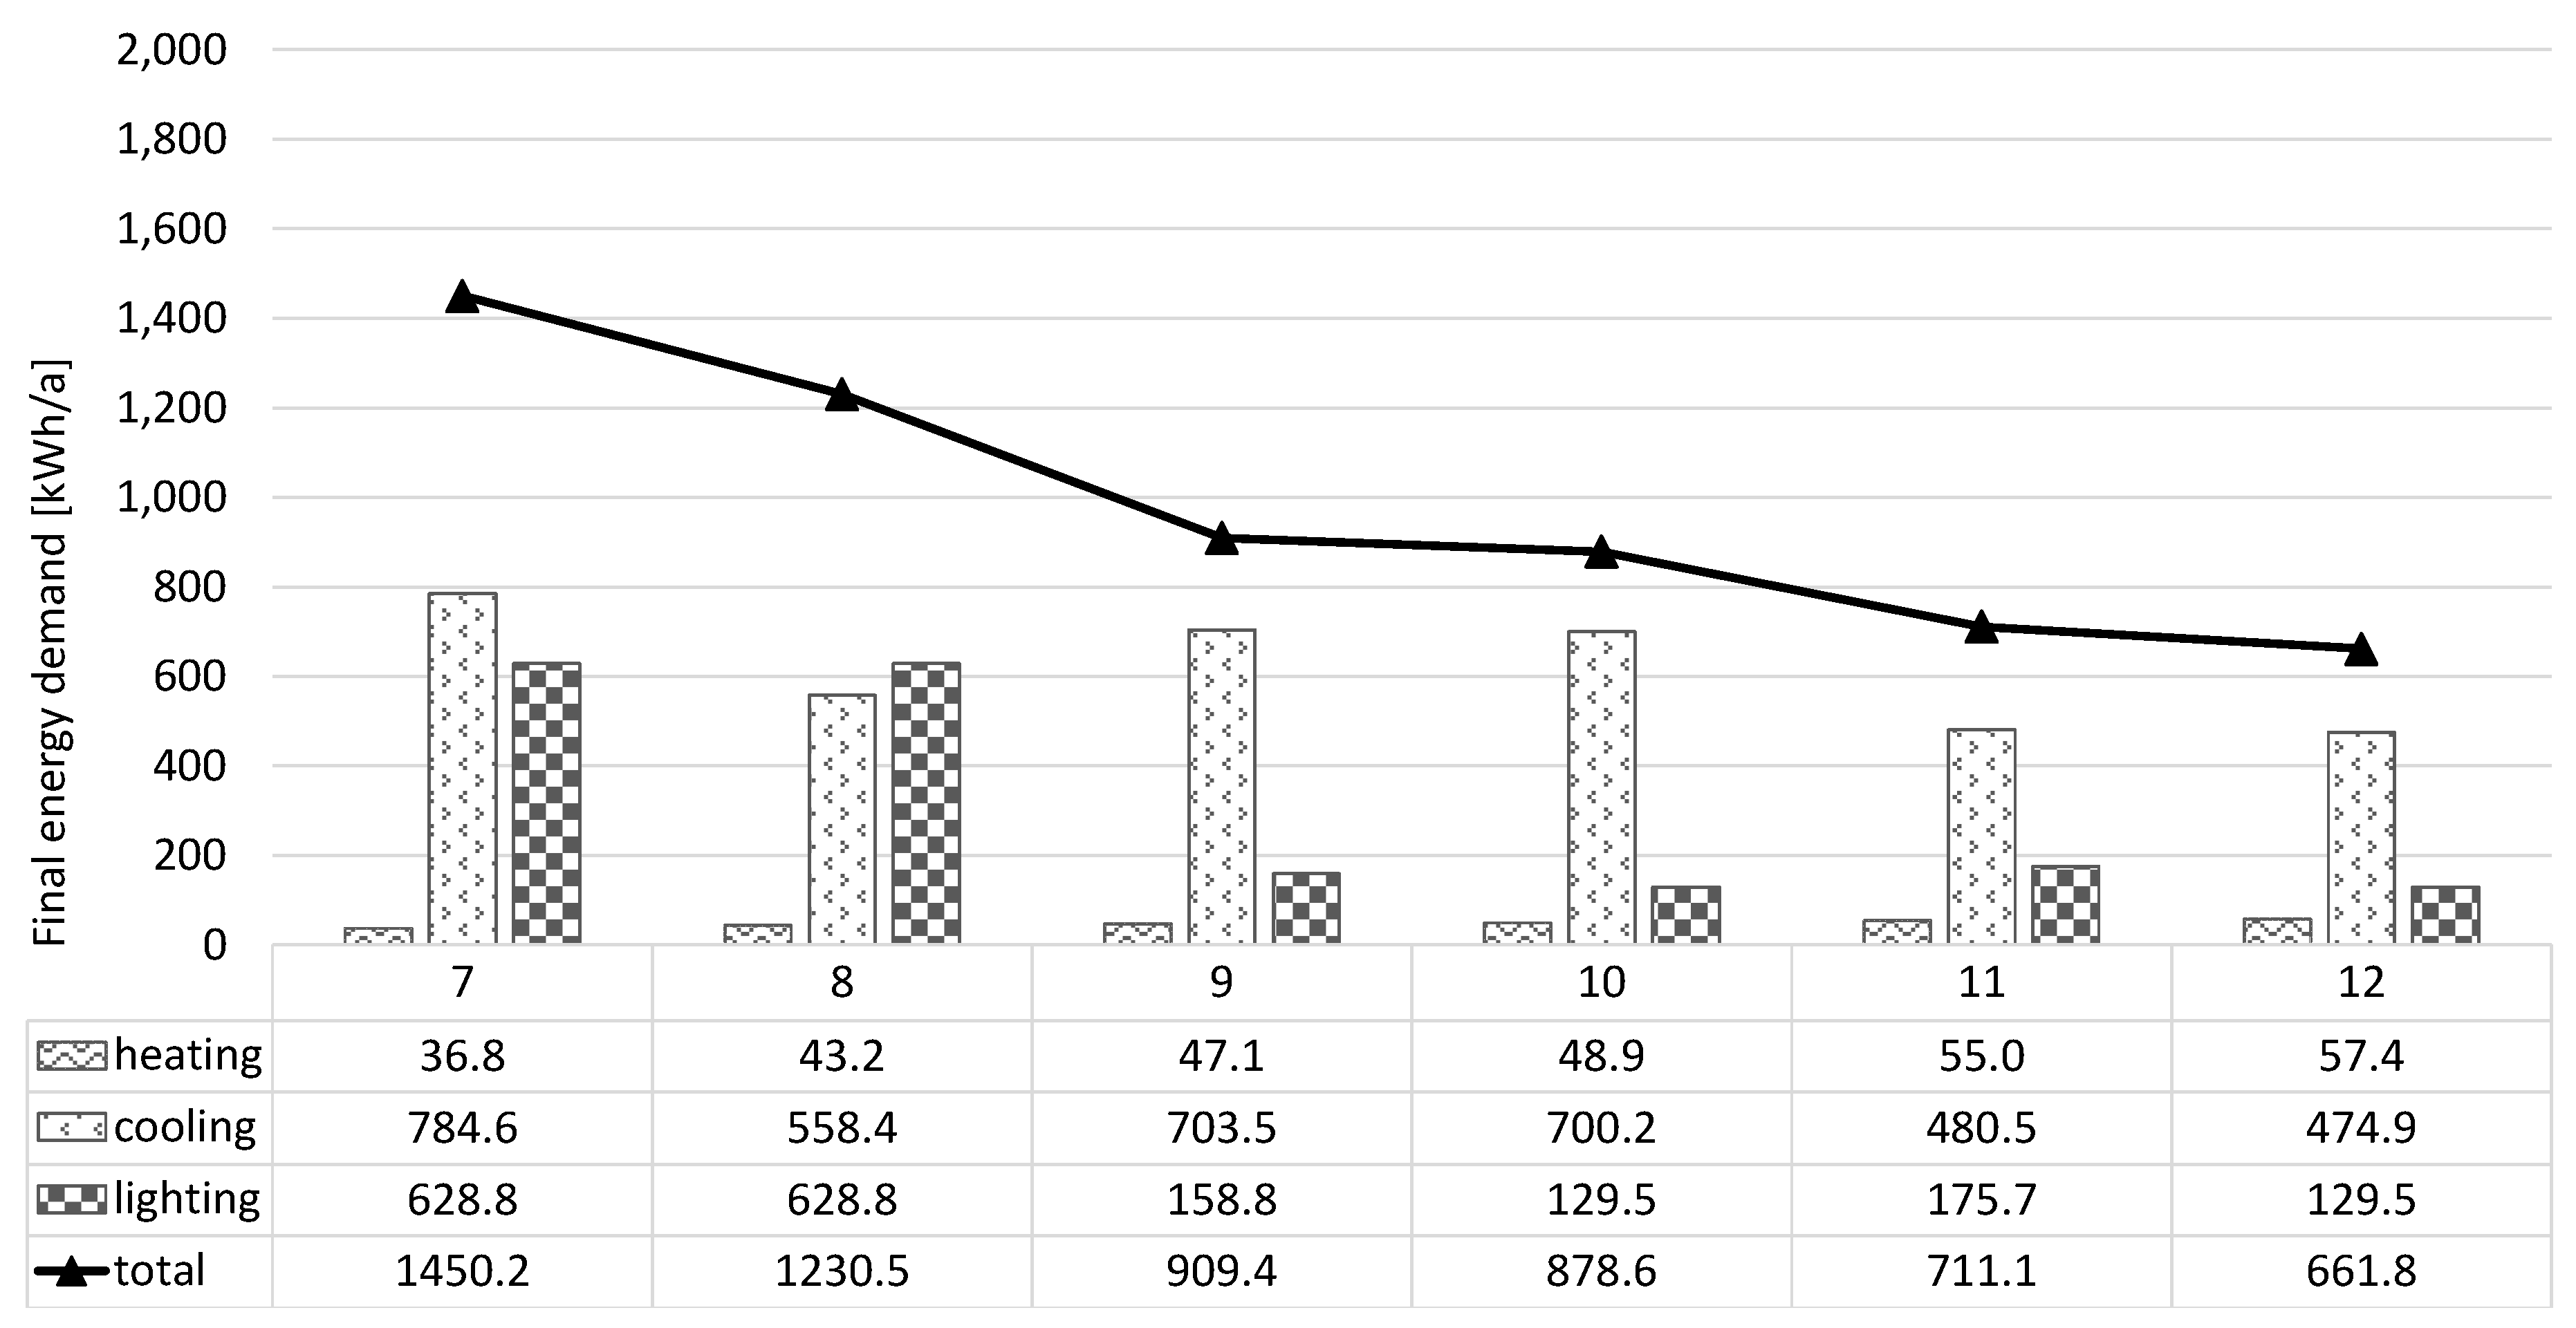
3.2. Energy Performance Simulations

The study included 12 different simulation variants. Each variant is defined by a unique combination of parameters, including location (Warsaw or Genoa), absorptance of internal surfaces (low or high), lighting control strategy (none or linear), and external shading configuration (with or without external blinds) (Table 5). The specific values for “low” and “high” absorptance are provided in Table 3.
The simulation variants were developed based on a systematic parametric approach, combining four key design variables: climatic location (Warsaw or Genoa), visible absorptance of internal surfaces (high or low), lighting control strategy (none or linear), and external shading configuration (with or without blinds). This configuration enabled a comprehensive evaluation of both the individual and interactive effects of these parameters on the energy performance. The selected scenarios reflect realistic design options and support the identification of synergies and trade-offs between visual and thermal strategies under different climatic conditions.
To ensure consistency and minimize the influence of other factors, the same configuration of HVAC systems was used in all variants. Therefore, in both locations, a mechanical ventilation system with 85% heat recovery was used, and a reversible heat pump was used as the source for both heating and cooling. The seasonal average system efficiency (including SPF/SEER, distribution, and regulation efficiencies) is assumed to be 2.87 for heating and 4.84 for cooling in Warsaw, and 3.38 and 4.41, respectively, in Genoa. The indoor temperature setpoints are 21 °C for heating and 24 °C for cooling in Warsaw, and 20 °C and 26 °C, respectively, in Genoa.
Analysis of six variants for the Warsaw location evaluates the impact of internal surface visual absorptance, lighting control, and the use of external solar shading on final energy consumption for lighting, heating, and cooling for the classroom space (Figure 7).
Variant 1 served as a baseline scenario for the Warsaw location. No lighting control or external blinds results in the highest final energy consumption (1464.0 kWh/a). The absence of daylight control results in high demand for artificial lighting (628.8 kWh/a), which also leads to a high level of internal heat gains and, as a result, the elevated demand for cooling (657.7 kWh/a).
Variant 2 introduces external blinds, but it does not include lighting control. As an outcome, energy use for lighting remains identical to the baseline case. Although cooling demand is 30 % lower than in Variant 1 (462.0 kWh/a), the lack of daylight management, accompanied by the increase of heat demand, caused by reduced solar heat gains, significantly limits the overall energy performance, which decreases only by 12% (1291.8 kWh/a).
Variants 3 and 4 introduce continuous lighting control, but it does not include external blinds. For these variants, the energy use for lighting drops significantly (by 69 and 74% respectively); moreover, due to reduced internal heat gains, there is also a noticeable drop in cooling demand compared to Variant 1 (12–13%). However, reduced internal heat gains from artificial lighting in these cases lead to an increased demand for heating (by 13% and 16%).
It should be noted that the light-coloured interior in Variant 4 allows a significant reduction in energy demand for lighting (161.8 kWh/a) compared to Variant 3 (195.9 kWh/a), resulting in a higher decrease of the total demand (36% instead of 33%). The energy demand reduction for cooling is not as high as in the case of the use of external blinds, but the total final energy consumption for both Variants 3 and 4 is much lower than for Variant 2.
Variants 5 and 6 combine lighting control with automated external blinds that respond to solar radiation levels. Again, the use of light-coloured interior (Variant 6) allows a more significant reduction in energy demand for lighting (161.8 kWh/a), compared to Variant 5 (210.1 kWh/a). Effective reduction of both cooling and lighting energy demand results in the lowest overall energy use for Variant 6 (782.2 kWh/a), which is lower by 47% compared to the baseline variant.
A similar analysis was carried out for the Genoa location, evaluating the impact of internal surface absorptance, lighting control, and the application of external solar shading on the final energy consumption for the simulated classroom (Figure 8).
The baseline configuration for Genoa location, Variant 7, excludes both lighting control and external shading devices, that results in the highest final energy demand (1450.2 kWh/a), with dominating cooling (784.6 kWh/a) and lighting loads (628.8 kWh/a).
Variant 8 introduces external blinds, but it does not include lighting control. Same as for the Warsaw location, the energy use for lighting remains identical to the baseline case. Although cooling demand is 29 % lower than in Variant 1 (558.4 kWh/a), the lack of daylight management, accompanied by the increase of heat demand, caused by reduced solar heat gains, significantly limits the overall energy performance, which decreases only by 15% (1230.5 kWh/a). However, this decrease is higher than in the case of Warsaw, due to the greater share of cooling demand in the overall energy balance.
Variants 9 and 10 introduce continuous lighting control but do not include external blinds. Again, the use of lighting control results in a significant drop in the energy use for lighting and a noticeable drop in cooling demand compared to Variant 7. However, reduced internal heat gains from artificial lighting in these cases lead to an increased demand for heating.
The light-coloured interior in Variant 10 allows a significant reduction in energy demand for lighting (129.2 kWh/a) compared to Variant 9 (158.8 kWh/a), resulting in a higher decrease of the total demand (39% instead of 37%). Despite not as high a reduction of cooling demand as in the case of the use of external blinds, the total final energy consumption for both Variants 9 and 10 is much lower than for Variant 8.
Variants 11 and 12 combine lighting control with automated external blinds that respond to solar radiation levels. Again, the use of a light-coloured interior (Variant 12) allows a more significant reduction in energy demand for lighting (129.5 kWh/a), compared to Variant 11 (175.7 kWh/a). Effective reduction of both cooling and lighting energy demand results in the lowest overall energy use for Variant 12 (661.8 kWh/a), which is lower by 54% compared to the baseline variant.

4. Discussion

Comparison of measurement results with those obtained from simulations confirmed that numerical models can fairly well represent the level of available natural lighting in rooms under various conditions of solar radiation intensity. This means that their use may allow an evaluation of advanced solutions related to the use of daylight in terms of energy efficiency.
The comparative analysis of the energy demand for lighting, cooling, and heating of the analysed room confirmed that an effective use of daylight can significantly improve its energy performance. For the analysed variants, savings resulting from the applied solutions allowed a reduction of the energy demand even to the level of 53% for Warsaw or 46% for Genoa of the values for the baseline scenarios (Table 6), which were variants 1 and 7 for Warsaw and Genoa, respectively.
It is particularly important that the use of lighting control allows not only a significant reduction of the energy demand for artificial lighting, but also enables a noticeable reduction of the demand for cooling. The analysis for both locations indicated that the implementation of a lighting control system provided better results than external shading. Whereas the blinds had only reduced total energy demand to a level of 88% and 85% of the baseline scenario (respectively for Warsaw and Genoa locations), while variants with the automatic lighting control systems allowed for a reduction of the demand to a level in the range from 61 to 67% of the base value. Combining all of the considered measures allowed for a reduction of the total energy demand down to 53% (variant 6) or 46% (Variant 12) of the baseline values. These results, although the analysis was carried out only for a single room with a given characteristic, confirm that it is important to consider a wide range of measures at the design stage.
Moreover, the study indicated that factors that are often neglected in energy performance analyses, like the colour of the internal surfaces, can have a significant effect on the final energy consumption. In variants with light interior, the total energy consumption was lower by about 3–4% of the baseline demand, compared to their corresponding variants with a dark surface.
Further analysis showed that even though the combination of lighting control and light-coloured surfaces can significantly reduce total energy use, their introduction may lead to an increase in heating demand. This essentially happens due to the reduction of internal heat gains from lighting, for which the luminous efficiency, measured as the ratio of visible light to heat, is lower than that of daylight. A similar effect can be observed in the case of the use of external shading, as it can limit passive solar heat gains in the course of its action aimed at the reduction of the glare effect. Despite this negative effect, the overall energy balance remains advantageous, as the savings in lighting and cooling energy outweigh the additional heating needs. In warmer locations, such as Genoa, the increase in heating demand is less significant, which confirms that the effectiveness of daylight-based strategies is closely related to local climatic conditions.
This study highlights the importance of the use of integrated analysis of multiple design parameters, lighting control, surface reflectance, and external shading, using a BIM-based simulation workflow. Previous studies have explored these strategies individually; comprehensive analyses that evaluate their combined effects on energy performance within a unified BIM environment remain limited. A recent review, made by Hauer [38], highlights that the integration of lighting control and material properties in BIM-based simulations is still underdeveloped and lacks practical implementation in design workflows.
This study addresses that gap by demonstrating how interactions between visual and thermal parameters—such as reflectance and shading—can lead to trade-offs, including increased heating demand despite reduced cooling and lighting loads.
In their research, Peña-García and Salata emphasized the importance of surface reflectance in optimizing visual comfort and energy use [39]. We develop this issue further by showing how reflectance can interact with other design strategies in a dynamic simulation context, influencing not only lighting but also heating and cooling demands.
In conclusion, the use of BIM to integrate the use of daylight in building design can help to estimate the energy savings potential of various measures, in order to find a solution that provides the most beneficial results.
These findings demonstrate the importance of considering the integrated effects of design strategies, rather than analysing them separately, in order to prevent unintended consequences and achieve comprehensive optimization of building performance. However, due to the limitations of simplified daylight availability models such as the one used in EnergyPlus or time-consuming, accurate models such as Radiance, further research is needed to determine methods that will allow for improving the reliability of the results.

Author Contributions

Conceptualization, A.T. and J.R.; methodology, A.T.; software, J.R.; validation, A.T. and J.R.; formal analysis, J.R.; investigation, A.T.; resources, A.T.; data curation, A.T. and J.R.; writing—original draft preparation, A.T. and J.R.; writing—review and editing, A.T. and J.R.; visualization, J.R.; supervision, A.T. All authors have read and agreed to the published version of the manuscript.

Funding

The research was co-financed under the research grant from the scientific council of the Science discipline of environmental engineering, mining, and energy of the Warsaw University of Technology.

Data Availability Statement

The datasets presented in this article are not readily available due to time limitations. Requests to access the datasets should be directed to adrian.trzaski@pw.edu.pl.

Conflicts of Interest

The authors declare no conflicts of interest.

Abbreviations

The following abbreviations are used in this manuscript:
BIMBuilding Information Modelling
OECDOrganisation for Economic Co-operation and Development
UNEPUnited Nations Environment Programme
SPFSeasonal Performance Factor
SEERSeasonal Energy Efficiency Ratio
HVACHeating, Ventilation and Air Conditioning

References

  1. UNEP. 2022 Global Status Report for Buildings and Construction; United Nations Environment Programme: Nairobi, Kenya, 2022; Available online: https://www.unep.org/resources/publication/2022-global-status-report-buildings-and-construction (accessed on 14 April 2025).
  2. OECD. Global Monitoring of Policies for Decarbonising Buildings: A Multi-level Approach; OECD Urban Studies; OECD Publishing: Paris, France, 2024. [Google Scholar] [CrossRef]
  3. Hee, W.J.; Alghoul, M.A.; Bakhtyar, B.; Elayeb, O.K.; Shameri, M.A.; Alrubaih, M.S.; Sopian, K. The role of window glazing on daylighting and energy saving in buildings. Renew. Sustain. Energy Rev. 2015, 42, 323–343. [Google Scholar] [CrossRef]
  4. Nielsen, T.R.; Duer, K.; Svendsen, S. Energy performance of glazings and windows. Sol. Energy 2000, 69, 137–143. [Google Scholar] [CrossRef]
  5. Bakmohammadi, P.; Noorzai, E. Optimization of the design of the primary school classrooms in terms of energy and daylight performance considering occupants’ thermal and visual comfort. Energy Rep. 2020, 6, 1590–1607. [Google Scholar] [CrossRef]
  6. Gasparella, A.; Pernigotto, G.; Cappelletti, F.; Romagnoni, P.; Baggio, P. Analysis and modelling of window and glazing systems energy performance for a well insulated residential building. Energy Build. 2011, 43, 1030–1037. [Google Scholar] [CrossRef]
  7. Persson, M.-L.; Roos, A.; Wall, M. Influence of window size on the energy balance of low energy houses. Energy Build. 2006, 38, 181–188. [Google Scholar] [CrossRef]
  8. Poirazis, H.; Blomsterberg, Å.; Wall, M. Energy simulations for glazed office buildings in Sweden. Energy Build. 2008, 40, 1161–1170. [Google Scholar] [CrossRef]
  9. Urbikain, M.K.; Sala, J.M. Analysis of different models to estimate energy savings related to windows in residential buildings. Energy Build. 2009, 41, 687–695. [Google Scholar] [CrossRef]
  10. Dussault, J.-M.; Gosselin, L.; Galstian, T. Integration of smart windows into building design for reduction of yearly overall energy consumption and peak loads. Sol. Energy 2012, 86, 3405–3416. [Google Scholar] [CrossRef]
  11. Lee, J.W.; Jung, H.J.; Park, J.Y.; Lee, J.B.; Yoon, Y. Optimization of building window system in Asian regions by analyzing solar heat gain and daylighting elements. Renew. Energy 2013, 50, 522–531. [Google Scholar] [CrossRef]
  12. Li, D.H.W. A review of daylight illuminance determinations and energy implications. Appl. Energy 2010, 87, 2109–2118. [Google Scholar] [CrossRef]
  13. Díaz-Vilariño, L.; Lagüela, S.; Armesto, J.; Arias, P. Indoor daylight simulation performed on automatically generated as-built 3D models. Energy Build. 2014, 68 Part A, 54–62. [Google Scholar] [CrossRef]
  14. Li, D.H.W.; Lam, T.N.T.; Wong, S.L.; Mak, A.H.L. Lighting and cooling energy consumption in an open plan office using solar film coating. Energy Int. J. 2008, 33, 1288–1297. [Google Scholar] [CrossRef]
  15. Littlefair, P.J. Predicting annual lighting use in daylit buildings. Build. Environ. 1990, 25, 43–53. [Google Scholar] [CrossRef]
  16. Nazari, M.; Matusiak, B. Daylighting simulation and visualisation: Navigating challenges in accuracy and validation. Energy Build. 2024, 312, 114188. [Google Scholar] [CrossRef]
  17. Brembilla, E.; Hopfe, C.J.; Mardaljevic, J. Influence of input reflectance values on climate based daylight metrics using sensitivity analysis. J. Build. Perform. Simul. 2018, 11, 333–349. [Google Scholar] [CrossRef]
  18. Yu, J.; Lu, Y.; Hu, J.; Zhong, K.; Jia, T.; Yang, X. Prediction models for building thermal mass of intermittently heated rooms for balancing energy consumption and indoor thermal comfort. Energy Build. 2024, 317, 114376. [Google Scholar] [CrossRef]
  19. Duan, J.; Li, N.; Peng, J.; Wang, C.; Liu, Q.; Zhou, X. Study on occupant behaviour using air conditioning of high-rise residential buildings in hot summer and cold winter zone in China. Energy Build. 2022, 276, 112498. [Google Scholar] [CrossRef]
  20. Ascione, F.; Bianco, N.; Masi, R.F.D.; Mastellone, M.; Mauro, G.M.; Vanoli, G.P. The role of the occupant behavior in affecting the feasibility of energy refurbishment of residential buildings: Typical effective retrofits compromised by typical wrong habits. Energy Build. 2020, 223, 110217. [Google Scholar] [CrossRef]
  21. Abbas, G.M.; Gursel Dino, I.; Percin, M. An integrated pipeline for building performance analysis: Daylighting, energy, natural ventilation, and airborne contaminant dispersion. J. Build. Eng. 2023, 75, 106991. [Google Scholar] [CrossRef]
  22. Gürsel Dino, İ.; Üçoluk, G. Multiobjective design optimization of building space layout, energy, and daylighting performance. J. Comput. Civ. Eng. 2017, 31, 04017025. [Google Scholar] [CrossRef]
  23. Touloupaki, E.; Theodosiou, T. Performance Simulation Integrated in Parametric 3D Modeling as a Method for Early Stage Design Optimization—A Review. Energies 2017, 10, 637. [Google Scholar] [CrossRef]
  24. Papinutto, M.; Boghetti, R.; Colombo, M.; Basurto, C.; Reutter, K.; Lalanne, D.; Kämpf, J.H.; Nembrini, J. Saving energy by maximising daylight and minimising the impact on occupants: An automatic lighting system approach. Energy Build. 2022, 268, 112176. [Google Scholar] [CrossRef]
  25. Lee, J.H.; Kang, J.-S. Study on Lighting Energy Savings by Applying a Daylight-Concentrating Indoor Louver System with LED Dimming Control. Energies 2024, 17, 3425. [Google Scholar] [CrossRef]
  26. Wong, I.L. A review of daylighting design and implementation in buildings. Renew. Sustain. Energy Rev. 2017, 74, 959–968. [Google Scholar] [CrossRef]
  27. Grynning, S.; Gustavsen, A.; Time, B.; Jelle, B.P. Windows in the buildings of tomorrow: Energy losers or energy gainers? Energy Build. 2013, 61, 185–192. [Google Scholar] [CrossRef]
  28. Dimson, C.K.; Nwaji, G.N.; Nwufo, O.C.; Ogueke, N.V.; Anyanwu, E.E. Investigation of the Effect of Window Glazing on the Cooling Loads of Buildings. Int. J. Adv. Sci. Eng. 2023, 10, 3380–3387. [Google Scholar] [CrossRef]
  29. Carlander, J.; Moshfegh, B.; Akander, J.; Karlsson, F. Effects on Energy Demand in an Office Building Considering Location, Orientation, Façade Design and Internal Heat Gains—A Parametric Study. Energies 2020, 13, 6170. [Google Scholar] [CrossRef]
  30. Bellia, L.; Pedace, A.; Fragliasso, F. The impact of the software’s choice on dynamic daylight simulations’ results: A comparison between Daysim and 3ds Max Design. Sol. Energy 2015, 122, 249–263. [Google Scholar] [CrossRef]
  31. Nguyen, A.-T.; Reiter, S.; Rigo, P. A review on simulation-based optimization methods applied to building performance analysis. Appl. Energy 2014, 113, 1043–1058. [Google Scholar] [CrossRef]
  32. Gibson, T.; Krarti, M. Comparative Analysis of Prediction Accuracy from Daylighting Simulation Tools. LEUKOS 2014, 11, 49–60. [Google Scholar] [CrossRef]
  33. Pisello, A.L.; Goretti, M.; Cotana, F. A method for assessing buildings’ energy efficiency by dynamic simulation and experimental activity. Appl. Energy 2012, 97, 419–429. [Google Scholar] [CrossRef]
  34. Queiroz, N.; Westphal, F.S.; Pereira, F.O.R. A performance-based design validation study on EnergyPlus for daylighting analysis. Build. Environ. 2020, 183, 107088. [Google Scholar] [CrossRef]
  35. Jakubiec, J.A. Data-Driven Selection of Typical Opaque Material Reflectances for Lighting Simulation. LEUKOS 2022, 19, 176–189. [Google Scholar] [CrossRef]
  36. Muneer, T.; Gueymard, C.; Kambezidis, H. Solar Radiation and Daylight Models: For the Energy Efficient Design of Buildings; Taylor & Francis Group: London, UK, 2004. [Google Scholar]
  37. Pereira, L.D.; Raimondo, D.; Corgnati, S.P.; Da Silva, M.G. Energy consumption in schools—A review paper. Renew. Sustain. Energy Rev. 2014, 40, 911–922. [Google Scholar] [CrossRef]
  38. Hauer, M.; Hammes, S.; Zech, P.; Geisler-Moroder, D.; Plörer, D.; Miller, J.; van Karsbergen, V.; Pfluger, R. Integrating digital twins with BIM for enhanced building control strategies: A systematic literature review focusing on daylight and artificial lighting systems. Buildings 2024, 14, 805. [Google Scholar] [CrossRef]
  39. Peña-García, A.; Salata, F. Indoor lighting customization based on effective reflectance coefficients: A methodology to optimize visual performance and decrease consumption in educative workplaces. Sustainability 2021, 13, 119. [Google Scholar] [CrossRef]
Figure 1. The distribution of the measurement points.
Energies 18 04113 g001
Figure 2. Visualisation of the model of the building and its surroundings.
Energies 18 04113 g002
Figure 3. A photograph of the Lecture Hall 241 (a) and building surroundings (b).
Energies 18 04113 g003
Figure 4. Measured and simulated illuminance profiles for the reference point 1.
Energies 18 04113 g004
Figure 5. Measured and simulated illuminance profiles for the reference point 2.
Energies 18 04113 g005
Figure 6. Measured and simulated illuminance profiles for the reference point 3.
Energies 18 04113 g006
Figure 7. Summary of the final energy demand calculations for Warsaw.
Energies 18 04113 g007
Figure 8. Summary of the final energy demand calculations for Genoa.
Energies 18 04113 g008
Table 1. Visual absorptance of surfaces used for the hourly daylight profiles simulations.
SurfaceVisible Absorptance
walls0.5
ceiling0.3
floor0.8
tables0.5
Table 2. Main parameters of the building envelope.
LocationUnitWarsawGenua
U-value
  external wallW/(m2K)0.180.24
  internal wallsW/(m2K)1.901.90
  windowsW/(m2K)0.91.5
solar energy transmittance of windows (gg)-0.570.57
light transmission coefficient of windows (Lt)-0.550.55
Table 3. Visual absorptance of internal surfaces for annual simulations.
SurfaceVisible Absorptance
LowHigh
walls0.10.5
ceiling0.20.3
floor0.30.8
tables0.50.5
Table 4. Correlation coefficient and average deviation values for analysed reference points.
PeriodParameterReference Point
123
JanuaryR20.950.930.93
avg. deviation−3%−10%8%
AprilR20.790.790.93
avg. deviation8%−8%5%
Table 5. Overview of simulation variants used in the study.
Variant NumberLocationAbsorptance of
Internal Surfaces
Lighting
Control
Automatic Shading
1WarsawHigh/LowNoneNone
2WarsawHigh/LowNoneExternal blinds
3WarsawHighLinearNone
4WarsawLowLinearNone
5WarsawHighLinearExternal blinds
6WarsawLowLinearExternal blinds
7GenoaHigh/LowNoneNone
8GenoaHigh/LowNoneExternal blinds
9GenoaHighLinearNone
10GenoaLowLinearNone
11GenoaHighLinearExternal blinds
12GenoaLowLinearExternal blinds
Table 6. Overview of the simulation results.
Variant NumberHeatingCoolingLightingTotal
kWh/a (% of Baseline Scenario)
1177
(100%)
658
(100%)
629
(100%)
1464
(100%)
2201
(113%)
462
(70%)
629
(100%)
1292
(88%)
3201
(113%)
577
(88%)
196
(31%)
974
(67%)
4206
(116%)
574
(87%)
162
(26%)
942
(64%)
5228
(129%)
391
(59%)
210
(33%)
830
(57%)
6234
(132%)
386
(59%)
162
(26%)
782
(53%)
737
(100%)
785
(100%)
629
(100%)
1450
(100%)
843
(118%)
558
(71%)
629
(100%)
1230
(85%)
947
(128%)
703
(90%)
159
(25%)
909
(63%)
1049
(133%)
700
(89%)
129
(21%)
879
(61%)
1155
(149%)
480
(61%)
176
(28%)
711
(49%)
1257
(156%)
475
(61%)
129
(21%)
662
(46%)
Disclaimer/Publisher’s Note: The statements, opinions and data contained in all publications are solely those of the individual author(s) and contributor(s) and not of MDPI and/or the editor(s). MDPI and/or the editor(s) disclaim responsibility for any injury to people or property resulting from any ideas, methods, instructions or products referred to in the content.

