1. Introduction
Diesel-fueled internal combustion engines are widely used in heavy transportation, agro-industrial activities, and power generation due to their adaptable operating range and high thermal efficiency [
1]. Despite this, the emissions produced by diesel engines have a significant impact on the environment and human health [
2]. Due to environmental concerns, emission standards for diesel engines have become increasingly stringent, motivating researchers to seek strategies for reducing emissions [
3]. Among the various alternatives studied, the use of biofuels is one of the most promising due to their renewable nature and ability to be blended with traditional diesel [
4]. Biofuels can be produced from waste fats, waste hulls, vegetable seeds, and waste vegetable oil. Among the advantages of biofuels are the reduction in environmental impact and the fostering of new economic activities [
5]. The blend of biofuel and diesel, known as biodiesel, is characterized by a more efficient combustion process, as well as lower emissions of smoke opacity and soot compared to conventional diesel [
6]. The above allows for improving air quality, especially in urban areas [
7].
Studies available in the literature indicate that biodiesel is a viable alternative for replacing conventional diesel [
8]. Krishnamoorthi et al. [
7] investigated the effect of a blend of delonix regia seed biodiesel in a compression ignition engine. The results obtained indicate a decrease in specific fuel consumption of 0.015–0.0425 kg/kWh and an increase in brake thermal efficiency of 1.2–3.1%. Similarly, a reduction in carbon monoxide and hydrocarbon emission levels was observed. Chen et al. [
9] evaluated the performance and emission characteristics of a diesel engine fueled with five proportions of biodiesel blends (0%, 5%, 10%, 10%, 15%, and 20%). The study showed reductions of 1.20%, 2.64%, 3.88%, and 4.65% in soot emissions compared to pure diesel. Mulkan et al. [
10] analyzed the characteristics of a diesel engine fueled with waste cooking oil (WCO) biodiesel blends under various engine speeds. They observed a significant reduction in CO emissions between 6.11% and 48.63% compared to pure diesel. Qenawy et al. [
11] investigated biodiesel fuels composed of a mixture of castor bean and jatropha seeds. An analysis of the results showed a reduction in carbon dioxide, smoke opacity, and hydrocarbon emissions. Kesharvani et al. [
12] numerically studied biodiesel fuels from microalgae with various proportions (20%, 40%, 60%, and 100%). The results show a reduction in particulate matter and smoke opacity. Mu et al. [
13] investigated the performance and emission characteristics of a diesel engine with tung-oil-based biodiesel blends (B10, B20, and B50). In general, it was observed that the biodiesel blends showed a significant decrease in CO, HC, NOx, and smoke opacity emissions compared to pure diesel.
To ensure biofuel production, the use of oil-rich seeds from indigenous plants and agricultural sources is recommended [
14]. Palm oil has the highest production volume among vegetable oils globally. The high production of palm oil ensures the supply of feedstock for biodiesel production [
15]. Although second- and third-generation biofuels are in development to become commercially viable, the use of first-generation biofuels, such as palm oil, still represents the most practical alternative for meeting the market demand [
16]. In general, the use of palm oil is considered a promising option as a feedstock for biodiesel production, making it economically viable and sustainable in the long term [
17].
The use of organic waste as a raw material for producing biofuels is a current innovative strategy for addressing waste management and fossil fuel dependence issues. Furthermore, using organic waste helps to reduce CO
2 emissions. This is because waste disposal often leads to the release of pollutants. From an economic perspective, using agricultural waste promotes local development and independence from fluctuations in the crude oil market [
18]. One agricultural activity that generates significant waste is coffee processing. Each year, 102 tons of coffee husks are produced, which are typically burned outdoors without any energy recovery. This contributes to substantial environmental pollution. Utilizing this waste would enhance the economic viability of the coffee industry and mitigate environmental pollution [
19].
Fuel modification is another strategy used to enhance the physicochemical properties of fuels, such as biodiesel. Among these are the use of additives, water, nanoparticles, ethers, alcohols, and the use of gaseous fuels [
20]. Literature studies indicate that mixtures of biodiesel with gaseous fuels have yielded positive results. In the last few years, research has been conducted with various types of gaseous fuels, such as biogas, synthesis gas, liquefied petroleum gas (LPG), compressed natural gas (CNG), and hydrogen, as a secondary fuel in internal combustion engines [
21]. The findings indicate that hydrogen is a source with high energy potential and is environmentally friendly. Hydrogen is the most abundant element in the universe and one of the most widely used fuels [
22]. This resource stands out for its versatility, as it can be used independently or combined with traditional fuels such as gasoline and diesel. Recently, hydrogen has garnered significant interest as a clean and sustainable energy source. When used in combustion processes or fuel cells, it generates primarily water as a byproduct, resulting in a reduced environmental impact and virtually zero greenhouse gas emissions [
23]. In the field of combustion, hydrogen has been implemented in various applications, such as internal combustion engines, gas turbines, and homogeneous charge compression ignition systems, to optimize performance and reduce polluting emissions [
24]. Due to the potential of hydrogen, several investigations have been conducted in recent years to analyze its influence on performance and emission parameters when mixed with various types of biodiesels. Zhang et al. [
25] investigated the use of blends of biodiesel and used cooking oil nanoparticles in a hydrogen direct ignition engine. Trends show a reduction in carbon monoxide, hydrocarbons, and carbon dioxide. Mohan and Dinesha et al. [
26] analyzed the use of hydrogen peroxide with emulsions in biodiesel blends for compression ignition engines. Improved combustion is reported, resulting in reduced emissions of carbon monoxide and hydrocarbons. Shanmuganathan et al. [
27] used hydrogen as a secondary fuel to improve the combustion characteristics of spirulina biodiesel. Tests indicated a higher cylinder chamber pressure and higher heat release rate in the biodiesel mixtures with hydrogen injection. Xia et al. [
28] concluded that the use of hydrogen in castor oil biodiesel blends improves thermal efficiency and specific fuel consumption.
Studies in the literature suggest that biofuels could potentially replace traditional diesel fuel to varying degrees. However, engine performance parameters tend to decrease as the percentage of substitution increases. This loss of performance is an obstacle to replacing fossil fuels with renewable biofuels derived from vegetable oils and agricultural waste. For this reason, the present research seeks to minimize the reduction in biofuel performance parameters by adding hydroxy. This study evaluates the performance characteristics, thermodynamic balances, environmental impact, and operating costs of internal combustion engines fueled by biodiesel from a palm oil and coffee husk blend (D85P10C5 and D80P10C10) with different hydroxy injection rates (4 and 8 lpm). Thus, this study aims to contribute to the analysis of the impact of hydroxy on palm oil and coffee husk biofuels, a topic not yet explored in the literature. This will promote the use of agricultural waste, such as coffee husks, providing economic benefits to the sector while reducing the demand for fossil fuels and decreasing pollutant emissions.
2. Production of Biodiesel from Coffee Husks
Coffee husks have a high carbon and oxygen content, which allows them to be used as raw material for producing biofuel. The methodology used to produce biofuel from coffee husks is described in
Figure 1.
The approximate composition of coffee husk is 10.38 wt% moisture, 71.08 wt% dietary fiber, 2.71 wt% protein, 0.73 wt% lipids, and 1.35 wt% ash, respectively. On the other hand, it was observed that coffee husk contains 2.54 g of oil per 100 g of dry coffee husk. The biofuel derived from coffee husks is obtained in three stages: grinding, esterification, and transesterification. In the first stage, coffee husk powder is ground using a screw press to extract the oil. In the second stage, the coffee husk oil is poured into a reactor flask and heated to 64 °C. Once the oil has reached this temperature, methanol and sulfuric acid are added and mixed using a stirrer at a constant speed of 700 rpm. After two hours of heating and continuous stirring, the mixture is transferred to a separatory funnel. After four hours, two liquids had formed: the oil was at the top, and the diglyceride was at the bottom. In the final stage, methanol is mixed with sodium hydroxide pellets to produce a methoxide solution. This solution is then combined with the oil that was separated in the previous stage. The mixture is heated and stirred at 64 °C and 700 rpm until a homogeneous mixture is obtained. The mixture is then transferred to a separatory funnel and left to stand for three hours. The glycerol that has formed at the bottom of the funnel is then separated from the methyl ester of coffee husk oil. The excess methanol in the methyl ester was removed by heating to 70 °C.
3. Materials and Methods
The experimental tests were conducted on a test bench consisting of a stationary diesel engine and a hydroxy gas generation system. The test bench’s schematic is shown in
Figure 2.
The stationary diesel engine is a single-cylinder, four-stroke, air-cooled, naturally aspirated, direct injection engine. The technical characteristics of the engine are described in
Table 1.
The engine speed and torque were controlled using an alternator coupled to its output shaft. Fuel consumption was measured using a gravimetric meter (OHAUS PA313, Parsippany, NJ, USA). The combustion chamber pressure was determined utilizing a piezoelectric sensor (KISTLER 7063-A, Wien, Austria) installed in the cylinder head. The rotational speed of the engine was calculated using a rotational angle sensor (Beck Arnley 180-0420, Amherst, NY, USA). The temperature inside the combustion chamber was measured through a K-type thermocouple. The intake air mass flow was determined by a flow sensor (BOSCH 22680 7J600, Stuttgart, Germany). Engine emission measurements were calculated using two analyzers (Brain-Bee AGS-688, Parma, Italy and Bacharach® PCA 400, New Kensington, PA, USA).
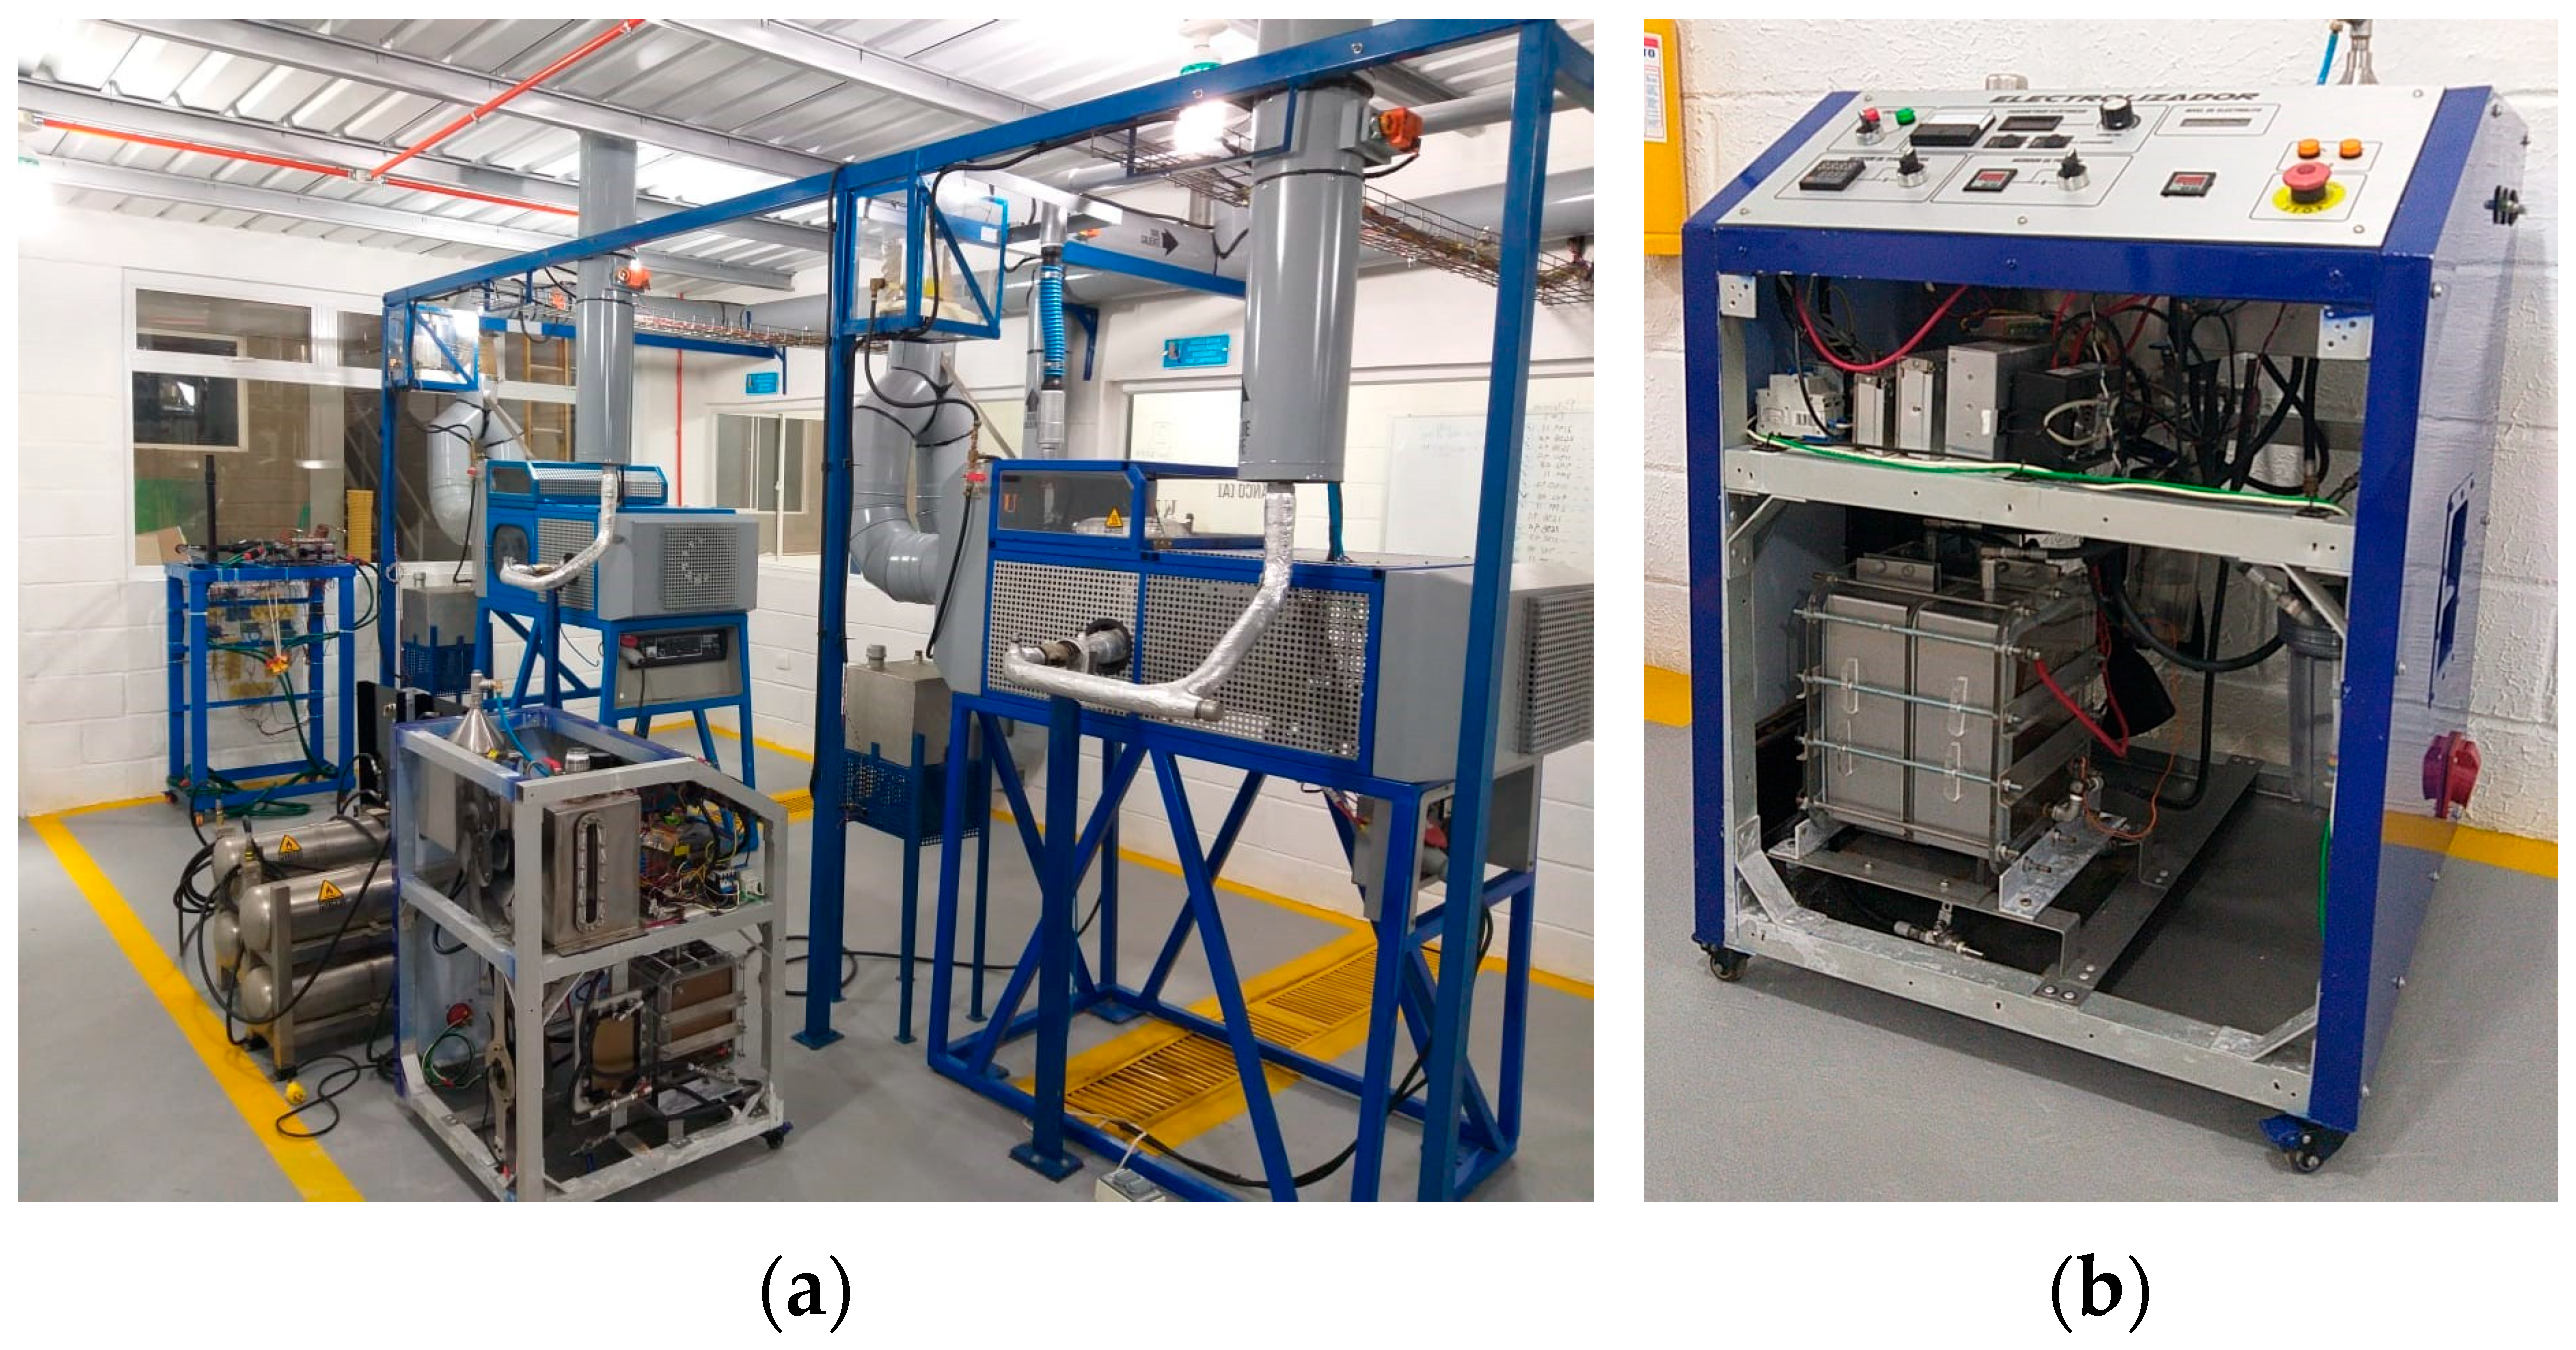
The hydroxy gas injected into the engine was generated using a system based on the water electrolysis process. This system includes key components such as a dry cell, an electrolytic tank, a bubbler tank, a storage tank, and safety devices. The dry cell was fabricated from stainless steel, chosen for its excellent conductivity and resistance to extreme temperatures, voltages, and corrosion. This cell incorporates electrodes with dimensions of 0.15 cm thickness, 13.3 cm width, and 20 cm height, separated by a space of 2 mm. The electrolytic tank serves as a continuous water supply to the dry cell. In contrast, the bubbler tank catches water vapor mixed with hydroxy gas, thereby protecting the engine components against corrosion. The hydroxy gas produced is stored in 304 austenitic stainless-steel tanks. To ensure the safety of the system, a silica gel filter and two flame filters were installed to prevent flame backflow during combustion. The technical specifications of the measuring instruments installed on the test bench are detailed in
Table 2.
4. Uncertainty Model
The literature describes two main approaches to determining sources of uncertainty. The first is the type A evaluation method, which is based on the statistical analysis of a series of measurements. The second is the type B evaluation method, which uses a distribution derived from experience or external instrument information. Both methods are considered suitable for estimating instrument uncertainties. In the uncertainty analysis performed in this study, the Type A evaluation method was applied. Consequently, the following expression is used to calculate the best estimate
for the set of measurements
:
The variability in the results of the set of measurements (
) is evaluated by calculating the standard deviation
.
Finally, the standard uncertainty is determined using the average experimental standard deviation
.
where
is the number of repetitions. For operational variables that are related to various parameters, the combined uncertainty was used [
29].
Table 3 shows the procedure for determining the combined uncertainty of the main study parameter.
5. Combustion Diagnostic Model
The use of the combustion diagnostic model requires the use of the geometrical parameters of the engine. The collection of this information was performed using the investigations previously developed on the test engine [
30].
Table 4 shows the geometrical characteristics collected.
To analyze the behavior of the combustion process, a combustion model was used to identify the heat release rate (HRR) curves as a function of the angle of rotation. The engine combustion chamber is considered an open-system thermodynamic model, which agrees with the literature [
31]. The development of the model involved the following considerations for its formulation:
The pressure inside the combustion chamber is uniform. This is reasonable because the fluid propagation velocity and the flame velocity are significantly lower than the speed of sound [
32].
The gases present in the combustion chamber behave as an ideal gas. Valencia et al. [
33] validated this hypothesis for internal combustion engines.
The specific heat of gases depends only on their chemical composition and temperature. This assumption is based on the idea that gases act as an ideal mixture.
The products of combustion are calculated stoichiometrically. This assumption is valid since combustion in diesel engines occurs mainly by diffusion, which makes it possible to assume stoichiometric combustion [
34].
The thermodynamic properties are determined using the average temperature of the combustion chamber. This is justifiable because diffusion and heat transfer processes tend to homogenize the temperature inside the chamber.
The heat transfer through the cylinder walls and the strains of the piston mechanism are considered in order to obtain more representative results of the phenomenon.
The heat transfer coefficients are calculated by applying the Woschni equations [
35].
The combustion model cannot adequately simulate the expansion stage due to the complex interaction between liquid (diesel) and gaseous (hydroxy gas) fuels. However, since self-detonation is a process that occurs at the beginning of the compression stage, the model can be used to identify anomalies during this part of the combustion cycle.
Equation (4) presents the combustion model formulated from the first law of thermodynamics [
36].
where
represents the fuel’s heat release rate,
denotes the heat loss (combustion chamber walls),
is the constant for exhaust gases,
is the gas temperature,
refers to the blow-by mass flow rate,
is the mass (inside the combustion chamber),
is the specific heat (constant volume),
corresponds to the internal energy,
is the cylinder’s instantaneous pressure,
is the crankshaft angle,
is the mass flow rate (injected fuel),
represents the enthalpy (injected fuel), and
is the cylinder’s instantaneous volume. The heat loss through
was determined using Equation (5).
where
is the total surface area through which heat loss occurs,
represents the heat transfer coefficient, and
denotes the temperature of the combustion chamber walls. The total heat loss surface area (
) is determined using Equation (6).
where
is the piston diameter and
is the piston area. The combustion chamber wall temperature
is determined by Equation (7) [
36].
where
is the coolant temperature,
is the density of gases in the chamber,
is the average piston velocity, and
is the average effective pressure.
and
are constants that depend on each heat transfer area, as shown in
Table 5.
The heat transfer coefficient
utilized in Equation (5) was calculated using the formula proposed by Woschni, as detailed below:
where
is the gas velocity, and
is the inner diameter of the cylinder. The term
and
are constants with a value of 0.80 and 3.26 [
37]. The gas velocity
was calculated by the following equation [
38]:
where
is the piston velocity. The subindice
refers to the beginning of the combustion phase. The piston velocity
was calculated by Equation (10):
where
is the speed, and
is the piston stroke, respectively.
The blow-by flow rate
was represented as a compressible flow process, as shown in Equation (11) [
39,
40]:
where
is the discharge coefficient,
is the combustion chamber pressure,
is the ratio of specific heat capacities,
is the gap area, and
is the crankcase pressure. The variable
was determined using Hoffman’s correlation [
41]:
The instantaneous volume of the cylinder consists of four components, as expressed in Equation (13).
where
is the combustion chamber volume,
is the instantaneous volume displaced, and
is the volume variation due to strain from inertia forces and pressure
, and clearances
. The combustion chamber volume
was calculated, as shown below [
30,
42]:
where
is the volumetric compression ratio, and
is the crankshaft length. The instantaneous volume displaced
is calculated by Equation (15).
where
is the vertical position (piston), and
is the length of the connecting rod. The volume variation
is calculated by Equation (16).
where
is the elastic modulus (steel),
is the piston area,
is the piston acceleration,
is the inertial mass, and
is the mechanical deformation, respectively. The joints of the engine mechanism cause a volume variation in the combustion chamber due to the clearances
. This volume variation is calculated by Equation (17) [
30].
where
is the eccentricity between the journal and bearing, and
is the angle between the connecting rod and the piston displacement axis, respectively. The average temperature in the combustion chamber is determined by Equation (18).
where
is the confined mass in the combustion chamber, which is determined by the following balance:
To determine the specific heats at constant pressure and volume , the polynomial equations shown below were used:
Specific heat at constant volume:
Specific heat at constant pressure:
where the subscripts
,
, and
refer to the specific heats of air, fuels, and combustion gases, respectively.
is the ideal gas constant of air, which was calculated using the following equations:
where
,
, and
are the molar mass of the air, fuel, and combustion gases.
6. Analysis of the Maximum Injection Flow Rate of Hydroxy
To analyze the limit of hydroxy gas that can be injected, a series of experimental tests were performed on the diesel engine. During the experimental tests, the engine was fueled with pure diesel and five volumetric flows of hydroxy gas. The engine was run at maximum power, with a torque of 9 Nm, and a rotational speed of 3600 rpm. The conditions of each experimental run are shown in
Table 6.
For each experimental run, the behavior of the pressure curve during the intake and compression stages of the engine was recorded. These results are subsequently used in the combustion diagnostic model as input data to obtain the heat release rate. The combustion model described in
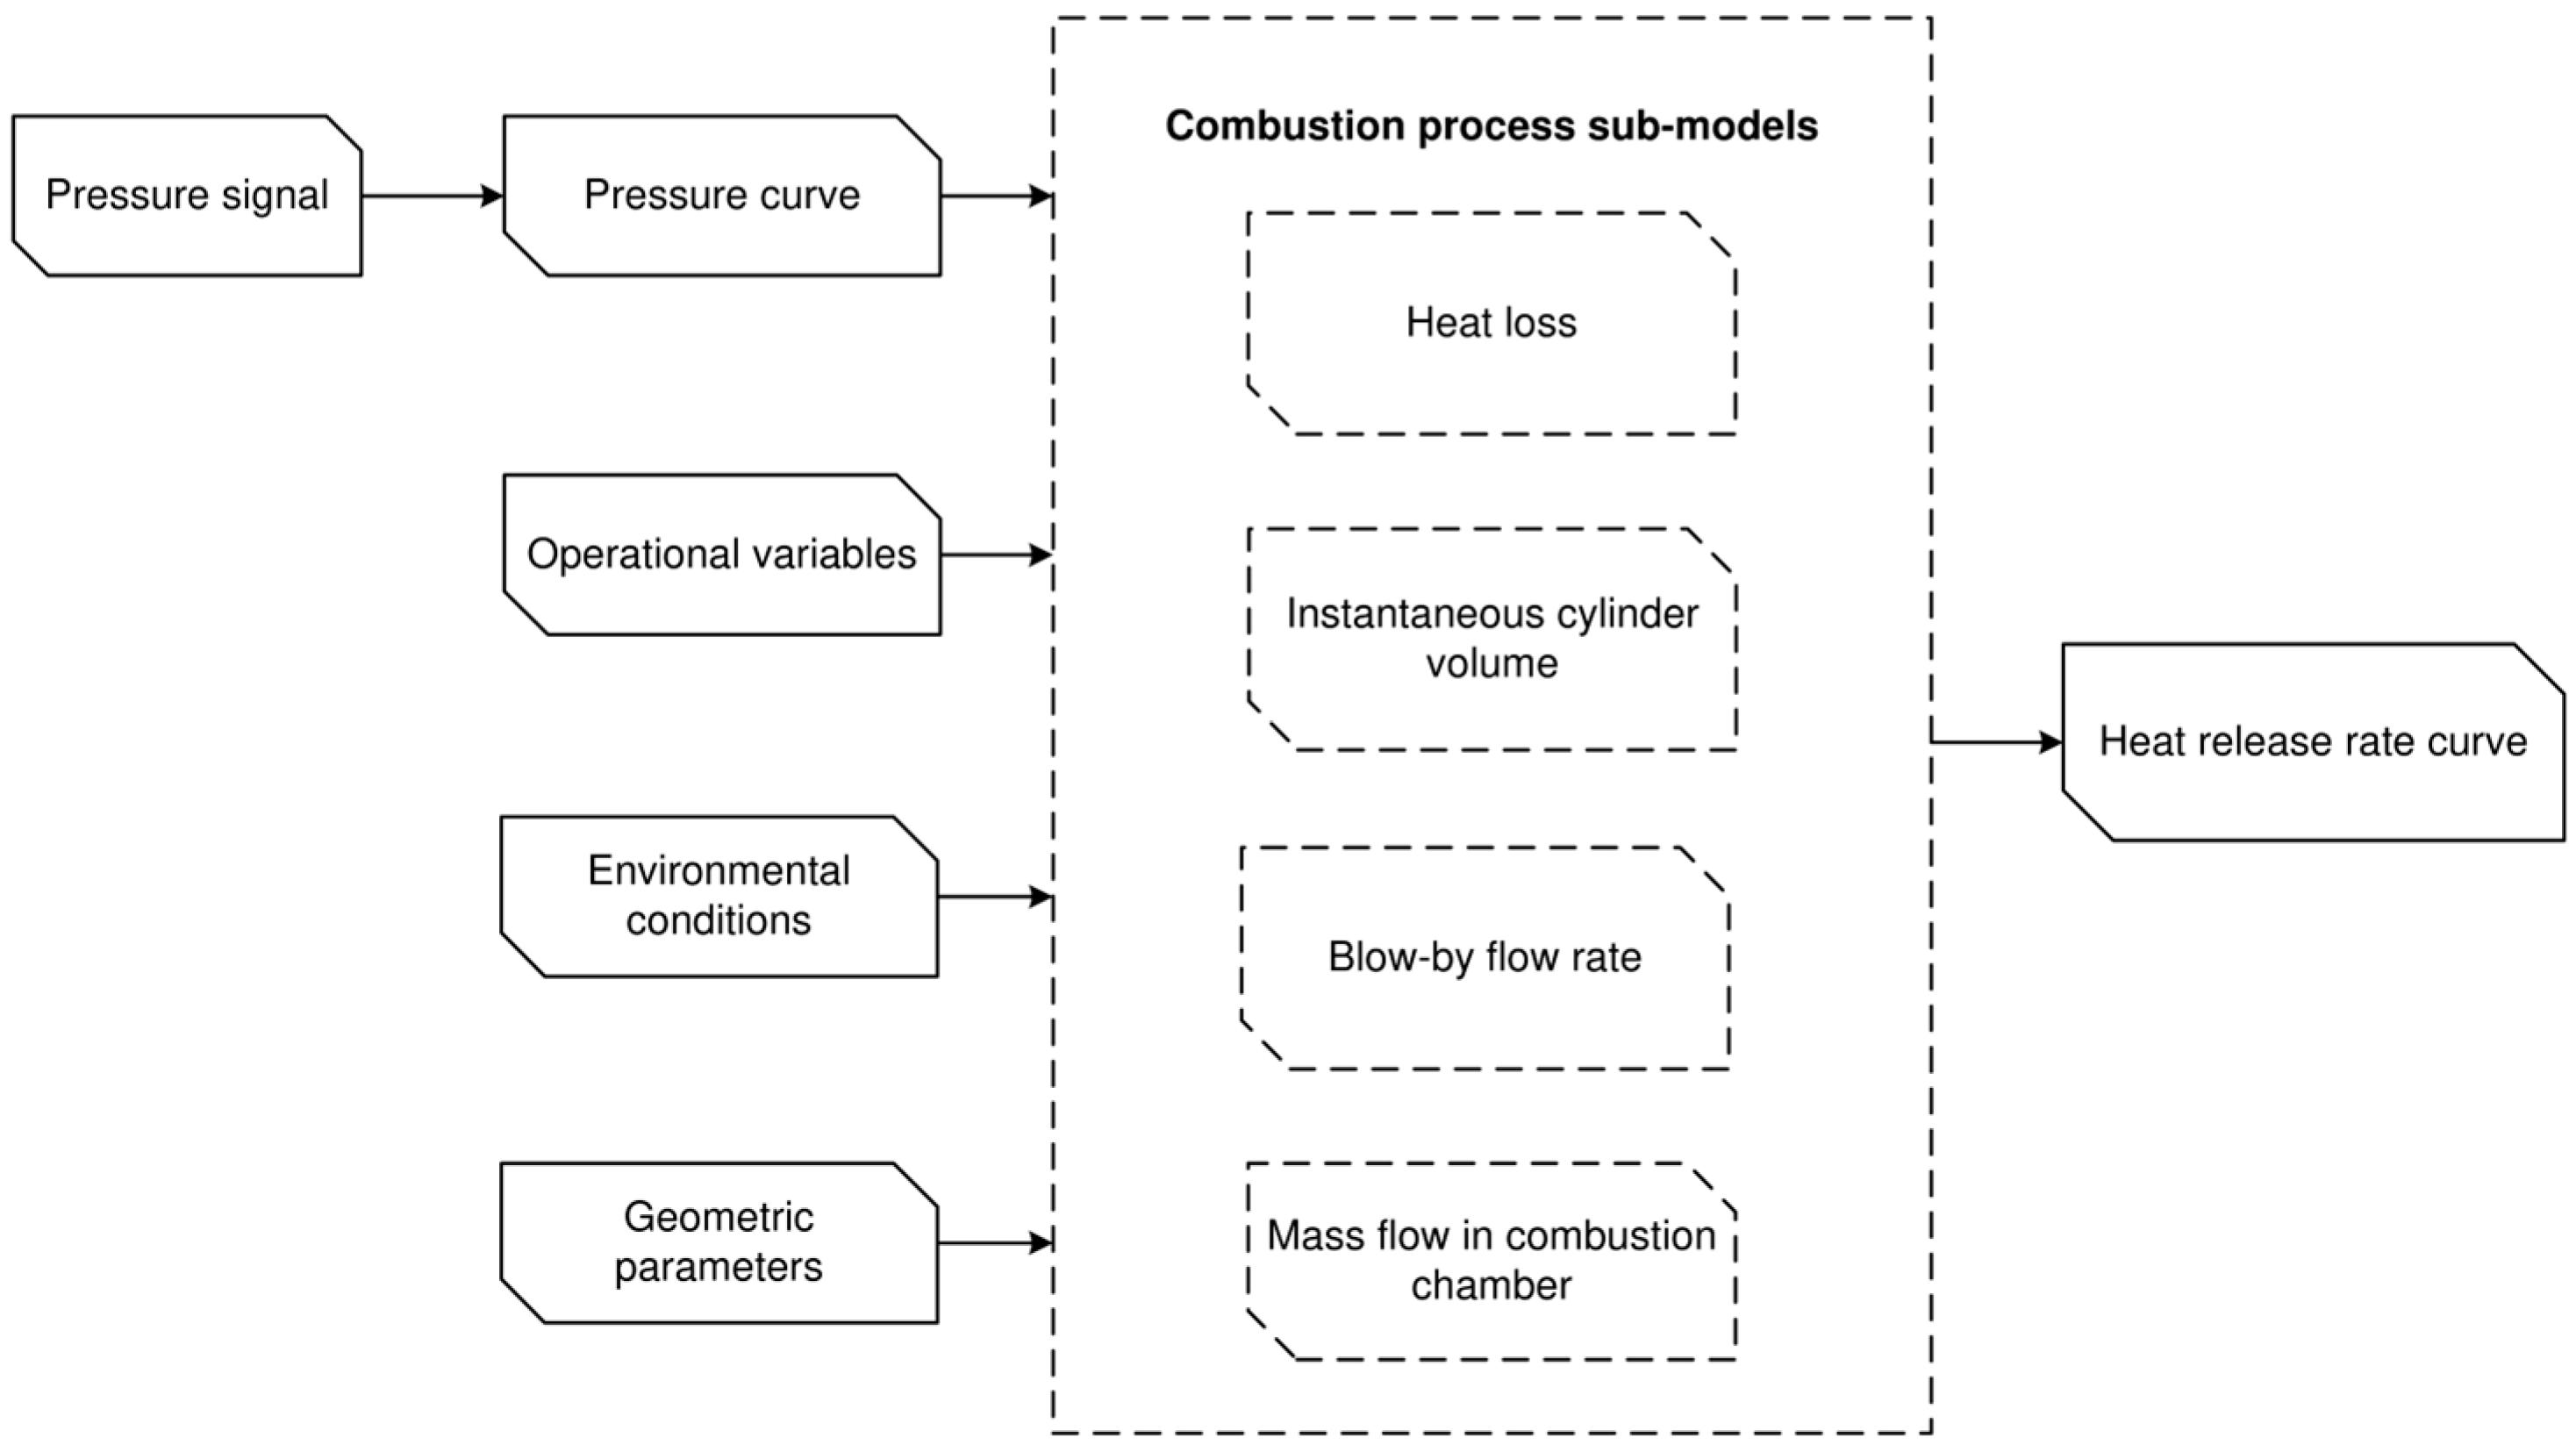
Section 5 is used to analyze the behavior of the heat release rate curves in the intake and compression stages of the engine. The procedure for using the model is shown in
Figure 3.
The use of the model consists of three main stages: (1) data input, (2) data processing, and (3) the export of results. In the first stage, all the data required by the model are supplied, which include pressure curves, operational variables, environmental conditions, and geometric parameters. During the second stage, the input data is processed to solve all sub-models of the combustion diagnostics. This process is carried out using MATLAB R2025a software. In the third stage, the model exports as output the heat release rate curve, which will be used for the analysis of auto-ignition indications. The heat release rate curves for each of the diesel–hydroxy mixtures are shown in
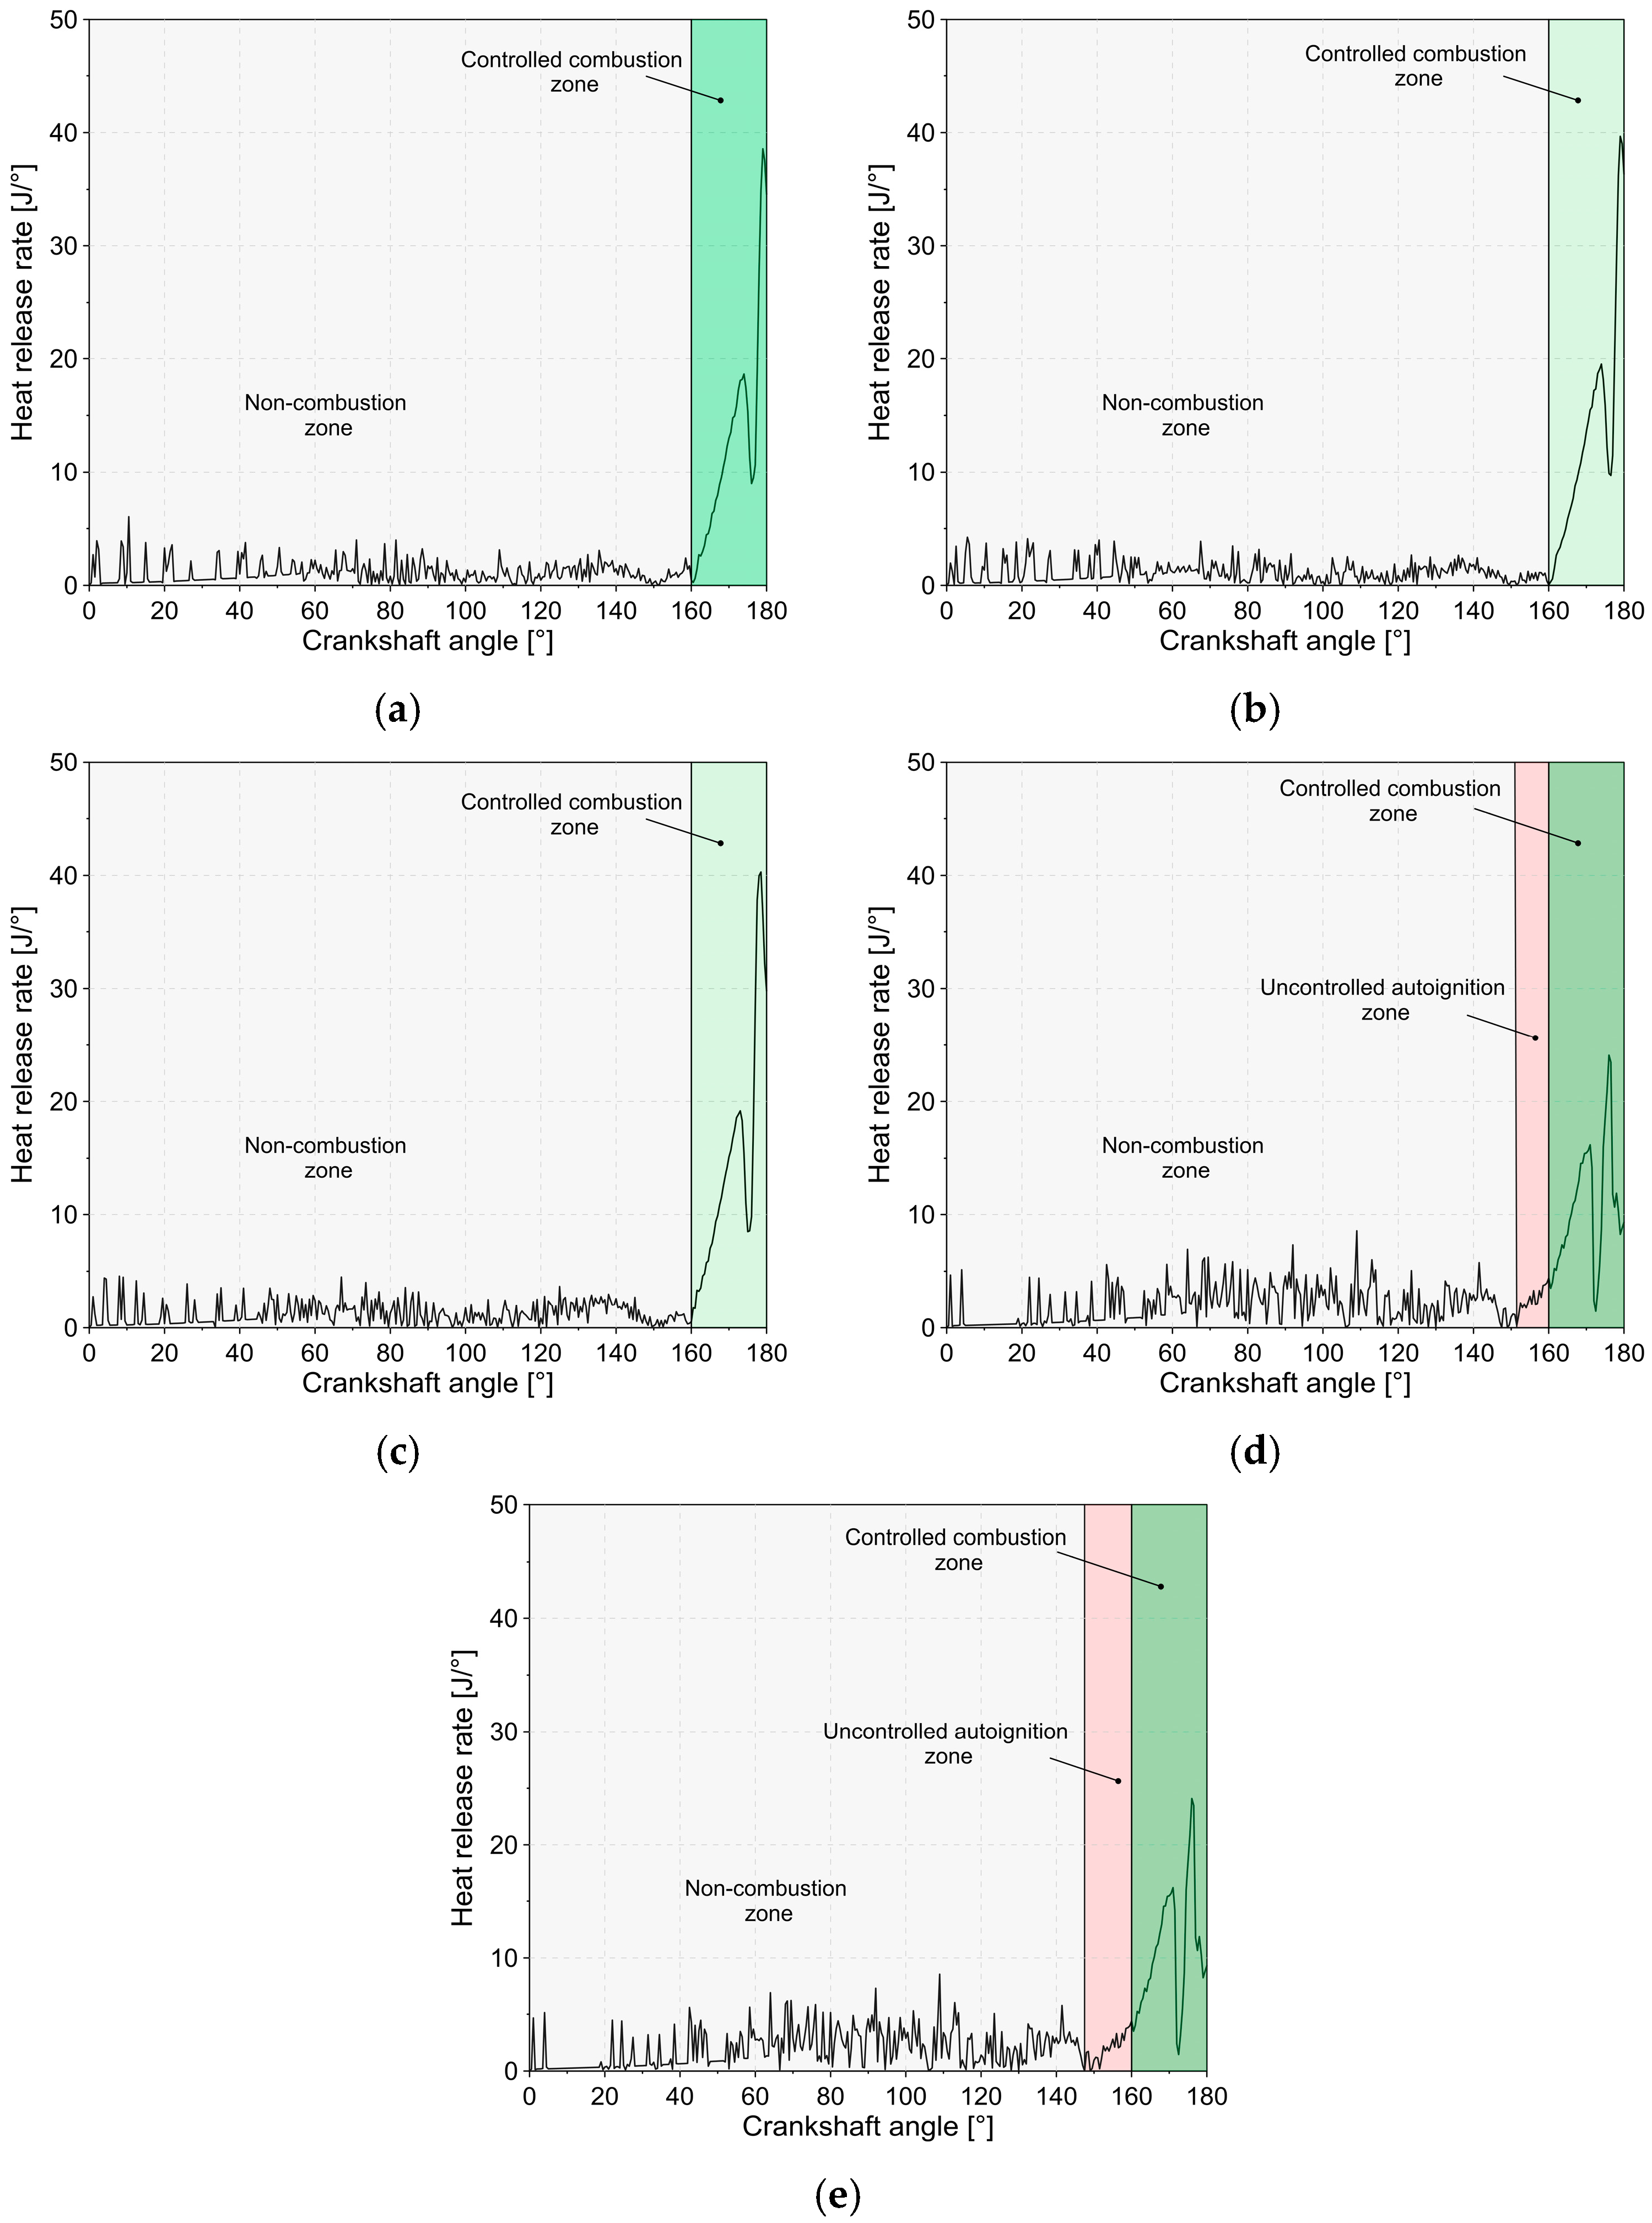
Figure 4.
Figure 4 shows the trend of the heat release rate inside the combustion chamber for a crankshaft angle range of 0°–180°. This range encompasses the intake stage and compression stage of the engine. The 0° angular position represents the start of the intake, and the 180° angular position represents the condition where the piston has reached the top dead center (TDC). The figures show a degree of variability in the curves; however, this is natural behavior because of the high sensitivity of the model to noise in the input signals.
From the results, two types of zones can be identified in the mixtures D100 + 0 lpm, D100 + 4 lpm, and D100 + 8 lpm. The first zone (gray area) corresponds to the non-combustion zone, where the heat release rate values are zero. This implies that the combustion process has not started. The second zone (green area) is the location where combustion is expected to start. In the case of the first three mixtures, it is observed that the heat release curve begins to grow continuously from an angle of approximately 160°. This is because the fuel injection point in the test engine occurs 20° before the piston reaches the top dead center (20° BTDC). Therefore, in these three diesel–hydroxy mixtures, a natural behavior is evident in the combustion process of the engine.
In the case of the mixtures D100 + 10 lpm and D100 + 12 lpm, it is observed that the heat release rate curve tends to grow continuously before the angular position of 160°. This behavior becomes more evident as the volumetric flow rate of hydroxy gas is increased. For the D100 + 10 lpm mixture, a continuous growth in the curve is observed starting at an angle of 151.5 °C, and, for the D100 + 12 lpm mixture, the development begins with an angular position of 147.5 °C. Since the diesel fuel is injected at the angular position of 160°, the above behaviors correspond to an uncontrolled combustion start. This phenomenon is known as auto-ignition and is a consequence of the wide range of hydrogen flammability, which is one of the main dangers and limitations of its use in internal combustion engines since it leads to a degradation of their valuable life and essential losses of performance. Considering these results, it was established that the safe limit for the hydroxy gas addition is a volumetric flow of 8 lpm. This will be the maximum amount injected in the following experimental tests.
7. Experimental Procedure
In the present investigation, palm oil and coffee husk biofuel were mixed with pure diesel in two proportions, 15% and 20%, which were identified as D85P10C5 and D80P10C10. Additionally, two hydroxy injection rates were defined (4 and 8 lpm). The physicochemical characteristics of the fuels used in the experimental tests are shown in
Table 7.
The experimental tests began with the engine running on pure diesel (D-100%) for a period of 10 min to warm up and establish the operational variables. Subsequently, the fuel tank was emptied and filled with the new fuel. During the experimental tests, the torque and engine speed varied in the range of 3 to 7 Nm and 3000 to 3600 rpm, respectively. The experimental tests were carried out while maintaining constant operational parameters (steady state) for engine torque and rpm. This is because the research focuses on stationary engines for the generation of electrical energy, which maintain a constant speed to ensure a constant electrical frequency.
Table 8 shows the configuration of each of the experimental runs.
8. Results and Discussion
The results obtained from the analyses carried out on the engine when fueled with diesel, a blend of biodiesel (palm oil and coffee husk), and hydrogen are shown below. The analyses included an evaluation of performance parameters, the energy and exergy distribution, the impact of emissions, and the economic savings and costs.
8.1. Performance Parameter Analysis
Figure 5 shows the brake-specific fuel consumption (BSFC) of the engine under different operating conditions and fuel types.
BSFC is a key performance parameter, since it allows the fuel consumption to be associated with the mechanical power output of the engine. Therefore, it is desirable for the engine to operate at low BSFC levels. The experimental findings indicate that pure diesel has the lowest BSFC values compared to the D85P10C5 and D80P10C10 biodiesel blends. In general, the lowest BSFC values were obtained with a torque of 7 Nm, regardless of the type of fuel used. For the experimental configurations, BSFC values in the range of 0.33–0.67 kg/kWh, 0.36–0.70 kg/kWh, and 0.37–0.74 kg/kWh were obtained for the D100, D85P10C5, and D80P10C10 fuels, respectively. The results show an increase of 9.79% and 13.33% in engine BSFC with the D85P10C5 and D80P10C10 fuels compared to D100. The higher BSFC levels with the palm oil and coffee husk biodiesel blends may be a consequence of the lower calorific value of these fuels compared to pure diesel; therefore, higher fuel consumption is needed to achieve the same mechanical power output. In the case of the blends D85P10C5 and D80P10C10, it is observed that their lower calorific value is lower by 3.92% and 5.91% than D100. Similar results are reported in the literature for blends of biodiesel from vegetable seeds [
43].
On the other hand, it is observed that fuels containing hydroxy consume the least amount of fuel, which is reflected in the reduction in engine BSFC. As the addition of hydroxy volumetric flow increases, a further reduction in BSFC is observed. The D100 + 4 lpm, D85P10C5 + 4 lpm, and D80P10C10 + 4 lpm fuels cause a 6.91%, 4.38%, and 4.20% reduction compared to the D100, D80P10C5, and D85P10C10 fuel, respectively. In the case of D100 + 8 lpm, D85P10C5 + 8 lpm, and D80P10C10 + 8 lpm fuels, a reduction of 11.66%, 11.28%, and 10.94% was observed. A high calorific value characterizes hydroxy compared to pure diesel and biodiesel blends. This implies a greater availability of energy in the combustion process, which favors fuel reduction. Additionally, hydroxy injection allows a higher oxygen concentration, favoring the quality of the air–fuel mixture. Reports in the literature show that the injection of hydrogen into the engine tends to reduce fuel consumption [
44].
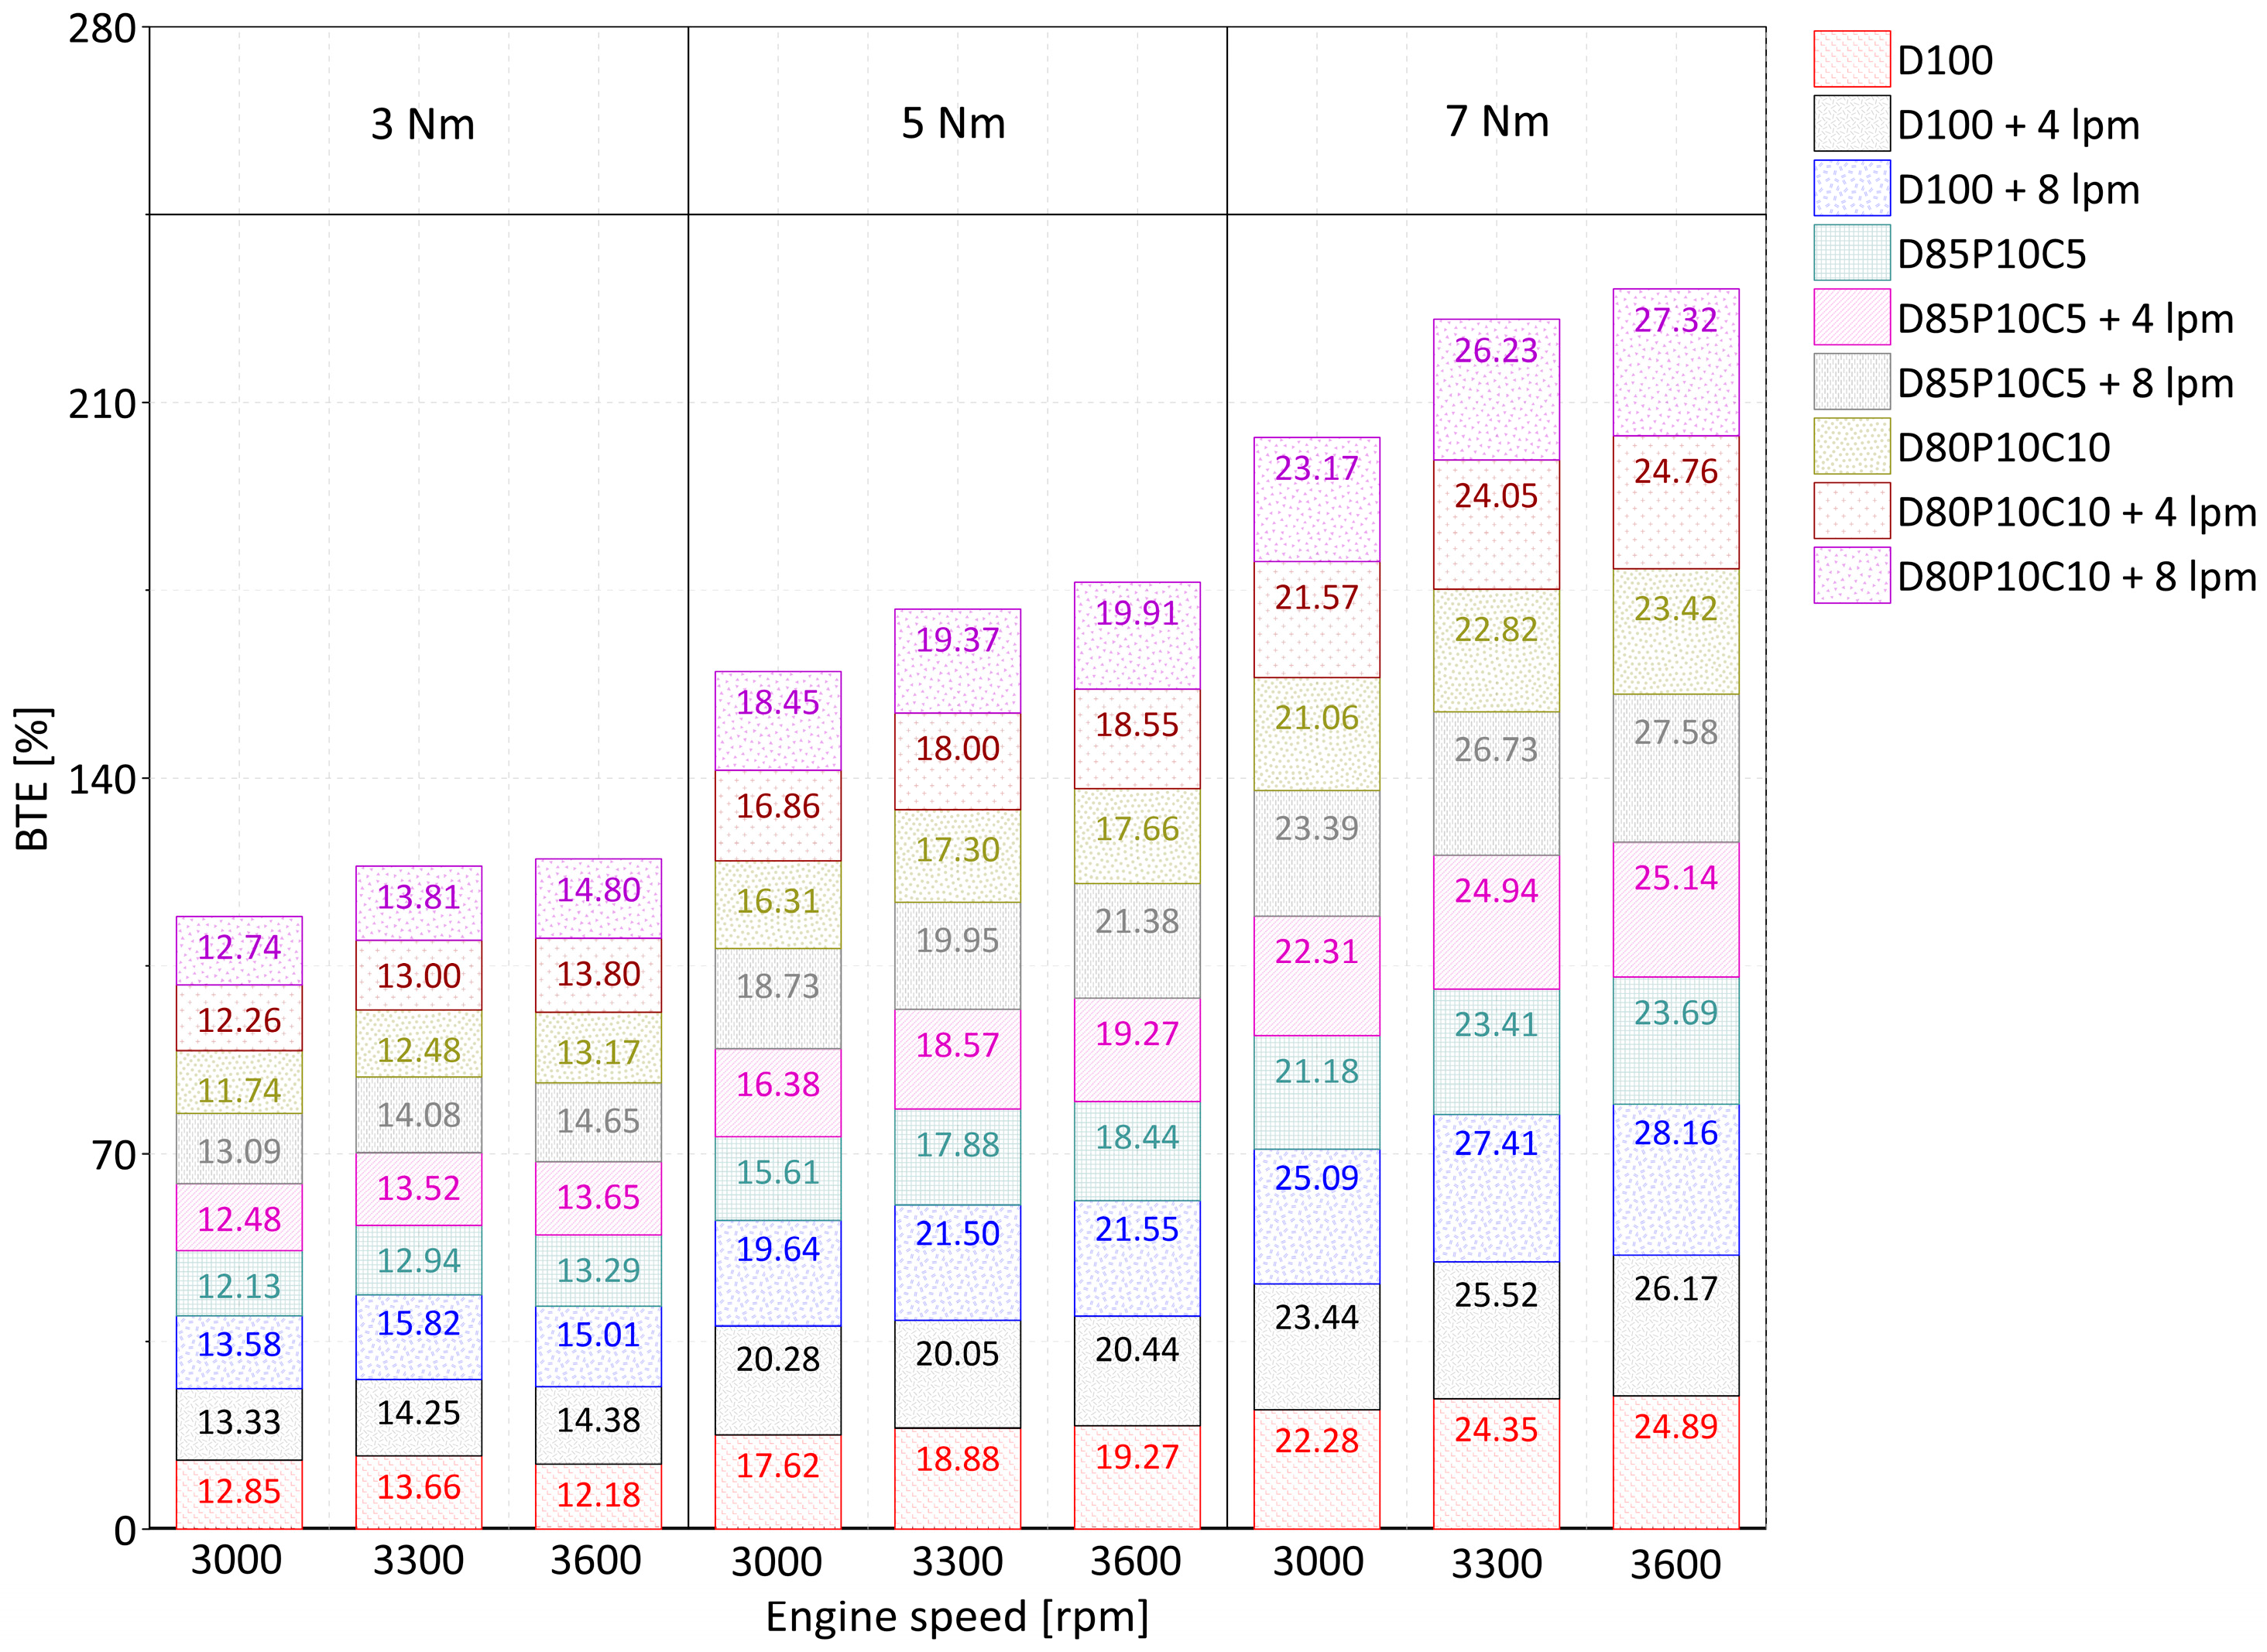
Figure 6 shows the engine brake thermal efficiency (BTE) trends for the D100, D85P10C5, and D80P10C10 fuels.
BTE is a performance parameter that relates mechanical power to the energy supplied to the engine. This parameter allows determining the efficiency of the conversion of chemical energy from fuel to mechanical power. In general, it was observed that engine BTE increases with increasing torque and speed. This behavior was evident in all the fuels tested. For the D100, D85P10C5, and D80P10C10 fuels, a range of BTE values of 12.18–24.89%, 12.13–23.69%, and 11.74–23.42% were obtained, respectively. Compared to pure diesel, palm oil and coffee husk biodiesel blends lead to a reduction in engine BTE. This reduction becomes more noticeable as the percentage of biofuel in the blend increases. In the case of D85P10C5 and D80P10C10 fuels, a 6.08% and 7.47% decrease in engine BTE was observed compared to D100. The density of the D85P10C5 and D80P10C10 biodiesel blends is 0.84% and 1.54% higher compared to pure diesel. This increase in density causes problems in the combustion process and its quality due to the poor atomization of the fuel droplets. On the other hand, the lower calorific value of palm oil and coffee husk biodiesel also favors the reduction in BTE due to the increase in fuel consumption. Similar trends are reported in the literature for blends of biodiesel from other feedstocks [
44].
The injection of hydroxy in all fuels tested causes an increase in engine BTE. For D100 + 4 lpm, D85P10C5 + 4 lpm, and D80P10C10 + 4 lpm, an increase of 7.64%, 4.59%, and 4.39% is reported compared to the D100, D85P10C5, and D80P10C10 fuels, respectively. In the case of the D100 + 8 lpm, D85P10C5 + 8 lpm, and D80P10C10 + 8 lpm fuels, the trends indicate an increase of 13.37%, 12.84%, and 12.34%. Hydroxy has a wide flammability range as well as a high flame speed. These two characteristics enable a proper air–fuel mixture and improve fuel combustion in the combustion chamber. Previous studies in the literature indicate that the properties of hydroxy tend to increase the BTE of internal combustion engines [
45].
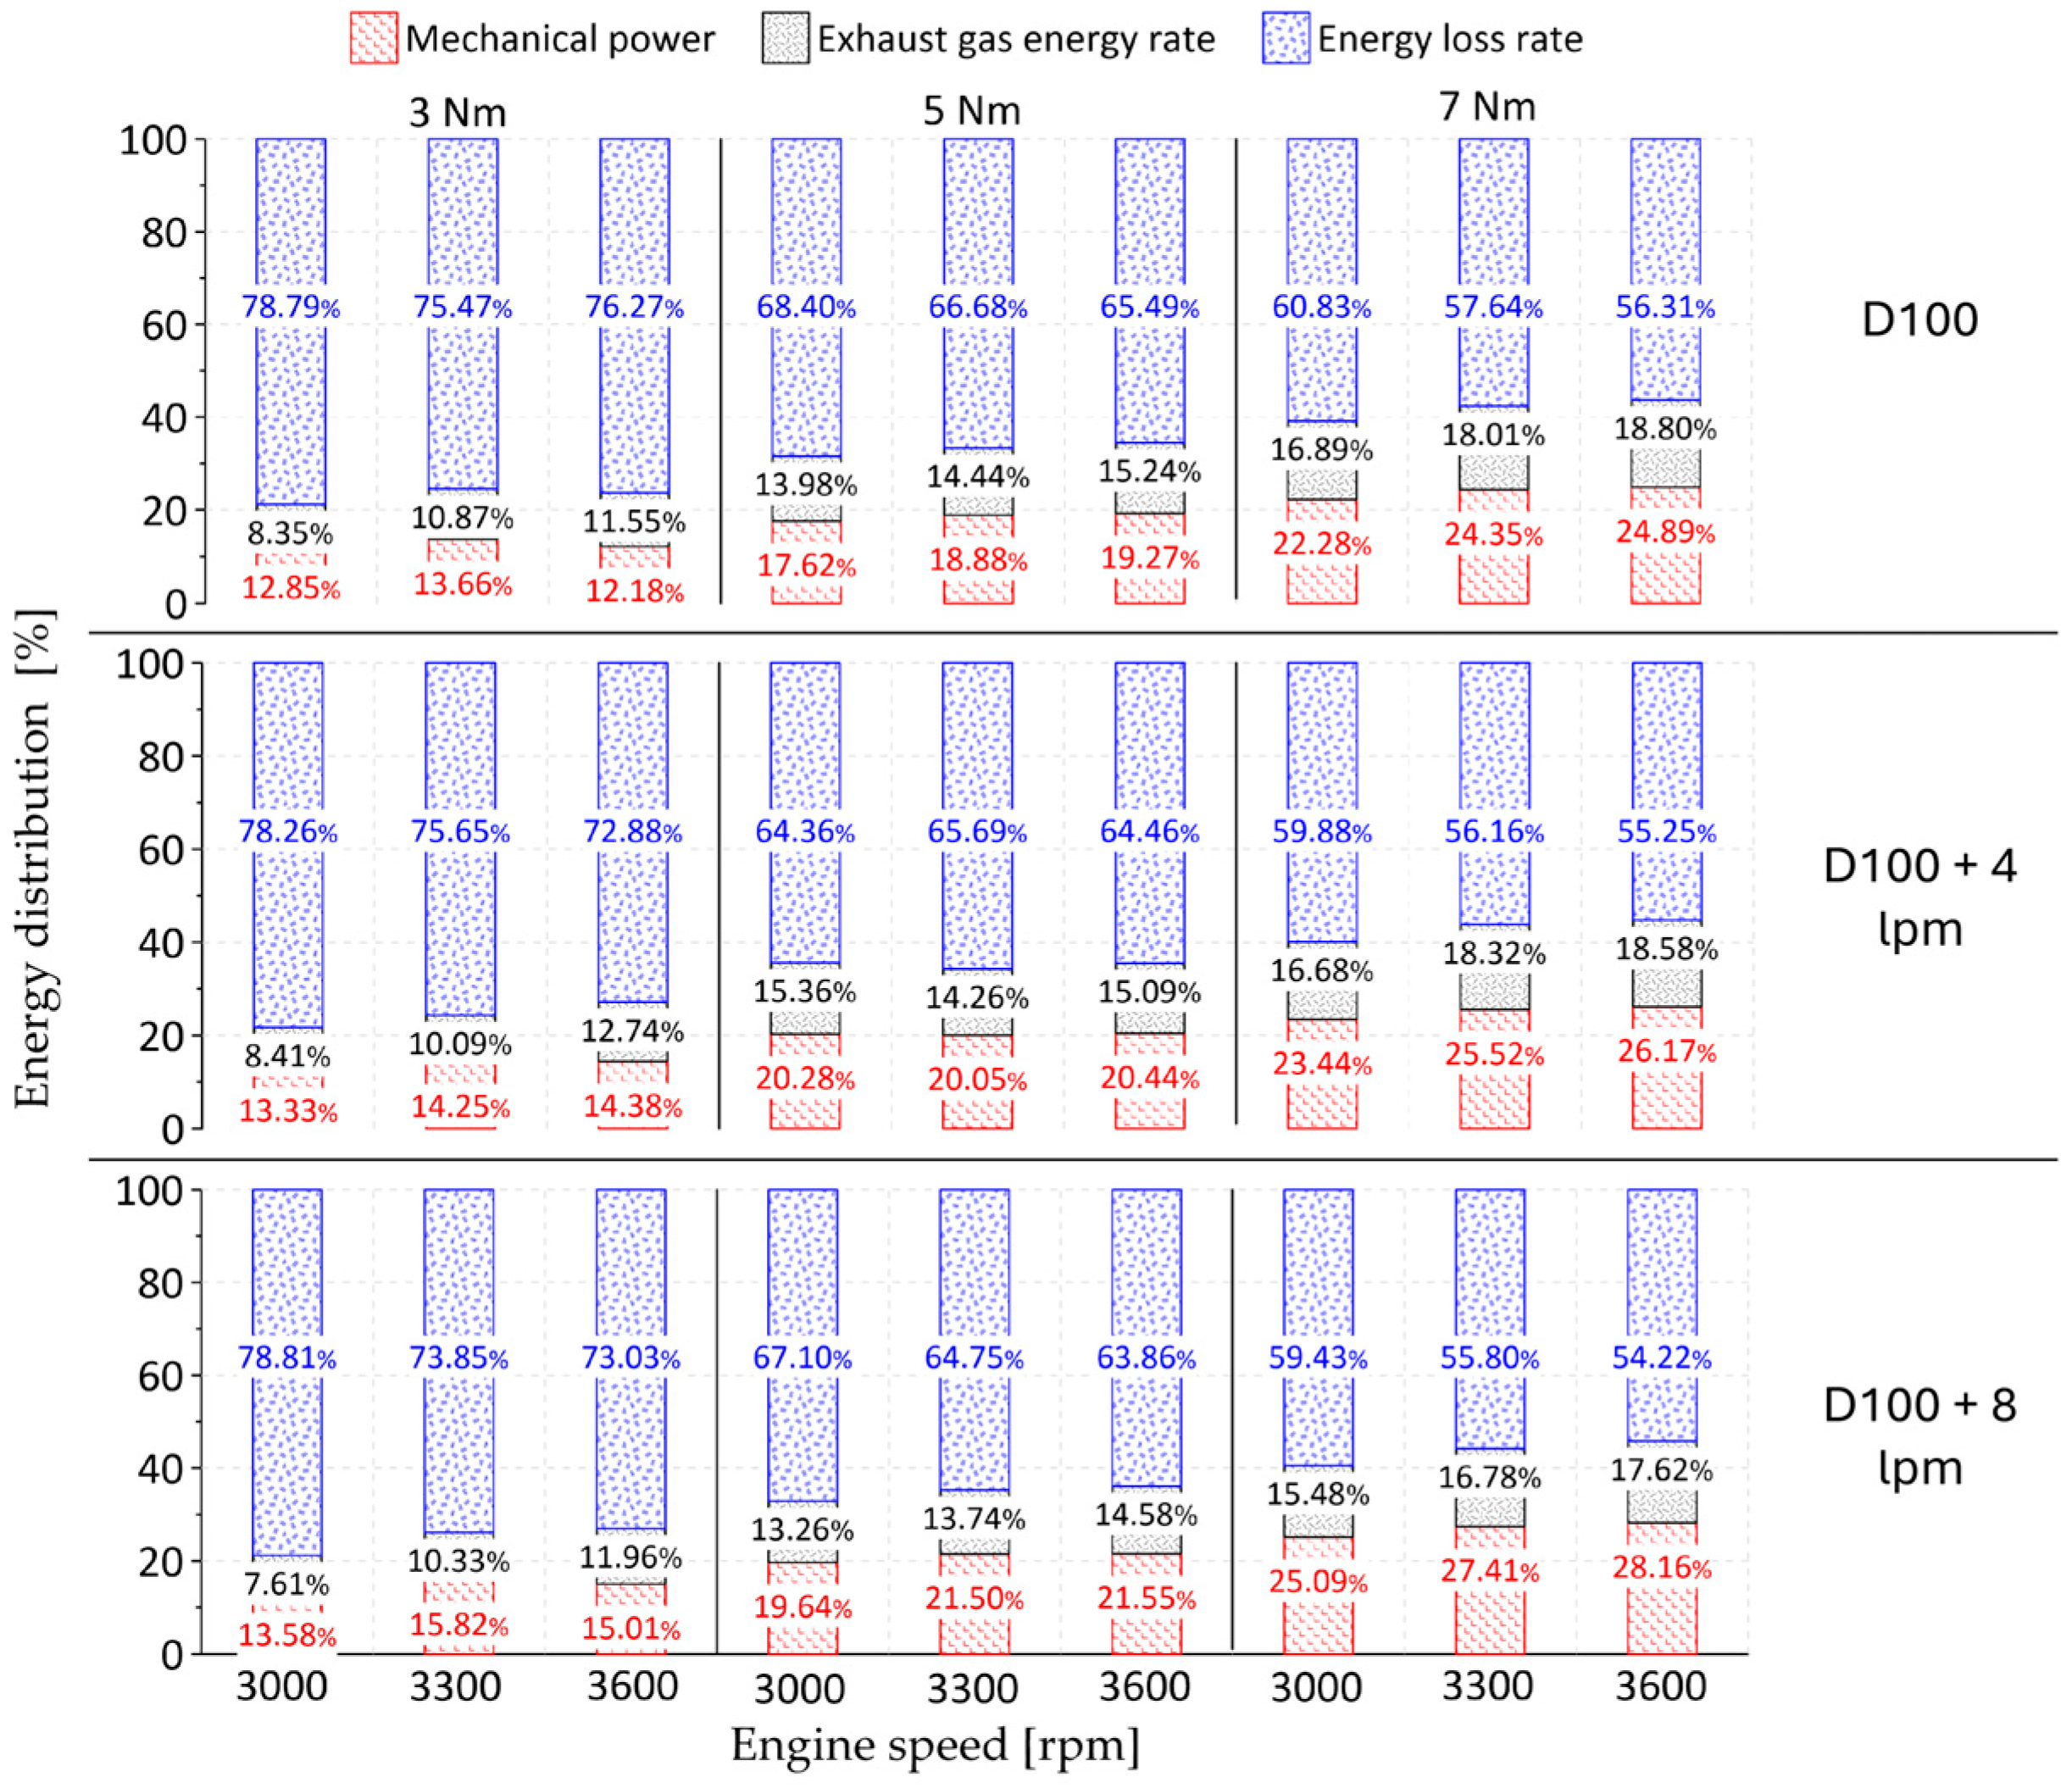
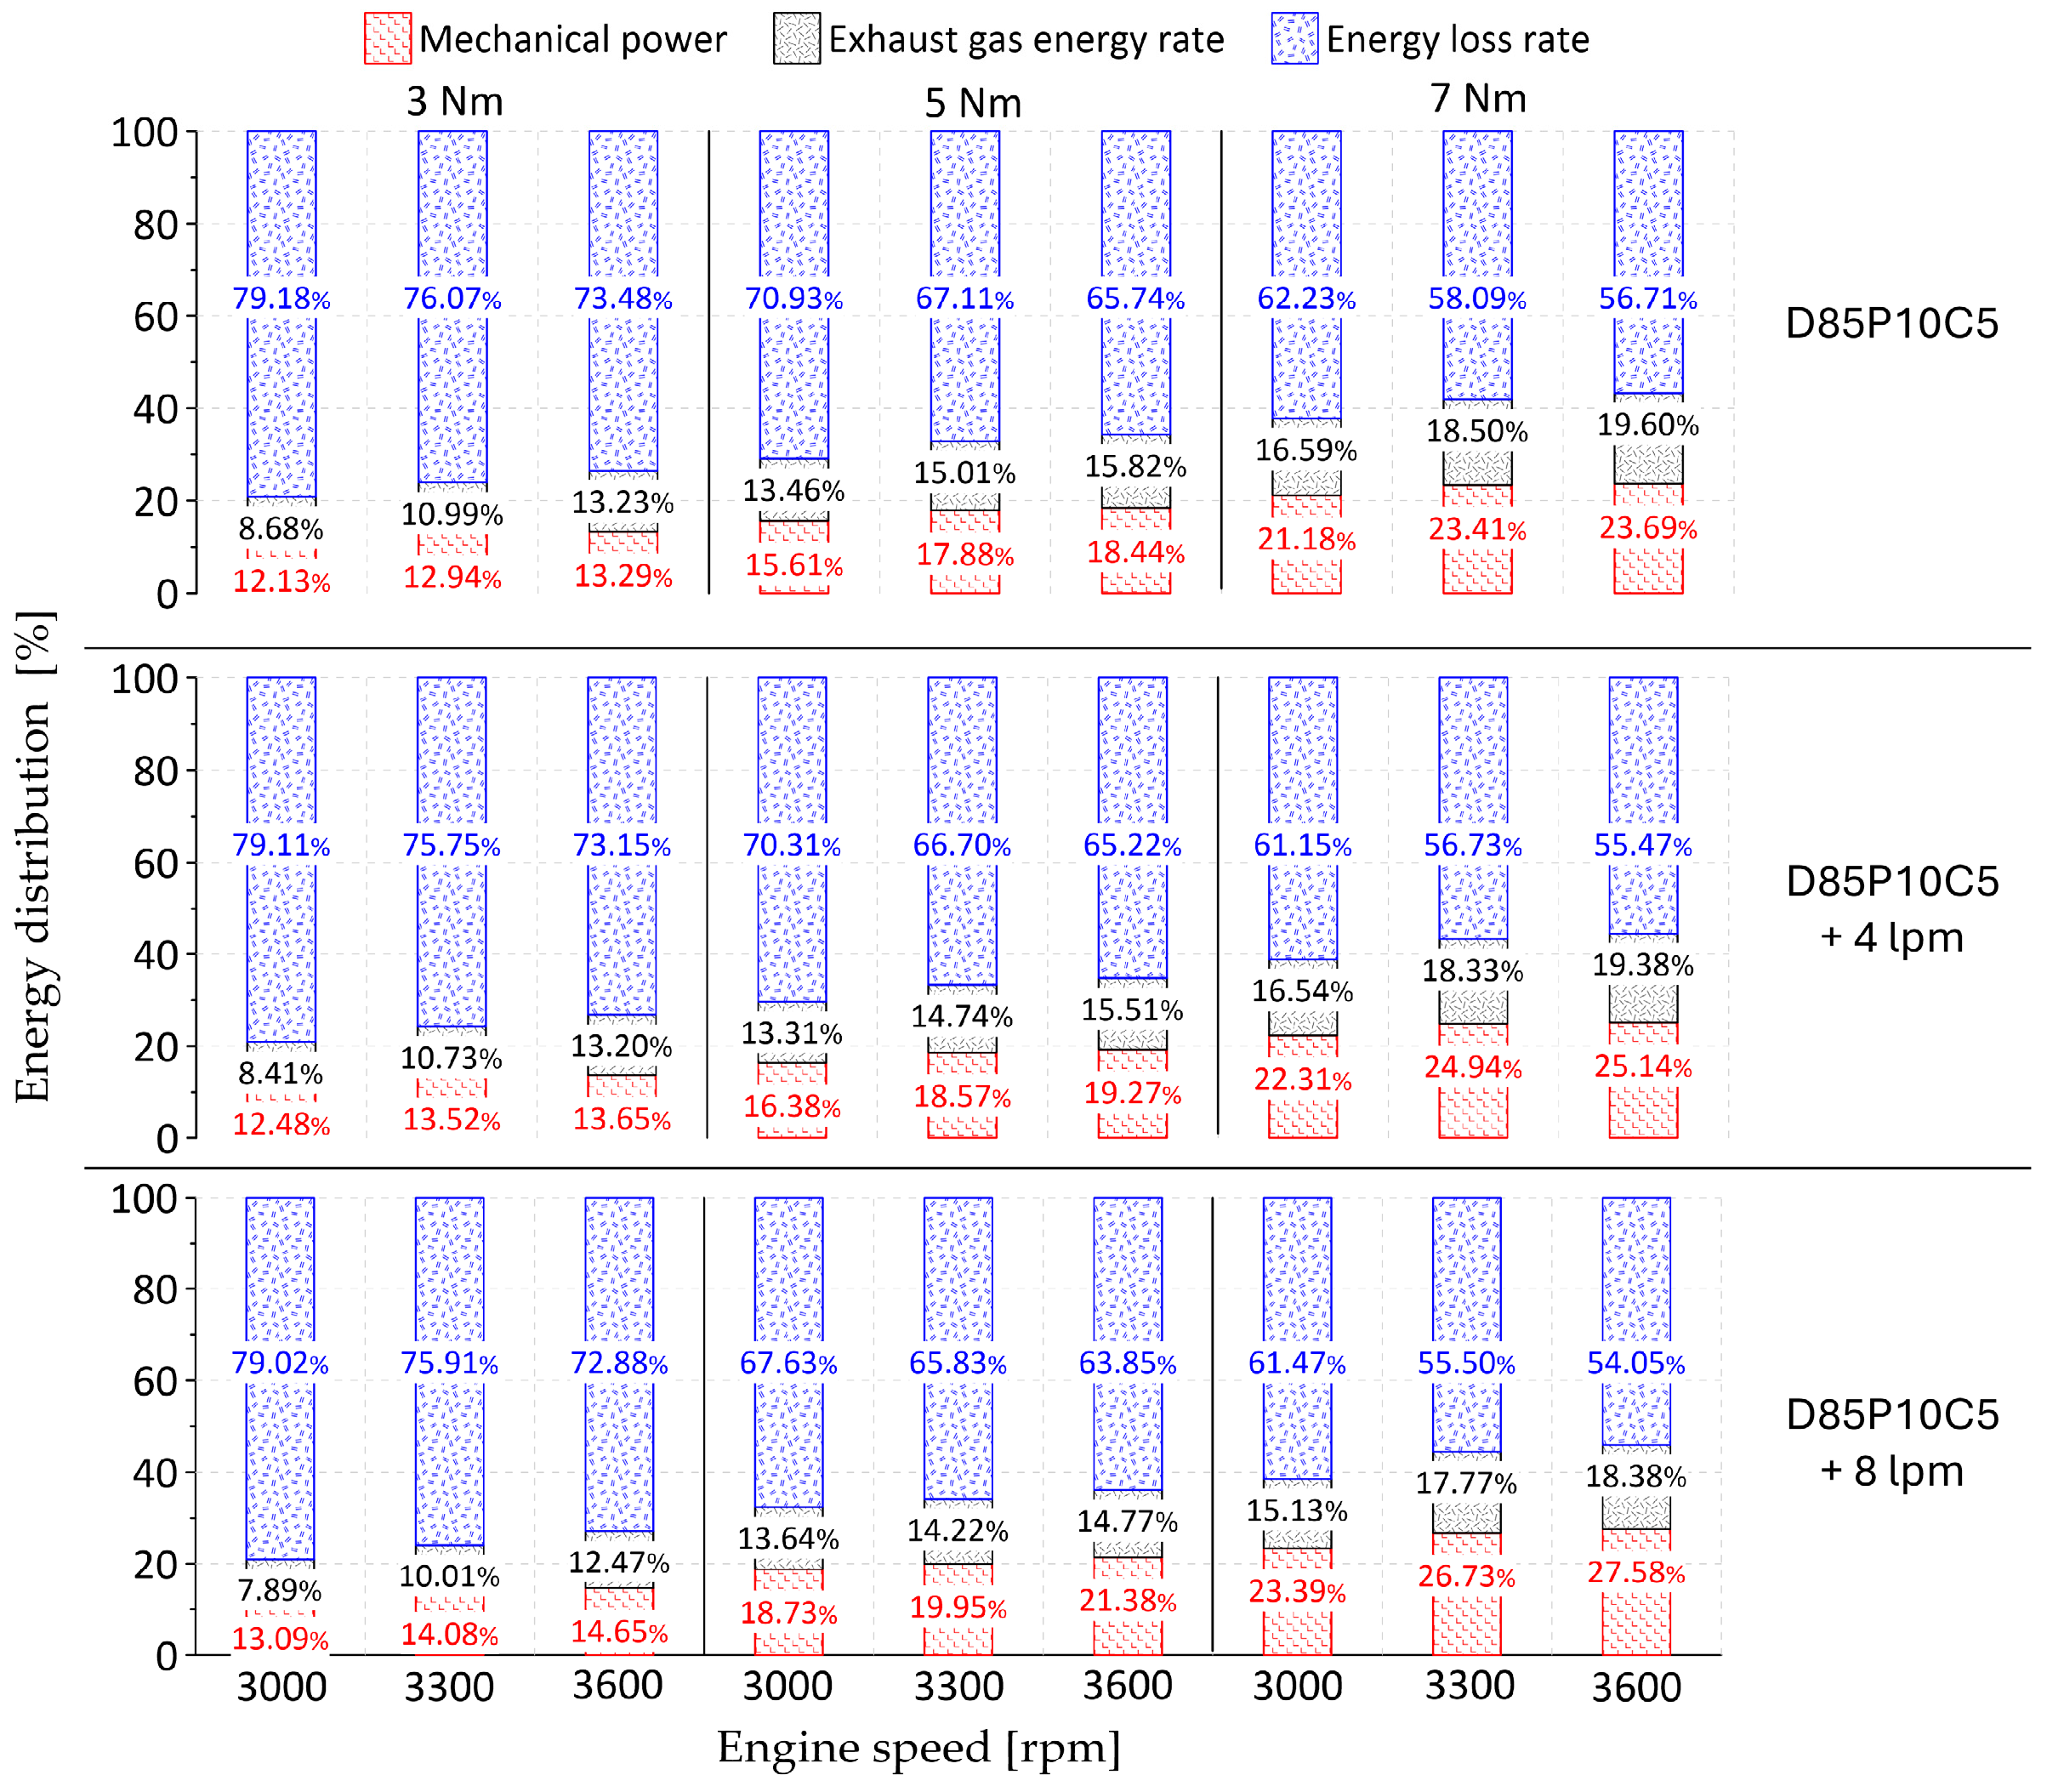
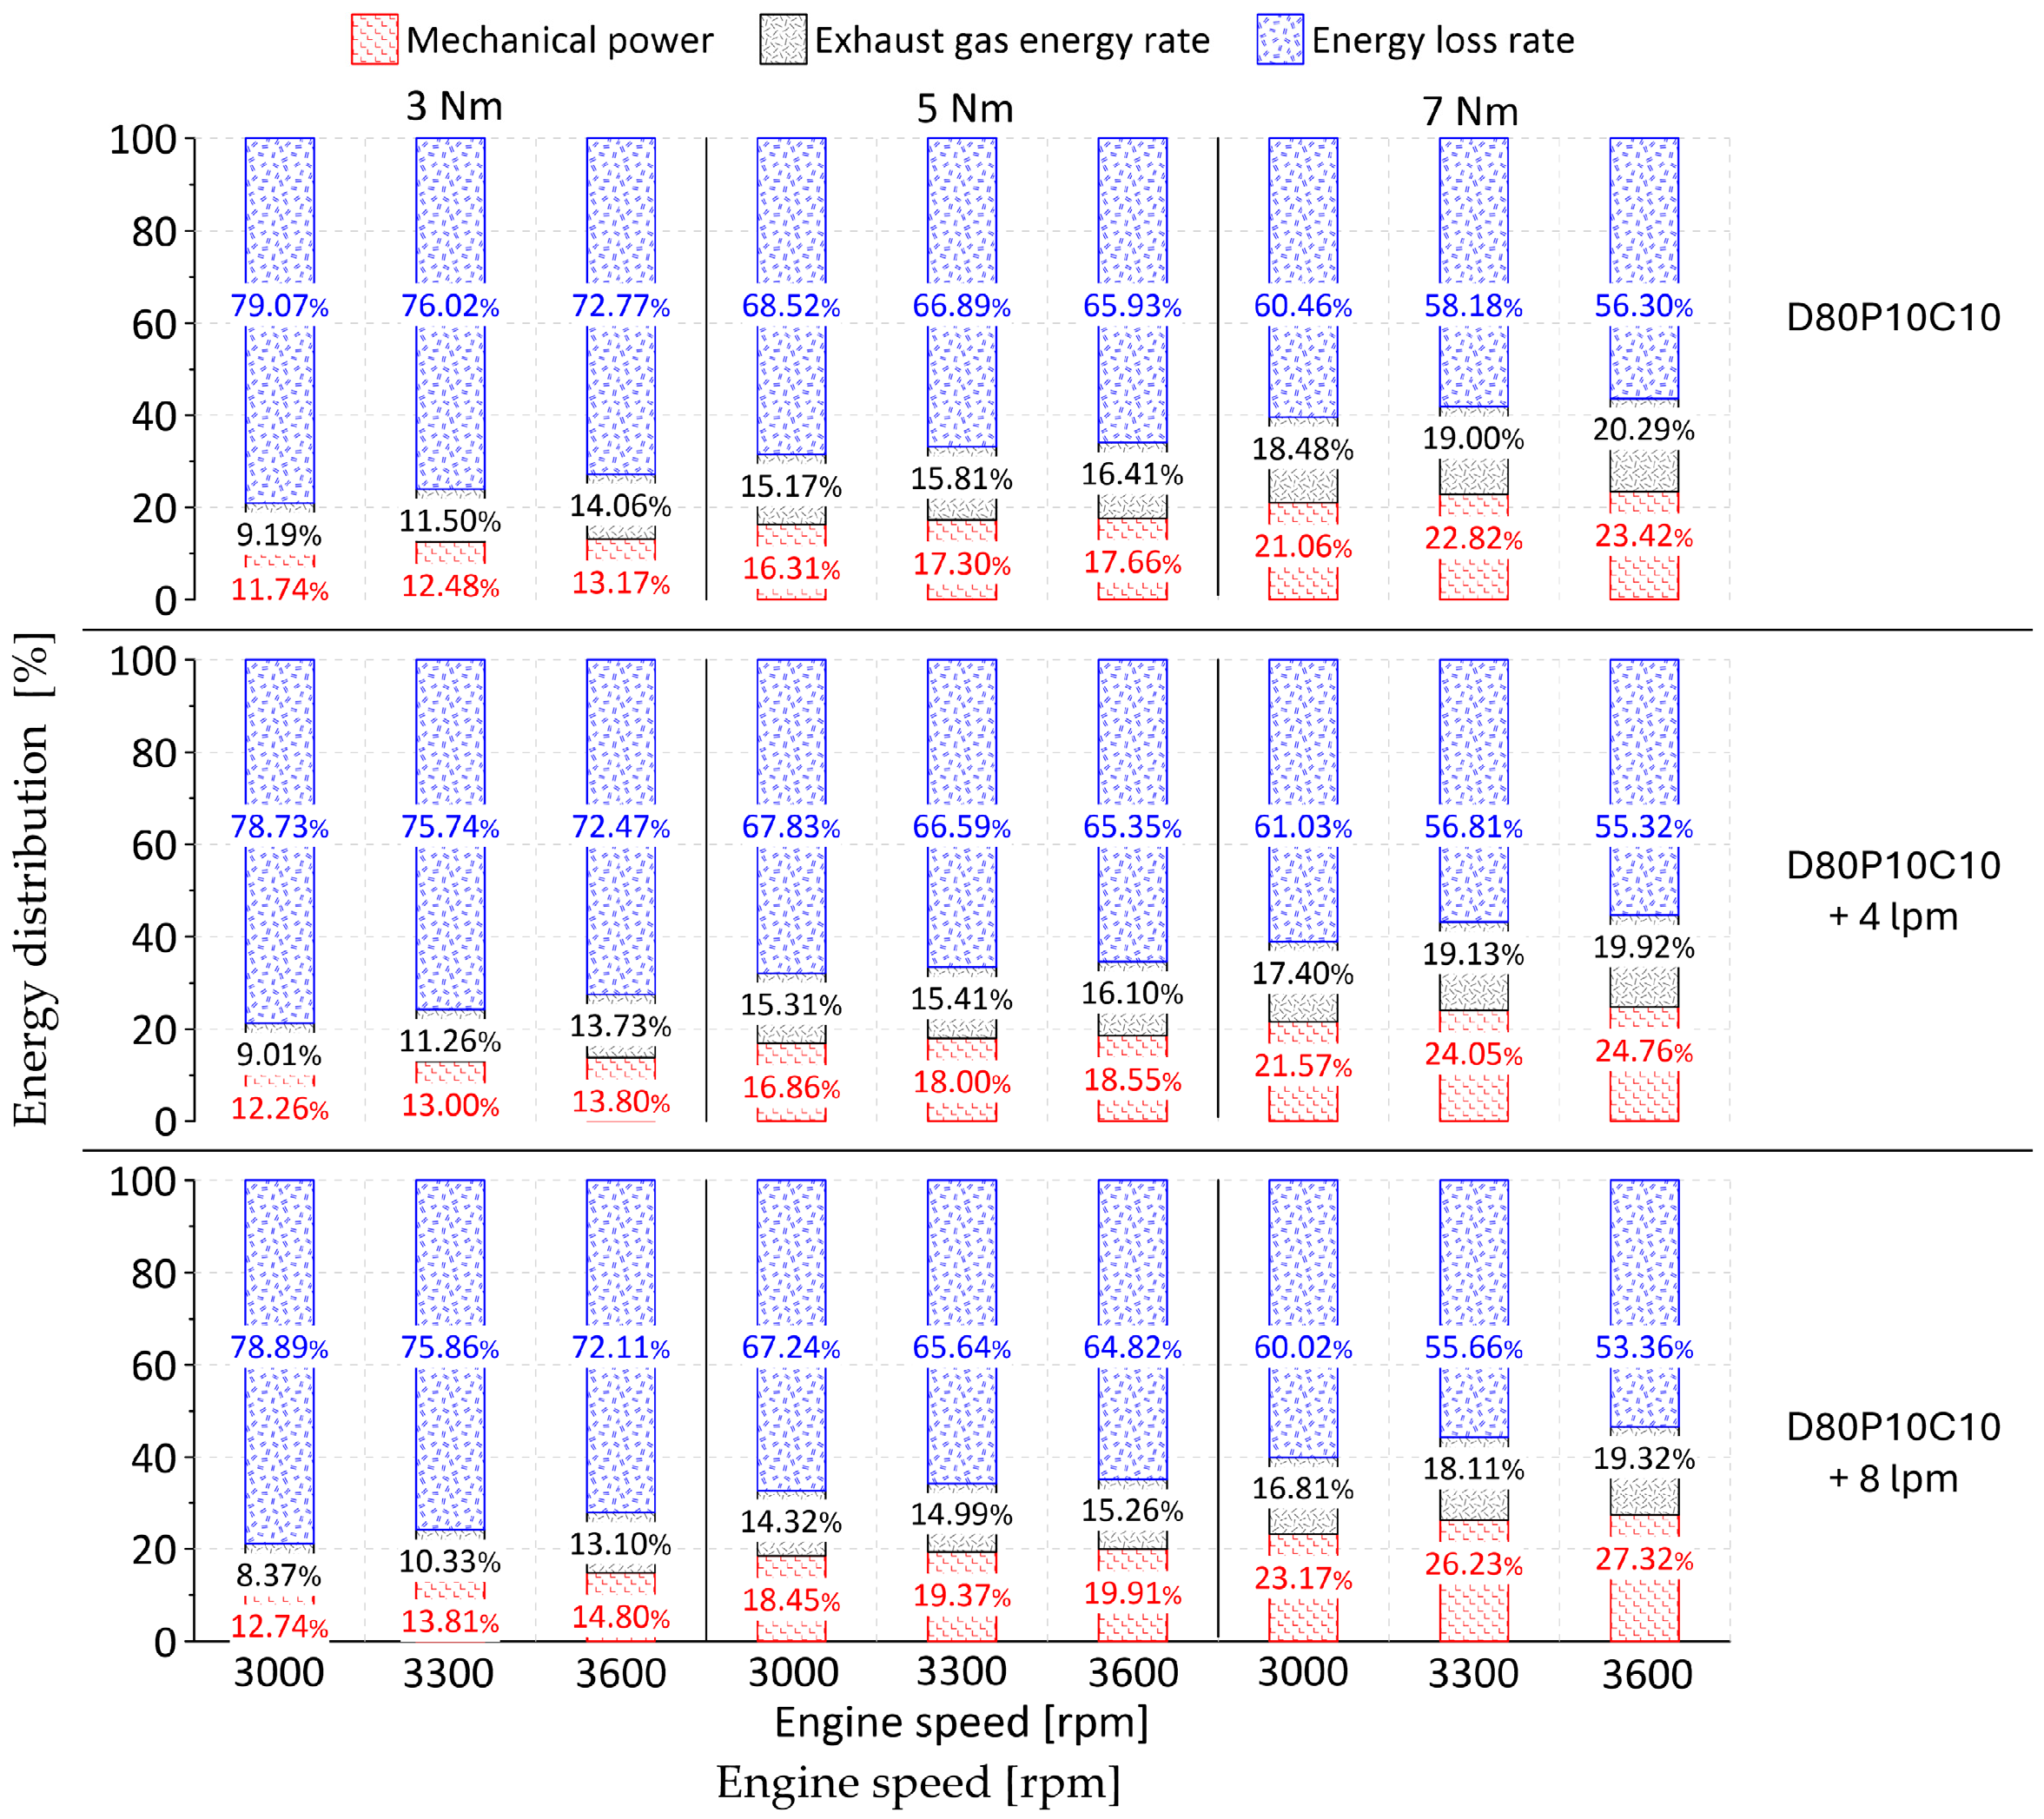
8.2. Energy Distribution Analysis
To analyze the influence of hydroxy injection on the engine fueled with pure diesel, palm oil, and coffee husk biodiesel blends, an energy analysis was performed for D100, D85P10C5, and D80P10C10 fuels, with hydroxy injection rates of 4 and 8 lpm. The engine energy distributions are shown in
Figure 7,
Figure 8 and
Figure 9.
The chemical energy of the fuel is converted to mechanical power, and the energy is lost in the form of heat and through exhaust gases. On average, the D100, D85P10C5, and D80P10C10 fuels were observed to produce a fuel chemical energy to mechanical power conversion of 18.44%, 17.62%, and 17.33%. The lower conversion rate in the biodiesel blends is a consequence of the lower efficiency compared to pure diesel. In the case of the exhaust gas energy rate, an average percentage distribution of 14.24%, 14.65%, and 15.55% is shown for the D100, D85P10C5, and D80P10C10 fuels. The higher exhaust gas energy rates in the D85P10C5 and D80P10C10 blends are a consequence of their higher oxygen content, which tends to increase the temperature during the combustion process. For the D100, D85P10C5, and D80P10C10 fuels, an average loss energy rate of 67.32%, 67.73%, and 67.13% was obtained, respectively. This loss energy rate is associated with heat loss to the environment, friction, and the quality of the combustion process.
Hydroxy injection achieves a reduction in the loss energy rate for all fuels. The fuels D100 + 4 lpm and D100 + 8 lpm produce a 2.26% and 2.55% reduction in the loss energy rate compared to D100. For the fuel D85P10C5 + 4 lpm and D85P10C5 + 8 lpm, a decrease of 1.06% and 2.34% was obtained. In the case of D80P10C10 + 4 lpm and D80P10C10 + 8 lpm, a reduction of 0.95% and 1.89% was observed, respectively. The addition of hydroxy favors the conversion of chemical energy from fuel to mechanical power for pure diesel and biodiesel blends. For D100, D85P10C5, and D80P10C10, a maximum percentage conversion of fuel chemical energy to mechanical power of 24.89%, 23.69%, and 23.42% was obtained. However, with the injection of a volumetric flow rate of 4 lpm, the maximum conversion percentage was 26.17%, 25.14%, and 24.76%. In the case of the mixtures D100 + 8 lpm, D85P10C5 + 8 lpm, and D80P10C10 + 8 lpm, a maximum conversion of 28.16%, 27.58%, and 27.32% was obtained. These results are a consequence of the lower amount of fuel consumption and the higher combustion efficiency achieved by the fuels when mixed with hydroxy.
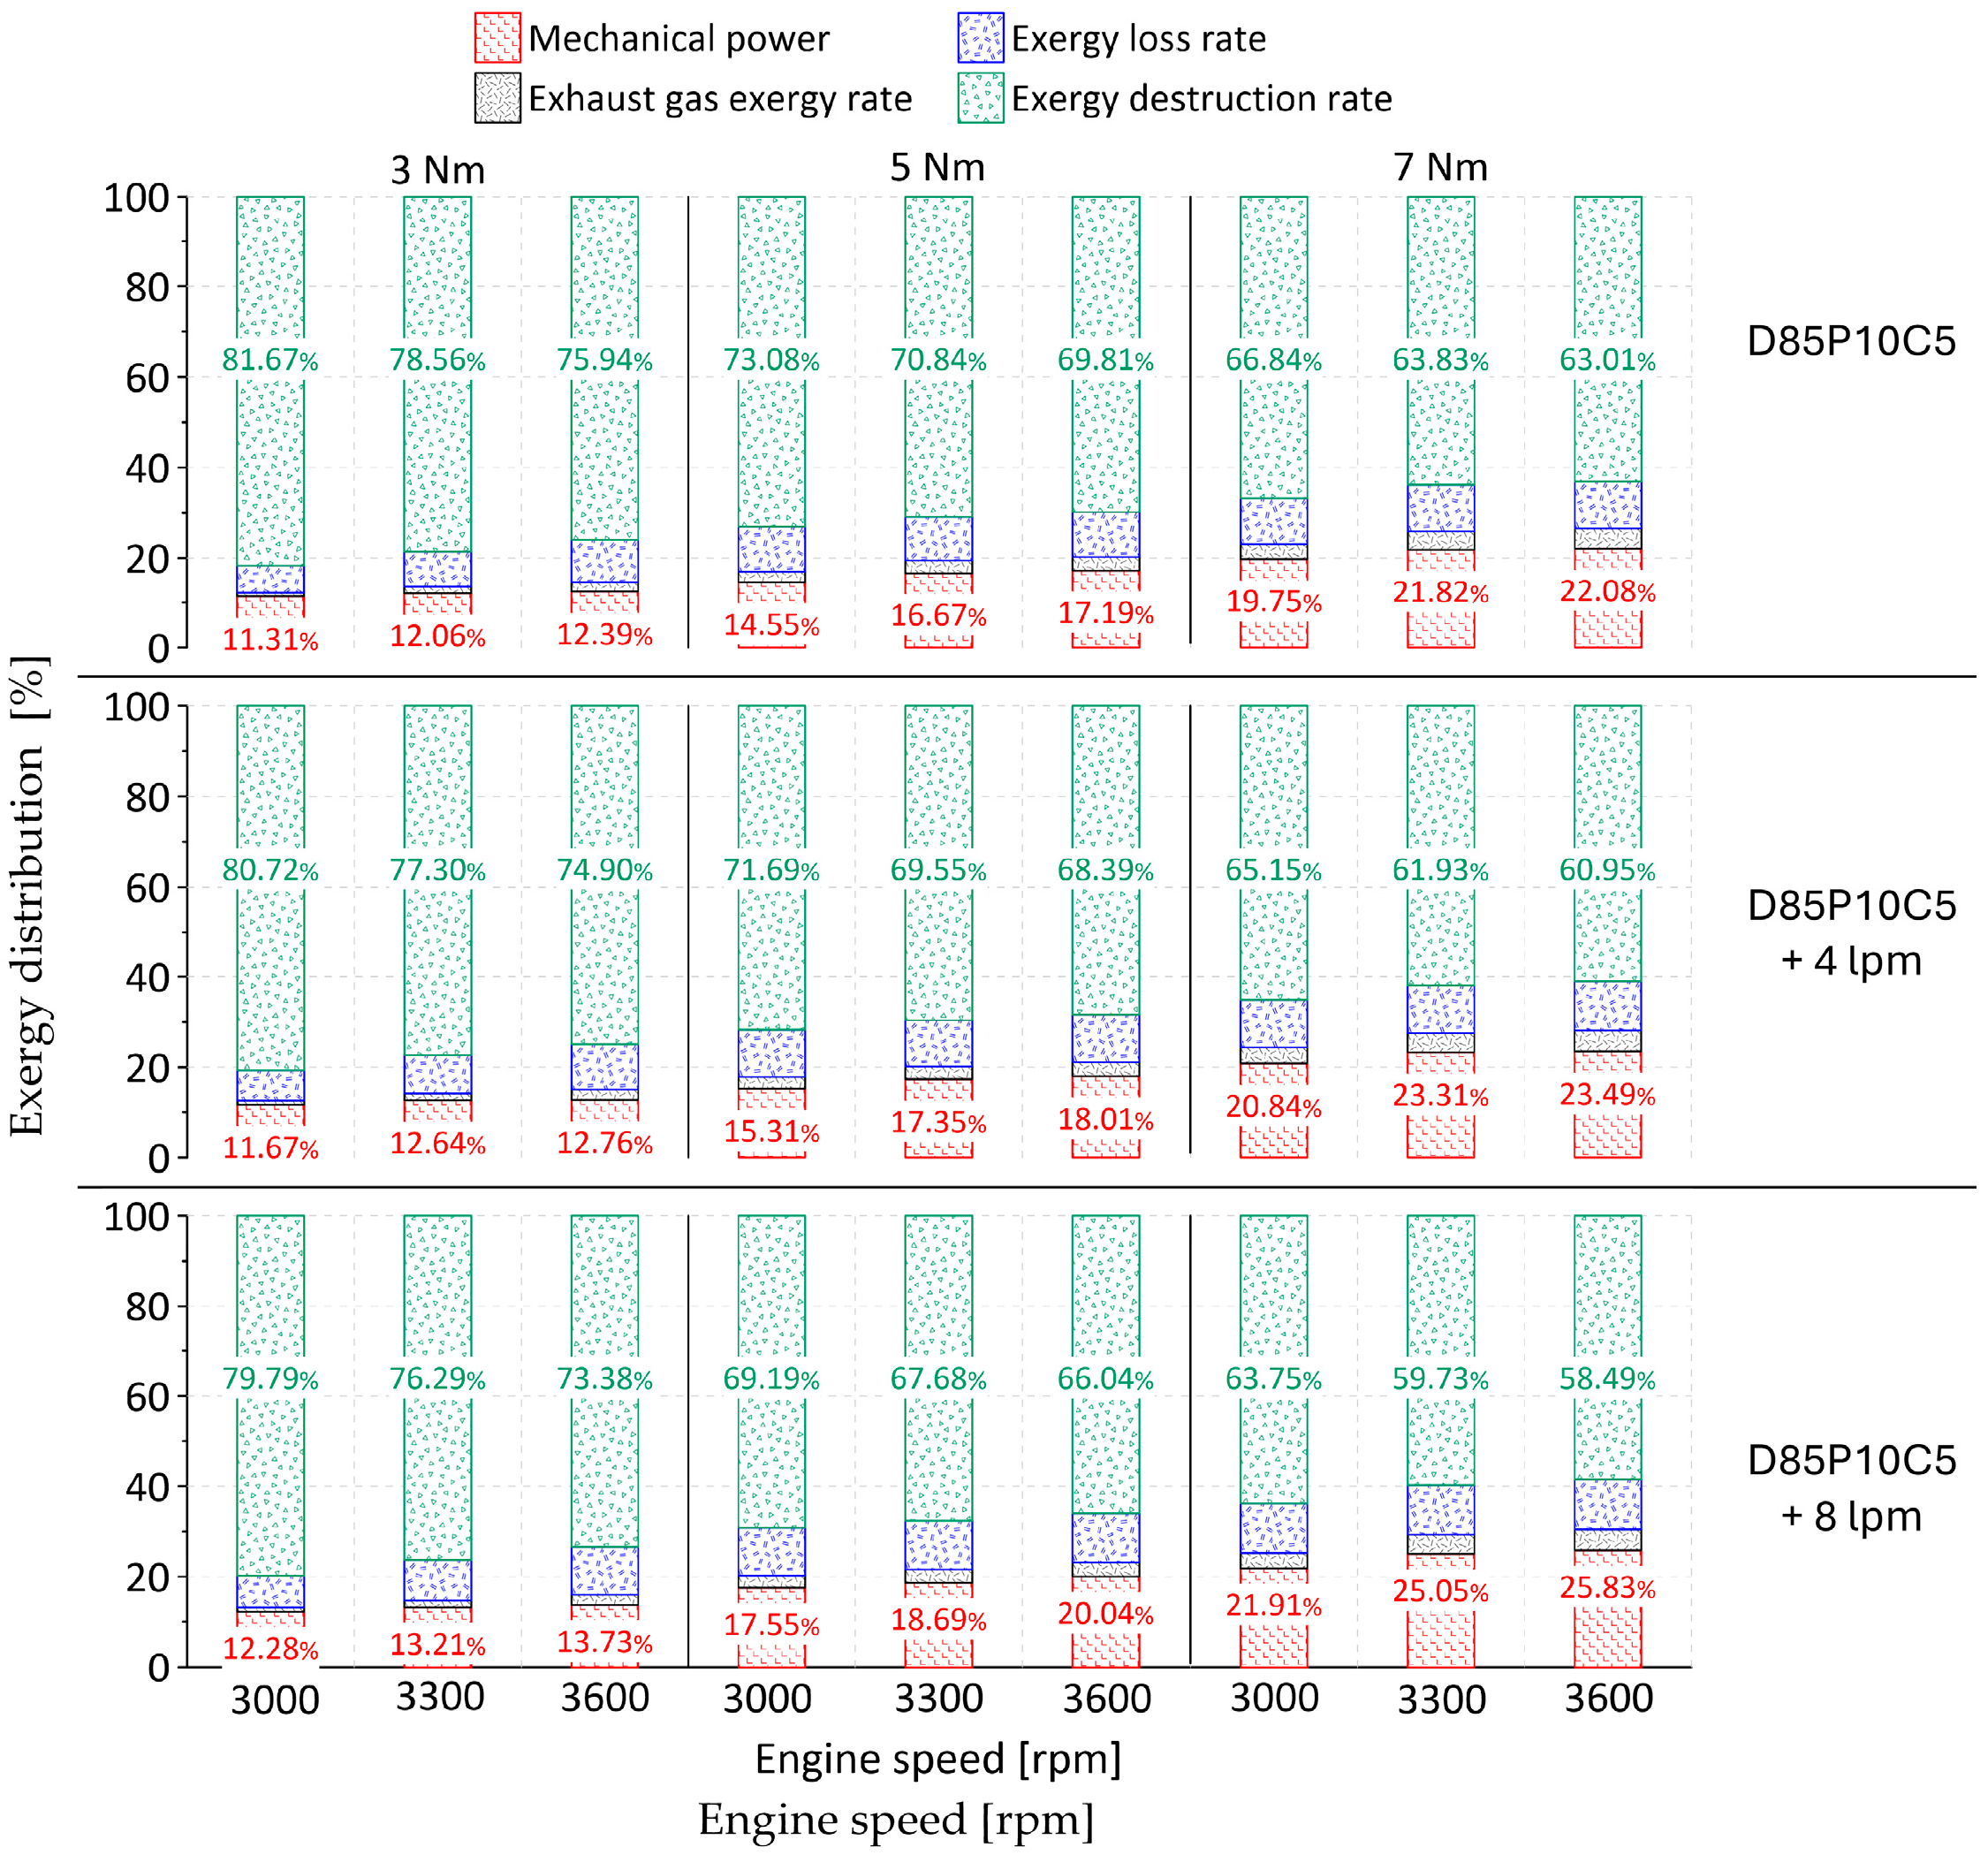
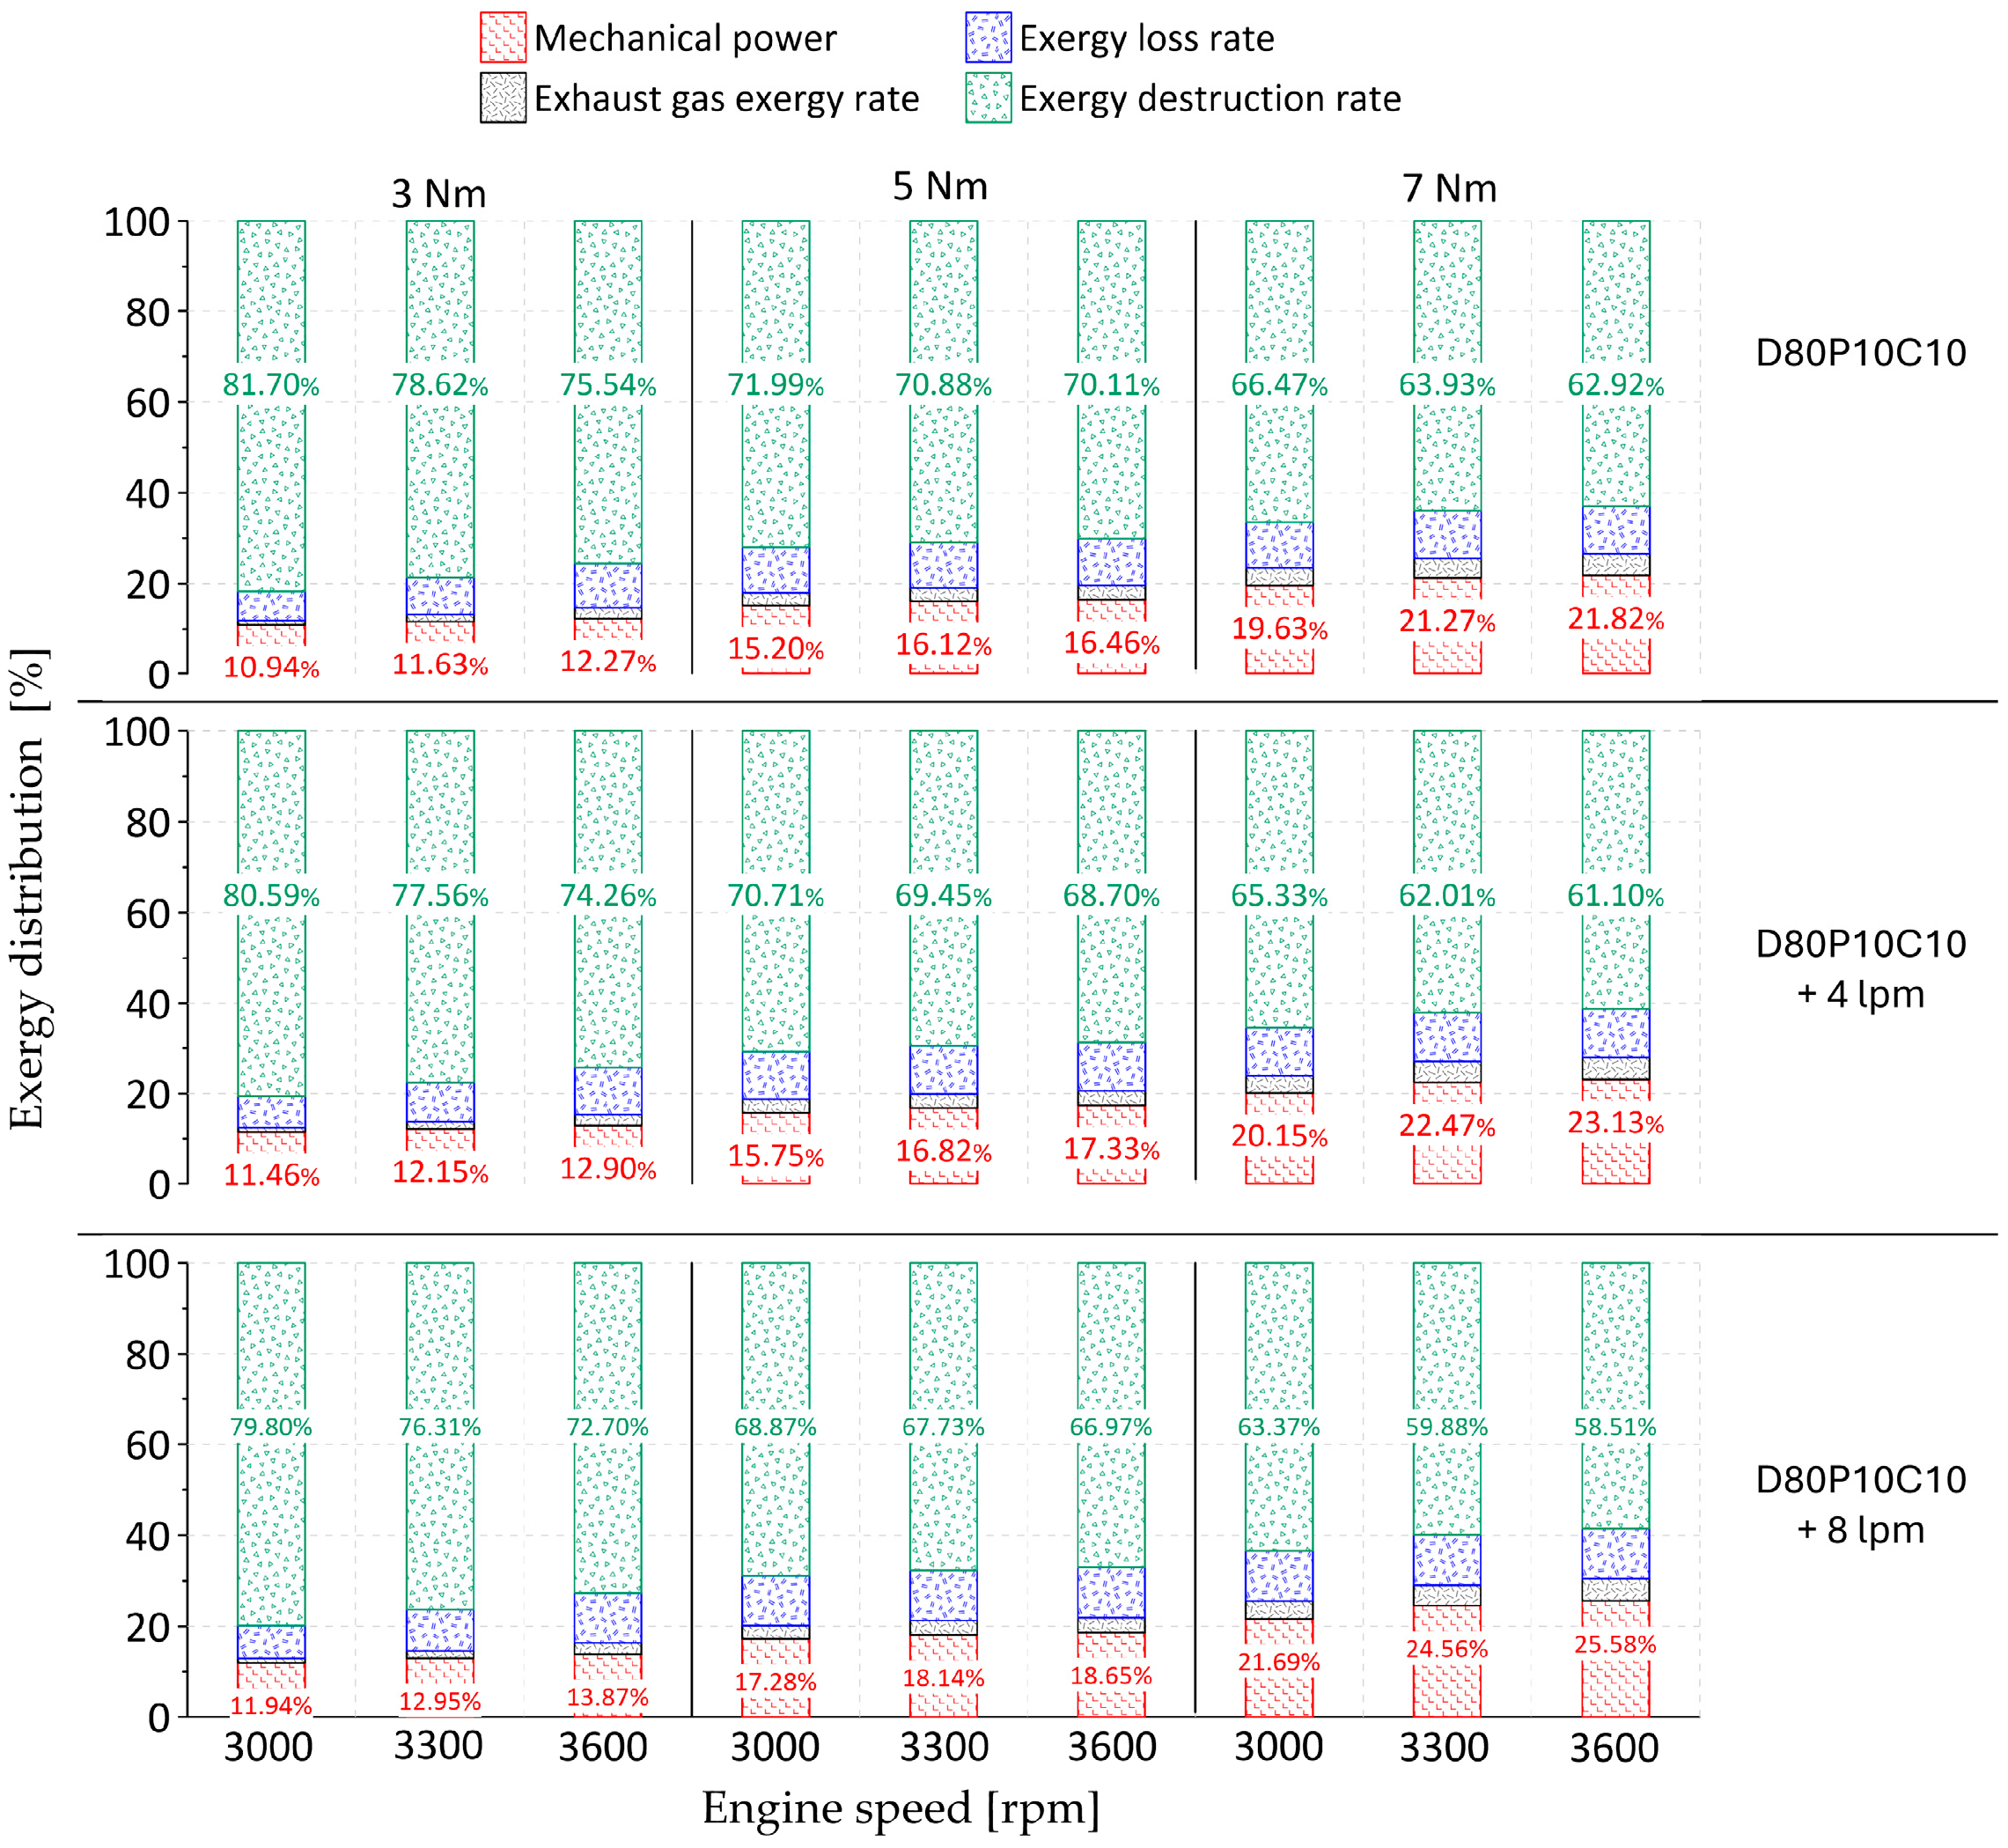
8.3. Exergy Distribution Analysis
To analyze the loss of energy in the engine, an exergy analysis was performed, considering mechanical power, exhaust gas exergy rate, exergy loss rate, and exergy destruction rate.
Figure 10,
Figure 11 and
Figure 12 show the exergy distributions of D100, D85P10C5, and D80P10C10.
The experimental results show that, for the D100 fuel, only 11.36–23.22% of the input exergy is transformed into useful work, exhaust gases lose 0.82–4.22% of the fuel exergy, 5.98–10.17% is eliminated by heat transfer, and irreversible processes in the engine lose 62.39–81.21% of the input exergy. In the case of the D85P10C5 fuel, 11.31–22.08% of the input exergy is transformed into useful work, 0.87–4.48% is lost through exhaust gases, 6.14–10.44% is lost through heat transfer, and 63.01–81.67% is lost through irreversibility. Finally, in the D80P10C10 fuel, 10.94–21.82% is transformed into useful work, 0.96–4.71% and 6.40–10.55% is lost through exhaust gases and heat transfer, and 62.92–81.70% due to irreversible processes. In general, D85P10C5 and D80P10C10 biodiesel blends tend to increase exergy losses due to exhaust gas, heat transfer, and irreversibility compared to pure diesel.
The increase in hydroxy injection has a positive impact on the exergy distributions for the D100, D85P10C5, and D80P10C10 fuels. The results obtained show that the D100 + 4 lpm and D100 + 8 lpm fuels cause a 2.59% and 4.77% reduction in the exergy destruction rate compared to D100. For the fuels D85P10C5 + 4 lpm and D85P10C5 + 8 lpm, decreases of 2.07% and 4.66% were obtained. In the case of the fuels D80P10C10 + 4 lpm and D80P10C10 + 8 lpm, a reduction of 1.98% and 4.47% was observed when compared to D80P10C10, respectively. The use of hydroxy as a secondary fuel allows for increasing the exergy efficiency of the engine for all fuels. The maximum exergy efficiency of D100 was 23.22%. However, for the D100 + 4 lpm and D100 + 8 lpm fuels, a maximum exergy efficiency of 24.46% and 26.39% was obtained, respectively. In the case of the D85P10C5 + 4 lpm and D85P10C5 + 8 lpm fuels, a maximum exergy efficiency of 23.49% and 25.83% was obtained, which is an improvement compared to the efficiency achieved with D85P10C5. The fuels D80P10C10 + 4 lpm and D80P10C10 + 8 lpm allow reaching a maximum exergy efficiency of 23.13% and 25.58%, respectively.
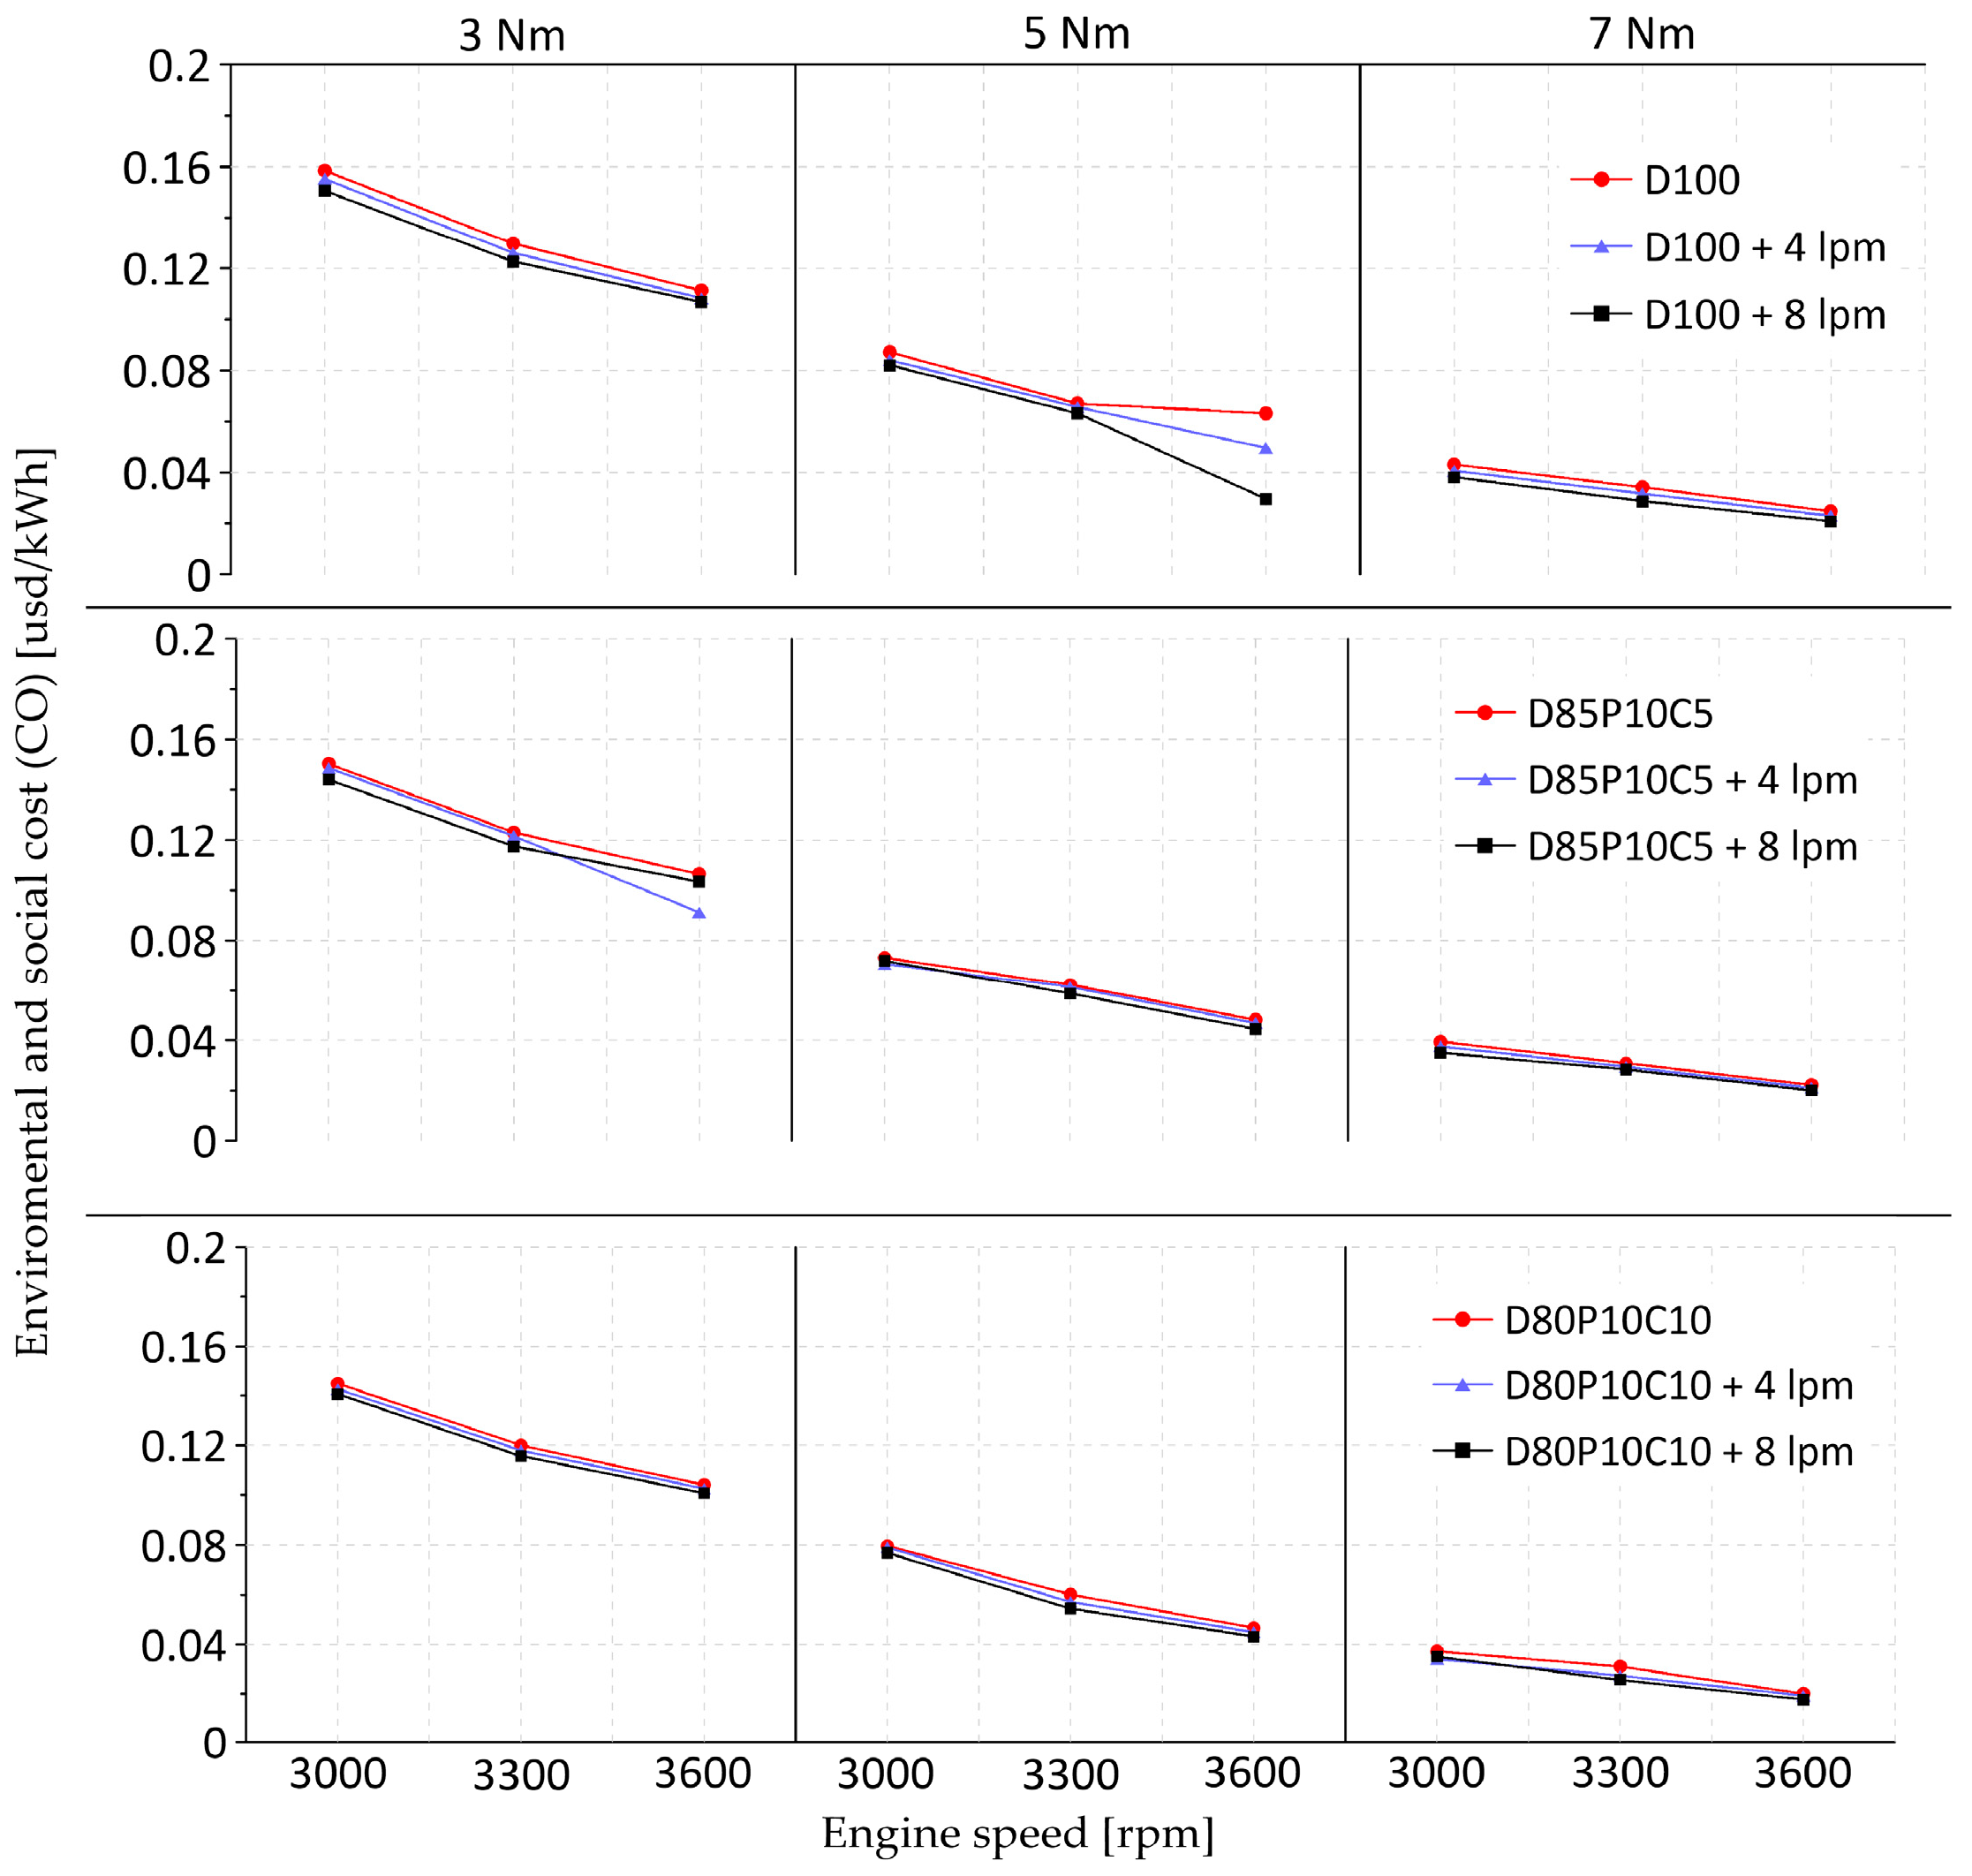
8.4. Analysis of the Environmental and Social Costs of Emissions
Figure 13 shows the environmental and social cost of carbon monoxide (CO) emissions for pure diesel and palm oil and coffee husk biodiesel blends.
CO emission levels are associated with oxygen deficiency in the combustion chamber and poor combustion quality [
46]. The highest environmental and social cost of CO emissions occurs at a torque of 3 Nm for all fuels. The blends of biodiesel D85P10C5 and D80P10C10 achieve a decrease in the environmental and social cost of CO emissions. For the experimental tests carried out, a reduction of 10.50% and 13.69% was observed in comparison with pure diesel. This remarkable reduction is the result of the oxygen content in the D85P10C5 and D80P10C10 fuels. Similar results have been reported in the literature for various types of biodiesels [
47].
Hydroxy injection has resulted in a reduction in the environmental and social cost of CO emissions for pure diesel (D100), and biodiesel blends (D85P10C5, and D80P10C10). The fuels D100 + 4 lpm and D100 + 8 lpm produce a reduction of 6.11% and 13.63% compared to pure diesel. For D85P10C5 + 4 lpm and D85P10C5 + 8 lpm, a decrease of 4.33% and 6.16% was obtained in D85P10C5. Finally, in the fuel D80P10C10 + 4 lpm and D80P10C10 + 8 lpm, a reduction of 4.31% and 7.28% was observed in comparison with D80P10C10, respectively. The leading cause of this behavior is the formation of hydroxide (OH) molecules with hydroxy injection, which leads to an improvement in combustion quality and a reduction in CO formation [
48].
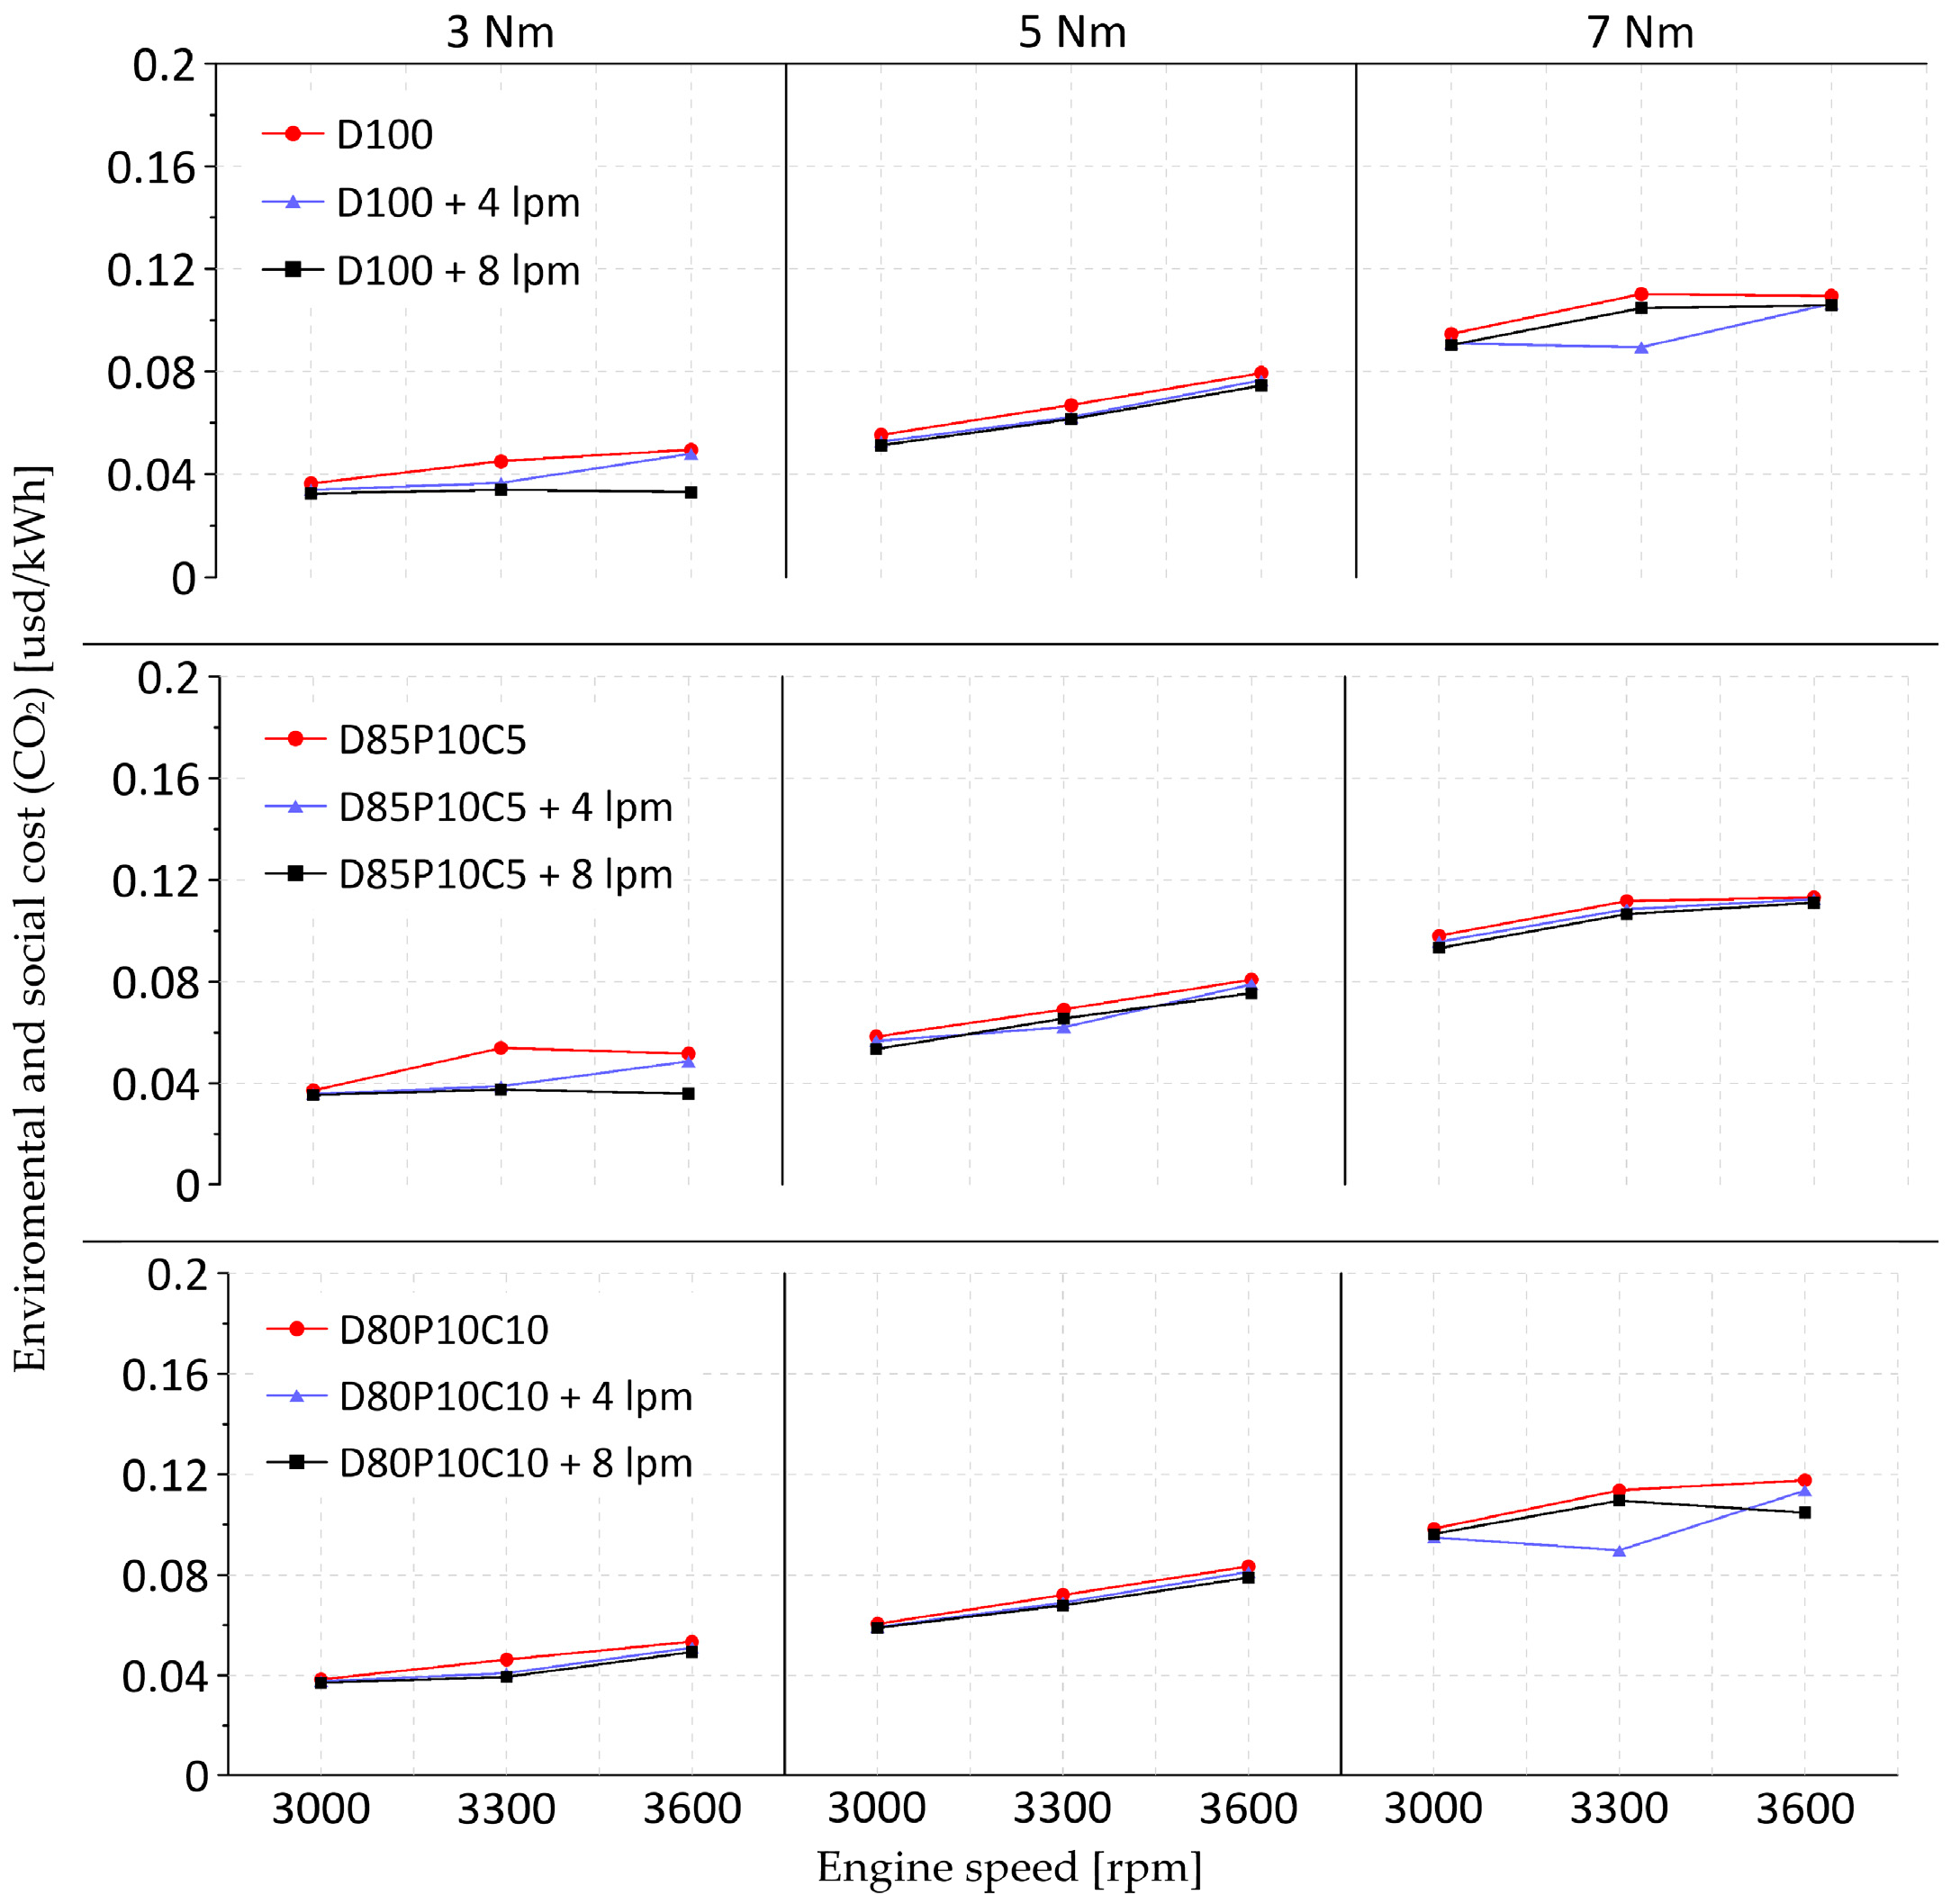
Figure 14 shows the environmental and social cost of carbon dioxide (CO
2) emissions for the D100, D85P10C5, and D80P10C10 fuels.
Carbon dioxide emissions are products of the complete combustion of the fuel.
Figure 14 analyzes the environmental and social costs of CO
2 emissions for diesel, biodiesel, and their mixtures with hydroxy injection. In general, the engine tends to produce higher CO
2 emissions with increasing torque and engine speed. The D85P10C5 and D80P10C10 biodiesel blends result in a 5.07% and 5.96% increase in the environmental and social cost of CO
2 emissions compared to D100. This implies higher CO
2 levels with the biodiesel blends. This result is associated with the high oxygen content of D85P10C5 and D80P10C10 fuels, which promotes complete combustion [
49].
All fuel types tested decrease the environmental and social cost of CO2 emissions with hydroxy injection. By adding a volumetric flow of 4 and 8 lpm, a reduction of 7.74% and 11.49% was obtained in the D100 fuel. In the case of the D85P10C5 blend, a decrease of 6.53% and 10.80% was obtained when the engine is operated with fuel D85P10C5 + 4 lpm and D85P10C5 + 8 lpm, respectively. The use of the fuels D80P10C10 + 4 lpm and D80P10C10 + 8 lpm allows a reduction of 6.11% and 6.28% in the environmental and social cost of CO2 emissions. Since hydroxy has a high energy content, less fuel is required, and, thus, a decrease in carbon molecules inside the combustion chamber. As the volumetric flow of hydroxy increases, the environmental and social cost of CO2 emissions decreases.
Figure 15 shows the environmental and social cost trends of hydrocarbon (HC) emissions for D100, D85P10C5, and D80P10C10 fuels.
Hydrocarbons are caused by inadequate combustion in the combustion chamber. The results obtained show that the environmental and social costs of HC emissions are reduced with the increase in engine torque and speed, which may be related to the lower fuel consumption and better efficiency in these operational conditions. Under low engine load conditions, excess fuel injection and a poor air–fuel ratio occur, thus resulting in higher levels of environmental and social costs of HC emissions. The D85P10C5 and D80P10C10 biodiesel blends allow a reduction of 11.52% and 19.04% compared to D100.
This reduction in the environmental and social cost of HC emissions is a consequence of the oxygen available in the palm oil and coffee husk biodiesel blends, which results in better combustion quality. Hydroxy injections can significantly reduce the environmental and social cost of HC emissions. The wide flammability range of hydroxy and the better homogeneity allow a reduction in unburned hydrocarbons during combustion [
50]. With the addition of a volumetric flow of 4 lpm, a decrease of 4.24%, 5.56%, and 5.30% in the environmental and social cost of HC emissions was obtained for the D100, D85P10C5, and D80P10C10 fuels. In the case of a volumetric flow of 8 lpm, a decrease of 9.56%, 9.30%, and 8.93% was observed for fuels D100, D85P10C5, and D80P10C10, respectively.
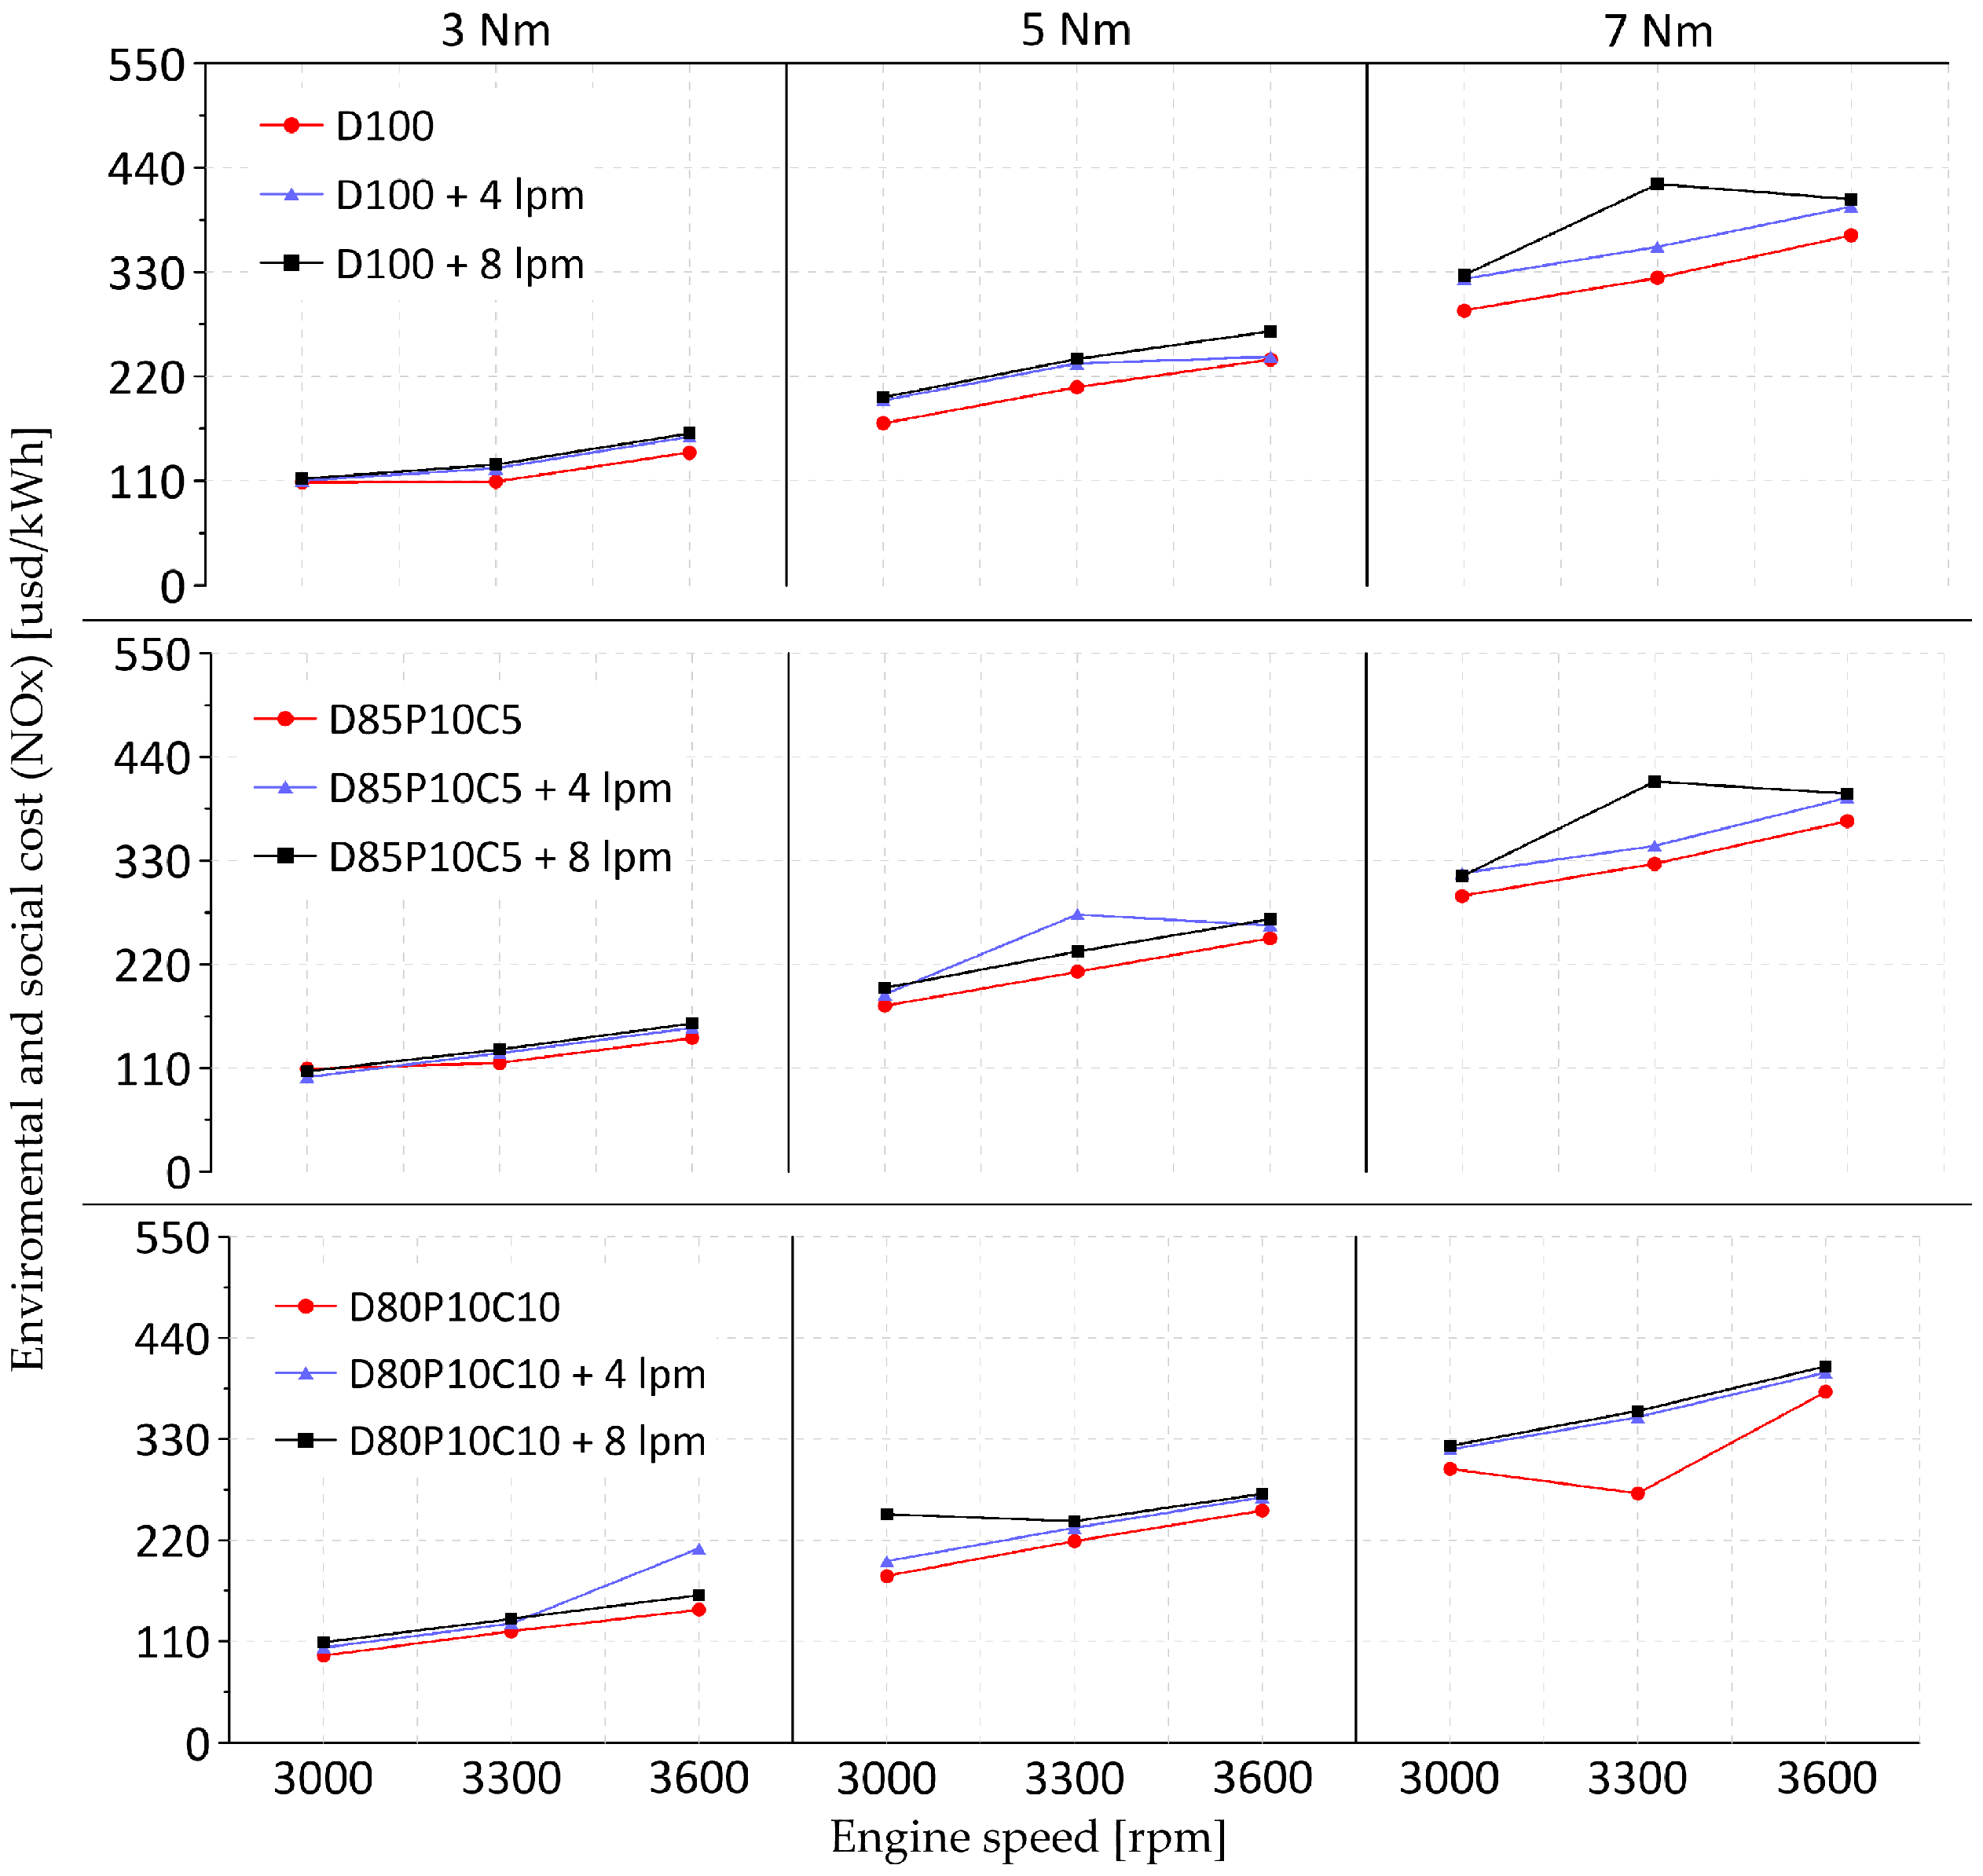
Figure 16 shows the environmental and social costs of nitrogen oxide emissions for fuels.
NOx emissions are mainly caused by high temperatures during the combustion process. These high temperatures favor the reaction of nitrogen and oxygen. Another factor that influences NOx formation is the availability of oxygen in the combustion chamber. This explains the higher environmental and social cost of NOx emissions in palm oil and coffee husk biodiesel blends. The results show that D85P10C5 and D80P10C10 fuels cause an increase of 2.20% and 7.40% compared to D100.
Although hydroxy injections improve efficiency and reduce CO, CO2, and HC emissions from the engine, the trends obtained show an increase in NOx emissions when using this type of fuel. For D100 + 4 lpm and D100 + 8 lpm fuels, there is an increase of 9.25% and 20.97% in the environmental and social cost of NOx emissions compared to D100. In the case of D85P10C5 + 4 lpm and D85P10C5 + 8 lpm fuel, an increase of 9.61% and 10.73% was obtained when compared to D85P10C5. Finally, for the fuel D80P10C10 + 4 lpm and D80P10C10 + 8 lpm, the results show an increase of 14.13% and 15.61%. Due to this behavior, it is necessary that we implement strategies to mitigate NOx emissions. This is especially important in transportation and power generation applications, due to NOx emission regulations.
The increase in NOx emissions caused by using biodiesel and hydroxy can be minimized through various strategies such as fuel treatment (emulsification, fuel additives, and blending), engine parameter modification (combustion modification, dual injection, and combustion type), and exhaust gas aftertreatment technologies (EGR and SCR) [
51].
Table 9 shows a comparison of the NOx emission mitigation capacity for various strategies.
Among the most notable options is selective catalytic reduction (SCR) due to its high efficiency in mitigating NOx emissions [
57]. Studies in the literature indicate that NOx emissions in biodiesel blends with an SCR application are reduced by 68% to 82% [
55,
56]. This favors the viability of using biodiesel and hydroxy mixtures to take advantage of their lower carbon content without causing a significant increase in NOx emissions.
8.5. Cost Savings Analysis
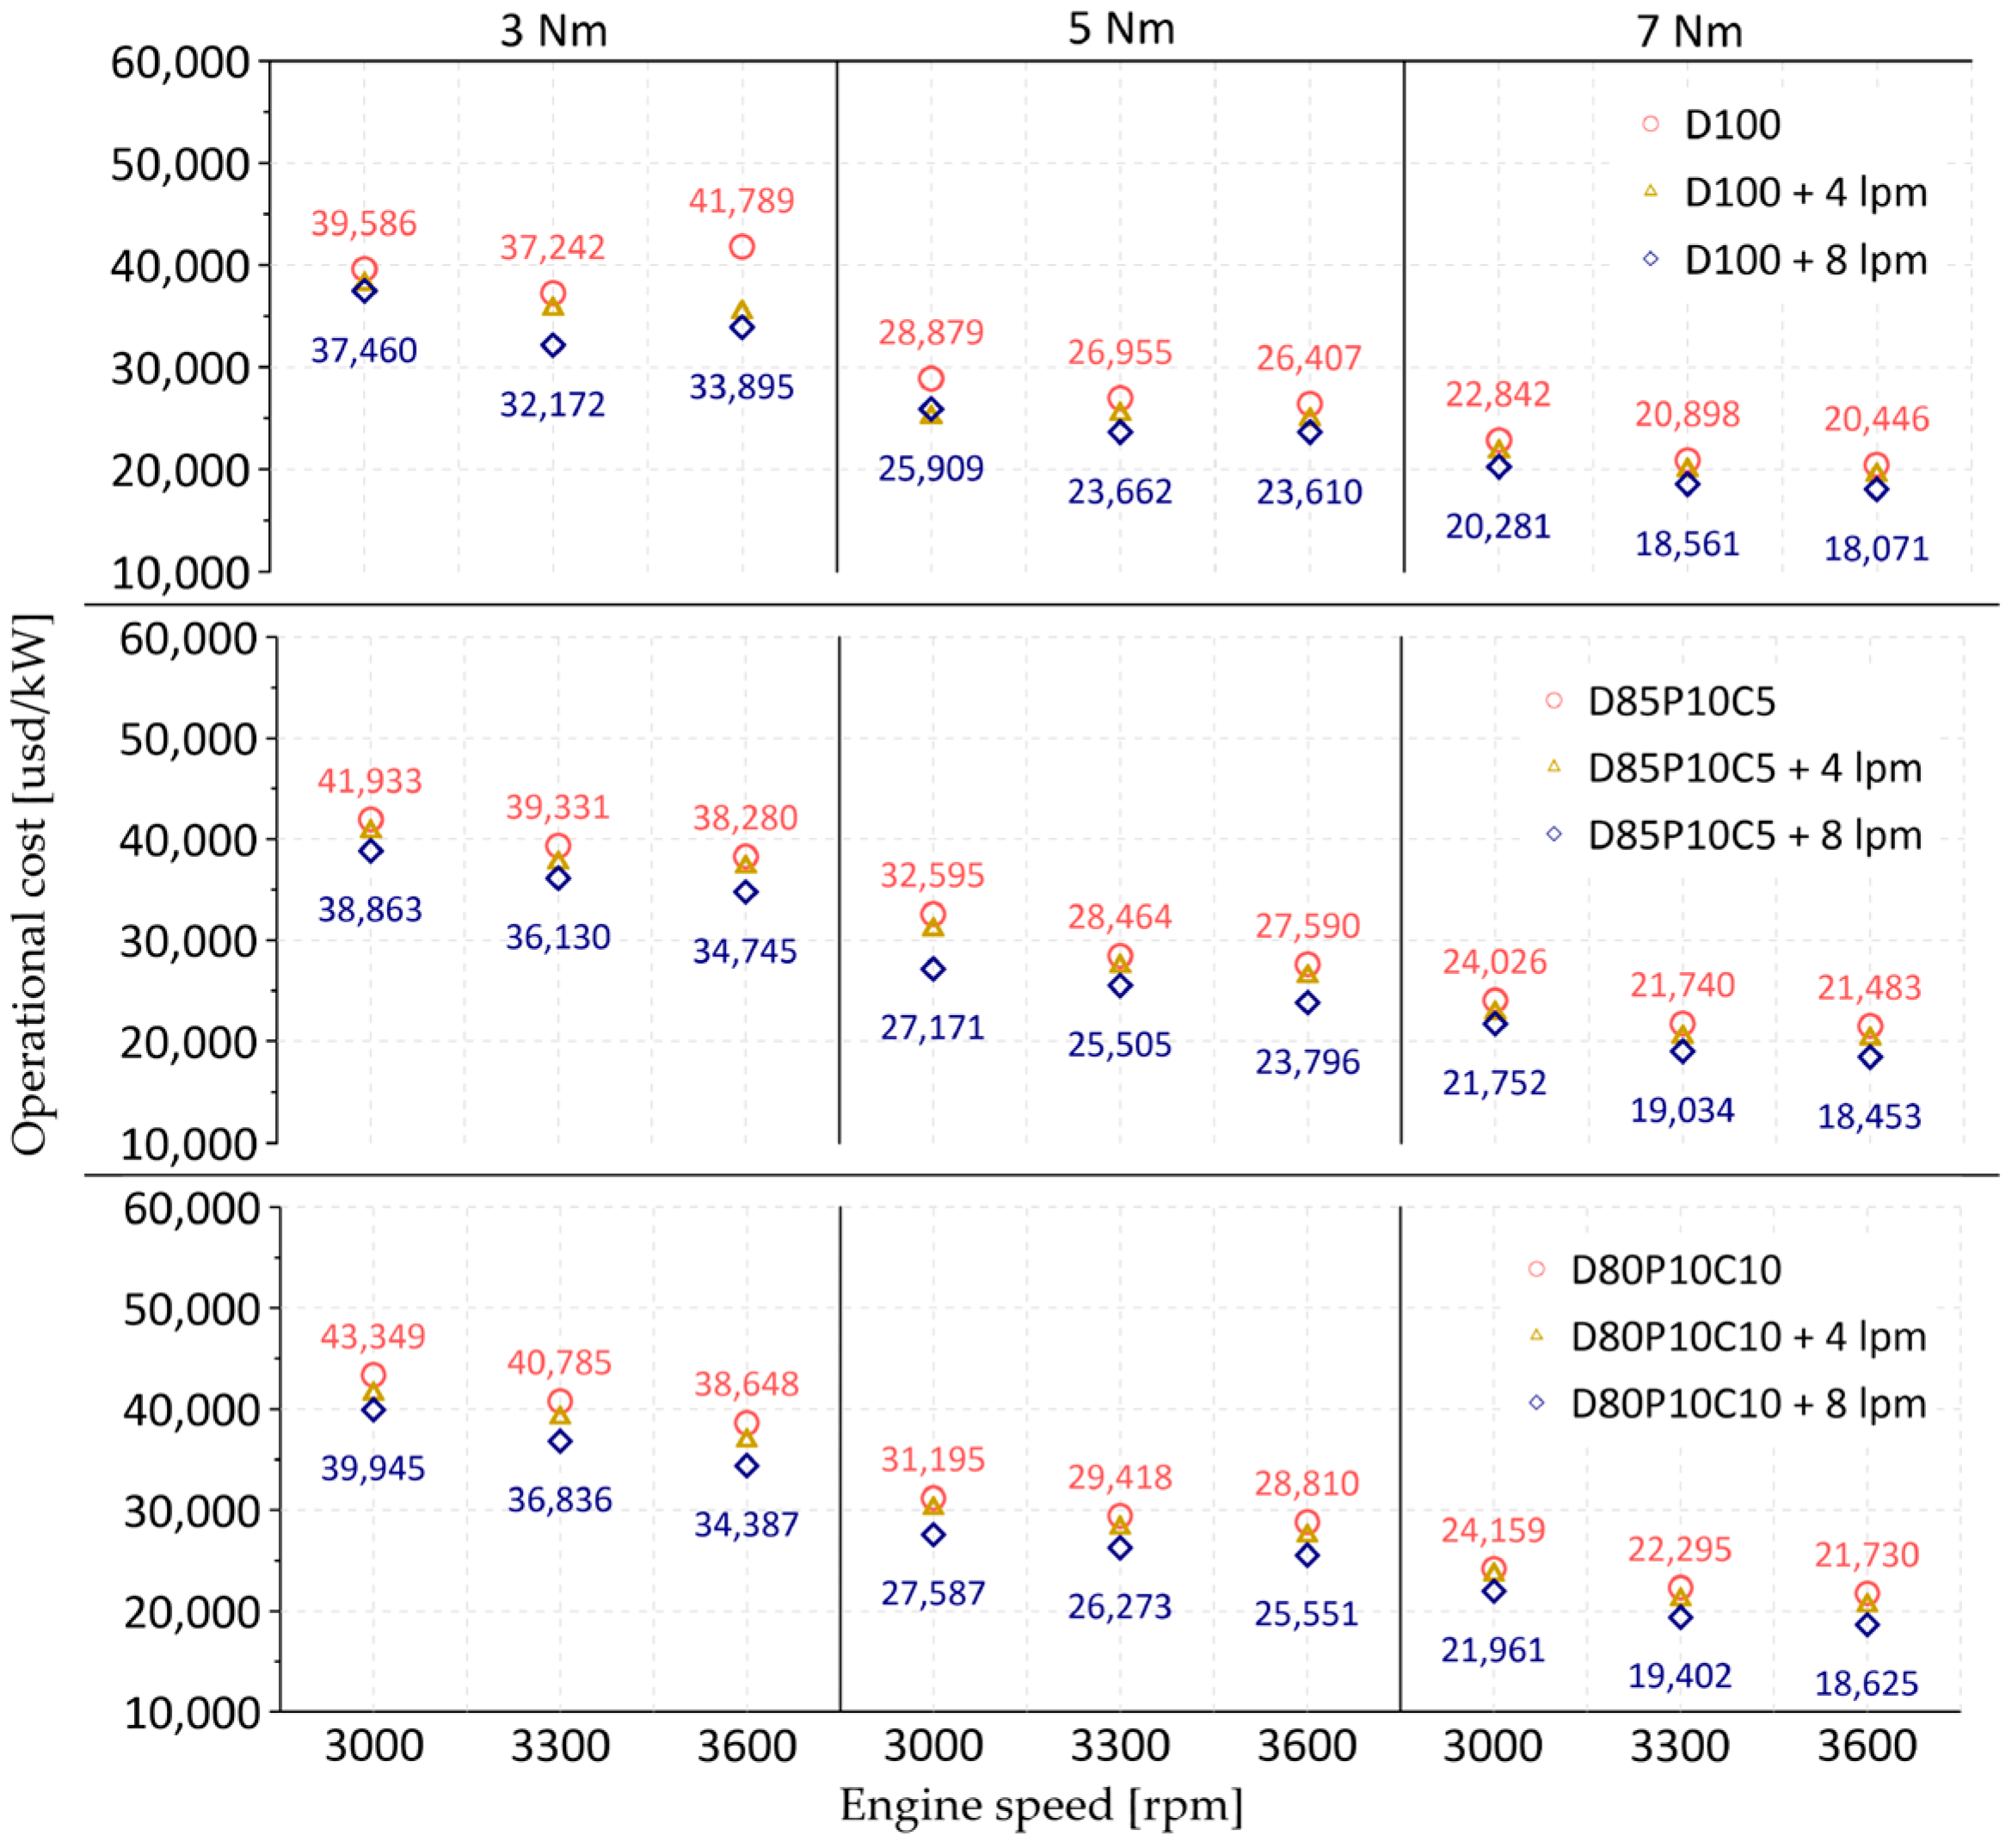
Figure 17 shows the engine operating cost for pure diesel, biodiesel, and their mixtures with hydroxy for the different operating conditions.
The engine operating cost shown is associated with fuel consumption. The trends indicate a reduction in operating cost with increasing torque and speed levels. The operating cost intervals for D100, D85P10C5, and D80P10C10 fuels were 20,446–41,789 usd/kWh, 21,483–41,933 usd/kWh, and 21,730–43,349 usd/kWh, respectively. In general, the D85P10C5 and D80P10C10 biodiesel blends produce an increase of 5.13% and 8.01% in engine operating cost, compared to pure diesel. These trends are a consequence of the higher fuel consumption when the engine is fueled with palm oil and coffee husk biodiesel blends. The injection of hydroxy can reduce the operational cost in pure diesel and biodiesel blends. For the experimental tests carried out, it was observed that the D100 + 4 lpm and D100 + 8 lpm fuels achieve a reduction of 6.91% and 11.66% compared to pure diesel. In the case of the D85P10C5 + 4 lpm and D85P10C5 + 8 lpm fuels, a decrease of 4.34% and 10.61% was obtained. Finally, in the blends D80P10C10 + 4 lpm and D80P10C10 + 8 lpm, there is a reduction of 4.20% and 10.94% compared to D80P10C10, respectively.
9. Conclusions
In the present research, an analysis of the influence of hydroxy on pure diesel and blends of palm oil and coffee husk biodiesel with a percentage of 15% and 20% was carried out. The experimental tests were carried out in a stationary diesel engine, in which the torque and speed varied from 3–7 Nm and 3000–3600 rpm. Hydroxy was used as a secondary fuel with a volumetric flow injection of 4 and 8 lpm.
The results show that palm oil and coffee husk biodiesel blends tend to increase the BSFC of the engine compared to pure diesel. This implies an increase in injected fuel consumption. In general, D85P10C5 and D80P10C10 fuels produce a rise of 9.79% and 13.33% compared to D100. The use of palm oil and coffee husk biodiesel blends also results in a reduction of engine BTE, which implies a less efficient combustion process. The D85P10C5 and D80P10C10 fuels reduce BTE by 6.08% and 7.47%, respectively. The injection of hydroxy can reduce BSFC and increase engine BTE when running on pure diesel and biodiesel blends. On average, a maximum decrease of 11.66%, 11.28%, and 10.94% in BSFC was observed when hydroxy is injected into the D100, D85P10C5, and D80P10C10 fuels. In the case of BTE, a maximum increase of 13.37%, 12.84%, and 12.34% was obtained for the above fuels.
The energy and exergy analysis shows that the use of hydroxy as a secondary fuel causes an improvement in the energy and exergy efficiency of the engine. For fuels D100 + 8 lpm, D85P10C5 + 8 lpm, and D80P10C10 + 8 lpm, a maximum energy efficiency of 28.16%, 27.58%, and 27.32% was observed. In the case of exergy efficiency, a maximum value of 26.39%, 25.83%, and 25.58% was obtained for the above fuels. Additionally, hydroxy causes a maximum reduction of 4.77%, 4.66%, and 4.47% in the exergy destruction rate for fuels D100, D85P10C5, and D80P10C10.
The environmental and social costs of CO, CO2, and HC emissions are significantly reduced with the addition of hydroxy in pure diesel, and palm oil and coffee husk biodiesel blends. For D100, a maximum decrease of 13.63%, 11.49%, and 9.56% in the environmental and social cost of CO, CO2, and HC emissions was obtained when mixed with hydroxy (8 lpm). In the D85P10C5 case, a reduction of 6.16%, 10.80%, and 9.30% was observed. Finally, for the D80P10C10 fuel, a decrease of 7.28%, 6.28%, and 8.93% was reported.
The improvement in combustion quality due to hydroxy is reflected in a decrease in engine operating costs. The injection of a volumetric flow rate of 8 lpm allows a reduction of 11.66%, 10.61%, and 10.94% in operational cost when the engine is fueled with D100, D85P10C5, and D80P10C10.
The present research proposes the use of biodiesel derived from agricultural waste materials such as coffee husks. Unlike other common feedstocks used for biodiesel production, such as vegetable oils, the use of coffee husks promotes a circular economy by enabling better resource utilization. Additionally, it results in a significant reduction in raw material costs, as coffee husks are considered a waste product. Moreover, the partial substitution of diesel with biodiesel and hydroxy allows for the use of existing engine technology without requiring significant modifications. This alternative offers greater feasibility compared to options such as the complete replacement of diesel with hydrogen. Although the latter presents high environmental sustainability, it still poses a technological challenge that limits its large-scale implementation.
In general, the research conducted shows that hydroxy injection is a viable alternative for reducing fuel consumption and improving engine efficiency when fed with palm oil and coffee husk biodiesel blends. In this way, the environmental and social cost of emissions associated with internal combustion engines can be minimized while maintaining performance characteristics like those of pure diesel.


 ,
, 


