Article

Absorption Heat Transformer and Vapor Compression Heat Pump as Alternative Options for Waste Heat Upgrade in the Industry

by
Giorgio Villa
1,
Josè Luis Corrales Ciganda
2,
Gianluca Abrami
1 and
Tommaso Toppi
1,*
1
Department of Energy, Politecnico di Milano, 20156 Milano, Italy
2
TECNALIA, Basque Research and Technology Alliance (BRTA), 20730 Azpeitia, Spain
*
Author to whom correspondence should be addressed.
Energies 2025, 18(13), 3454; https://doi.org/10.3390/en18133454
Submission received: 26 February 2025 / Revised: 12 June 2025 / Accepted: 13 June 2025 / Published: 30 June 2025
(This article belongs to the Special Issue Advances in Refrigeration and Heat Pump Technologies)

Abstract

Increasing the temperature of waste heat is crucial to enable its recovery. Vapor compression heat pumps and absorption heat transformers are the two heat upgrade technologies most commonly used for this purpose. Heat pumps have the advantage of entirely recovering the waste heat and the disadvantage of requiring electricity as input. Heat transformers need a negligible amount of electricity but reject at part of the waste heat input at low temperature. Due to these differences, the choice between the two options depends on the application. In this work, the environmental and economic performance of heat pumps and heat transformers are compared in some relevant applications. Indications about the most suitable technology are provided based on the availability of the waste heat, of the CO2 content of the electricity and of the electricity–gas price ratio. Heat pumps perform better when the waste heat availability is limited compared to the upgraded heat requirements and has a better environmental profile when the electricity has low carbon content. Heat transformer results are often economically convenient, especially when the availability of waste heat is large.

1. Introduction

Waste heat recovery is more and more seen as a key practice for decarbonizing the energy sector. Industrial processes, power generation and other energy-intensive activities generate large amounts of waste heat, much of which remains unutilized. In fact, while for a share of the available waste heat, direct reuse is possible, for a non-negligible fraction, the temperature is too low to find direct application. Obtaining an estimation of the actual magnitude of the waste heat is difficult, especially for the low-temperature fraction, which has often been considered non-recoverable. However, estimates suggest that waste heat below 100 °C amounts at about 20% of the global primary energy consumption [1]. This estimate is for the year 2012, but the figures are unlikely to have decreased since then, especially in view of the continuous growth of data centers [2,3], whose energy consumption is entirely dissipated as low-temperature waste heat.
Increasing the waste heat temperature by means of heat upgrade technology makes low-temperature heat available for several practical applications, such as industrial processes, district heating and other heat-intensive applications. Among the technologies available for temperature upgrading, high-temperature heat pumps (HTHPs) and absorption heat transformers (AHTs) are the ones that find more practical applications in the mentioned sectors.
In heat pumps the heat upgrade is achieved by means of an input of mechanical power, usually in the form of electricity. HTHPs are usually based on an electrically driven Rankine cycle, even if applications based on the Stirling cycle [4] also exist. Focusing on the former technology, progressive advancements in refrigerants and compressor technology have extended the operational temperature, making them suitable for high-temperature industrial applications [5]. Several options are available for the working fluid, with a recent trend towards natural fluids such as ammonia, propane and isobutane, to overcome the environmental issues of synthetic molecules, connected to the high GWP and fluorine content. The main drawback of HTHPs is their reliance on electricity, which can partially offset their environmental benefits, particularly in regions where the grid is powered by fossil fuels.
For this reason, heat pumps are used in district heating systems in regions with favorable conditions, namely the availability of cheap and low-carbon electricity. This is the case in Sweden, where heat pumps with an overall capacity of about 1.2 GW were already operating in district heating networks in 1986, with an annual heat production of about 6 TWh [6]. More recently, under the pressure of new regulation and the increase of the renewable share in the electricity networks of many countries, the use of heat pumps in district heating networks started in other European countries, reaching about 1.6 GW of installed capacity in 2017 [7] and 2.5 GW in 2024. In Sweden, the installed capacity remained roughly constant and the growth concentrated in Finland, Denmark, France, Norway, Germany and Austria [8]. Most of these countries are characterized by low electricity cost, which offsets the low COP of the heat pumps when operated at the high thermal lift, typical of most of the district heating networks. To overcome this limitation, there are two options, i.e., lowering the supply temperature, possible in fourth generation district heating networks [9], or using a relatively warm heat source, as waste heat [10].
The same concept applies for heat pumps for industrial steam generation, which can be competitive against gas boiler at temperatures up to 180 °C [11], provided that a source at sufficiently high temperature is available. Heat pumps can be successfully applied in other energy intensive applications as carbon capture [12] or desalination, where they enable cost and energy reduction [13,14].
Absorption heat transformers operate on a thermodynamic cycle directly activated by the waste heat, with a minimal electricity consumption. Unlike absorption heat pumps, which require a high temperature input, AHTs use relatively low-quality heat to activate the thermodynamic cycle. A fraction of the input heat is thus upgraded to a higher temperature, while the remainder is rejected to a lower temperature sink. AHTs utilize as working pairs water–lithium bromide or ammonia–water, with the former being more common in actual installations [15]. Their reliance on heat rather than electricity makes AHTs particularly attractive for regions with abundant thermal energy resources or low-grade heat availability. Additionally, AHTs are less sensitive to electricity costs and grid carbon intensity, making them an appealing option for decarbonization. On the other hand, the lower fraction of heat which is upgraded at high temperature compared to heat pumps, and limitations in achieving very high-temperature lifts can restrict their use to specific scenarios. As heat pumps, AHTs are suitable for delivering high temperature heat in the form of a hot water stream or steam. In [16] a small scale AHT prototype producing steam at 120 °C while driven by heat at 85 °C was developed. The COP of the prototype was 0.33, but estimation suggest an increase up to 0.36 for larger units, where the impact of the heat losses is lower. In [17] a heat transformer with a capacity of 5 MW was used to recover the heat of condensation from a chemical plant to provide process water at 110 °C, with a COP of 0.47 and a payback period of about 2 years. Fuji et al. [18] reported two AHT installations with a capacity of 0.15 MW and 2.48 MW, respectively, with calculated payback periods smaller than four years. Aoyama and Okinawa [19], on the other hand, stated that the investment cost of a 1 MW capacity AHT can be recovered after 12,000 h of operation.
When considering heat upgrade options without incentive schemes, vapor compression heat pumps and combinations of a heat transformer with an auxiliary natural gas boiler emerge as the most cost-effective solutions, with the optimal choice depending on energy prices [20]. Since both technologies have advantages and limitations that influence their applicability, the choice between HTHPs and AHTs often depends on factors such as the temperature of the waste heat, the desired temperature lift, the carbon intensity of the electricity and economic considerations, including capital and operating costs. Previous studies have provided economic and/or environmental comparisons between technologies such as vapor compression heat pumps and absorption heat pumps. In [21], absorption heat pumps and chillers were compared with vapor compression heat pumps for different applications to determine the minimum number of operating hours above which they are profitable for industrial and real estate applications. An environmental and economic comparison is performed in [22], where a multi-objective decision support system has been developed to minimize environmental impact and maximize economic performance. The tool considers different technologies, such as absorption chillers and heat pumps, to exploit available waste heat. In [23], vapor compression heat pumps and absorption heat transformers are compared with gas and electric boilers and solar heat for industrial processes as possible alternatives for supplying 500 kW of heat at 120 °C or 150 °C, comparing economic performance and CO2 emissions depending on the boundary conditions along different European countries.
However, no studies have focused on an environmental and economic comparison between absorption heat transformers and high-temperature vapor compression heat pumps and provided indication about the technology to select when both can be applied to upgrade available waste heat to satisfy a demand of high temperature heat.
To fill this gap and provide first guidelines about the choice of the more convenient technology, this work compares high-temperature vapor compression heat pumps and heat transformers as alternative solutions in applications where both are suitable. Four case studies, characterized by low-temperature waste heat availability and higher-temperature heat demand, are considered. For each case, the cost and the CO2 emissions for a unit of upgraded heat are calculated for two competing systems, one based on a heat pump using the waste heat as the source for the evaporator and another based on a heat transformer using the waste heat to activate the thermodynamic cycle. For both cases, a gas boiler is used to provide the fraction of high-temperature heat not covered by the heat upgrade technology. Parametrical analysis will be done based on three quantities: (i) the availability of waste heat compared to the high-temperature heat demand; (ii) the carbon intensity of the electricity; (iii) the ratio between electricity and gas price. Through this analysis, an evaluation of which technology is preferable under the various combination of these parameters is derived for both the cost and the carbon emissions of the upgraded heat. The economic evaluation is based on the running cost, excluding the capital cost of the technology, and the environmental analysis is based only on the use phase, excluding the other phases of the life cycles. This is for several reasons. At first, the different level of maturity of the two technologies would make a comparison based on current prices unfair. Moreover, the installation costs, which are very dependent on the practical situation, would need to be considered in the capital cost. Moreover, the use phase usually represents the most impactful phase, both from the economic and environmental point of view.

2. Method

The study compares two alternative systems for waste heat upgrading: a high temperature vapor compression heat pump and a heat transformer. In the former case, the HTHP receives the waste heat ( Q w a s t e ) at the evaporator and delivers the upgraded heat ( Q U P ) at the condenser (see Figure 1). In the latter, the AHT uses the waste heat in the evaporator and generator and delivers the upgraded heat at the absorber, while discharging a fraction of it ( Q D I S ) at the condenser (see Figure 1). In both cases the heat upgrade technology uses all the available waste heat, until the high temperature demand ( Q n e e d ) is met. If needed, in both cases a gas boiler is used to produce the additional required high temperature heat, while the potential excess of waste heat not used by the heat upgrade technology is dissipated. From this point, the combination of the heat upgrade technology (either HTHP or AHT) and the gas boiler will be referred as the heat upgrade system.

2.1. Approach to the Analysis

A parametrical analysis is performed to assess the economic and environmental cost of a unit of heat required by the user ( Q n e e d ). The parameters changed in the parametrical analysis are the following:
-
The ratio between the available waste heat ( Q w a s t e ) and the demand of heat at high temperature ( Q n e e d ) , named RQ. This parameter is varied between 0 and 3, which represents a broad range of applications. Values close to zero refer to those cases where the available waste heat is significantly lower than the need of high temperature heat. In this case, the auxiliary boiler will be required to provide a non-negligible fraction of Q n e e d . Values close to 1 could refer to those industrial process where the process heat delivered at high temperature is almost entirely rejected at low temperature, after been used. Values above 1 are more likely to be found in those cases when a large source of the waste heat, decoupled from the potential user, is available.
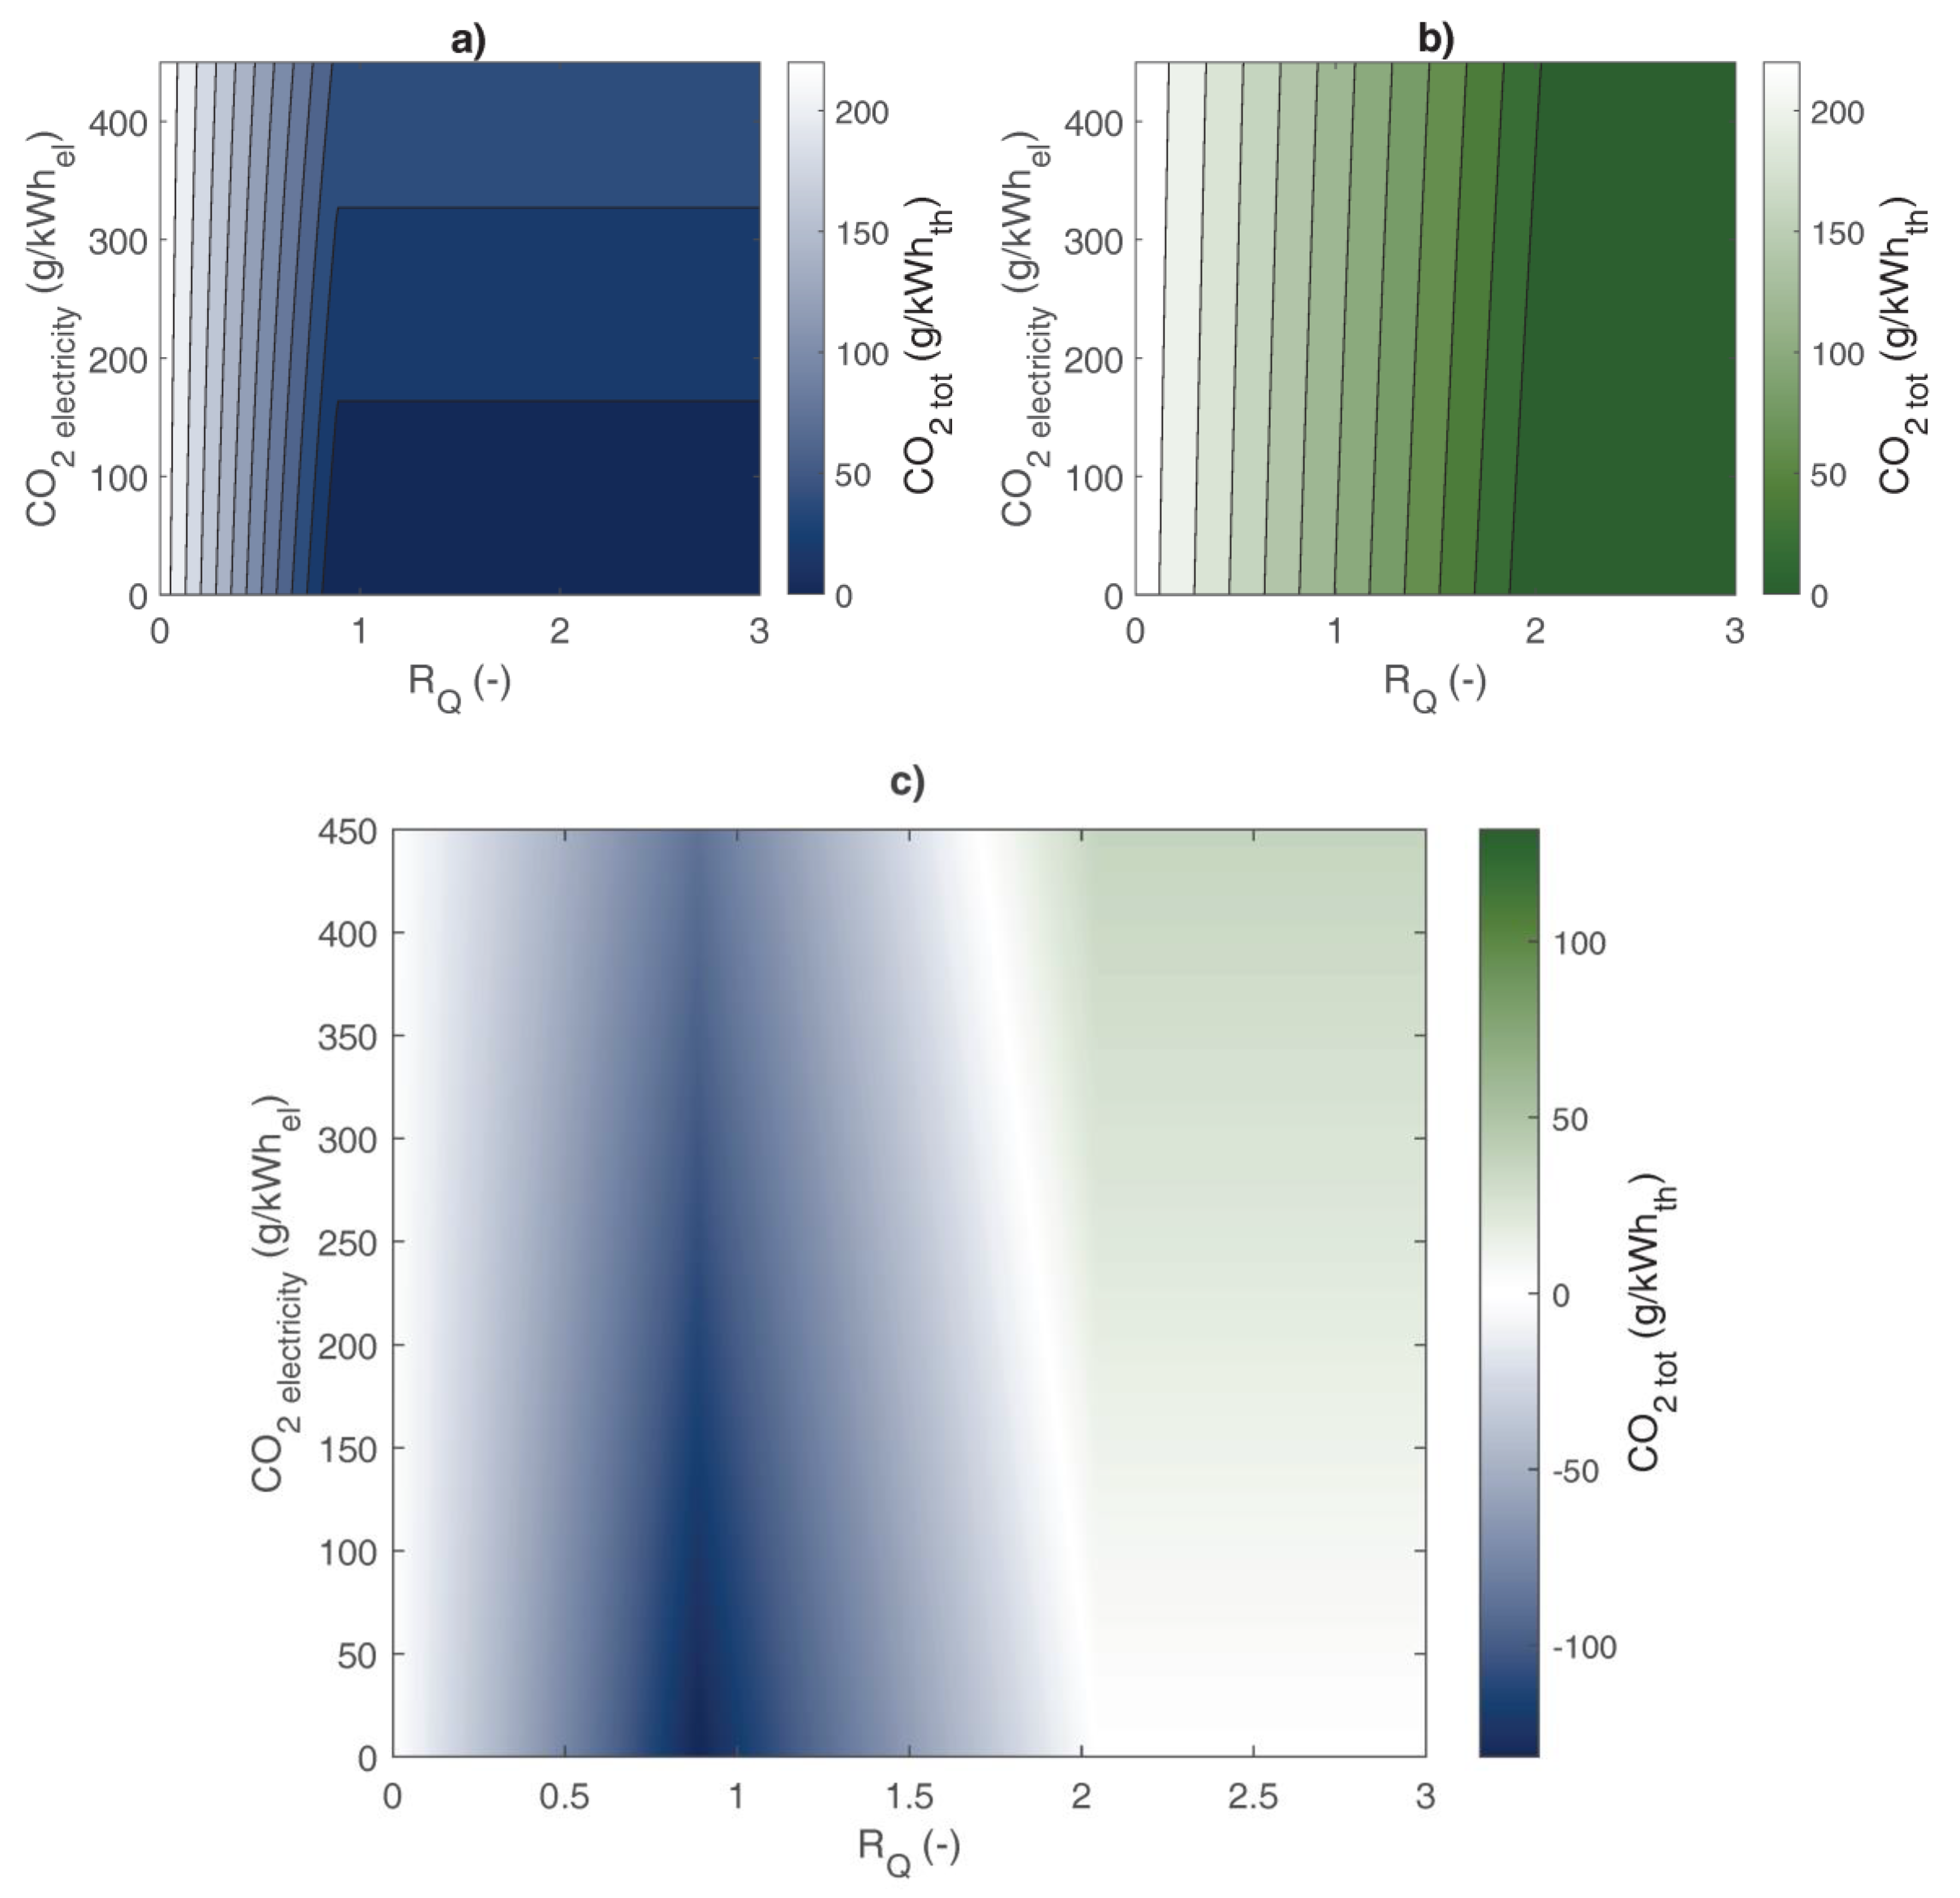
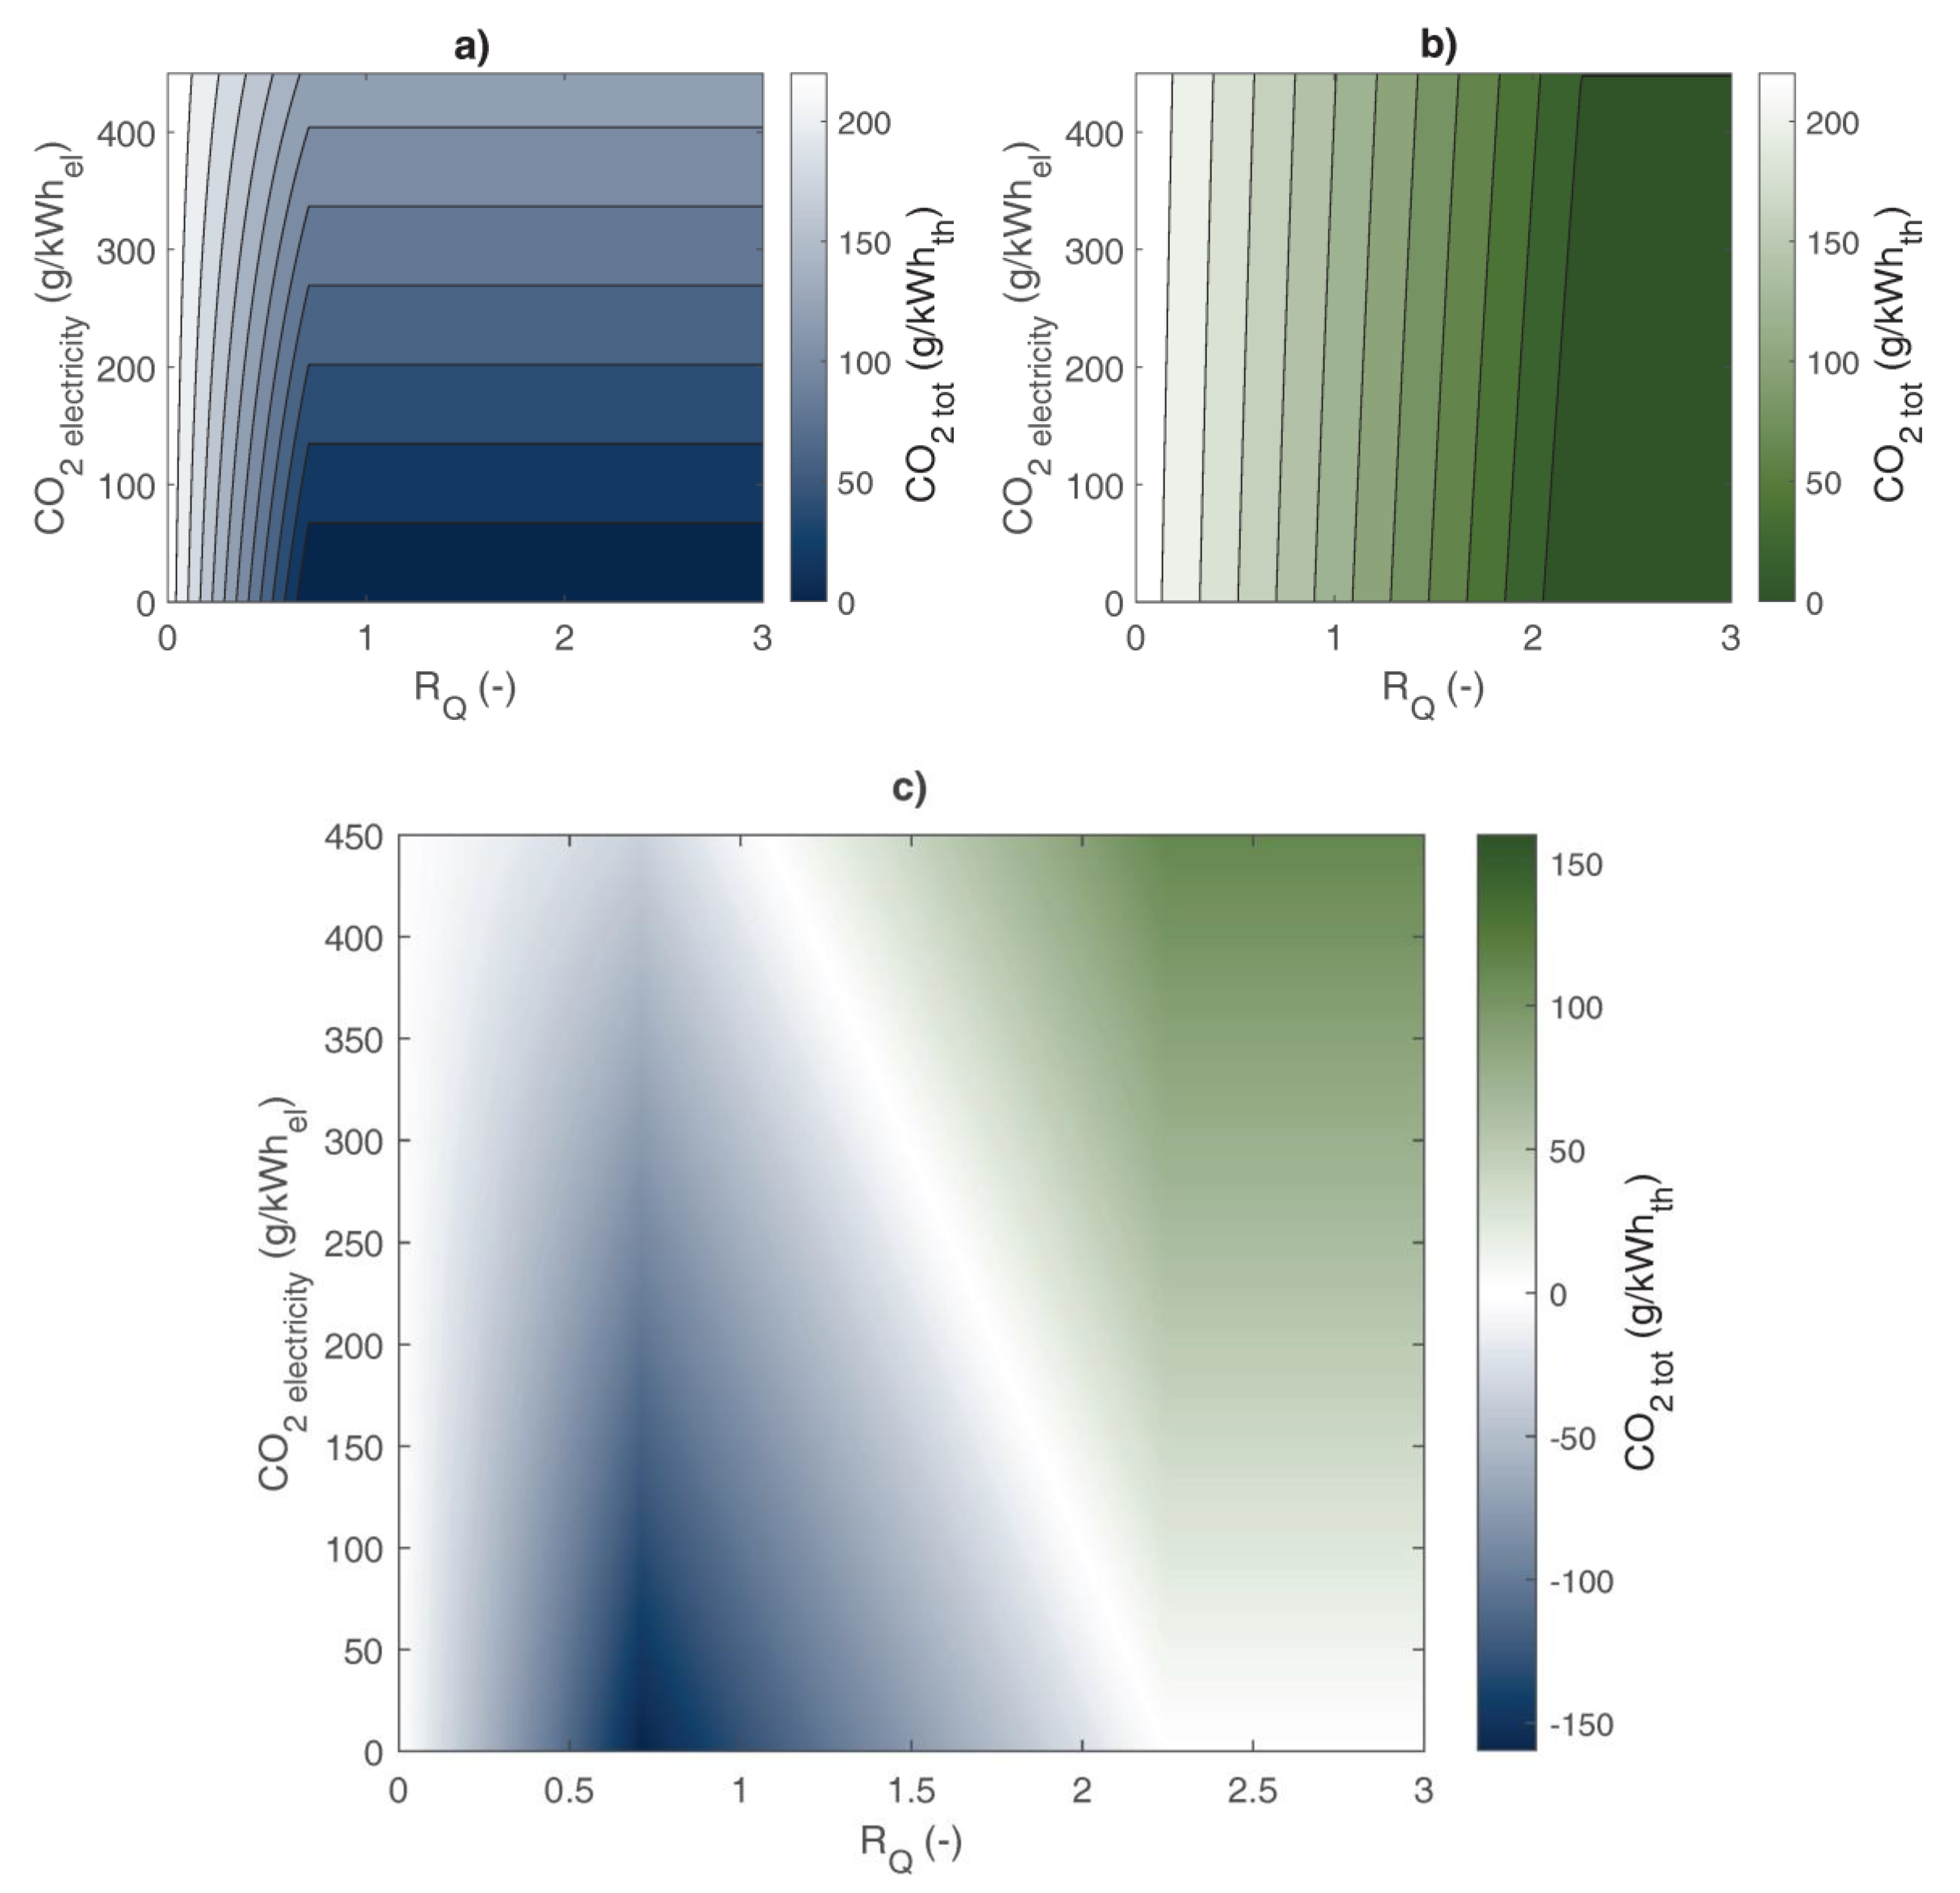
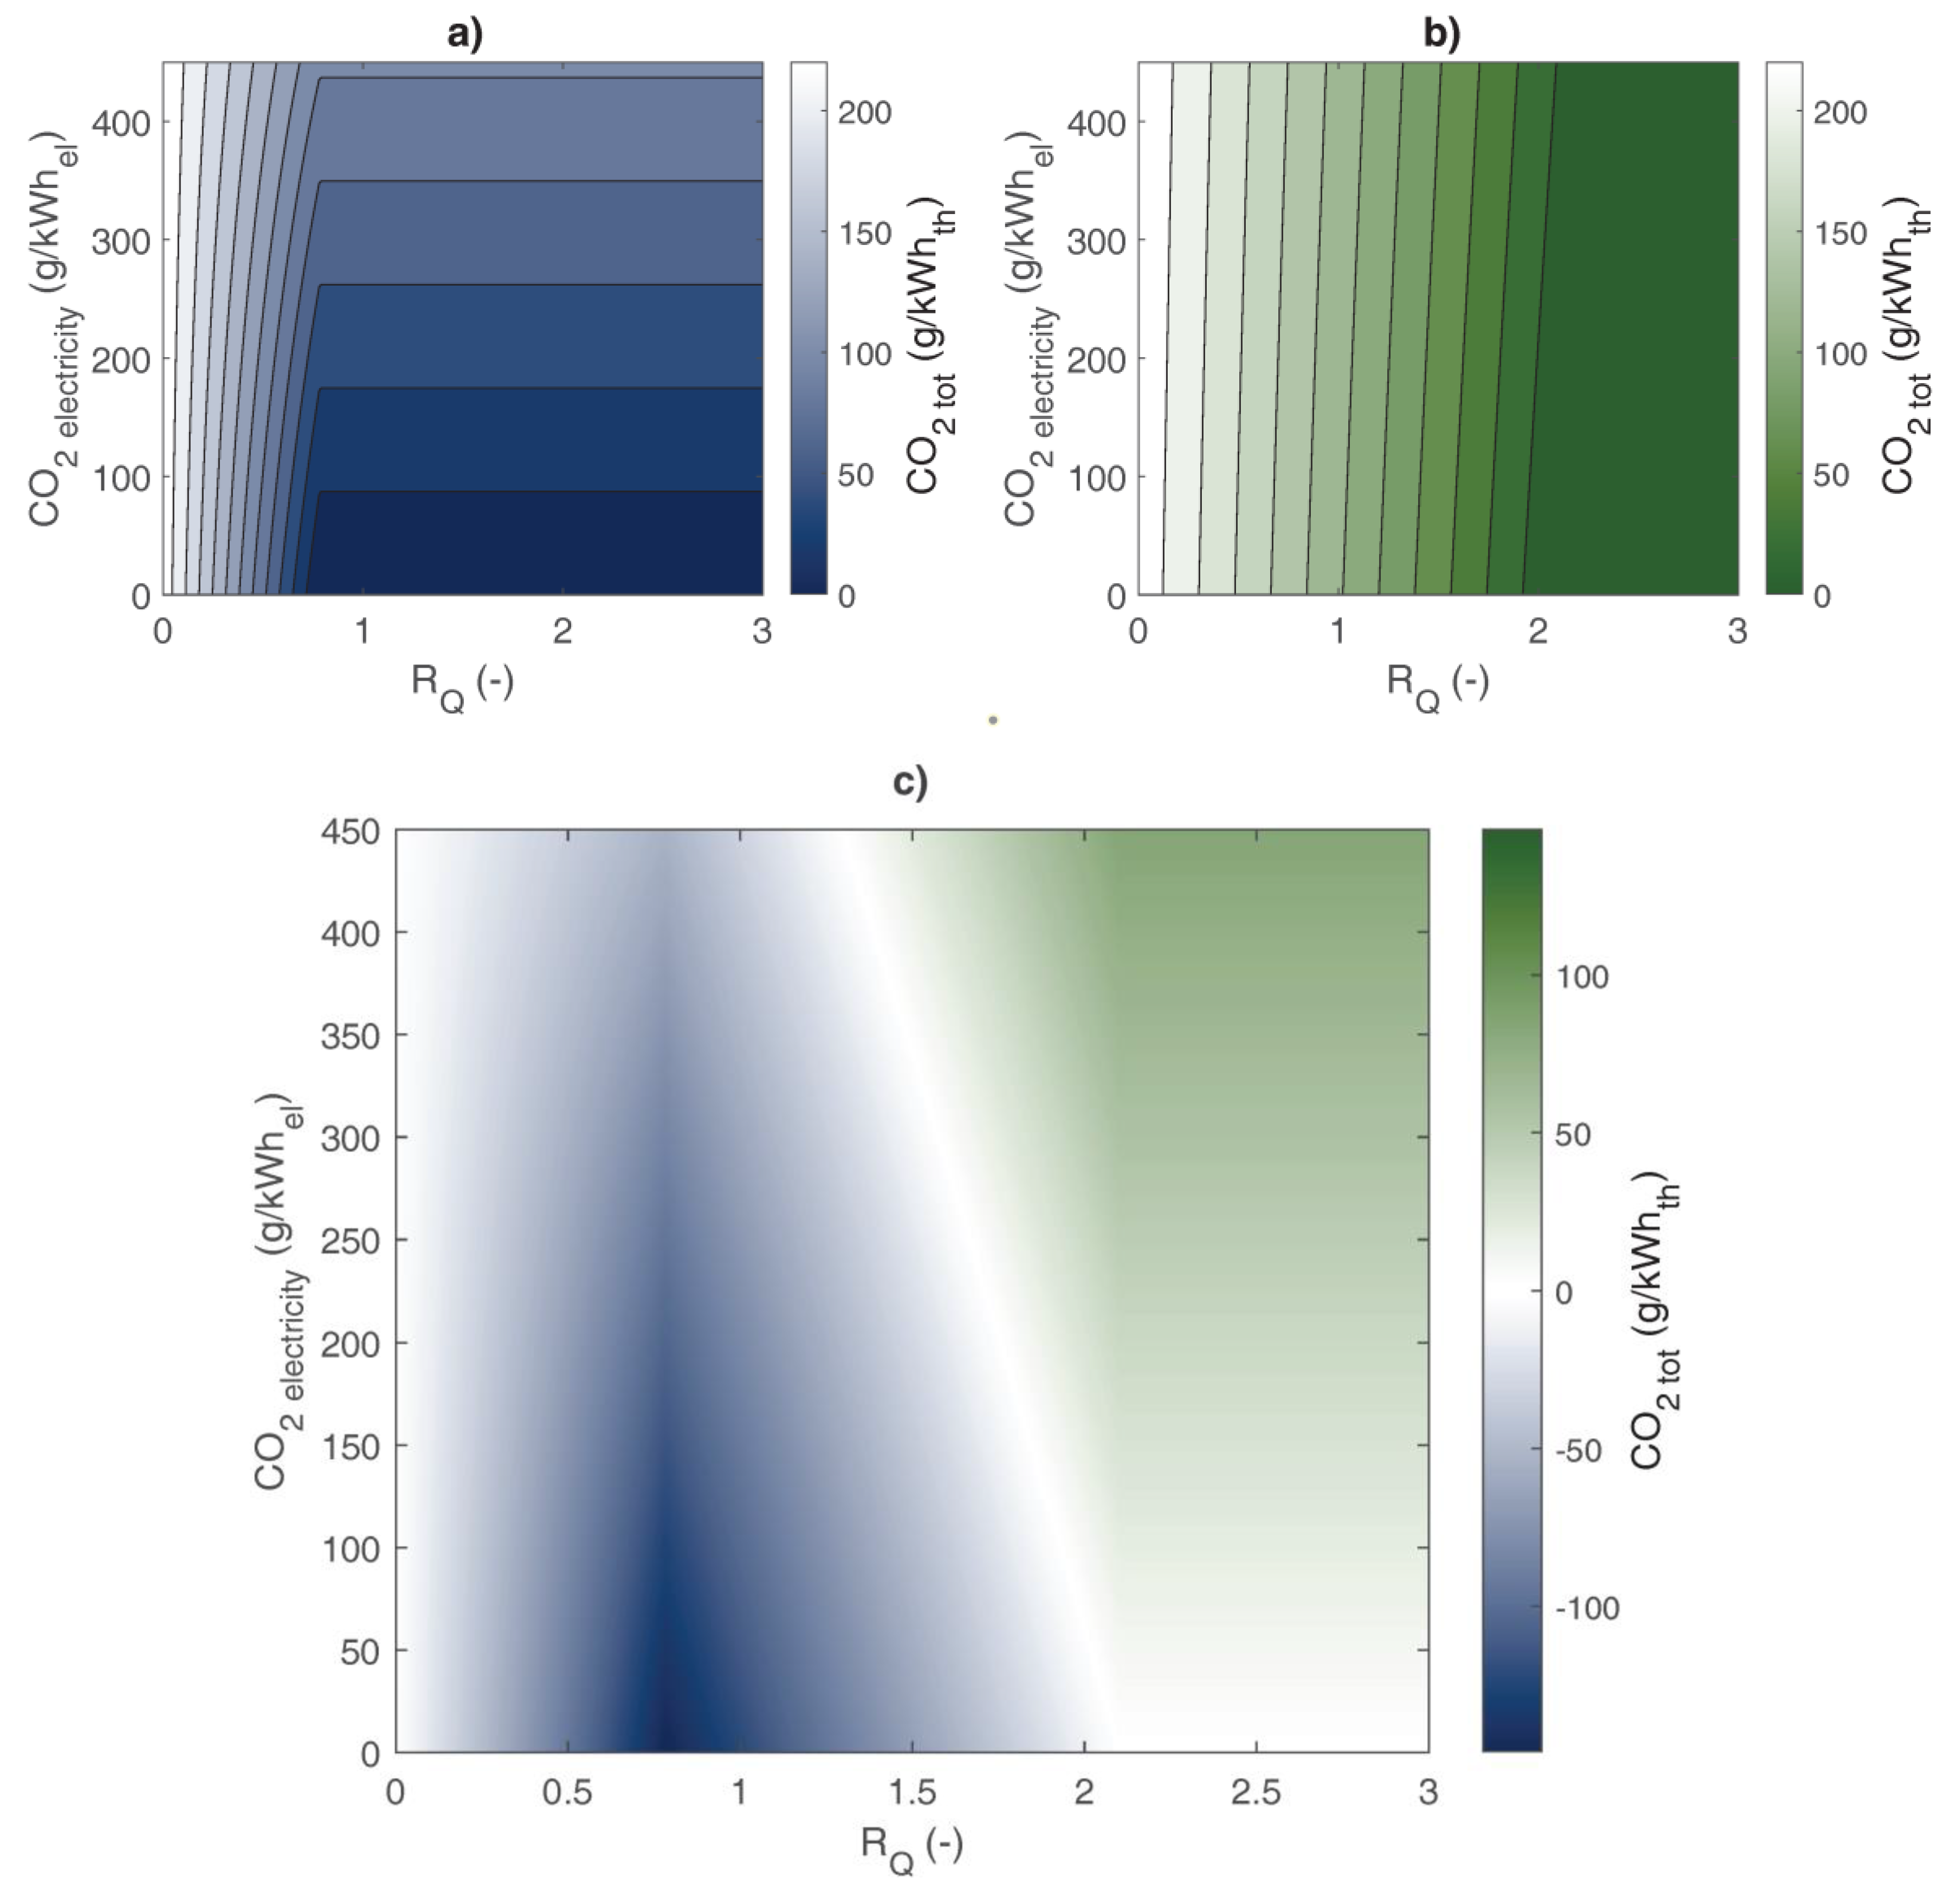
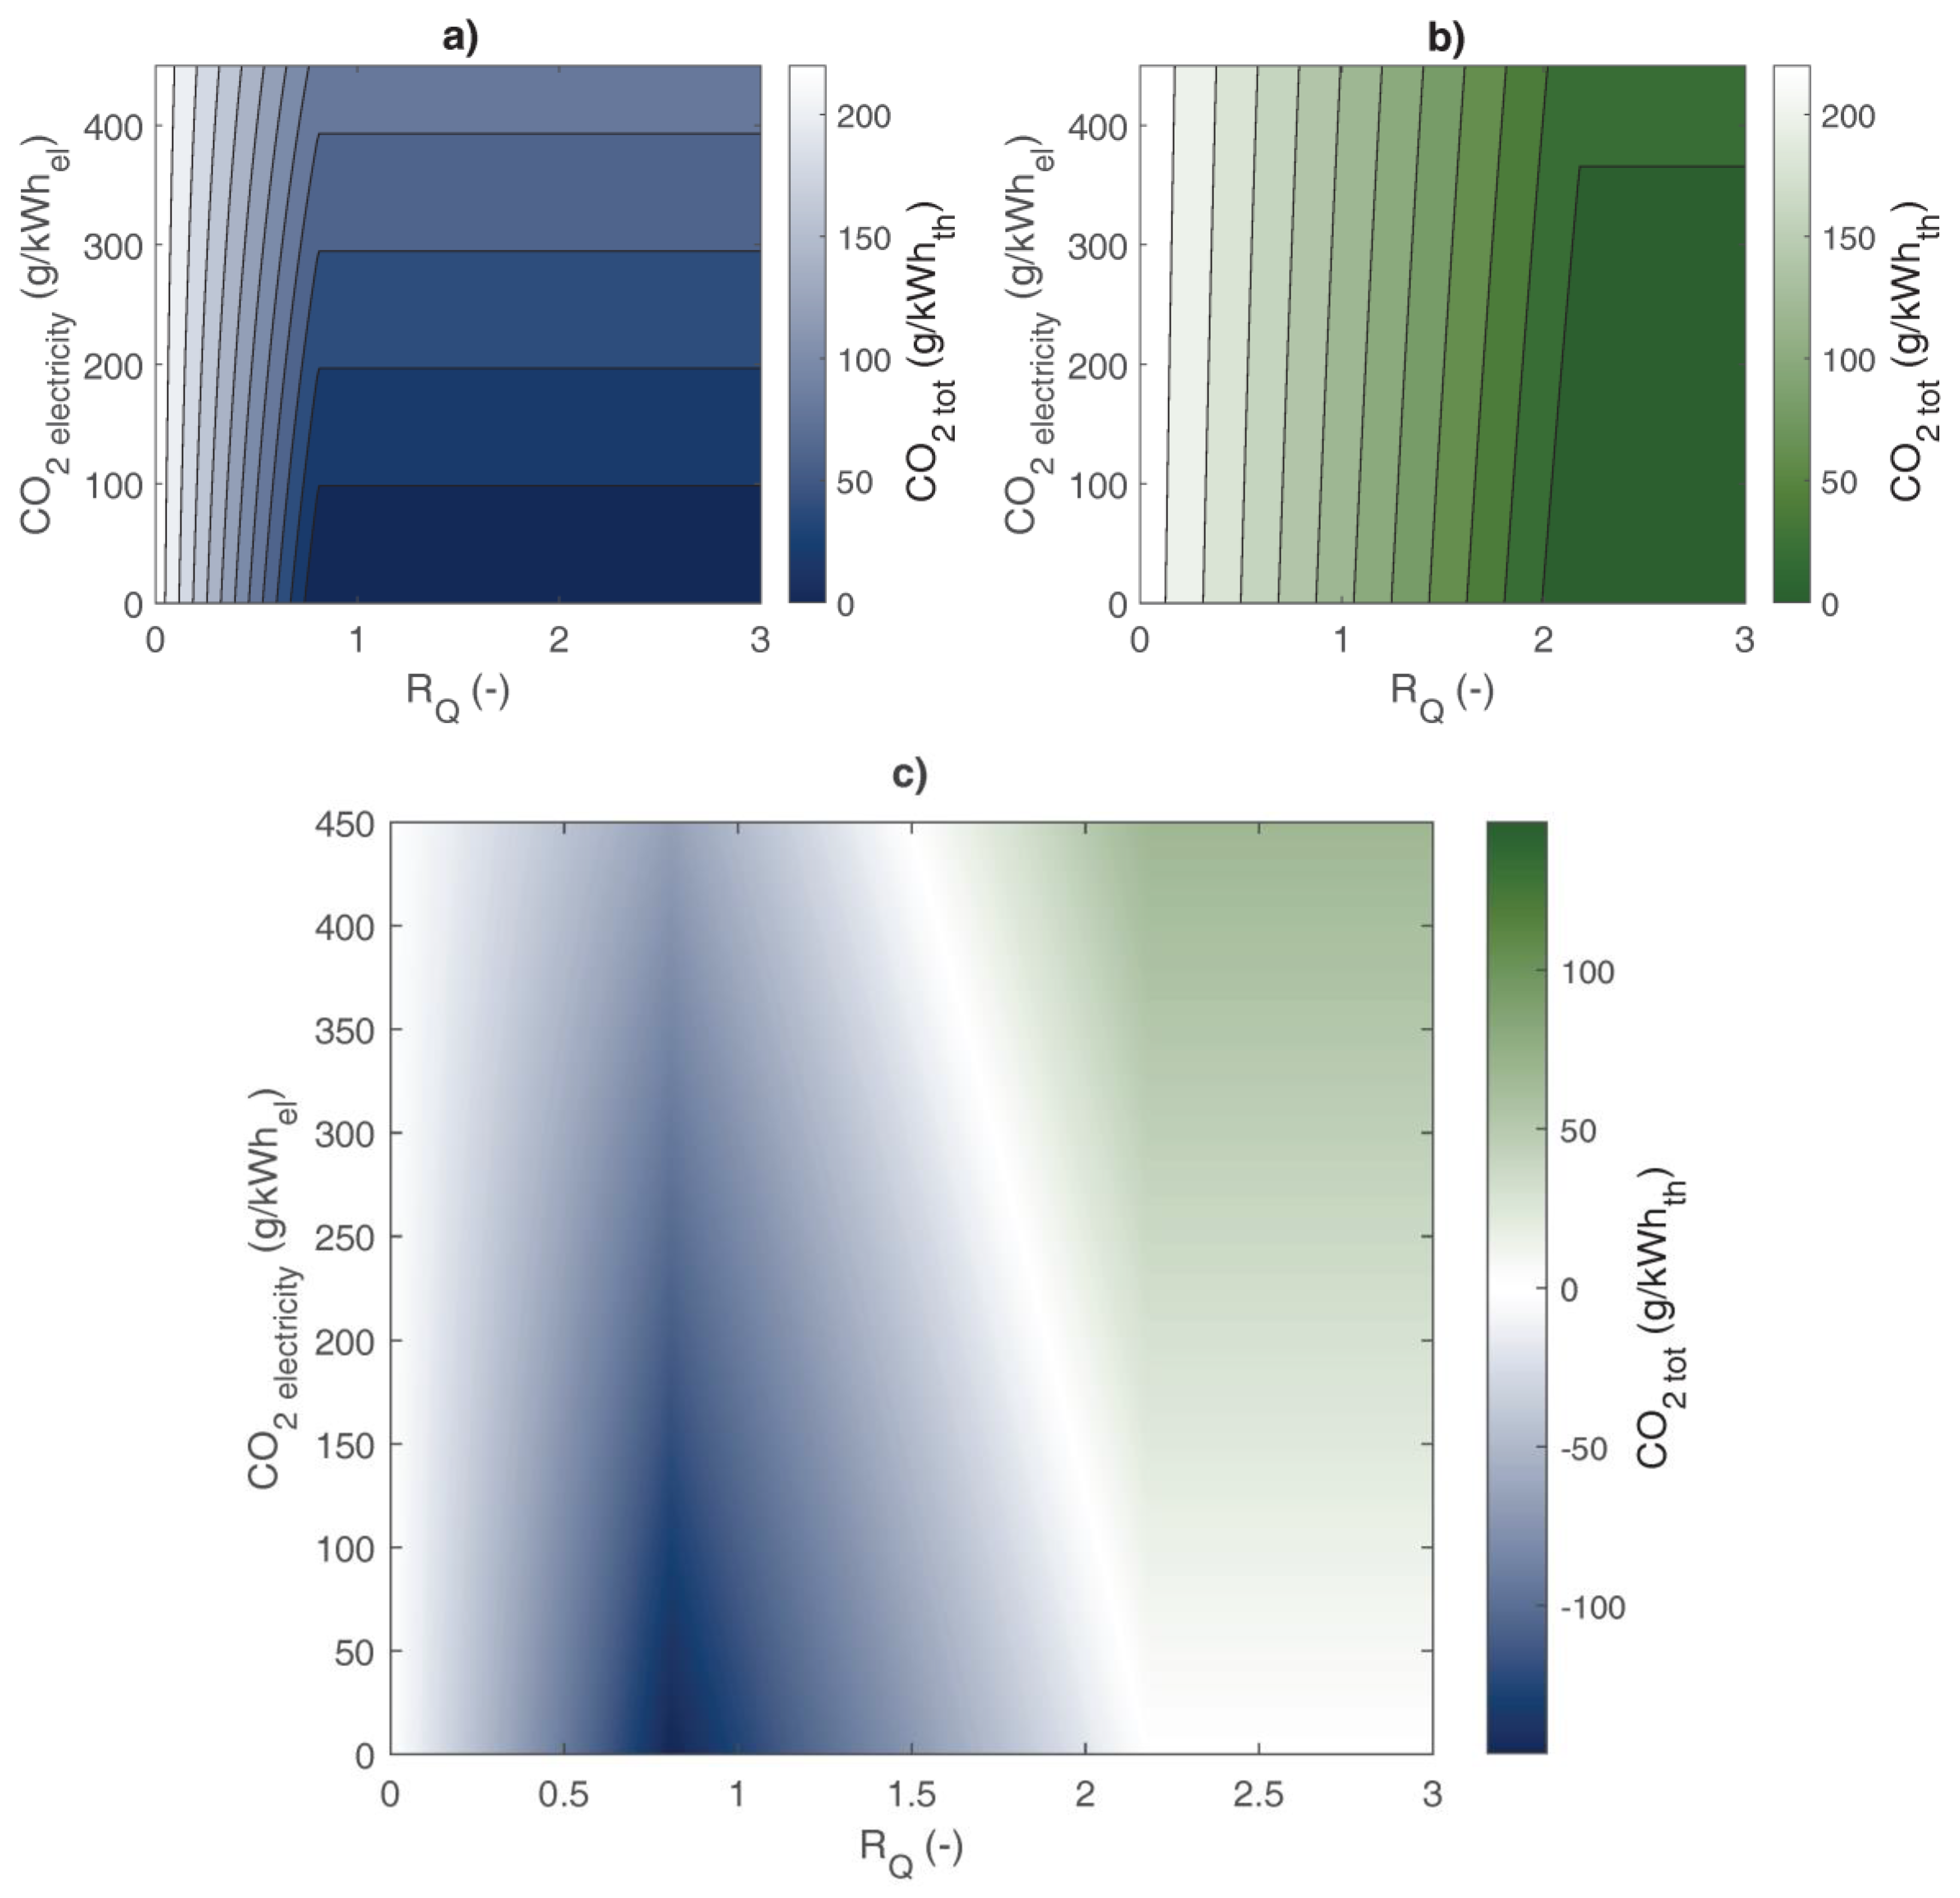
-
The carbon content of electricity in g C O 2 / k W h e l is used in the environmental analysis for the calculation of the C O 2 emissions per unit of Q n e e d . This parameter has particular influence on the emissions associated with the electricity consumption of the HTHP compressor, of the AHT internal pumps and of the circulation pumps of the circuit connected with both the technologies. The carbon content of electricity will be varied between 0 (completely decarbonized electricity) to 450 g C O 2 / k W h e l . A larger impact of this parameter is expected on the solution based on HTHP than on the one based on the AHT.
-
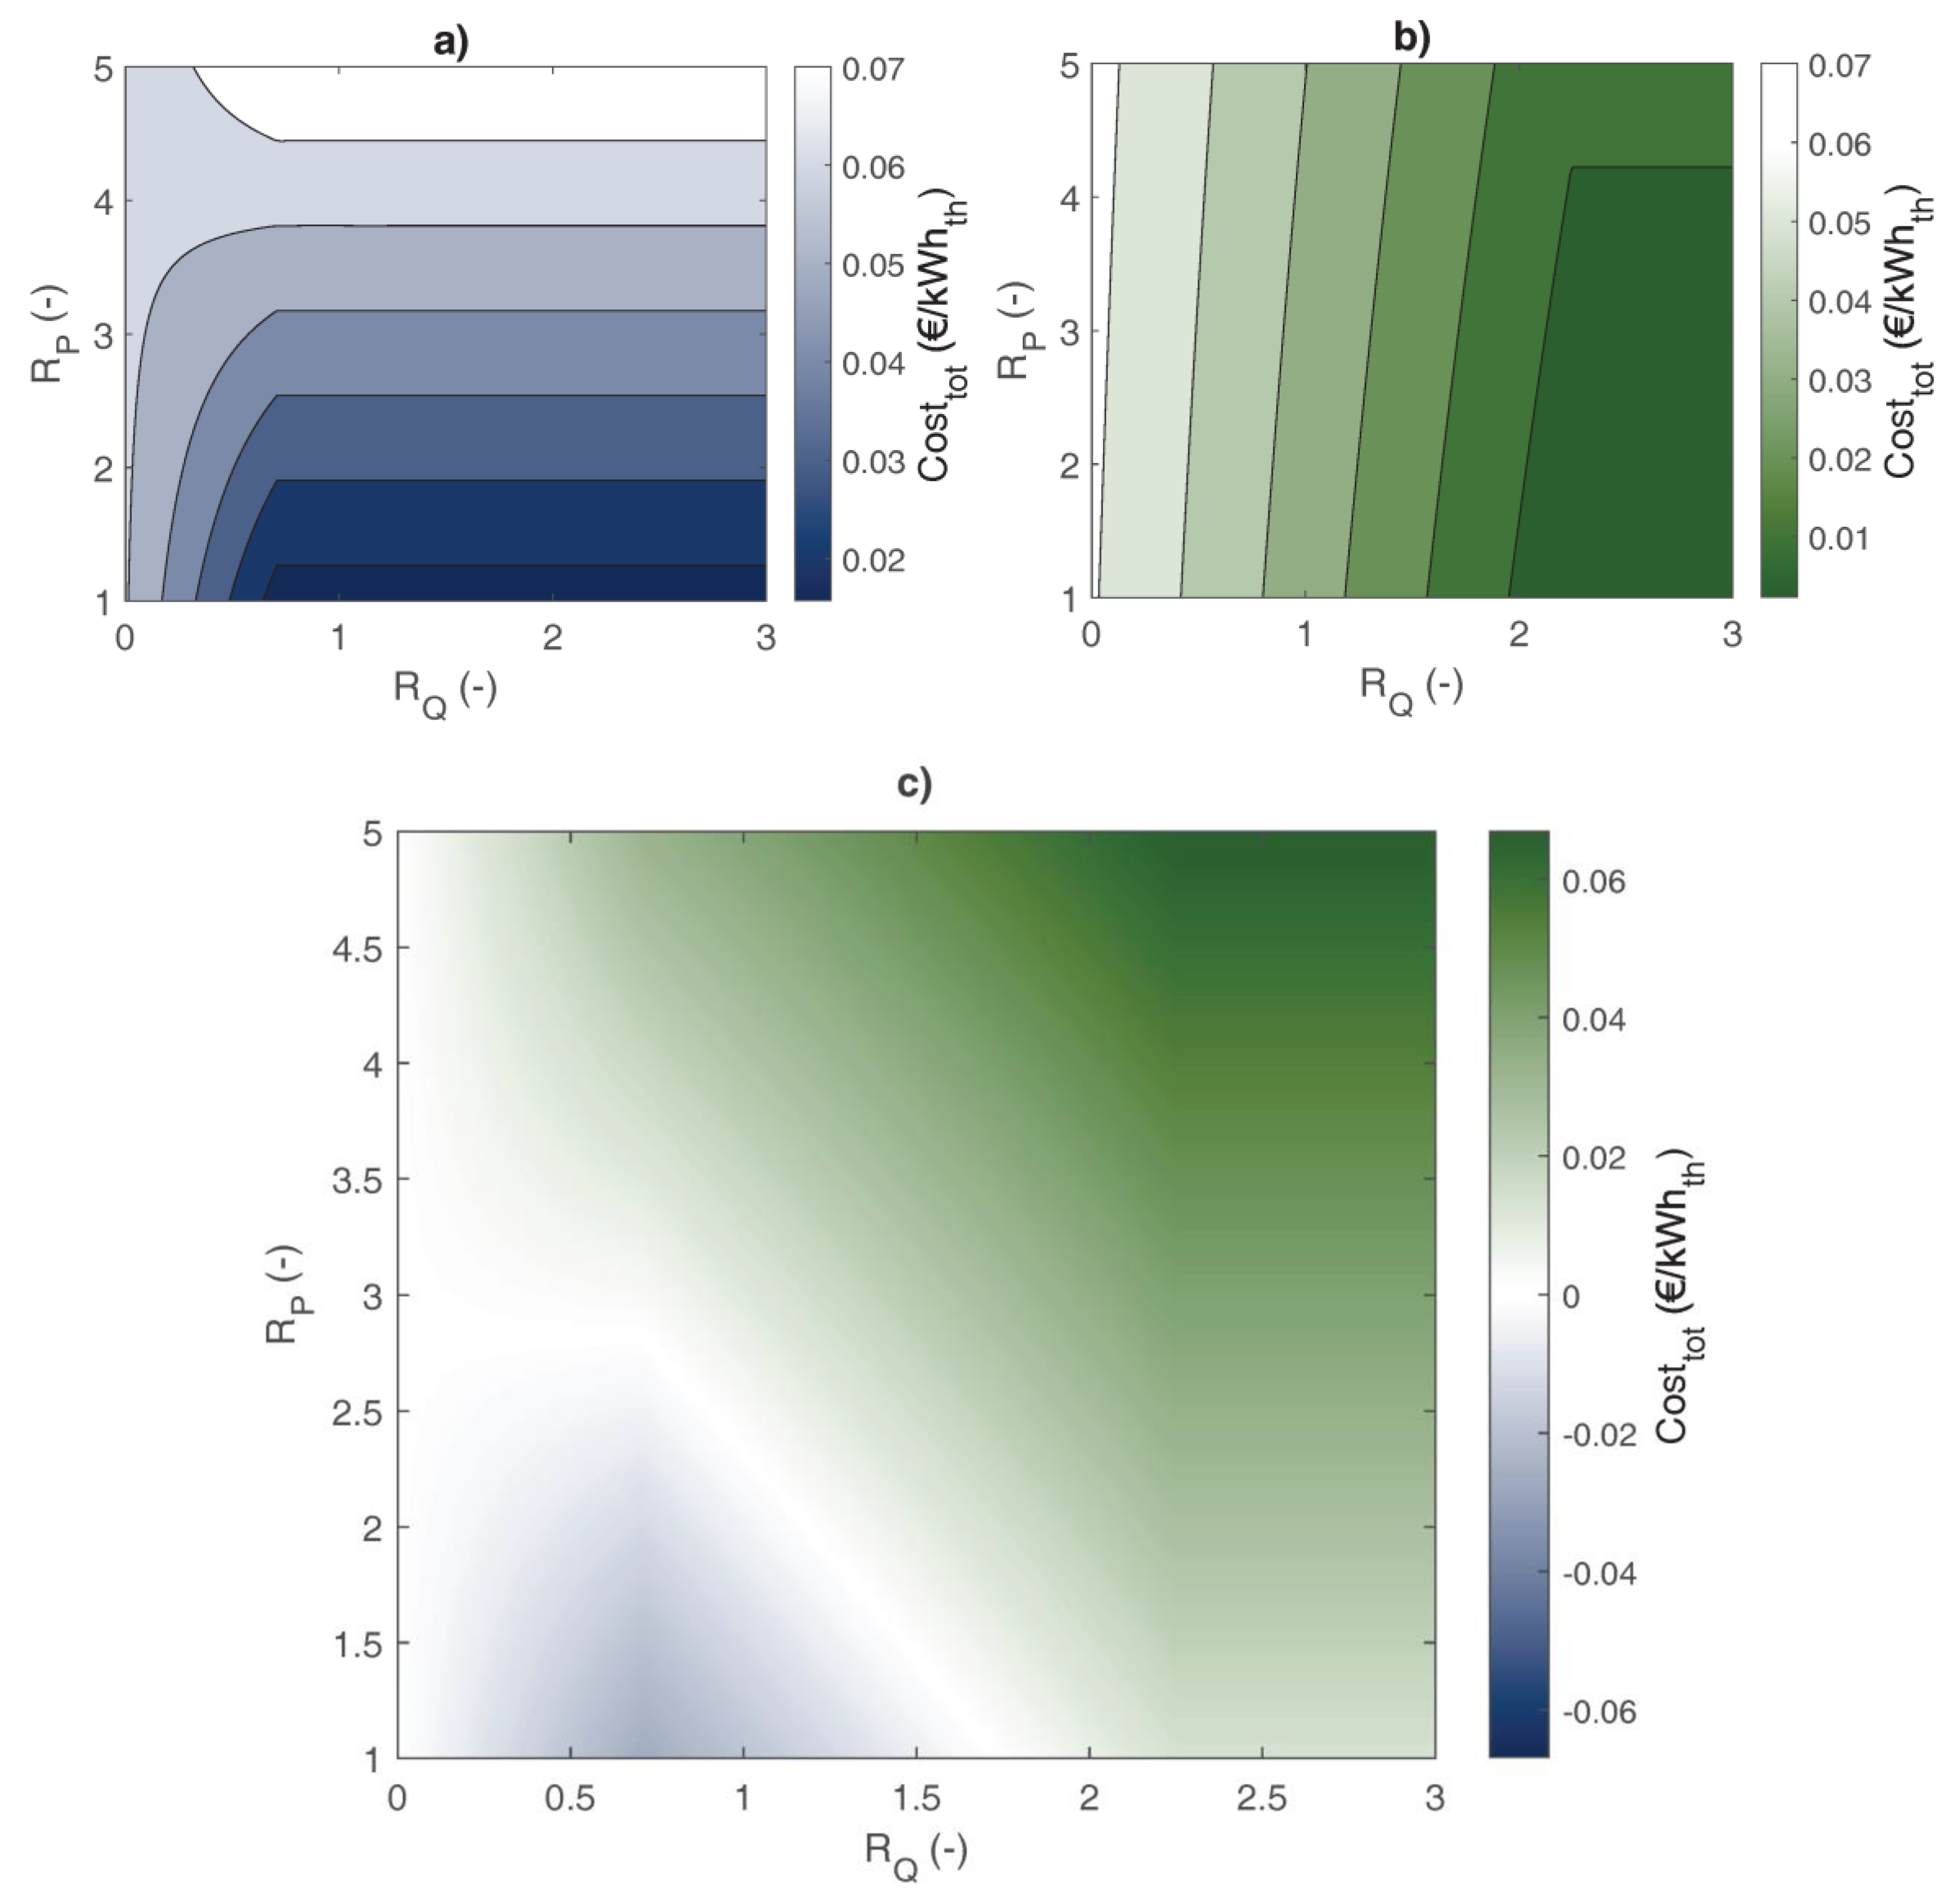
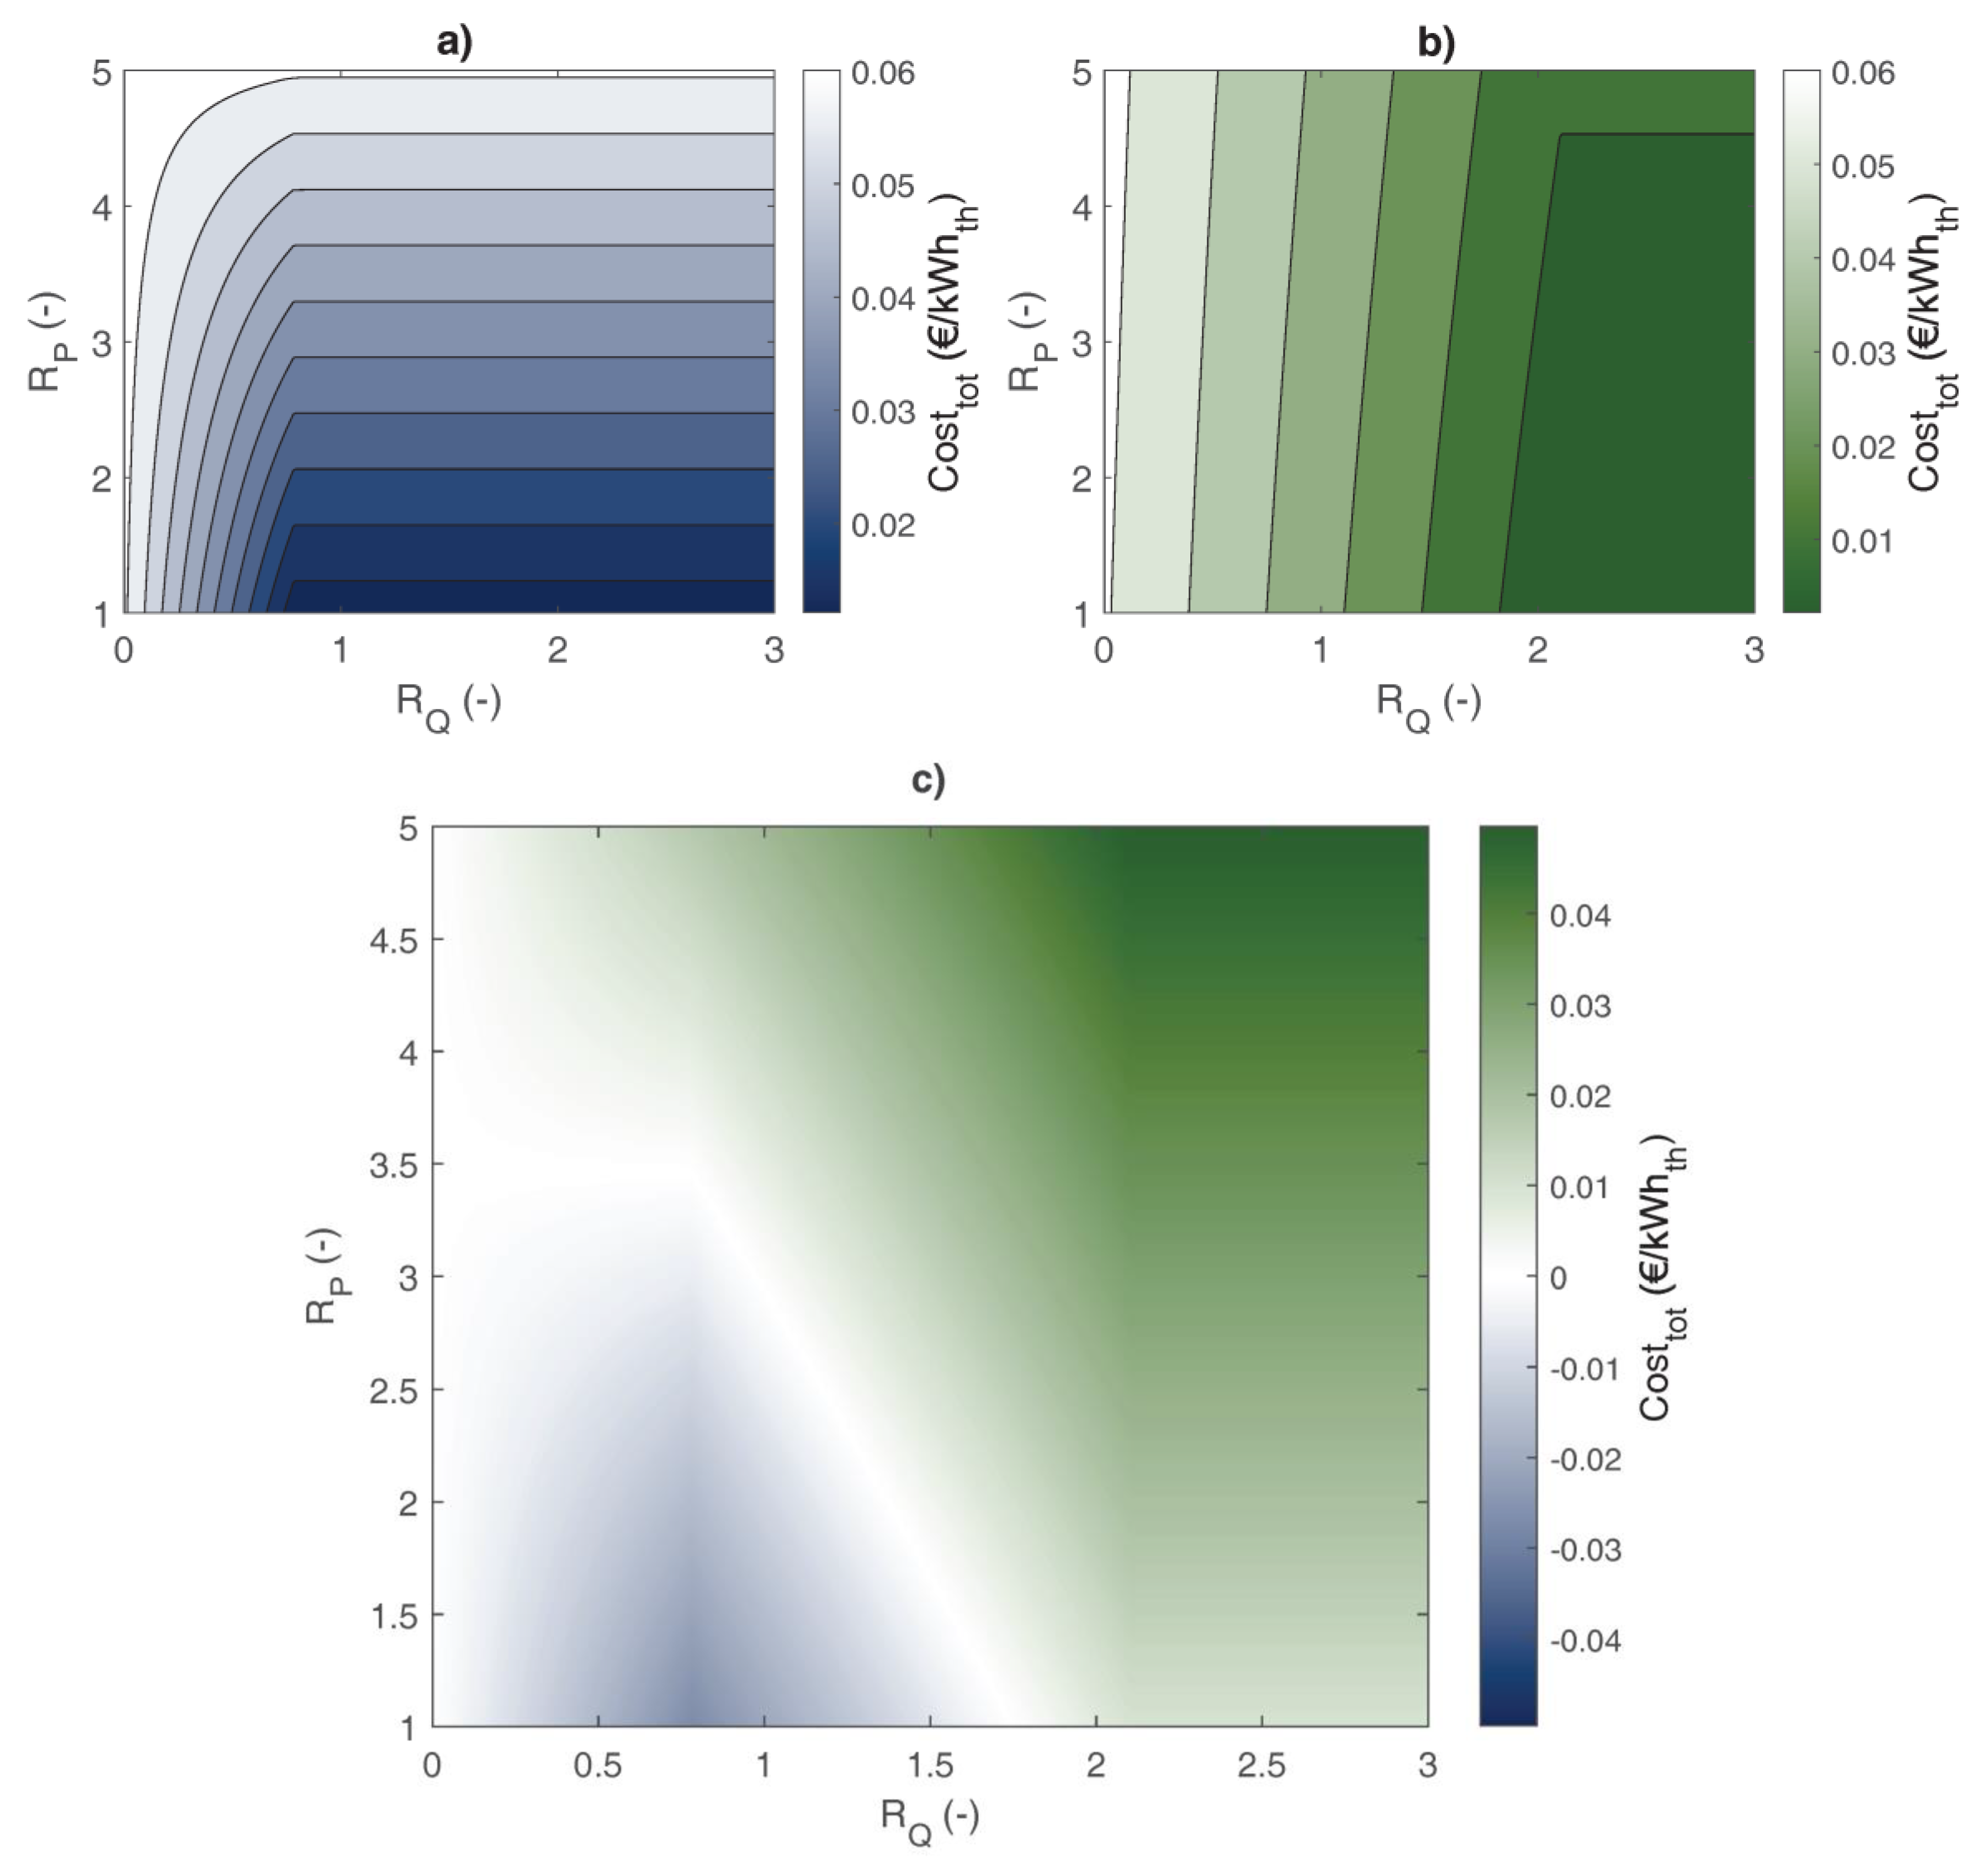
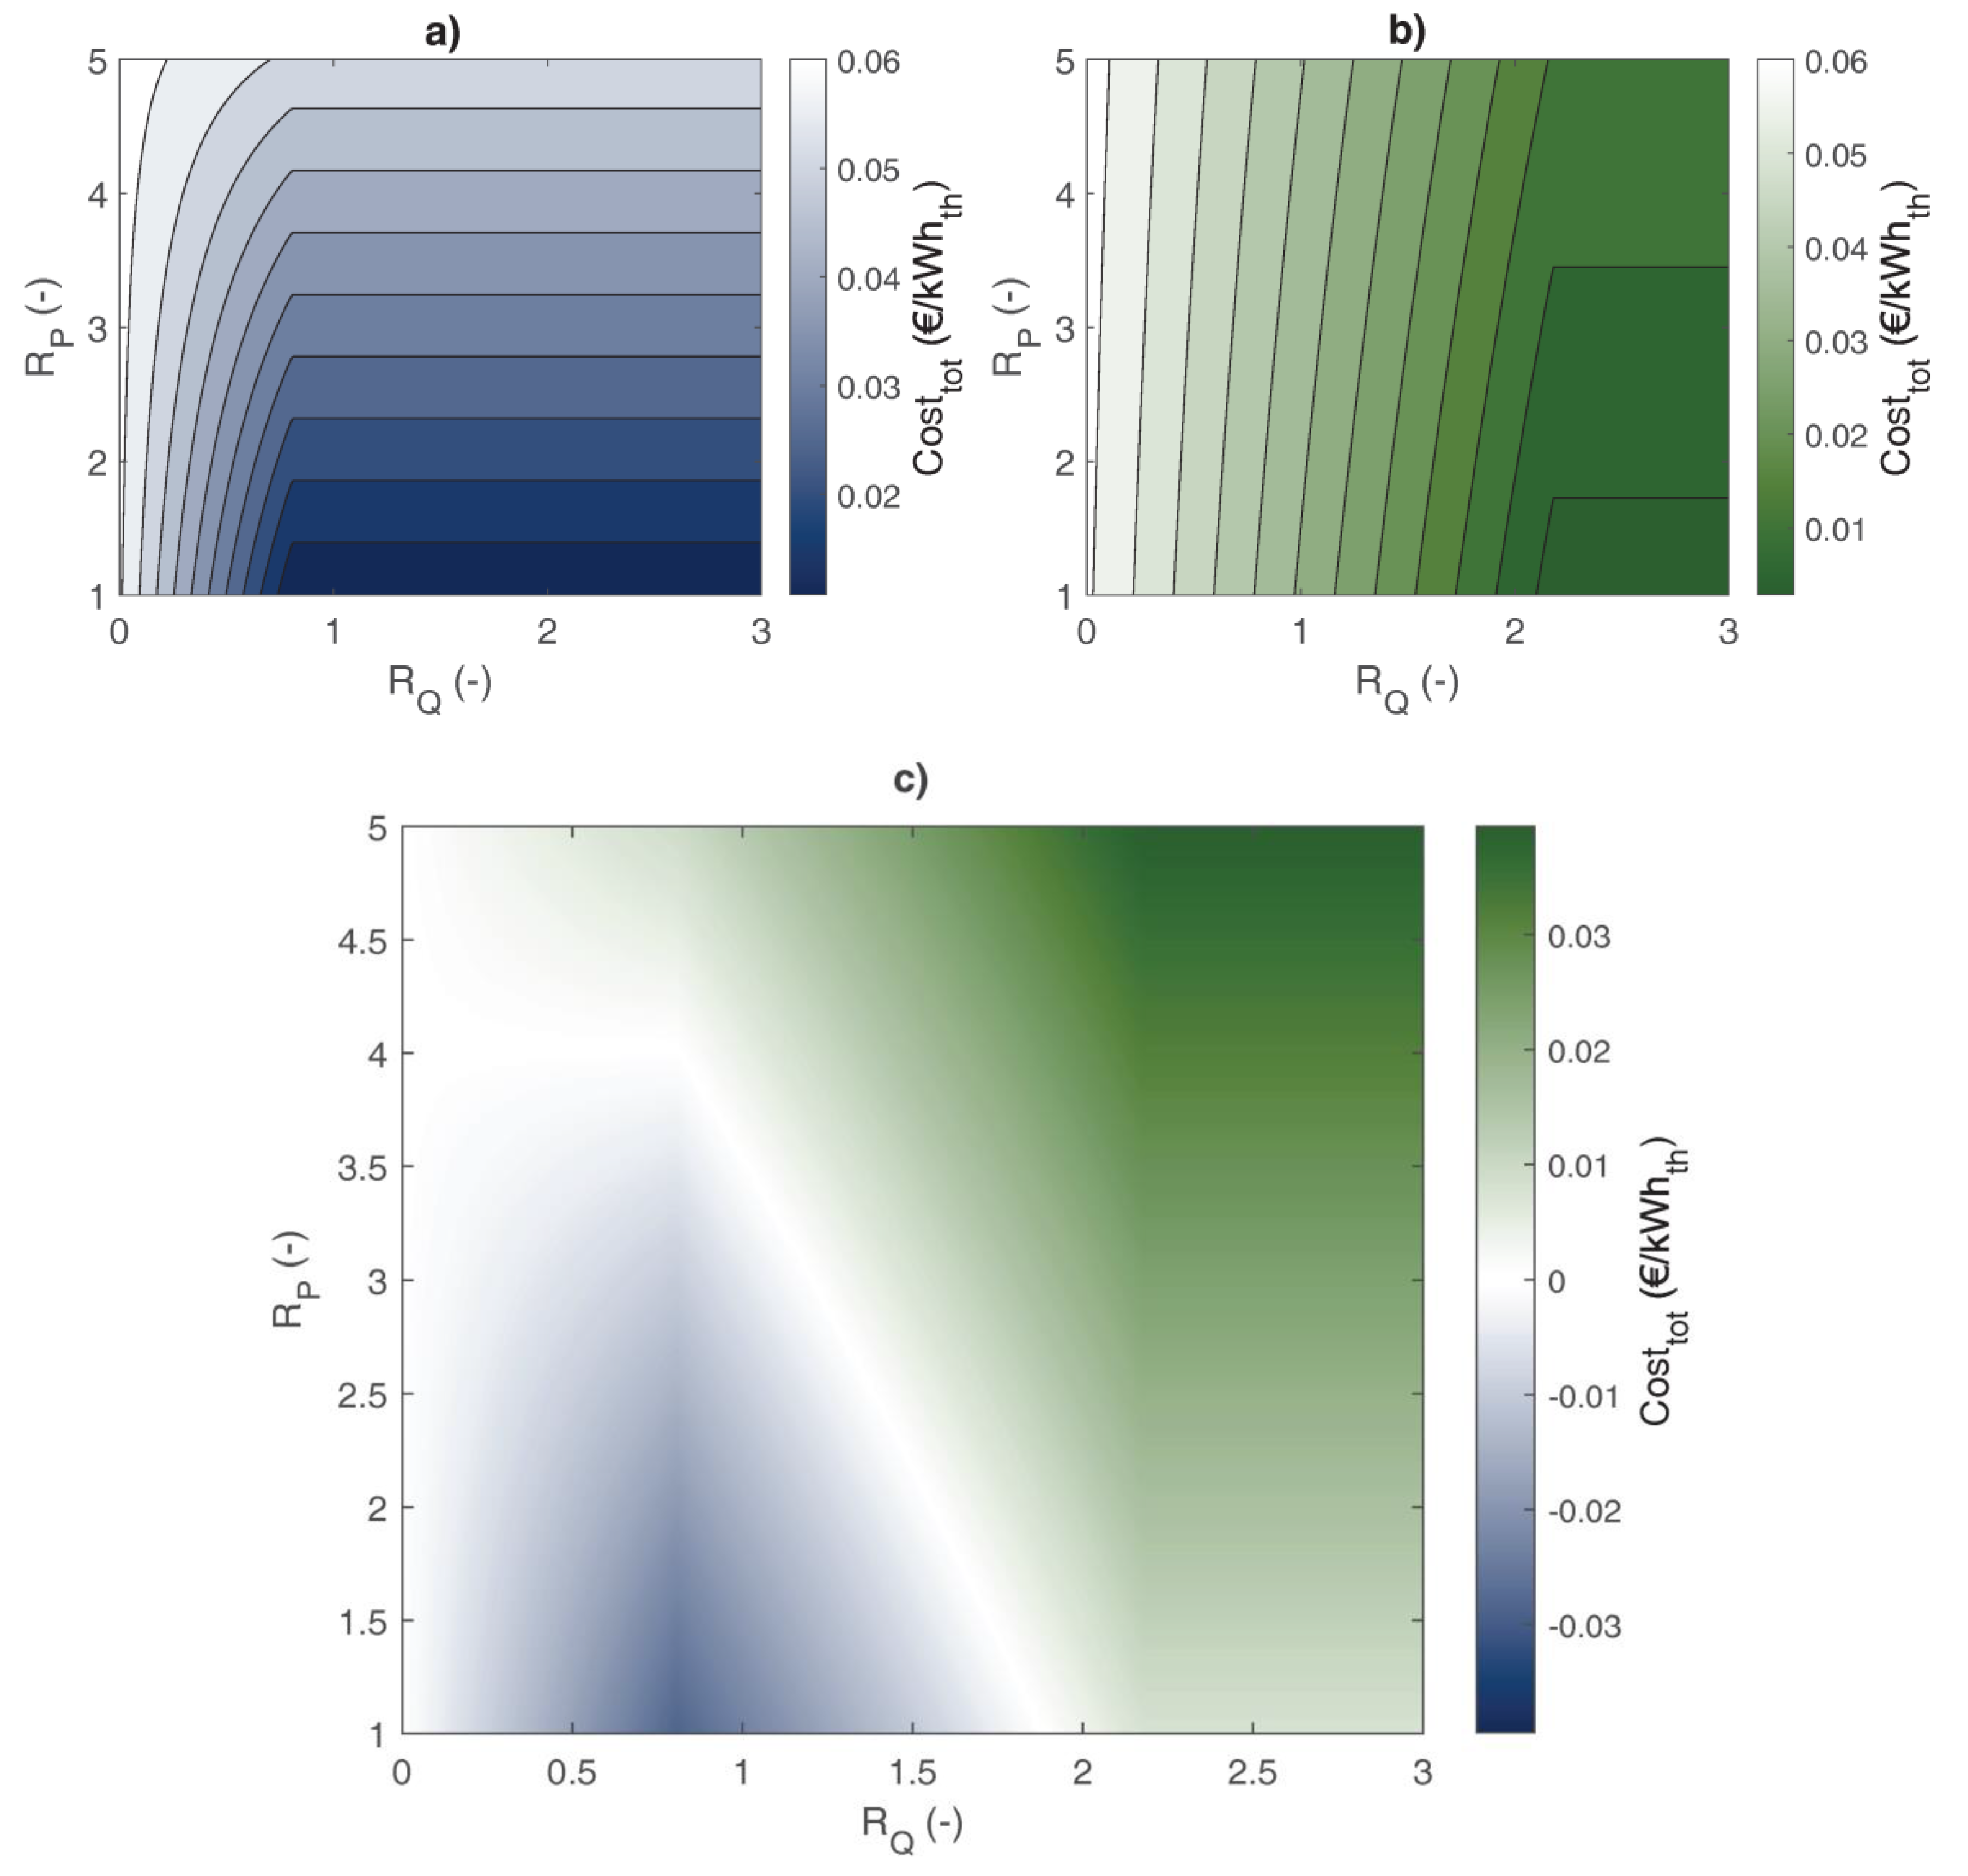
The ratio between electricity and natural gas cost (RP) is used as a parameter for the economic analysis. The range of considered values spans from 1 to 5, i.e., covering cases with equal cost per kWh of the two energy vectors up to cases where the electricity is much more expensive than the natural gas. To provide cost indication for the heat delivered by the system to the user, a natural gas price of 0.053 EUR/kWh [24] has been considered. This choice influences the absolute value of the cost but does not impact the comparison between the two technological options, since the electricity price is calculated as a function of the natural gas price. Thus, the thresholds and trends presented in Section 4 are applicable independently of the gas price.
Greenhouse gas emissions ( C O 2 t o t ) are calculated as shown in Equation (1), where electrical ( W e l ) and natural gas ( Q N G ) energy needed for producing a unit of high temperature are multiplied by the related C O 2 emission coefficient. While for electricity the emission coefficient varies in the mentioned range, for natural gas a constant value of 205 g C O 2 / k W h t h has been used. Similarly, operative costs ( C o s t t o t ) are calculated in Equation (2), multiplying electricity and natural gas consumptions by their specific costs.
C O 2 t o t = Q N G   C O 2 N G + W e l   C O 2 e l
C o s t t o t = Q N G   C o s t N G + W e l   C o s t e l

2.2. AHT + Boiler System

In the system based on the heat transformer, the amount of upgraded heat ( Q U P ) is calculated based on Equation (3), where the thermal COP C O P T H depends on working conditions, as described in Section 3.1. Q U P is set equal to Q n e e d if Q U P calculated in Equation (3) is greater than Q n e e d . The discharged heat ( Q D I S ) is calculated by imposing the energy balance to the heat transformer as in Equation (4), neglecting the heat losses and the contribution of the internal pumps to the thermal energy balance.
Q U P = C O P T H · Q w a s t e
Q D I S = 1 C O P T H C O P T H   Q U P
The heat provided by the gas boiler ( Q b o i l e r ) is calculated as the difference between Q n e e d and Q U P and can be zero when the amount of waste heat is sufficient for the heat transformer to produce the required Q n e e d .
As for Equation (5), the natural gas consumption is given by the ratio between Q b o i l e r and the efficiency of the boiler ( η b o i l e r ), obtained as described in Section 3.3. Electricity consumptions of heat transformer ( W H T e l ) and boiler ( W b o i l e r ) are calculated in Equations (6) and (7) where C O P e l , A H T and boiler’s auxiliary consumptions ( a u x b o i l e r ) are provided in Section 3.1 and Section 3.3, respectively.
Q N G = Q b o i l e r η b o i l e r
W A H T   e l = Q U P C O P e l , A H T
W b o i l e r   e l = Q b o i l e r   a u x b o i l e r

2.3. HTHP + Boiler System
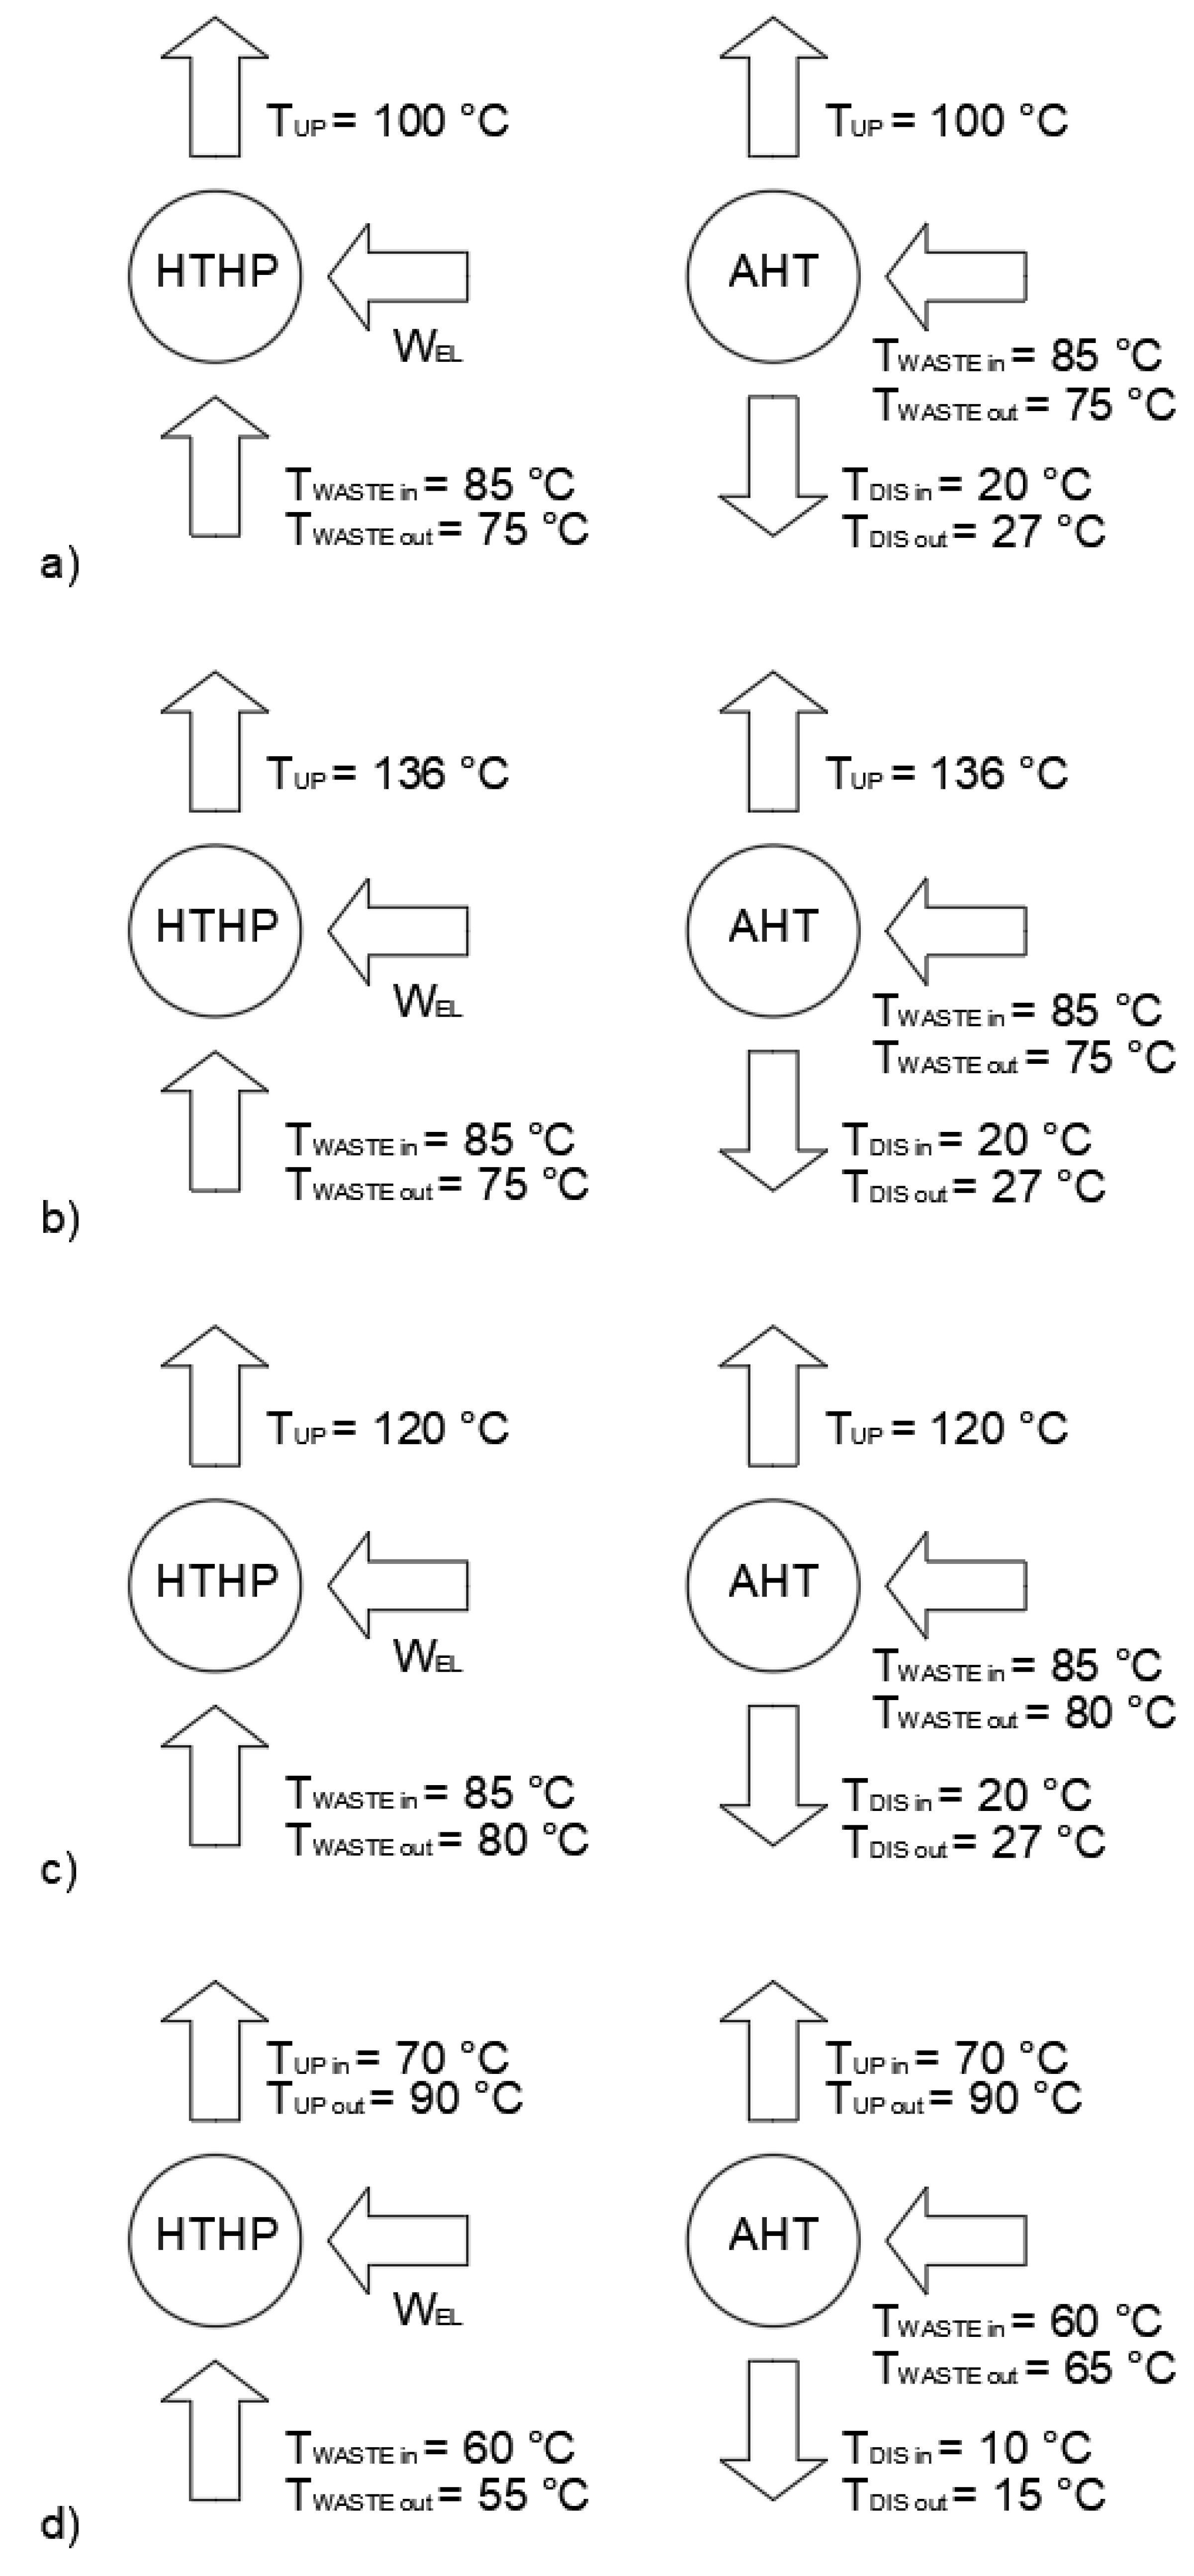
The heat pump receives waste heat as input at the evaporator and upgrades it to provide the upgraded heat ( Q U P ) . Q U P is calculated as in Equation (8), neglecting the heat losses as for the AHT, where the C O P H P depends on source and sink temperatures as described in Section 3.2. Q U P is set equal to Q n e e d if Q U P calculated in Equation (8) is greater than Q n e e d . The electricity consumption of the compressor is calculated in Equation (9).
Q U P = Q w a s t e C O P H P C O P H P 1
W H P e l = Q U P C O P
The heat provided by the gas boiler ( Q b o i l e r ) is calculated as the difference between Q n e e d and Q U P , and its natural gas consumption is the ratio between Q b o i l e r and η b o i l e r , obtained as in Section 3.2. Auxiliaries’ electricity consumptions are calculated as in Section 3.2

2.4. Case Studies

A comparison between AHT and HTHP is conducted considering four case studies with realistic working conditions, in which both technologies may be valid options to fulfil the demand (see Table 1). The temperature range of T U P is between 90 °C and 136 °C, a range considered suitable for several commercial HTHPs [5] and of interest to many users [15]. T w a s t e range has been chosen as 60–85 °C, which is suitable for obtaining reasonable performance from heat upgrade technologies and is relevant to the industry since it includes the discharge temperature of many processes. Based on these considerations, four case studies have been defined for analysis:
  • Desalination: process driven by heat from a cogeneration plant, with heat rejection through a cooling tower.
  • Carbon capture: regeneration of the ammines in a carbon-capture process driven by heat from a cogeneration plant and with heat rejection through a cooling tower.
  • Industrial steam: steam generation at 2 bar for an industrial process driven by the condensation loop of a distillation column and with condensation heat rejected through a cooling tower.
  • District heating: medium temperature district heating network driven by waste heat from data centers with ground water for the heat rejection.
The relevant temperatures of the case studies are summarized in Table 1 in the form of inlet-outlet values. A single value is reported when the external stream is isothermal, as in the case of phase change. Figure 2 shows the schemes of the analysed technologies with inlet and outlet temperatures for every case study.

3. Modelling Approach

This chapter presents the modelling approach of the different energy technologies, including the heat transformer, heat pump, gas boiler and auxiliary hydraulic loops. Different approaches have been used for the technologies, chosen to provide sufficiently accurate results without requiring too much case specific information, which would make the results less generalisable. The models have been used within their boundaries of application, to assure reliable results.

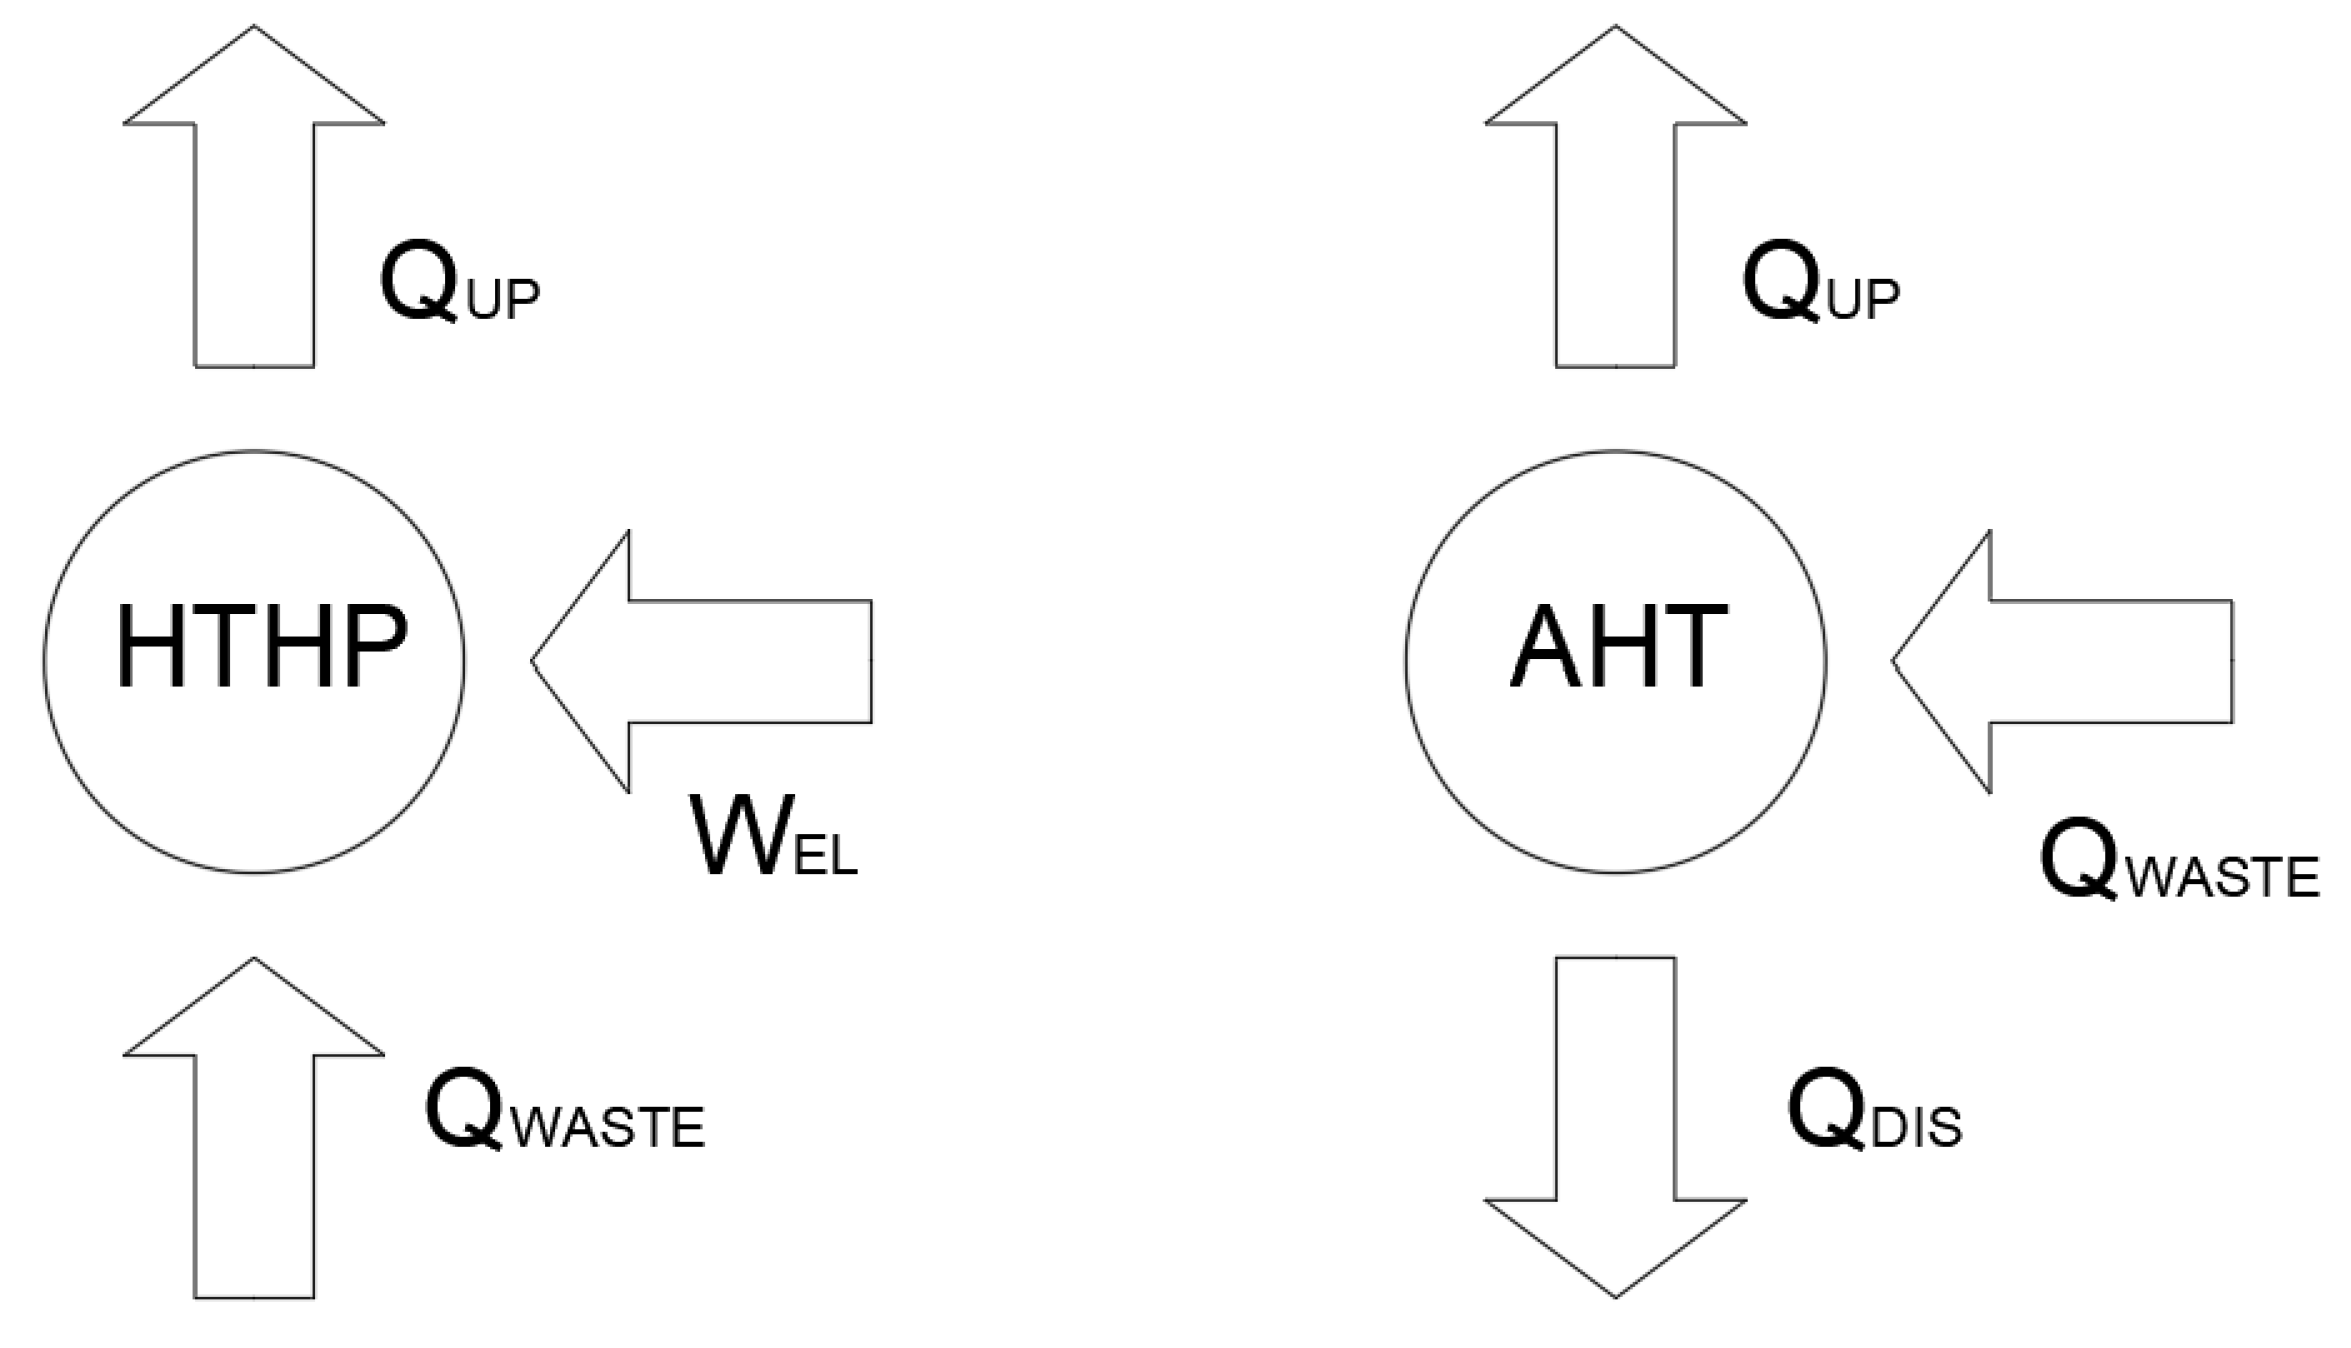
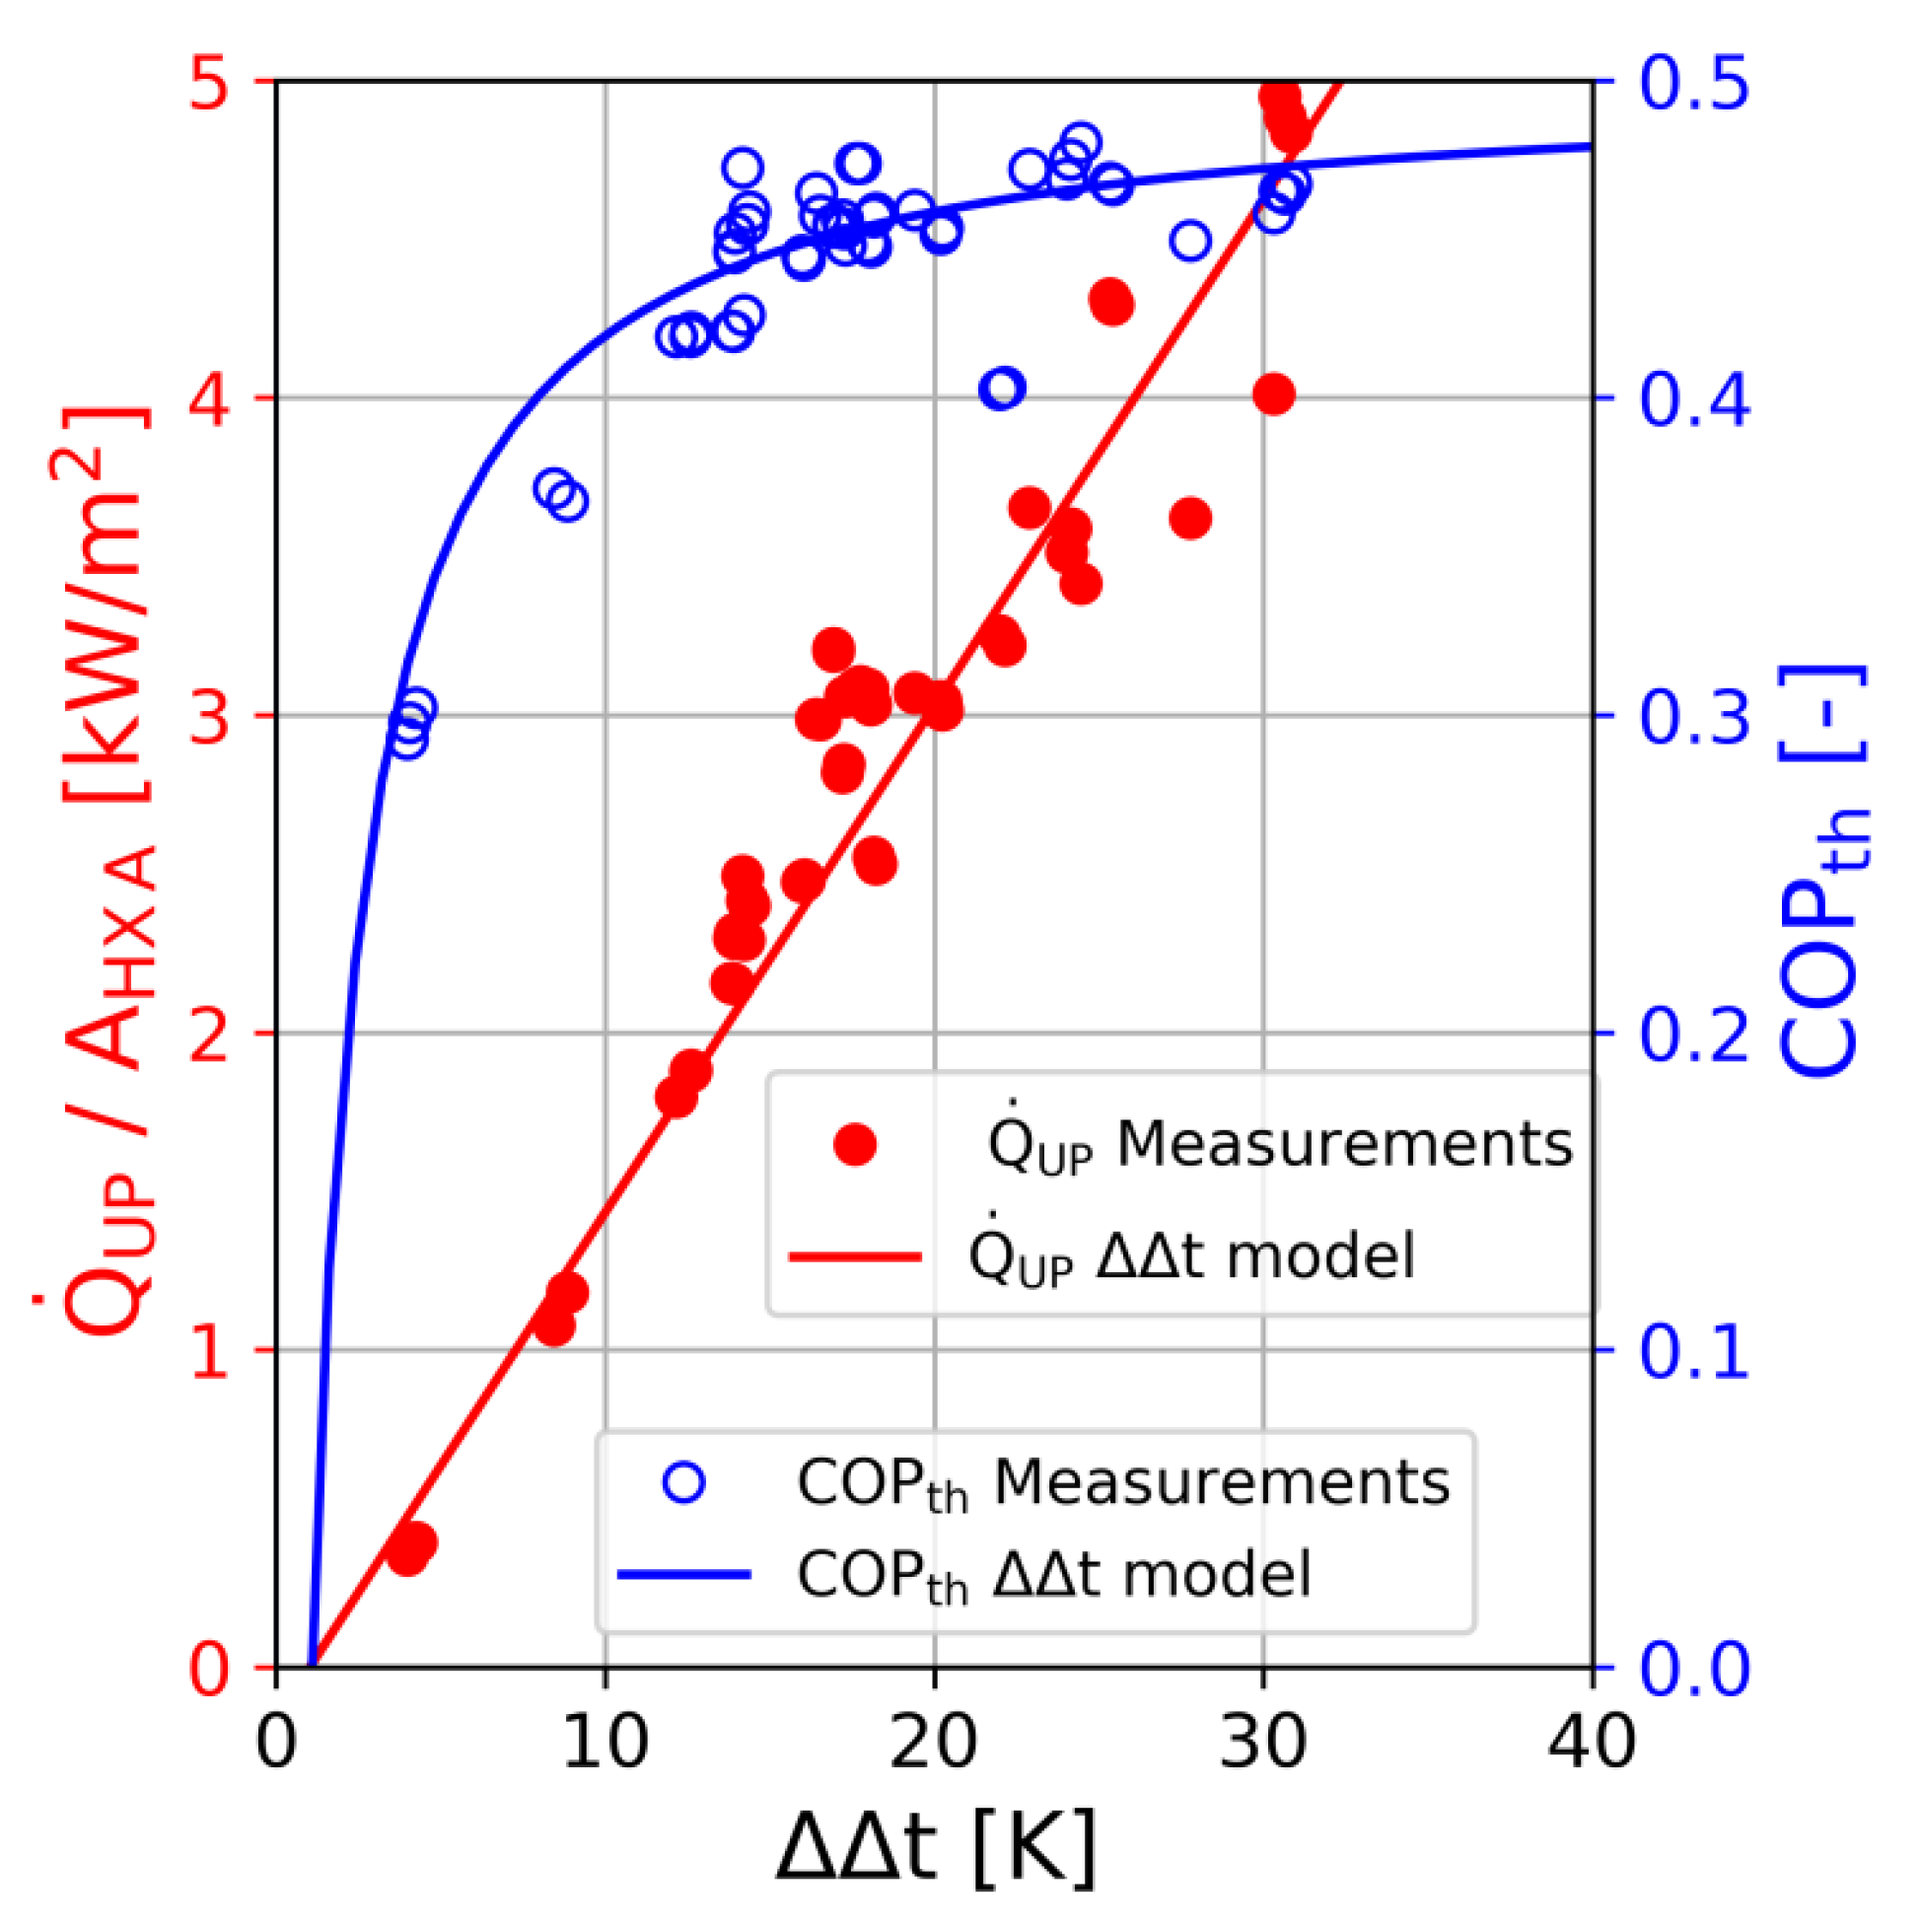
3.1. Heat Transformer
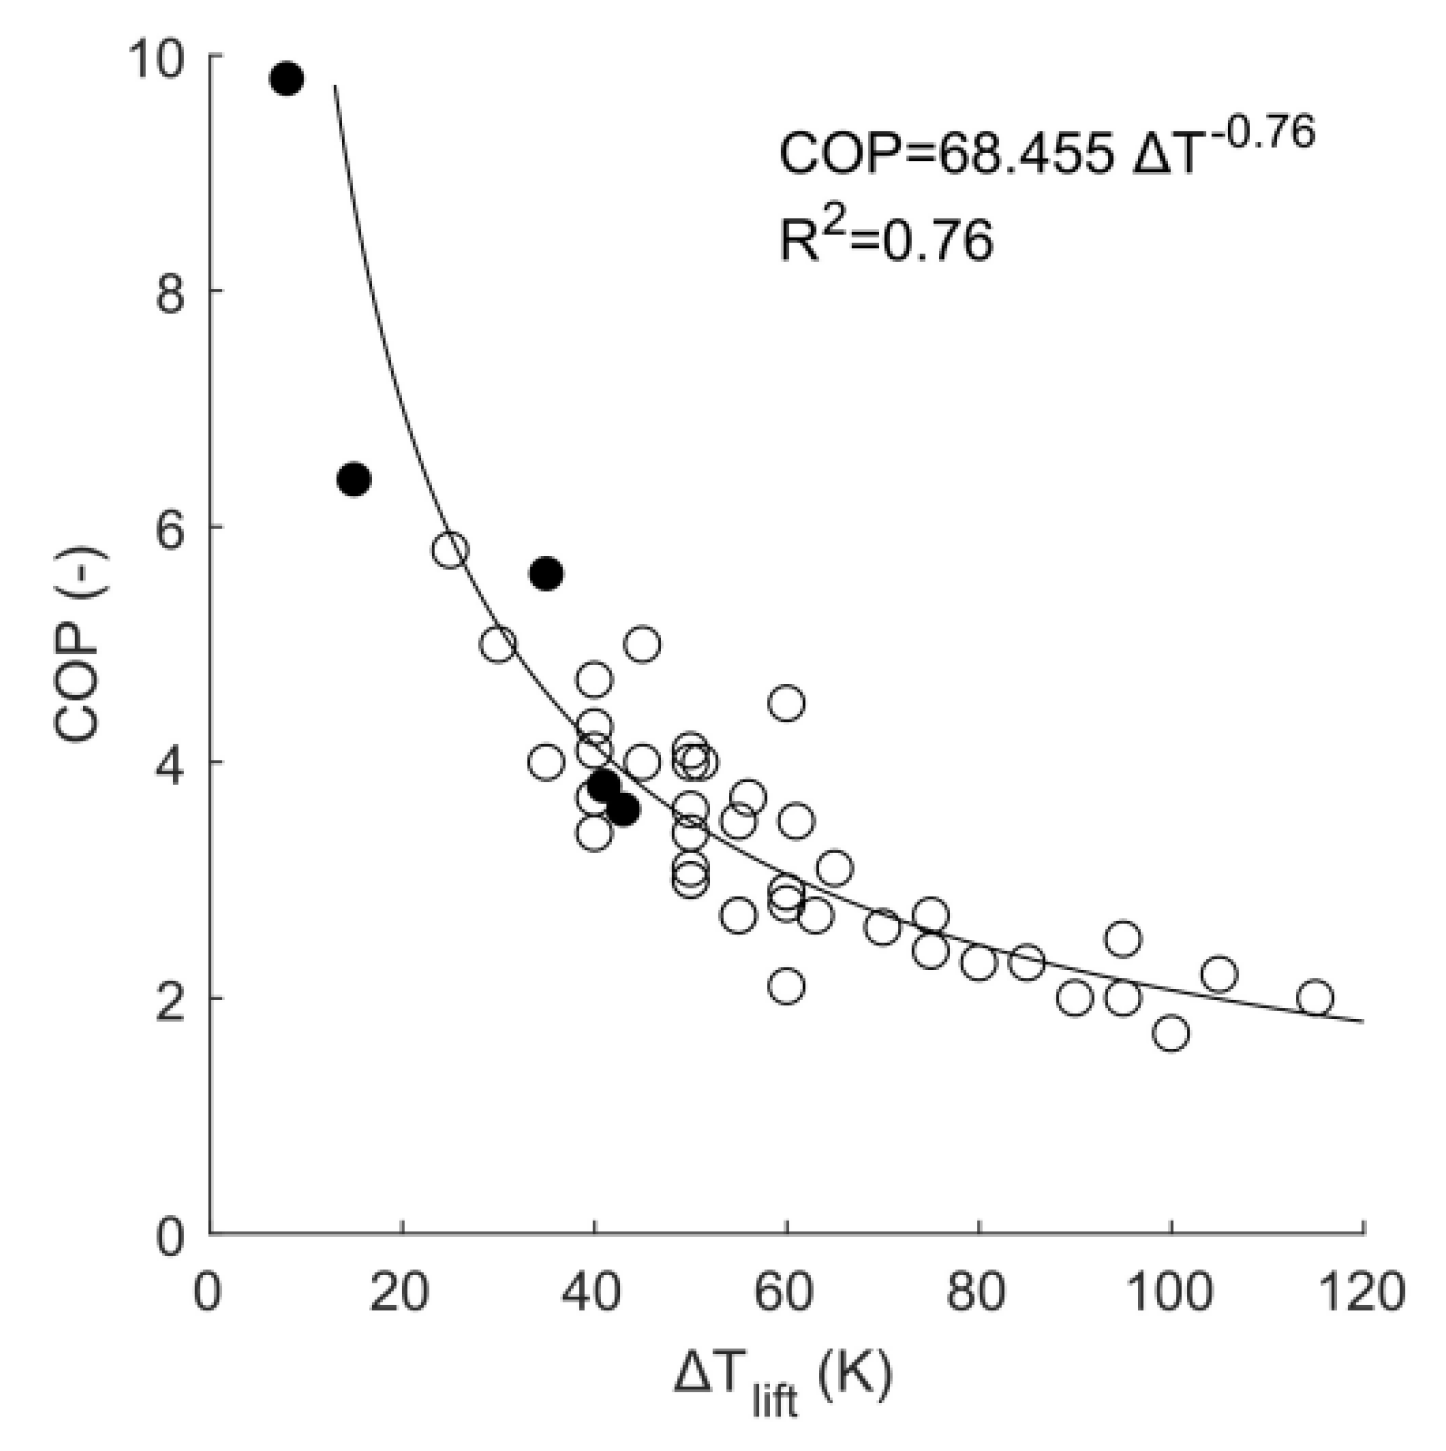
The absorption heat transformer has been modelled using the characteristic equation model. This approach relies on a thermodynamic background for the derivation of a simplified set of equations and is commonly used for the simulation and control of absorption chillers [25]. Recently its usage for the performance evaluation of absorption heat transformer has been demonstrated and validated with a set of laboratory measurements of a 40 kW prototype under different operating conditions [26].
The equation derived from these references has been used in this work assuming an upscaled version of the measured prototype, with the same heat and mass transfer characteristics and equal heat transfer areas ratios between the main heat exchangers. For an upscaled heat transfer capacity of approximately 500 kW, this results in an upscaling factor between 10 and 15. As shown in Figure 3, the same specific heat flow rate per absorber heat transfer area (Qup/AHXA) is expected for equal characteristic temperature difference (ΔΔt). This approach has also been proved valid with the measurements of a 250 kW heat transformer measured in a refinery [27].
The equations for the prediction of the upgrade heat flow and discharged heat flow are presented in Equations (10) and (11), together with the expression for the thermal COP presented in Equation (12). The parameters are obtained from [26].
Q U P = 0.94 · s C · ( t t U P )
Q D I S = s C · ( t t r e j )
C O P T H = 0.94 + Q D I S , d e s Q r e j · ( 0.096 + 0.003 · t ) 1.94 + Q D I S , d e s Q D I S · ( 0.096 + 0.003 · t )
In the characteristic equation method, the heat flows at each external circuit are an almost linear function of the so-called characteristic temperature difference ΔΔt, presented in Equation (13). The derived thermal COP (see Equation (12)) is also a function of ΔΔt, but it also depends on the ratio between the heat flow at the condenser for which the solution circuit of the heat transformer has been designed and the current condenser heat flow (QDIS,des/QDIS). As shown in Figure 3, COPth increases asymptotically with ΔΔt.
t = 1.15 · T w a s t e T D I S T U P T w a s t e
The (double) characteristic temperature difference ΔΔt is calculated with the temperature differences between driving heat and discharged heat (Twaste − TDIS) and the difference between the upgraded heat and the driving heat or temperature lift (TUP − Twaste).
The calculated electrical COP of the AHT includes the contributions of the three main groups of auxiliary electrical consumers necessary for its operation: the refrigerant and solution pumps inside the AHT, the heat rejection device (if necessary) and the hydraulic loop pumps, as presented in Equation (14).
C O P A H T   e l = 1 C O P A H T   e l , i n t + Q D I S Q U P · w r e j + W h y d   p u m p   i Q U P 1
Based on educated assumptions [27], COPHT el,int = 100 (10 W/kW or 5 kW for a 500 MW heat transformer) is used as a conservative assumption for the electrical consumption of refrigerant and solution pumps.
Assuming that either a very efficient (Class A+) dry cooler or a cooling tower is used for heat rejection (wrej = 10 W of electricity per kW of rejected heat), its specific auxiliary consumption can be calculated with the ratio QDIS/QUP.
The specific electric consumption of the three hydraulic pumps is calculated by relating the expression presented in Section 3.4 to the upgraded heat flow.

3.2. Heat Pump

For the HTHP the COP of the heat pump is correlated with the temperature lift ( T l i f t ) as shown in Equation (15).
C O P H P = 68.455 · T l i f t 0.76
where the T l i f t is calculated as the difference between the outlet temperature of the sink and the inlet temperature of the source.
This expression was derived from [5], which proposed a review of the state of the art of high temperature heat pumps. They based the review on over 20 different industrial high temperature heat pumps from 13 manufactures available on the market. The expression in Equation (15) is based on COP and temperature lift data collected in the reviews and represented in Figure 4. The range of temperature lifts covered by the data includes the value in the case studies. This makes the fitting curve suitable for the estimation of the COP. Figure 4 shows that Equation (15) is accurate also for thermal lifts below 20 K, which is the minimum thermal lift considered in [28]. Filled dots in Figure 4 are heat pump performances shown in [28].

3.3. Gas Boiler

For gas boilers a constant efficiency equal to 87.5% based on the gross calorific value is used for this work. The data and the information that in the considered temperature range the efficiency variations are limited have been obtained from an industrial boiler manufacturer. The electrical consumption of the boiler’s auxiliaries is considered equal to 0.5% of the delivered heat. These data are provided by a manufacturer of boilers for industrial heat and are representative of the actual efficiency that can be achieved in the applications considered in this work.

3.4. Auxiliary Hydraulic Loops

The electrical consumption of the hydraulic loops connected to the heat upgrade technology is calculated using Equation (16). This depends on the volume of fluid that circulates per unit of heat (v), expressed in m3/kWh, pressure drops and the efficiency of the pump (η). For this calculation, a pressure drop of 1.5 bar has been assumed for each hydraulic circuit, and a fixed pump efficiency of 60% has been used. Typically, the pump efficiency depends on the flow rate (see Figure 5), with larger pumps being more efficient. However, as can be seen in the chart, the trend is relatively flat for flow rates above 20 m3/h, which are often encountered in industrial applications, corresponding to a heat duty of around 230 kW with a temperature difference of 10 °C.
W h y d   p u m p = v _ · P η · 3600 · 1000

4. Results

In this chapter, the outcomes of the analysis are presented. The performances of the heat upgrade technologies, calculated as in Section 3, are reported in Table 2 for the four case studies, while the outcome of the environmental and economical comparison between the two technologies is detailed in the following subsections.
It has to be noted that, given the COP calculated for the case studies, the heat provided by the HTHP is always the preferred option with respect to the one produced by the gas boiler while the carbon content of the electricity is below 800 g/kWh. Given that in very few places worldwide, the electrical system operates above these values on a yearly basis, it is considered that the HTHP is always running until waste heat is available, and the required upgraded heat demand is met.
The thermal COP of the heat transformer is slightly affected by the working conditions that impact more on the electrical COP, which decreases when the circulation ratio increases due to the higher internal pump consumption.
In the following subsections the results of the cases studies will be discussed.

4.1. Case Study 1 (Desalination)

In this case study, waste heat at 85–75 °C is recovered to run a desalination process at 100 °C. For this application, given the low thermal lift, the expected COP of the HTHP is above 8. Figure 4 shows that for thermal lift below 20 K, there is a remarkable increase of performances due to the favorable working conditions; this is confirmed by data shown in [28] for large capacity heat pumps.
The environmental analysis is reported in Figure 6 in terms of CO2 emissions per unit of heat delivered to the process by the heat upgrade system. The emissions of the system based on the heat pump are in Figure 6a, and the ones of the system with the AHT are in Figure 6b, while Figure 6c shows the differences between the two options. The value of CO2 emissions ( C O 2 t o t ) is provided as a function of the ratio between the process heat required by the user and the available waste heat, and of the CO2 intensity of the electricity.
In the system based on the HTHP, C O 2 t o t decreases as RQ increases, thanks to the higher capacity delivered by the heat pump and the consequently lower contribution of the auxiliary boiler. However, as RQ reaches about 0.9, the heat pump delivers the entire required process heat, and any further increase of the availability of waste heat is unnecessary for the applications and is not exploited. Thus, for RQ above 0.9, the emission associated to Q n e e d remain unchanged. As expected, an increase of the electricity’s carbon intensity causes an increase of C O 2 t o t . Thanks to the high COP associated with this application, the emissions associated with Q U P never exceed 70 gCO2/kWh if sufficient waste heat is available, even when the electricity’s carbon content is high.
A threshold on RQ is also present for the system based on the AHT, with the difference that the threshold is about 2 due to the lower value of the COPth of the AHT than the COP of the heat pump. Above the threshold, the heat transformer covers the heat demand, and the gas boiler is switched off. The curves of constant C O 2 emission are not vertical, but tilted due to the auxiliaries’ electricity consumptions, although it is smaller compared to the electricity consumptions of the heat pump. This leads to a weaker dependence of the C O 2 emissions on the C O 2 intensity of the electricity.
In Figure 6c the two systems are compared in terms of C O 2 t o t . Thus, positive values, characterized by the green fill, mean that the HTHP system has higher emissions than the AHT system delivering the same amount of Q n e e d . In the chart, the two heat upgrade systems are equivalent when RQ = 0 since the heat demand is entirely covered by the gas boiler. As the availability of waste heat increases, the higher Q U P produced by the heat pump makes this technology the one with the lower emission. Above the value of RQ, which constitutes the threshold above which additional waste heat does not provide benefit for the HTHP system but still enhances the environmental performance of the AHT system, the difference between the two systems gradually decreases until it reaches zero. It can be noticed that the higher the carbon intensity of the electricity, the sooner the two systems become equal. Above this threshold, the heat transformer has the lower emissions per unit of Q n e e d , and the advantage of using this technology is higher if the electricity carbon intensity is higher, thanks to the lower electrical energy required to run the system.
Operative costs are presented following a similar approach. Figure 7a,b show the cost ( C o s t t o t ) per unit of heat delivered by the heat upgrade system based on the HTHP and the AHT. As for the environmental analysis, the operative costs are reported as function of RQ, while the second parameter for the analysis is the ratio between the electricity and the gas prices (RP). Given the high COP of the heat pump, the heat produced by the HTHP is always cheaper than that produced by the gas boiler. Therefore, the operative costs decrease when RQ increases until the threshold placed at the value of 0.9, above which the needed heat is fully delivered by the heat pump and the backup boiler is not needed anymore. The reduction of the operative cost is larger for small values of RP, which give a large advantage to the use of the heat pump instead of the gas boiler.
Similarly, the operating costs of the system based on the AHT decrease until the threshold at about RQ = 2 and remain constant above it. The impact of RP is rather small and, as discussed, based on the consumption of the internal pump and of the auxiliaries. When sufficient waste heat is available, C o s t t o t stabilizes on a value of about 0.01 EUR/kWh, while maintaining a mild dependence on RP.
The comparison between the two systems is shown in Figure 7c, as the difference between the operative costs of the HTHP and of the AHT systems. As discussed in the environmental analysis, the two systems are equivalent for RQ = 0, since the heat demand is covered by the gas boiler. Above this value the HTHP system becomes progressively the most interesting (negative values of the difference), until about 0.9, which corresponds to the threshold identified for the heat pump. Given the higher reliance of the HTHP system on electricity, the advantage is higher when the RP is smaller. Above RQ = 0.9 the advantage of the HTHP system decreases until a value above which the AHT system becomes more convenient. This second threshold is anticipated at a high electricity price, which penalizes the HTHP system, while it is located at a higher value of RQ when the electricity prices are low compared with the gas price.
Comparing the outcomes of the two analysis presented in Figure 6 and Figure 7, it must be noticed that even when the application allows a high COP for the heat pump, the AHT system has a better environmental profile as soon as there is enough available waste heat. Additionally, the threshold at which the operating cost of the AHT system becomes lower than that of the HTHP system occurs at a lower values than the environmental threshold. Moreover, the threshold is before the working condition where there is sufficient waste heat available for the AHT to deliver Q n e e d without the support of the gas boiler. This is particularly true when the electricity prices are high.

4.2. Case Study 2 (Carbon Capture)

The same analysis is carried out for the carbon capture application. The CO2 emissions of the HTHP and AHT systems are shown in Figure 8a and in Figure 8b, respectively. Their difference is shown in Figure 8c. This case study is the one characterized by the lowest efficiency both for the heat pump and the heat transformer. The trends are the same as the ones already observed for case study 1, but the position of the threshold and the impact of the electricity carbon intensity on the HTHP system are different due to the difference in the COP. The threshold above which the system CO2 emissions are not influenced by the value of RQ moves to 0.7. In contrast, the chart with the results for the system based on the AHT is very similar to the one of the previous case study, given a difference of about 10% between the two COPth. A difference between the COPel of 10% is found, but the impact of this parameter on the AHT is very limited due to the small electricity consumption.
Comparing the two systems (Figure 8c), it can be seen that, even if it is possible to identify the same region, the area where the system based on the HTHP has lower emissions is smaller, especially when the electricity’s carbon intensity is high. As a consequence, when the emission coefficient for the electricity is 450 g/kWh, the AHT system has lower emissions per unit of Q n e e d already when the RQ is just above 1.
Looking at the results of the economic analysis reported in Figure 9a,b, significant differences are found with respect to case study 1 for the HTHP system. In fact, the low COP of the heat pump has two effects. First, the heat pump becomes less convenient than the backup boiler when RP is larger than 4. This creates a region of high specific cost per unit of Q n e e d in correspondence with high electricity price and high waste heat availability, i.e., a condition where the HTHP provides all or the majority of Q n e e d , but with a higher cost than the gas boiler. The second impact is on the absolute value of the heat cost, which roughly doubles when compared with case study 1.
The chart in Figure 9b is very similar to the one in Figure 7b, with the difference that the operative cost is slightly higher, keeping the same RQ and RP, due to the lower COPth and COPel. When comparing the two systems (see Figure 9c), it can be seen that the region where the system based on the HTHP is more convenient has shrunken in comparison with the previous case study. The system based on the AHT is always the most convenient option when Rp is above 2.5 and when RQ is above 1.5.

4.3. Case Study 3 (Industrial Steam) and Case Study 4 (District Heating)

Since the COP of the HTHP has emerged as the parameter with the largest influence on the outcome of the analysis, case studies 3 and 4 are discussed together, as they share a similar value of this parameter (4.59 and 5.16 respectively), which are intermediate with respect to case studies 1 and 2. The analysis of the CO2 emissions is reported in Figure 10 and Figure 11, while the cost for the delivered heat is in Figure 12 and Figure 13.
The charts are rather similar, with small differences due to the lower COP characterizing the HTHP in case study 3. In both cases the thresholds are located at intermediate position compared to case study 1 and 2. The gas boiler stops operating in HTHP system for a value of RQ of about 0.8. This value of RQ also coincides with the point where the advantage of the HTHP over the AHT system is the largest. In both cases, the AHT becomes the technology with the lowest C O 2 t o t for values of RQ between 1.4 and 2.2, depending on the carbon intensity of the electricity.
Also, the operative cost analysis reported in Figure 12 and Figure 13 are quite similar in the two case studies. A visible difference is present in the AHT system: on the right side of the chart, where the heat is entirely delivered by the heat transformer, the cost varies with RP. In fact, case study 4 is characterized by larger electricity consumption for pumping than case study 3. In the former case, the high temperature sink is a district heating network, with a significantly higher flow rate compared with the steam produced in the latter. This affects both the heat upgrade systems, so it does not have impact on the comparison reported in Figure 12c and Figure 13c. On the contrary, here it can be seen that the region where the HTHP system provides heat at lower cost than the AHT system is larger, due to the higher COP of the heat pump, which is confirmed as the main parameter impacting on the analysis.

5. Conclusions

Economic and environmental comparisons have been made between two alternative systems for waste heat recovery, considering a system based on a high temperature heat pump and a system based on an absorption heat transformer. The performances of the two systems were calculated based on the operating conditions in four realistic case studies. A gas boiler was assumed as a back-up system to provide the fraction of heat demand not covered by the heat upgrade technology when the available waste heat is insufficient.
Parametric analyses were carried out in the four cases, in which the following were varied:
-
The ratio between the heat demand and the available waste heat (RQ), which affects the heat production of the heat upgrade technology and the fraction of heat provided by the gas boiler.
-
The carbon intensity of the electricity, whose consumption is higher in the HTHP system than in the AHT system.
-
The ratio between electricity and gas prices (RP), which affects the economic convenience of the heat provided by the heat pump compared to that of the backup boiler.
The three parameters have interrelated influences on the results of the analyses, which can be summarized as follows:
-
The analysis and comparison of the case studies presented show that both HTHP and AHT systems can be used for heat recovery. The choice of the most suitable system depends on the specific operating conditions.
-
The main parameter influencing the results of the analyses is the COP of the heat pump. Other less influential parameters are the consumption of auxiliaries and the thermal and electrical COP of the heat transformer.
-
By increasing the ratio between the available waste heat and the demand for upgraded heat (RQ), the HTHP system is initially the one with the lowest emissions per unit of heat supplied. As the available waste heat increases, a threshold is reached where the CO2 emissions of the two options are equal and above which the AHT system becomes the one with the lowest emissions. The position of the threshold depends on the carbon intensity of the electricity.
-
The HTHP system achieves lower CO2 emissions than the AHT system when a limited amount of waste heat is available (RQ < 1), while the AHT system is always preferred when a large amount of waste heat is available compared to the heat demand (RQ > 2). In between, the choice of system should be based on the operating conditions that affect the performance of the heat pump and heat transformer.
-
Regarding the cost of the upgraded heat, a similar threshold is found as in the environmental analysis. However, the cost threshold is anticipated with respect to the emission threshold, especially when the ratio between electricity and gas prices (RP) is high. The HTHP system achieves lower operative costs than the AHT system when a limited amount of waste heat is available (RQ < 0.8), and the electricity price is sufficiently low when compared to the gas price (RP < 2.5). On the contrary, the AHT system is better when a large quantity of waste heat is available (RQ > 2) and when RP > 3.5. In between, the determination of the system delivering heat at the lower cost depends on the working conditions impacting on the heat pump and heat transformer performances.
-
Outside the ranges of conditions where the advantage of one technology over the other is unambiguous regardless of the type of analysis carried out, there is a range in all the case studies where the preference of one system over the other depends on the type of analysis carried out. Typically, the environmental analysis shows a wider range of favorable conditions for the HTHP system than the cost analysis.
-
Focusing on the specific case studies included in this work, for desalination, HTHP is in most cases the option with the lowest cost and emissions, thanks to the high COP that characterizes this application. For carbon capture, the system based on the AHT is often the preferred option, especially considering the cost of the upgraded heat produced. The production of industrial steam and the district heating case are similar and intermediate with respect to the previous ones.

Author Contributions

Conceptualization, T.T.; methodology, T.T. and G.V.; software, G.V.; validation, T.T., G.V. and J.L.C.C.; formal analysis, T.T. and G.V.; investigation, T.T., G.V., J.L.C.C. and G.A.; resources, J.L.C.C. and G.A.; data curation, G.V.; writing—original draft preparation, T.T., G.V., J.L.C.C. and G.A.; writing—review and editing, J.L.C.C.; visualization, T.T. and G.V.; supervision, T.T.; project administration, T.T. and J.L.C.C.; funding acquisition, T.T. All authors have read and agreed to the published version of the manuscript.

Funding

This work has been partially funded by the grant agreement No. 101069689 (PUSH2HEAT project) of the European Union’s Horizon 2020 research and innovation program.

Data Availability Statement

The data presented in this study are available on request from the corresponding author.

Conflicts of Interest

Author Josè L. Corrales Ciganda was employed by the TECNALIA. The remaining authors declare that the research was conducted in the absence of any commercial or financial relationships that could be construed as a potential conflict of interest.

Nomenclature

A Area, m 2
a u x Auxiliaries, k W h / k W h t h
C O P Coefficient of performance
C O 2 Greenhouse gas emission, g C O 2 / k W h
C o s t Specific cost, / k W h t h
P Pressure P a
Q Heat, k W h t h / k W h t h
Q ˙ Heat flow rate, k W
R Ratio
s Characteristic equation slope parameter for heat exchanger, k W / K
T Temperature, K
v _ Volume of circulated fluid per unit of heat, m 3 / k W h t h
w Work, W e l / W t h
W Work, k W h / k W h t h
Greek letters
Difference
t Characteristic temperature difference, K
η Efficiency
Subscripts
AHTAbsorption heat transformer
b o i l e r Gas boiler
d e s Design
D I S Discharged
e l Electric
H P Heat pump
H T Heat transformer
h t High temperature
H T H P High temperature heat pump
H X A Absorber heat exchanger
h y d Hydraulic
i n t Internal
l t Low temperature
N G Natural gas
PPrice
QHeat
r e j Rejected
s Source
t h Thermal
t o t Total
U P Upgraded
Abbreviations
AHTAbsorption heat transformer
GWPGlobal warming potential
HTHPHigh temperature heat pump

References

  1. Forman, C.; Muritala, I.K.; Pardemann, R.; Meyer, B. Estimating the global waste heat potential. Renew. Sustain. Energy. Rev. 2016, 57, 1568–1579. [Google Scholar] [CrossRef]
  2. Hintemann, R.; Hinterholzer, S. Energy consumption of data centers worldwide How will the Internet become green? In Proceedings of the ICT4S 2019, Lappeenranta, Finnland, 10–14 June 2009. [Google Scholar]
  3. Koot, M.; Wijnhoven, F. Usage impact on data center electricity needs: A system dynamic forecasting model. Appl. Energy 2021, 291, 116798. [Google Scholar] [CrossRef]
  4. Zevenhoven, C.A.P.; Khan, U.; Haikarainen, C.; Saeed, L.; Tveit, T.-M.; Saxén, H. Performance improvement of an industrial Stirling engine heat pump. In Proceedings of the 33rd International Conference on Efficiency, Cost, Optimization, Simulation and Environmental Impact of Energy Systems, Osaka, Japan, 29 June–3 July 2020; Available online: http://www.proceedings.com/55242.html (accessed on 10 November 2024).
  5. Arpagaus, C.; Bless, F.; Uhlmann, M.; Schiffmann, J.; Bertsch, S.S. High temperature heat pumps: Market overview, state of the art, research status, refrigerants, and application potentials. Energy 2018, 152, 985–1010. [Google Scholar] [CrossRef]
  6. Averfalk, H.; Ingvarsson, P.; Persson, U.; Gong, M.; Werner, S. Large heat pumps district heating systems. Renew. Sustain. Energy. Rev. 2017, 79, 1275–1284. [Google Scholar] [CrossRef]
  7. David, A.; Mathiesen, B.V.; Averfalk, H.; Werner, S.; Lund, H. Heat Roadmap Europe: Large-Scale Electric Heat Pumps in District Heating Systems. Energies 2017, 10, 578. [Google Scholar] [CrossRef]
  8. Piel, E.; Mata, C.; Lucas, P.; Pesce, G. DHC Market Outlook Insights & Trends; Euroheat & Power’s Unit Market Intelligence: 2023. Available online: https://api.euroheat.org/uploads/DHC_Market_Outlook_Insights_Trends_2023_36d6fe8924.pdf (accessed on 10 November 2024).
  9. Lund, H.; Werner, S.; Wiltshire, R.; Svendsen, S.; Thorsen, J.E.; Hvelplund, F.; Vad Mathiesen, B. 4th Generation District Heating (4GDH): Integrating smart thermal grids into future sustainable energy systems. Energy 2014, 68, 1–11. [Google Scholar] [CrossRef]
  10. International Energy Agency. The Future of Heat Pumps in China; IEA: Paris, France, 2024; Available online: https://www.iea.org/reports/the-future-of-heat-pumps-in-china (accessed on 5 December 2024).
  11. Bergamini, R.; Jensen, J.K.; Elmegaard, B. Thermodynamic competitiveness of high temperature vapor compression heat pumps for boiler substitution. Energy 2019, 182, 110–121. [Google Scholar] [CrossRef]
  12. Jensen, E.H.; Andreasen, A.; Jørsboe, J.K.; Andersen, M.P.; Hostrup, M.; Elmegaard, B.; Riber, C.; Fosbøl, P.L. Electrification of amine-based CO2 capture utilizing heat pumps. Carbon Capture Sci. Technol. 2024, 10, 100154. [Google Scholar] [CrossRef]
  13. He, W.F.; Han, D.; Ji, C. Investigation on humidification dehumidification desalination system coupled with heat pump. Desalination 2018, 436, 152–160. [Google Scholar] [CrossRef]
  14. Ayati, E.; Rahimi-Ahar, Z.; Hatamipour, M.S.; Ghalavand, Y. Water productivity enhancement in variable pressure humidification dehumidification (HDH) desalination systems using heat pump. Appl. Therm. Eng. 2019, 160, 114114. [Google Scholar] [CrossRef]
  15. Cudok, F.; Giannetti, N.; Corrales Ciganda, J.L.; Aoyama, J.; Babu, P.; Coronas, A.; Fujii, T.; Inoue, N.; Saito, K.; Yamaguchi, S.; et al. Absorption heat transformer—State-of-the-art of industrial applications. Renew. Sustain. Energy Rev. 2021, 141, 110757. [Google Scholar] [CrossRef]
  16. Liu, Z.; Lu, D.; Tao, S.; Chen, R.; Gong, M. Experimental study on using 85 °C low-grade heat to generate. Energy 2024, 299, 131491. [Google Scholar] [CrossRef]
  17. Ma, X.; Chen, J.; Li, S.; Sha, Q.; Liang, A.; Li, W.; Zhang, J.; Zheng, G.; Feng, Z. Appliacation of absorption heat transformer to recover waste heat from a synthetic rubber plant. Appl. Therm. Eng. 2003, 23, 797–806. [Google Scholar] [CrossRef]
  18. Fujii, T.; Nishiguchi, A.; Uchida, S. Development Activities of Low Temperature Waste Heat Recovery Appliances Using Absorption Heat Pumps. In Proceedings of the International Symposium on Next-Generation Air Conditioning and Refrigeration Technology, Tokyo, Japan, 17–19 February 2010. [Google Scholar]
  19. Aoyama, J.; Oikawa, Y.; Ebara, S. Absorption Heat Pump—Type II Heat Transformer. In Proceedings of the 14th IIT Gustav Lorentzen Conference on Natural Refrigerants, Kyoto, Japan, 7–9 December 2020. [Google Scholar]
  20. Vieren, E.; Demeester, T.; Beyne, W.; Magni, C.; Abedini, H.; Arpagaus, C.; Bertsch, S.; Arteconi, A.; De Paepe, M.; Lecompte, S. The Potential of Vapor Compression Heat Pumps Supplying Process Heat between 100 and 200 °C in the Chemical Industry. Energies 2023, 16, 6473. [Google Scholar] [CrossRef]
  21. Brückner, S.; Liu, S.; Miró, L.; Radspieler, M.; Cabeza, L.F.; Lävemann, E. Industrial waste heat recovery technologies: An economic analysis of heat transformation technologies. Appl. Energy 2015, 151, 157–167. [Google Scholar] [CrossRef]
  22. Ciotti, G.; Cottes, M.; Mazzolini, M.; Sappa, A.; Simeoni, P. A decision support system for industrial waste heat recovery: The CE-HEAT Project. In Proceedings of the XXIV Summer School “Francesco Turco”—Industrial Systems Engineering, Brescia, Italy, 11–13 September 2019. [Google Scholar]
  23. Payà, J.; Cazorla-Marìn, A.; Arpagaus, C.; Corrales Cigarda, J.L.; Hassan, A.H. Low-Pressure Steam Generation with Concentrating Solar Energy and Different Heat Upgrade Technologies: Potential in the European Industry. Sustainability 2024, 16, 1733. [Google Scholar] [CrossRef]
  24. Eurostat. Gas Prices for Non-Household Consumers—Bi-Annual Data (from 2007 Onwards). Available online: https://ec.europa.eu/eurostat/databrowser/view/nrg_pc_203/default/table?lang=en (accessed on 11 December 2024).
  25. Puig Arnavat, M.; Lopez-Villada, J.; Bruno, J.C.; Coronas, A. Analysis and parameter identification for characteristic equations of single- and double-effect absorption chillers by means of multivariable regression. Int. J. Refrig. 2010, 33, 70–78. [Google Scholar] [CrossRef]
  26. Corrales Ciganda, J.L.; Cudok, F. Performance evaluation of an absorption heat transformer for industrial heat waste recovery using the characteristic equation. Appl. Therm. Eng. 2021, 193, 116986. [Google Scholar] [CrossRef]
  27. Corrales Ciganda, J.L.; Martinez-Urrutia, A. Steady State Measurements and Dynamic Behaviour of an Absorption Heat Transformer Operating in an Industrial Environment. In Proceedings of the 14th IEA Heat Pump Conference, Chicago, IL, USA, 15–18 May 2023. [Google Scholar]
  28. Famiglietti, J.; Acconito, L.; Arpagaus, C.; Toppi, T. Environmental life cycle assessment of industrial high temperature to residential small-size heat pumps: A critical review. Energy Convers. Manag. X 2025, 26, 100947. [Google Scholar] [CrossRef]
Figure 1. Heat pump (left) and heat transformer (right) simplified schemes.
Energies 18 03454 g001
Figure 2. Working conditions of case studies: (a) desalination, (b) carbon capture, (c) industrial steam, (d) district heating.
Energies 18 03454 g002
Figure 3. Model with experimental data [26]; (left heat flow, right COP) r employed in this study.
Energies 18 03454 g003
Figure 4. COP–temperature lift correlation for HTHPs as presented by [5]; additional data (filled dots) presented by [28].
Energies 18 03454 g004
Figure 5. Variation of the hydraulic efficiency of the pump connected with the hydraulic loops and the volumetric flow rate.
Energies 18 03454 g005
Figure 6. CO2 emissions per unit of heat for the HTHP system (a) and the AHT system (b) and comparison between the two technologies (c) for case study 1—desalination.
Energies 18 03454 g006
Figure 7. Operative cost per unit of delivered heat for the HTHP system (a) and AHT system (b) and comparison between the two technologies (c) for case study 1—desalination.
Energies 18 03454 g007
Figure 8. CO2 emissions per unit of heat for the HTHP system (a) and the AHT system (b) and comparison between the two technologies (c) for case study 2—carbon capture.
Energies 18 03454 g008
Figure 9. Operative cost per unit of delivered heat for the HTHP system (a), AHT system (b) and comparison between the two technologies (c) for case study 2—carbon capture.
Energies 18 03454 g009
Figure 10. CO2 emissions per unit of heat for the HTHP system (a) and the AHT system (b) and comparison between the two technologies (c) for case study 3—industrial steam.
Energies 18 03454 g010
Figure 11. CO2 emissions per unit of heat for the HTHP system (a) and the AHT system (b) and comparison between the two technologies (c) for case study 4—district heating.
Energies 18 03454 g011
Figure 12. Operative cost per unit of delivered heat for the HTHP system (a) and AHT system (b) and comparison between the two technologies (c) for case study 3—industrial steam.
Energies 18 03454 g012
Figure 13. Operative cost per unit of delivered heat for the HTHP system (a) and AHT system (b) and comparison between the two technologies (c) for case study 4—district heating.
Energies 18 03454 g013
Table 1. Waste heat, upgraded heat and low-temperature sink temperatures for each case study.
Case Study T w a s t e T U P T D I S
Desalination85–75 °C100 °C20–27 °C
Carbon capture85–75 °C136 °C20–27 °C
Industrial steam85–80 °C120 °C20–27 °C
District heating60–55 °C70–90 °C10–15 °C
Table 2. COP of the HTHP and COPth and COPel for the AHT in the four case studies.
Case Study C O P H T H P C O P t h ,   A H T C O P e l ,   A H T
18.740.4925.90
23.450.4523.35
34.590.4820.20
45.160.4618.30
Disclaimer/Publisher’s Note: The statements, opinions and data contained in all publications are solely those of the individual author(s) and contributor(s) and not of MDPI and/or the editor(s). MDPI and/or the editor(s) disclaim responsibility for any injury to people or property resulting from any ideas, methods, instructions or products referred to in the content.

