


Recent Developments in the CO2-Cyclic Solvent Injection Process to Improve Oil Recovery from Poorly Cemented Heavy Oil Reservoirs: The Case of Canadian Reservoirs


Abstract
1. Introduction
2. Recovery Techniques in Thin Unconsolidated Heavy Oil Reservoirs
2.1. Cold Production with Sand
2.2. Waterflooding in Heavy Oil Reservoirs
2.3. Thermal EOR in Heavy Oil Reservoirs
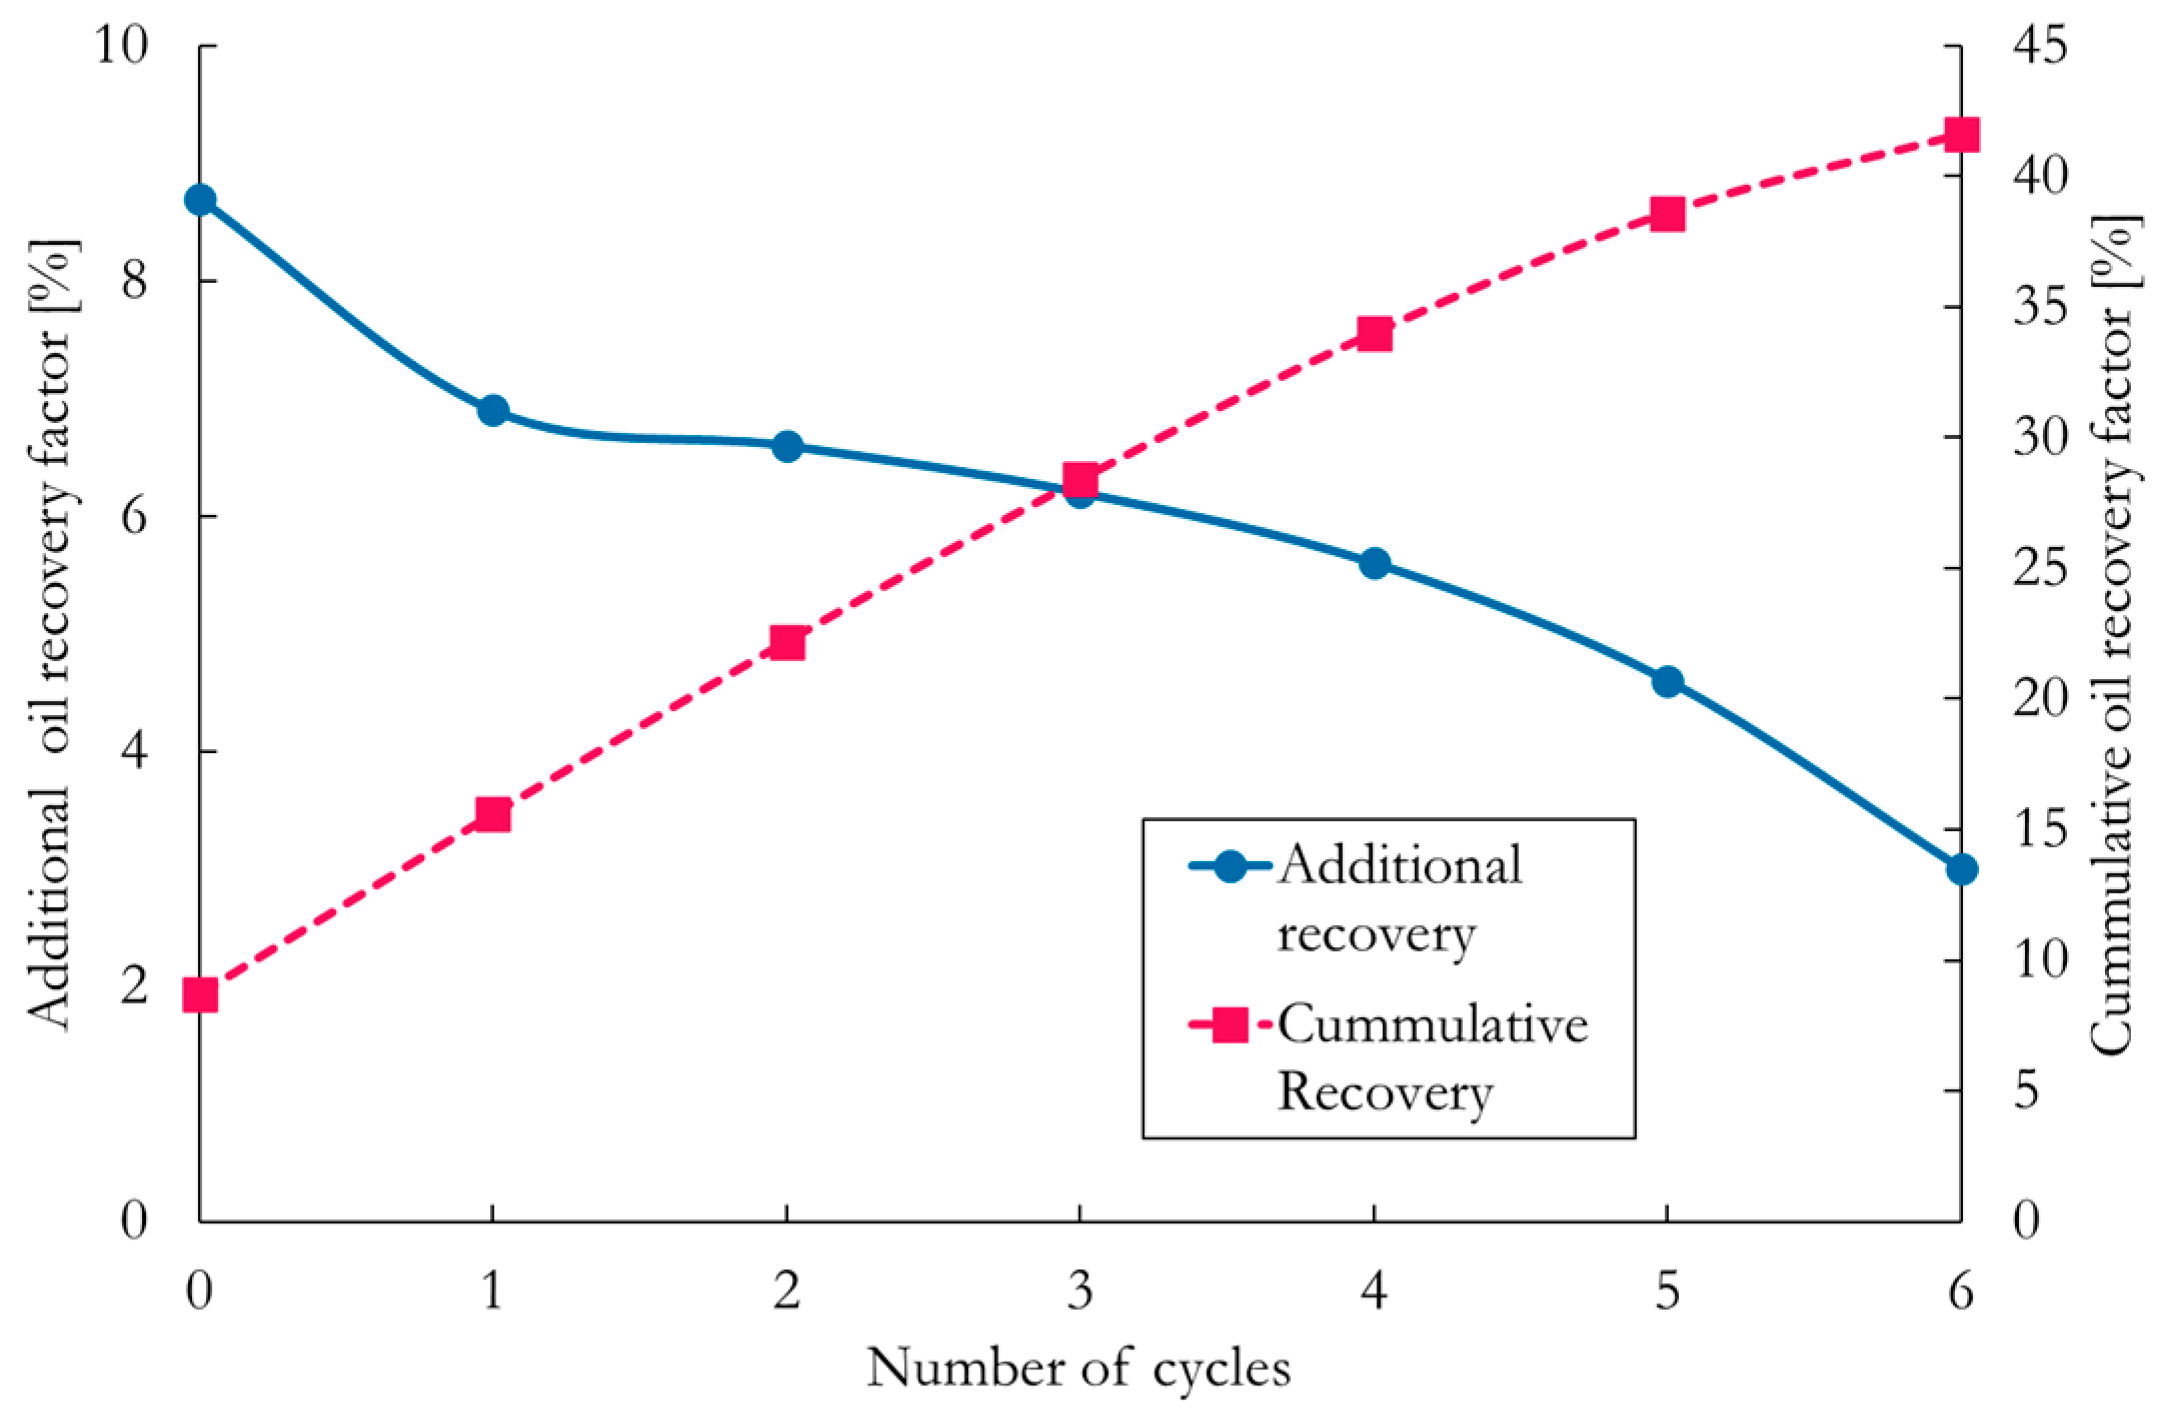
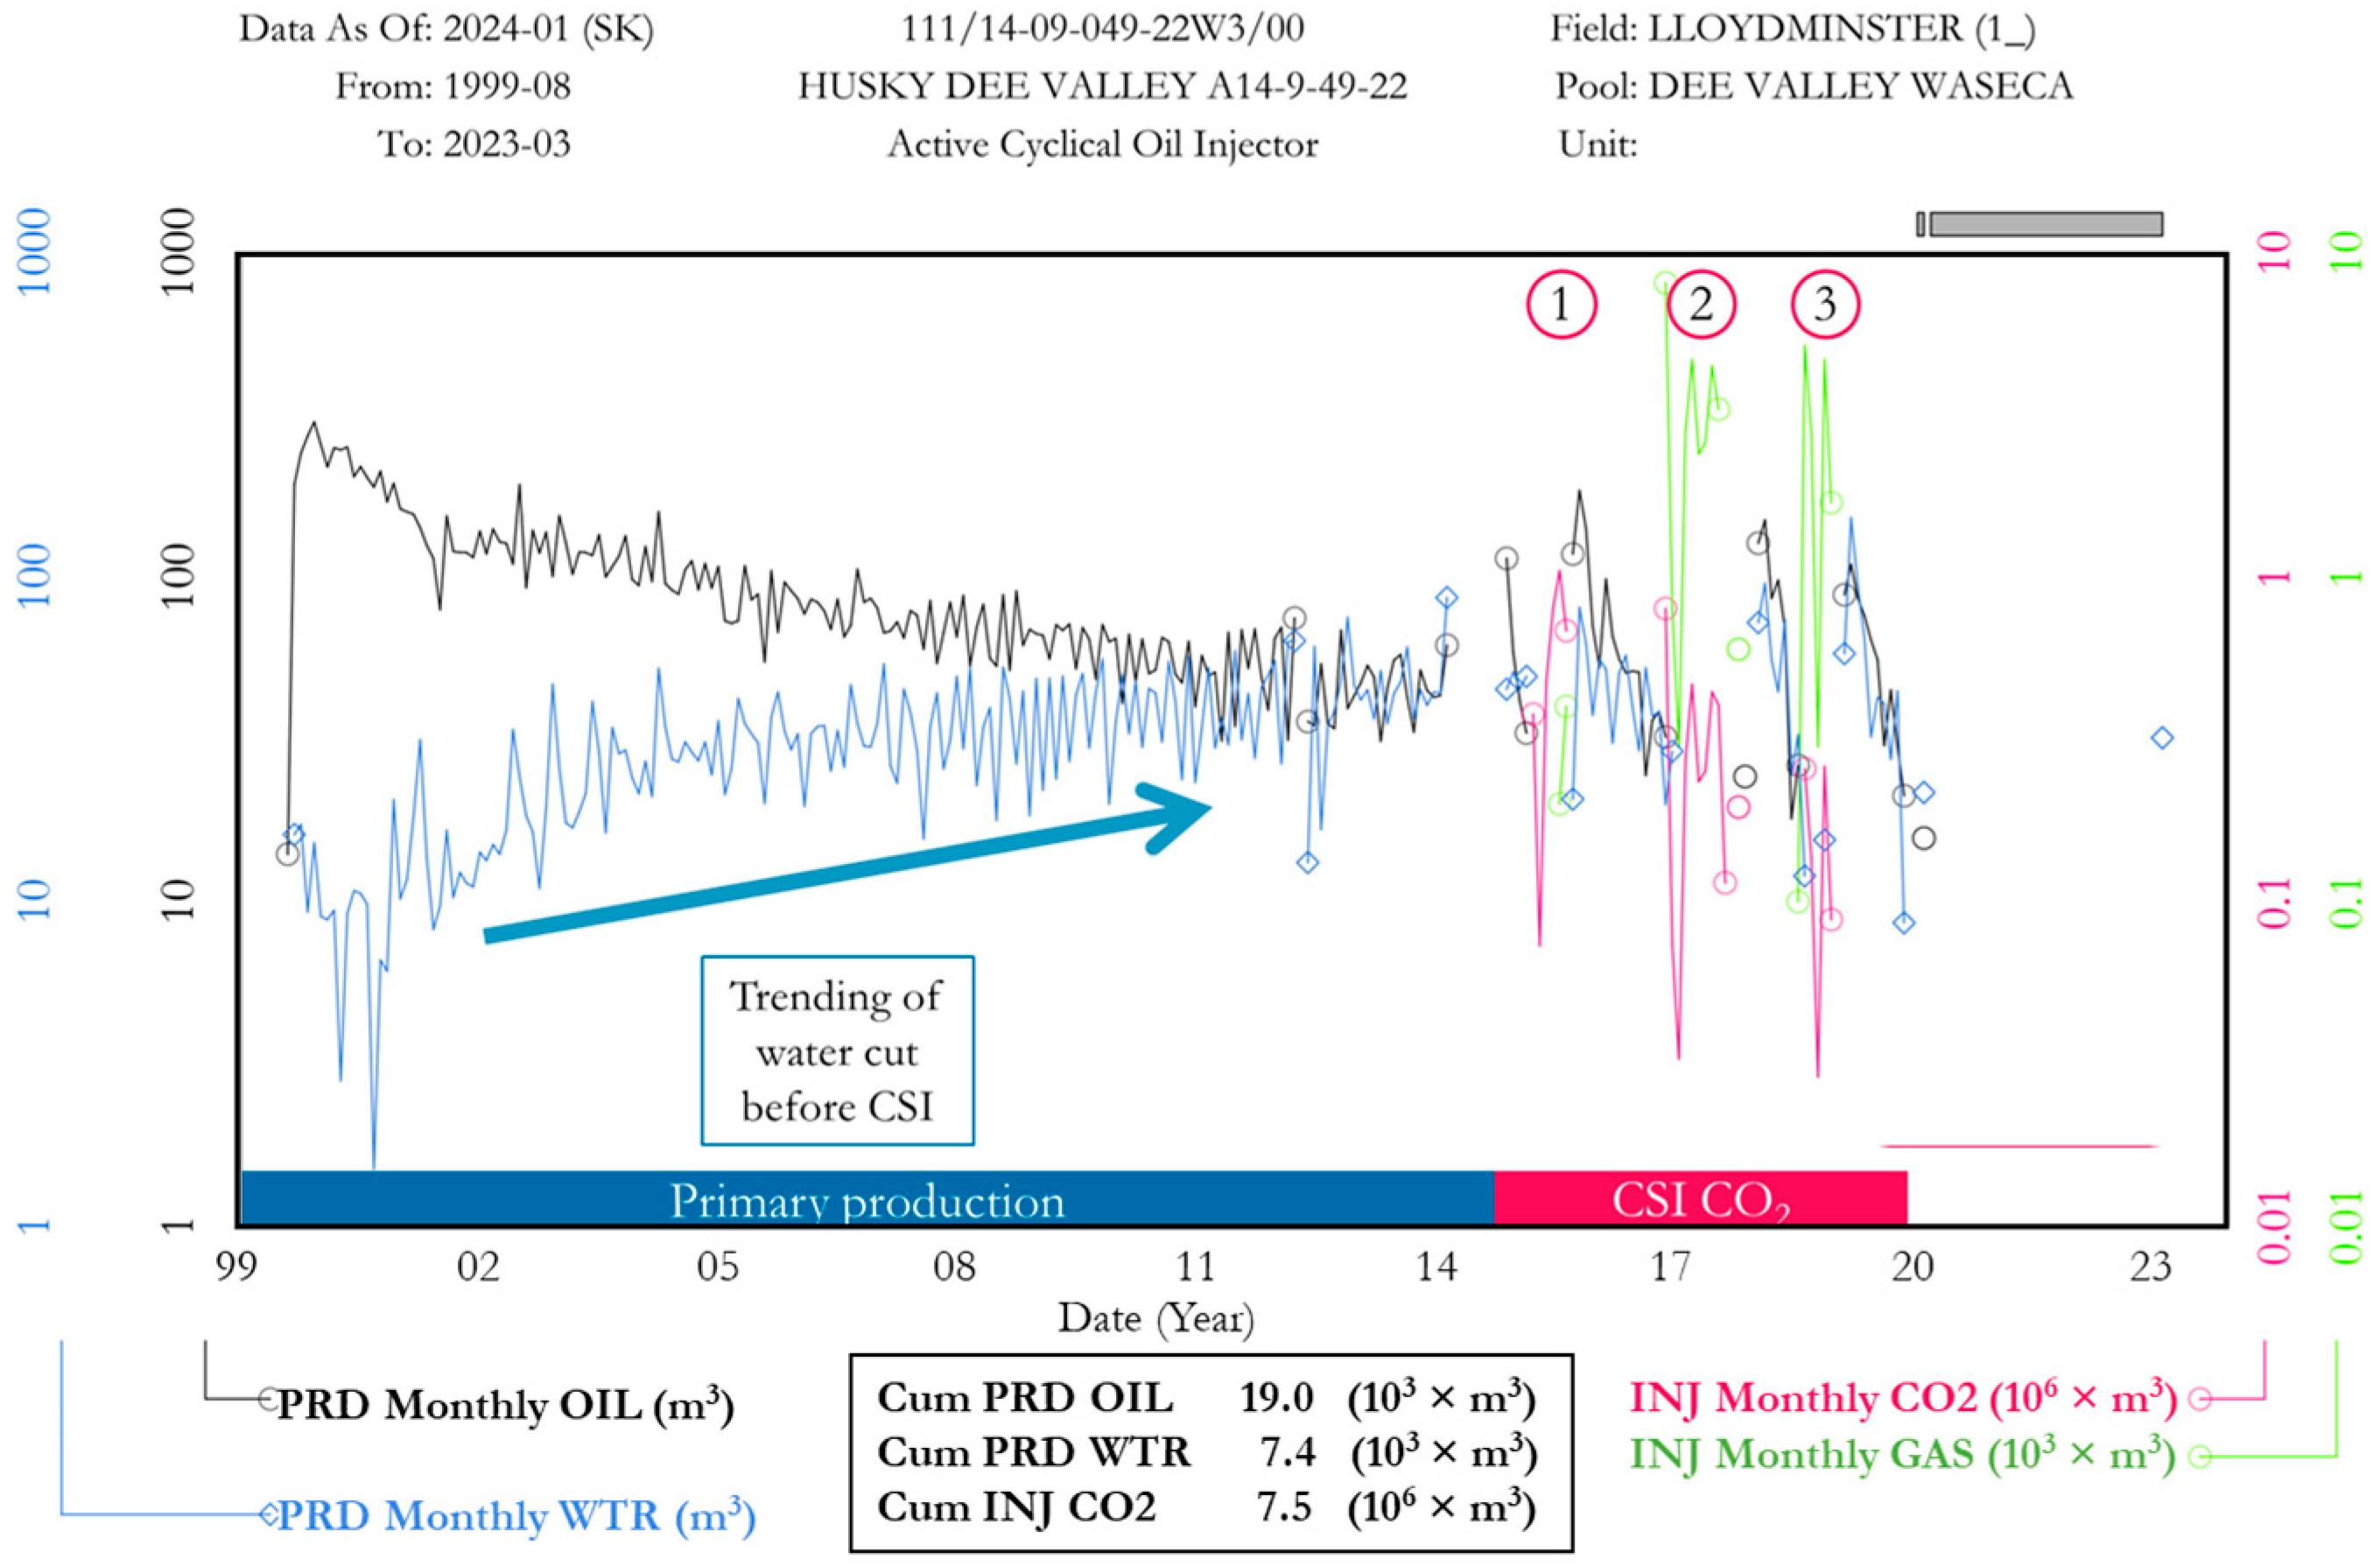
3. Cyclic Solvent Injection Process
3.1. Recent CSI Experimental Studies
3.2. Recent Development in Numerical Modeling of CSI
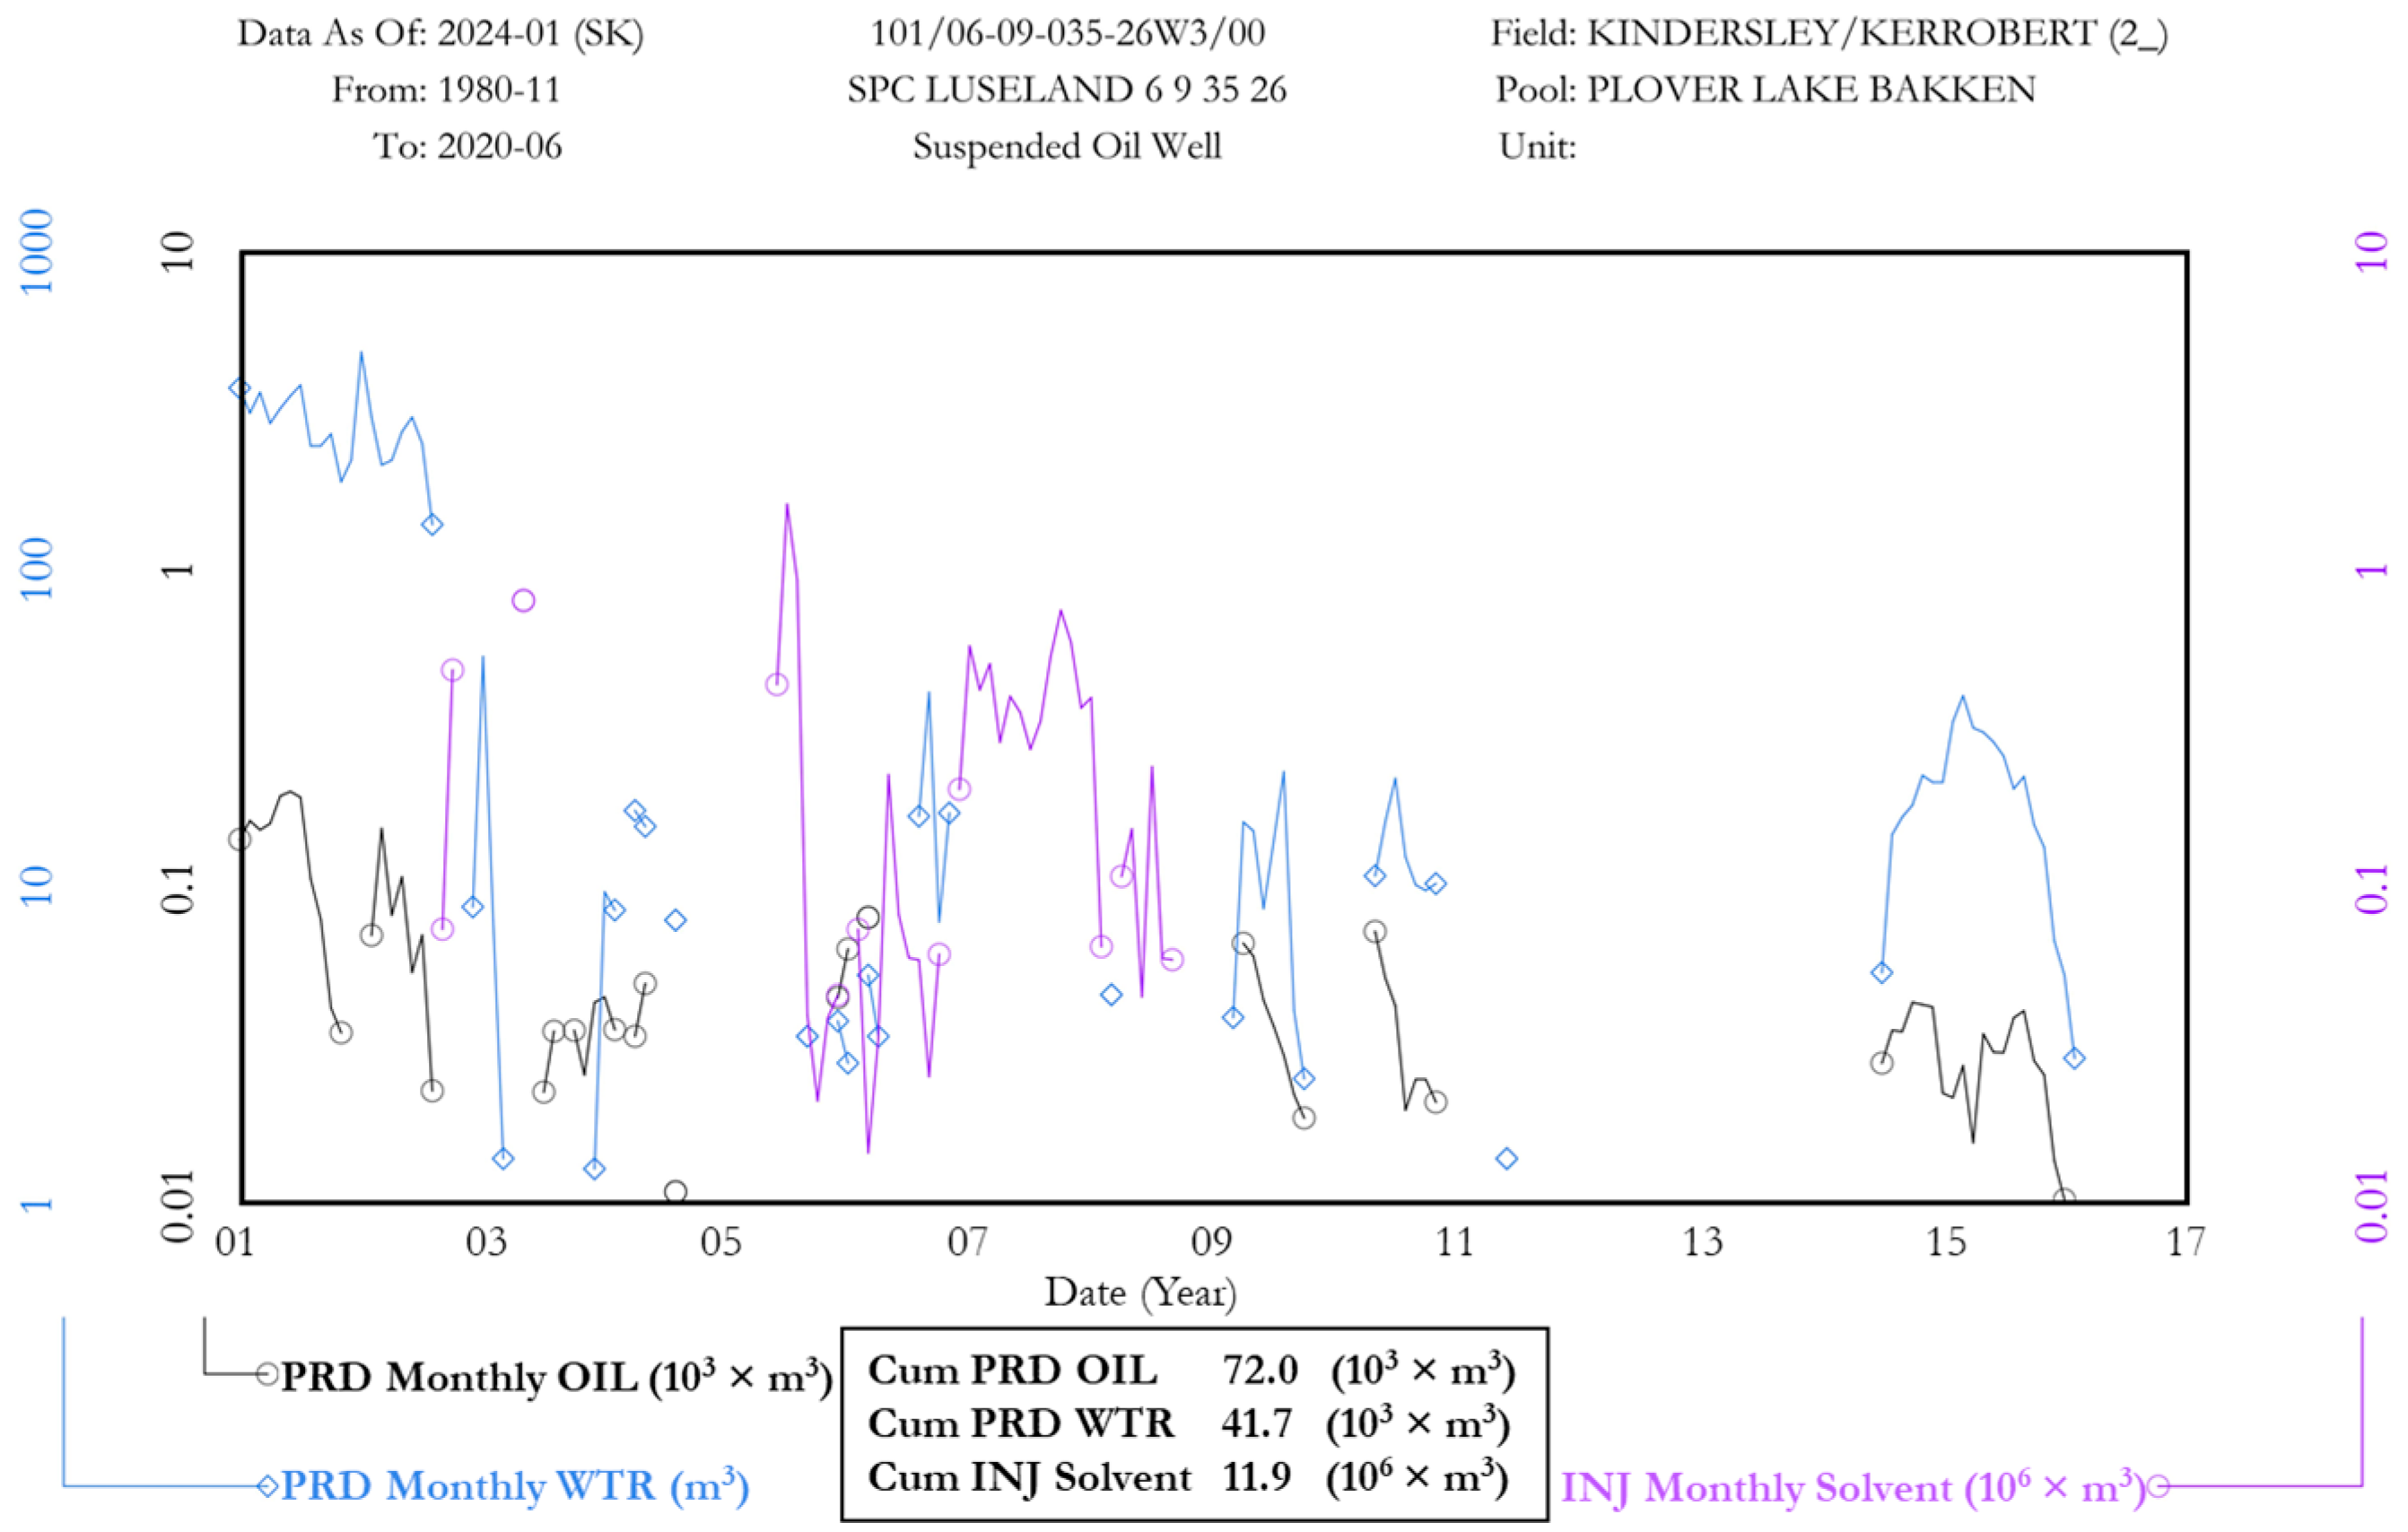
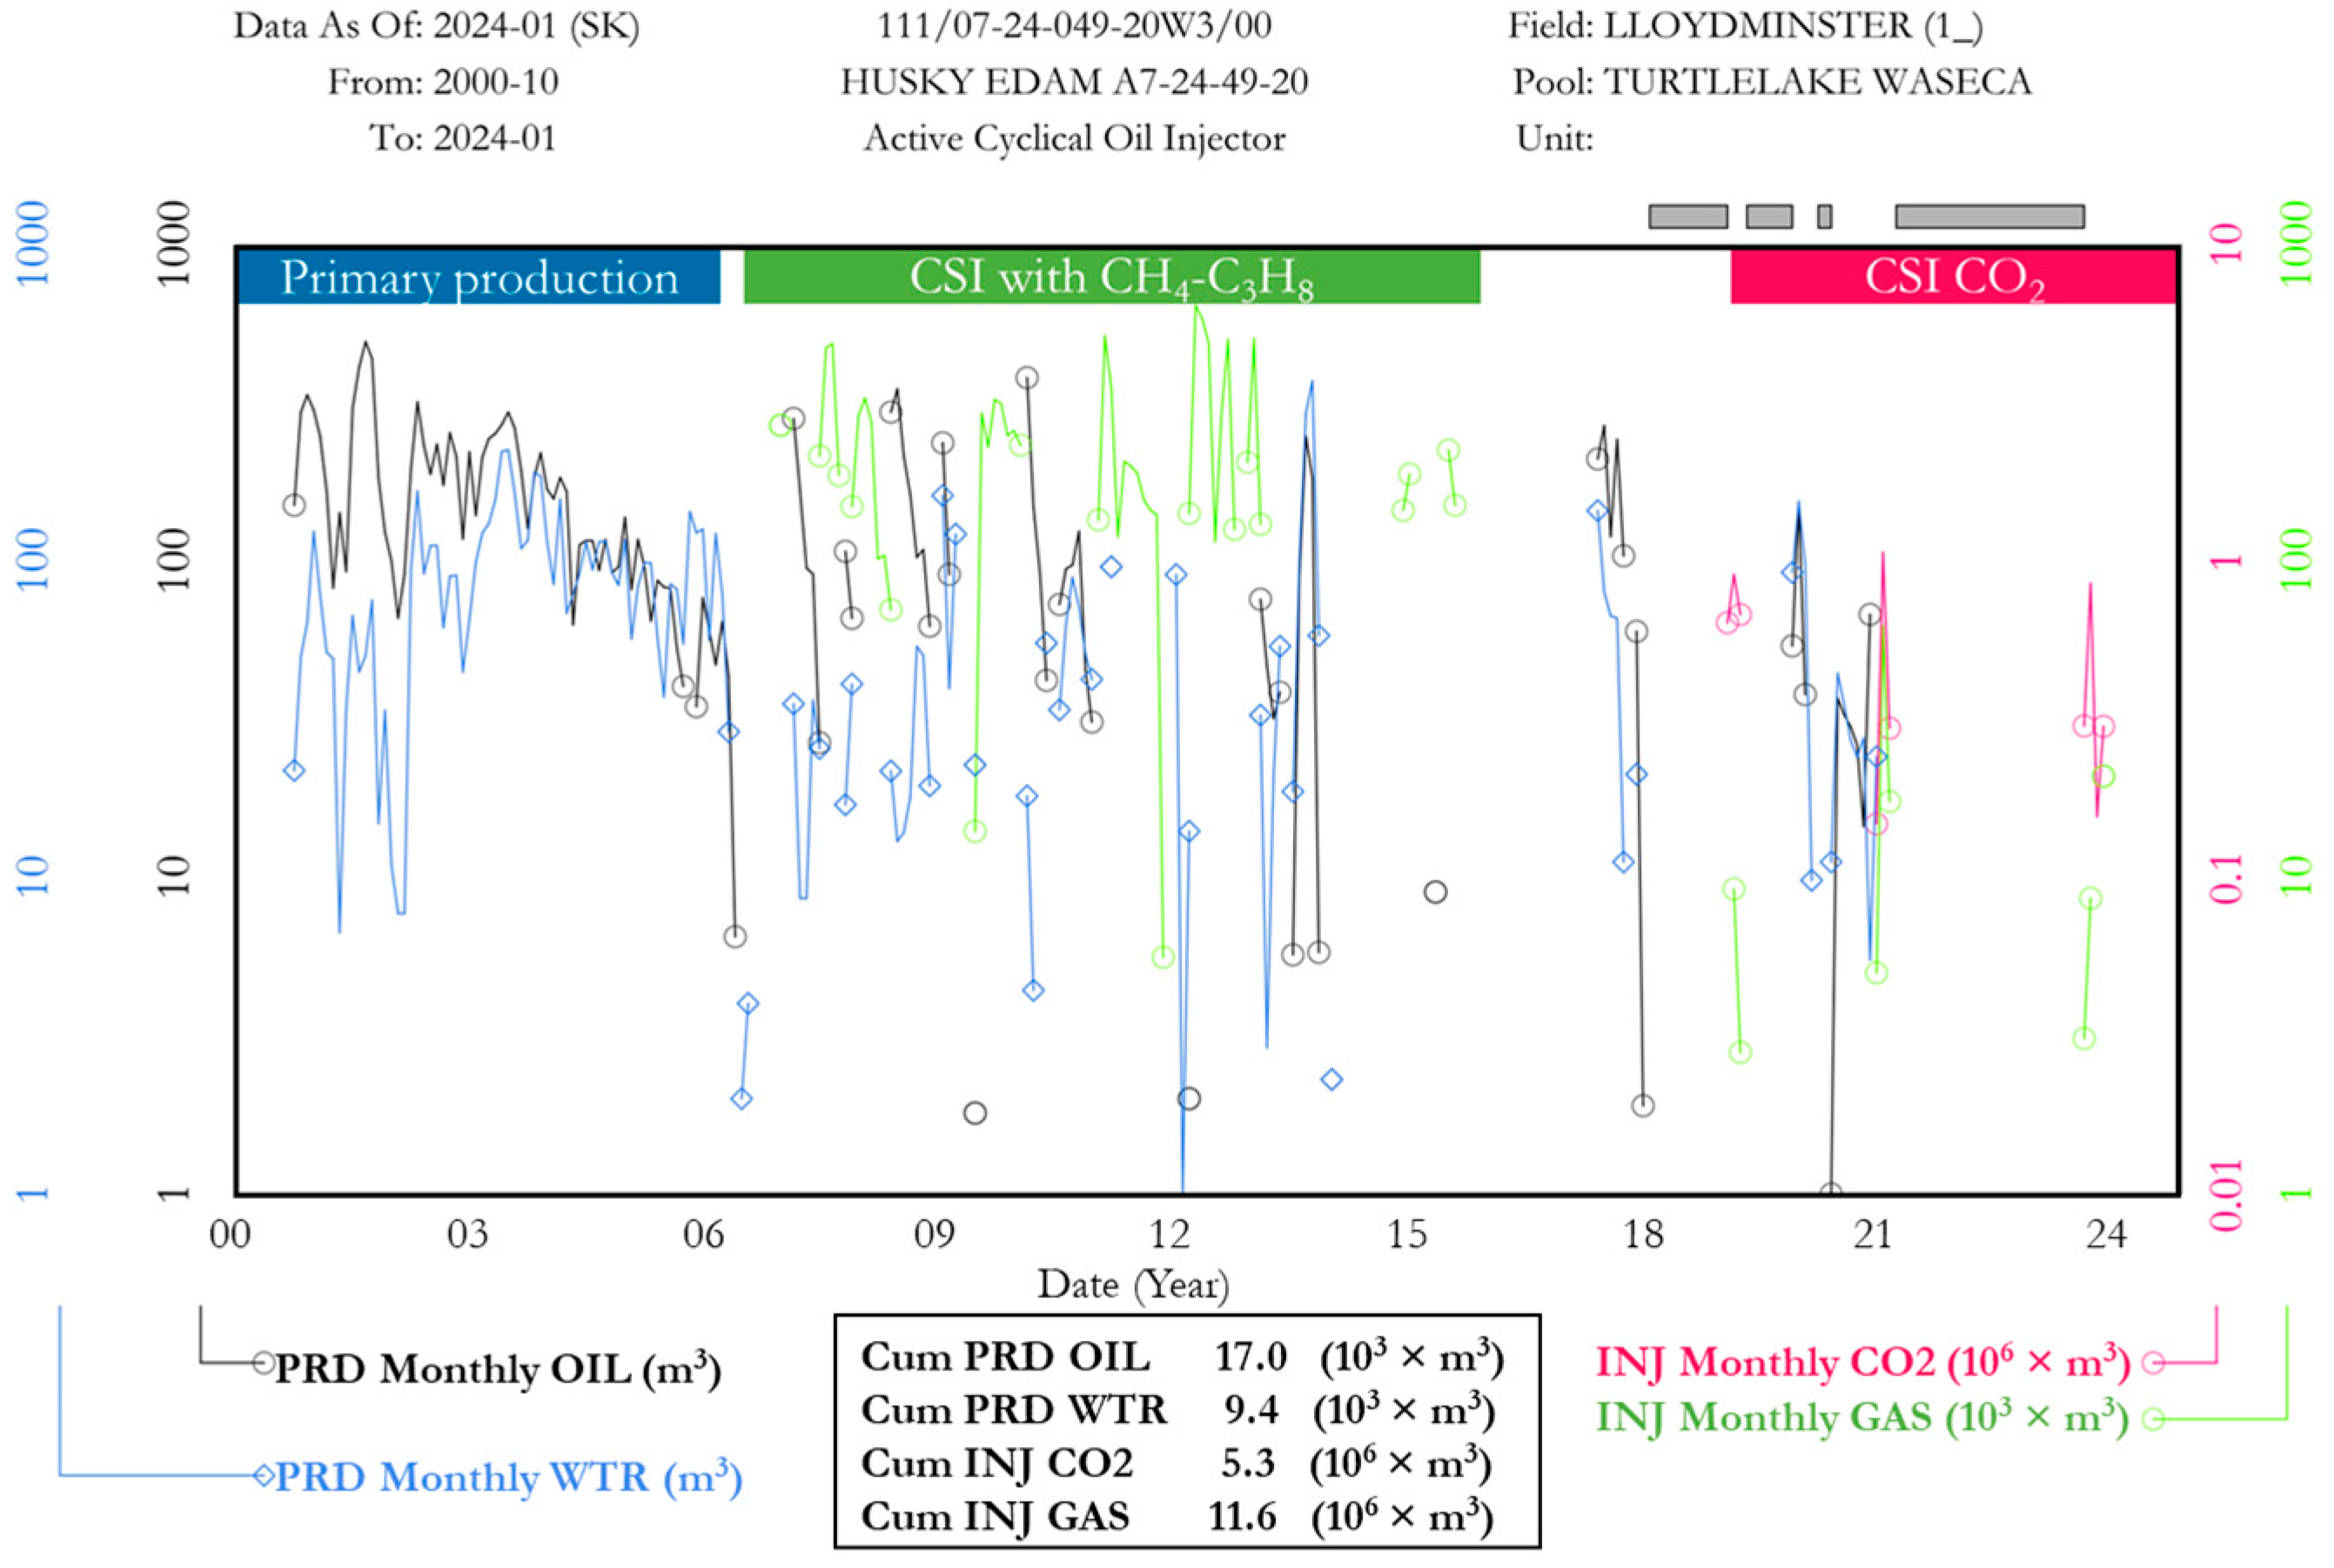
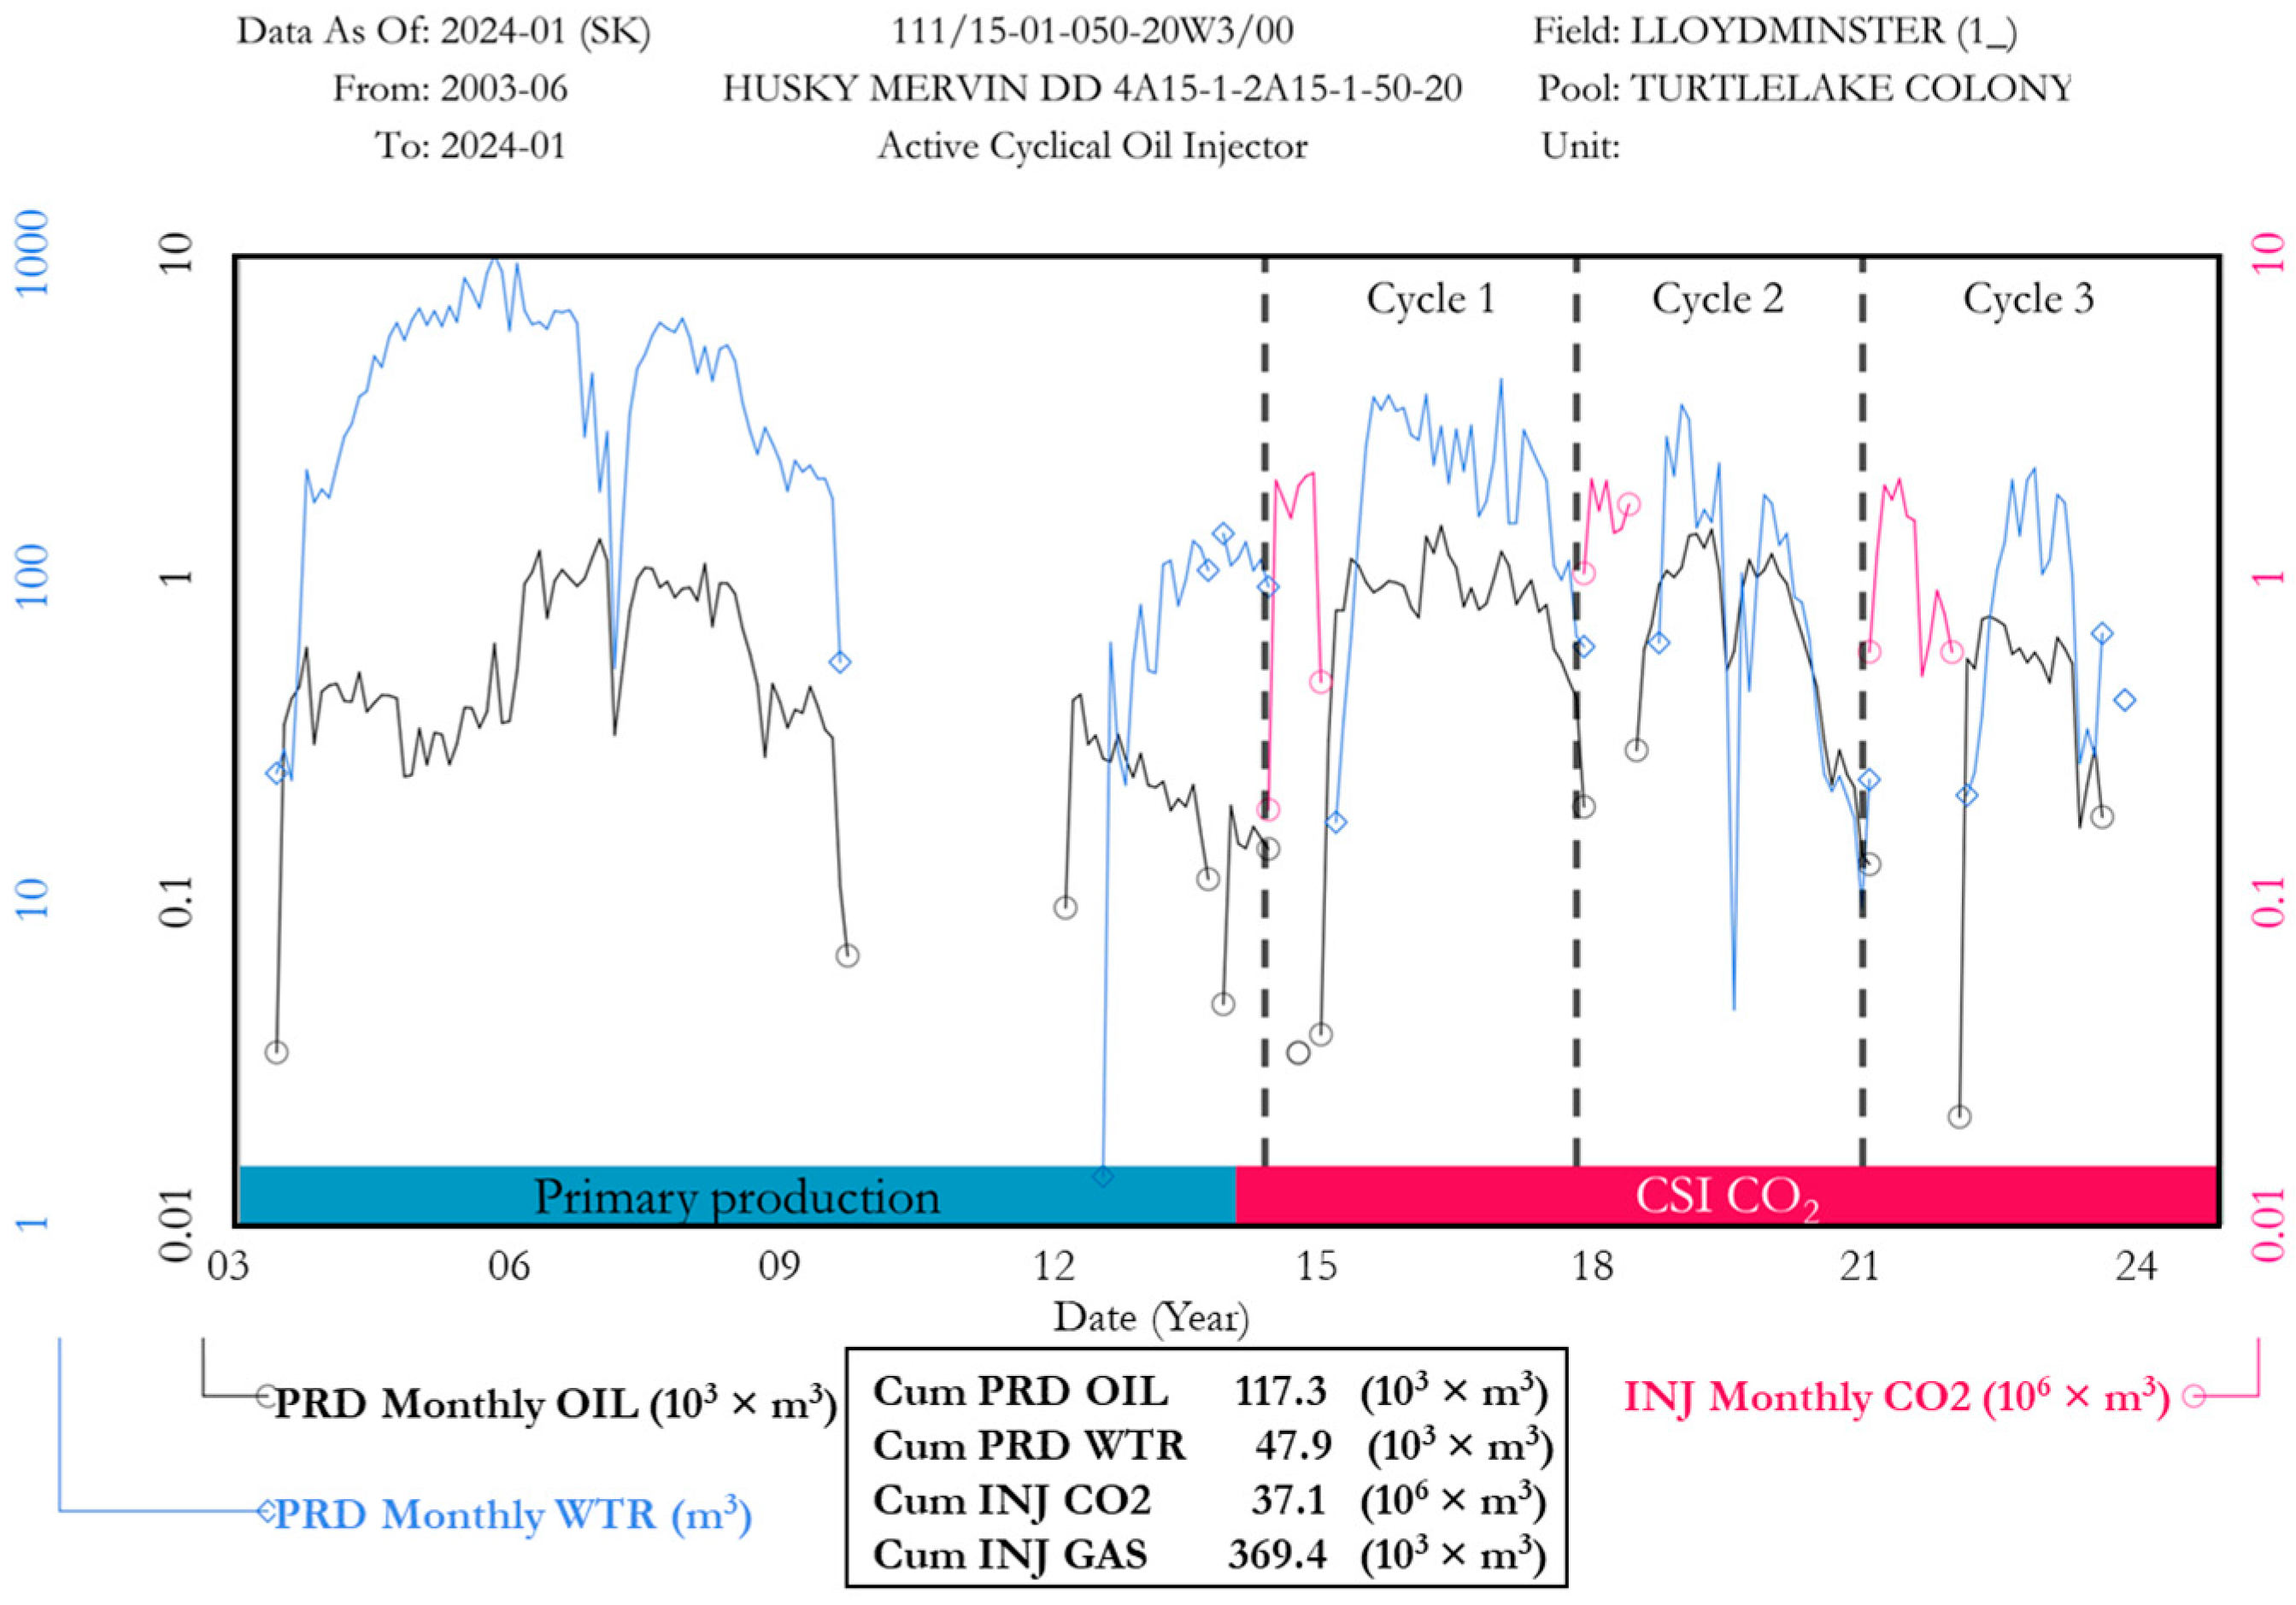
3.3. Recent CSI Pilot Projects and Case Studies
4. Conclusions and Remarks
Author Contributions
Funding
Data Availability Statement
Acknowledgments
Conflicts of Interest
References
- BP. Statistical Review of World Energy; BP Plc: London, UK, 2020. [Google Scholar]
- Canada Energy Regulator. Crude Oil Annual Export Summary—2025. 2025. Available online: https://www.cer-rec.gc.ca/en/data-analysis/energy-commodities/crude-oil-petroleum-products/statistics/crude-oil-export-summary/index.html (accessed on 8 May 2025).
- Coskuner, G.; Naderi, K.; Babadagli, T. An enhanced oil recovery technology as a follow up to cold heavy oil production with sand. J. Pet. Sci. Eng. 2015, 133, 475–482. [Google Scholar] [CrossRef]
- Zhao, D.W.; Wang, J.; Gates, I.D. Thermal recovery strategies for thin heavy oil reservoirs. Fuel 2014, 117, 431–441. [Google Scholar] [CrossRef]
- Coskuner, G.; Huang, H. Enhanced oil recovery in post-CHOPS cold heavy oil production with sand heavy oil reservoirs of Alberta and Saskatchewan part 2: Field piloting of cycling solvent injection. In Proceedings of the Society of Petroleum Engineers—SPE Canada Heavy Oil Conference 2020, CHOC 2020, Calgary, Canada, 15–16 September 2020; Volume 3. [Google Scholar]
- Dusseault, M.B. CHOPS: Cold Heavy Oil Production with Sand in the Canadian Heavy Oil Industry; Alberta Goernment: Waterloo, Canada, 2002. [Google Scholar]
- Shokri, A.R.; Babadagli, T. Modelling of Cold Heavy-Oil Production with Sand For Subsequent Thermal/Solvent Injection Applications. J. Can. Pet. Technol. 2014, 53, 095–108. [Google Scholar] [CrossRef]
- Istchenko, C.M.; Gates, I.D. Well/wormhole model of cold heavy-oil production with sand. SPE J. 2014, 19, 260–269. [Google Scholar] [CrossRef]
- Fjær, E.; Holt, R.M.; Horsrud, P.; Raaen, A.M.; Risnes, R. Petroleum Related Rock Mechanics; Elsevier: Amsterdam, The Netherlands, 2008. [Google Scholar]
- Fattahpour, V.; Roostaei, M.; Mahmoudi, M.; Soroush, M.; Hosseini, S.A.; Anderson, M. Standalone sand control evaluation: Developing a large-scale high temperature sand retention test apparatus. In Proceedings of the SPE Canada Heavy Oil Conference 2020, Calgary, Canada, 15–16 September 2020. [Google Scholar]
- Naderi, K.; Romaniuk, N.; Ozum, B. Improvement of the CHOPS process efficiency. In Proceedings of the SPE Kuwait Oil and Gas Show and Conference, Mishref, Kuwait, 11–14 October 2015. [Google Scholar]
- Plata, M.; Bryan, J.; Kantzas, A. Experimental study of heavy oil recovery mechanisms during cyclic solvent injection processes. In Proceedings of the SPE Annual Technical Conference and Exhibition, Orlando, FL, USA, 7–10 May 2018; No. June. pp. 24–26. [Google Scholar]
- Li, X.; Sun, X.; Yang, Z.; Gong, H.; Li, T.; Shi, X. Experimental study on chemical-assisted methane flooding for foamy oil reservoirs after primary production. J. Pet. Sci. Eng. 2022, 216, 110803. [Google Scholar] [CrossRef]
- Luo, P.; Li, S.; Knorr, K.D.; Nakutnyy, P. A New PVT Apparatus for Automatic Measurement of Foamy Oil Generation and Stability. In Proceedings of the PE Canada Heavy Oil Technical Conference, CHOC 2018, Calgary, Canada, 13–14 March 2018; Volume 2018-Janua. [Google Scholar]
- Maini, B. Foamy Oil Flow in Primary Production of Heavy Oil under Solution Gas Drive. In Proceedings of the Annual Technical Conference and Exhibition, Houston, TX, USA, 3–6 October 1999. [Google Scholar]
- Shen, C.; Hamm, M.L.; Bdair, M. Improving cold heavy oil development at peace river with the understanding of foamy-oil dynamics. In Proceedings of the SPE Kuwait Oil and Gas Show and Conference, Mishref, Kuwait, 11–14 October 2015. [Google Scholar]
- Wu, M.; Lu, X.; Yang, J.; Lin, Z.; Zeng, F. Experimental analysis of optimal viscosity for optimizing foamy oil behavior in the porous media. Fuel 2020, 262, 116602. [Google Scholar] [CrossRef]
- Wang, H.; Torabi, F.; Zeng, F.; Xiao, H. A novel visualization approach for foamy oil non-equilibrium phase behavior study of solvent/live heavy oil systems. Fuel 2020, 272, 117648. [Google Scholar] [CrossRef]
- Du, Z.; Zeng, F.; Chan, C. Effects of pressure decline rate on the post-CHOPS cyclic solvent injection process. In Proceedings of the Society of Petroleum Engineers—SPE Heavy Oil Conference Canada 2014, Calgary, Canada, 10 June 2014; Volume 3, pp. 1979–1996. [Google Scholar]
- Lu, T.; Li, Z.; Fan, W.; Li, S. CO2 huff and puff for heavy oil recovery after primary production. Greenh. Gases Sci. Tecnol. 2016, 6, 288–301. [Google Scholar] [CrossRef]
- Yang, S.; Yang, D. Integrated characterization of wormhole network by use of a modified pressure-gradient-based (PGB) sand failure criterion and ensemble-based history matching during CHOPS processes. J. Pet. Sci. Eng. 2022, 208, 109777. [Google Scholar] [CrossRef]
- Cartagena-Pérez, D.F.; Alzate-Espinosa, G.A.; Arbelaez-Londoño, A. Conceptual evolution and practice of sand management. J. Pet. Sci. Eng. 2022, 210, 110022. [Google Scholar] [CrossRef]
- Jiang, L.; Liu, J.; Liu, T.; Yang, D. Characterization of Dynamic Wormhole Growth and Propagation During CHOPS Processes by Integrating Rate Transient Analysis and Pressure-Gradient-Based Sand Failure Criterion. In Proceedings of the SPE Canadian Energy Technology Conference, Calgary, Canada, 16–17 March 2022. [Google Scholar]
- Lei, X.; Gang, Z. A novel approach for determining wormhole coverage in CHOPS wells. In Proceedings of the PE Heavy Oil Conference Canada 2012, Calgary, Canada, 12–14 June 2012; Volume 2, pp. 1531–1549. [Google Scholar]
- Xiao, L.; Zhao, G. Integrated study of foamy oil flow and wormhole structure in CHOPS through transient pressure analysis. In Proceedings of the SPE Heavy Oil Conference Canada, Calgary, Canada, 11–13 June 2013; Volume 3, pp. 1946–1960. [Google Scholar]
- Shokri, A.R.; Babadagli, T. Feasibility Assessment of Heavy-oil Recovery by CO2 Injection After Cold Production with Sands: Lab-to-Field Scale Modeling Considering Non-Equilibrium Foamy Oil Behavior. Appl. Energy 2017, 205, 615–625. [Google Scholar] [CrossRef]
- Yu, H.; Leung, J.Y. A Sand-Arch Stability Constrained Dynamic Fractal Wormhole Growth Model for Simulating Cold Heavy-Oil Production with Sand. SPE J. 2020, 25, 3440–3456. [Google Scholar] [CrossRef]
- Oldakowski, K.; Sawatzky, R.P. Direction of wormholes growth under anisotropic stress. In Proceedings of the SPE Canada Heavy Oil Technical Conference, Calgary, Canada, 13–14 March 2018. [Google Scholar]
- Pereira, M. A Physical Model to Assess Sand Production Processes during Cold Heavy Oil Production with Sand. Ph.D. Thesis, University of Saskatchewan, Saskatoon, Canada, 2021. [Google Scholar]
- Meza-Díaz, B.; Sawatzky, R.; Kuru, E. Sand on Demand: A Laboratory Investigation on Improving Productivity in Horizontal Wells Under Heavy-Oil Primary Production—Part II. SPE J. 2012, 17, 1012–1028. [Google Scholar] [CrossRef]
- Mathur, B.; Dandekar, A.Y.; Khataniar, S.; Patil, S.L. Life after CHOPS: Alaskan heavy oil perspective. In Proceedings of the SPE Western Regional Meeting Proceedings, Bakersfield, CA, USA, 23–27 April 2017; Volume 2017, pp. 914–927. [Google Scholar]
- Chang, J.; Ivory, J.; London, M. History matches and interpretation of CHOPS performance for CSI field pilot. In Proceedings of the Society of Petroleum Engineers—SPE Canada Heavy Oil Technical Conference 2015, CHOC 2015, Calgary, Canada, 9–11 June 2015; pp. 526–544. [Google Scholar]
- Oldakowski, K.; Sawatzky, R.P. Wormhole stability under post chops conditions. In Proceedings of the Society of Petroleum Engineers—SPE Canada Heavy Oil Technical Conference, CHOC 2018, Calgary, Canada, 13–14 March 2018; Volume 2018. [Google Scholar]
- Mohamad-Hussein, A.; Mendoza, P.E.V.; Delbosco, P.F.; Sorgi, C.; De Gennaro, V.; Subbiah, S.K.; Ni, Q.; Serra, J.M.S.; Lakshmikantha, M.R.; Iglesias, J.A.; et al. Geomechanical modelling of cold heavy oil production with sand. Petroleum 2022, 8, 66–83. [Google Scholar] [CrossRef]
- Shokri, A.R.; Babadagli, T. A sensitivity analysis of cyclic solvent stimulation for post-CHOPS EOR: Application on an actual field case. SPE Econ. Manag. 2016, 8, 78–89. [Google Scholar] [CrossRef]
- Jamaloei, B.Y.; Kharrat, R.; Torabi, F. Analysis and correlations of viscous fingering in low-tension polymer flooding in heavy oil reservoirs. Energy Fuels 2010, 24, 6384–6392. [Google Scholar] [CrossRef]
- Lin, Z. Experimental Study About Radial Viscous Fingering in Heavy Oil Reservoir. Master’s Thesis, University of Regina, Regina, Canada, 2020. [Google Scholar]
- Maas, J.G.; Springer, N.; Hebing, A.; Snippe, J.; Berg, S. Viscous fingering in CCS—A general criterion for viscous fingering in porous media. Int. J. Greenh. Gas Control 2024, 132, 104074. [Google Scholar] [CrossRef]
- Soliman, A.A.; Aboul-Fetouh, M.E.; Gomaa, S.; Aboul-Fotouh, T.M.; Attia, A.M. Optimizing in-situ upgrading of heavy crude oil via catalytic aquathermolysis using a novel graphene oxide-copper zinc ferrite nanocomposite as a catalyst. Sci. Rep. 2024, 14, 25845. [Google Scholar] [CrossRef]
- Soh, Y.; Rangriz-Shokri, A.; Babadagli, T. Optimization of methane use in cyclic solvent injection for heavy-oil recovery after primary production through experimental and numerical studies. Fuel 2018, 214, 457–470. [Google Scholar] [CrossRef]
- Li, Y.; Wang, Z.; Hu, Z.; Xu, B.; Li, Y.; Pu, W.; Zhao, J. A review of in situ upgrading technology for heavy crude oil. Petroleum 2021, 7, 117–122. [Google Scholar] [CrossRef]
- Krumrine, P.H.; Lefenfeld, M.; Romney, G.A. Investigation of post CHOPS enhanced oil recovery of alkali metal silicide technology. In Proceedings of the SPE Heavy Oil Conference Canada 2014, Calgary, Canada, 12 June 2014; Volume 3, pp. 1634–1650. [Google Scholar]
- Du, Z.; Zeng, F.; Chan, C. An experimental study of the post-CHOPS cyclic solvent injection process. J. Energy Resour. Technol. Trans. ASME 2015, 137, 1–15. [Google Scholar] [CrossRef]
- Bairq, Z.A.S.; Gao, H.; Huang, Y.; Zhang, H.; Liang, Z. Enhancing CO2 desorption performance in rich MEA solution by addition of SO42−/ZrO2/SiO2 bifunctional catalyst. Appl. Energy 2019, 252, 113440. [Google Scholar] [CrossRef]
- Bairq, Z.; Pang, Y.; Li, J.; Hezam, A.; Tontiwachwuthikul, P.; Chen, H. Reducing energy requirements and enhancing MEA-CO2 desorption rates in amine solutions with KIT-6 nanostructures. Sep. Purif. Technol. 2024, 346, 127536. [Google Scholar] [CrossRef]
- Huerta, M.; Alvarez, J.M.; Jossy, E.; Forshner, K. Use of acid gas (CO2/H2S) for the Cyclic Solvent Injection (CSI) process for heavy oil reservoirs. In Proceedings of the Society of Petroleum Engineers—SPE Heavy Oil Conference Canada 2012, Calgary, Canada, 12–14 June 2012; Volume 2, pp. 912–921. [Google Scholar]
- Perez, D.C.; Shokri, A.R.; Zambrano, G.; Pantov, D.; Wang, Y.; Chalaturnyk, R.; Hawkes, C. Scaled Physical Modeling of Cyclic CO2 Injection in Unconsolidated Heavy Oil Reservoirs Using Geotechnical Centrifuge and Additive Manufacturing Technologies. In Proceedings of the SPE Canadian Energy Technology Conference and Exhibition, Calgary, Canada, 12–13 March 2024. [Google Scholar]
- Chang, J.; Ivory, J. Field-scale simulation of cyclic solvent injection (CSI). J. Can. Pet. Technol. 2013, 52, 251–265. [Google Scholar] [CrossRef]
- Shokri, A.R.; Babadagli, T. Field scale modeling of CHOPS and solvent/thermal based post CHOPS EOR applications considering non-equilibrium foamy oil behavior and realistic representation of wormholes. J. Pet. Sci. Eng. 2016, 137, 144–156. [Google Scholar] [CrossRef]
- Shokri, A.R.; Babadagli, T. Laboratory Measurements and Numerical Simulation of Cyclic Solvent Stimulation with a Thermally Aided Solvent Retrieval Phase in the Presence of Wormholes after Cold Heavy Oil Production with Sand. Energy Fuels 2016, 30, 9181–9192. [Google Scholar] [CrossRef]
- Rivero, J.A.; Coskuner, G.; Asghari, K.; Law, D.H.; Pearce, A.; Newman, R.; Birchwood, R.; Zhao, J.; Ingham, J. Modeling CHOPS Using a Coupled Flow-Geomechanics Simulator with Nonequilibrium Foamy-Oil Reactions: A Multiwell History Matching Study. In Proceedings of the SPE Annual Technical Conference and Exhibition, Florence, Italy, 20–22 September 2010. [Google Scholar]
- Shokri, A.R.; Babadagli, T. An approach to model CHOPS (cold heavy oil production with sand) and post-CHOPS applications. In Proceedings of the SPE Annual Technical Conference and Exhibition, San Antonio, TX, USA, 8–10 October 2012; Volume 3, no. 1. pp. 2305–2316. [Google Scholar]
- Haddad, A.S.; Gates, I. Modelling of Cold Heavy Oil Production with Sand (CHOPS) using a fluidized sand algorithm. Fuel 2015, 158, 937–947. [Google Scholar] [CrossRef]
- Vanderheyden, B.; Jayaraman, B.; Ma, X.; Zhang, D. Multiscale Simulation of CHOPS Wormhole Networks. In Proceedings of the SPE Reservoir Simulation Symposium, Woodlands, TX, USA, 18 February 2013. [Google Scholar]
- Ma, H.; Yu, G.; She, Y.; Gu, Y. A new hybrid production optimization algorithm for the combined CO2-cyclic solvent injection (CO2-CSI) and water/gas flooding in the post-CHOPS reservoirs. J. Pet. Sci. Eng. 2018, 170, 267–279. [Google Scholar] [CrossRef]
- Zhang, M.; Du, Z.; Zeng, F.; Xu, S. Upscaling study of cyclic solvent injection process for post-chops reservoirs through numerical simulation. In Proceedings of the Society of Petroleum Engineers—SPE Heavy Oil Conference Canada 2014, Calgary, Canada, 10 June 2014; Volume 3, pp. 1651–1669. [Google Scholar]
- Gamboa, J.J.M.; Leung, J.Y. Design of field-scale cyclic solvent injection processes for post-CHOPS applications. Can. J. Chem. Eng. 2019, 97, 123–132. [Google Scholar] [CrossRef]
- Chang, J.; Ivory, J.; Beaulieu, G. Pressure maintenance at post-CHOPS cyclic solvent injection (CSI) well using gas injection at offset well. In Proceedings of the SPE Heavy Oil Conference, Mangaf, Kuwait, 8–10 December 2014; Volume 2, pp. 1387–1409. [Google Scholar]
- Tang, X.; Yu, C.; Bai, Y.; Lu, H.; Mohamed, M.S. Field Trial of Nitrogen-Assisted Cyclic Steam Stimulation in Post-CHOPS Wells, Case Study in Sudan. In Proceedings of the SPE Thermal Well Integrity and Production Symposium, Banff, Canada, 30 November 2022. [Google Scholar]
- Jia, X.; Zhu, Q.; Wang, K.; Jiao, B.; Guo, E.; Qu, T.; Wu, K.; Chen, Z. Numerical simulation of foamy-oil flow in a cyclic solvent injection process. Fuel 2023, 333, 126259. [Google Scholar] [CrossRef]
- Layeghpour, S. Geotechnical Centrifuge Experiments to Improve Understanding of Sand Production from Heavy Oil Reservoirs. Ph.D. Thesis, University of Saskatchewan, Saskatoon, Canada, 2021. [Google Scholar]


| Property | Value |
|---|---|
| Depth (m) | 480 |
| Net pay (m) | 5 |
| Porosity (%) | 33 |
| Permeability (Darcies) | 2 to 4 |
| Oil saturation (%) | 80 |
| Initial reservoir pressure (kPa) | 2750 |
| Reservoir temperature (°C) | 20 |
| Dead-oil viscosity (cp) | 25,000 |
| Formation compressibility (kPa−1) | 5 × 10⁻⁶ |
| Wormhole radius (m) | 0.05 |
| Primary Driver Category | Consequence |
|---|---|
| Gravity | Causes vertical stress from overlying rocks and impacts rock yielding and dilation |
| Pressure drop | Viscous force drives fluids to production well |
| Foamy oil | Enhances production via gas nucleation and fluid expansion dynamics |
| Sand production | Increases reservoir permeability and boosts extraction efficiency |
| Wellbore damage | Maintains flow by clearing obstructive deposits (e.g., asphaltenes, fine-grained particles, or mineral deposits). |
| No. | Reference | Initial Porosity [%] | Final Porosity [%] |
|---|---|---|---|
| 1 | [29]—Sandstone low density | 36.31 | 85.61 |
| 2 | [29]—Max. density of 1860 kg/m3 | 36.31 | 79.86 |
| 3 | [29]—Experiment 2, Low density sandstone density | 31.03 | 71.85 |
| 4 | [29]—Experiment 2, max density of 1860 kg/m3 | 31.03 | 70.65 |
| 5 | [29]—Experiment 3, max density of 1860 kg/m3 | 31.03 | 85.47 |
| 6 | [29]—Experiment 3, max density of 1860 kg/m3 | 31.03 | 83.86 |
| 7 | [30]—Silica well sorted | 41.08 | 57.30 |
| 8 | [30]—Silica poorly sorted | 32.2 | 41.65 |
| 9 | [30]—Silica well sorted 2 | 40.82 | 53.87 |
| 10 | [30]—Silica no fine fraction | 38.4 | 48.6 |
| 11 | [30]—Husky field | 38.2 | 62 |
| 12 | [31] * | 20.56 | 60 |
| 13 | [32] | 21.80 | 52.99 |
| 14 | [33] | 37 | 46 |
| 15 | [34] * | 32 | 60 |
| 15 | [34] * | 32 | 60 |
| 16 | [21] ξ | 32 | 52 |
| Mean | 33.18 | 63.23 | |
| Standard Deviation | 5.69 | 14.01 |
| Oil/Reservoir | Viscosity [mPa·s] (Temperature) | Solvent | Viscosity After Dissolution [mPa·s] |
|---|---|---|---|
| Lloydminster | 7600 (20°) | Propane | 2000 |
| Athabasca | 148 (104°) | Propane | 8.6 |
| Cold lake | 70,000 (20°) | Ethane | 80 |
| Athabasca bitumen | 700,000(20) | Toluene | 2000 |
| Frog lake | 18,600 (21.6 °C) | Butane | 8 |
| Du84, Liaohe | 400,000 (60 °C) | Toluene | 291.8 |
| Gao3624, Liaohe | 600 (50°) | CO2 | 150 |
| Fengcheng, Xinjiang | 21,584 (25.6°) | Propane | 4362 |
| Continuous Solvent Injection | Cyclic Solvent Injection | |
|---|---|---|
| Operation Strategy | Two types: Vapex and Lateral SVX | Huff—n-puff |
| Driving Mechanisms |
|
|
| EOR Mechanisms |
|
|
| Rules of Wormholes | Establish communication between the injector and the producer. They may cause solvent quick breakthrough. | Increase contact area for solvent and crude oil. Help the diluted oil flow to the producer. |
| Main Challenges |
|
|
| Geomechanics Implications |
|
|
| Mechanism | Explanation | References |
|---|---|---|
| Larger wormhole network or cavities | The wellbores with well-developed wormholes or cavity areas have a larger contact area for the solvent to act. It has been observed in the field experience that wells with good performance during CHOPS have higher production during the CSI. | [5] |
| Re-energization | Due to the injection of solvent, the increase in the pore pressure derived in a re-energization of the reservoir. This means a higher reservoir pressure around the wellbore to facilitate the production. | [35] |
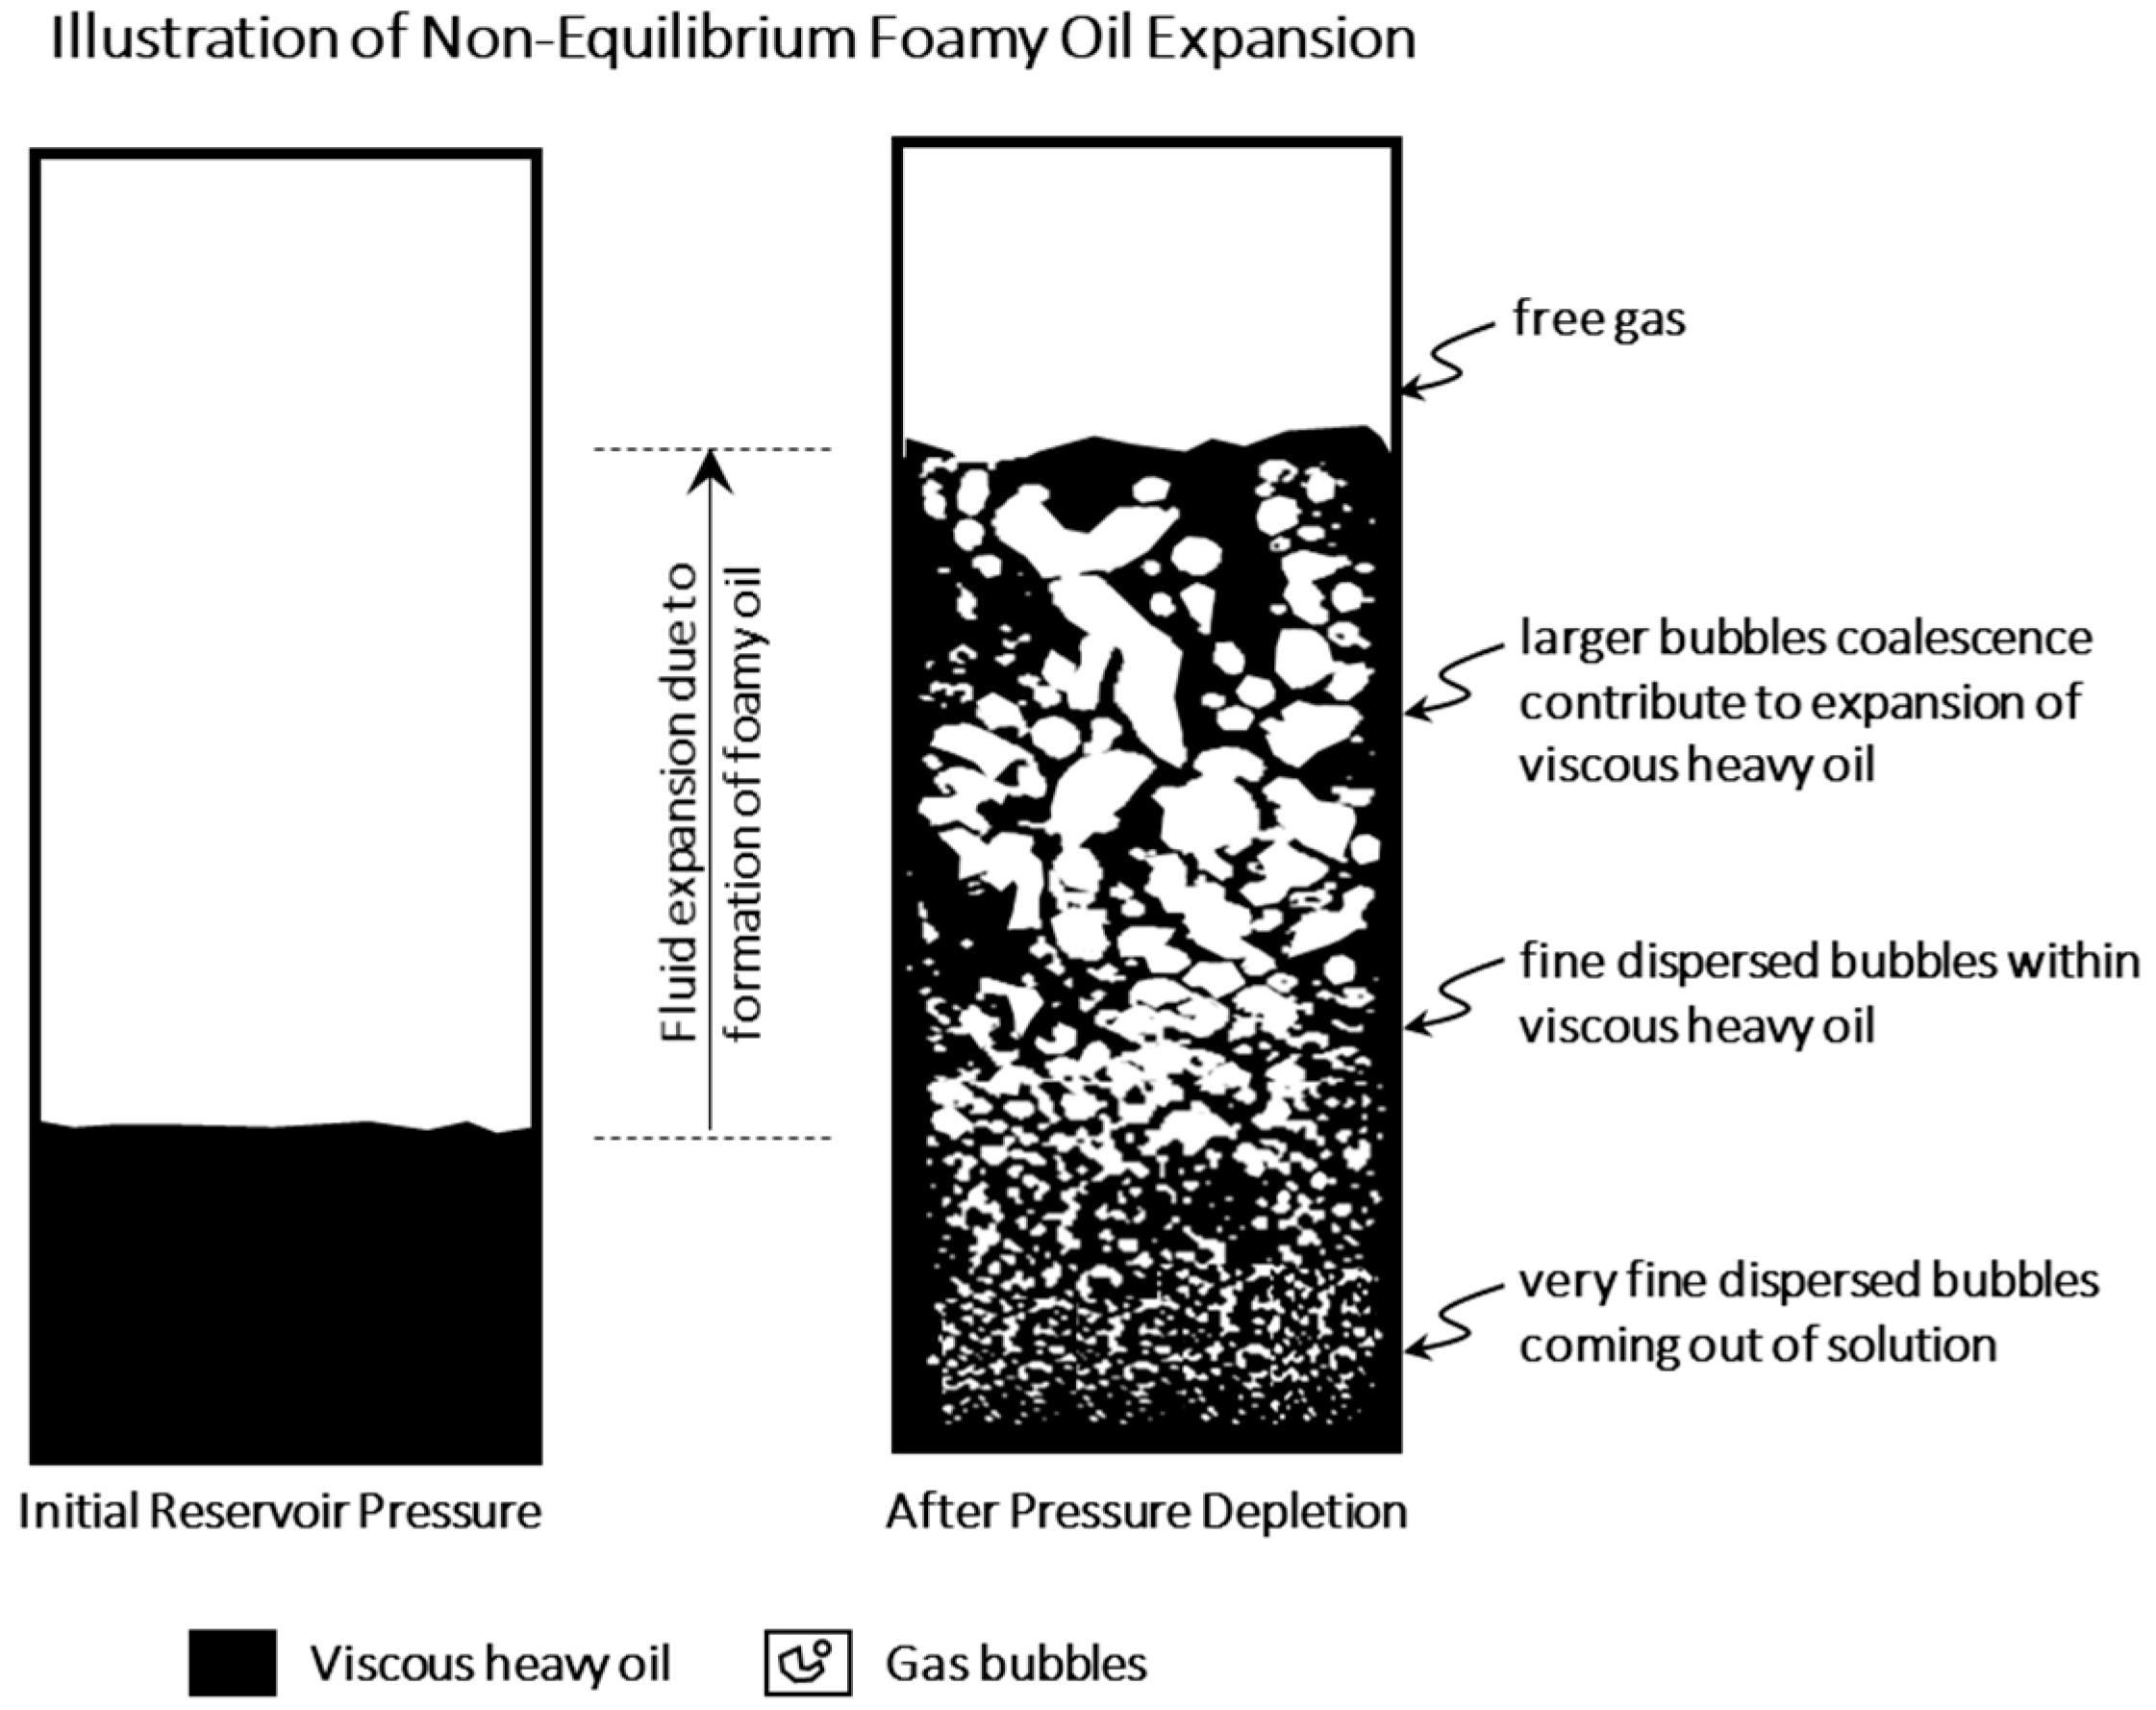
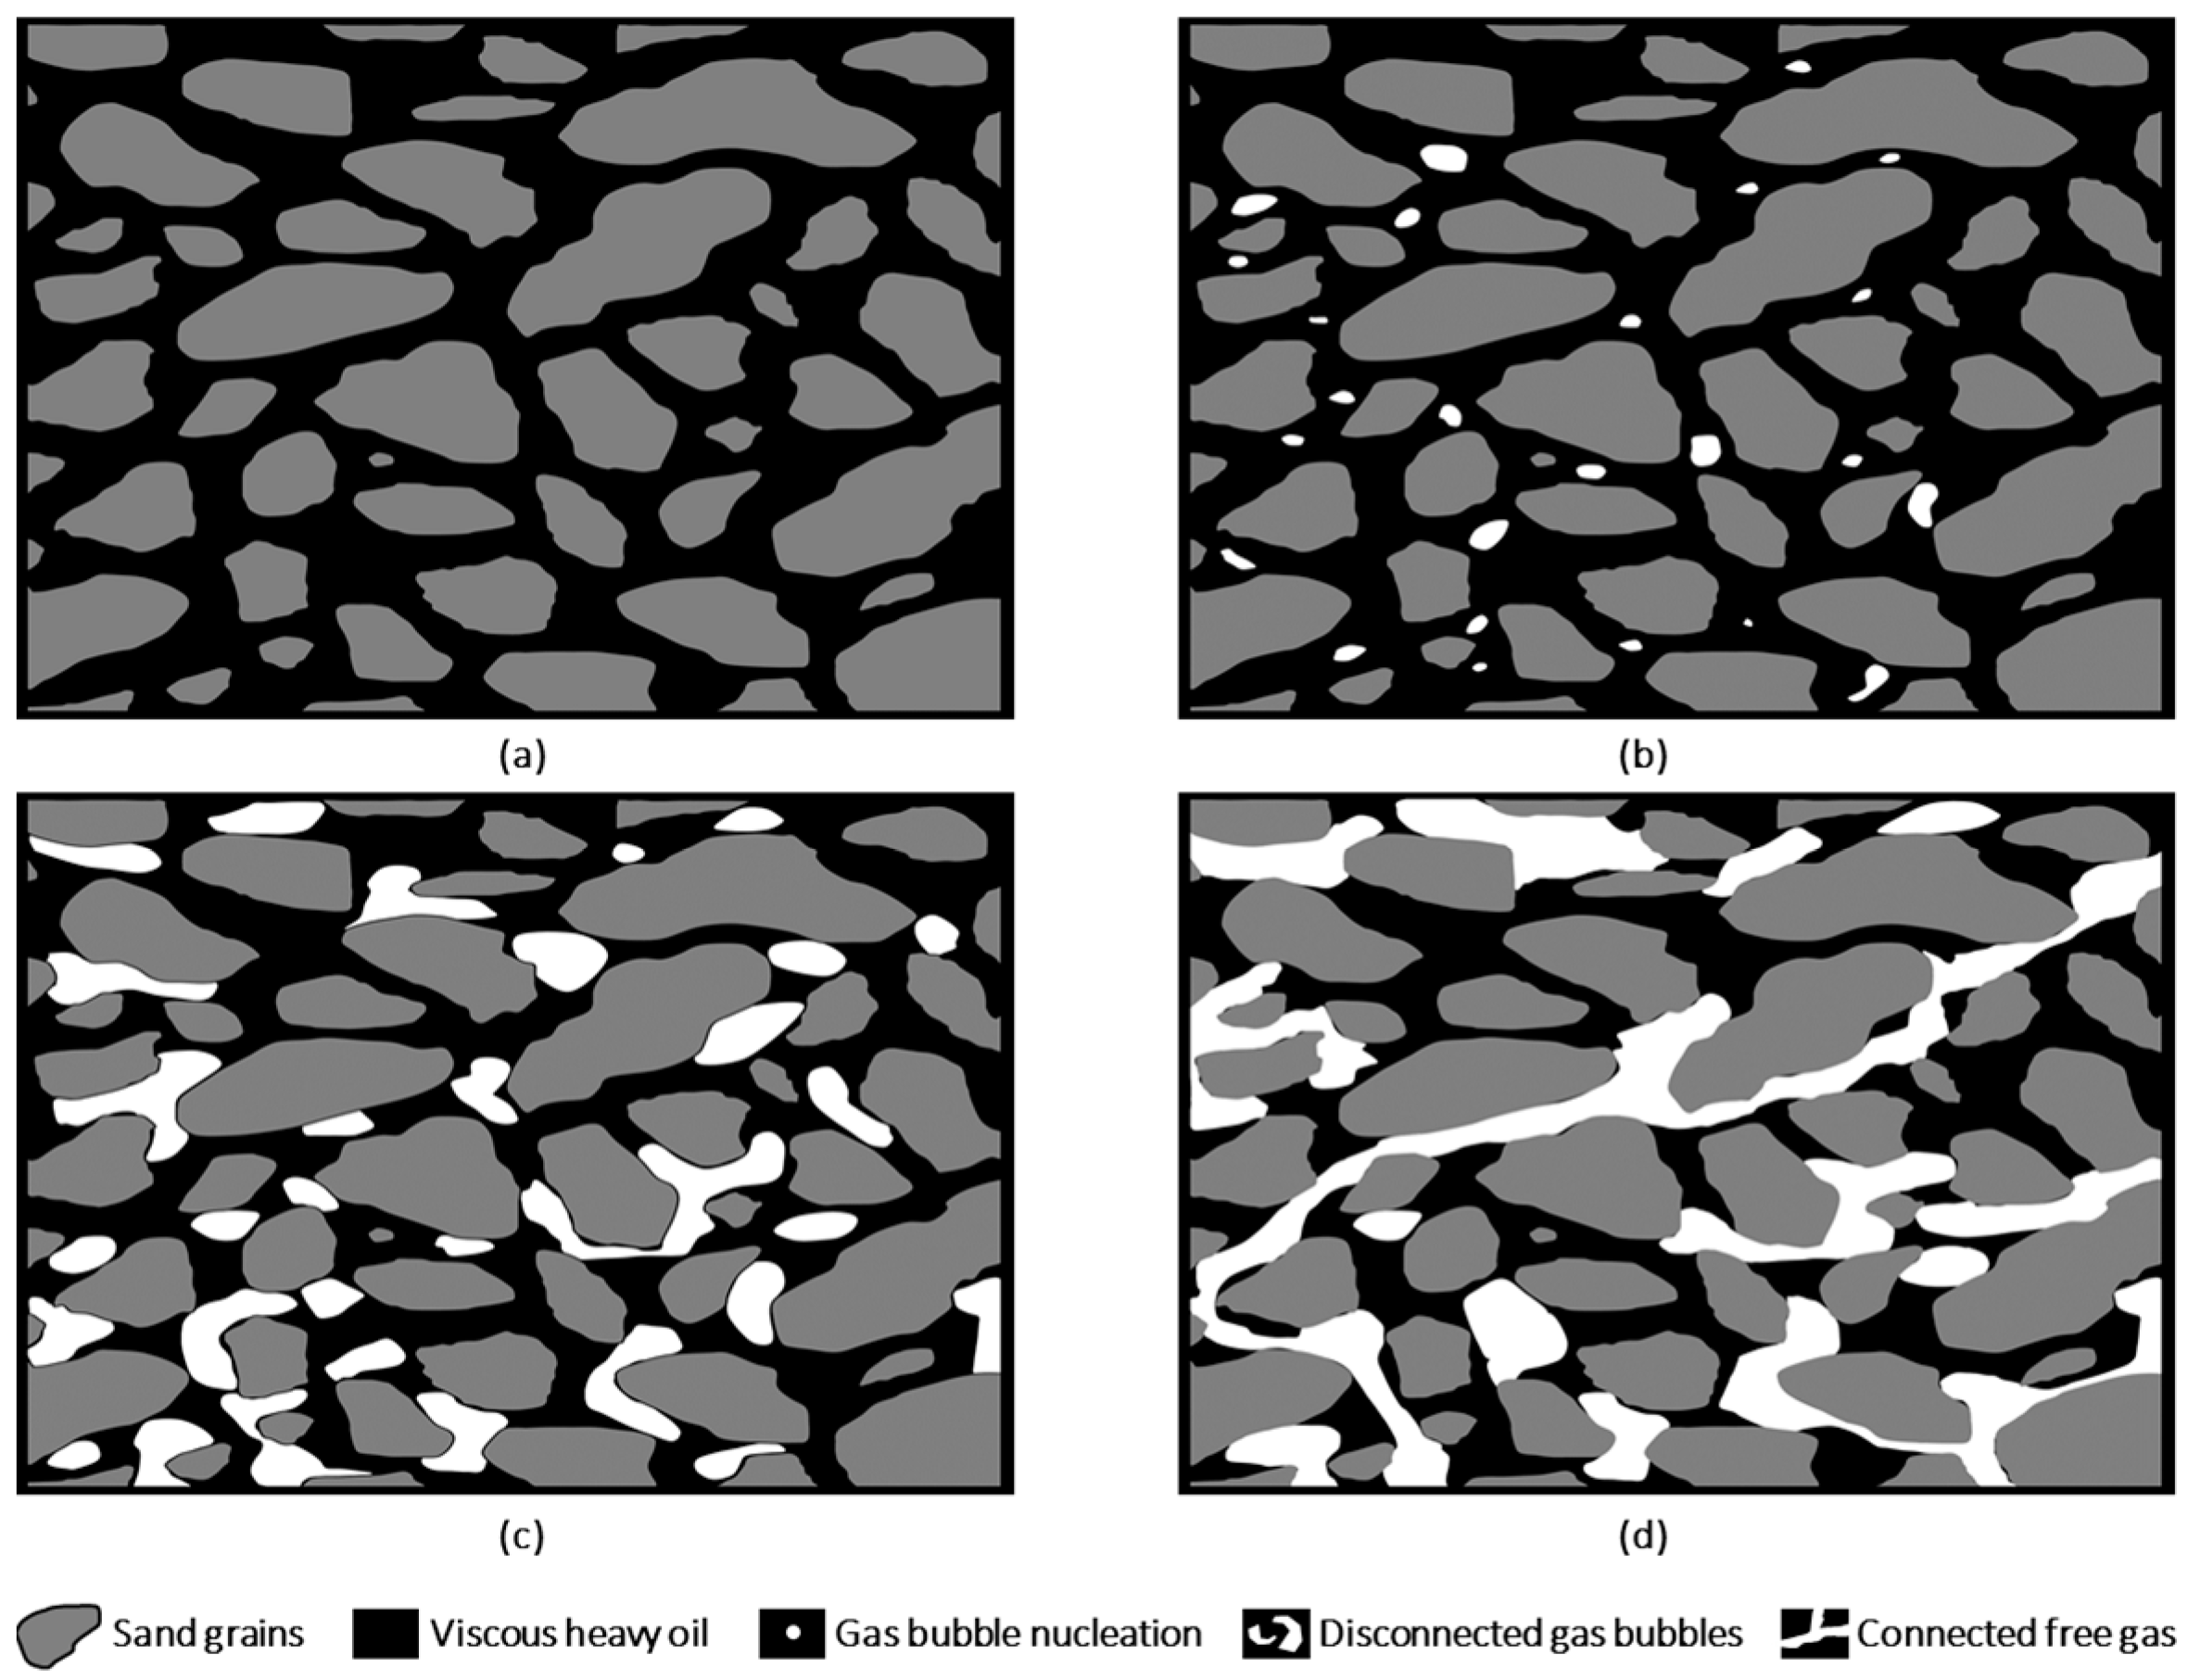
| Foamy oil | Experimental approaches have shown that the foamy oil promoted by the CO2 as a discontinuous phase may play a key role in the recovery due to the expansion of it during the drawdown. | [60] |
| Increase in the compaction | Physical modeling of post-CHOPS reservoirs concludes that geomechanical driving mechanics are key by influencing the flow behavior and pressure distribution in CO2-CSI processes. | [29,47,61] |
| Capillarity mixing | During the production stage, the zone around the wormholes reduces its saturation of oil. During the injection and soaking periods, and due to the capillary forces and wettability of the formation, there is a redistribution of saturations, allowing the oil to migrate from the far to the near zone surrounding the wormholes or cavities. | [43] |
| Reduction in oil viscosity | Field experiences have shown that this mechanism is limited (Case Dee Valley or Husky Mervin), and the impact of the CO2 in the mobility ratio is not always dominant. | [5] |
Disclaimer/Publisher’s Note: The statements, opinions and data contained in all publications are solely those of the individual author(s) and contributor(s) and not of MDPI and/or the editor(s). MDPI and/or the editor(s) disclaim responsibility for any injury to people or property resulting from any ideas, methods, instructions or products referred to in the content. |
© 2025 by the authors. Licensee MDPI, Basel, Switzerland. This article is an open access article distributed under the terms and conditions of the Creative Commons Attribution (CC BY) license (https://creativecommons.org/licenses/by/4.0/).
Share and Cite
Cartagena-Pérez, D.; Rangriz Shokri, A.; Chalaturnyk, R. Recent Developments in the CO2-Cyclic Solvent Injection Process to Improve Oil Recovery from Poorly Cemented Heavy Oil Reservoirs: The Case of Canadian Reservoirs. Energies 2025, 18, 2728. https://doi.org/10.3390/en18112728
Cartagena-Pérez D, Rangriz Shokri A, Chalaturnyk R. Recent Developments in the CO2-Cyclic Solvent Injection Process to Improve Oil Recovery from Poorly Cemented Heavy Oil Reservoirs: The Case of Canadian Reservoirs. Energies. 2025; 18(11):2728. https://doi.org/10.3390/en18112728
Chicago/Turabian StyleCartagena-Pérez, Daniel, Alireza Rangriz Shokri, and Rick Chalaturnyk. 2025. "Recent Developments in the CO2-Cyclic Solvent Injection Process to Improve Oil Recovery from Poorly Cemented Heavy Oil Reservoirs: The Case of Canadian Reservoirs" Energies 18, no. 11: 2728. https://doi.org/10.3390/en18112728
APA StyleCartagena-Pérez, D., Rangriz Shokri, A., & Chalaturnyk, R. (2025). Recent Developments in the CO2-Cyclic Solvent Injection Process to Improve Oil Recovery from Poorly Cemented Heavy Oil Reservoirs: The Case of Canadian Reservoirs. Energies, 18(11), 2728. https://doi.org/10.3390/en18112728