1. Introduction
Permanent magnet synchronous motors are extensively utilized in electric vehicles, industrial drives, and household appliances owing to their high power density, superior efficiency, and excellent dynamic performance [
1,
2,
3]. In PMSM drive systems, precise rotor position signals are required for control implementation. However, position sensors may introduce increased system costs, reduced reliability, and susceptibility to extreme environmental conditions. Consequently, sensorless control strategies have become a prominent research focus in motor control technologies [
4,
5,
6]. For the low-speed sensorless operation of PMSMs, high-frequency injection is commonly adopted. Nevertheless, this method introduces continuous high-frequency voltage signals into the motor windings, resulting in concentrated harmonic components in the current spectrum that induce significant electromagnetic vibrations and audible noise.
The high-frequency injection generates dual hazards of electromagnetic noise and acoustic noise: On one hand, the electromagnetic interference (EMI) caused by high-frequency currents can affect control systems and surrounding electronic devices, potentially leading to distorted current sampling, abnormal communication signals, or even malfunctioning controllers, thereby threatening system stability and safety. On the other hand, the acoustic noise (such as harsh whining) converted from high-frequency excitation through motor core magnetostriction and mechanical resonance not only compromises environmental sound quality, triggering user complaints about smart home appliances, electric vehicles, and other devices but also restricts motor applications in quiet-sensitive scenarios like medical facilities and offices. Ultimately, these issues severely limit the applicability of motors in noise-sensitive environments [
7,
8,
9,
10,
11,
12,
13,
14,
15,
16,
17,
18,
19,
20].
Considering the harsh audible noise and electromagnetic interference caused by high-frequency signal injection, scholars have proposed corresponding solutions, which are primarily categorized into three types: amplitude adjustment methods, frequency adjustment methods, and random high-frequency voltage injection methods.
For amplitude adjustment methods, since the amplitude of the response current is correlated with the injected voltage amplitude, appropriately reducing the injected voltage amplitude represents the most direct and effective approach to noise reduction. However, this method introduces unavoidable issues, such as a decreased signal-to-noise ratio (SNR) resulting from reduced response current amplitudes. Specifically, lowering the signal amplitude inevitably increases rotor position estimation errors. To address this issue, [
8] employs a sliding filter to replace the conventional high-pass filter. Study [
9] utilizes a second-order generalized integrator to extract high-frequency current components, effectively reducing the injected voltage amplitude while maintaining position estimation accuracy. However, these methods exhibit multiple limitations and demonstrate poor anti-interference capabilities.
Regarding frequency adjustment methods, domestic and international research institutions have achieved notable progress. Since the human auditory range spans 20 Hz to 20 kHz, injecting signals outside this frequency band effectively reduces audible noise. Studies [
10,
11,
12] elevate injection frequencies to match PWM switching frequencies (typically ≤ 20 kHz), pushing signals beyond human auditory sensitivity, though practical implementations remain constrained by power device limitations. Study [
13] utilizes FPGA and SiC-based inverters to increase injection frequencies, enhancing position estimation accuracy and noise reduction, but this approach raises system costs and requires excessive voltage amplitudes (exceeding inverter limits) to maintain SNR. Alternative methods exploit human insensitivity to low-frequency signals: Study [
14] proposes low-frequency current injection with harmonic controllers to isolate rotor-position-related stator voltage components; study [
15] implements 300 Hz voltage injection, achieving limited noise reduction while demanding precise motor parameters for demodulation; and study [
16] further reduces injection frequency to 50 Hz for enhanced noise suppression, yet faces challenges including spectral overlap with fundamental stator currents and degraded dynamic response.
The randomized high-frequency voltage injection method selects one frequency from multiple predefined high-frequency voltages per injection cycle in a stochastic manner, effectively broadening the power spectral density (PSD) of high-frequency currents, expanding their frequency distribution, reducing discrete harmonic amplitudes, and thereby suppressing sharp audible noise. Studies [
17,
18] introduced a pseudo-random square-wave voltage injection technique that randomly switches between two frequencies, dispersing PSD to mitigate noise. Studies [
19,
20] proposed randomized sinusoidal signal injection, theoretically analyzing PSD broadening and experimentally validating noise reduction efficacy. In contrast to frequency-randomized approaches, study [
21] maintained a fixed injection frequency but randomized phase angles to achieve noise suppression, though improper phase selection may introduce DC bias in high-frequency currents and complicate demodulation. Currently, the most promising noise-reduction strategies involve modulating either injection frequency or phase, inspired by randomized pulse-width modulation (RPWM) principles proven effective against PWM-induced acoustic noise. However, these methods necessitate pseudo-random sequence generators, imposing demanding hardware requirements.
Existing noise suppression methods for high-frequency injection predominantly operate under fixed switching-frequency conditions. However, during actual motor operation, PWM switching itself generates audible noise [
22]. Limited research has addressed both high-frequency injection noise and PWM switching noise simultaneously. Notably, studies [
23,
24] proposed an integrated noise suppression framework combining variable switching-frequency randomized square-wave injection, which disperses acoustic energy across broader frequency bands. Despite this advancement, the method requires sophisticated implementation: it relies on Markov chains for random sequence generation, increasing computational overhead and hardware complexity.
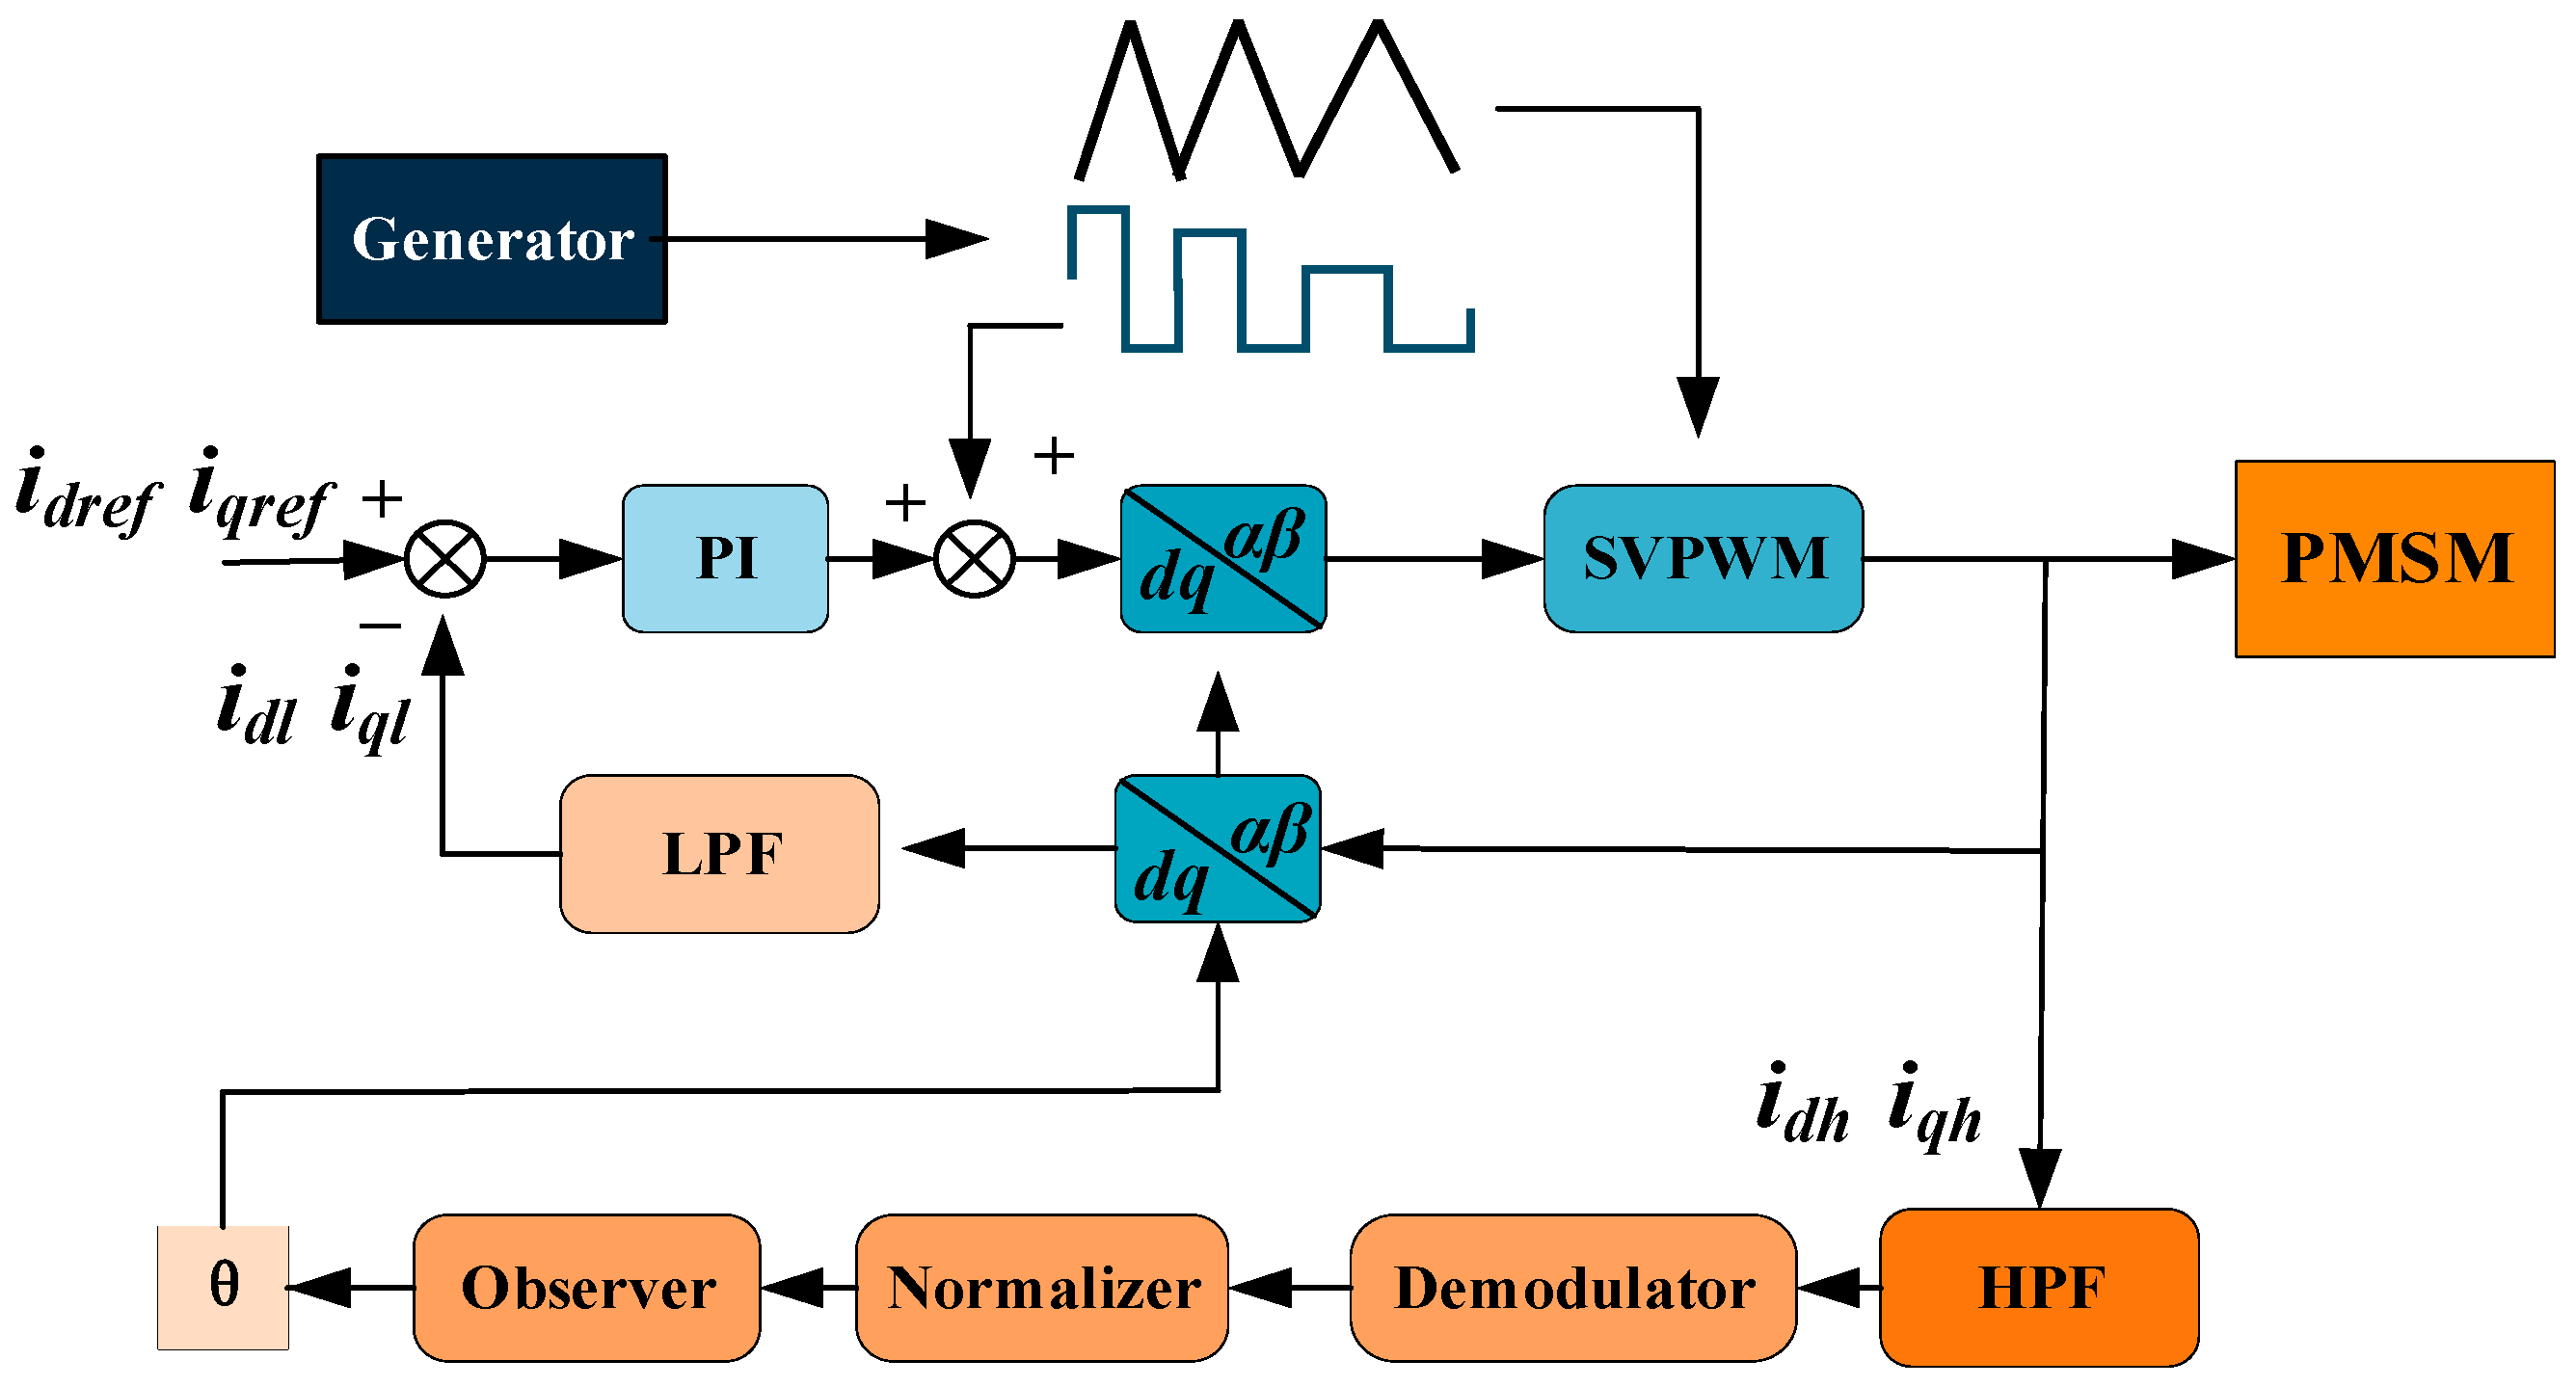
To address the aforementioned issues, this paper proposes a sensorless control scheme for interior permanent magnet synchronous motors (IPMSMs) based on PFM high-frequency square-wave injection, aiming to mitigate audible noise during low-speed operation. The proposed scheme utilizes PFM to generate SVPWM signals and injected square waves, achieving signal generation solely through software programming without additional hardware costs. Furthermore, a demodulation method based on the measured-axis frame is introduced to optimally align with the PFM approach, enabling accurate rotor position extraction from periodic frequency-modulated current components.
To validate the scheme, this study first reviews conventional square-wave injection methods, followed by a detailed presentation of the PFM-based carrier and square-wave injection strategy. A comparative noise analysis between the proposed and traditional methods theoretically demonstrates the noise-reduction capability of the proposed approach. Subsequently, the PFM-based sensorless control algorithm is elaborated, encompassing periodic signal injection, demodulation, and normalization. Experimental results, including a fast Fourier transform (FFT) analysis of phase currents, confirm the feasibility of the proposed method in reducing audible noise.
2. Basic Principles of Conventional High-Frequency Injection
Given that the frequency of the injected high-frequency square wave during low-speed operation significantly exceeds the motor’s fundamental operating frequency, the voltage drop across the resistance can be neglected. Furthermore, high-frequency injection is typically applied within a speed range below 10% of the rated speed, allowing the back electromotive force (EMF) to be disregarded. Consequently, the high-frequency model of an IPMSM under these conditions can be described by the following equations, where:
vdh, vqh: High-frequency stator voltage components in the d-q axis;
idh, iqh: High-frequency stator current components in the d-q axis;
Ldh,
Lqh: High-frequency inductances in the
d-
q axis.
The square-wave injection is implemented along the d-axis with a high-frequency signal, where the injection frequency in this study is set to half of the switching frequency. When injecting high-frequency voltage into the d-axis, the resulting high-frequency current predominantly manifests in the
d-axis, while the
q-axis high-frequency current component correlates with rotor position estimation error. Crucially, since the actual
d-
q axis orientation of the motor cannot be precisely determined during voltage injection, the signal must be injected into the estimated reference frame.
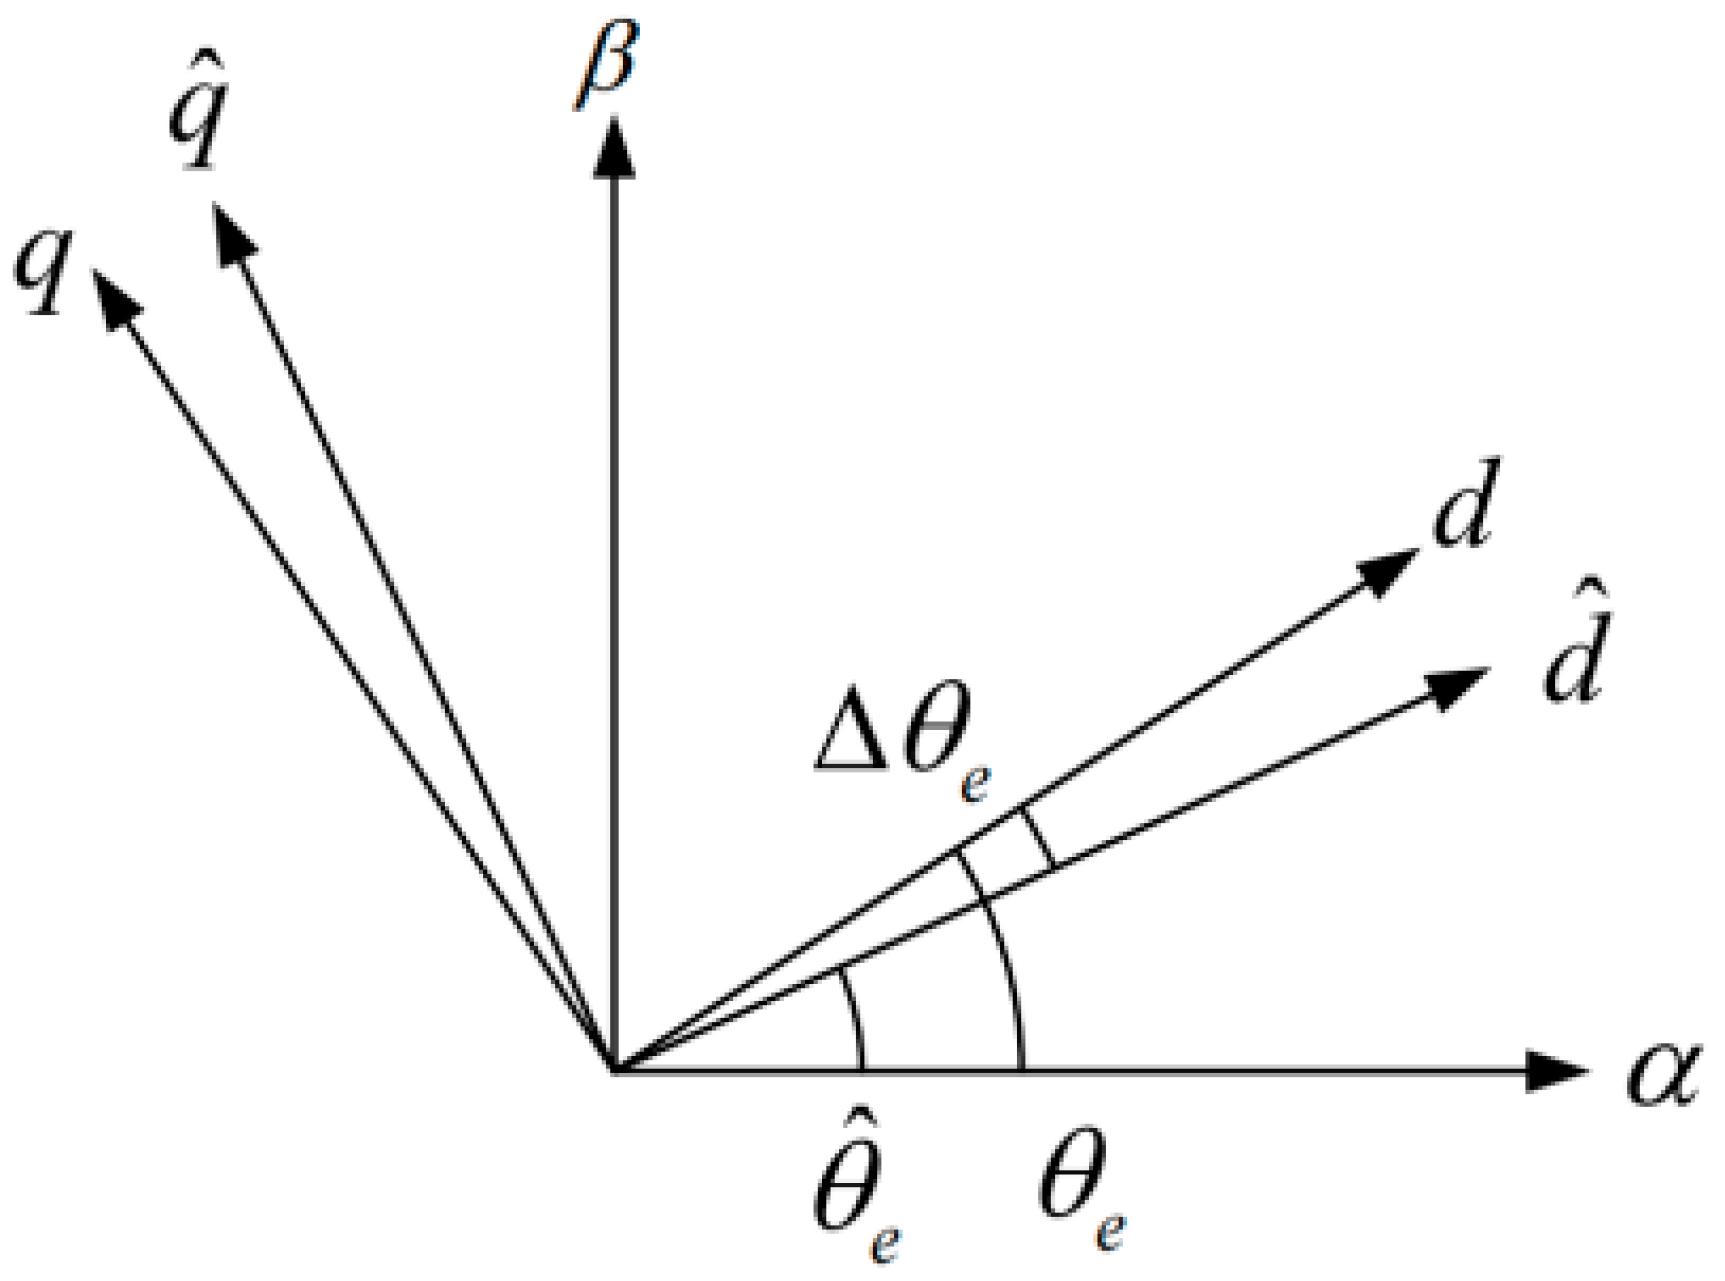
Figure 1 illustrates the coordinate systems, where
: Actual rotor position angle;
: Estimated rotor position angle;
: Position estimation error ( = − ).
The voltage and current relationships between the actual and estimated reference frames are expressed as follows:
where
A high-frequency voltage signal (
vinj) is injected into the estimated d-axis of the rotor reference frame, while rotor position estimation is performed in the two-phase stationary (
α-
β) coordinate system.
The high-frequency signal components are extracted within the two-phase stationary (
α-
β) coordinate system.
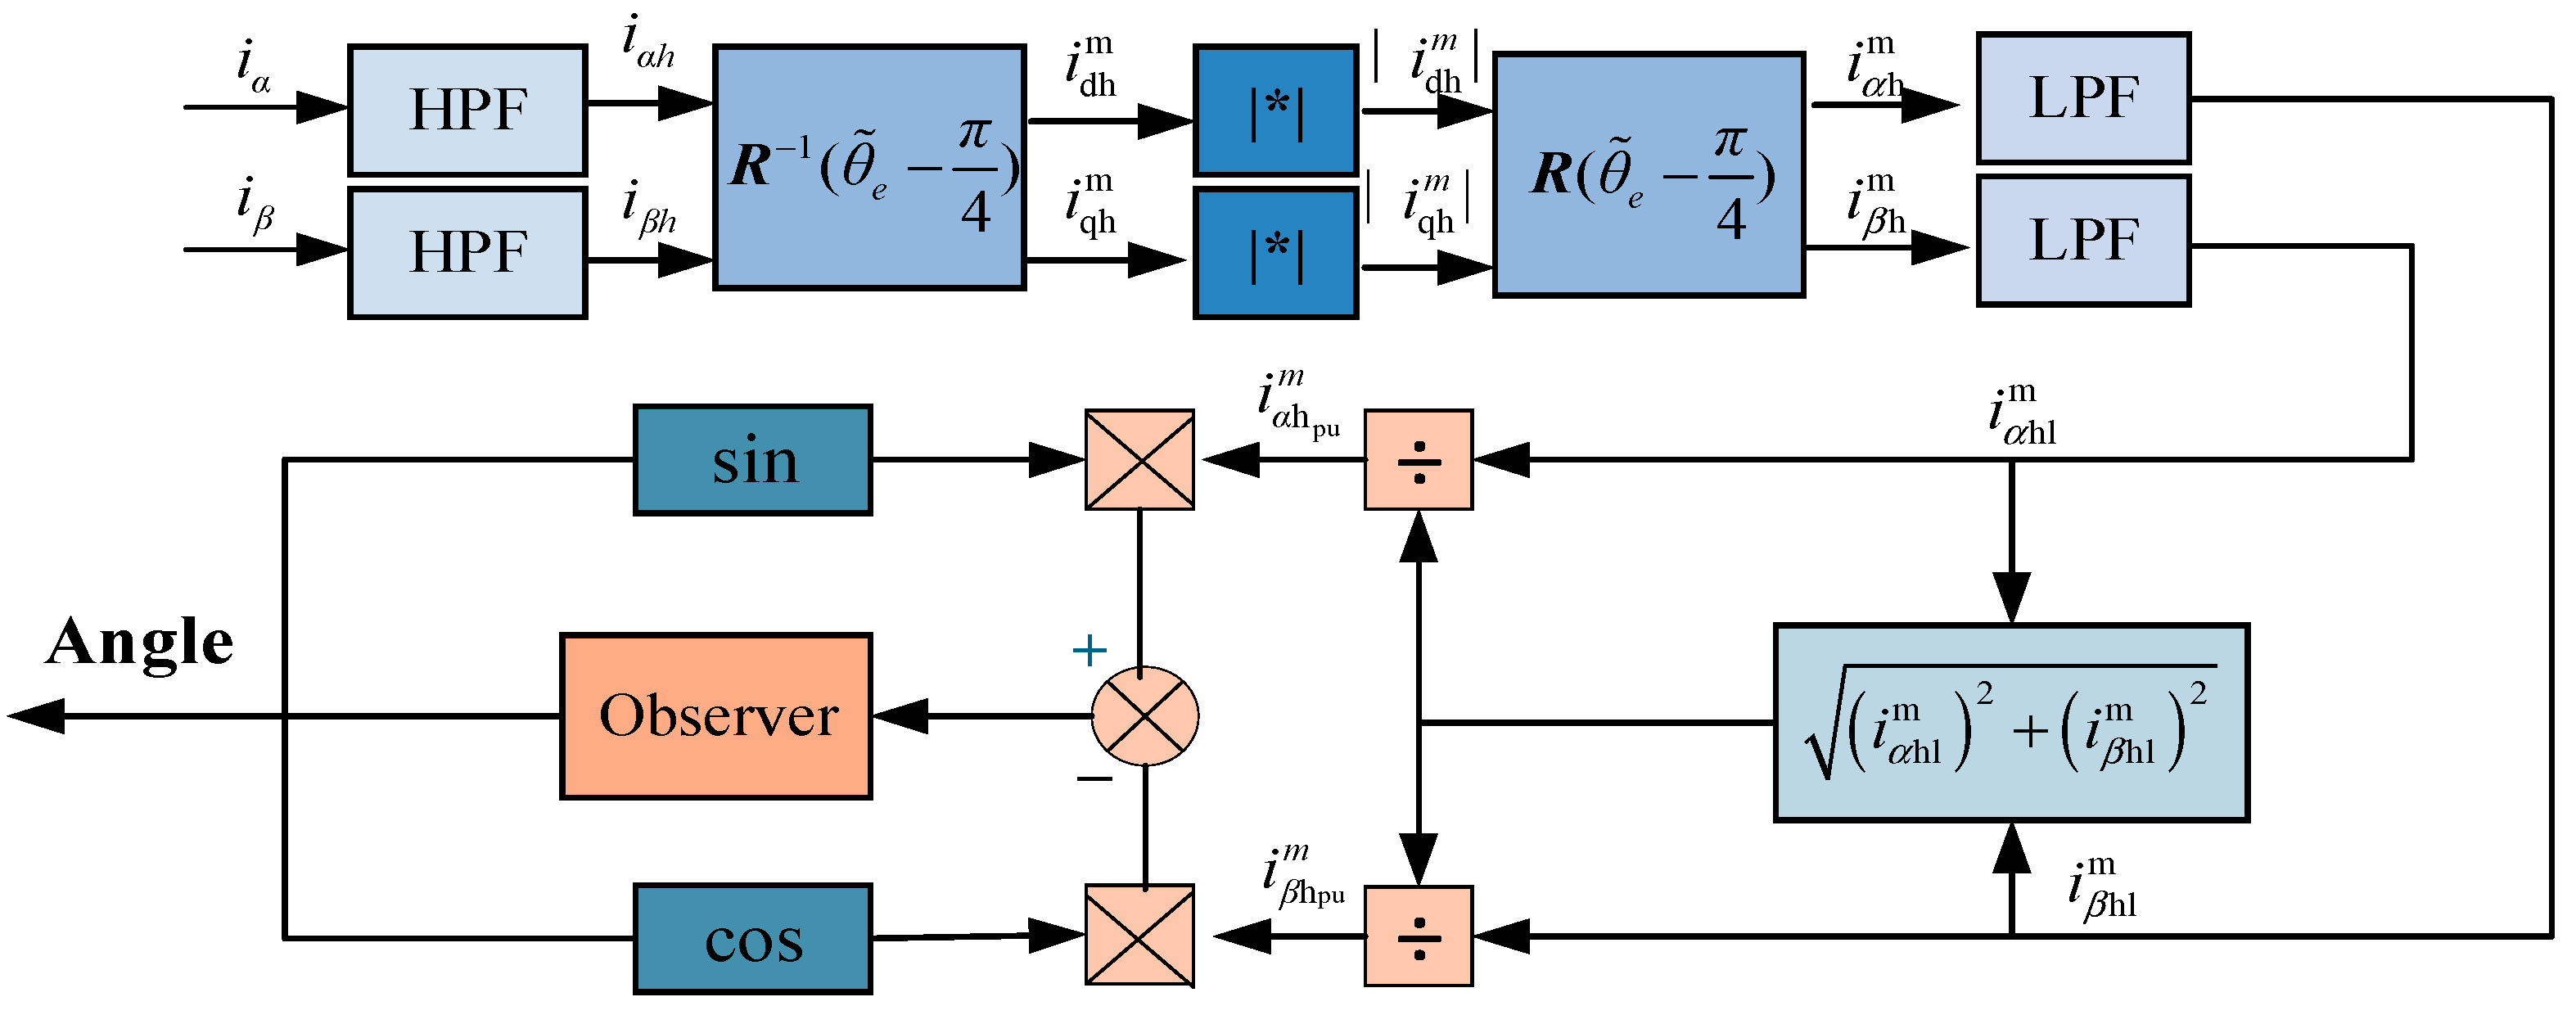
The high-frequency current components are first extracted, which can be achieved either by employing a high-pass filter (typically implemented using a second-order Butterworth design) or through filter-free mathematical computation.
The differential values of the
α-
β axis currents are then calculated by computing the difference between two successive high-frequency current samples.
The differential values are corrected based on the polarity of the injected voltage to obtain sine-cosine signals correlated with the rotor position.
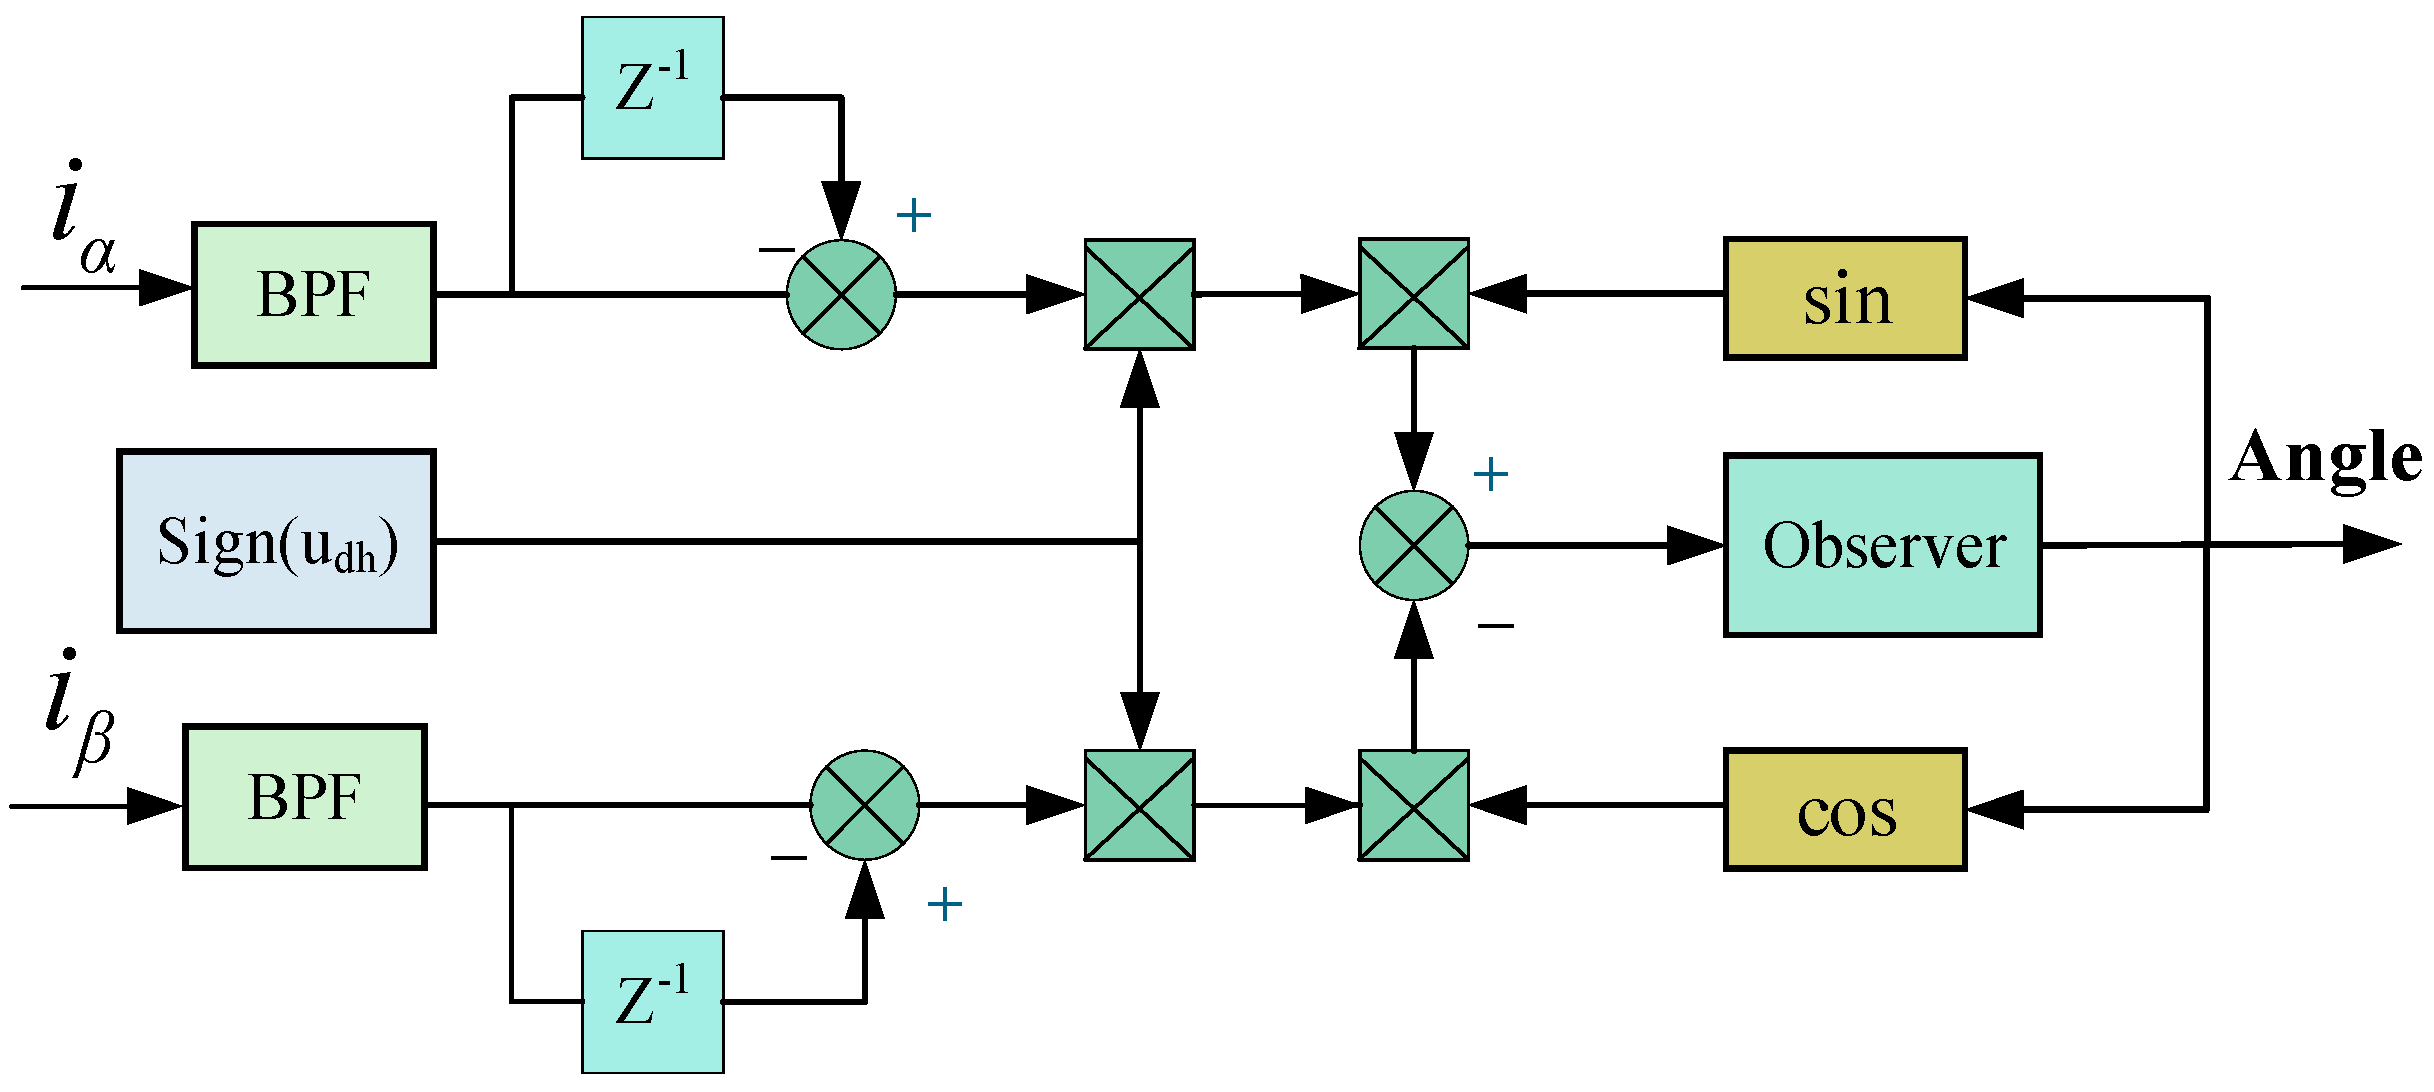
To ensure the sinusoidal fidelity of the signals and guarantee positional accuracy, this study processes the obtained signals using a low-pass filter. Finally, asynchronous demodulation extracts the equivalent rotor position error signal.
This establishes a stationary-frame position error extraction method. By driving the rotor position error to zero via an observer, the estimated position converges to the actual value. The block diagram of the stationary-frame position extraction principle is shown in
Figure 2.
3. Analysis of Acoustic Noise in Fixed-Frequency Square-Wave Injection
3.1. Carrier and Injected Square-Wave Generation Methods
In traditional square-wave high-frequency injection strategies, the frequency remains fixed. If the frequency is varied periodically around a fixed central frequency according to a periodic function, this is called periodic frequency modulation. This technique is widely used in spread spectrum implementations by modulating the PWM carrier frequency. To better capture high-frequency response information, this paper adopts a carrier-wave and square-wave cooperative generation method based on periodic frequency modulation, where the generated carrier signal determines the frequency and phase of the square wave.
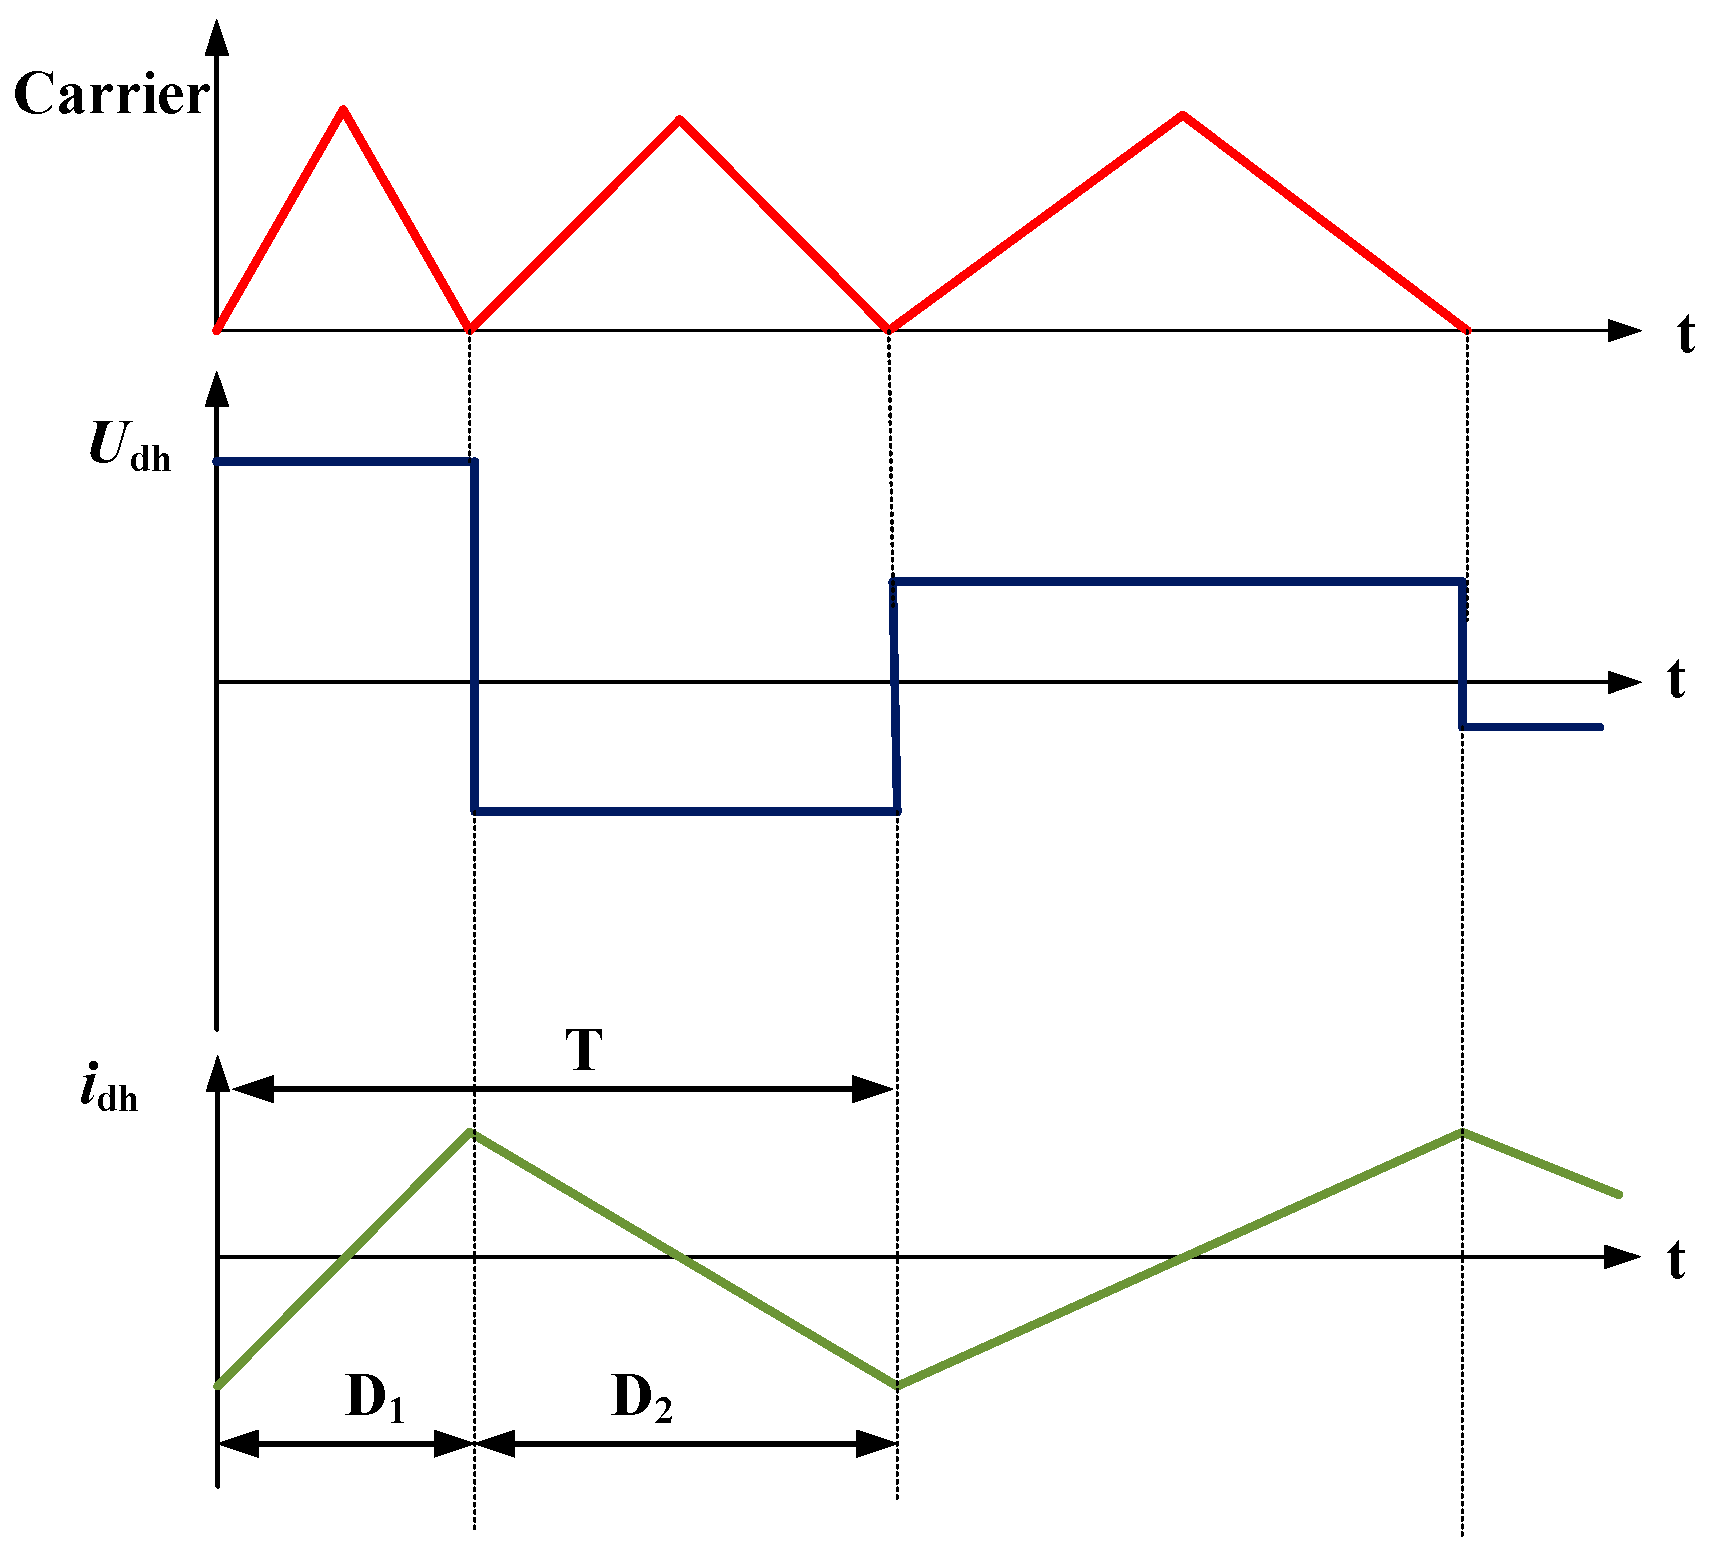
Figure 3 illustrates the simultaneous variation in the carrier-wave period and the injected square wave.
In
Figure 3, Carrier(red waveform) represents the frequency-modulated carrier, while
Udh (blue waveform) denotes the injected square wave with periodic variations in both frequency and amplitude. The
idh (green waveform) waveform corresponds to the high-frequency current response.
The unit square-wave signal and unit triangular-wave signal are defined as follows:
3.2. PWM Noise Analysis Under Periodic Frequency Modulation
The following analyzes the PWM waveform and high-frequency current response, comparing the Fourier expansions under fixed-frequency and periodic frequency modulation to demonstrate that periodic frequency modulation can effectively reduce switching and injection noise.
The expression for the carrier frequency after adopting periodic frequency modulation technology is as follows:
In the equation, fi (t)is the modulated carrier frequency (Hz), fc (t) is the central fixed frequency (Hz), and Δfc (t) is the periodic frequency variation (Hz).
The triangular carrier-wave signal within the interval [0,
Ts] (
Ts being the carrier period) can be expressed as follows:
In the equation, Kp is the slope of the triangular wave’s rising edge, and Ts is the slope of the falling edge.
The sawtooth modulation signal within one variation period [−
T1/2,
T1/2],
T1 being the period of the sawtooth wave function,
fm being the frequency of the sawtooth wave function, can be expressed as follows:
In the equation, Δf is twice the maximum frequency deviation of the carrier frequency (Hz).
When performing Fourier decomposition on it, the expression is as follows:
In the equation, ω1 is the angular frequency corresponding to the sawtooth wave function (rad/s), equal to 2π/T1.
Perform Fourier decomposition on the PWM square-wave signal, and its expansion is as follows:
In the equation, SPWM(t) represents the PWM square-wave signal, D is the duty cycle of the PWM signal, Sa(x) is the sampling function defined as (Sa(nπD) = sin(nπD)/nπD), and φ(t) is the fundamental instantaneous phase (rad) after Fourier decomposition.
Based on the relationship between the instantaneous phase and the carrier frequency, the expression is as follows:
To solve for the instantaneous phase (assuming the initial phase is zero):
In the equation, ωc is the angular frequency corresponding to the carrier center frequency (rad/s), equal to 2π/Tc.
The frequency modulation index
mf is defined as Δ
f/2
f1, where
f1 = 1/
T1, and we obtain the following:
By transforming Equation (19), extracting the
k = 1 term from the summation in the cosine function, and utilizing Bessel functions, the following expression is obtained:
where:
By retaining only the first term on the right-hand side of Equation (20) and substituting it into Equation (16), the Fourier expansion of PWM under a fixed carrier frequency is obtained:
From the equation, it can be seen that for a fixed carrier frequency PWM square-wave signal, harmonic peaks only exist at the carrier frequency and its integer multiples, with amplitudes of 2DSa(nπD). According to Equation (20), after applying sawtooth wave periodic frequency modulation to the carrier, the harmonics exist at integer multiples of the carrier frequency and their nearby sideband frequencies. Their amplitudes are multiplied by Jn(2nmf/π) based on the original 2DSa(nπD)). Based on the properties of Bessel functions, Jn(2nmf/π) are all less than one. Therefore, the harmonic peaks generated by the sawtooth wave periodic frequency modulation technique are all smaller than those of the corresponding fixed carrier frequency case.
3.3. Square-Wave Noise Analysis Under Periodic Frequency Modulation
The following analyzes the response of a square wave under fixed-frequency and periodic frequency modulation. To simplify the analysis, assume that a fixed-frequency high-frequency voltage is injected into the actual d-axis. A Fourier analysis of the phase current under fixed-frequency high-frequency square-wave injection can identify the causes of high-frequency harmonic noise.
Taking the unit triangular wave as an example, decompose its response within the first cycle.
When using the fixed-frequency high-frequency injection method (
D1 =
D2 =
T/2):
Considering the parity of ‘
n’, where the sine and cosine functions in the equation can only take values of zero or one, we obtain the following equation:
It can be seen that the power spectrum of the phase current under fixed-frequency injection contains only discrete components, resulting in spike-like noise that primarily concentrates at the injection signal frequency and its odd multiples.
The analysis below examines the spectral distribution characteristics of the high-frequency response current when the injected square wave undergoes periodic frequency modulation. In this case, each half-period duration differs, with adjacent half-periods separated by Δ
T.
The analysis reveals that the high-frequency current response transitions from a fixed concentration to a dispersed distribution under periodic frequency modulation (PFM). Each cycle exhibits distinct characteristics, comprising both discrete and continuous spectral components. This dispersion arises from the time-varying periods D1 and D2, which follow a sawtooth modulation pattern. Consequently, the originally concentrated frequency response spreads across a broader bandwidth.
For the amplitude analysis, consider the term ((D1 + D2)3/D1D2). When (D1 + D2) remains constant, this term reaches its maximum value at (D1 = D2). Although PFM introduces fluctuations in (D1 + D2) around a central period, the time-averaged value of the term remains smaller compared to fixed-frequency injection. Additionally, the term values are consistently below one, indicating reduced amplitudes relative to fixed-frequency operation. For odd harmonic orders, PFM simultaneously achieves frequency dispersion and amplitude attenuation, effectively suppressing tonal noise. Conversely, for even harmonic orders, PFM introduces residual noise components near the switching frequency due to interactions between switching harmonics and injected signals. Consequently, the coordinated modulation of both the switching frequency and injection frequency is essential to comprehensively suppress noise across critical spectral regions, addressing both injection-related and switching-induced acoustic disturbances.
5. Experiment and Results
The experimental platform for the sensorless control system based on periodic frequency modulation is shown in
Figure 6. The platform consists of an interior permanent magnet synchronous motor (IPMSM, parameters listed in
Table 1), a drag test platform, a rectifier bridge, an electronic load, an oscilloscope with hardware filtering, a motor driver, and an upper computer. The motor driver uses the TMS320F28075 (Texas Instruments Incorporated, Dallas, TX, USA) as its main control chip, which implements sensorless control of the actual motor. The electronic load operates in constant current mode, with the load current set to half of the motor’s rated current; thus, all subsequent experiments are conducted under half-load conditions. The motor speed is set to 4% of its rated speed, i.e., 120 r/min. The high-frequency injection frequency is configured as half of the switching frequency, with the switching frequency’s center frequency set to 5 kHz. The experimental results are achieved under sensorless control.
5.1. Performance of Sensorless Algorithms
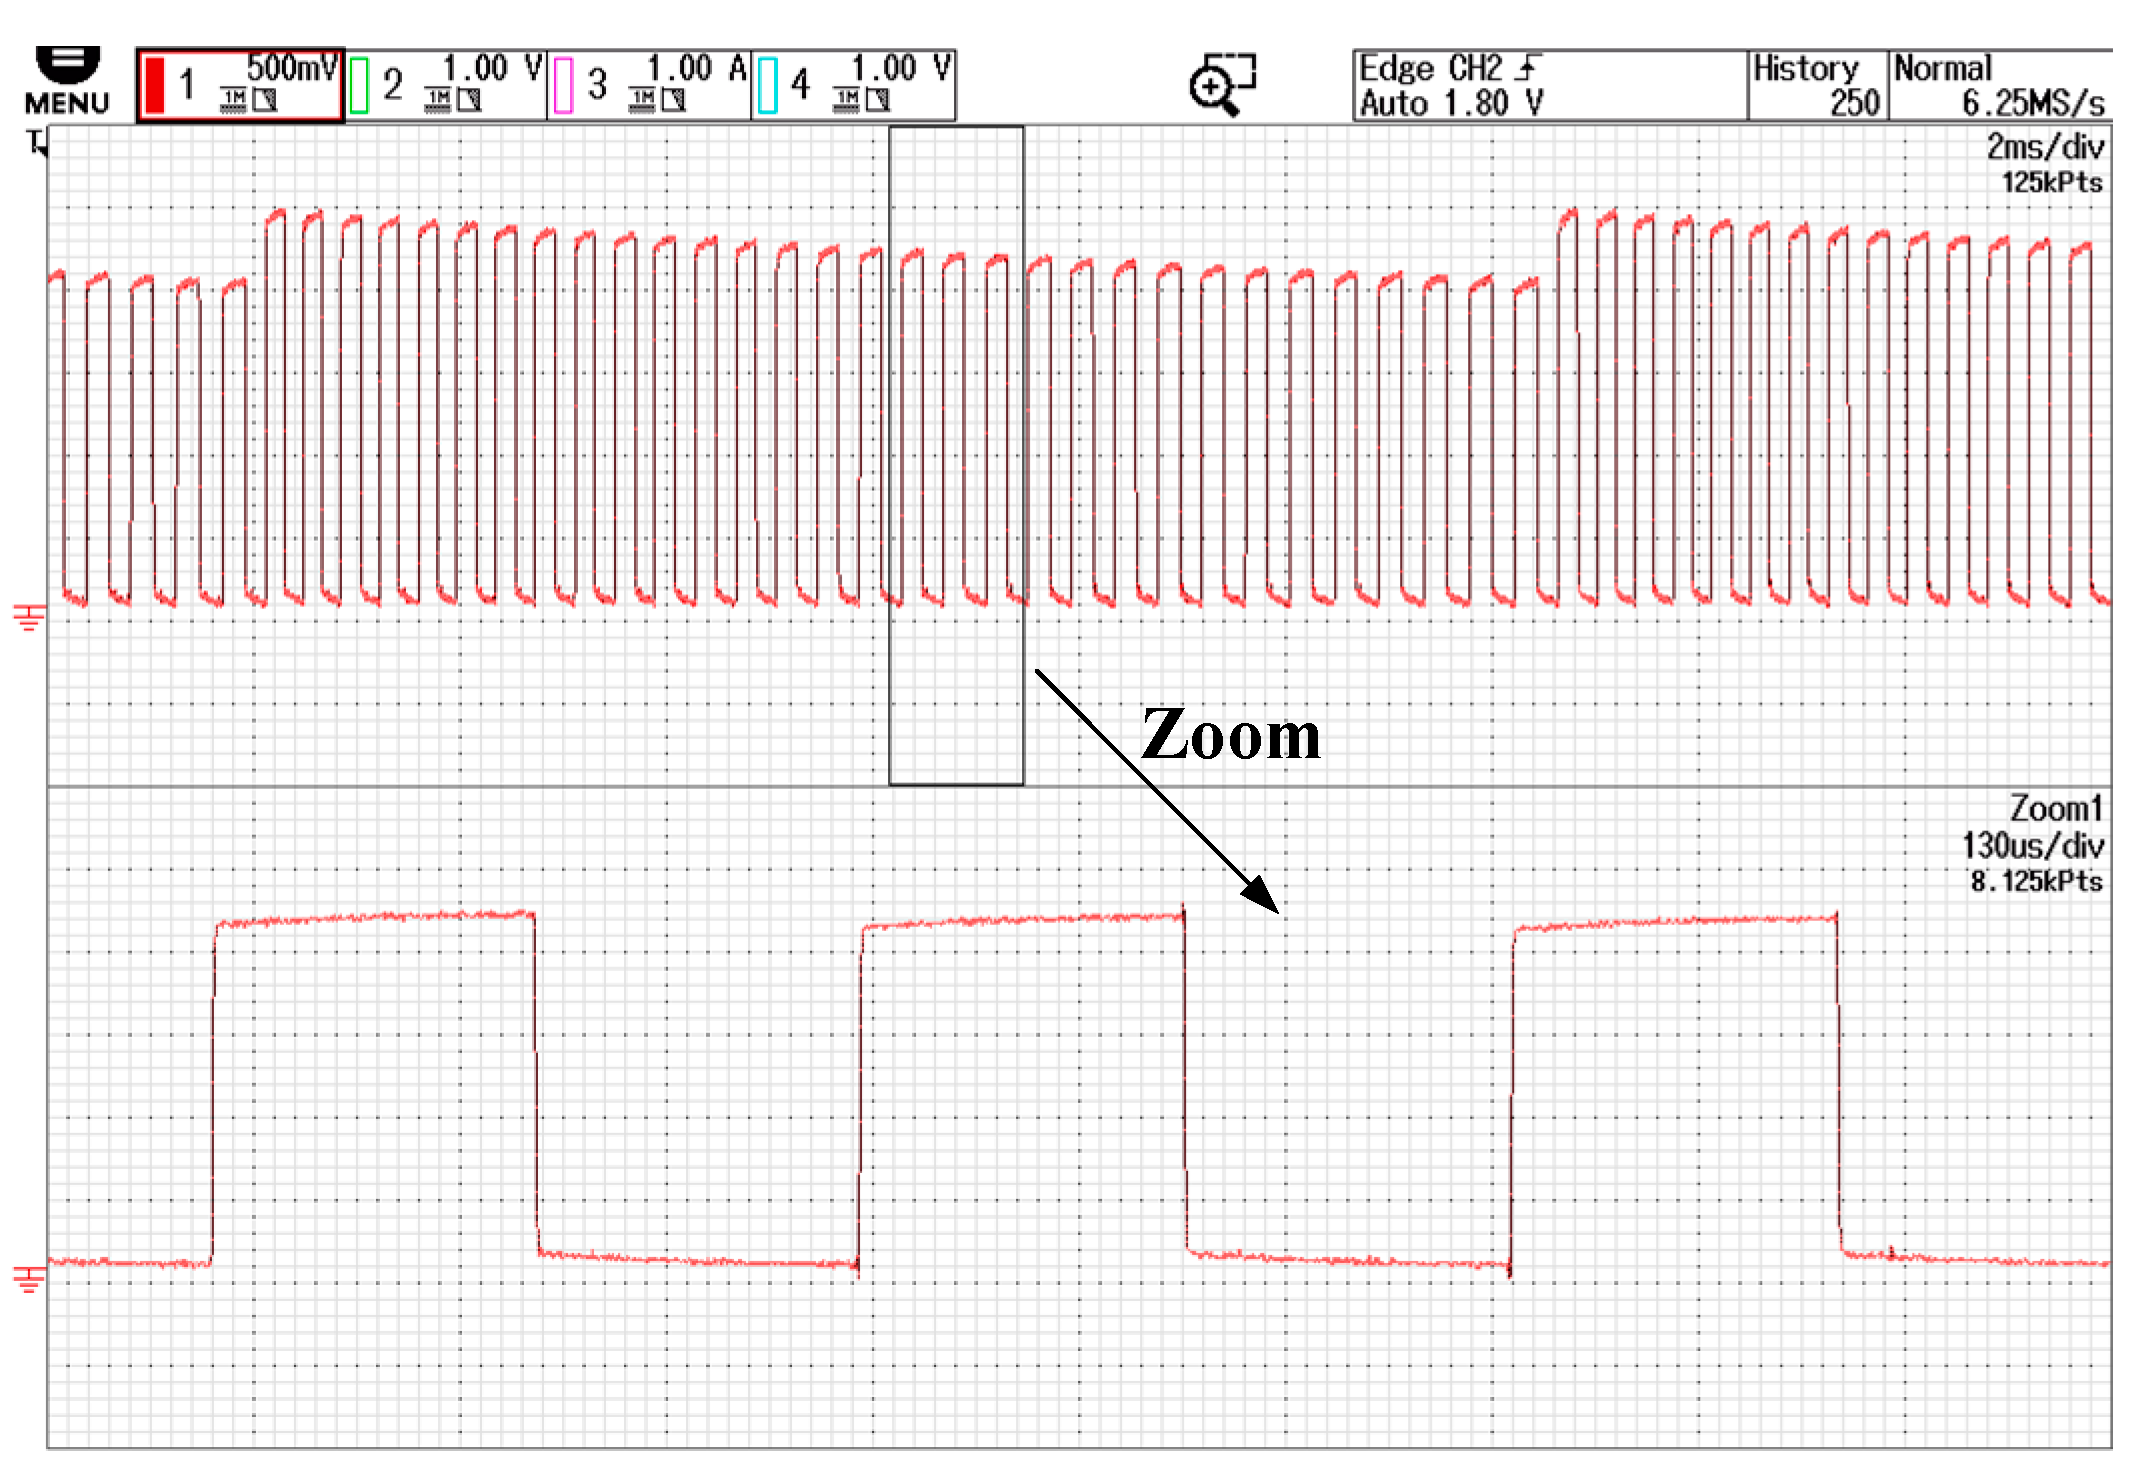
Figure 7 illustrates the periodically frequency-modulated square-wave signal used for injection. The carrier’s center frequency is set to 5 kHz, varying between 4.5 kHz and 5.5 kHz. The injected square-wave signal is generated from the carrier signal by changing both the polarity and period of the square wave each time an interrupt is triggered. This ensures that adjacent positive and negative injection signals have different periods, thereby enhancing the spread-spectrum effect. Consequently, the center frequency of the injected signal is 2.5 kHz. To satisfy volt-second balance, the amplitude of each square wave is inversely proportional to its period.
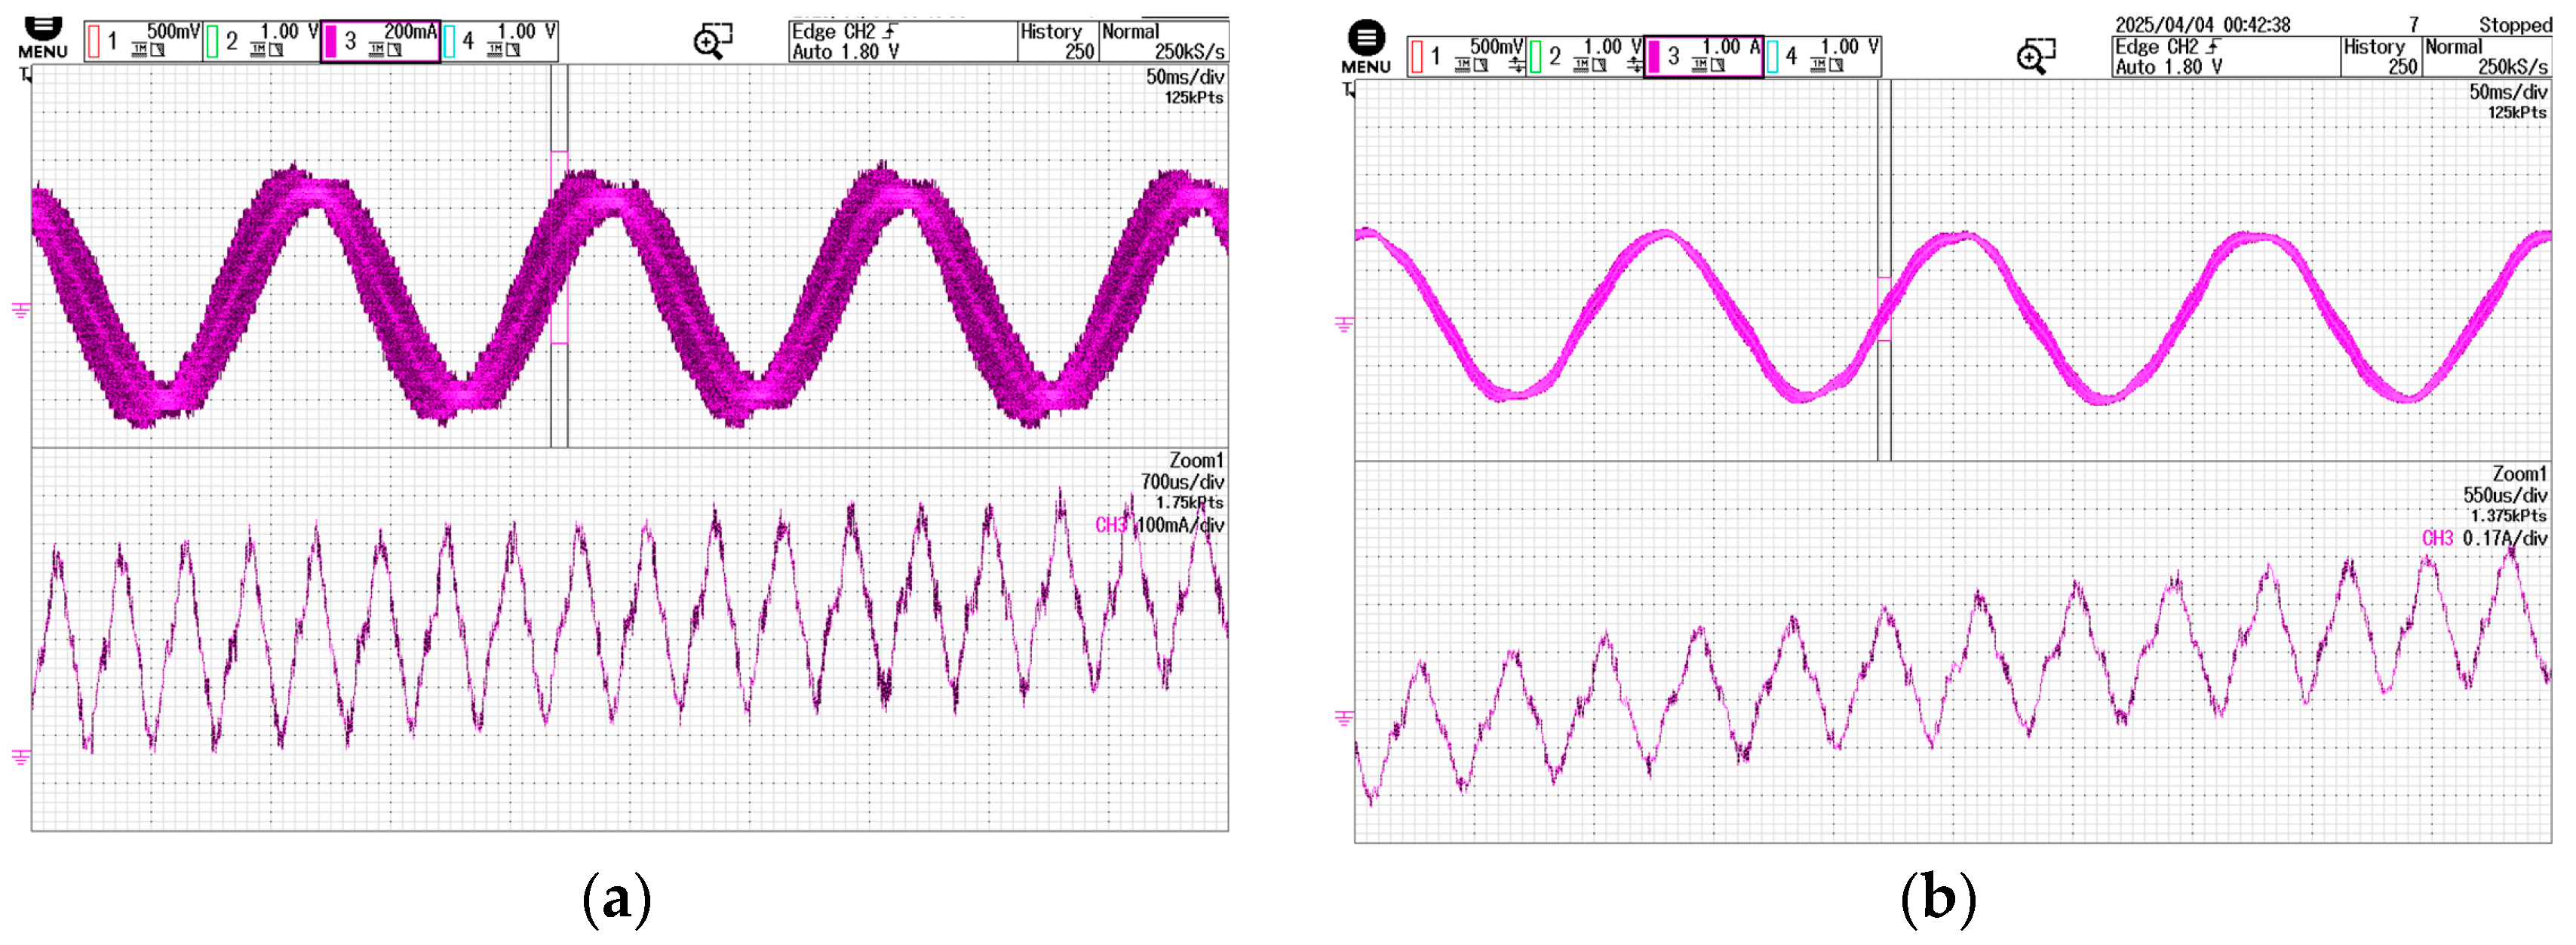
Figure 8a,b show the phase current waveforms after high-frequency signal injection based on periodic frequency modulation under no-load and loaded conditions, respectively. The waveforms include both the fundamental signal and high-frequency components.
Figure 9a,
Figure 10a,
Figure 11a and
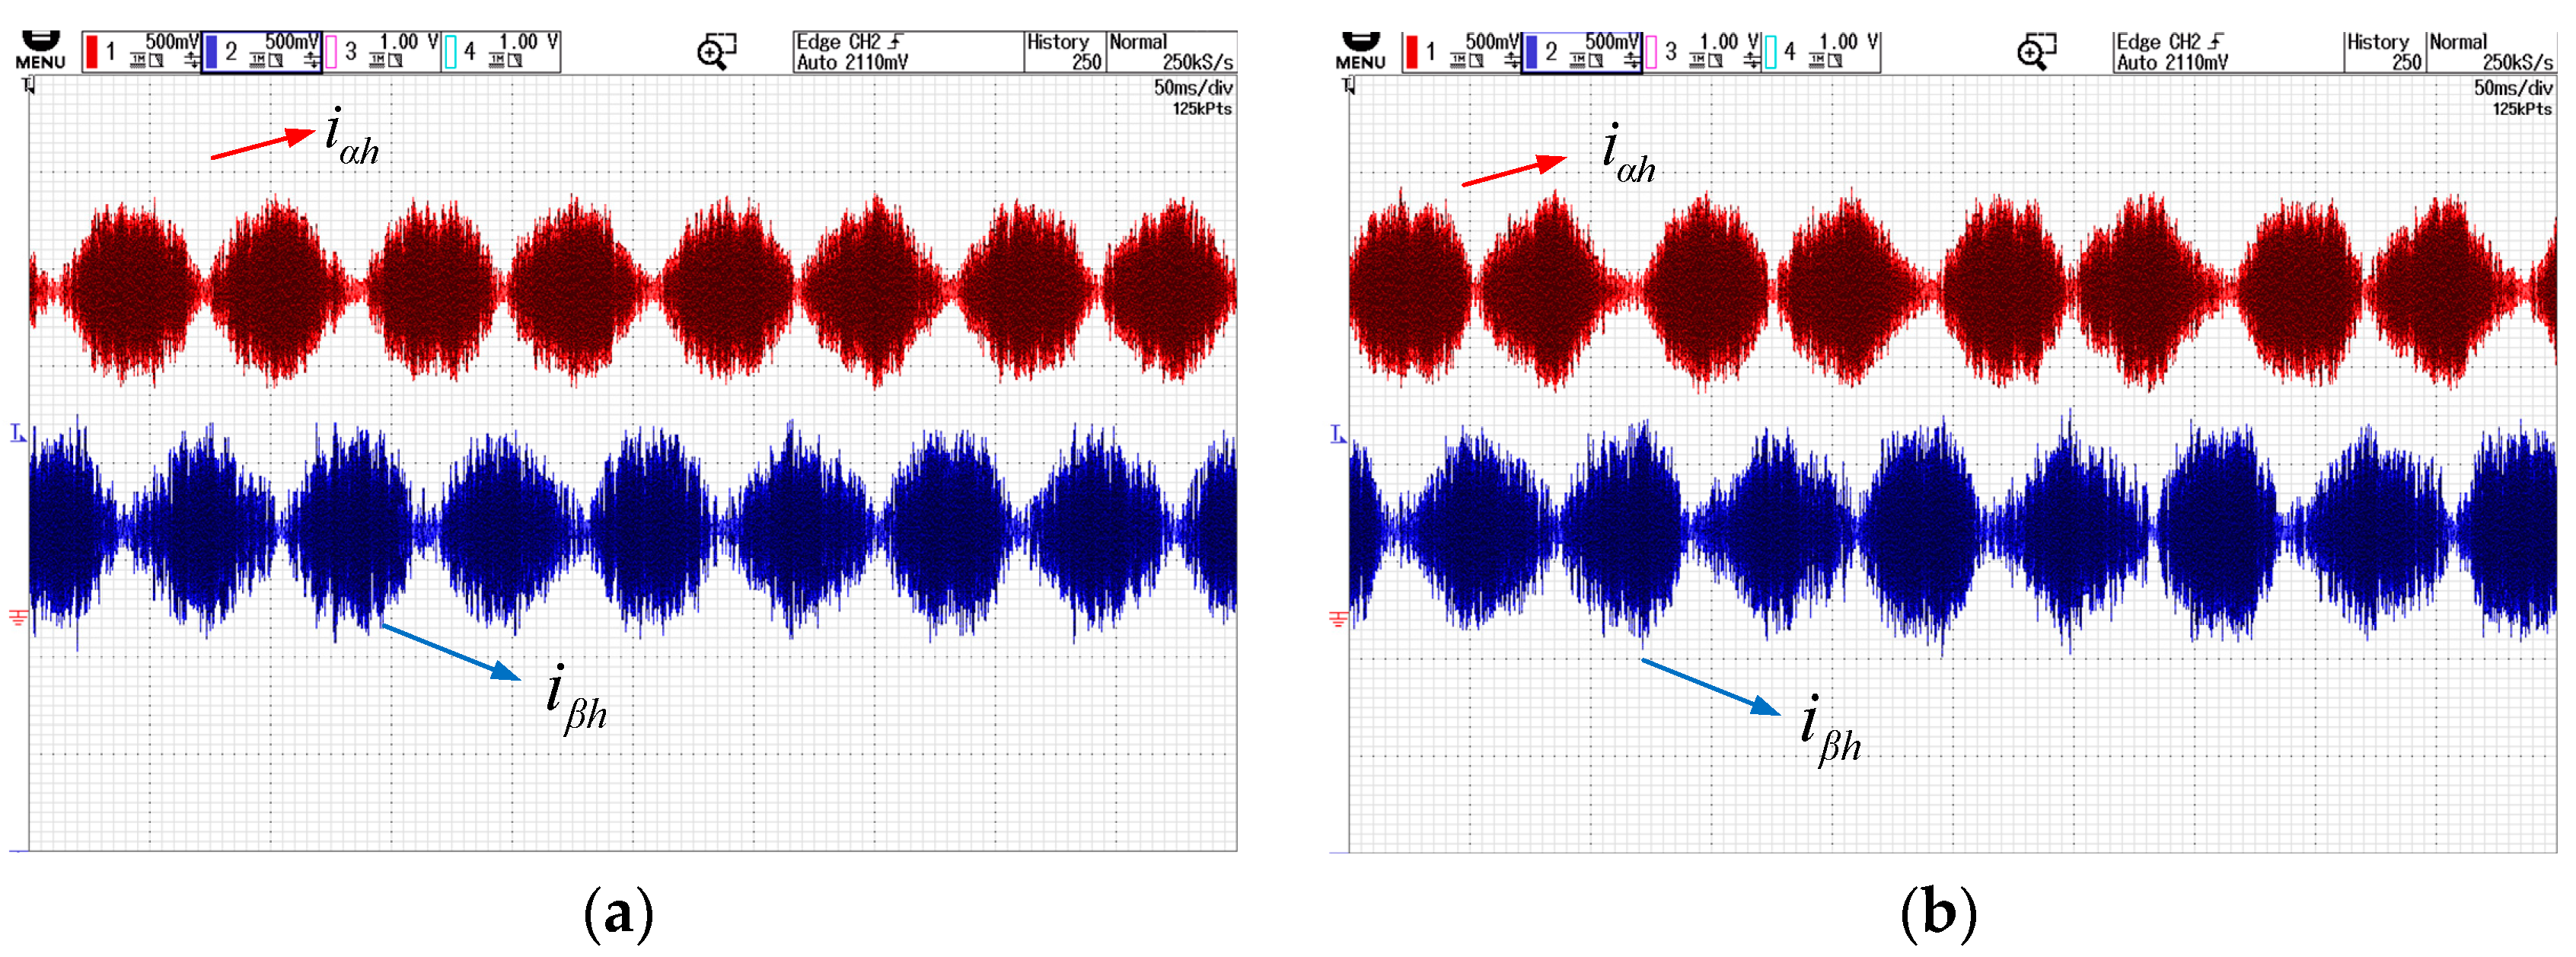
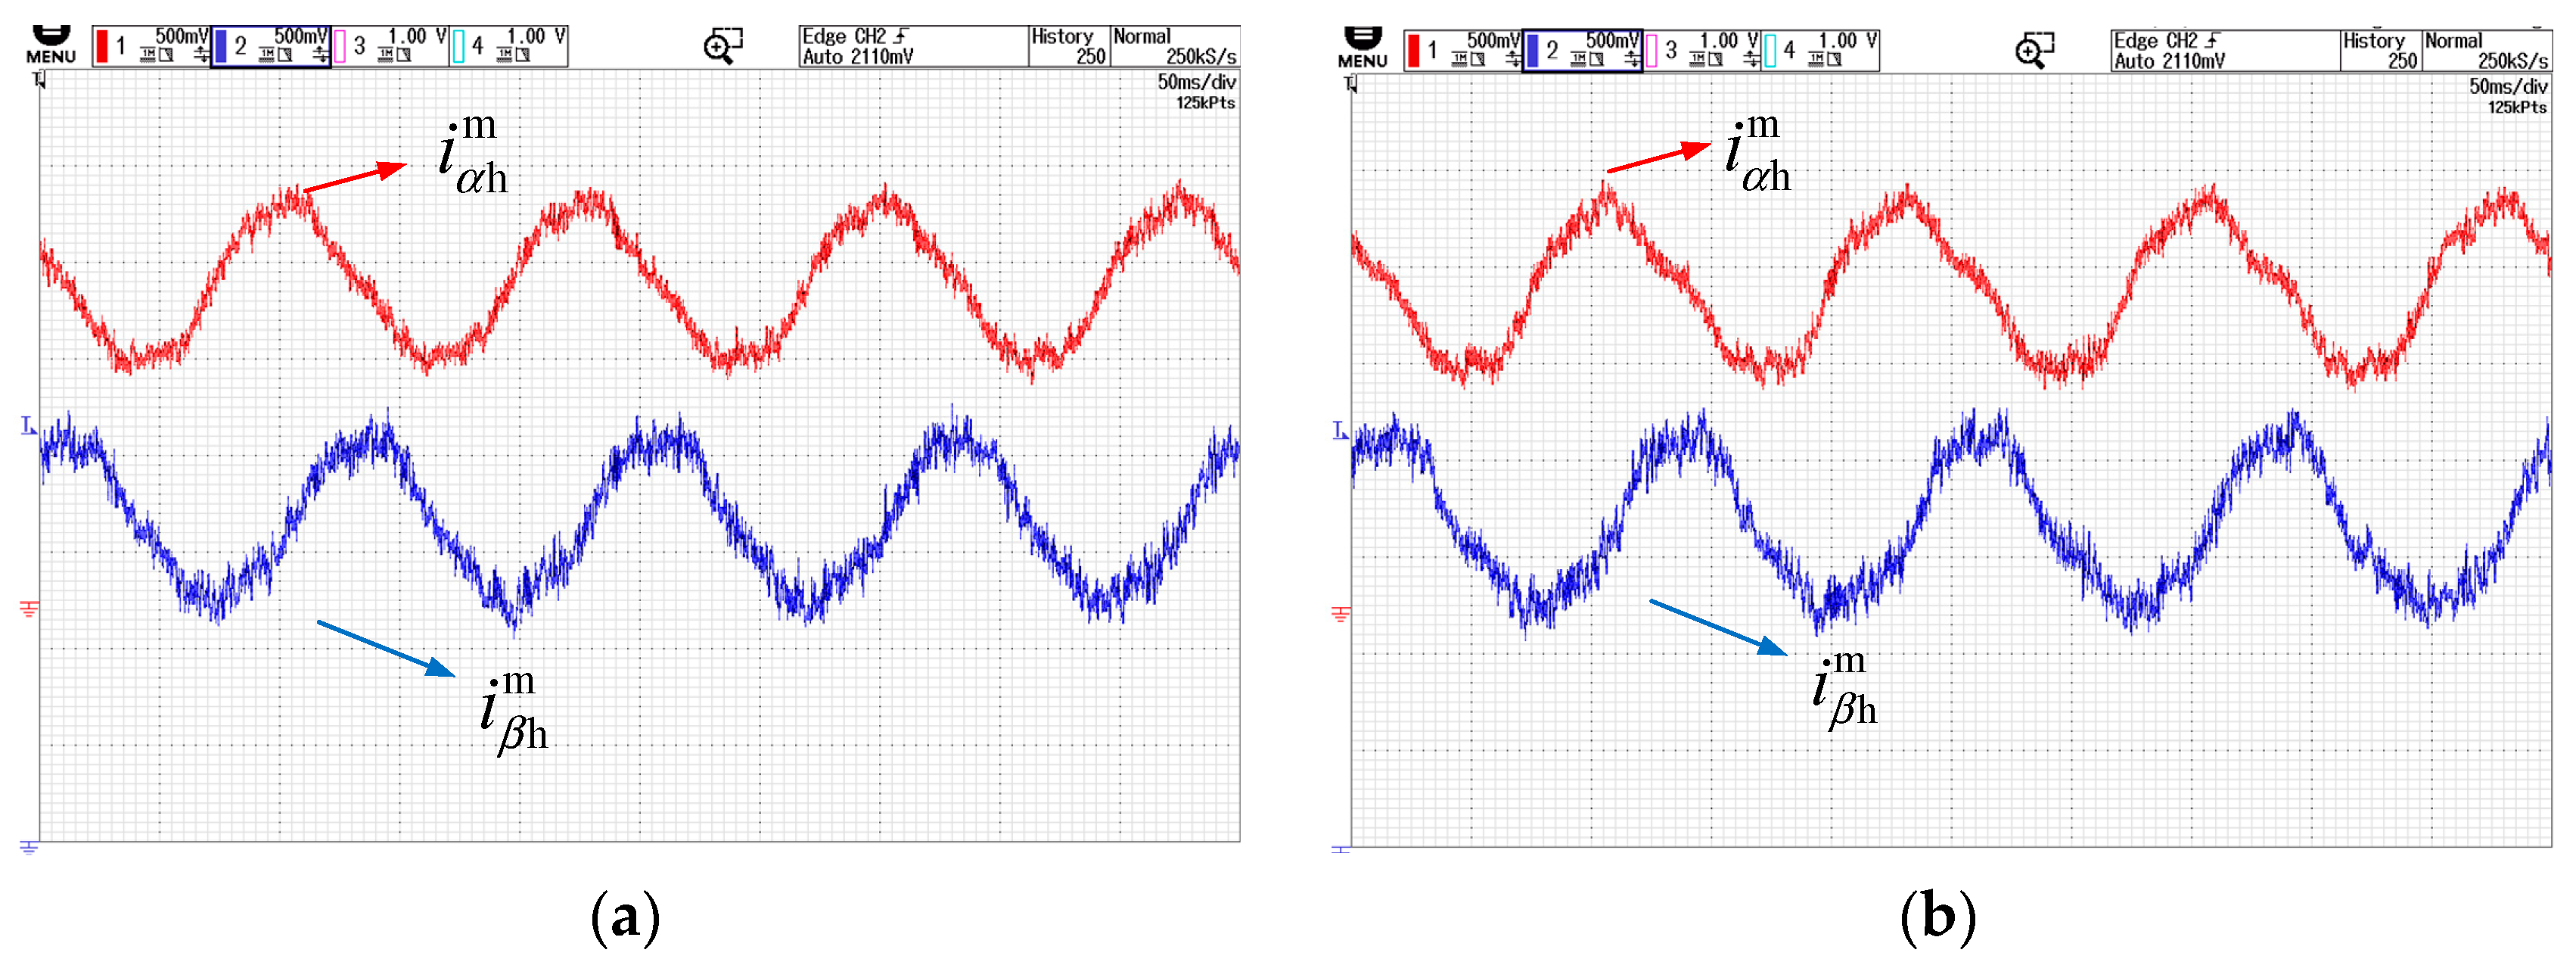
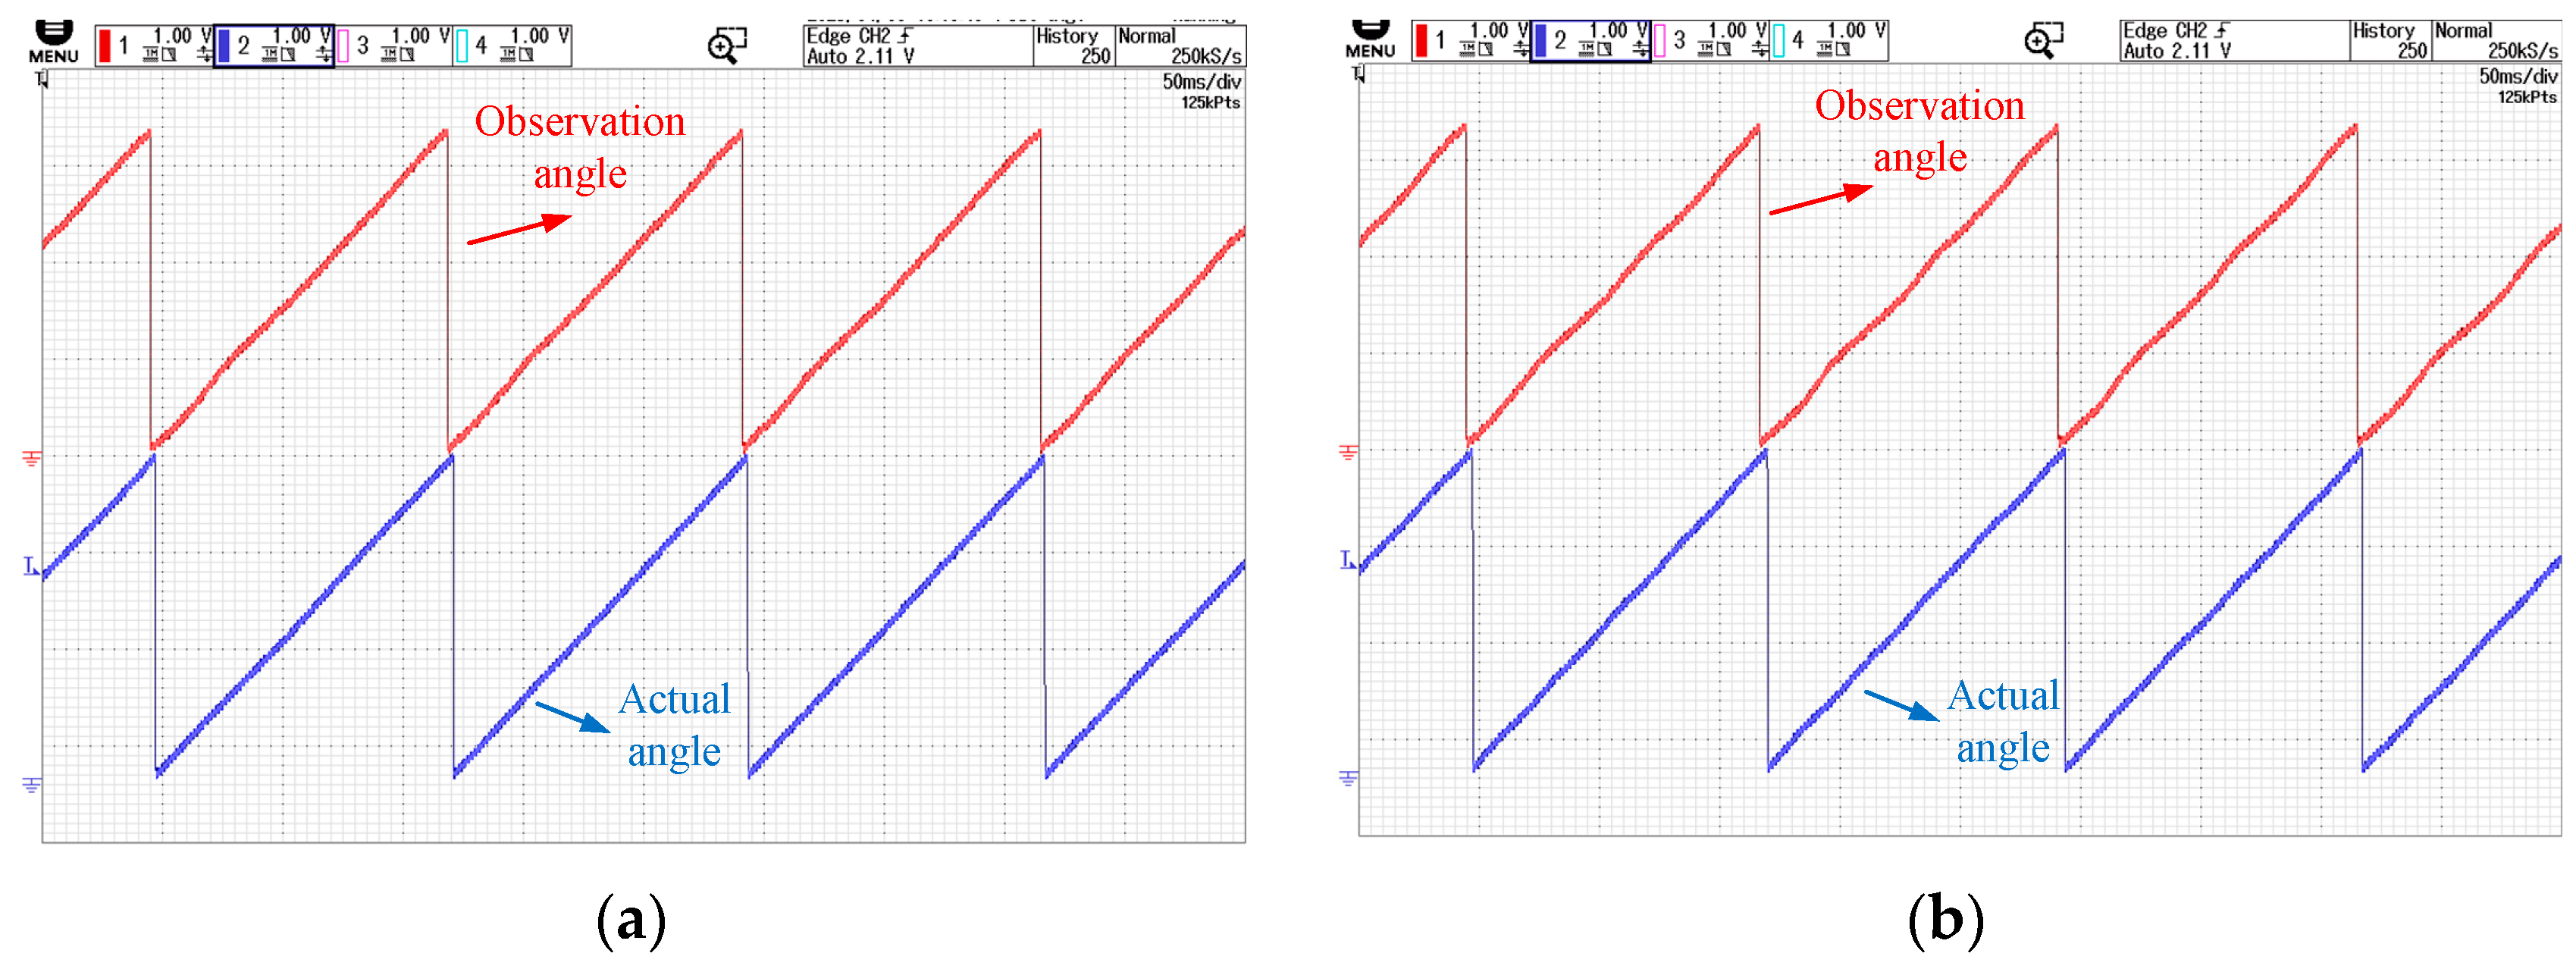
Figure 12a display the high-frequency response, demodulated signal, low-pass-filtered and normalized signal, and position signal waveforms obtained under no-load conditions using periodic frequency-modulated carrier and injected square waves for sensorless control.
Figure 9b,
Figure 10b,
Figure 11b and
Figure 12b show the corresponding waveforms under loaded conditions. The position signal errors under no-load and loaded conditions are 0.34 rad and 0.59 rad, respectively, while the error using conventional methods is approximately 0.4 rad. Therefore, the waveforms and signal demodulation exhibit no significant difference compared to conventional fixed-signal injection, validating the feasibility of the proposed method. Additionally, slight waveform distortion is observed under loaded conditions compared to no-load conditions, but this does not affect the extraction of angular information, indicating that loading does not significantly impact the performance of the periodic frequency modulation-based sensorless method.
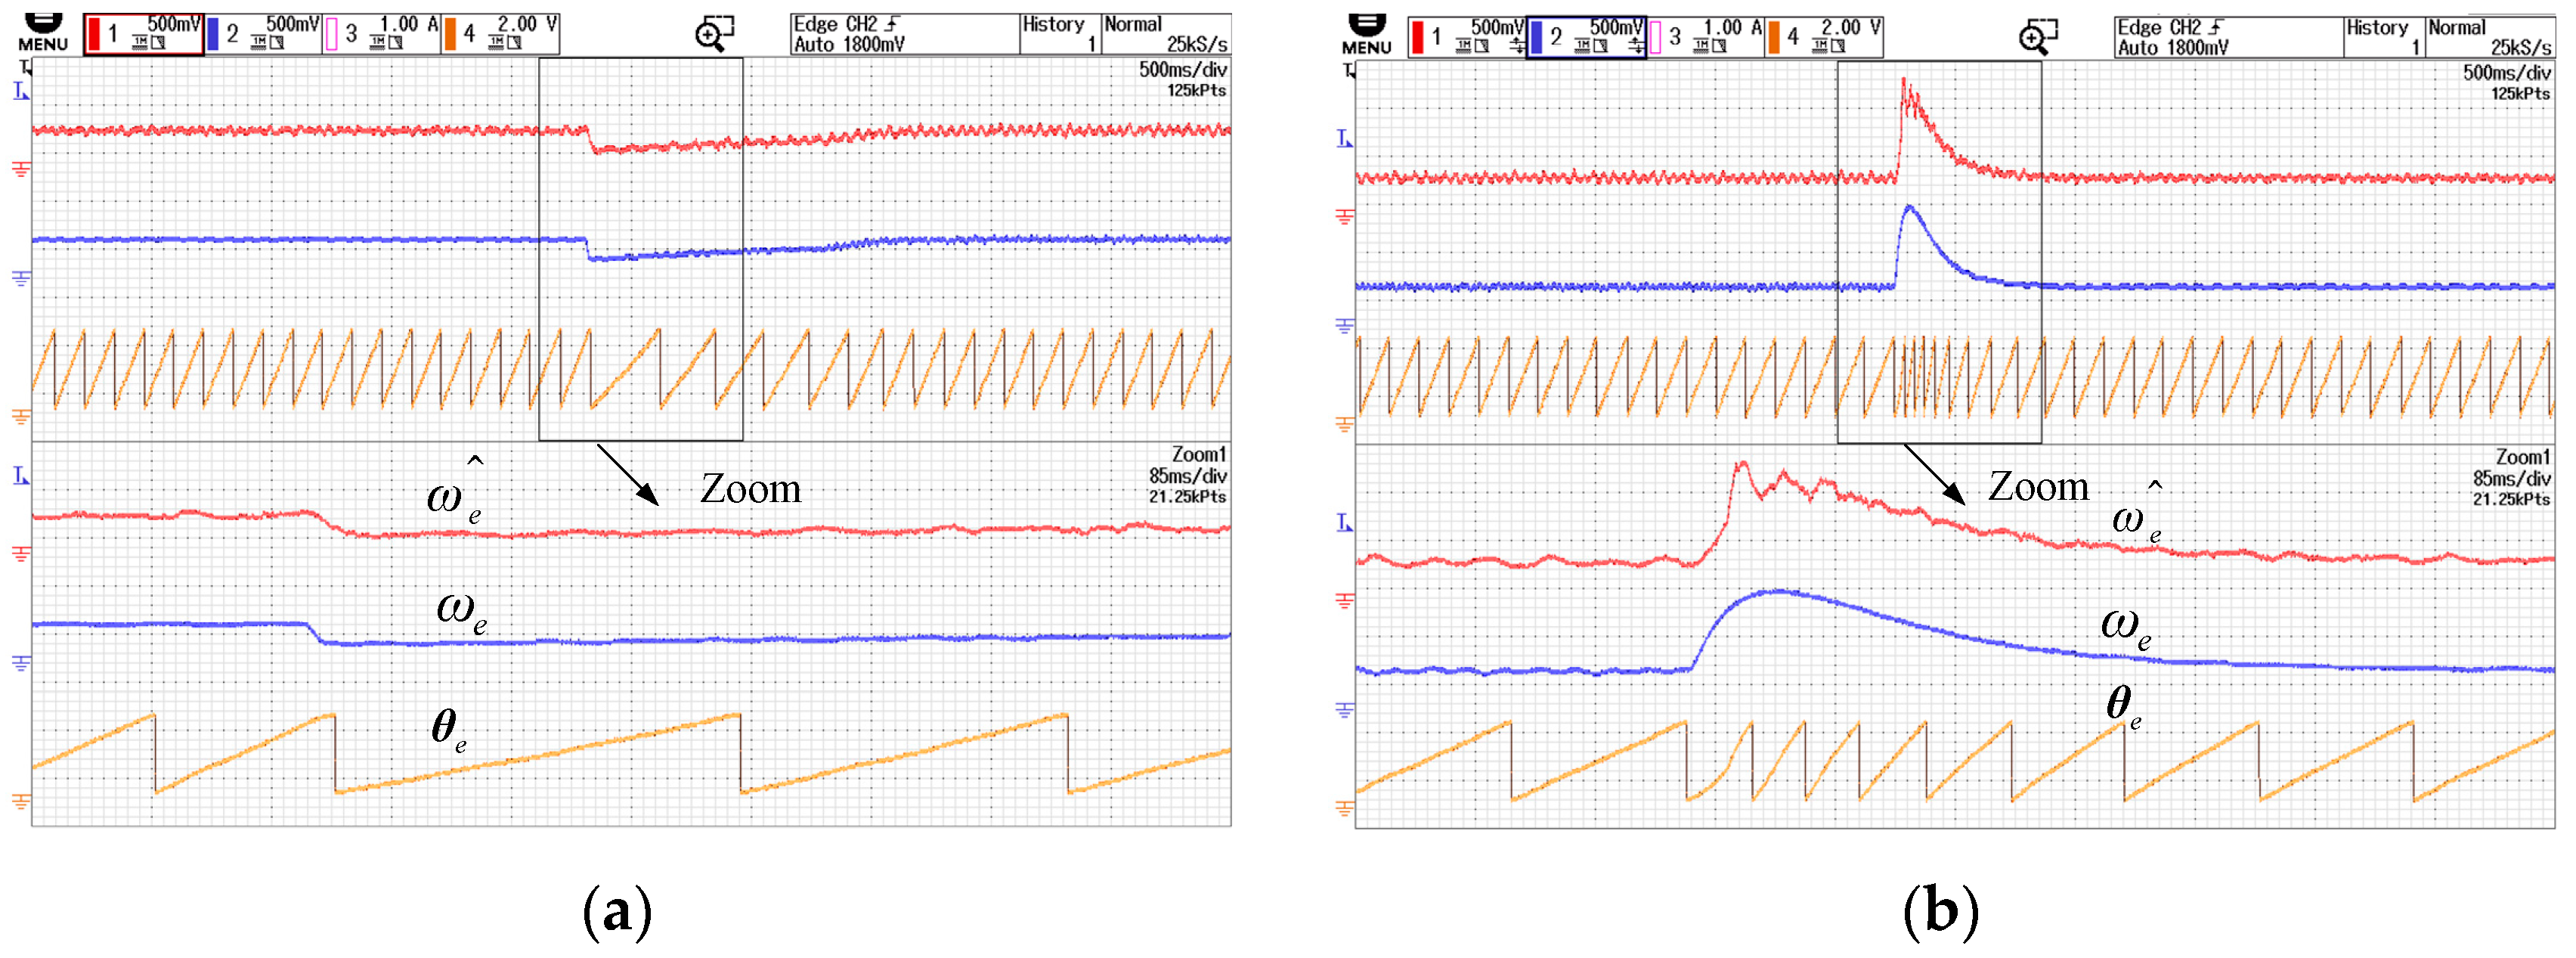
Figure 13a illustrates the changes in rotational speed and angular information when the sensorless control system transitions abruptly from no-load to loaded conditions.
Figure 13b shows the variations in speed and angle when the system shifts suddenly from loaded to no-load conditions. Based on the observed speed and angle dynamics, the sensorless control system rapidly regains stability after disturbances, demonstrating the robustness of the proposed periodic frequency modulation-based sensorless control framework.
5.2. Acoustic Noise Reduction Effects of the Proposed Algorithm
Fast Fourier transform (FFT) analysis was performed on the motor phase current to evaluate spectral changes under conditions where the switching frequency was set to 5 kHz and 10 kHz, respectively, with the injection frequency fixed at half of the switching frequency. The results were compared with the spectrum variations before and after applying the periodic frequency modulation method.
Figure 14a,b show the spectral distribution of the phase current under no-load and loaded conditions at a switching frequency of 5 kHz.
Figure 14c,d illustrate the spectral distribution of the phase current under no-load and loaded conditions after applying periodic frequency modulation, with the switching frequency centered at 5 kHz.
Figure 15a,b show the spectral distribution of the phase current under no-load and loaded conditions at a switching frequency of 10 kHz.
Figure 15c,d illustrate the spectral distribution of the phase current under no-load and loaded conditions after applying periodic frequency modulation, with the switching frequency centered at 10 kHz.
5.3. Discussion
The noise suppression effects are summarized in the
Table 2 below:
Based on the analysis of the tables and figures, the following conclusions can be drawn. The proposed periodic frequency modulation-based sensorless control algorithm demonstrates certain effectiveness in noise suppression. An analysis of the first, second, and third harmonics of the injection frequency reveals that the first harmonic (fundamental frequency) corresponds to the injection frequency and exhibits the highest noise level. The second harmonic represents switching frequency-related noise, while the third harmonic arises from odd-order harmonics induced by the injection frequency. The fourth harmonic, associated with double the switching frequency, has similar suppression principles to those of switching frequency noise and is not discussed in detail.
First, comparing loaded and no-load conditions, the spectral distribution and noise suppression performance of the algorithm show minimal sensitivity to load variations. Second, among different harmonics, the suppression effect is most pronounced for the second harmonic (switching frequency). Finally, comparing switching frequencies, the noise suppression at 5 kHz outperforms that at 10 kHz. This indicates that noise reduction depends on both spreading width and spreading depth. Smaller periodic modulation steps within a reasonable spreading width can more effectively disperse spectral energy. The final performance requires a balanced consideration of these two factors.
In summary, with a well-designed periodic frequency modulation strategy, the proposed algorithm achieves an effective suppression of injection-related and switching-related noise while maintaining sensorless control performance.
6. Conclusions
This paper proposes a high-frequency injection scheme based on periodic frequency modulation, which effectively reduces audible noise caused by high-frequency signals and switching signals. This study provides a detailed analysis of the current response under periodic variations in carrier frequency and injected square-wave cycles. From the perspective of FFT spectrum analysis, the proposed method reduces signal spikes and spreads the spectrum over a wider frequency range, thereby achieving noise reduction.
To ensure that the periodic frequency modulation method mitigates high-frequency noise without compromising the accuracy of the sensorless control system, this paper introduces a demodulation method based on the measurement-axis reference frame. This approach effectively extracts rotor position information from the periodically excited high-frequency current.
Theoretical and experimental results demonstrate that the proposed method broadens the frequency distribution of the high-frequency injection response, reducing noise while simultaneously suppressing noise generated by switching signals. The sensorless control scheme is validated on a 0.4 kW IPMSM platform, evaluating both steady-state and dynamic performance during low-speed operation. Additionally, the phase current spectrum of the experimental motor is analyzed, confirming the effectiveness of the proposed noise mitigation method.


