Article

Optimal Multi-Area Demand–Thermal Coordination Dispatch

1
Department of Electrical Engineering, National Taiwan Ocean University, Keelung 202301, Taiwan
2
Maritime Development and Training Center, National Taiwan Ocean University, Keelung 202301, Taiwan
3
Department Marine of Engineering, National Taiwan Ocean University, Keelung 202301, Taiwan
*
Author to whom correspondence should be addressed.
Energies 2025, 18(11), 2690; https://doi.org/10.3390/en18112690
Submission received: 18 March 2025 / Revised: 25 April 2025 / Accepted: 19 May 2025 / Published: 22 May 2025

Abstract

:
With the soaring demand for electric power and the limited spinning reserve in the power system in Taiwan, the comprehensive management of both thermal power generation and load demand turns out to be a key to achieving the robustness and sustainability of the power system. This paper aims to design a demand bidding (DB) mechanism to collaborate between customers and suppliers on demand response (DR) to prevent the risks of energy shortage and realize energy conservation. The concurrent integration of the energy, transmission, and reserve capacity markets necessitates a new formulation for determining schedules and marginal prices, which is expected to enhance economic efficiency and reduce transaction costs. To dispatch energy and reserve markets concurrently, a hybrid approach of combining dynamic queuing dispatch (DQD) with direct search method (DSM) is developed to solve the extended economic dispatch (ED) problem. The effectiveness of the proposed approach is validated through three case studies of varying system scales. The impacts of tie-line congestion and area spinning reserve are fully reflected in the area marginal price, thereby facilitating the determination of optimal load reduction and spinning reserve allocation for demand-side management units. The results demonstrated that the multi-area bidding platform proposed in this paper can be used to address issues of congestion between areas, thus improving the economic efficiency and reliability of the day-ahead market system operation. Consequently, this research can serve as a valuable reference for the design of the demand bidding mechanism.

1. Introduction

With the soaring demand for electric power and the rising environmental awareness, governments from many countries have actively developed renewable energy generation systems (REGS), implemented energy-saving actions, and performed user-side load management measures to realize the energy transition more smoothly. At present, Taiwan’s government puts focus on increasing the proportion of renewable energies in the energy supply system in response to the net zero emissions. The goal is to increase the ratio of power generation from renewable energy resources to 20% by 2025 [1]. As the penetration of renewable energy keeps increasing, the impact of REGS on the stability and robustness of the power system is attracting a lot of attention. Due to the characteristics of uncertainty and intermittency of the output from renewable energy resources, power dispatching becomes a challenge for system operators [2,3,4]. Moreover, the electricity demand during peak hours has increased sharply in recent years in Taiwan. With limited generators to compensate and a sudden rise in load demand, many problems have occurred, including high variations in load demand during peak hours and off-peak hours, inefficient usage of energy, regional imbalances between supply and demand, and even the insufficiency of backup capacity. The question of how to ensure the safety and reliability of the operation of Taiwan power system becomes an important and challenging one.
As many distributed energy resources (DERs) are introduced into the power system, the development of a virtual power plant (VPP) plays a key role to integrate the resources from both supply and demand sides. VPP is regarded as a novel power supply service that consists of DERs, controllable load, and battery energy storage system (BESS), etc., giving VPP flexible adjustability and rapid response ability. In this way, it can effectively handle the unstable issues in the power system, such as a sudden increase in load, failure of thermal generator, or uncertainty in the output of renewable energy generation [5,6,7]. In addition, many papers have investigated the strategies applied for demand response (DR) [8,9,10,11,12]. In Ref. [8], a large number of end-users, namely DR sources, are formed as DR aggregators in the electricity market, and an approach based on game theory is developed for the bidding strategy. In Ref. [9], the load aggregator (LA) takes the risk of the uncertainty of the wholesale market prices and bids in the wholesale market to purchase electricity to satisfy the demand of the customers in the electricity market. To relieve the risks of financial loss caused by price volatility, an optimal bidding strategy model is designed for the LA to perform DR program. Furthermore, to ensure the aggregator fully grasps the information of available DR capacity, Ref. [10] has proposed an optimal bidding strategy for the aggregator, considering the bottom-up responsiveness of residential customers. In Ref. [11], a novel hybrid stochastic–robust optimal trading strategy for a DR aggregator in the wholesale electricity market has been proposed, aiming to improve scheduling and manage risk by considering both stochastic market prices and non-stochastic consumer participation, while also incorporating energy storage and multiple demand response programs. In contrast, Ref. [12] focuses on the self-scheduling problem of a generation company and a DR aggregator in a competitive market. It models temporal load characteristics and employs a Fuzzy Inference System (FIS) to represent DR aggregator participation based on load behavior and customer willingness. The circumstances of multi-grid and the inclusion of distributed energy resources or renewable energy resources are also considered in Refs. [13,14,15,16,17]. Ref. [13] introduces a low-carbon economic dispatch (ED) model tailored for multi-energy microgrids, aiming to reduce daily operating costs through the integration of DR and a multi-stage carbon trading scheme. Ref. [14] presents a decentralized optimization approach for managing the operation strategy of hierarchical systems, taking into account the competitive interactions among individual agents. Ref. [15] provides a comprehensive review of ED problems, examining their mathematical formulation; evolution from conventional to modern power systems, including VPPs and multi-energy systems; and the various conventional, uncertainty-based, AI-based, and hybrid optimization techniques used to solve them. In contrast, Ref. [16] focuses on a specific control strategy, namely Model Predictive Control (MPC), for microgrids to participate in real-time ancillary service markets. This paper addresses the integration of DERs and the potential for microgrids to enhance power system stability and reliability. Finally, a comprehensive review of demand response programs within multi-energy systems (MESs) can be found in Ref. [17], which highlights the increasing research and the potential of MESs, often incorporating energy hubs and storage, to enhance flexibility and consumer comfort during DR operation.
Apart from the supply–demand balance for electricity, the ancillary services, including frequency regulation, voltage control, and reserve capacity, also play a crucial role in the power market for a robust and stable power system operation. Ref. [18] analyzes the current development and historical evolution of the unified power market in Europe and regional power markets in the US and further highlights the critical factors influencing the design of ancillary service trading mechanisms in regional electricity markets. Therefore, some studies focus on the bidding strategies that consider the spinning reserve [19,20,21,22,23,24,25,26]. In Ref. [19], an optimal bidding strategy is presented considering flexible ramping products; thus, a microgrid is able to optimally allocate the capacities for energy, spinning reserve, and ramping. In Ref. [20], the reserve cost and penalty cost of over and under estimation of outputs of renewable energy resources were considered, respectively, for more robust optimal bidding. Ref. [21] developed an optimal bidding strategy in energy and reserve markets considering environmental restrictions for a grid-connected combined-heat-and-power-based multi-microgrid system. Ref. [22] and Ref. [23] specifically focus on optimal bidding strategies for microgrids considering uncertainties of renewable energy resources and market prices, which employ stochastic modeling and risk management techniques for participation in energy and ancillary service markets such as regulation and reserves. Ref. [24] broadens this to the distribution system level and proposes a framework for optimizing profits by local resources such as wind, PV, EVs, and BESS in the joint energy, regulation, and ramp markets. Ref. [25] investigates a more advanced paradigm of transactive energy management in distribution systems, enabling bidirectional exchange of both energy and ancillary services between the distribution system operator and microgrids through a stochastic bilevel programming model to manage interactions under uncertainty. To prevent the shortage of power supply during the peak hours, Taiwan Power Company, namely Taipower, has implemented the DB mechanism since 2015 [26]. It is noted that a DB mechanism is one of the load management measures used by Taipower to perform demand response. Within the energy bidding platform, DR participants can specify both the amount of load reduction for peak shaving and the corresponding bid price during their available time slots. All participants will join the bidding process, together with thermal generators of Taipower. Therefore, a collaboration between the customers and suppliers can be achieved. Through the load management strategy, the significant load consumption during peak hours can be reduced. In addition, DR users in the ancillary service bidding platform are able to provide reserve capability to enhance the stability of Taipower’s system.
The day-ahead market enables participants to submit bids for the purchase or sale of electricity for each hour of the following day through a closed auction mechanism. In order to further strengthen Taipower’s DB mechanism, operated at the day-ahead market, this paper intends to integrate the energy bidding platform and the ancillary service bidding platform to comprehensively investigate the optimum dispatch problem of multi-area economic generation and reserve under DB mechanism. Meanwhile, the coordination between thermal generators and substantial industrial users under DB mechanism is also discussed to further improve the power system operation efficiency and stability. Due to the complex constraints and many coupling conditions, it is very difficult to achieve optimal power dispatch for both generation and reserve in power system. Many studies have applied analytical methods and optimization techniques to investigate power dispatch problems, such as direct search method (DSM) [27], Simulated Annealing (SA) [28], Genetic Algorithm (GA) [29], Particle Swarm Optimization (PSO) [30], and Grey Wolf Optimizer (GWO) [31], etc. This paper aims to expand the application of the DSM and develop a software analysis tool to assist the day-ahead market bidding platform. To dispatch energy and reserve markets concurrently, a hybrid approach of combining dynamic queuing dispatch (DQD) with DSM is developed to solve the multi-area ED problem. The proposed method is designed to simultaneously optimize the power dispatch of DR users and thermal power generation systems to enhance the fairness of DR user competition in the generation scheduling of the system and further optimize the bidding results of actual DR users. The results show that allocation of generation and reserve capacity cooperated by thermal units and equivalent DR units is able to relieve congested areas and supply bottlenecks. It should be noted that although the increasing share of renewable energy is a key driver behind the need for demand-side flexibility, this paper focuses solely on the design and evaluation of a multi-area demand bidding mechanism.
The main technical innovations and contributions of this paper are summarized as follows:
  • A multi-area DB mechanism is developed to enhance customer–supplier collaboration in DR, aiming to alleviate regional congestion and address supply bottlenecks.
  • This paper integrates the multi-area DB platform of energy market and ancillary services market with the actual bidding prices and information from the DR users to enhance the transparency and the efficiency of the day-ahead market.
  • An improved technique based on a DSM is proposed to address the multi-area generation and reserve dispatch problem under the DB mechanism of Taipower.
  • Simulation results are presented to evaluate the effectiveness and economic benefits of implementing the DB program. The proposed DSM approach demonstrates both practical applicability and operational efficiency.
This paper is organized as follows. In Section 2, the DB mechanism of Taipower will be introduced. In Section 3, the problem description will be given. In Section 4, the DSM including DQD will be explained in detail. Eventually, in Section 5, the simulation results and three case studies will be discussed.

2. A Brief Introduction of the Demand Bidding Mechanism of Taipower

The DB mechanism was initially implemented in 2015. Until now, it has been revised and changed to meet the up to date supply–demand conditions. Depending on the system requirement, the day-ahead market for the bidding mechanism can be divided into the energy market and ancillary services market. In the day-ahead market, the key factors, such as the bidding prices given by DR users, output power from thermal generators, and the requirements from the power system, etc., are all taken into account in the optimum dispatch algorithm to determine the bid winners in the energy market and ancillary services market, individually. A brief description of Taipower’s current DB mechanism is provided in the following section.

2.1. Regulations of Load Reduction by DR Users

The DB mechanism for participants, i.e., DR users, can be divided into three types: economical type, reliable type, and aggregated type. Among them, the economical type is of interest for most of the participants, due to the incentives. According to Taipower, participants must follow the rules to join the DB mechanism. That is, the minimum load reduction in participants is 20 kW and the maximum bidding price is 10 TWD/kWh. Participants can choose to perform load reduction for 2 h or 4 h for each time, and the total load reduction in a month is limited to 36 h. The actual amount of load reduction is determined by the difference between customer baseline load (CBL) and the average load demand in the period of DR implementation shown in Figure 1. Herein, the CBL is calculated by averaging the demand power during the same DR period, except for the load-reduction day, off-peak days, weekends, and holidays [32].

2.2. Equivalent Groups of Multiple DR Users

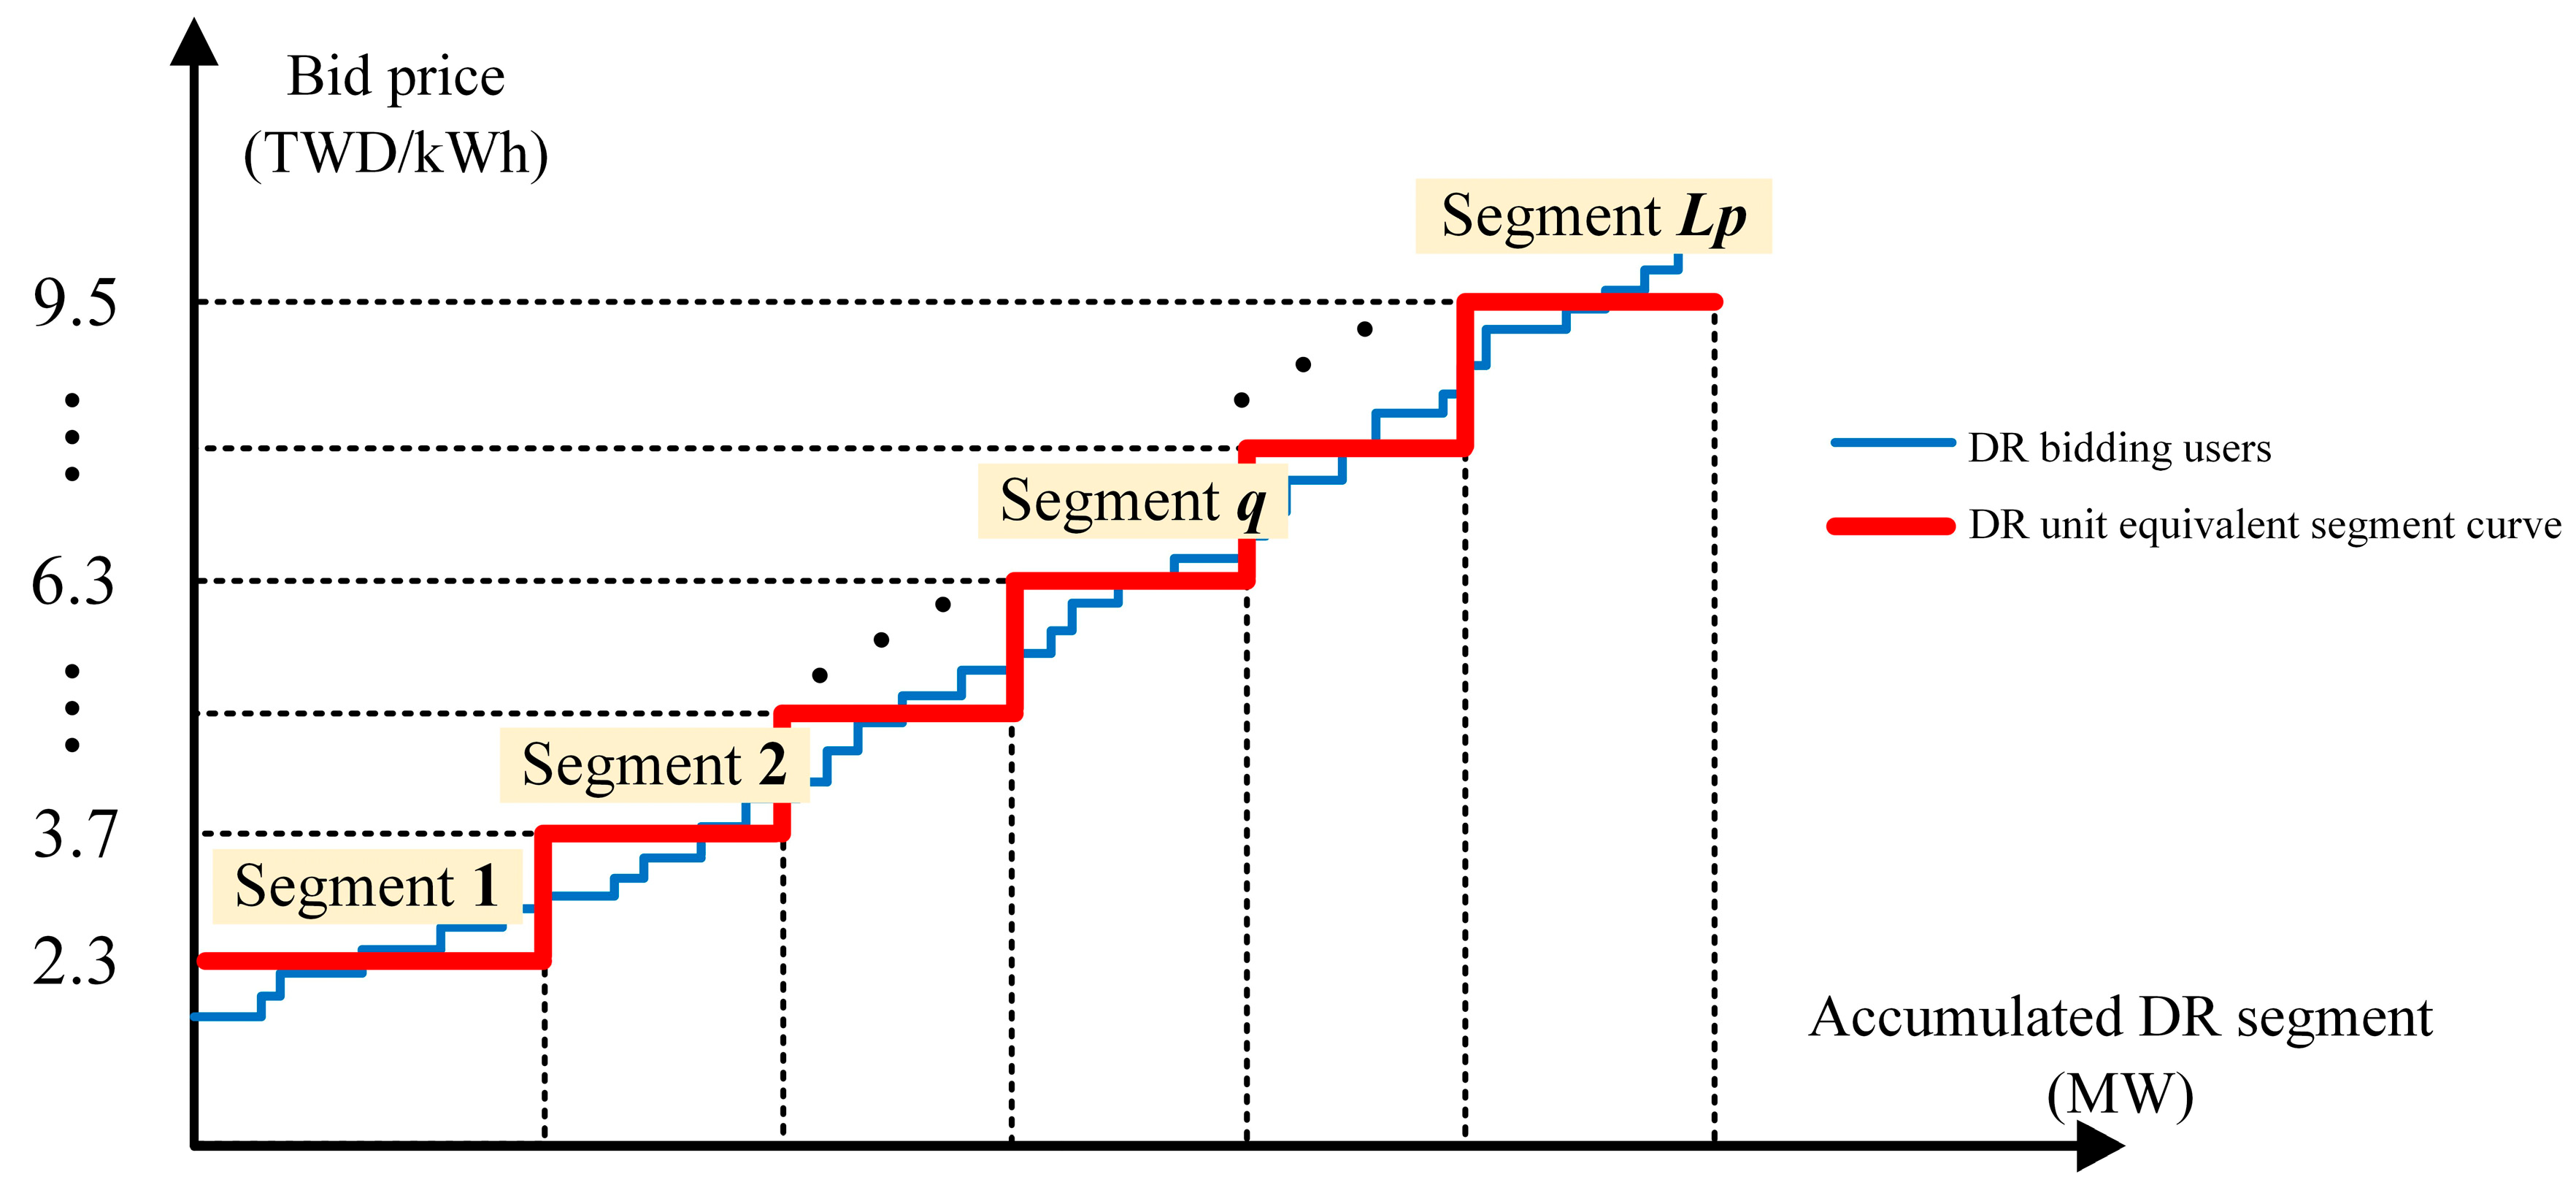
In the DB mechanism, customers with larger load reduction capability can participate directly in the bidding market, while customers with less load reduction capability need to be integrated through an aggregator. Because most of the DB participants have relatively limited capability to perform load reduction, it is difficult for them to participate in the bidding process with thermal generator units of Taipower. A DR user formed via the integration of participants through an aggregator, which not only enhances the competitivity of individuals but also benefits the systematic allocation. Therefore, the formation of DR users enables the equal demonstration of the bidding procedure for participants with various levels of load reduction capabilities. As illustrated in Figure 2, there are LP levels of prices corresponding to the equivalent DR segments bidding with the same prices. The quotes of DR users in the day-ahead market are ranked from low to high. Taipower groups DR users with similar bidding prices into equivalent segments, each representing a defined amount of load reduction from a DR unit [32]. As a result, the DR bidding structure is organized into six price levels, with each level corresponding to a specific DR segment bidding at the same price. This process enables the unit to possess competitive DR capability compared with the existing thermal generator units in the bidding procedure.

2.3. Determination of the Bid Winner

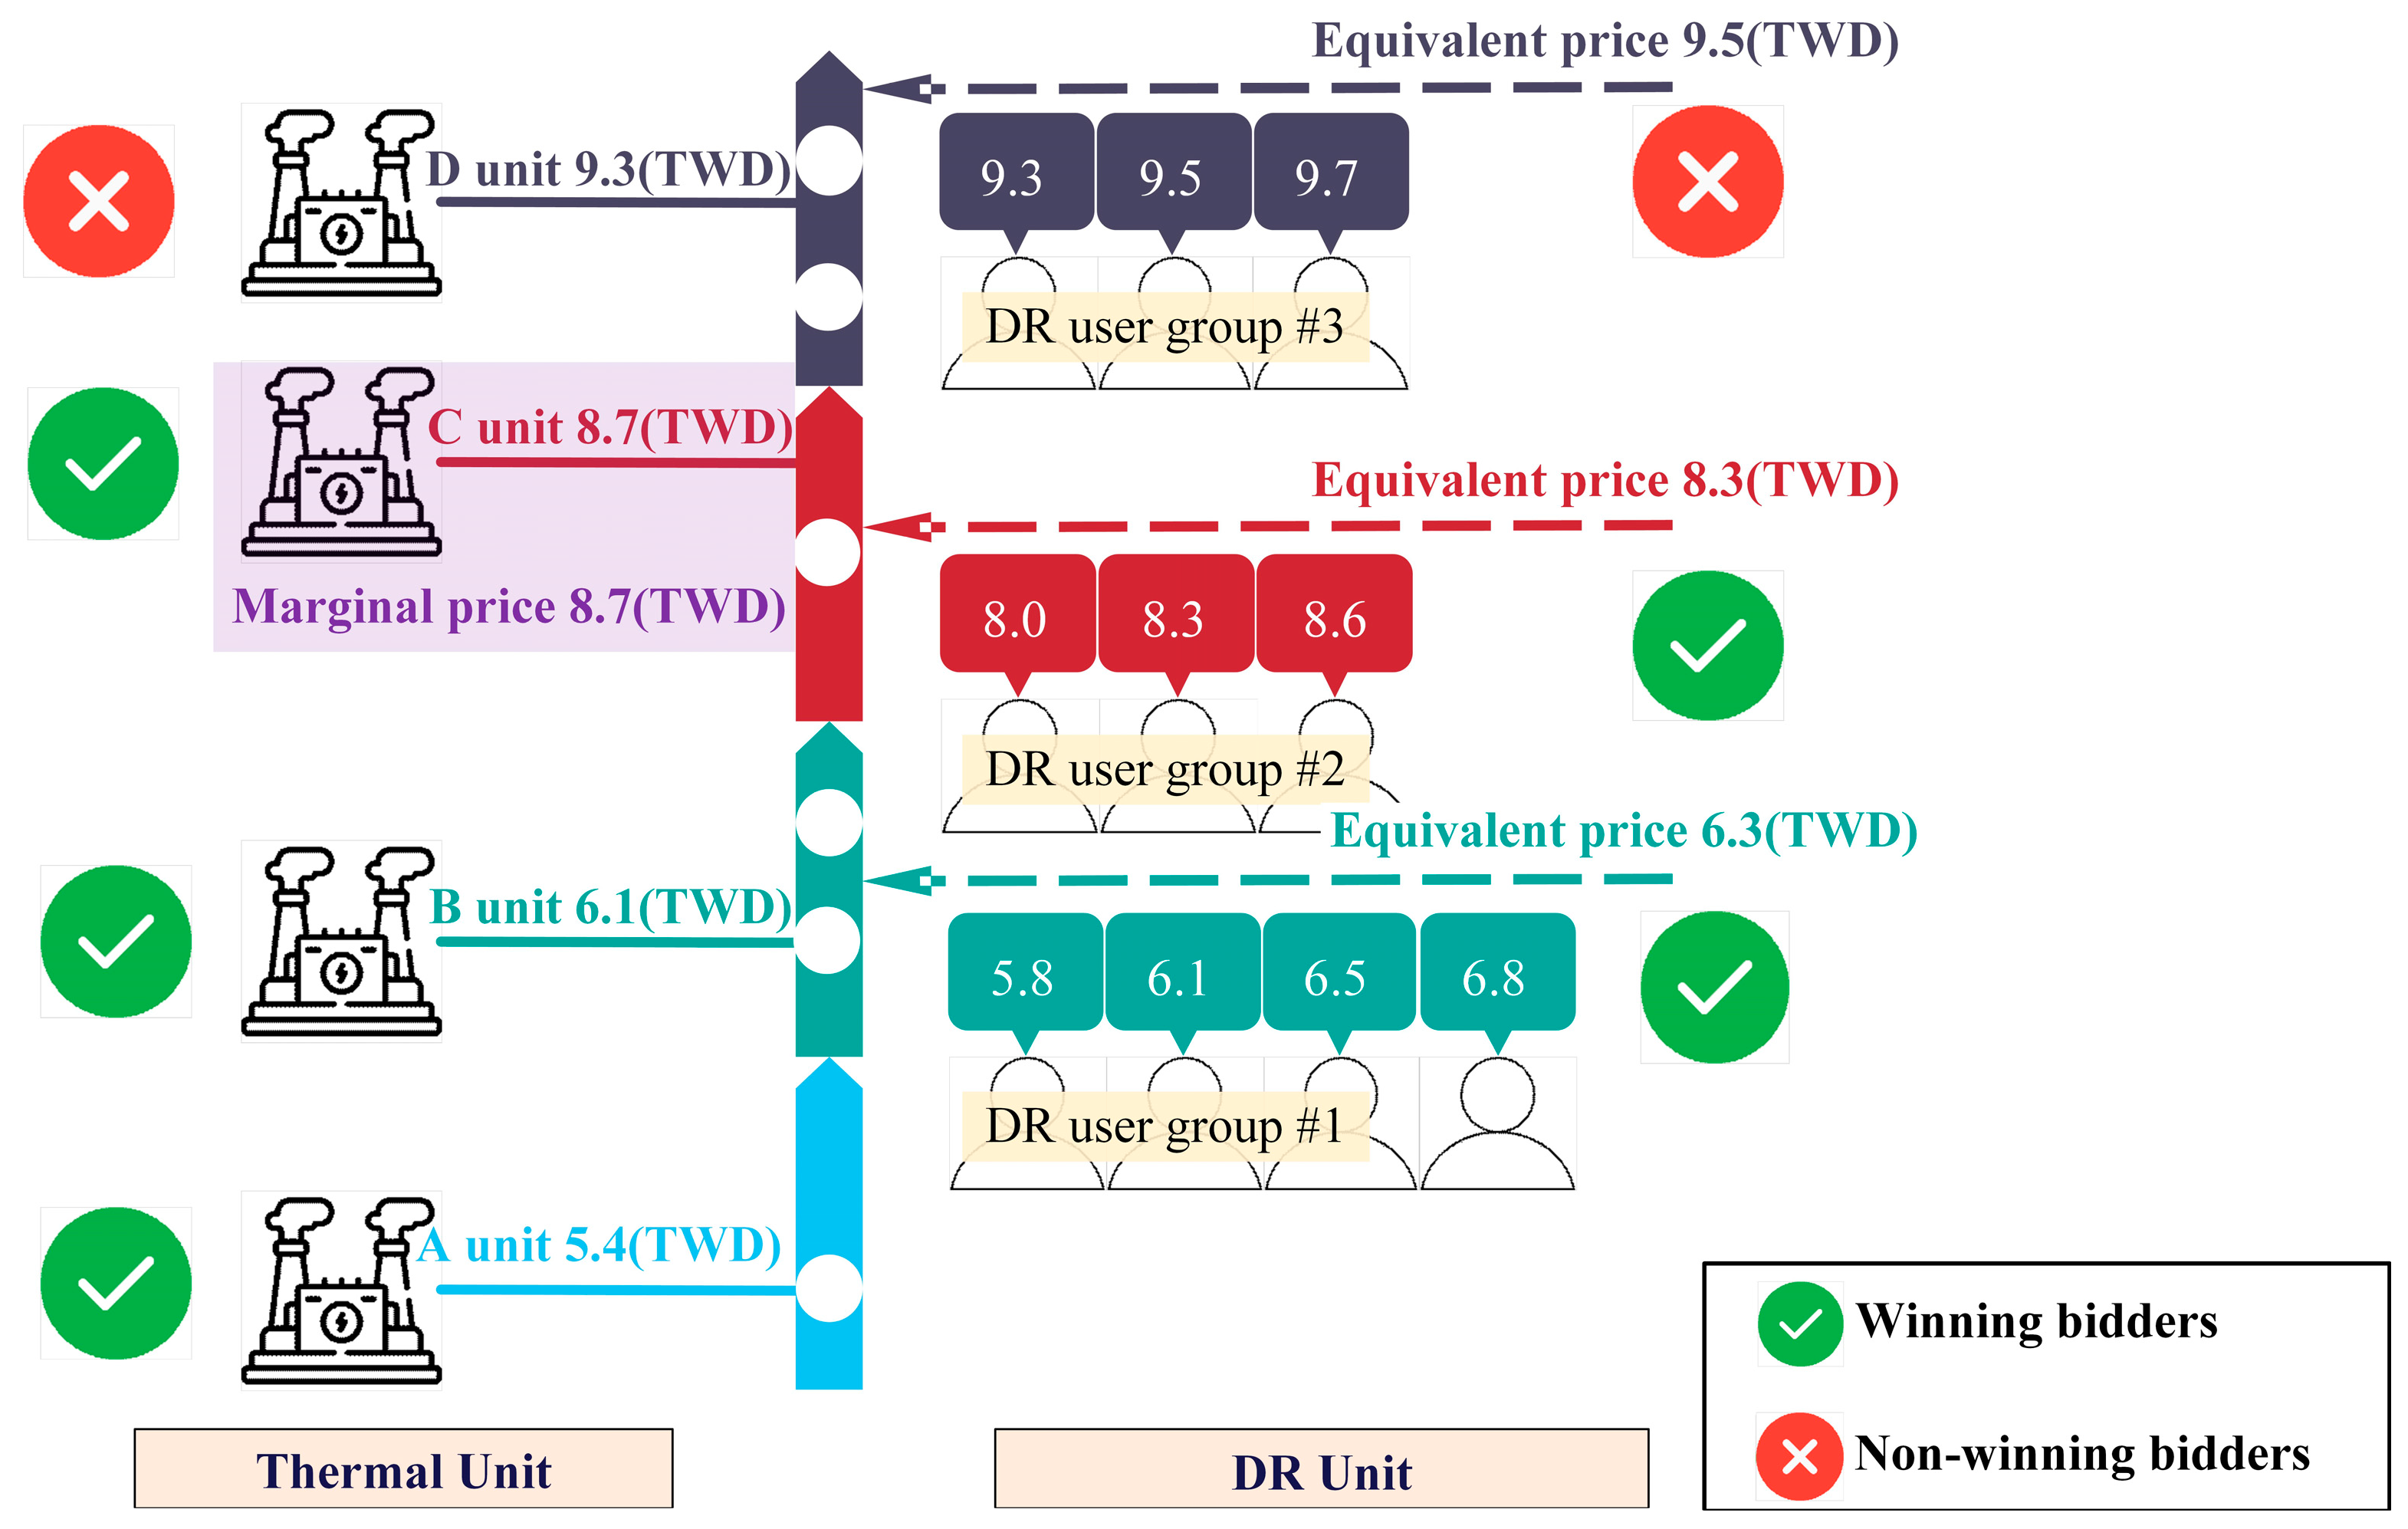
Taipower has built the DB mechanism to allow the substantial small and medium-scale DB participants to form a DR unit in the design of power dispatch strategy. The DR user groups will win the bid when their prices are lower than the marginal price of the thermal generator unit. As presented in Figure 3, DR user group #1 and #2 win the bid and perform load reduction in place of starting up thermal generator D. Similarly to the energy market, there is an ancillary service market open for DR users to participate in the bidding mechanism [32]. Figure 4 represents an illustration of the determination of the dealing prices for the bid winners. In the ancillary service bidding framework, Taipower will decide the total required amount for ancillary service in advance. Next, the ancillary service demand will be satisfied by the DR users, matched from low bidding prices to high ones. Unlike DB for generation, the price of the last bidding winner (DR user x) in ancillary service is applied for all the bidding winners, regardless of the initial bidding prices [33]. As a result, unit commitment and economic dispatch play the crucial roles in the DB mechanism. It is necessary to develop a software tool to determine whether the equivalent DR unit wins the bid and tell the corresponding users to perform load reduction. Importantly, this tool can help Taipower to implement the DB mechanism and provide a better understanding for system operators of interactions between the players.

3. Problem Description Considering Multi-Area Scenario

Taiwan’s power system can be modeled as a simplified network including northern, central, and southern areas, as shown in Figure 5. It is noted that the northern thermal units take 30% of power generation, but the northern load demand consumes almost 50% of the total load [34]. Since the severe unbalance occurs in the northern area, the transmission of power flow among areas becomes significant and even results in congestion of power lines. The allocation of spinning reserve will also be affected, which brings the issues of instability and lack of robustness for the power system. To strengthen system security and reliability, ensuring adequate emergency reserves distributed among multiple thermal units in each area significantly improves the ability of system to respond to frequency deviations and load pick-up following a contingency, particularly in isolated systems like the Taiwan power system. Each thermal unit is subject to generation limits (both upper and lower) and can provide only a restricted amount of spinning reserve, based on its ramping capacity. The spinning reserve requirements for each area can be met by the combined sum of local and imported reserves during forced outages of thermal generators. The local reserve in each area is determined to ensure an adequate amount of reserve capacity. As a result, tie-lines are responsible for transmitting both generation and reserve simultaneously. To enhance the transparency and the efficiency of the day-ahead market for DB mechanism, this paper integrates the DB platform of energy and ancillary service market with the actual bidding prices and information from the DR users, which enables the associated DR users to compete with the thermal units. Through the proposed optimum dispatch algorithm, the resulting day-ahead procurement quantity and the price can be obtained.
Under the DB framework of the day-ahead market, the purpose of optimal multi-area demand–thermal coordination dispatch is to allocate the required generation and reserve capacity to thermal units and equivalent DR units. Namely, the goal is to minimize the total dispatch cost, subject to the satisfaction of regional load and reserve capacity requirements, the upper and lower output limits of the thermal unit, the coupling restrictions of reserve capacity for the thermal unit, and the operational limitations of the DR units. The objective function (1) includes two terms: the operation cost of thermal units and the summation of energy and spinning reserve cost of DR unit. The mathematical model is represented as follows:
Objective function
M i n i m i z e T C = i = 1 N T F i ( P i ) + a N , C , S F D B a ( P D B a ) + G D B a ( S D B a )

3.1. Calculation of the Cost for Thermal Unit and DR Unit

Generally, the fuel cost of thermal units can be represented by a second-order, strictly increasing function, shown in (2) [35]. The spinning reserve cost of thermal units from the public utility is almost negligible.
F i ( P i ) = α i + β i P i + γ i P i 2
The quotes of DR users in the day-ahead market are ranked from low to high. The participants with low capacity are aggregated into a DR user. Then, the DR users are aggregated into an equivalent DR unit with multiple segments to simplify the calculation. In this way, substantial small and medium-scale DB users are grouped based on bidding prices to form a multi-segment equivalent DR unit for energy generation. Figure 6 represents a conceptual illustration to calculate the cost of DR unit. Since the price of the bid winner in the DR unit for energy generation is based on the user’s bidding price, the cost of the DR unit for energy generation with P D B a load reduction is calculated as
F D B a ( P D B a ) = F D B 1 a + F D B 2 a a N , C , S
where
F D B 1 a = q = 1 l 1 j = 1 N P q a B P q , j a × C P q , j a
F D B 2 a = j = 1 m 1 B P l , j a × C P l , j a + ( P D B a P D B , l , m 1 a ) × C P l , m a
P D B , l , m 1 a P D B a P D B , l , m a
P D B , l , m 1 a = q = 1 l 1 j = 1 N P q a B P q , j a + j = 1 m 1 B P l , j a
Since the price of bid winner in DR unit for spinning reserve is based on the last user’s bidding price, the cost of DR unit for spinning reserve with S D B a reserve capacity for the user of bid winner is calculated as
G D B a ( S D B a ) = S D B a × C S k a a N , C , S
where
S D B , k 1 a S D B a S D B , k a   ,   k 1 , 2 ,   ... ,   N S a

3.2. Constrains for System Power Dispatch

  • Requirement of power balance for each area:
i N P i + P D B N + P C N = P D N
i C P i + P D B C + P S C P C N = P D C
i S P i + P D B S P S C = P D S
  • Requirement of spinning reserve for each area:
i N S i + S D B N + S C N 1 S R D
i C S i + S D B C + S C N 2 + S S C 1 S R D
i S S i + S D B S + U S C 2 S R D
  • Transmission capacity constraints for power flow among the areas:
P C N + S C N 1 P C N max     i f   P C N > 0
P C N + S C N 2 P C N m a x     i f   P C N < 0
P S C + S S C 1 P S C m a x     i f   P S C > 0
P S C + S S C 2 P S C m a x     i f   P S C < 0

3.3. Constraints for Thermal Units

  • Upper limit of spinning reserve for the thermal unit:
S i max = d % × P i max
  • Spinning reserve contribution of thermal unit:
S i = min S i max , P i max P i
  • Output generation constraint of thermal unit:
P i min P i P i max
  • Constraints of the energy and reserve capacity:
P i + S i P i max

3.4. Constraints for DR Unit and DR Users

  • Constraint of DR unit for energy generation:
0 P D B a P D B a , max a N , C , S
  • Constraint of a DR user for energy generation:
B P q , j a , min B P q , j a B P q , j a , max ,   when winning the bid
B P q , j a = 0 ,   others
  • Constraint of bidding price of a DR user for energy generation:
0 C P q , j a C P D B max ,   q = 1 , 2 , ... , L p , j = 1 , 2 , ... , N P q a
  • Constraint of a DR unit for spinning reserve:
0 S D B a S D B a , max a N , C , S
  • Constraint of a DR user for spinning reserve:
B S k a , min B S k a B S k a , max ,   when winning the bid
B S k a = 0   ,   others
  • Constraint of the bidding price of a DR user for spinning reserve:
0 C S k a C S D B max ,   k = 1 , 2 , ... , N S a

4. The Modified Direct Search Method

DSM is a type of deterministic search algorithm characterized by its simple structure, easy implementation, fast convergence speed, and good convergence quality compared to other general heuristic algorithms. In addition, it is capable of handling various types of cost functions of thermal units to deal with ED problems. However, it has the disadvantage of being prone to falling into local optima. To overcome the shortage of conventional DSM, an improved DSM has been developed with a direct search procedure for multiple points to enhance the exploration and exploitation at the same time, which leads to a higher probability of obtaining the global optimal solution [36]. In consideration of the multi-area DB platform, system operators must simultaneously manage the generation capacity, reserve capacity, and inter-regional transmission capacity constraints for a large number of DB users. The complexity of these constraints makes it challenging to apply traditional DSM or SDSM approaches. To address the optimization problem of combining generation capacity and reserve capacity scheduling on a multi-area bidding platform, this paper introduces a Hybrid Direct Search Method (HDSM). The complex scheduling problem then can be decomposed into two parts: namely, the traditional DSM is used to coordinate the scheduling of system thermal power units and DR units for each area, serving as the primary problem, meanwhile, the DQD method optimizes spinning reserve allocation for each area and inter-regional sharing of the spinning reserve, serving as the secondary problem. By coordinating between these two problems, the overall dispatch cost can be minimized.
Notably, inequality constraints in this study are handled differently. Equations (10)–(12) and (20)–(31) can be controlled using a direct search procedure. On the other hand, inter-regional flow constraints (16)–(19) and inter-regional reserve capacity supply–demand constraints (13)–(15) can be appropriately controlled through penalty function techniques. To account for transmission capacity limit violations (16)–(19) and area spinning reserve requirement violations (13)–(15), the total operating cost is increased by non-negative penalty terms, PC1 and PC2, which penalize any violations of constraints. These penalty terms are directly proportional to the extent of the violations and are zero when no violations occur. The values of PC1 and PC2 are selected to be sufficiently large to make any constraint violations undesirable in the final solution. Consequently, the dispatch cost and penalty cost can be combined to form a new objective function called TCA. Further details are explained as follows:
T C A = T C + P C 1 + P C 2
where
P C 1 = a N , C , S P F × ( S R D S R a c t a ) S R D × H ( S R D S R a c t a )
P C 2 = l C N , S C P F × ( P l a c t P l max ) P l max × H ( P l a c t P l max )
P l a c t = P l + S l 1       i f   P l > 0       l C N , S C
P l a c t = P l + S l 2       i f   P l < 0       l C N , S C
Here,
H x unit step function
P F penalty coefficient
P C 1 penalty for the violation of the requirement of area spinning reserve
P C 2 penalty for the violation of the limits of the transmission line
S R D spinning reserve requirement at each area
S R a c t a actual supply of spinning reserve at each area
P l max maximum   power   flow   between   area   l   where   l C N , S C
P l a c t actual   power   flow   between   area   l where   l C N , S C
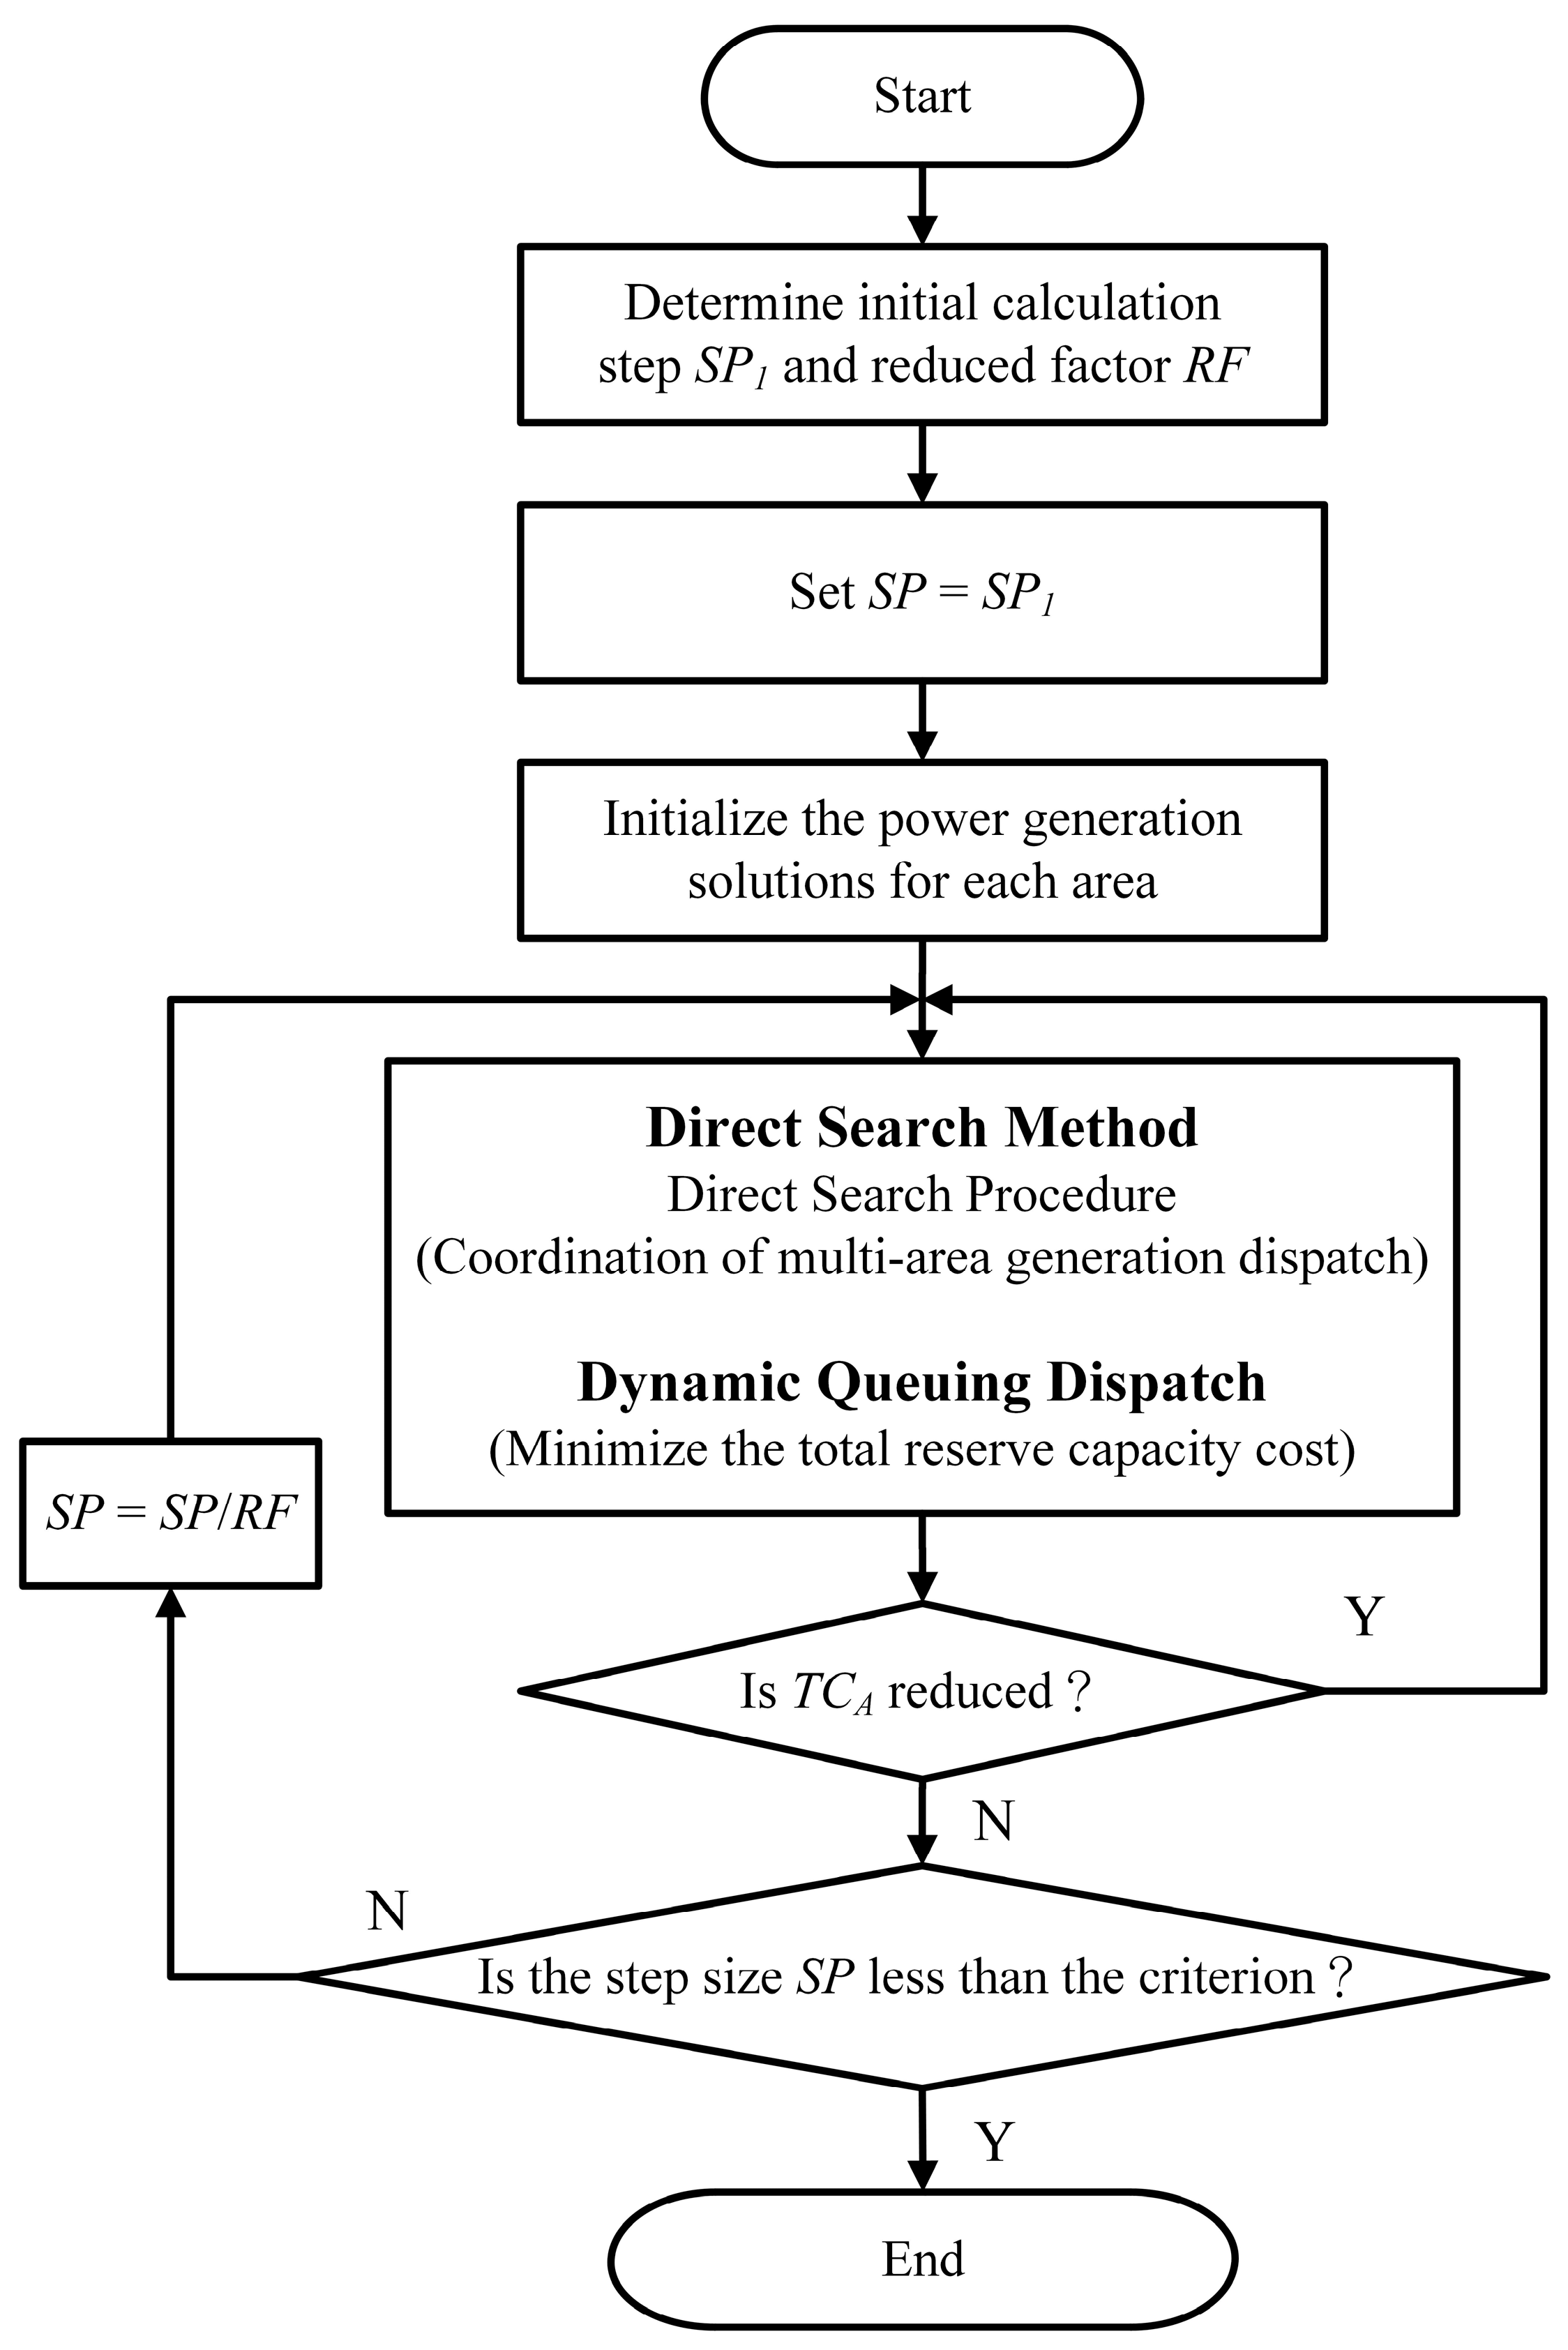
The flowchart of the proposed HDSM is shown in Figure 7. In the searching process, the DSM enables the coordination of multi-area demand–thermal generation dispatch and handles constraints properly. At each possible step, the DQD is used to minimize the total reserve cost when the preliminary solution of energy dispatch is frozen. Through the iterations of the proposed method, the minimum dispatch cost can be obtained. Unlike metaheuristics with a stochastic nature and multiple parameters to be determined in the algorithm, the proposed method is characterized by its simplicity and merely two parameters need to be set, namely initial step size (SP1) and the reduced factor (RF). Particularly, it is able to cope with many coupling conditions and equality or inequality constraints. Below is a detailed explanation of the computational steps in HDSM.
Step 1: 
Obtain the data from thermal units and DB users.
Step 2: 
Group the equivalent DR units in each area based on DB participant’s data.
Step 3: 
Set initial calculation step SP1 and reduced factor RF.
Step 4: 
Set SP = SP1.
Step 5: 
Initialize the power generation solutions for each area.
Step 6: 
Perform the DSM with step SP to optimize the scheduling of generation and handle additional constraints properly for multiple areas.
Step 7: 
At each possible step SP, the DQD is applied to optimize the scheduling of reserve capacity for multiple areas.
Step 8: 
Is the step size SP less than the criterion? Yes, proceed to the next step. Otherwise, SP = SP/RF, and return to Step 6.
Step 9: 
Output the scheduling results and the bid winner in each area. The winning customers in each area are then determined by the area’s marginal prices.

4.1. Establishing the Equivalent DR Unit in Individual Area

As mentioned in Section 2.2, to make DR users competitive with the existing thermal generator units in the bidding procedure, DR users are required to form into the equivalent groups as a DR unit. The quoted prices of DR users are arranged in order and divided into LP segments. However, instead of using the equivalent quote introduced in the Taipower DR bidding mechanism, this paper employs the actual prices of DR users to carry out the simulation to reflect the actual cost. Table 1 provides further explanation on the establishment of an equivalent DR unit for a specific area. The DR users are grouped to simplify the computation. Assuming that there are 12 DR users participating in bidding, and the difference between the highest (TWD 9.80/kWh) and lowest (TWD 6.60/kWh) quoted prices of the DR user is evenly distributed into four segments, namely [6.6, 7.4, 8.2, 9.0]. In this way, the DR users with similar quoted prices are allocated to the same segment, for example, Segment 4 has three customers (#10 to #12) with close quoted prices. Finally, the equivalent bid quantity and bidding cost for each segment can be calculated based on the actual bidding information of DR users within each segment. In fact, the calculation can be simplified by using the equivalent segment. The number of total segments has no effect on the computation results.

4.2. Initial Solution Estimate

In order to solve the problem of minimizing the objective function TCA, HDSM must generate an initial solution and perform a series of variable steps in solutions to search in the direction that yields the maximum cost reduction. Since an appropriate initial solution can improve the convergence properties of the subsequent search procedure, this paper designs the procedure to obtain the initial solutions as follows:
Step 1: 
Allocate a portion of the load to the minimum generation level of units in each area.
Step 2: 
Dispatch load demand in sequence according to the average cost of generation for all units. The units with lower average costs have priority to supply until the system load demand is met.
Step 3: 
While maintaining the generation level of the units, optimize the dispatch of multi-area spinning reserve using the DQD method introduced in Section 4.3. If the system violates constraint conditions, evaluate the penalty costs PC1 and PC2.
Step 4: 
Calculate the initial dispatch cost, which includes the generation cost of thermal power units, bidding costs of DR units for power reduction and ancillary service, as well as the penalties.
In this way, the initial solutions for each area can be obtained based on the average bidding costs of each unit (including thermal units and DR units of energy generation).

4.3. Direct Search Procedure to Solve Multi-Area Power Generation Dispatch

Once an initial solution is determined, the technique of DSM can explore the optimal solutions that minimize the total dispatch cost (TCA). The primary feature of the direct search procedure is that, at each step during the searching process, only a pair of units are selected for modification, effectively controlling additional constraint conditions. These constraints include regional power supply–demand balance, generation limits for units, and coupling relationships between the generation level of thermal units and their reserve capacity, all of which can be handled through the direct search procedure. The calculation steps are further explained as follows:
Step 1: 
Without violating the power generation limits of the units, the incremental costs (ICi and ICa) and the decremental costs (DCi and DCa) for each unit can be calculated when there is an increment or decrement for the adjustment of SP power generation, as shown in Equations (37) to (40).
Incremental cost of thermal units : I C i = F i ( P i + S P ) F i ( P i ) S P    i = 1 , 2 , , N T
Incremental cost of DR units :   I C a = F D B a ( P D B a + S P ) F D B a ( P D B a ) S P    a N , C , S
              Decremental   cos t   of   thermal   units : D C i = F i ( P i ) F i ( P i S P ) S P    i = 1 , 2 , , N T
        Decremental cost of DR units :   D C a = F D B a ( P D B a ) F D B a ( P D B a S P ) S P    a N , C , S
S u b j e c t   t o                                                                         P i + S P P i max ,   P i S P P i min    i = 1 , 2 , , N T
P D B a + S P P D B a , max ,   P D B a S P 0    a N , C , S
Step 2: 
All the pairs of units are examined to check if there is any improvement. If there is no improvement, then stop; otherwise, go to step 3.
Step 3: 
A pair of units are chosen to perform adjustments to reach the maximum cost reduction. That is, a unit x with the minimum incremental cost ICx is chosen to increase its output by the specific SP adjustment. Simultaneously, a unit y (where xy) with the maximum decremental cost DCy is chosen to reduce its output by the specific SP adjustment. In this way, the net power balance is satisfied and the dispatch cost can be reduced. It should be noted that all units stay unchanged except x and y units. Subsequently, the DQD procedure is then proceeded to determine the optimal allocation of spinning reserve and satisfy the spinning reserve in each area.
Step 4: 
The chosen x, y pair will adjust their output by the predefined step size SP, if it does not violate power generation limits. In this process, only the incremental cost for unit x and the decremental cost for unit y will be recalculated.
Step 5: 
Go to step 2.

4.4. DQD to Solve Multi-Area Spinning Reserve Dispatch

In this study, the dispatch of spinning reserve in areas is determined by DQD, which is proceeded after a preliminary power generation dispatch is obtained by DSM. When thermal units have sufficient capability to provide spinning reserve, thermal units, which are owned by the Taipower company, will be utilized first because the cost of the reserve capacity of the thermal units can be almost negligible. However, when the reserve capacity requirement cannot be satisfied, the system may either change the dispatch pattern of the thermal units, or purchase from the ancillary service bidding platform to meet the demand for spinning reserve in the areas. In other words, once the power generation dispatch is determined, the insufficient reserve capacity can be optimized through the DQD method to minimize the purchasing cost of the spinning reserve. As a result, when it comes to purchasing the ancillary services of the system, it is not only about selecting a DR user for spinning reserve with lower quote in each area, but also considering the capacity of transmission between areas. The detailed calculation steps of DQD are given as follows:
Step 1: 
Obtain the available capacity of spinning reserve that thermal units are able to provide.
Step 2: 
Initialize the purchase of spinning reserve from ancillary services market.
Step 3: 
The spinning reserve demand in each area can be satisfied by adding up the spinning reserve of that area itself and the spinning reserve that other areas can provide without violating inter-regional flow constraints.
Step 4: 
If the requirement for spinning reserve is satisfied in each area?
Yes, go to step 7.
Otherwise, continue to Step 5.
Step 5: 
If there is a congested area?
If there is no congestion, the system selects the DR user of ancillary service with the lowest bid for fulfilling the system reserve capacity. In addition, it takes the essential factors into consideration, including the bidding quantity of the DR user, the availability of inter-regional transmission capacity, and the demands for reserve capacity in that area to determine the actual purchase quantity of the DR user for ancillary service as given in (43)–(45).
A = min { B S k a , max ,   P l max P l a c t ,   S R D S R a c t a }   ,   l C N , S C , a N , C , S
B S k a   =   A ,   i f   B S k a , min     A     B S k a , max
B S k a   =   0   ,   i f   0   <   A   <   B S k a , min
If congestion occurs, the congested area allocates the required spinning reserve capacity to the DR user of ancillary service based on their bidding prices from low to high until the reserve capacity demand is satisfied.
Step 6: 
Back to Step 3.
Step 7: 
Calculate the purchase cost of reserve capacity and check the reserve capacity requirements in each area as well as the inter-regional flow constraints. If any violation of the constraints occurs, impose a penalty cost of PC1 and PC2.
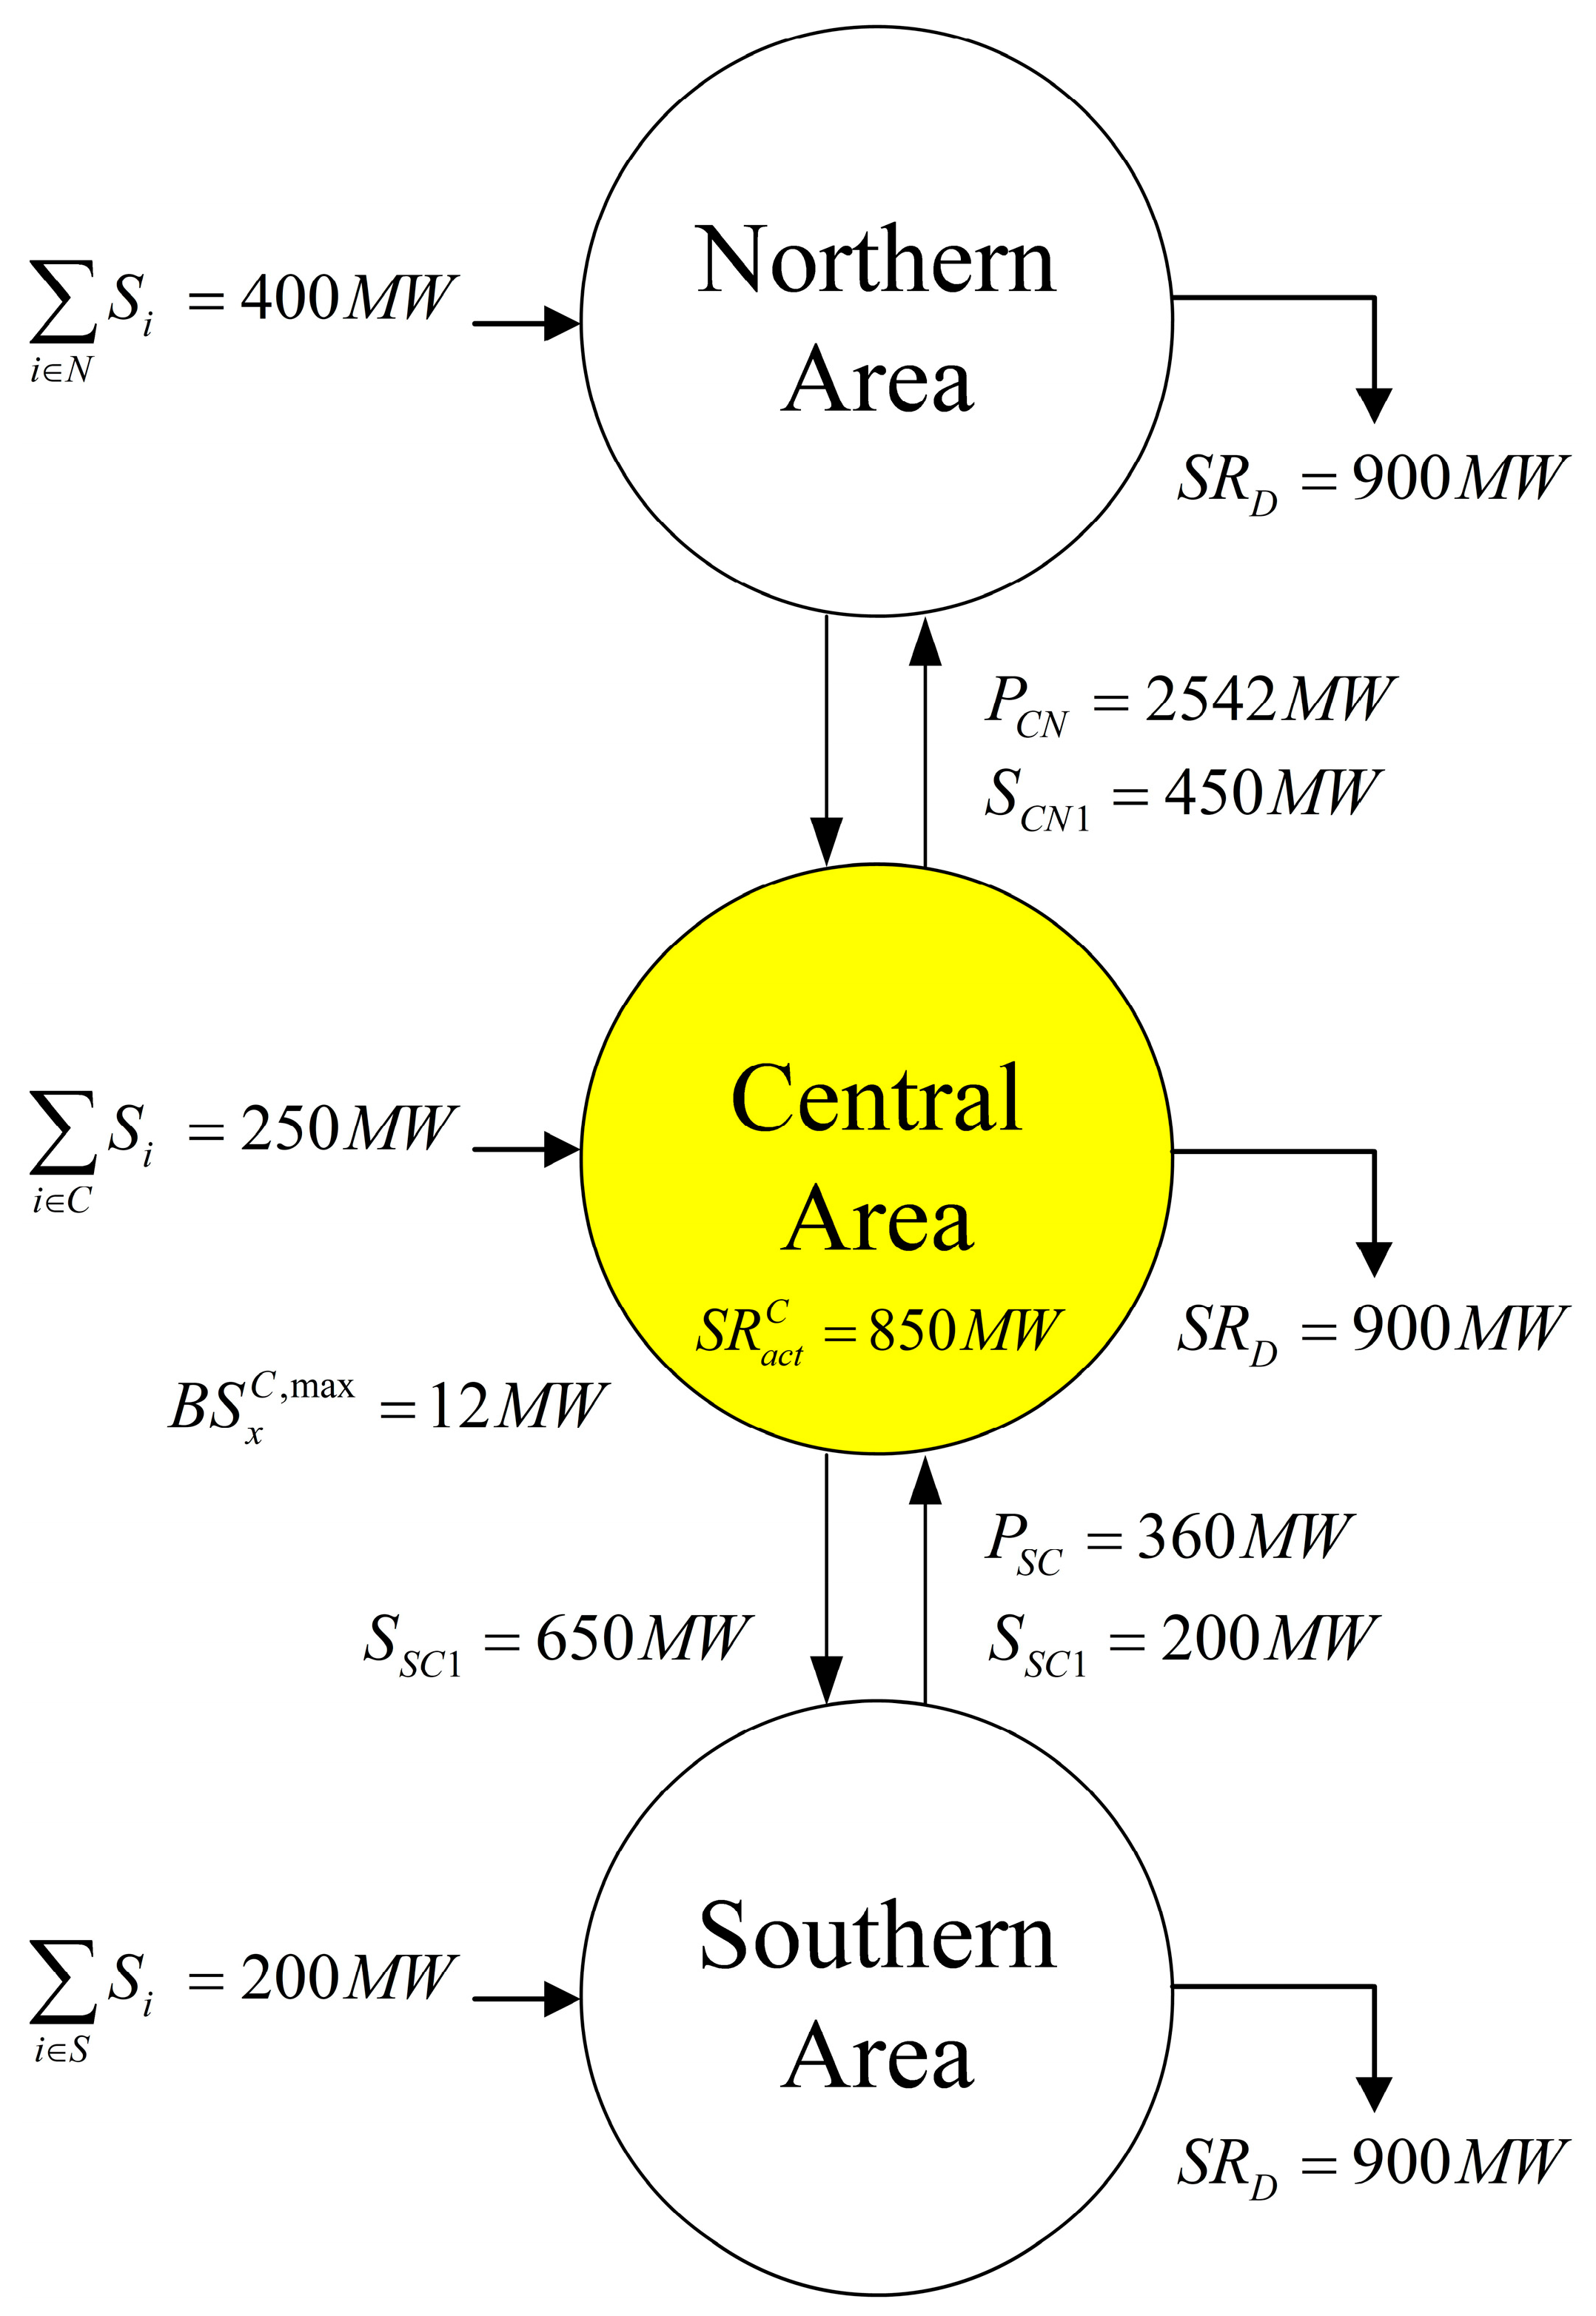
An example of the dispatch result by DQD is explained in Figure 8. The maximum power flow capacity of the transmission line is 3000 MW. Firstly, the DR user with the lowest quote for spinning reserve is selected from the three areas. Assume that this user is from the central area, denoted as x, and its bid quantity is 12 MW, i.e., B S x C , max = 12     MW . Next, consider the supply and demand situation for spinning reserve capacity in the central area, where the demand is S R D = 900     MW and the supply is S R a c t C = 850     MW . Therefore, there is a shortage of 50 MW in the central area. Subsequently, the available capacity for power flow between areas is assessed. Although there is a surplus of 2350 MW (3000 MW–650 MW) from the central area to the southern area, there is only 8 MW available from the central area to the northern area due to congestion between areas. Finally, the DQD would determine only 8 MW purchased from the DR user x in the central area, as the lower price reserve capacity in the central area cannot be shared with the northern area.

4.5. Determination of Optimal Load Reduction and Optimal Spinning Reserve

Since DR users in the energy market (or in the ancillary services market) are numerous and have limited capability for load reduction, they are typically grouped by aggregators for the bidding. The power company then ranks the equivalent DR users in each area based on the bidding prices, establishing the equivalent DR units for that area. To ensure fair competition among participants, these equivalent DR units must participate in the day-ahead market and compete with the thermal units for scheduling and ED. The impacts of tie-line congestion and area spinning reserve requirements must be consistently reflected in the marginal cost in each area. When transmission capacity and area spinning reserves are not constrained, all generation units, except those operating at their upper or lower generation limits, will operate at the same incremental cost. However, in areas connected by congested tie-lines, differing area marginal costs may arise, but units within each area will maintain the same incremental cost unless constrained by their generation limits. The determination of whether a DR user can win the bid is derived from the ED. When the bidding price of a DR user is lower than the marginal price of the existing thermal power units in the group, it can be considered as the winner of the bid. The proposed HDSM for the multi-area bidding platform can determine the optimal bidding results for equivalent DR units in each area. Furthermore, based on the marginal prices in each area, it can further decide the actual quantities of load reduction for DR users. Simultaneously, considering the supply and demand situation for spinning reserve capacity in each area, it can also determine the optimal bidding results of the DR unit for ancillary service. The proposed algorithm is able to assist the current DB framework in both the energy market and ancillary services market to obtain the optimal load reduction ( P D B , a ) and optimal spinning reserve ( S D B , a ) for the demand-side management units. The objective of area marginal cost is to adjust energy costs to reflect their network properties of Taiwan power system and give correct signals or provide incentives for DR users to avoid undesirable heavy flows among the three areas.

5. Simulation Results and Case Study

In order to demonstrate the feasibility of the multi-area DB platform and the dispatch strategy proposed in this paper, simulations have been carried out with different numbers of thermal units in comparisons. For simplicity, the fuel cost function for each thermal unit in the study has been approximately represented by a quadratic function. The parameter selection in HDSM will not affect the optimal solution when the generator incremental cost curves are monotonically increasing. However, the HDSM with large SP1 and small RF is usually commended to make the search effective. The parameters of HDSM are selected as SP1 = 80 MW, RF = 2, PF = 105, and the convergence criteria is 0.1 MW. The dispatch strategy developed for this study is written in FORTRAN and simulations were carried out on a personal computer (ASUS X512F) with an Intel(R) Core(TM) i5-10210 CPU @ 1.6~4.2 GHz environment. The analysis of case study results is now explained as follows.

5.1. Case Study 1: A System with Four Thermal Units

To validate the feasibility and the effectiveness of the proposed simulation platform and HDSM dispatch algorithm, a scenario of four thermal units is first discussed. Meanwhile, the ancillary service bidding platform is neglected to focus on analyzing the effect of load reductions by DR users on the results of power dispatch. In Case Study 1, the system load demand and requirement for spinning reserve are 1200 MW and 150 MW, respectively. The thermal unit data are presented in Table 2 [37]. It is assumed that the maximum reserve capacity that the thermal unit can provide is 10% of its rated output. On the other hand, it is assumed that there are 15 DR users participating in the bidding platform, with their quotes and availability of load reduction presented in Table 3. They are grouped into six equivalent sections based on their bidding price and formed as a DR unit to compete with the thermal units in the energy market.
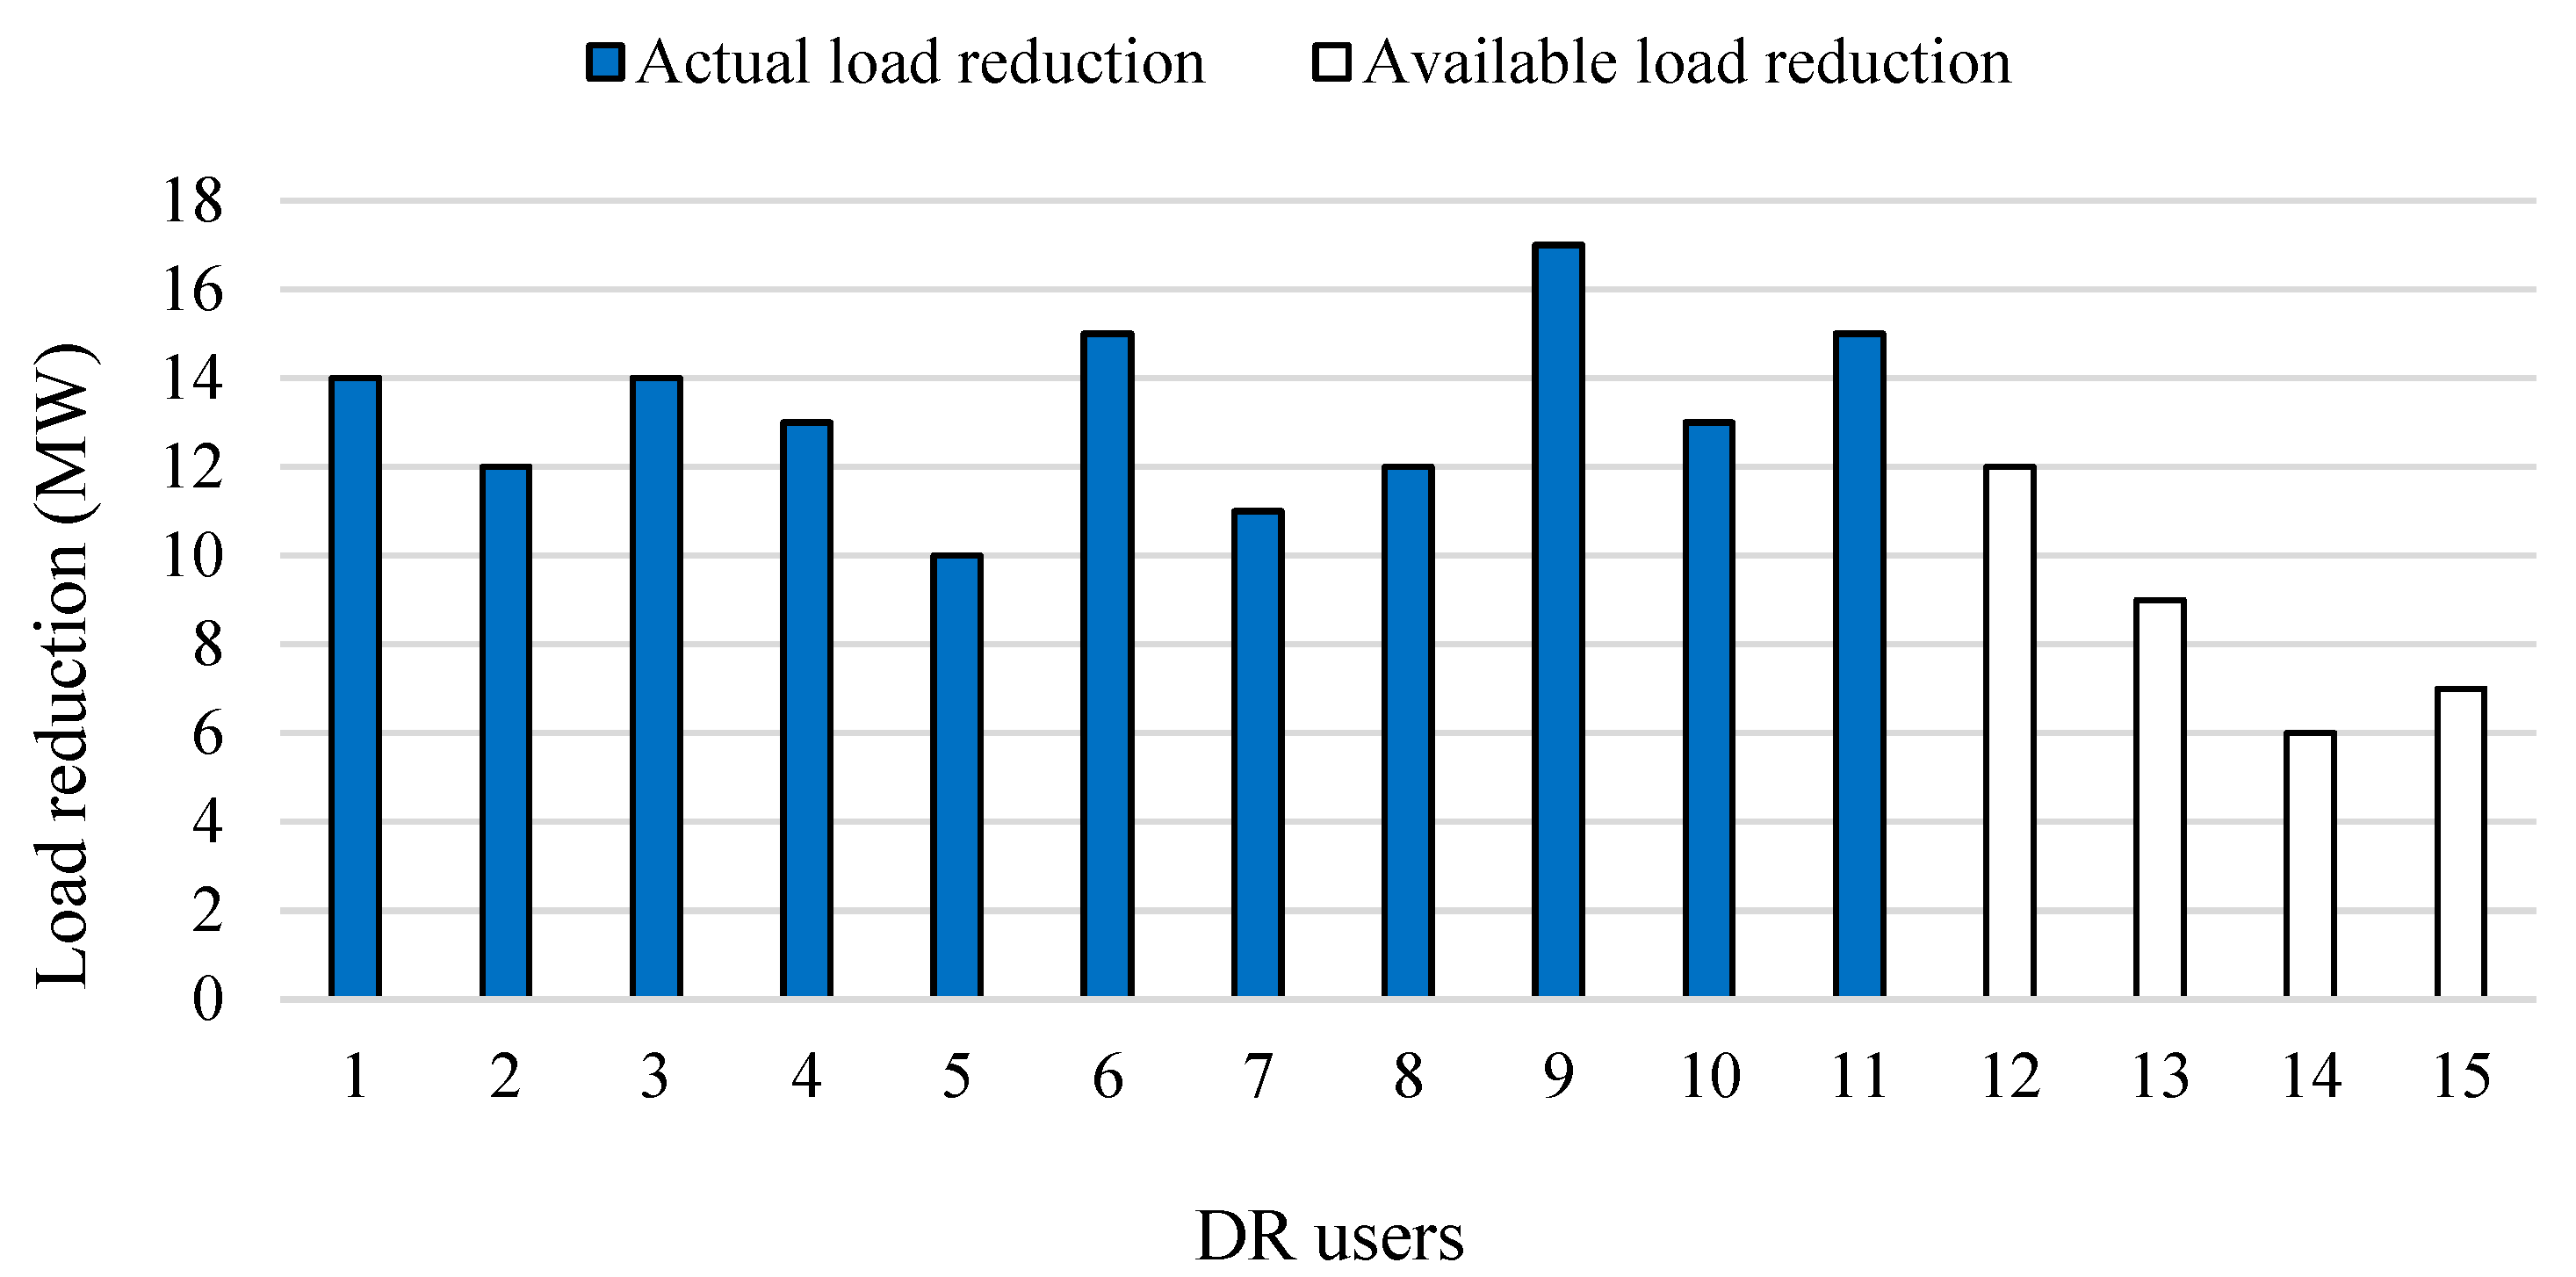
The purpose of Case Study 1 is to investigate the impacts of the participation of DR users on the power dispatch. Table 4 illustrates a comparison of the dispatch results with and without the participation of DR users. In Example 1.1, when the system does not include DR users, the dispatch cost is approximately USD 11,310.29, with a system marginal price as high as USD 9.20 per MW. On the contrary, Example 1.2 shows that the participation of DR users is able to reduce the system’s dispatch cost to USD 11,142.47. The system can save approximately USD 167.82 (USD 11,310.29–USD 11,142.47) in generation costs due to the participation of DR users in bidding in the energy market. Additionally, the system marginal price decreases to USD 8.99 per MW, which means that all DR users bidding below USD 8.99 are bid winners who will perform corresponding load reduction. Namely, the optimal capacity for the DR unit is 146 MW, with users numbered from #1 to #11 winning the bids. The actual load reduction by DR users can be referred to in Figure 9. The detailed allocation of power dispatch and spinning reserve capacity for thermal units are given in Table 5. Table 6 presents a convergence history of the proposed HDSM, including iteration counts, variation steps, and the dispatch costs for Example 1.2. This table demonstrates that the proposed method exhibits good convergence properties, and the optimum result can be obtained in short execution times below 0.1 s.

5.2. Case Study 2: A System of Two Areas with Four Thermal Units

Followed by Section 5.1, Case Study 2 considers two areas with four identical thermal units. The overview of the Case Study 2 is given in Table 7, where thermal unit 1 and 2 are located at Area A and thermal unit 3 and 4 are located at Area B. The maximum capacity of the transmission line for power flow is 300 MW. The system load demand and requirement for spinning reserve are 1600 MW and 150 MW, respectively. Area A accounts for 70% of the total load demand while Area B accounts for 30% of the total load demand, revealing an unbalanced situation of demand and supply in the areas. To solve the issues, multi-area demand–thermal coordination dispatch is investigated, with the energy bidding platform and the ancillary service bidding platform taken into account. The quotes and availability of DR users participating in the energy bidding platform are given in Table 3. The quotes and availability of DR users participating in the ancillary service bidding platform are presented in Table 8. It is assumed that Area A and Area B share the same bidding data of DR users, as given in Table 3 and Table 8.
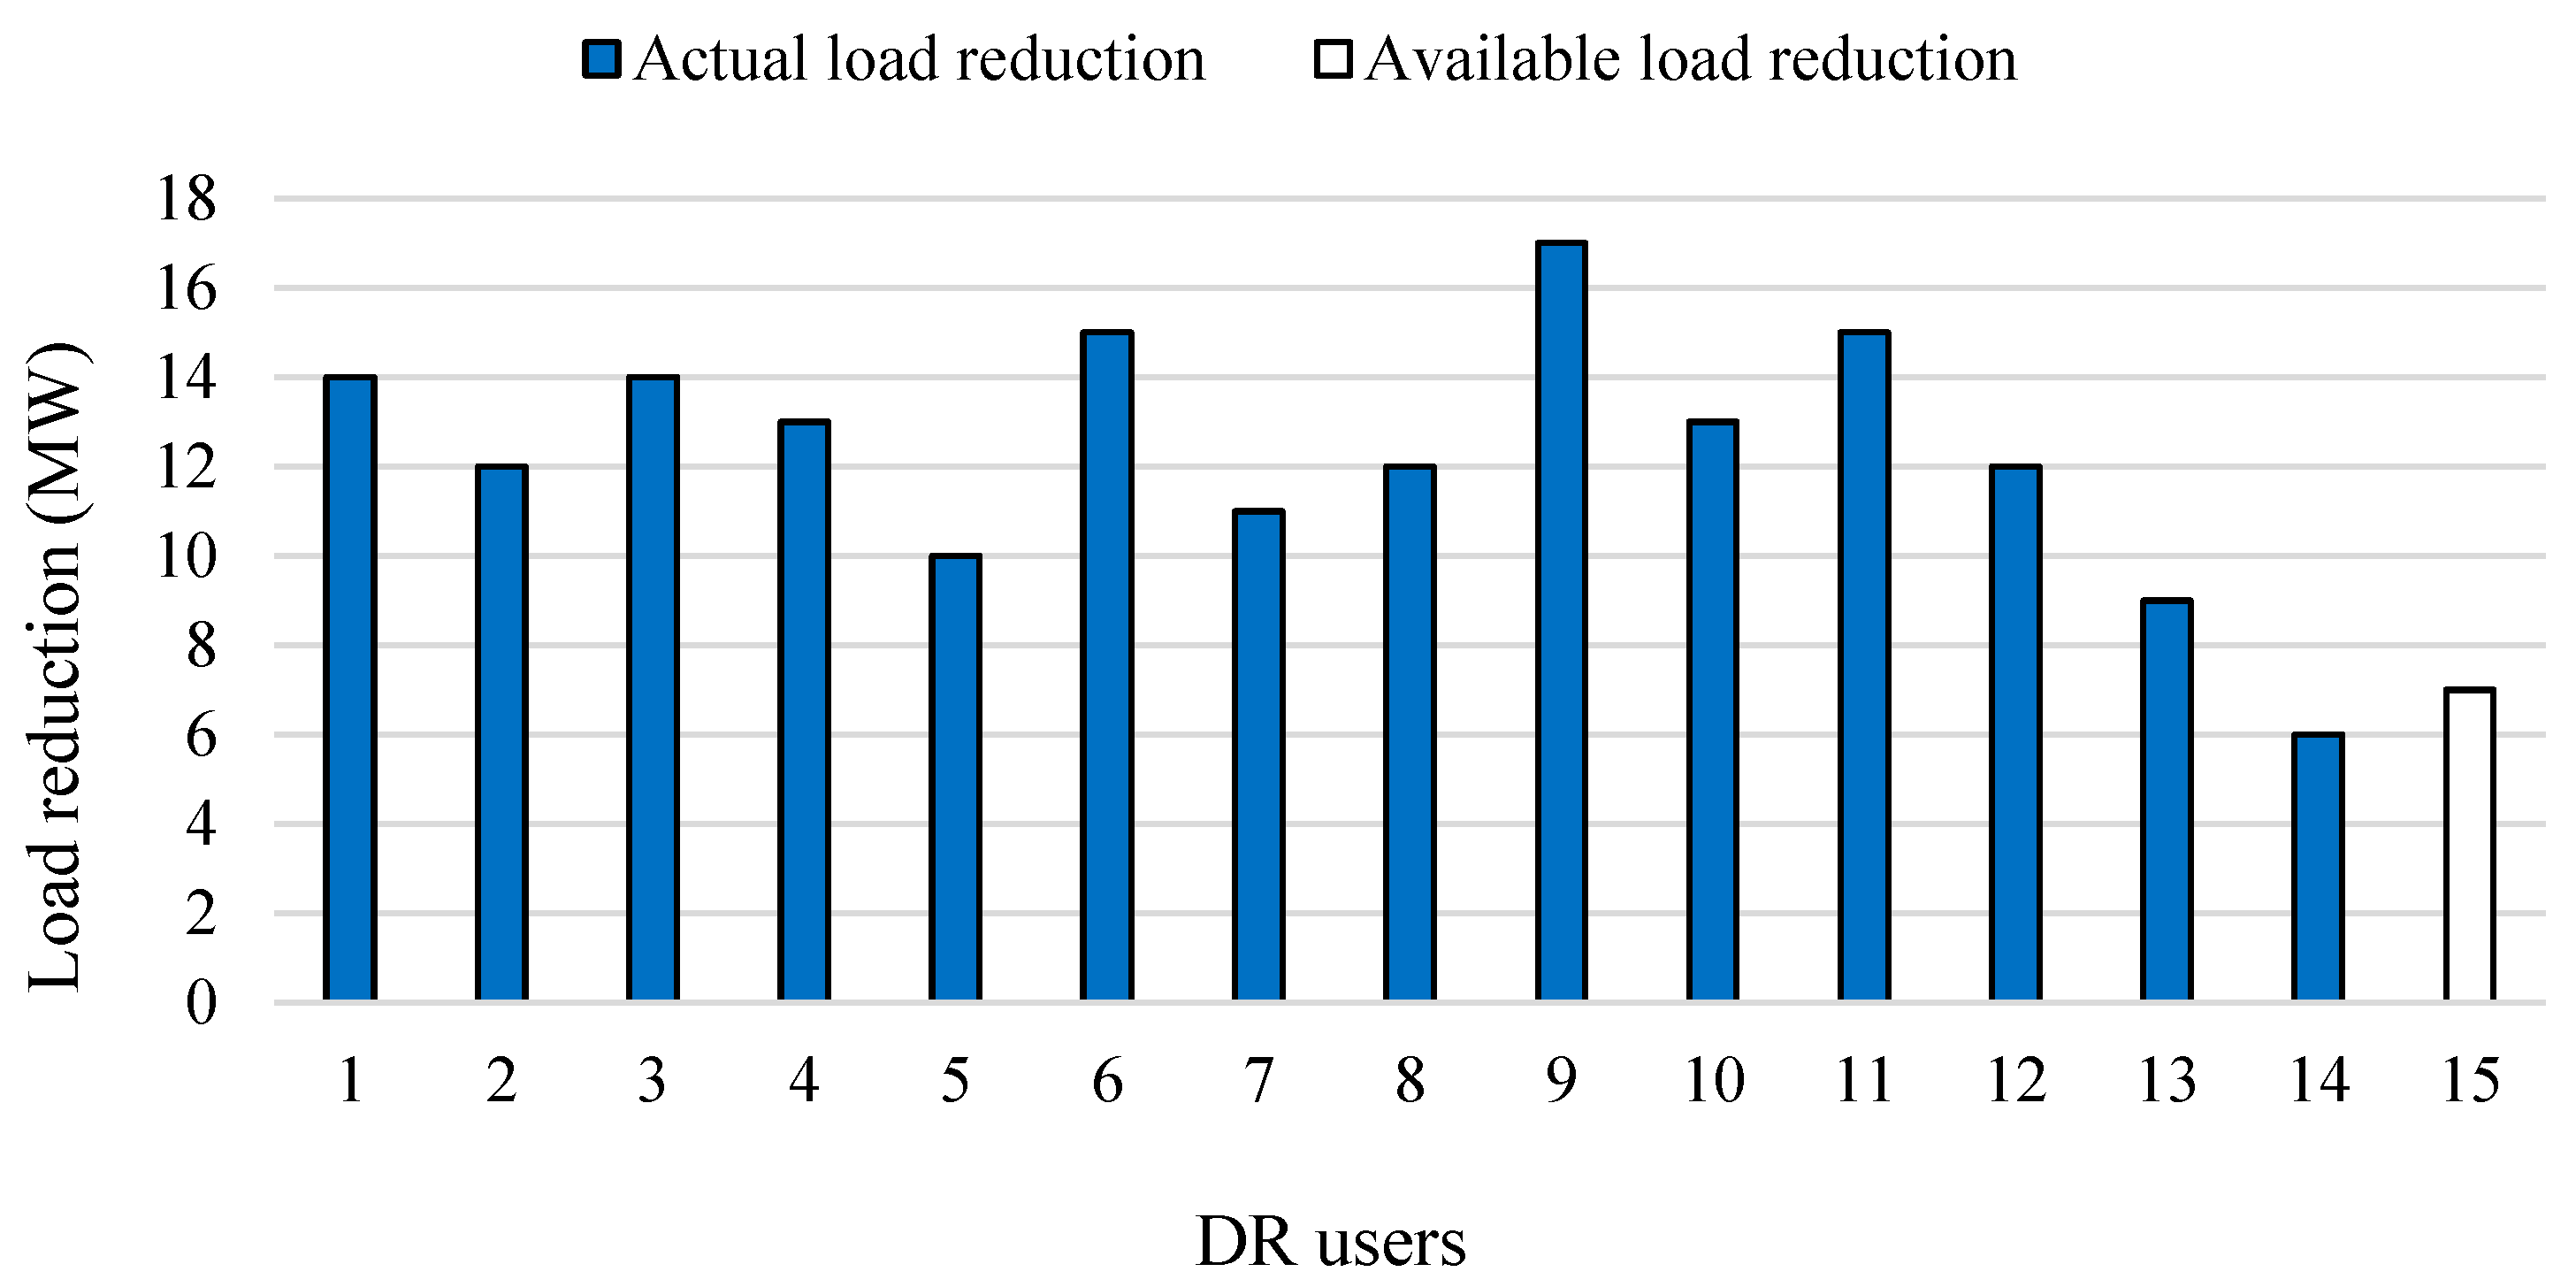
The purpose of Case Study 2 is to investigate the impacts of a transmission constraint on the power dispatch. Table 9 illustrates a comparison of the dispatch results with and without the consideration of the power transmission constraint. The minimum power reduction and the minimum spinning reserve capability for DR users are both assumed to be 1 MW. In Example 2.1, when the system neglects power transmission constraint, each area will have the same marginal cost (USD 9.31/MWh). The optimal load reduction for the DR unit in each area is also the same (i.e., 167 MW), and the bid winners are numbered #1 to #13 DR users. However, when the system considers a 300 MW power transmission constraint, as demonstrated in Example 2.2, congestion will occur between areas, leading to a higher marginal cost in Area A (USD 9.55/MWh) and a 173 MW load reduction from DR unit. In contrast, Area B requires only 142.53 MW of load reduction with a lower marginal cost of USD 8.85/MWh. Hence, Area A and Area B show different load reduction results for DR users, as shown in Figure 10 and Figure 11.
Table 9 provides further insights into the dispatch of spinning reserve in each area. When the system ignores power transmission constraints in Example 2.1, thermal units at Area A provide 80 MW of spinning reserve capacity, while thermal units at Area B provide 59.2 MW. The utility company must purchase additional 10.8 MW (from congested Area A) from the ancillary service bidding platform to meet the reserve capacity requirements (150 MW) for each area. However, when the system considers power transmission constraints, as demonstrated in Example 2.2, in order to meet the reserve capacity requirements in Area A (150 MW), the power flow from Area B to Area A is reduced to 260 MW to allow for the transmission of 40 MW of spinning reserve capacity. Simultaneously, thermal units in Area A must adjust their generation to adapt to the decrease in power transmitted from Area B. The utility must also purchase 30 MW (from Area A) from the ancillary service bidding platform. As a result, in Example 2.2, congestion between areas results in an increase in generation costs of approximately USD 47.1/h. Table 10 presents a convergence history of the proposed HDSM, including iteration counts, variation steps, and the dispatch costs for Example 2.2. A penalty calculated by Equation (34), due to violation of power transmission constraint, can be observed at the beginning of the searching process. The time consumption of the search process is approximately 0.1 s. Moreover, since the cost of the thermal units in this study is modeled by a strictly increasing quadratic function, different selections of parameters, namely SP1 and RF, do not affect the dispatch results for the proposed HDSM. As shown in Table 11, the simulation results demonstrate the robustness.

5.3. Case Study 3: A System of Three Areas with 52 Thermal Units

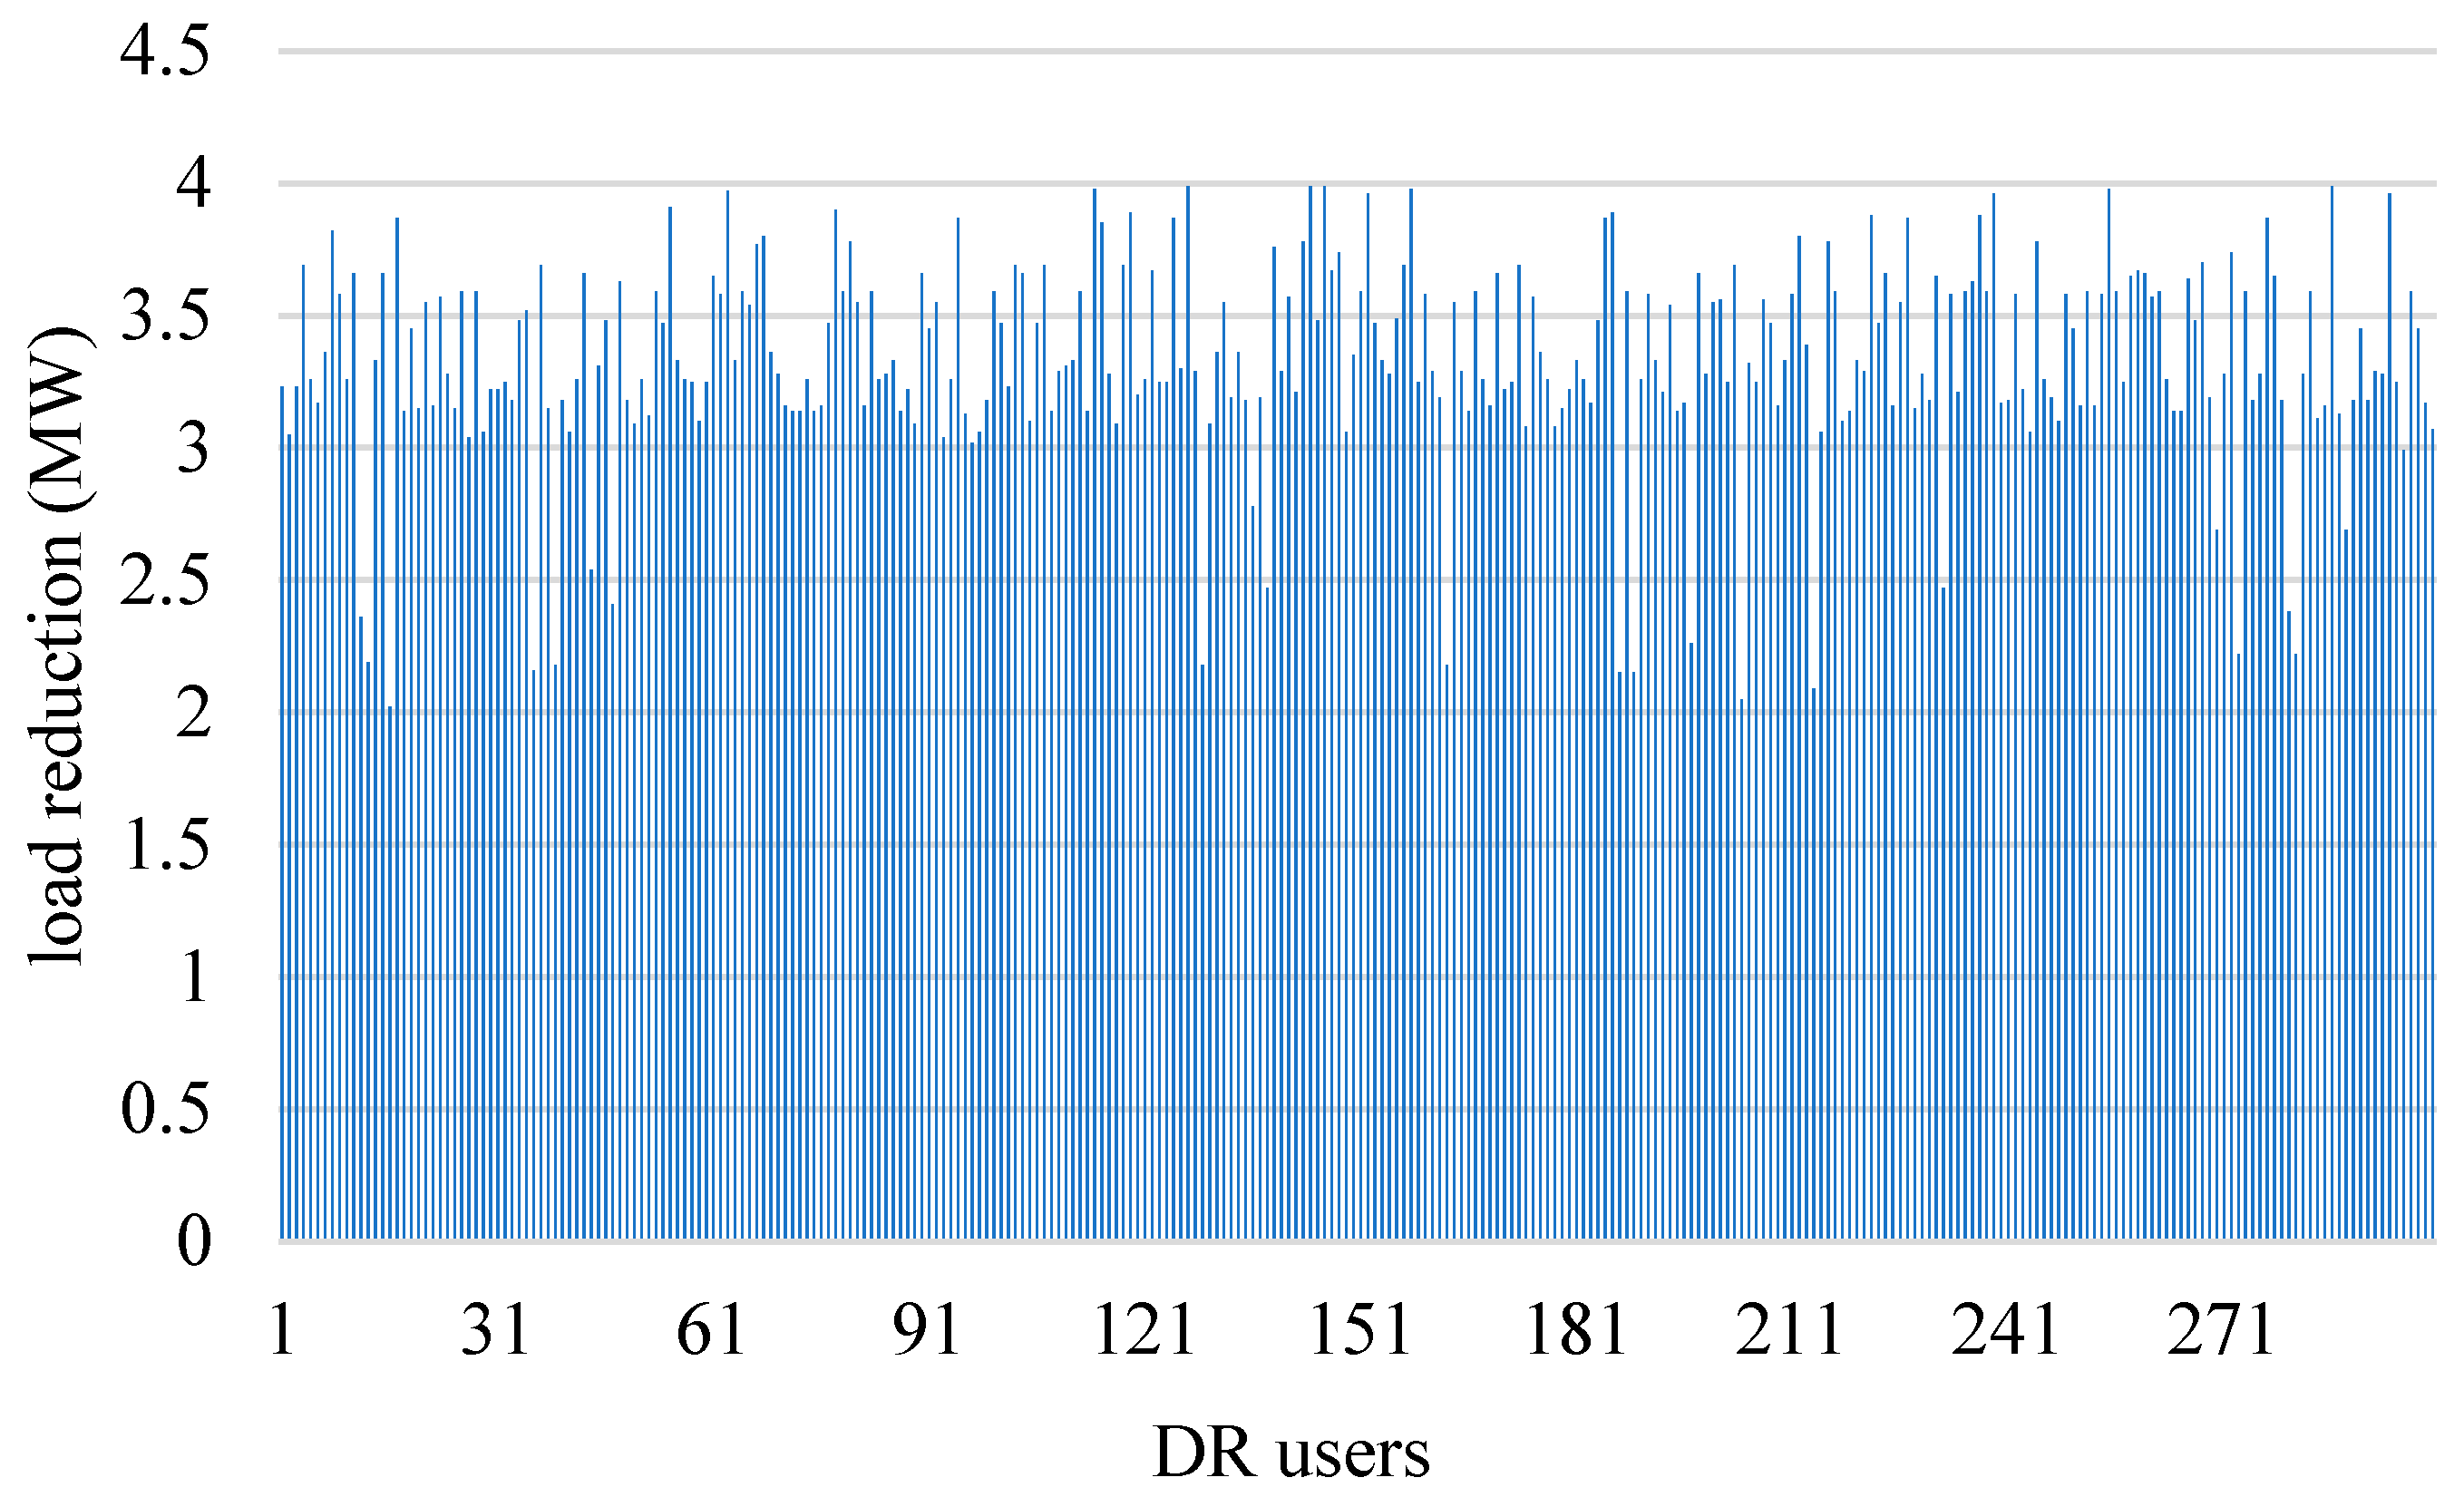
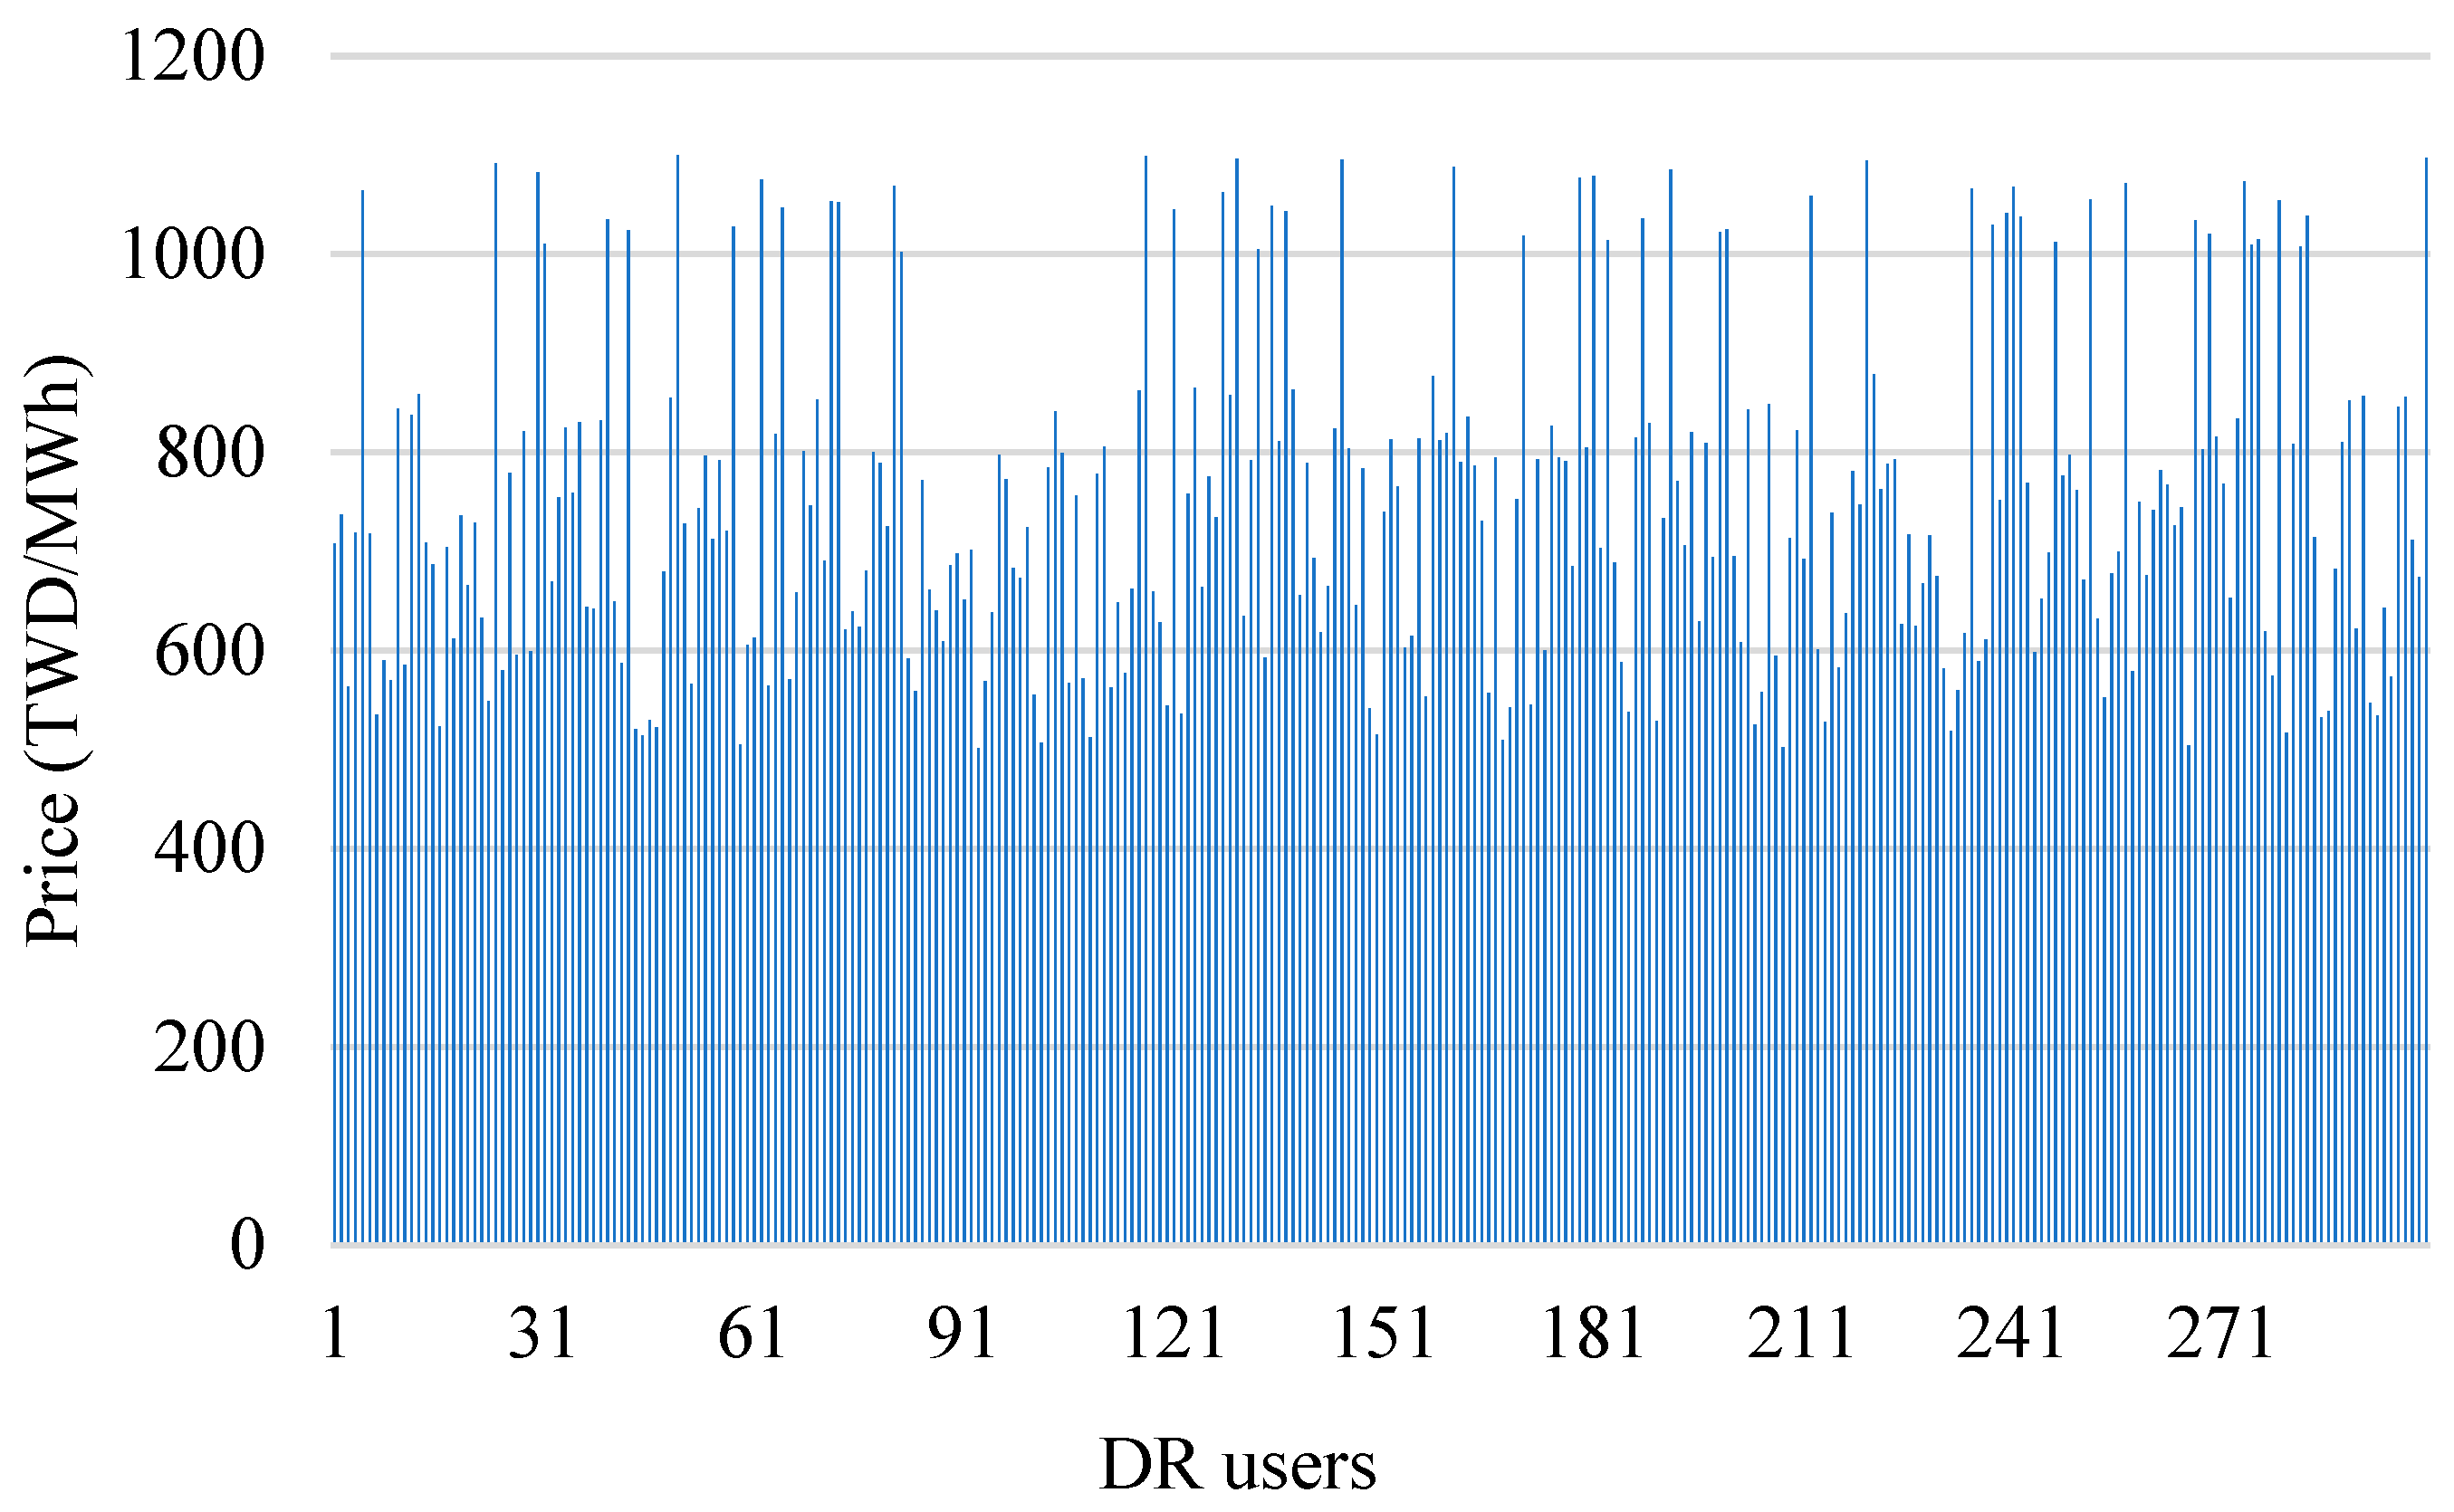
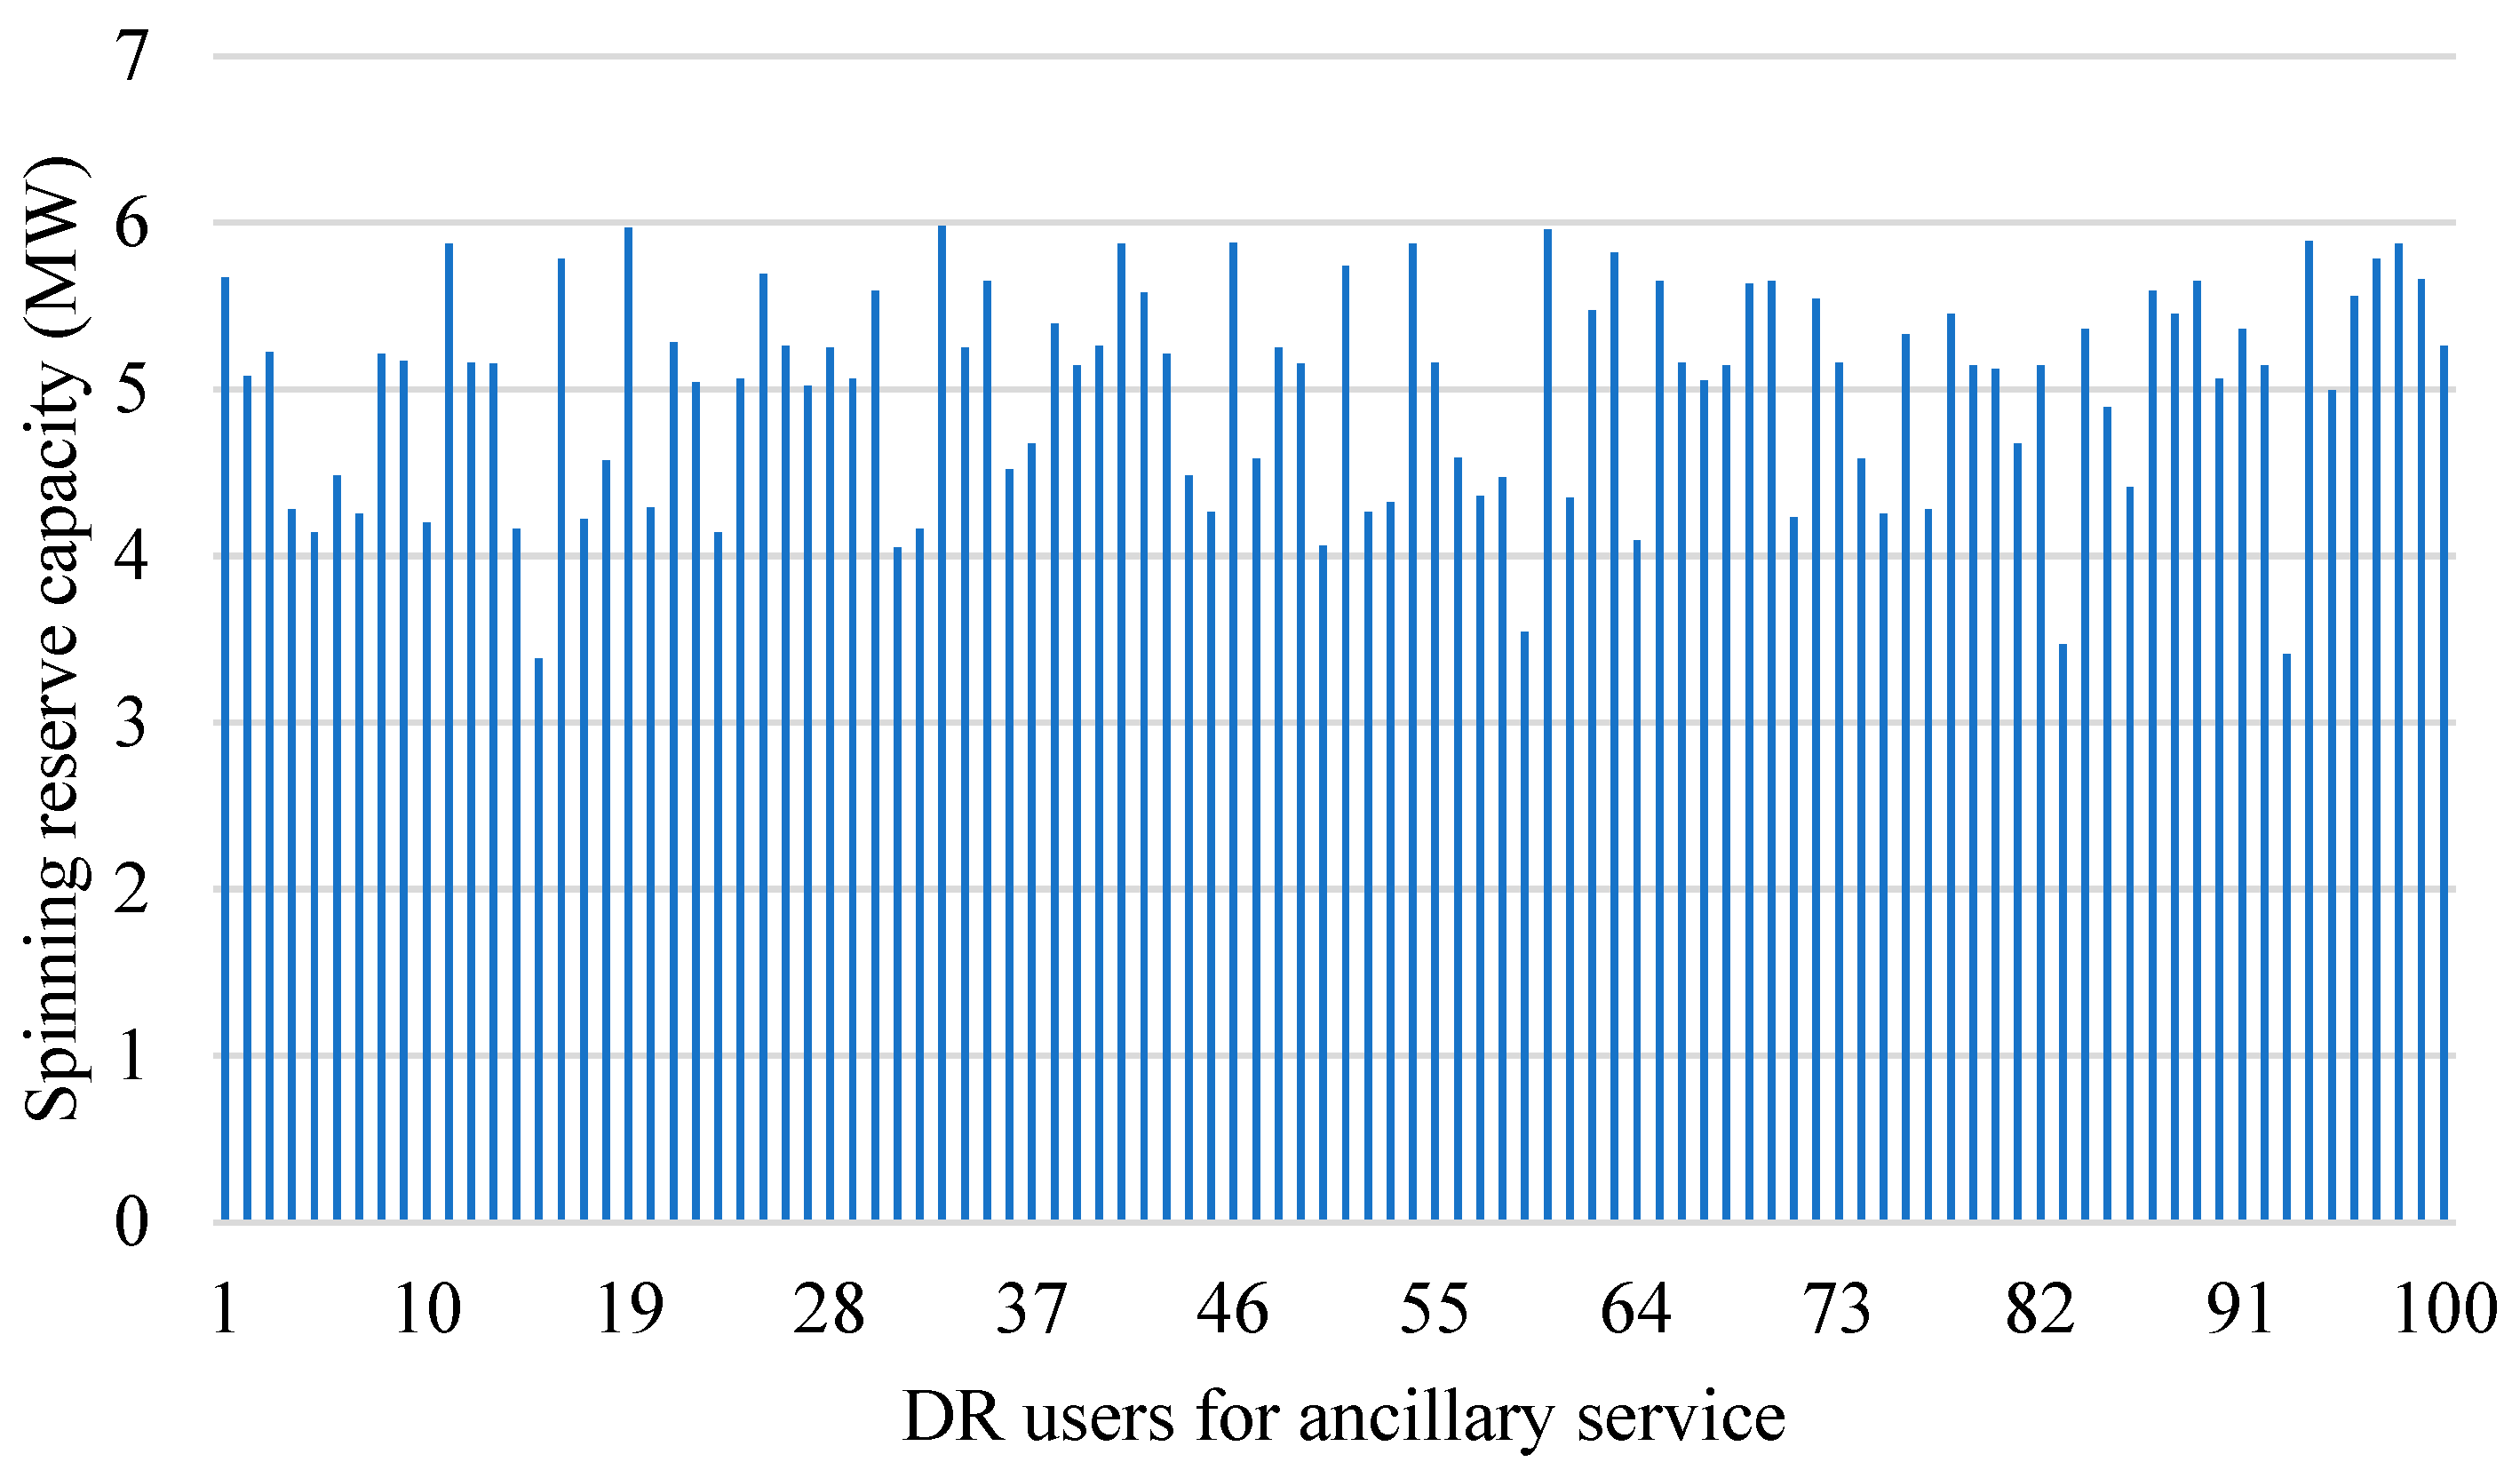
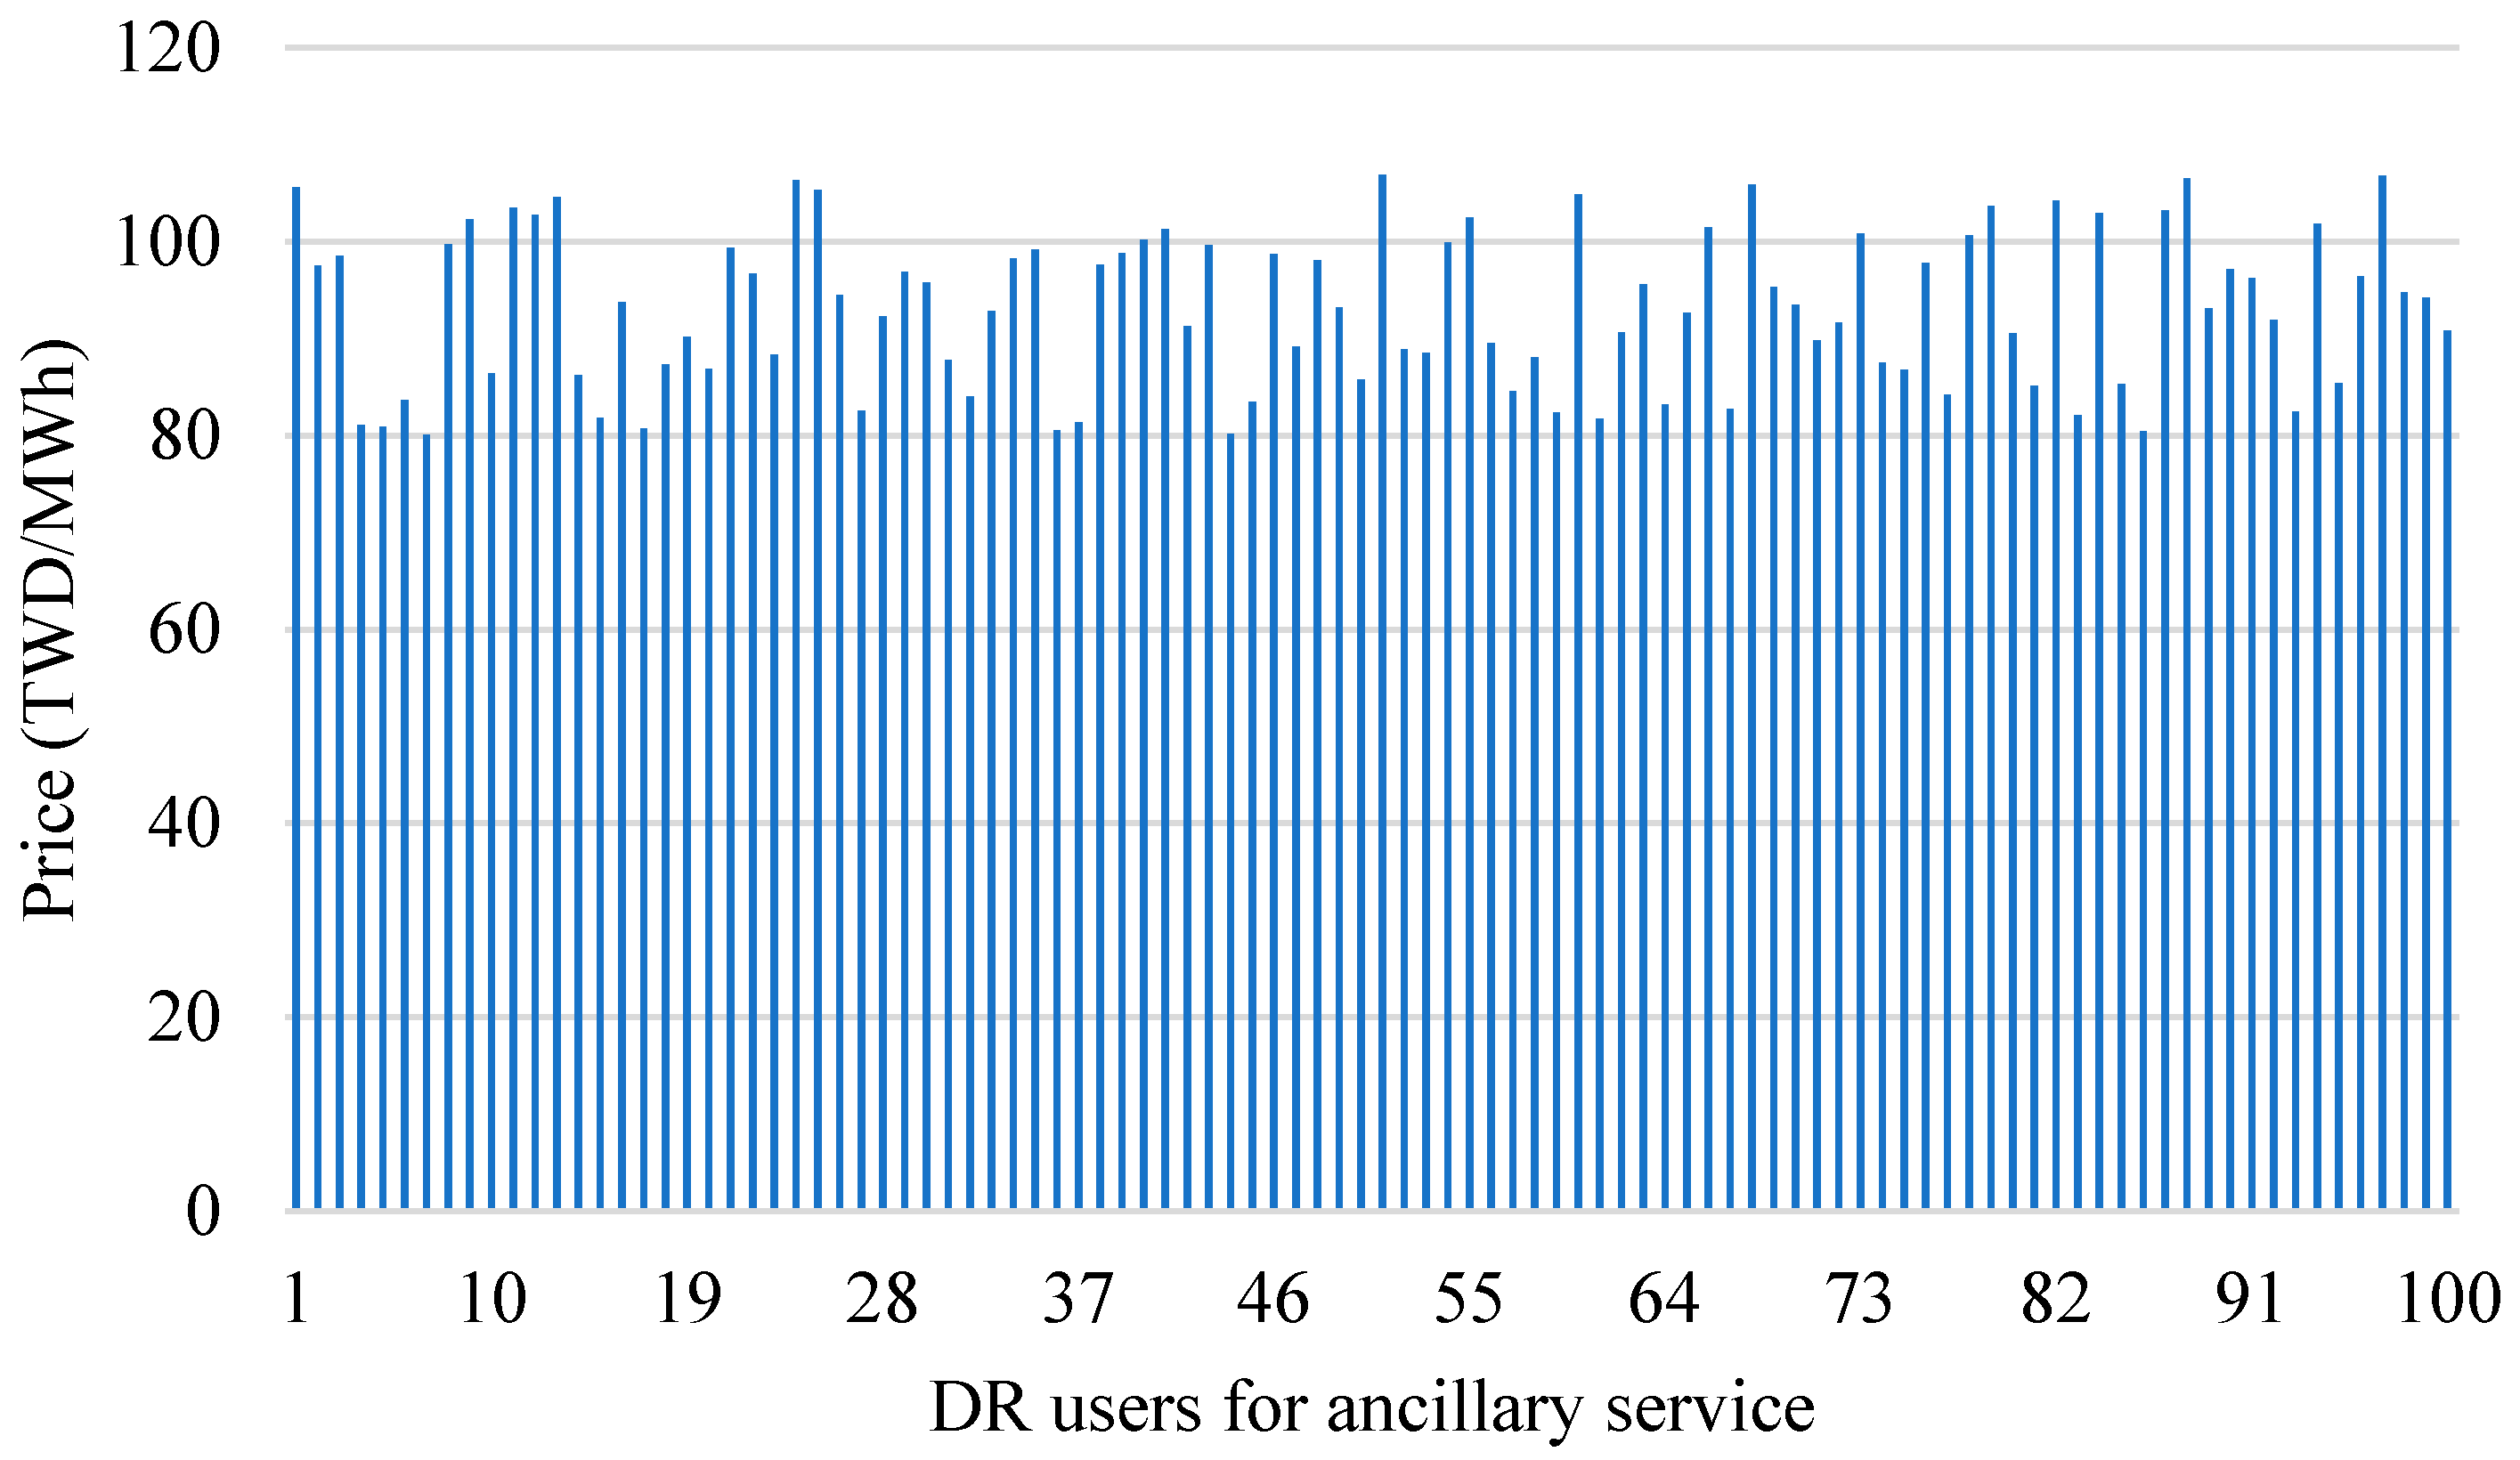
This section considers an actual power system of 52 thermal units in three areas of Taiwan [38]. For each area, the requirement for a spinning reserve is 900 MW in each area. The maximum capacity of the power transmission between areas is 3000 MW. To ensure the stability and robustness of the power system, the DB mechanism is utilized in the day-ahead market integrated with the energy bidding platform and the ancillary service bidding platform for DR users. In this case study, DR users for energy generation are grouped into 10 equivalent segments with similar bidding prices. There are 300 DR users participating in the energy bidding platform, with their capabilities and quotes visualized in Figure 12 and Figure 13. Additionally, there are 100 DR users participating in the ancillary service bidding platform, with corresponding capabilities and quotes presented in Figure 14 and Figure 15. For each individual area, it is assumed the number of DB users, the reduction capability, and the quoted prices are all the same for simplicity. Notably, the minimum power reduction and the minimum spinning reserve capability for DR users are both assumed to be 1 MW. The simulation results are explained as follows.
Table 12 presents the dispatch results when the system is in different scenarios for the load demand of 18,000 MW. Through Examples 3.1 and 3.2.1, the effects of DR units to the dispatch results can be examined. As shown in Example 3.1, when the system disregards DR units, the northern area experiences a significantly high marginal price of 1436 TWD/MWh. This high price reflects the congestion between areas and the demand for reserve capacity. The inclusion of DR units in Example 3.2.1 solves the congestion and the high power demand at northern area with the load reduction from the DR units of 828 MW, 609 MW, and 609 MW from the north, center, and south, respectively. In this way, the marginal price can be reduced significantly and save the dispatch cost of 798,850 TWD/h (TWD 12,360,076–TWD 11,561,226). Through Examples 3.2.1 and 3.2.2, the effects of the spinning reserve provided by DR units can be examined. It can be observed that both examples have the capability to supply the required spinning reserve capacity 900 MW for each area. However, the HDSM developed in this paper determines that purchasing reserve capacity for the northern area is more cost-effective, resulting in savings of approximately 44,026 TWD/h (TWD 11,605,232–TWD 11,561,226) in generation costs. This result may be attributed to the increased transmission capacity, allowing more cost-effective generation to be transmitted from the central area to the north. Consequently, the expensive generation from thermal units in the northern area can be reduced from 5663 MW in Example 3.2.2 to 5509 MW in Example 3.2.1. Example 3.3 explains that when the system ignores transmission capacity constraints, each area will have the same marginal cost (791 TWD/MWh) and load reduction amount (647 MW). In this example, congestion between areas would result in an increase in generation costs of approximately 21,085 TWD/h (TWD 11,561,226–TWD 11,540,141). This can be considered as the congestion cost of the transmission lines, and such information can provide a reference for planning the power system. Table 13 presents a convergence history for Example 3.2.1, including iteration counts, variation steps, and dispatch costs. The time consumption of the search process is approximately 2.59 s.
Table 14 discusses the impact of changes in different loads on dispatch results. In this example, due to the imbalance between electricity supply and demand in the northern area, a large amount of power flow is transferred from the central area to the northern area. From the simulation results, it is further observed that as the load increases, the congestion on inter-regional transmission lines also increases. The price differences between areas become more significant, leading to a greater chance of winning the bidding for DR users in the congested northern area. For example, when the load increases from 16,000 MW to 18,000 MW, under the same pricing conditions, the generation volume won by DR users in the northern area can increase from 260 MW to 828 MW, while the central and southern areas only see an increase from 260 MW to 609 MW. It is worth noting that when the load is at 16,000 MW, the system’s thermal units have sufficient capacity to meet the reserve capacity requirements of all areas, so there is no need to purchase from the ancillary service bidding platform. However, as the load increases (to 17,000 MW), the power transmitted from the central area to the north also increases, leading to a relative increase in the marginal price in the northern area (724 TWD/MW). The dispatch results indicate that it becomes more economical for the power company to purchase reserve capacity from the ancillary service bidding platform. However, during heavy load conditions (18,000 MW), constrained by the inter-regional transmission limit, the system’s thermal units change their allocations and purchase 279 MW of ancillary service reserve capacity from the northern area to meet its reserve capacity requirement (900 MW). Therefore, the multi-area bidding platform proposed in this paper can be used to address issues of congestion between areas and the distribution of reserve capacity in various areas, thus improving the economic efficiency and reliability of the day-ahead market system operation.

6. Conclusions

This paper focuses on enhancing the DB mechanism for the day-ahead energy market and ancillary services market. To comprehensively solve the ED problem, this paper integrates thermal units and DR units to satisfy the load demand and the requirement of reserve capacity simultaneously. The imbalance that occurs in multi-area systems is particularly considered, with the maximum power flow constraints being the same as the practical situation. Additionally, this paper introduces the HDSM technique coupled with DQD to optimize the multi-area demand–thermal coordination dispatch problem. The proposed method is able to minimize the overall costs, subject to the satisfaction of regional load and reserve capacity requirements, the upper and lower output limits of the thermal unit, the coupling restrictions of reserve capacity for the thermal unit, and the operational limitations of the DR units. The resulting allocation of generation and reserve capacity generated by the cooperation of thermal units and equivalent DR units is able to relieve congested areas or supply bottlenecks. This study could serve as a guide for system operators to design regulations for a DB mechanism and access the economic benefits.

Author Contributions

Conceptualization, Y.-S.C. and C.-L.C.; Methodology, Y.-S.C., Y.-Y.C., C.-T.T. and C.-L.C.; Software, Y.-Y.C.; Validation, Y.-S.C. and Y.-Y.C.; Formal analysis, C.-T.T. and C.-L.C.; Writing—original draft, Y.-S.C. and Y.-Y.C.; Writing—review & editing, C.-T.T. and C.-L.C.; Visualization, C.-T.T.; Supervision, Y.-S.C., Y.-Y.C. and C.-L.C. All authors have read and agreed to the published version of the manuscript.

Funding

This research was funded by the Ministry of Science and Technology, Taiwan, under grants MOST 109-2221-E-019-014-MY2.

Data Availability Statement

The original contributions presented in this study are included in the article. Further inquiries can be directed to the corresponding authors.

Conflicts of Interest

The authors declare no conflict of interest.

Abbreviations

T C total operating cost
N T number of thermal units in system
F i ( ) operation cost function of thermal unit i
i index for thermal units
P i energy generation of thermal unit i
α i , β i , γ i coefficients to calculate the fuel costs for the thermal unit i
F D B a ( ) energy bidding price function of DR unit for energy generation in area a
P D B a energy generation of DR unit in area a
B P q , j a load reduction in the jth user in segment qth of DR unit for energy generation in area a
C P q , j a bidding price of the jth user in segment qth of DR unit for energy generation in area a
N P q a the number of users in segment qth of DR unit for energy generation in area a
G D B a ( ) reserve bidding price function of DR unit for spinning reserve in area a
S D B a spinning reserve of DR unit in area a
B S k a reserve capacity of the kth user DR unit for spinning reserve in area a
C S k a bidding price of the kth user of DR unit for spinning reserve in area a
N S a total number users of DR unit for spinning reserve in area a
P D a load demand in area a
S R D spinning reserve requirements at each area
S i spinning reserve of thermal unit i
P i max upper generation limit of thermal unit i
P i min lower generation limit of thermal unit i
d % percentage of maximum unit capacity
S i max maximum spinning reserve contribution of thermal unit i
P D B a , max the maximum energy reduction in DR unit in area a
B P q , j a , max maximum of DR user for energy generation in area a
B P q , j a , min minimum of DR user for energy generation in area a
C P D B max the highest bidding price of DR users for energy generation
L p the number of the equivalent segment of DR unit for energy generation
S D B a , max the maximum reserve capacity of DR unit for spinning reserve in area a
B S k a , max maximum of DR user for spinning reserve in area a
B S k a , min minimum of DR user for spinning reserve in area a
C S D B a , max the highest bidding price of DR users for spinning reserve in area a
P C N , P C N max transfer power and flow limits from central area to northern area respectively
P S C , P S C max transfer power and flow limits from southern area to central area respectively
S C N 1 transfer spinning reserve from central area to northern area
S C N 2 transfer spinning reserve from northern area to central are
S S C 1 transfer spinning reserve from southern area to central area
S S C 2 transfer spinning reserve from central area to southern area
DBdemand bidding
DQDdynamic queuing dispatch
DSMdirect search method
REGSrenewable energy generation system
DERsdistributed energy resources
VPPvirtual power plant
DRdemand response
LAload aggregator
FISFuzzy Inference System
EDeconomic dispatch
MPCModel Predictive Control
MESsmulti-energy systems
CBLcustomer baseline load
HDSMHybrid Direct Search Method
SPstep size
RFreduced factor

References

  1. Chuang, Y.S.; Cheng, C.C.; Cheng, H.P. The current development of the energy storage industry in Taiwan: A snapshot. J. Energy Storage 2022, 53, 105117. [Google Scholar] [CrossRef]
  2. Zakaria, A.; Ismail, F.B.; Lipu, M.H.; Hannan, M.A. Uncertainty models for stochastic optimization in renewable energy applications. Renew. Energy 2020, 145, 1543–1571. [Google Scholar] [CrossRef]
  3. Tan, Z.; Ju, L.; Reed, B.; Rao, R.; Peng, D.; Li, H.; Pan, G. The optimization model for multi-type customers assisting wind power consumptive considering uncertainty and demand response based on robust stochastic theory. Energy Convers. Manag. 2015, 105, 1070–1081. [Google Scholar] [CrossRef]
  4. Li, Y.; Wang, C.; Li, G.; Chen, C. Optimal scheduling of integrated demand response-enabled integrated energy systems with uncertain renewable generations: A Stackelberg game approach. Energy Convers. Manag. 2021, 235, 113996. [Google Scholar] [CrossRef]
  5. Yu, S.; Fang, F.; Liu, Y.; Liu, J. Uncertainties of virtual power plant: Problems and countermeasures. Appl. Energy 2019, 239, 454–470. [Google Scholar] [CrossRef]
  6. Nosratabadi, S.M.; Hooshmand, R.A.; Gholipour, E. A comprehensive review on microgrid and virtual power plant concepts employed for distributed energy resources scheduling in power systems. Renew. Sustain. Energy Rev. 2017, 67, 341–363. [Google Scholar] [CrossRef]
  7. Riveros, J.Z.; Bruninx, K.; Poncelet, K.; D’haeseleer, W. Bidding strategies for virtual power plants considering CHPs and intermittent renewables. Energy Convers. Manag. 2015, 103, 408–418. [Google Scholar] [CrossRef]
  8. Abapour, S.; Mohammadi-Ivatloo, B.; Hagh, M.T. Robust bidding strategy for demand response aggregators in electricity market based on game theory. J. Clean. Prod. 2020, 243, 118393. [Google Scholar] [CrossRef]
  9. Wang, F.; Ge, X.; Li, K.; Mi, Z. Day-ahead market optimal bidding strategy and quantitative compensation mechanism design for load aggregator engaging demand response. IEEE Trans. Ind. Appl. 2019, 55, 5564–5573. [Google Scholar] [CrossRef]
  10. Lu, X.; Ge, X.; Li, K.; Wang, F.; Shen, H.; Tao, P.; Hu, J.; Lai, J.; Zhen, Z.; Shafie-khah, M.; et al. Optimal bidding strategy of demand response aggregator based on customers’ responsiveness behaviors modeling under different incentives. IEEE Trans. Ind. Appl. 2021, 57, 3329–3340. [Google Scholar] [CrossRef]
  11. Vahid-Ghavidel, M.; Javadi, M.S.; Santos, S.F.; Gough, M.; Mohammadi-Ivatloo, B.; Shafie-Khah, M.; Catalão, J.P. Novel hybrid stochastic-robust optimal trading strategy for a demand response aggregator in the wholesale electricity market. IEEE Trans. Ind. Appl. 2021, 57, 5488–5498. [Google Scholar] [CrossRef]
  12. Sumaiti, A.; Konda, S.R.; Panwar, L.; Gupta, V.; Kumar, R.; Panigrahi, B.K. Aggregated demand response scheduling in competitive market considering load behavior through fuzzy intelligence. IEEE Trans. Ind. Appl. 2020, 56, 4236–4247. [Google Scholar] [CrossRef]
  13. Long, Y.; Li, Y.; Wang, Y.; Cao, Y.; Jiang, L.; Zhou, Y.; Deng, Y.; Nakanishi, Y. Low-carbon economic dispatch considering integrated demand response and multistep carbon trading for multi-energy microgrid. Sci. Rep. 2022, 12, 6218. [Google Scholar] [CrossRef]
  14. Wang, L.; Jing, Z.X.; Zheng, J.H.; Wu, Q.H.; Wei, F. Decentralized optimization of coordinated electrical and thermal generations in hierarchical integrated energy systems considering competitive individuals. Energy 2018, 158, 607–622. [Google Scholar] [CrossRef]
  15. Marzbani, F.; Abdelfatah, A. Economic Dispatch Optimization Strategies and Problem Formulation: A Comprehensive Review. Energies 2024, 17, 550. [Google Scholar] [CrossRef]
  16. Nelson, J.R.; Johnson, N.G. Model predictive control of microgrids for real-time ancillary service market participation. Appl. Energy 2020, 269, 114963. [Google Scholar] [CrossRef]
  17. Vahid-Ghavidel, M.; Javadi, M.S.; Gough, M.; Santos, S.F.; Shafie-khah, M.; Catalão, J.P.S. Demand Response Programs in Multi-Energy Systems: A Review. Energies 2020, 13, 4332. [Google Scholar] [CrossRef]
  18. Liu, L.; Chen, X.; Li, D.; Liu, C.; Liu, D.; Li, G. Evaluation method for assessing the auxiliary service transaction mechanism in regional power markets. Glob. Energy Interconnect. 2023, 6, 238–252. [Google Scholar] [CrossRef]
  19. Wang, J.; Zhong, H.; Tang, W.; Rajagopal, R.; Xia, Q.; Kang, C.; Wang, Y. Optimal bidding strategy for microgrids in joint energy and ancillary service markets considering flexible ramping products. Appl. Energy 2017, 205, 294–303. [Google Scholar] [CrossRef]
  20. Das, S.; Basu, M. Day-ahead optimal bidding strategy of microgrid with demand response program considering uncertainties and outages of renewable energy resources. Energy 2020, 190, 116441. [Google Scholar] [CrossRef]
  21. Rezaei, N.; Pezhmani, Y.; Khazali, A. Economic-environmental risk-averse optimal heat and power energy management of a grid-connected multi microgrid system considering demand response and bidding strategy. Energy 2022, 240, 122844. [Google Scholar] [CrossRef]
  22. Nikpour, A.; Nateghi, A.; Shafie-Khah, M. Stochastic-risk based approach for microgrid participation in joint active, reactive, and ancillary services markets considering demand response. IEEE Open Access J. Power Energy 2022, 10, 2–13. [Google Scholar] [CrossRef]
  23. Nikpour, A.; Nateghi, A.; Shafie-khah, M.; Catalão, J.P. Day-ahead optimal bidding of microgrids considering uncertainties of price and renewable energy resources. Energy 2021, 227, 120476. [Google Scholar] [CrossRef]
  24. Naseri, A.; Fattaheian-Dehkordi, S.; Abbaspour, A.; Lehtonen, M. Day-Ahead Optimal Scheduling of Resources in a Distribution System in Joint Energy, Regulation and Ramp Markets. Int. Rev. Electr. Eng. 2023, 18, 1–14. [Google Scholar] [CrossRef]
  25. Wu, Y.; Shi, J.; Lim, G.J.; Fan, L.; Molavi, A. Optimal management of transactive distribution electricity markets with co-optimized bidirectional energy and ancillary service exchanges. IEEE Trans. Smart Grid 2020, 11, 4650–4661. [Google Scholar] [CrossRef]
  26. Taiwan Power Company. Demand Response Bidding Platform. Available online: https://dbp.taipower.com.tw/TaiPowerDBP/Portal/Login (accessed on 18 May 2025).
  27. Chen, C.L.; Chen, N. Direct search method for solving economic dispatch problem considering transmission capacity constraints. IEEE Trans. Power Syst. 2001, 16, 764–769. [Google Scholar] [CrossRef]
  28. Wong, K.P.; Fung, C.C. Simulated annealing based economic dispatch algorithm. In IEE Proceedings C Generation, Transmission and Distribution; IET Digital Library: Hertfordshire, UK, 1993; Volume 140, pp. 509–515. [Google Scholar]
  29. Walters, D.C.; Sheble, G.B. Genetic algorithm solution of economic dispatch with valve point loading. IEEE Trans. Power Syst. 1993, 8, 1325–1332. [Google Scholar] [CrossRef]
  30. Chaturvedi, K.T.; Pandit, M.; Srivastava, L. Self-organizing hierarchical particle swarm optimization for nonconvex economic dispatch. IEEE Trans. Power Syst. 2008, 23, 1079–1087. [Google Scholar] [CrossRef]
  31. Pradhan, M.; Roy, P.K.; Pal, T. Grey wolf optimization applied to economic load dispatch problems. Int. J. Electr. Power Energy Syst. 2016, 83, 325–334. [Google Scholar] [CrossRef]
  32. Taiwan Power Company. Demand Response Bidding Measures. Available online: https://dbp.taipower.com.tw/TaiPowerDBP/Portal/proj_data/%E9%9C%80%E9%87%8F%E7%AB%B6%E5%83%B9%E6%8E%AA%E6%96%BDDM.pdf (accessed on 1 November 2024).
  33. Taiwan Power Company. Ancillary Services Market. Available online: https://etp.taipower.com.tw (accessed on 18 May 2025).
  34. Chen, C.L.; Chen, Z.Y.; Lee, T.Y. Multi-area economic generation and reserve dispatch considering large-scale integration of wind power. Int. J. Electr. Power Energy Syst. 2014, 55, 171–178. [Google Scholar] [CrossRef]
  35. Wood, A.J.; Wollenberg, B.F.; Sheblé, G.B. Power Generation, Operation, and Control; John Wiley & Sons: Hoboken, NJ, USA, 2013. [Google Scholar]
  36. Chen, C.L. Non-convex economic dispatch: A direct search approach. Energy Convers. Manag. 2007, 48, 219–225. [Google Scholar] [CrossRef]
  37. Yalcinoz, T.; Short, M.J. Neural networks approach for solving economic dispatch problem with transmission capacity constraints. IEEE Trans. Power Syst. 1998, 13, 307–313. [Google Scholar] [CrossRef]
  38. Chen, C.L. Key issues of wind capacity integration in congested areas of the Taiwan power system. IET Renew. Power Gener. 2014, 8, 10–21. [Google Scholar] [CrossRef]
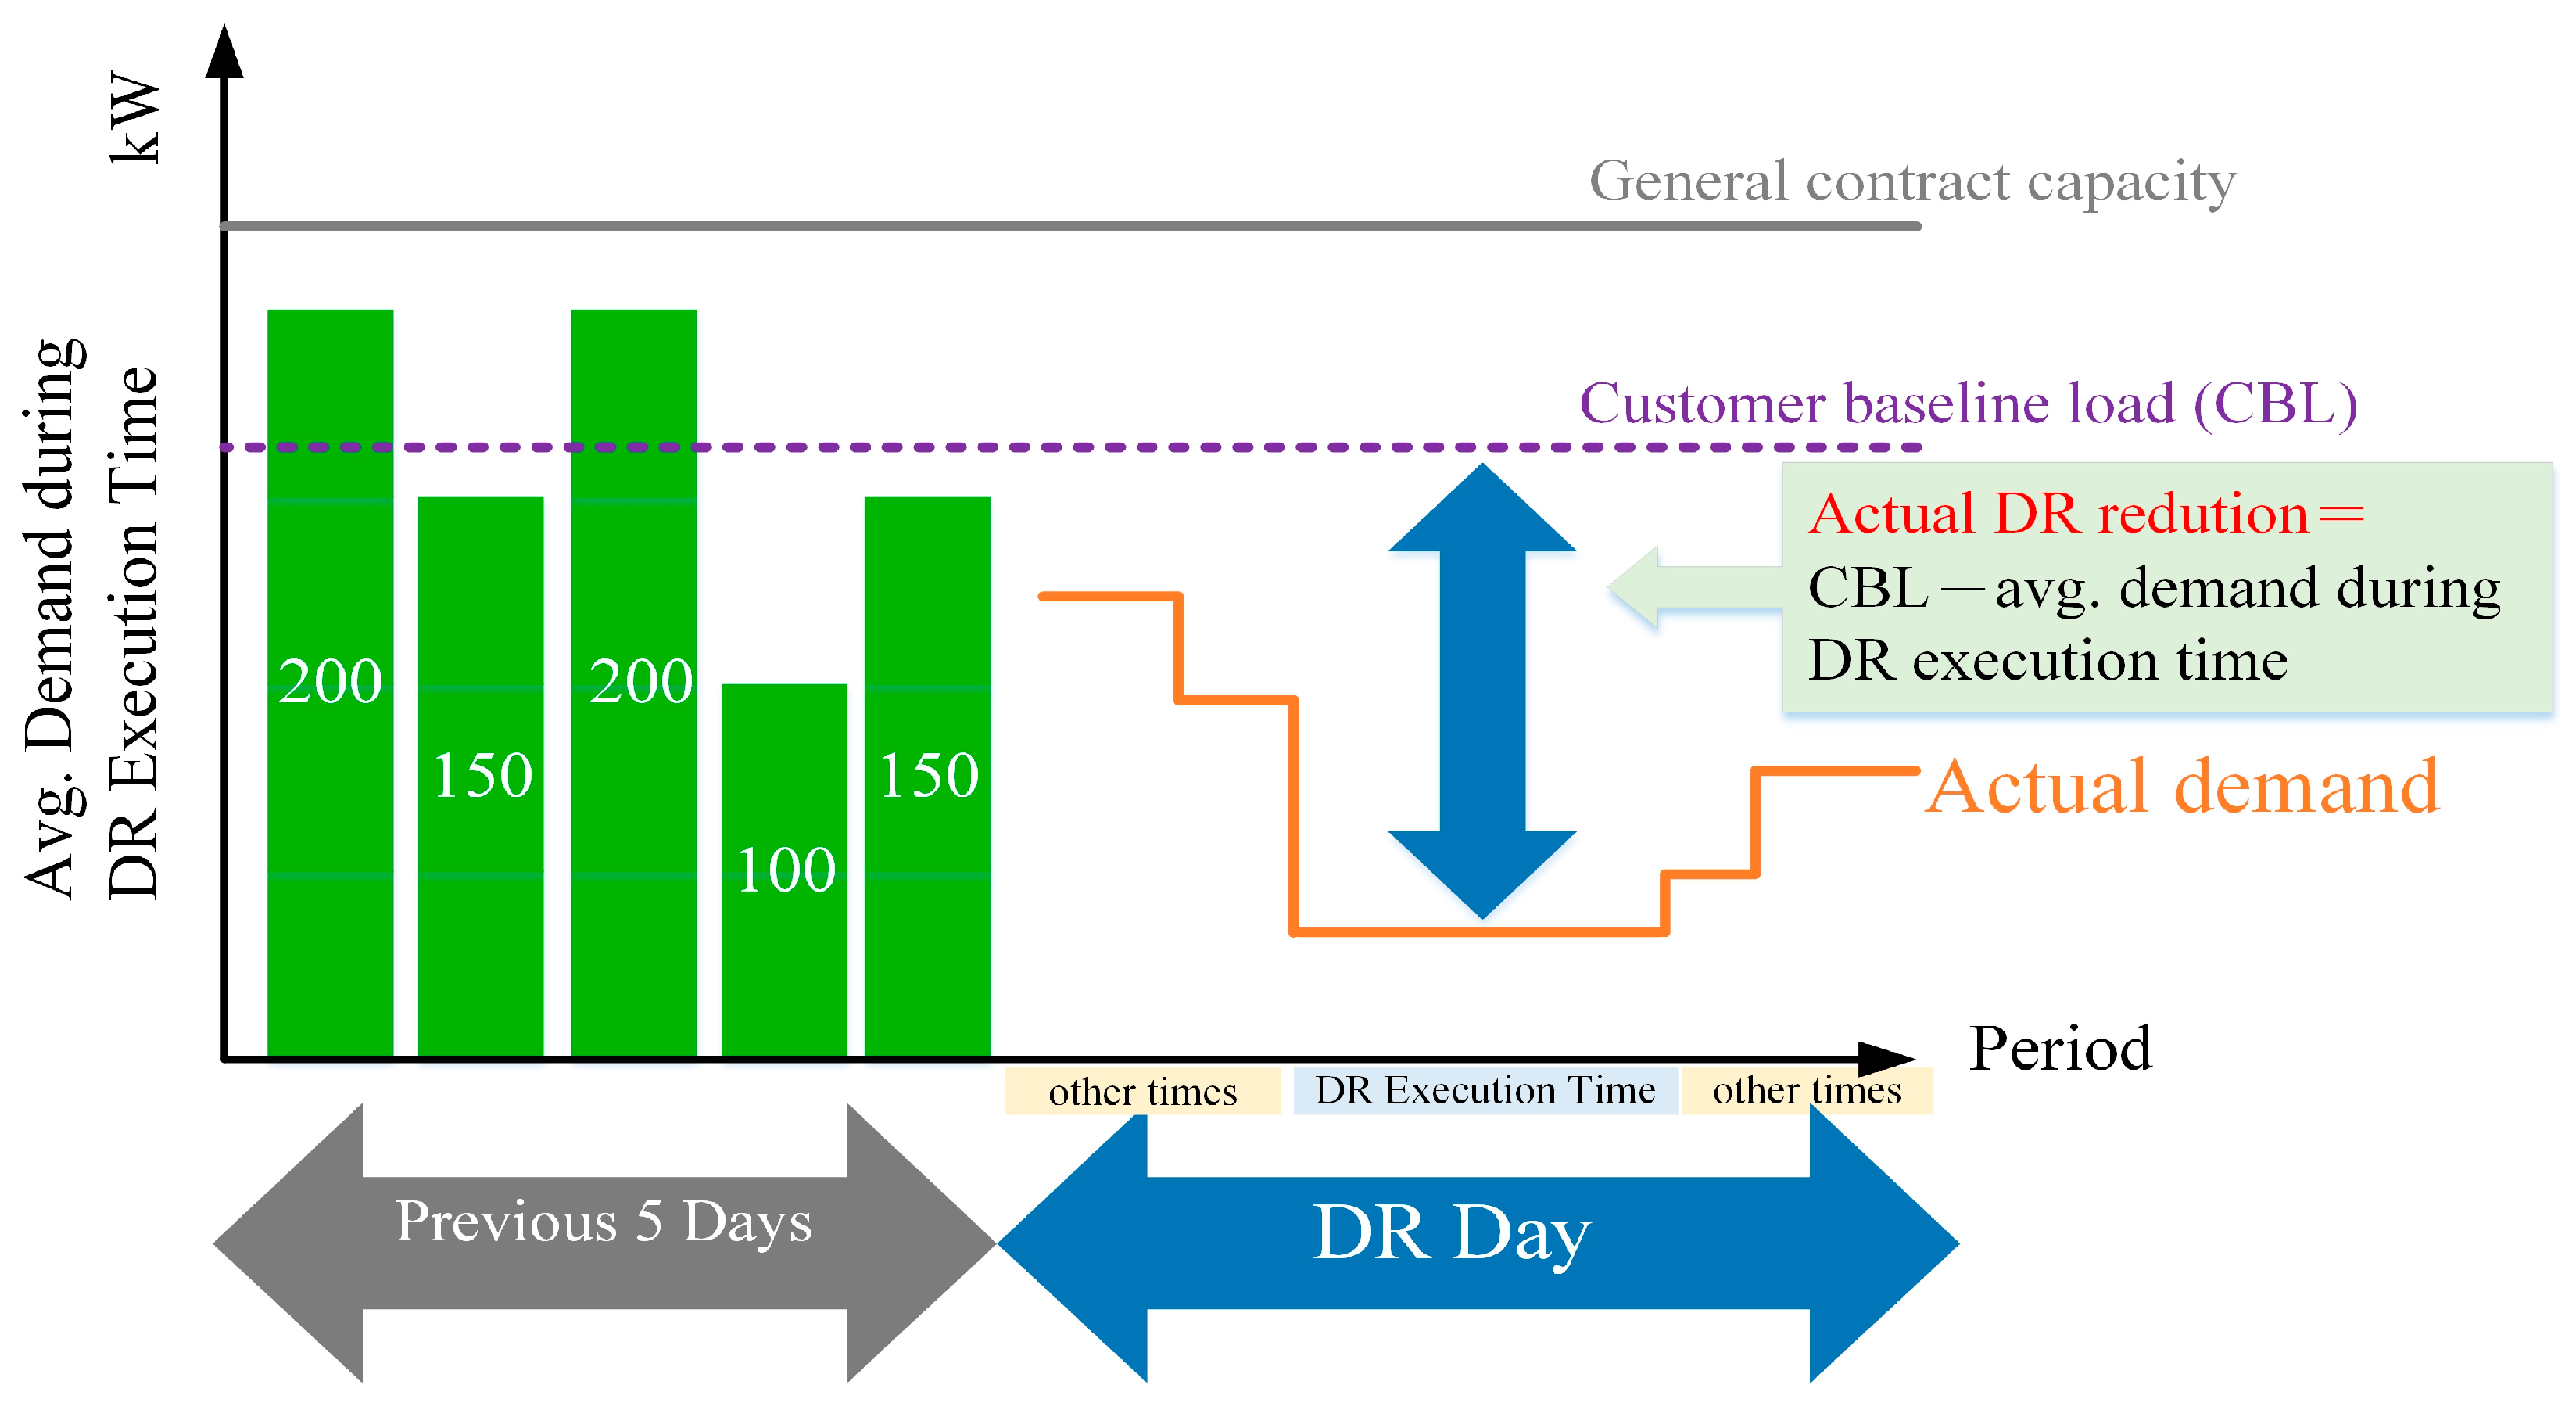
Figure 1. Conceptual illustration to calculate load reduction by DR users.
Energies 18 02690 g001
Figure 2. The segmented bidding prices and reduction capacity for an equivalent DR unit.
Energies 18 02690 g002
Figure 3. Conceptual illustration for the DB mechanism.
Energies 18 02690 g003
Figure 4. Conceptual illustration of DB mechanism for the ancillary services market.
Energies 18 02690 g004
Figure 5. A simplified model of the investigated power system.
Energies 18 02690 g005
Figure 6. Conceptual illustration to calculate the cost of DR unit.
Energies 18 02690 g006
Figure 7. HDSM flowchart.
Energies 18 02690 g007
Figure 8. An example of the dispatch result by DQD.
Energies 18 02690 g008
Figure 9. Actual load reduction by DR users.
Energies 18 02690 g009
Figure 10. Actual load reduction in DR users in Area A in Example 2.2.
Energies 18 02690 g010
Figure 11. Actual load reduction in DR users in Area B for Example 2.2.
Energies 18 02690 g011
Figure 12. Load reduction availability of DR users for energy generation.
Energies 18 02690 g012
Figure 13. Bidding prices of DR users for energy generation.
Energies 18 02690 g013
Figure 14. Availability of DR users for ancillary service.
Energies 18 02690 g014
Figure 15. Bidding prices of DR users for ancillary service.
Energies 18 02690 g015
Table 1. Accumulated information of an equivalent DR unit.
Index of
DR User
Load Reduction Capability (kW)Accumulated Load Reduction (kW)Price Quote (TWD/kWh)Equivalent
Segment Number
Accumulated
Cost (TWD)
Load Reduction in Segment (kW)
123.675.29.804607.516.2
114.471.69.60
108.267.29.20
93.2598.883454.512.2
82.855.88.30
76.2538.25
69.046.88.122351.725.8
58.037.88.06
45.629.87.82
33.224.27.60
212.4217.201146.021.0
18.68.66.60
Table 2. Data of thermal units.
Index of Thermal Unit P i max (MW) P i min (MW)α (USD)β (USD/MW)γ (USD/MW2)
16001505617.920.001560
220050787.970.004820
34001003107.850.001942
4340702507.500.001810
Table 3. Information about the DR users and their quotes and capabilities in the segments.
Index of
DR User
Availability of Load Reduction (MW)Accumulated Load Reduction
(MW)
Price Quote
(USD/MWh)
Equivalent
Segment Number
Accumulated
Cost (USD)
Load Reduction in Segment
(MW)
1571809.8661477.613
1461739.47
1391679.1551351.821
12121589.06
11151468.8541160.728
10131318.64
9171188.413915.729
8121018.13
711897.822675.136
615787.79
510637.71
413537.651395.253
314407.57
212267.34
114147.26
Table 4. Comparison of the dispatch results with and without DR users.
ExampleDR UsersMarginal Price
(USD/MWh)
DR Unit
(MW)
Cost
(USD/h)
Bid WinnerTotal Cost
(USD/h)
1.1Without DR users9.20---------11,310.29
1.2with DR users8.99146.0011611~1111,142.47
Table 5. Actual supply by thermal units.
ExampleDR UsersThermal Unit (MW)
P1S1P2S2P3S3P4S4
1.1Without DR users412.4060128.2920349.2940310.0030
1.2With DR users343.7560106.0720294.1040310.0030
Table 6. Convergence history of Example 1.2.
Variation StepIterationDR UnitTotal Cost (USD/h)
Load Reduction (MW)Cost (USD/h)
Initial soluiton---1801477.6311,257.95
SP1 = 80 MW21801477.6311,175.99
SP2 = 40 MW21401107.6211,157.15
SP3 = 20 MW21401107.6211,146.44
SP4 = 10 MW21501196.9611,145.66
SP5 = 5 MW21451151.8711,143.94
SP6 = 2.5 MW2147.51174.3111,143.23
SP7 = 1.25 MW2146.251162.9811,142.81
SP8 = 0.625 MW1146.251162.9811,142.65
SP9 = 0.3125 MW3145.931160.1611,142.56
SP10 = 0.15625 MW2146.091161.5611,142.52
SP11 = 0.078125 MW1146.001160.8611,142.45
Table 7. Overview of the Case Study 2.
AreaAB
Thermal units#1 and #2#3 and #4
Load demand (MW)1120480
Required spinning reserve (MW)150150
DR users for energy generation (Load reduction)Refer to Table 3Refer to Table 3
DR users for ancillary service (Spinning reserve)Refer to Table 8Refer to Table 8
Load demand (MW)1600
Inter-regional power flow constraints (MW)300
Table 8. The quotes and availability of DR users in the ancillary service bidding platform.
Index for DR User12345
Price quote (USD/MWh)0.620.680.720.760.79
Available capacity for spinning reserve (MW)1610151213
Index for DR User678910
Price quote (USD /MWh)0.810.830.840.860.89
Available capacity for spinning reserve (MW)1211121415
Table 9. Technical and economical results of the Case Study 2.
Example2.12.2
Load demand (Area A/B) (MW)1120/4801120/480
Required spinning reserve (Area A/B) (MW)150/150150/150
Thermal unitsActual supply of energy generation:
Area A (P1/P2) (MW)
Area B (P3/P4) (MW)
446/139
360/320.8
522.93/164.06
257.47/340
Actual supply of spinning reserve:
Area A (S1/S2) (MW)
Area B (S3/S4) (MW)
60/20
40/19.2
60/20
40/0
DR units for
energy generation
Availability for load reduction:
Area A/B (MW)
180/180180/180
Actual supply of load reduction:
Area A/B (MW)
167/167173/142.53
DR units for
ancillary service
Availability for spinning reserve
Area A/B (MW)
130/130130/130
Actual supply of spinning reserve:
Area A/B (MW)
10.8/030/0
Power transmission lineMaximum limit (MW)---300
Actual flow (MW)368260
Economical results
Marginal prices for energy generation:
Area A/B (USD/MWh)
9.31/9.319.55/8.85
Bid winner of DR users for energy generation
(Area A/Area B)
1~13/1~131~14/1~11
Marginal prices for spinning reserve:
Area A/B (USD/MWh)
0.62/---0.72/---
Bid winner of DR users for ancillary service
(Area A/B)
1/---1~3/---
Total cost (USD/h)14,625.014,672.1
Table 10. Convergence history for Example 2.2.
Variation StepIterationPenalty (USD/h)Total Cost (USD/h)
Initial solution---46,666.761,370.701
SP1 = 80 MW2014,696.362
SP2 = 40 MW2014,676.938
SP3 = 20 MW1014,673.564
SP4 = 10 MW2014,672.511
SP5 = 5 MW2014,672.364
SP6 = 2.5 MW2014,672.142
SP7 = 1.25 MW1014,672.139
SP8 = 0.625 MW1014,672.136
SP9 = 0.3125 MW1014,672.112
SP10 = 0.15625 MW1014,672.103
SP11 = 0.0078125 MW2014,672.098
Table 11. Comparison of dispatch results under different HDSM parameters for Example 2.2.
SP1 (MW)RFTotal Cost (USD/h)
80814,672.1
414,672.1
214,672.1
60814,672.1
414,672.1
214,672.1
40814,672.1
414,672.1
214,672.1
Table 12. Technical and economical results of the Case Study 3.
Example3.13.2.13.2.23.3
Load demand (N/C/S) (MW)9000/3600/54009000/3600/54009000/3600/54009000/3600/5400
Required spinning reserve (N/C/S) (MW)900/900/900900/900/900900/900/900900/900/900
Thermal unitsActual supply of energy generation:
(N/C/S) (MW)
6498/5714/57885509/5596/48495663/5555/47835502/5633/4924
Actual supply of spinning reserve: (N/C/S) (MW)402/180/318283/170/286402/180/318283/170/297
DR units for
energy generation
Availability for load reduction:
(N/C/S) (MW)
---1000/1000/10001000/1000/10001000/1000/1000
Actual supply of load reduction:
(N/C/S) (MW)
---828/609/609834/582/582647/647/647
DR units for ancillary serviceAvailability for spinning reserve:
(N/C/S) (MW)
---300/300/300---300/300/300
Actual supply of spinning reserve:
(N/C/S) (MW)
---279/0/0---49.71/49.71/49.42
Power transmission lineMaximum limit ( P C N max / P S C max ) (MW)3000/30003000/30003000/3000---
Actual flow (PCN/PSC) (MW)2502/3882662/582502/-352851/171
Economical results
Marginal prices for energy generation:
(N/C/S) (TWD/MWh)
1436/944/944877/774/774879/762/762791/791/791
Marginal prices for spinning reserve:
(N/C/S) (TWD/MWh)
---96/---/------82.4/82.4/82.4
Total cost (TWD/h)12,360,07611,561,22611,605,25211,540,141
Table 13. Convergence history of DR units for Example 3.2.1.
Variation StepIterationLoad Reduction (MW)
(North/Center/South)
Spinning Reserve (MW)
(North/Center/South)
Total Cost
(TWD/h)
Initial solution---1000/812/0123/92/8911,713,046
SP1 = 80 MW7840/572/560283/0/011,567,852
SP2 = 40 MW3840/612/600283/0/011,563,906
SP3 = 20 MW2820/612/620303/0/011,563,247
SP4 = 10 MW5830/602/610273/0/011,562,003
SP5 = 5 MW5830/610/610278/0/011,561,322
SP6 = 2.5 MW4828/609/608278/0/011,561,277
SP7 = 1.25 MW5829/609/609278/0/011,561,243
SP8 = 0.625 MW4828/609/609279/0/011,561,231
SP9 = 0.3125 MW3828/609/609279/0/011,561,228
SP10 = 0.15625 MW5828/609/609279/0/011,561,226.6
SP11 = 0.078125 MW2828/609/609279/0/011,561,226.1
Table 14. The impact of changes in different loads on dispatch results for Example 3.2.1.
Load
(MW)
Marginal Price for Energy Generation
(TWD/MWh)
DR Unit for Energy Generation (MW)Marginal Prices for Spinning Reserve (TWD/MWh)DR Unit for Spinning Reserve
(MW)
Total Cost
(TWD/h)
NCSNCSNCSNCS
16,000622622622260260260------------------10,128,682
16,50066166166134534534581818130303010,449,880
17,0007246996994964404408780801244.31.310,791,601
17,50080872872871550750788.5------149------11,161,920
18,00087777377382860960995.8------279------11,561,226
N—northern area; C—central area; S—southern area.
Disclaimer/Publisher’s Note: The statements, opinions and data contained in all publications are solely those of the individual author(s) and contributor(s) and not of MDPI and/or the editor(s). MDPI and/or the editor(s) disclaim responsibility for any injury to people or property resulting from any ideas, methods, instructions or products referred to in the content.