Abstract
The thermal management system (TMS) of electric vehicles (EVs) plays a pivotal role in vehicle performance, driving range, battery lifespan, and passenger comfort. Precise control of compressor speed, informed by real-time sensor data, is essential for improving TMS efficiency and extending EV range. This study proposes a control strategy based on the PID Search Algorithm (PSA), ensuring optimal thermal management for an integrated battery and cabin TMS. A co-simulation platform combining AMESim and Simulink is developed for validation, utilizing various sensors to monitor system performance. Simulations are conducted under target temperatures of 20 °C and 25 °C to replicate various operating conditions. The optimized strategy is compared with the most commonly used PID controllers, fuzzy controllers, and PID fuzzy control strategies. The results demonstrate that the PSA-Optimized control strategy significantly outperforms the other three strategies. For a target of 25 °C, the PSA-Optimized control strategy shows a minimal temperature overshoot of 0.012 °C, with COP improvements of 0.06, 0.04, and 0.03 compared to the other three control strategies, respectively. For a target of 20 °C, the overshoot is further reduced to 0.010 °C, while the coefficient of performance (COP) increases by 0.14, 0.01, and 0.07 relative to the same benchmarks. Overall, the results indicate that the PSA-Optimized control strategy effectively utilizes sensor data to reduce cabin temperature overshoot, stabilize compressor speed fluctuations, slow the decay of the battery’s state of charge (SOC), and enhance the system’s COP.
1. Introduction
With the accelerating convergence of living and mobility, electric vehicles (EVs) are rapidly emerging as a pivotal technology for achieving global carbon neutrality and transforming energy structures. According to the International Energy Agency (IEA), the market share of EV sales is projected to rise from approximately 15% in 2023 to nearly 40% by 2030, surpassing 50% by 2035 [1,2,3].
Thermal management systems (TMSs), a core technology ensuring vehicle performance and safety, are undergoing rapid innovation. TMSs integrate multi-modal sensors (e.g., high-precision NTC thermistors, thermocouples, MEMS pressure transducers, and infrared thermal imaging arrays) to achieve real-time monitoring of critical components such as battery packs, cabins, and motors [4]. By dynamically regulating temperature and pressure within optimal ranges, TMS control strategies mitigate performance degradation, safety risks (e.g., thermal runaway), and energy losses caused by overheating or overcooling [5].
Lithium-ion (Li-ion) batteries exhibit pronounced temperature-dependent characteristics, with a recommended optimal charging and discharging temperature range of 25–40 °C. In extreme cases, excessive heat accumulation can lead to battery thermal runaway, significantly increasing the risk of fire or explosion [6,7,8,9].
The HVAC (Heating, Ventilation, and Air Conditioning) system is the primary energy-consuming subsystem in electric vehicles (EVs), with thermal regulation demands for battery packs and cabin compartments reducing driving range by 35–50% under high-temperature operating conditions. Empirical studies indicate that compressor power consumption contributes substantially to this energy burden, constituting 60–80% of the total HVAC energy expenditure [10]. Sensors play a crucial role in optimizing compressor operation by providing feedback on cabin temperature and humidity, enabling more efficient energy use.
Current thermal management optimization focuses on architectural innovations and component improvements, while control strategy development lags [11,12,13,14,15,16]. Compared with the static conditions of conventional buildings, air conditioning (AC) in EVs faces greater challenges: the conflict between comfort and range, the coupling of multiple circuits, and the dynamic condition perturbations in mobile scenarios. Thus, AC systems urgently require advanced control algorithms that leverage sensor data for precise temperature control and efficiency gains [17,18].
The investigation of compressor speed dynamics holds critical significance for enhancing cooling efficiency in AC systems. As the core component of air conditioning systems, temperature regulation is achieved by activating/deactivating the compressor via switch buttons to maintain target passenger cabin temperatures. Extensive compressor control strategies include on/off control, PID control, and intelligent control [19].
With the development of intelligent algorithms, new research ideas for PID parameter tuning have emerged. Researchers have successfully integrated fuzzy control theory into traditional PID controllers to develop fuzzy PID controllers, improving control precision to some degree [20]. However, fuzzy rules are difficult to modify once defined, resulting in poor system self-adjustment and suboptimal control performance.
In contrast, metaheuristic algorithms do not require precise system models, making them suitable for complex systems with incomplete or hard-to-model dynamics. They generally exhibit global search capabilities, avoid local optima, and automatically optimize PID parameters to enhance system stability, response speed, and robustness. Researchers have combined genetic algorithms, particle swarm optimization, and gray wolf optimization with PID controllers to improve control accuracy and adaptability. For instance, Ref. [21] applied ant colony optimization to adjust PID parameters for effective electric vehicle speed control. Ref. [22] integrated a WOA with PID controllers to significantly enhance brushless direct current (BLDC) motor speed regulation. These studies have established the outperformance and feasibility of intelligent algorithms for optimizing PID parameters, but their high computational complexity and long convergence times struggle to meet real-time requirements for vehicular controllers.
Previous studies have demonstrated the effective implementation of metaheuristic algorithms in areas such as industrial and robotic control systems. Nevertheless, their potential for optimizing automotive compressor speeds remains underexplored.
Ref. [23] proposed a novel genetic algorithm-based multi-stage constant-pressure compressor speed control strategy for EV air conditioning systems to reduce energy consumption and improve the coefficient of performance (COP), providing a reference for this study’s compressor speed control modeling.
Ref. [24] proposed a new metaheuristic optimization algorithm—the PID-based search algorithm (PSA). Inspired by incremental PID control, it mimics PID adjustment processes to enable rapid population-based near-optimal solutions. The PSA is fundamentally a PID process-based optimization algorithm, consequently enhancing compatibility with traditional PID controllers, offering critical advantages for industrial applications relying on PID-based motor speed and temperature control.
Recent studies have shown the successful implementation of PSA optimization in power systems and industrial control. Ref. [25] optimized impedance network parameters using the PSA, demonstrating superior convergence speed and optimization accuracy compared to particle swarm optimization (PSO) and genetic algorithms (GAs). Ref. [26] implemented the PSA in remaining useful life (RUL) prediction for computer numerical control (CNC) milling tools, underscoring its precise hyperparameter tuning that improves model performance while reducing computational resource consumption during optimization.
As a PID process-based algorithm, the PSA inherently offers better compatibility with traditional PID controllers. It automatically optimizes PID parameters without structural modifications, providing significant advantages for industrial applications like motor speed and temperature control. Thus, applying the PSA for compressor speed optimization holds both innovation and practical relevance.
Therefore, this paper constructs an improved PSA-Optimized controller for regulating compressor speed in a dual-evaporator parallel air conditioning system, aiming to reduce steady-state error and overshoot under high-temperature conditions while mitigating the decline rate of the battery’s state of charge (SOC) to some extent. First, a one-dimensional coupled model of the air conditioning system is established based on experimental data. Second, we utilize the calibrated model to analyze the impact of compressor speed variation on AC system performance, providing critical insights for controller parameter tuning and fuzzy rule formulation. Finally, to assess the potential improvements offered by the proposed PSA-Optimized strategy, the performance of the PSA-Optimized strategy is evaluated using an AMESim 2404 and MATLAB 2023b co-simulation platform and compared against conventional PID, fuzzy control, and fuzzy PID strategies. The results show that compared to conventional PID, fuzzy, and fuzzy PID strategies, the PSA-Optimized control system exhibits enhanced performance.
2. VTM Experimental Platform
2.1. Experimental Platform and Setup
This experiment aims to test and optimize the cooling performance of the EV air conditioning system. The experimental platform for this experiment includes a climate chamber located at the CAERI WindTunnel Center (Chongqing, China), which was used to simulate external conditions such as temperature, humidity, wind speed, and solar radiation under dynamic driving scenarios, an upper computer for control operations, CANoe (from Vector Informatik GmbH, Stuttgart, Germany) for collecting compressor speed, power, and operating data, and various actuators (such as compressors, fans, lights, etc.) and sensors on the vehicle. These components are shown in Figure 1a.
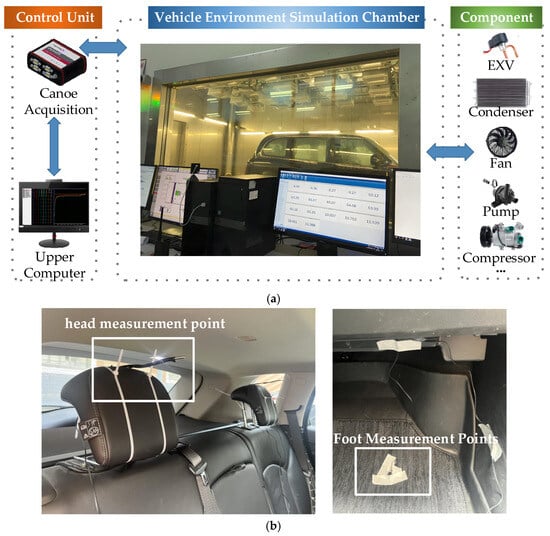
Figure 1.
Vehicle environmental test chamber and measurement setup. (a) Test bench and control room of high- and low-temperature environmental chamber; (b) Cabin temperature measurement points.
The wind tunnel environmental chamber can simulate realistic environments by precisely controlling temperature (−40 °C to +60 °C), relative humidity (5% to 95%), vehicle speed (0 km/h to 200 km/h), and solar load. Furthermore, it can simulate rain/snow and potentially temperature/humidity variations linked to gradients, bringing experimental conditions closer to reality.
Temperature sensors are installed at the battery coolant inlet and outlet (using waterproof NTC10K thermistors with ±1% accuracy) as well as at the refrigerant circuit inlet and outlet of the cabin thermal management system. Following GB/T 12782-2022 [27] vehicle test methods, sensors are strategically placed within the cabin to continuously collect real-time temperatures at occupant head level (driver’s head 150 mm above the seat) and foot level (10 mm above the floor) for both front and rear seats., as shown in Figure 1b. These data are crucial for assessing cabin thermal comfort and for validating the accuracy of the electric air conditioning system model.
The specific experimental steps conducted on this platform are as follows:
- (1)
- Vehicle preparation and soaking: Before formal testing, the test vehicle undergoes a comprehensive safety inspection. It is then placed on a roller dynamometer inside the environmental chamber set to a constant ambient temperature of 40 °C. The vehicle is soaked in this environment for a period ranging from 6 to 36 h to ensure thermal equilibrium. This means all internal components and fluid temperatures (e.g., coolant, refrigerant) stabilize and match the chamber temperature, which is crucial for ensuring repeatable and comparable test starting conditions.
- (2)
- Dynamic driving cycle execution: Following the soaking period, the vehicle is driven on the roller dynamometer strictly according to the prescribed vehicle speed profile of the defined driving cycle.
- (3)
- Data acquisition and analysis: Throughout the driving cycle, relevant data from various key measurement points and sensors on the vehicle and thermal management system are continuously collected. This includes, for example, cabin temperature, heat exchanger inlet/outlet temperatures, refrigerant pressures, compressor speed, and power consumption. After the test is completed, the collected data are analyzed to assess the thermal management system’s control performance and energy efficiency under dynamic conditions.
2.2. Closed-Loop Control System Architecture
Figure 2 illustrates the architecture of the closed-loop control system employed in these experiments. The core of the system is the Thermal Management Controller (TMS ECU). The TMS ECU processes signals received from various sensors on the vehicle (e.g., cabin/battery temperature, humidity). Based on these inputs and its internal control strategies, the TMS ECU calculates commands and drives the corresponding actuators, controlling parameters such as fan speed Nfan, compressor speed Ncomp, and pump speed Npump, via the LIN bus to regulate the vehicle’s thermal state.
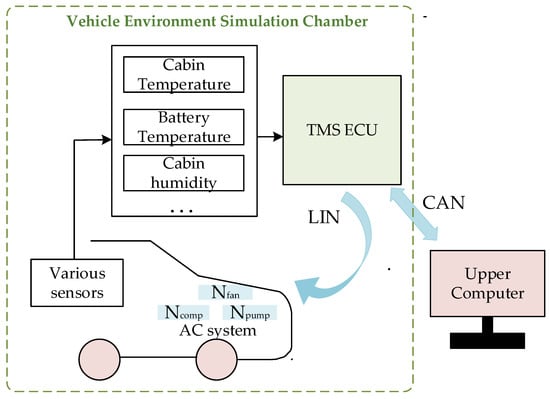
Figure 2.
Vehicle thermal management system closed-loop control schematic.
The TMS ECU communicates in both directions with the Upper Computer through the CAN bus. This connection serves multiple purposes:
- (1)
- Parameter setting and adjustment: Operators use the Upper Computer to set up target conditions and controller parameters before and during the experiment and to make adjustments when needed (e.g., by changing target temperatures).
- (2)
- Monitoring and data acquisition: For monitoring and logging, the Upper Computer displays live data, including important measurements, internal controller information, and commands. Simultaneously, related control and feedback signals are transmitted via the CAN bus to CANoe. Within CANoe, the Graphics function is utilized to log and visually display signal waveforms, facilitating detailed analysis later on for the control logic and system response.
3. Thermal Management System Architecture and Model Validation
3.1. Thermal Management System Architecture and Modes
Figure 3a illustrates the high-efficiency air conditioning cycle system adopted in this study. The system consists of a compressor, evaporator, condenser, electronic expansion valve, coolant pump, and other components. A parallel refrigeration circuit is established between the battery and cabin. The battery loop coolant is driven by a pump located upstream of the battery. To consider both cabin comfort and battery cooling requirements, a dual-evaporator air conditioning system is employed. Heat exchange at the chiller removes heat from the battery pack, which establishes synchronized cooling for both the cabin and battery.
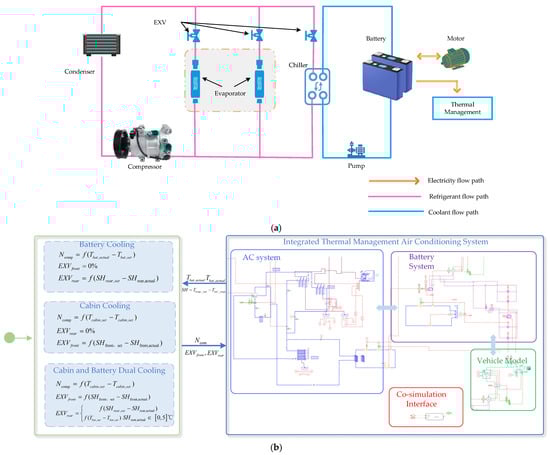
Figure 3.
Schematic diagram of air conditioning system coupled with cabin and battery. (a) Working principle diagram of an integrated thermal management system; (b) Tn-integrated thermal management system modulation model.
The integrated AC system cooling modulation model in AMESim and the aforementioned modeling approach is presented in Figure 3b. The integrated thermal management system can operate in three modes of cooling: battery single cooling, cabin single cooling, and battery and cabin co-cooling.
3.2. Mathematical and Thermal Models
3.2.1. Cabin Thermal Load Analysis
Cabin temperature is an important indicator for evaluating the thermal comfort of vehicle occupants. To reduce the temperature inside the passenger vehicle cabin to a comfortable level, a certain amount of cooling capacity needs to be provided to offset the internal heat gain. This heat is referred to as the thermal load. In summer, when the ambient temperature is higher than the cabin temperature and solar radiation is intense, passenger vehicles absorb a substantial amount of heat. The passenger vehicle cabin thermal load model developed in this paper primarily includes the heat entering through the vehicle body and glass via heat conduction and thermal radiation, the heat dissipated by occupants and electronic devices, and the heat entering through ventilation. A schematic diagram is shown in Figure 4, and the calculation formula is as follows:
where Qs is the thermal load caused by solar radiation, Qh is the thermal load caused by heat exchange between the external environment and the vehicle, Qd is the thermal load generated by occupant metabolism and electronic devices inside the cabin, and Qw is the ventilation thermal load.
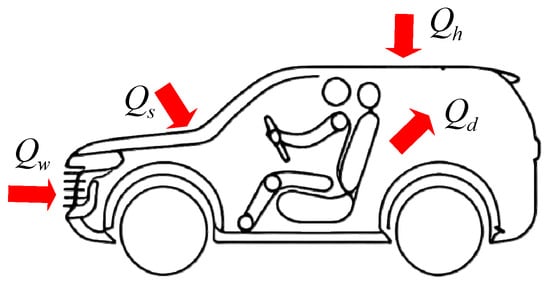
Figure 4.
Passenger cabin thermal load model.
- Solar Radiation Heat Load
The solar radiation heat load is primarily caused by the radiative flux of sunlight passing through the vehicle’s glass, and it is mainly divided into three components: direct, scattered, and reflected radiation. It is calculated using the following formula:
where is the transmissivity of the vehicle glass; Ag is the glass area; and Id, If, and Ir represent the intensity of direct, scattered, and reflected solar radiation, respectively.
- 2.
- Heat exchange between the external environment and the vehicle
The heat load Qh caused by heat exchange between the external environment and the vehicle is primarily attributed to convective heat transfer between the outside air and the vehicle body surface, heat conduction through the body material, and convective heat transfer between the interior air and the inner body wall. Its calculation formula is as follows:
where Ah is the surface area of the vehicle body; is the absorptivity of the body surface; is the external air temperature; is the convective heat transfer coefficient between the outer wall of the vehicle body and the external air, which is related to vehicle speed; and Kh is the overall heat transfer coefficient of the vehicle body, which can be calculated by the following formula:
where is the thickness of each layer of body material; is the thermal conductivity of each layer of material; and is the convective heat transfer coefficient between the inner wall surface of the body and the gas inside the passenger cabin, taken as 20 in this paper. is the heat transfer coefficient of the outer surface of the body, taken as 68 in this paper. The remaining vehicle body structural parameters are provided by the company.
- 3.
- Heat Load from Occupant Metabolism and Electronic Devices
The occupant metabolic heat load Qd is caused by the heat generated by human activities inside the passenger cabin, and can be calculated using the following formula:
where M is the number of occupants in the vehicle; and is the crowding factor, with a value of 0.89. Since the vehicle model is a seven-seater, M is taken as 7. The heat generated by in-car electrical appliances such as lighting and audio systems is relatively small; their total contribution is taken as 200 W.
- 4.
- Ventilation heat load
The ventilation heat load Qw is caused by the introduction of outside air into the passenger cabin by the air conditioning system to maintain cabin air quality. Its calculation formula is
where is the air density, which is 1.146 kg/m³ when the outside temperature is 35 °C; is the required fresh air rate per person, taken as 15 m³/h per person; and hout and hin are the air enthalpies outside and inside the vehicle, respectively, usually obtained by consulting tables.
- 5.
- Cabin Temperature Change Rate
Considering the air conditioning system’s cooling condition, the passenger cabin temperature change rate can be calculated by the following formula:
where Tcab is the passenger cabin temperature; Qcool is the cooling load provided by the air conditioning system to the passenger cabin; Vcab is the passenger cabin volume; and cair is the specific heat capacity of the air inside the cabin.
3.2.2. Battery Heat Generation
The heat generated by the power battery mainly comes from electrochemical reactions and internal resistance heat generation. Electrochemical reactions include ionic reaction heat, side reaction heat, and polarization heat. Internal resistance effects, on the other hand, produce ohmic heat. Specifically, ionic reaction heat comes from ion intercalation/deintercalation, side reaction heat comes from material decomposition, etc., polarization heat originates from voltage loss, and ohmic heat originates from resistance. The total heat generation calculation formula is expressed as
where Qbat is the chemical reaction heat; Qpolar is the polarization reaction heat; Qohm is the ohmic heat; and Qside is the side reaction heat.
Considering that the focus of this study is on the evaluation of thermal management system performance and control strategies, and to balance simulation accuracy and computational efficiency, the Bernardi equation [28] is used to describe the calculation formula for the power battery’s heat generation rate:
In the formula, is the heat generation rate per unit volume of the power battery; I is the discharge current; Uocv is the open-circuit voltage; Tbat is the battery temperature; Vbat is the battery volume; and is the reversible reaction heat, which has a relatively small impact on the battery heat generation and is generally an empirical constant of 11.16 Mv in engineering calculations.
3.2.3. Required Cooling Capacity
The cooling capacity of the air conditioning system needs to meet the heat dissipation requirements under extreme operating conditions. The cooling capacity should be greater than the sum of the battery pack’s maximum thermal load and the passenger cabin’s maximum thermal load. Based on this requirement, this design adopts 1.1 times the target value as the design cooling capacity. The calculation formula is as follows:
where Qbm is the maximum thermal load of the battery, and Qcm is the maximum thermal load of the passenger cabin.
3.3. Model Validation: Comparison of Cabin Temperature Simulation and Experimental Test Results
To ensure that the simulation model accurately replicates air conditioning energy consumption under real-world conditions, experiments were conducted in the environmental chamber simulating extreme heat scenarios. In this test, the cabin temperature was preset to 25 °C via the air conditioning control panel. The test vehicle operated on a roller dynamometer following the WLTC (Worldwide Harmonized Light Vehicles Test Cycle), as with the environmental chamber set to a constant ambient temperature of 40 °C. The vehicle was driven according to the WLTC on a roller dynamometer. The WLTC, along with the China Light-Duty Vehicle Test Cycle (CLTC), is a standard regulatory driving cycle commonly used in current automotive development for assessing energy consumption and emissions [29,30]. These standard cycles are constructed from real-world driving data and are designed to represent typical vehicle usage patterns. While primarily focused on energy efficiency, these dynamic driving cycles effectively impose varying loads on the thermal management system through the simulation of frequent changes in vehicle speed (including acceleration, deceleration, constant speed, and idle phases). These speed changes affect factors such as frontal airflow, heat generation from the engine or motor, and changes in the demand for cooling from the AC system, thereby allowing a good evaluation of the thermal management system’s performance under realistic operating conditions. Specifically, Figure 5 shows the vehicle speed profile over time for the WLTC.
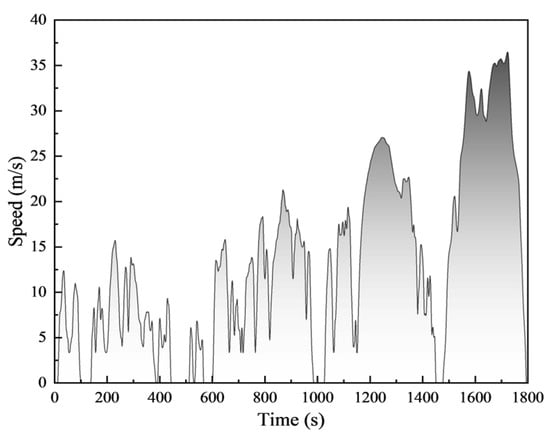
Figure 5.
WLTC conditions.
For the simulation, the established boundary conditions and control targets were input into the vehicle thermal management system model, which is described in Section 3.1. Key boundary conditions were carefully matched between the experimental test and the simulation to ensure comparability. These included the ambient temperature, solar radiation power, vehicle speed profile, and relative humidity. All other relevant boundary conditions were also maintained identically. Table 1 lists the detailed boundary conditions for this model validation experiment.

Table 1.
Test case boundary conditions.
Cabin temperature and battery temperature were selected as the primary output parameters for comparative analysis. Data for components like the battery, evaporator, condenser, and compressor used within the simulation model were based on experimentally measured data or empirical models where applicable. The cabin temperature, specifically, serves as the key output parameter for validating the cabin-coupled air conditioning model proposed in Section 3.1.
Simulated and experimental cabin temperature trajectories were compared over the entire duration of the WLTC, with results shown in Figure 6 and Table 2. Fifteen evaluation time points were selected to quantify the differences between the simulation results and experimental measurements. Experimentally, the cabin temperature was obtained by averaging the values from multiple in-car sensors. In the simulation, it was obtained from the simulated temperature sensor output in AMESim, which represents the average cabin temperature. Both methods capture the average cabin temperature.
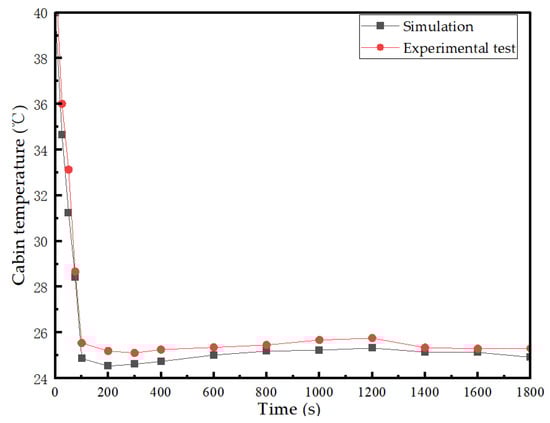
Figure 6.
Cabin temperature: simulation compared to experimental test.
Table 2.
Comparison of simulated and experimental cabin temperature.
The comparison shows that the simulation and experimental results for cabin temperature exhibit a strong correlation, demonstrating good agreement between the model predictions and measured data throughout the dynamic driving cycle. The absolute temperature errors at various representative time points were observed, with the average temperature difference across the evaluation points being 0.7 °C and a maximum temperature difference of 1.9 °C. These findings underscore that the integrated cabin–battery thermal management model proposed in Section 3.1 accurately simulates the cabin cooling process under dynamic driving conditions, thus validating its suitability for further performance and control strategy analysis.
3.4. The Impact of Compressor Speed on AC System Performance
Simulations will be conducted at ambient temperatures of 30 °C and 40 °C, based on the cabin–battery collaborative thermal management system described in Section 3.1. The compressor speed will vary between 1000 and 6000 r/min as an independent variable. This will be used to analyze the impact on the performance of the air conditioning system and the state of the battery, with the aim of optimizing the system control strategies and algorithms based on feedback from various sensor parameters.
As shown in Figure 7a–c, with the increase in compressor speed, the compressor discharge temperature, discharge pressure, and cooling capacity all increase. At an ambient temperature of 30 °C, for every 1000 r/min increase in speed, the discharge pressure increases by 3.2–3.5 bar, the discharge temperature rises by 4.2%, and the working fluid flow increases by 18–22%. At an ambient temperature of 40 °C, for every 1000 r/min increase, the discharge pressure increases by 4.8–5.2 bar, the discharge temperature rises by 5.7%, and the working fluid flow increases by 24–28%. This is because a higher speed leads to faster gas flow and higher compression efficiency, while also increasing internal friction and heat, which affects the discharge temperature, and the actual situation is also nonlinear.
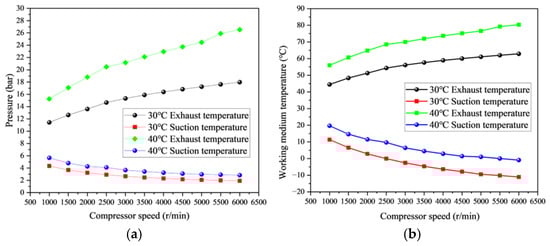
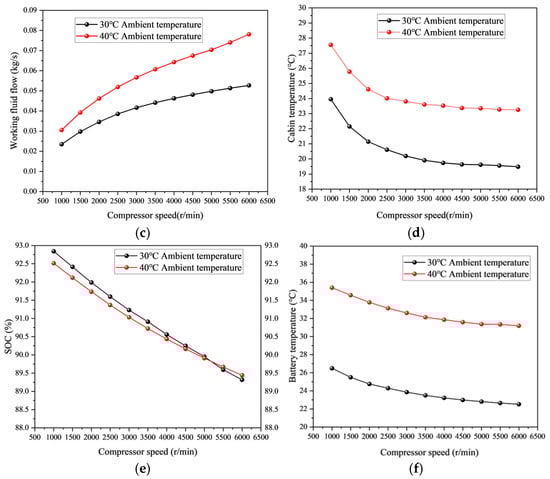
Figure 7.
Impact of compressor speed on cooling performance: (a) pressure, (b) working medium, temperature, (c) working fluid flow, (d) cabin temperature, (e) SOC, and (f) battery temperature.
Figure 7d,f show the relationship between compressor speed and the temperatures of the cabin and the battery. In the range of 1500–4500 r/min, increasing the compressor speed significantly reduces both the cabin and battery temperatures. Under the 30 °C ambient condition, the cabin and battery temperatures decrease by 6.5 °C and 8.3 °C, respectively. Under the 40 °C ambient condition, the cabin and battery temperatures decrease by 8.3 °C.
As indicated in Figure 7e, with the increase in compressor speed, the battery’s state of charge (SOC) decreases. This is because, with a higher compressor speed, the compressor power consumption increases, requiring the power battery to supply more energy to maintain the air conditioning system’s operation. At the same speed, the battery’s SOC at 40 °C ambient temperature is significantly lower than at 30 °C, as high temperatures accelerate the battery’s self-discharge and increase internal resistance, leading to higher energy losses.
In summary, temperature regulation in the AC system can be accomplished by reasonably modulating the compressor speed, which contributes to a rapid attainment of the target cabin temperature. In parallel, the compressor speed should be dynamically adjusted based on the ambient temperature to ensure passenger comfort while maximizing battery performance and range.
4. Compressor Speed Regulation Strategies
4.1. PID Control Method
PID control dynamically adjusts system errors through three components—proportional (P), integral (I), and derivative (D) actions. Its continuous-time formulation is expressed as
where represents the temperature error at time .
For implementation in digital controllers, the continuous PID formulation is discretized into an incremental form:
As illustrated in Figure 8a, PID control has a simple structure and is very robust. In practical engineering applications, parameters of the integrated thermal management system—including compressor speed, electronic expansion valve opening, water pump speed, and fan speed—are regulated via PID strategies. However, automotive air conditioning systems are complex nonlinear dynamic systems influenced by external environmental disturbances, internal perturbations, and operational conditions of vehicle components. Traditional PID controllers with fixed parameters struggle to address the time-varying nonlinearities and multi-disturbance coupling effects inherent to thermal management systems, and their parameter tuning is cumbersome and time-consuming.
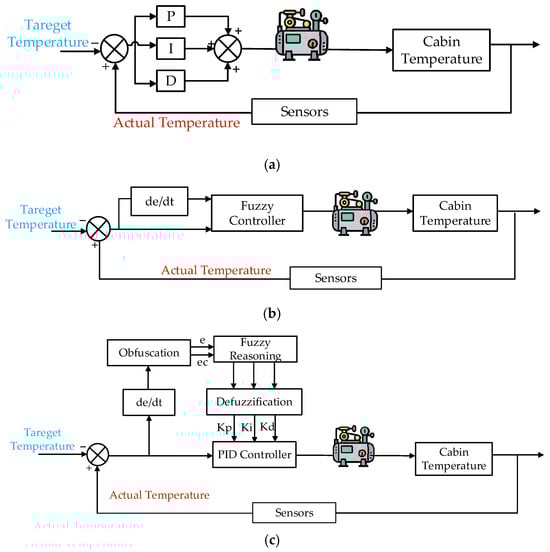
Figure 8.
Controller structure. (a) PID control strategy; (b) fuzzy control; (c) fuzzy PID control strategy.
4.2. Fuzzy PID Control Method
Fuzzy control emulates human reasoning by applying expert-defined fuzzy criteria, enabling intelligent regulation of nonlinear systems.
To regulate the compressor speed while guaranteeing the comfort of the passenger compartment, as shown in Figure 8b, fuzzy rules are established based on the characteristics of compressor speed and the characteristics of the cabin temperature and compressor speed in Section 3.3.
The PID fuzzy controller integrates the strengths of both methods: fuzzy logic dynamically adjusts parameters based on system states, avoiding overshoot, while PID regulation eliminates steady-state errors. This architecture combines fuzzy parameter adaptation with PID execution, ensuring robustness and precision, as shown in Figure 8c.
The PID fuzzy controller is structured around two core components: fuzzy-based parameter adaptation and optimization and PID control execution. First, it calculates the error and its rate of change , and uses these inputs to generate a correction value. Fuzzification and defuzzification dynamically adjust the initial PID parameters, with the parameter adaptation equations defined as
where
: adjusted PID parameters.
: initial PID parameters (pre-tuning values).
: correction values calculated by the fuzzy controller based on and .
4.3. PSA-Optimized Control Method
Because of its own advantages, the PID fuzzy control method is suited for the regulation of compressor speed in nonlinearly coupled AC systems. With reasonable settings of the fuzzy rule base, control parameters , and quantization parameters , the AC system can reach the target state quickly and stably. In order to solve the fuzzy PID parameter-tuning problem and improve compatibility with traditional PID control, a meta-heuristic optimization framework based on the PID search algorithm (PSA) is proposed in this paper.
4.3.1. PSA
The PID-based search algorithm (PSA) is a metaheuristic optimization technique inspired by the error correction mechanism of Proportional–Integral–Derivative (PID) control. It translates PID principles into a population-based framework, dynamically balancing exploration and exploitation through proportional, integral, and derivative adjustments. The PSA uniquely integrates historical error compensation, oscillation suppression, and stochastic perturbations to escape local optima.
Compared to conventional algorithms, the PSA offers structural simplicity, minimal parameter tuning (population size n and maximum iterations T), and seamless compatibility with industrial PID controllers. Its theoretical alignment with PID dynamics enables direct reuse of field-tuned controller expertise, significantly reducing engineering implementation barriers. These advantages justify its selection as the search algorithm in this study.
Assuming that the objective function is , the value of the objective function for the individual is calculated by Equation (13).
The individual position update mechanism is based on the feedback mechanism of Proportional-Integral-Derivative (PID) control. When the iteration number is t, the specific update formula for the output of the PID adjustment is
where , and are vectors of random numbers with n rows and 1 column, ranging from 0 to 1. To avoid the algorithm becoming trapped in a local optimum, a zero-output regulation factor is introduced, based on the original output, as defined in Equation (16).
In this equation, are vectors of random numbers ranging from 0 to 1 with n rows and d columns; L in Equation (16) represents a Lévy flight function, defined in Equation (17); and is an adjustment coefficient that is calculated in Equation (18). Β is a factor that is set to 1.5.
As shown in Figure 9, the value of λ decreases with an increase in the number of iterations. Additionally, as t increases from 0 to T, the term (1 − t/T) decreases from 1 to 0. Consequently, cos(1 − t/T) transitions from cos(1) (approximately 0.54) to cos(0) (which is 1). These varying components influence the search step size and contribute to the algorithm’s convergence.
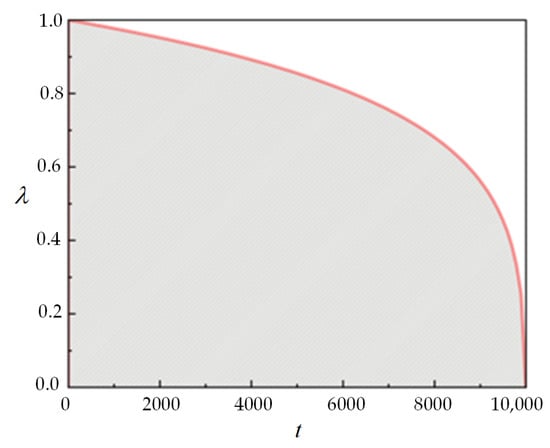
Figure 9.
The variation of with .
The population renewal formula is defined as
4.3.2. Optimization of PSA-Optimized Controller Parameters
Fuzzy PID parameter tuning is empirically dependent, while the PSA enables global optimization. In this study, we developed an air conditioning coupling system model based on the PID Search Algorithm (PSA) to regulate the compressor speed in order to meet cabin cooling requirements under high-temperature conditions. The control parameters and quantization factors were optimized algorithmically, specifically the five parameter values (). The flow of the five parameters optimized by the PID search algorithm is shown in Figure 10.
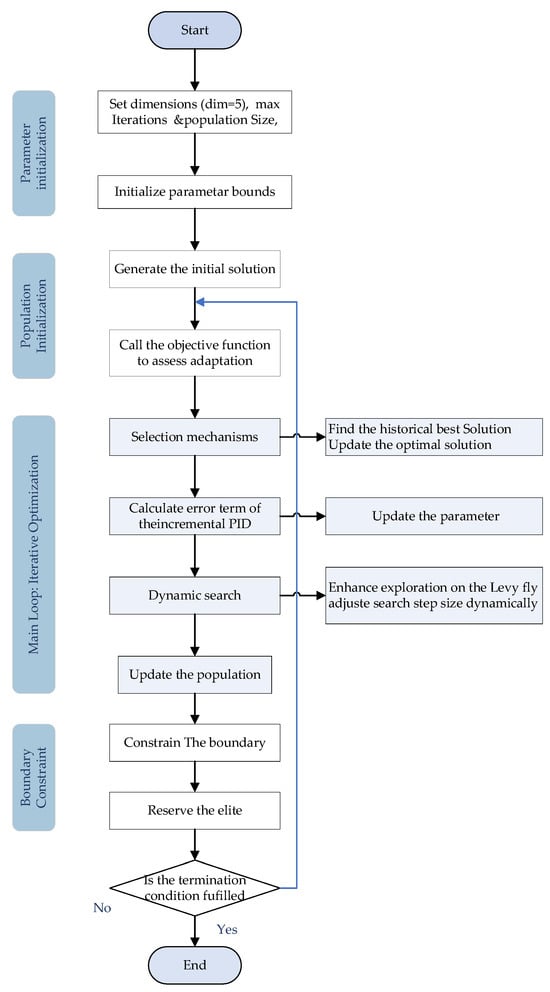
Figure 10.
Flowchart of PSA optimization of five parameters.
The following steps comprise the optimization process:
- (1)
- Parameter initialization: The initial population size is set to 50, and the initial values and ranges for the five parameters are set as well.
- (2)
- Determining the fitness function: The fitness function evaluates individual performance in the global optimization process. In the air conditioning system, the objective function is set as follows:
Through sensitivity analysis conducted by adjusting these weight coefficients, the results indicate that decreasing ω1 and increasing ω2 cause both overshoot and steady-state error to rise, while compressor speed falls only slightly—illustrating the classic trade-off between temperature accuracy and energy usage. Furthermore, changes in ω2 have only a modest impact on steady-state speed, confirming that the energy-efficiency weight does not unduly constrain compressor output under this scenario. Additionally, raising ω3 from 100 to 500 yielded only marginal improvement in overshoot (0.012 → 0.011 °C), showing that ω3 mainly serves to balance the magnitudes of the three objective terms rather than to significantly affect closed-loop dynamics. These results support our choice (ω1 = 0.999; ω2 = 0.001; ω3 = 100), which preserves tight thermal comfort control while delivering competitive energy performance and system stability.
- (3)
- Perform PSA optimization and present the optimized values of the five parameters ().
- (4)
- Launch the simulation mode. The optimized parameters are evaluated by means of the fitness function. Then, return to step (3). Each iteration updates the position and fitness of every individual
- (5)
- The process concludes once the maximum number of iterations is reached, yielding the global optimal solution. Selecting a higher number of iterations typically enhances accuracy in many algorithms. Given the complexity of the air conditioning system and the limitations on memory, a balance between computational efficiency and result accuracy is necessary; therefore, 20 iterations are sufficient to meet the requirements outlined in this paper.
5. Simulation Results Analysis
5.1. Definition of Simulation Conditions
To validate the effectiveness of the PSA-Optimized control strategy, a comparative study was conducted using conventional PID control, fuzzy control, and fuzzy PID control within the simulation framework. The designs of the four control systems are illustrated in Figure 11.
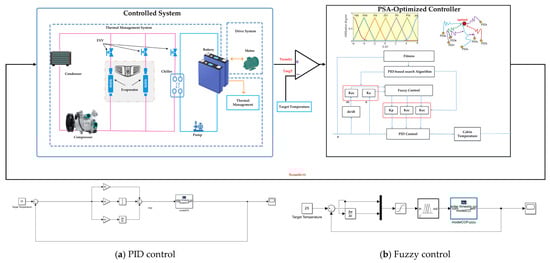
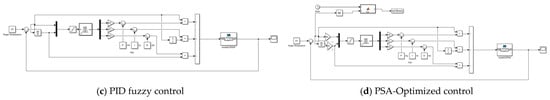
Figure 11.
Simulation framework of the four control methods.
The primary objective of the air conditioning system is to ensure human comfort. In terms of energy efficiency and passenger comfort, 20 °C and 25 °C were selected as the target temperatures. The simulation conditions are summarized in Table 3, with a total simulation time of 1000 s. The simulation results illustrate variations in cabin temperature, compressor speed, refrigerant flow rate, and compressor power consumption.
Table 3.
Parameters of simulation.
Two key performance indicators were established to evaluate the effectiveness of the temperature control system: steady-state error and adjustment time. Steady-state error refers to the temperature deviation from the target value once the cabin temperature stabilizes, reflecting the system’s ability to maintain a stable temperature. Adjustment time is the duration required for the temperature to reach the target value from the initial state, directly assessing the system’s response speed. By evaluating the simulation outcomes of various control strategies, the performance variations among them can be assessed based on these two metrics. This facilitates the enhancement of system regulation efficiency and stability.
5.2. Simulation Results Analysis and Discussion
5.2.1. An Analysis of the Differences in Cabin Temperature
Figure 12a,b depict the variations in cabin temperature over time under the four control strategies for target temperatures of 20 °C and 25 °C, respectively. In combination with the quantitative assessment metrics from Table 4, it is evident that all four control strategies successfully regulate the cabin temperature to the target value. However, significant differences are observed in their dynamic transient responses.
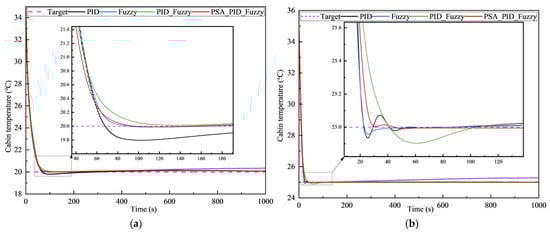
Figure 12.
Variations in cabin temperature and compressor speed under four control methods. (a) Target temperature of 20 °C; (b) target temperature of 25 °C.
Table 4.
Evaluation metrics.
For both target temperatures, the conventional PID control strategy exhibits the most aggressive initial temperature pull-down but suffers from the highest temperature overshoot, reaching 0.214 °C at 20 °C and 0.084 °C at 25 °C. While the PID strategy achieves the fastest response time, it also results in significant overshoot and continued fluctuations after reaching the target temperature. This under-damped response prolongs the time required to achieve true stability within the acceptable error band, as reflected in the relatively longer adjustment times shown in Table 2, which are 245.11 s at 20 °C and 49.53 s at 25 °C. Furthermore, the PID strategy shows larger steady-state errors compared to the PSA-Optimized strategy, measuring 0.078 °C at 20 °C and 0.11 °C at 25 °C. In contrast, the PSA-Optimized control strategy demonstrates the best overall dynamic performance and steady-state accuracy. Its temperature trajectory shows a smooth approach to the target value with minimal overshoot, measuring only 0.010 °C at 20 °C and 0.012 °C at 25 °C. The system quickly converges to the desired temperature without significant subsequent oscillations, indicating a highly stable and well-damped transient response. This superior dynamic behavior allows the PSA-Optimized strategy to achieve the smallest steady-state error and the fastest adjustment times, approximately 74.12 s for 20 °C and 27.76 s for 25 °C. It effectively maintains the desired temperature with high precision once stability is reached.
The fuzzy and PID-fuzzy strategies exhibit intermediate dynamic performance compared to the PID and PSA-Optimized strategies. Fuzzy control shows a slower initial response but smaller overshoot than PID control. PID-fuzzy control attempts to combine features but results in varying overshoot and slower settling for the 25 °C target compared to PSA-Optimized control.
5.2.2. An Analysis of the Differences in Compressor Speed and Working Fluid Flow
Figure 13a,b illustrate the variations in compressor speed under the four control strategies, while Figure 14a,b compare the changes in the refrigerant mass flow rate. Analyzing the dynamic behavior of these primary actuators is essential for understanding how different control strategies manage cooling capacity during transient periods and thus impact the refrigeration system’s overall performance, especially in terms of cabin temperature response, as seen in Figure 10.
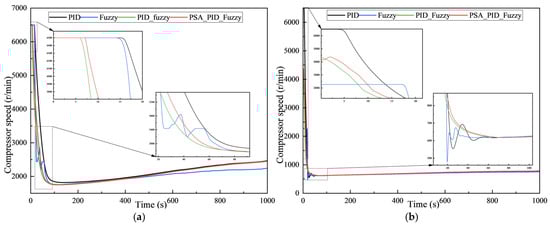
Figure 13.
Variations in compressor speed under four control methods. (a) Target temperature of 20 °C; (b) target temperature of 25 °C.
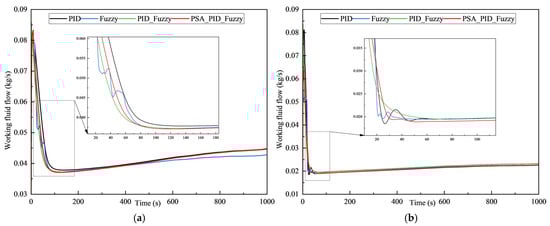
Figure 14.
Variations in working fluid flow under four control methods. (a) Target temperature of 20 °C; (b) target temperature of 25 °C.
During the initial cooling pull-down phase, at the 20 °C target temperature (Figure 11a), all strategies except for the fuzzy control exhibit a very rapid ramp-up of compressor speed to the maximum of 6500 r/min. The compressor speed for fuzzy control also increases towards maximum but with a noticeably slower initial rate. This rapid increase in speed directly results in a sharp increase in refrigerant flow rate, as shown in Figure 14a, providing maximum cooling capacity for quick temperature reduction. At the 25 °C target temperature, as shown in Figure 13b, the PID, PID-fuzzy, and PSA-Optimized strategies still show a fast initial speed increase. However, fuzzy control demonstrates a significantly slower initial speed ramp-up. The corresponding flow rate curves in Figure 14b reflect these differences in how quickly maximum cooling capacity is made available.
As the cabin temperature gradually decreases and approaches the target value (referencing Figure 12), both the compressor speed and working fluid flow rate are actively modulated by the controllers to regulate the cooling output. This dynamic modulation phase reveals crucial differences in how smoothly and effectively each strategy controls the system. For instance, the conventional PID control strategy, as the temperature approaches the target, shows significant oscillations in its speed and flow commands (Figure 13 and Figure 14) during the temperature settling process. This fluctuating actuator behavior directly contributes to the temperature oscillations observed in Figure 10, indicating less stable dynamic control over the refrigeration cycle. The fuzzy control strategy, while potentially having a less aggressive initial ramp-up (especially at 25 °C), shows some degree of fluctuation or slower convergence in its speed and flow modulation during the regulation phase (Figure 13 and Figure 14) compared to the PID strategy; its dynamic regulation might not be sufficiently precise.
Frequent and excessively high compressor speed fluctuations can lead to increased energy consumption. Compared to the strategies mentioned above, the PSA-Optimized control strategy demonstrates remarkably smooth and stable dynamic modulation of both compressor speed (Figure 13) and working fluid flow (Figure 14) as the system approaches and settles at the target temperature. The curves show minimal oscillations and faster, smoother convergence to the required steady-state values. This precise and stable actuator control during the transient phase is a key factor enabling the PSA-Optimized strategy to achieve the minimal temperature overshoot and rapid, smooth settling observed in Figure 12.
In summary, compared to the other three control strategies, the PSA-Optimized control strategy exhibits superior dynamic performance in controlling compressor speed and working fluid flow. This is characterized by more stable speed variations, less dynamic fluctuation, and faster, smoother convergence, directly translating into the enhanced temperature control performance discussed in Section 5.2.1.
5.2.3. An Analysis of the Differences in Battery Temperature and SOC
The state of charge (SOC) of the battery reacts to the current remaining charge, ranging from 0 to 100%, and the initial SOC is set to 95% in this experiment.
In order to facilitate the comparative analysis, the SOC is normalized according to the initial value:
As shown in Figure 15 and Figure 16, under the four strategies, both the battery’s state of charge (SOC) and temperature show a consistent downward trend, remaining in a constant decrease throughout. A comparison with the graph of compressor speed change over time (Section 5.2.2) reveals that fuzzy control has relatively poor self-regulation in the stabilization stage. Additionally, a lower compressor speed slows SOC consumption and causes the actual temperature to deviate from the target value. At a target temperature of 20 °C, the PSA-Optimized control strategy demonstrates the smallest SOC drop rate during the system’s initial regulation phase, and the SOC is higher after the stabilization stage compared to both traditional PID and fuzzy PID control strategies, indicating superior dynamic regulation performance. Table 5 shows that the battery temperature under the PSA-Optimized control strategy is lower compared to the other three strategies, respectively, while the battery SOC remains the highest.
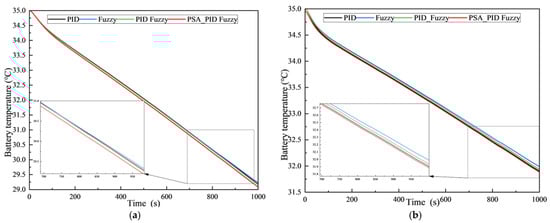
Figure 15.
Battery temperature under four control methods. (a) Target temperature of 20 °C; (b) target temperature of 25 °C.
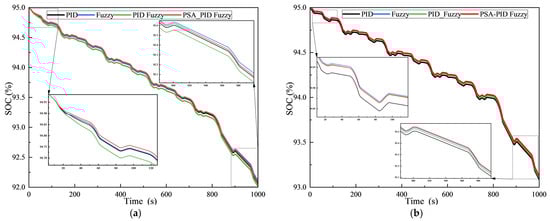
Figure 16.
Battery SOC under four control methods. (a) Target temperature of 20 °C; (b) target temperature of 25 °C.
Table 5.
Evaluation metrics.
5.2.4. An Analysis of the Differences in Compressor Power Consumption and COP
The coefficient of performance (COP) of an air conditioning system is a key indicator of its energy efficiency, representing the ratio of the system output cooling or heating capacity to the input energy. The following is the formula used to calculate the COP of the dual-evaporator air conditioning system in this design:
where represents the absorbed heat by the dual evaporators, and represents the power consumption of the compressor and the pump.
Figure 17a,b show the changes in compressor power consumption under different strategies. Evidently, the trend of variation in compressor power consumption is comparable across the four strategies, and disparities are only detectable at the peak values. As the system response stabilizes, the power consumption under the PSA-Optimized control strategy is lower than that of the other three strategies. As indicated in Table 6, at target temperatures of 20 °C and 25 °C, the PSA-Optimized control strategy generates more heat with lower power consumption during the compressor adjustment phase. Compared to conventional PID control, the PSA-Optimized system achieves a COP improvement of 0.14 and 0.06, respectively.
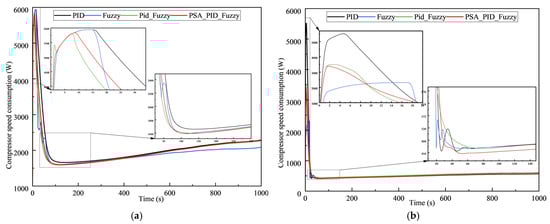
Figure 17.
Compressor power consumption under four control methods. (a) Target temperature of 20 °C; (b) target temperature of 25 °C.
Table 6.
Evaluation metrics.
Compared to the other three control strategies, the PSA-Optimized control framework developed in this study demonstrates significant advantages in minimizing peak temperature overshoot and steady-state error. This controller not only achieves high-precision control and exceptional response performance but also optimizes compressor speed to ensure synchronized battery temperature reduction, slow down the SOC decline rate, and effectively enhance cooling capacity and energy efficiency.
6. Conclusions
This study proposes a PSA-Optimized speed control strategy for air conditioning (AC) systems. By leveraging an AC system model, the comprehensive performance of the proposed strategy is thoroughly validated. Based on simulation results obtained from an experimentally calibrated model, the following key conclusions are drawn:
- Compared to the traditional PID control strategy, the PSA-Optimized control significantly reduces cabin temperature overshoot and improves steady-state control accuracy. Specifically, PSA-Optimized limits overshoot to just 0.010 °C when the target is 20 °C and 0.012 °C when the target is 25 °C, values substantially lower than PID’s overshoot of 0.214 °C at 20 °C and 0.084 °C at 25 °C. The steady-state error is also significantly minimized, measuring 0.066 °C versus PID’s 0.078 °C at 20 °C, and 0.02 °C versus PID’s 0.11 °C at 25 °C. Furthermore, the PSA-Optimized strategy achieves much faster adjustment times, approximately 74.12 s compared to PID’s 245.11 s at 20 °C, and 27.76 s compared to PID’s 49.53 s at 25 °C, ensuring rapid and smooth convergence to the target temperature with minimal fluctuations.
- The PSA-Optimized strategy effectively reduces compressor speed fluctuations and enables smooth speed adjustments, as shown in Figure 11 and Figure 12, particularly when compared to the more oscillatory behavior of traditional PID control. This superior dynamic control over the actuator contributes to improved system stability and responsiveness during transient phases and in the presence of disturbances.
- The PSA-Optimized control system exhibits enhanced performance in terms of compressor power consumption and the coefficient of performance (COP) of the air conditioning system. As indicated in Table 4, compared to traditional PID control, the PSA-Optimized system achieves a notably higher average COP. For example, at a target temperature of 20 °C, its COP is 3.45 compared to PID’s 3.31, and at 25 °C, its COP is 3.68 compared to PID’s 3.62. This improved energy efficiency also contributes to mitigating the rate of SOC decline in the battery system.
Overall, the PSA-Optimized control strategy enables precise cabin temperature regulation while minimizing overshoot and steady-state errors. These findings validate the superiority of the proposed control approach and highlight its feasibility for practical applications. Nevertheless, since this study is currently simulation-based, thorough real-time performance analysis and validation will be crucial for advancing the intelligent control strategy towards practical hardware implementation.
Author Contributions
Conceptualization, L.Y. and K.X.; methodology, L.Y. and J.W.; validation, W.Y., L.Y. and K.X.; data curation, writing—original draft preparation, writing—review and editing, L.Y.; funding acquisition, K.X. and J.W. All authors have read and agreed to the published version of the manuscript.
Funding
This research was supported in part by the National Natural Science Foundation of China, under grant 52307064.
Data Availability Statement
No datasets were generated or analyzed during the current study.
Conflicts of Interest
Author Wei Yu was employed by the company Hella Shanghai Electronics Co., Ltd. The remaining authors declare that the research was conducted in the absence of any commercial or financial relationships that could be construed as a potential conflict of interest.
References
- IPCC. Climate Change 2023: Mitigation of Climate Change. Working Group III Contribution to the Sixth Assessment Report; Cambridge University Press: Cambridge, UK, 2023; pp. 456–459. [Google Scholar]
- Prakhar, P.; Jaiswal, R.; Gupta, S.; Tiwari, A.K. Electric Vehicles in Transition: Opportunities, Challenges, and Research Agenda—A Systematic Literature Review. J. Environ. Manag. 2024, 372, 123415. [Google Scholar] [CrossRef] [PubMed]
- IEA. Global EV Outlook 2024; International Energy Agency: Paris, France, 2024. [Google Scholar]
- Li, X.; Wang, R. Towards integrated thermal management systems in battery electric vehicles: A review. eTransportation 2025, 24, 100396. [Google Scholar] [CrossRef]
- Zou, H.M.; Tang, Z.H.; Yang, T.Y.; Tian, C.Q. Research progress on thermal management technology of electric vehicles. J. Refrig. 2022, 43, 15–27+56. [Google Scholar]
- Li, Z.; Zhang, H.; Sheng, L. Research progress on immersion cooling technology for lithium -ion batteries in new energy vehicles. J. Refrig. 2024, 45, 38–49. [Google Scholar]
- Zhao, G.; Wang, X.; Negnevitsky, M.; Zhang, H. A review of air-cooling battery thermal management systems for electric and hybrid electric vehicles. J. Power Sources 2021, 501, 230001. [Google Scholar] [CrossRef]
- Gharehghani, A.; Rabiei, M.; Mehranfar, S.; Saeedipour, S.; Mahmoudzadeh Andwari, A.; García, A.; Mico Reche, C. Progress in battery thermal management systems technologies for electric vehicles. Renew. Sustain. Energy Rev. 2024, 202, 114654. [Google Scholar] [CrossRef]
- Maiorino, A.; Cilenti, C.; Petruzziello, F.; Aprea, C. A review on thermal management of battery packs for electric vehicles. Appl. Therm. Eng. 2024, 238, 122035. [Google Scholar] [CrossRef]
- Lee, J.T.; Kwon, S.; Lim, Y.; Chon, M.S.; Kim, D. Effect of Air-Conditioning on Driving Range of Electric Vehicle for Various Driving Modes. In Proceedings of the Asia Pacific Automotive Engineering Conference, Bangkok, Thailand, 1–3 April 2013. SAE Technical Paper. [Google Scholar]
- Mancini, N.; Mardall, J.S.M.; Kopitz, J.; Raymond, O.C.; Hanks, D.F.; Li, H. Optimal Source Electric Vehicle Heat Pump with Extreme Temperature Heating Capability and Efficient Thermal Preconditioning. U.S. Patent No. 2019/0070924A1, 6 April 2021. [Google Scholar]
- Lu, J.; Song, Q.; Fang, Y. Analysis of control strategies for the Tesla Model Y heat pump air conditioning system. Automobile Parts 2023, 40, 7–18. [Google Scholar] [CrossRef]
- Dan, D.; Zhao, Y.; Wei, M.; Wang, X. Review of thermal management technology for electric vehicles. Energies 2023, 16, 4693. [Google Scholar] [CrossRef]
- Zhang, R.R.; Stanke, E.J.; Zhang, G.X.; Lu, Y.C.; Sun, X.L.; Li, X.L. Benefits investigation of electronic expansion valve in electric vehicle thermal system as compared to thermal expansion valve with shut—Off valve. Int. J. Refrig. 2019, 100, 404–413. [Google Scholar] [CrossRef]
- Kim, H.; Hong, J.; Choi, H.; Oh, J.; Lee, H. Development of PCM-based shell-and-tube thermal energy storages for efficient EV thermal management. Int. Commun. Heat Mass Transf. 2024, 154, 107401. [Google Scholar] [CrossRef]
- Jino, L.; Kumar, A.V.; Doley, S.; Berlin, M.; Jacob, A.; Natarajan, N. Revolutionizing EV battery cooling: Innovative hybrid nanofluid solution in an inverted right-angled triangular porous cavities for enhanced thermal regulation via natural convection. J. Energy Storage 2024, 94, 112470. [Google Scholar] [CrossRef]
- Zhang, Z.; Wang, J.; Feng, X.; Chang, L.; Chen, Y.; Wang, X. The solutions to electric vehicle air conditioning systems: A review. Renew. Sustain. Energy Rev. 2018, 91, 443–463. [Google Scholar] [CrossRef]
- Hao, S.; Han, K.; Wang, Y.; Liu, Q. Vapor compression cycle-based integrated thermal management systems for electric vehicles: A critical review. Energy Convers. Manag. 2024, 321, 119072. [Google Scholar] [CrossRef]
- Ko, J.; Jeong, J.H. Status and challenges of vapor compression air conditioning and heat pump systems for electric vehicles. Appl. Energy 2024, 375, 124095. [Google Scholar] [CrossRef]
- Yordanova, S.; Merazchiev, D.; Jain, L. A two-variable fuzzy control design with application to an air-conditioning system. IEEE Trans. Fuzzy Syst. 2015, 23, 474–481. [Google Scholar] [CrossRef]
- George, M.; Kamath, D.; Kurian, C. Electronically tunable ACO-based fuzzy FOPID controller for effective speed control of electric vehicles. IEEE Access 2021, 9, 73392–73412. [Google Scholar] [CrossRef]
- Krishnamoorthy, S.K.; Das, N.; Gudimetla, P.; Emami, K. Enhanced speed control for BLDC motors using WOA-integrated PID controller optimization. IEEE Access 2024, 12, 162465–162475. [Google Scholar] [CrossRef]
- Huang, X.; Li, K.; Xie, Y.; Liu, B.; Liu, J.; Liu, Z.; Mou, L. A novel multistage constant compressor speed control strategy of electric vehicle air conditioning system based on genetic algorithm. Energy 2022, 241, 122903. [Google Scholar] [CrossRef]
- Gao, Y. PID-based search algorithm: A novel metaheuristic algorithm based on PID algorithm. Expert Syst. Appl. 2023, 232, 120886. [Google Scholar] [CrossRef]
- Xie, Z.; Cao, T. Adaptive impedance matching of medium voltage power line carrier communication based on PSA. Power Syst. Prot. Control 2024, 52, 45–52. [Google Scholar] [CrossRef]
- Zhu, M.; Zhang, J.; Bu, L.; Nie, S.; Bai, Y.; Zhao, Y.; Mei, N. Methodology and experimental verification for predicting the remaining useful life of milling cutters based on hybrid CNN-LSTM-attention-PSA. Machines 2024, 12, 752. [Google Scholar] [CrossRef]
- GB/T 12782-2022; Requirements and test methods for motor vehicle heating performance. China Standards Press: Beijing, China, 2022.
- Bernardi, D.; Pawlikowski, E.; Newman, J. A general energy balance for battery systems. J. Electrochem. Soc. 1985, 132, 5. [Google Scholar] [CrossRef]
- Kim, W.G.; Kim, C.K.; Lee, J.T.; Yun, C.W.; Yook, S.J. Characteristics of nanoparticle emission from a light-duty diesel vehicle during test cycles simulating urban rush-hour driving patterns. J. Nanoparticle Res. 2018, 20, 94. [Google Scholar] [CrossRef]
- Cheng, R.; Zhang, W.; Yang, J.; Wang, S.; Li, L. Analysis of the Effects of Different Driving Cycles on the Driving Range and Energy Consumption of BEVs. World Electr. Veh. J. 2025, 16, 124. [Google Scholar] [CrossRef]
Disclaimer/Publisher’s Note: The statements, opinions and data contained in all publications are solely those of the individual author(s) and contributor(s) and not of MDPI and/or the editor(s). MDPI and/or the editor(s) disclaim responsibility for any injury to people or property resulting from any ideas, methods, instructions or products referred to in the content. |
© 2025 by the authors. Licensee MDPI, Basel, Switzerland. This article is an open access article distributed under the terms and conditions of the Creative Commons Attribution (CC BY) license (https://creativecommons.org/licenses/by/4.0/).