1. Introduction
With the intensification of global environmental issues, atmospheric pollution mitigation and energy conservation have become core priorities for the international community. In the energy sector, combined heat and power (CHP) systems have been widely adopted in large-scale district heating projects due to their high energy efficiency [
1,
2]. Current research on improving the flexibility of heating systems predominantly focuses on external thermal storage devices [
3]. For example, Benalcazar et al. developed a Mixed-Integer Linear Programming (MILP) model to jointly optimize thermal storage tank capacity and annual operational scheduling in CHP systems [
4]. Wang et al. quantified the flexibility enhancement of CHP systems through a dynamic model integrating heat pumps, analyzing the decoupling effects of electro-thermal strategies [
5]. Although these standalone thermal storage methods partially resolve the spatiotemporal conflicts between heat plant operations and heating demands, they involve high hardware investment costs and spatial limitations. The proposed bypass thermal storage (BTS) technology offers a novel pathway for optimizing heating systems. Wang et al. maximized thermal storage benefits by reconfiguring the topology of district heating networks (DHNs), and implementing bypass branches on the primary side of heat exchange stations [
6]. This approach directly utilizes the sensible heat of circulating water in pipelines to store surplus thermal energy from power plants, bypassing traditional reliance on standalone tanks. Kouhia et al. further quantified the technical potential of DHNs as short-term thermal storage media, confirming the economic feasibility of BTS in enhancing CHP system flexibility [
7]. Compared to conventional solutions, BTS technology actively designs bypass pipelines to store excess heat in the circulating water of heating networks, achieving intraday load shifting without requiring large-scale storage equipment. This reduces the required capacity of peak-shaving heat sources, lowers system construction costs, and improves energy efficiency by shortening heat source operation time. Additionally, BTS reconstructs the operational paradigm of heat exchange stations through hydraulic decoupling: traditional stations suffer from mutual interference due to hydraulic coupling, while bypass pipelines establish pressure buffer interfaces, enabling independent control of each station and enhancing supply–demand balance accuracy [
8].
As critical infrastructure, the thermal storage capacity of DHNs depends on parameters such as pipeline water volume and baseline supply/return temperatures [
9]. These networks exhibit higher flexibility and environmental adaptability than traditional thermal storage tanks. In large-scale systems, indirect connections typically divide DHNs into primary networks (heat source to exchange stations) and secondary networks (exchange stations to end-users). Secondary networks directly serve users, and their operational characteristics and control strategies significantly impact heating quality and energy efficiency. Although primary network bypass technology improves flexibility through hydraulic decoupling, the high initial investment limits its widespread adoption. Therefore, this study focuses on secondary networks and their key control technologies.
In practical operations, achieving a supply–demand balance at heat exchange stations is essential for maintaining heating quality [
10]. However, due to inherent time delays, conventional feedback control struggles to adapt to rapid load variations and thermal source fluctuations. This study proposes a Model Predictive Control (MPC) strategy. MPC enables proactive adjustments by constructing a thermodynamic model to predict disturbance impacts and optimizing valve opening commands using real-time pipeline temperature and user load data. Recent studies have explored similar approaches: Knudsen et al. implemented an MPC-based coordinated thermal storage/discharge control strategy, reducing pressure fluctuations to ±3% and response times to 15 s in a Danish heat exchange station [
11]. X et al. developed a lightweight MPC algorithm (delay < 50 MS) integrated with a digital twin platform, improving dynamic response speeds by 40% [
12]. Existing research primarily optimizes control methods and operational stability, whereas this study emphasizes valve control performance to enhance supply–demand balance accuracy. Notably, mechanical limitations (e.g., dead zones, hysteresis) cause random fluctuations in the openings of heat exchange control valves and bypass control valves around their setpoints. These fluctuations induce flow deviations and pressure differential variations across bypass control valves, ultimately affecting secondary network supply temperatures and disrupting thermal balance [
13].
This study investigates two valves regulating bypass flow and heat exchange flow (specifically the heat exchange control valve and bypass control valve, hereafter collectively termed “control valves”) to analyze their flow characteristics and critical parameters (e.g., maximum/minimum controllable impedance) [
14] on the supply–demand balance of thermal substations, with numerical quantification of these effects. The findings will provide theoretical and technical guidance for optimizing secondary network control strategies, advancing the heating industry toward efficient, low-carbon, and stable operations.
2. Technical Methodology
As shown in
Figure 1, this figure illustrates the logical flow of the parameter calculation for control valves, with the calculations performed using MATLAB R2022a software. The process is divided into theoretical parameter calculation and actual parameter calculation, followed by an evaluation of the valve control accuracy. Below is a detailed logical description:
2.1. Theoretical Parameter Calculation Section
The theoretical parameter calculation is performed under ideal conditions, assuming that the valves have no dead zone and all parameters can be precisely controlled. This calculation provides benchmark data for evaluating the performance of the valves and the balance state of the network under ideal conditions. Through Formulas (1)–(4), (7), (9), and (12), the theoretical flow distribution, impedance distribution, valve opening degree, and secondary network supply water temperature are calculated, providing a reference for subsequent practical applications.
2.2. Actual Parameter Calculation Section
In practical applications, the valves have a dead zone, causing the actual opening degree to fluctuate near the set value. This directly affects the flow distribution and the secondary network’s supply water temperature. Therefore, the actual parameter calculation, based on the theoretical parameters, takes into account the influence of the dead zone. Through Formulas (13) and (14), the flow distribution is recalibrated, and through Formula (15), the actual supply water temperature of the secondary network is calculated. This process is closer to the real operating environment and can reflect the dynamic balance state of the actual network.
2.3. Comparison and Evaluation
By comparing the results of the theoretical parameter calculation and the actual parameter calculation, the impact of the valve dead zone on the network balance can be quantified [
15]. Comparing the flow distribution calculated theoretically and actually, the range of flow fluctuations caused by the dead zone can be assessed. Through Formula (12), the deviation of the secondary network supply water temperature between the theoretical and actual calculations can be evaluated. Based on the comparison results of the theoretical parameter calculation and the actual parameter calculation, the control accuracy of the control valves can be comprehensively evaluated [
16]. Through quantitative analysis, the optimal working conditions and applicable range of the valves can be identified, providing a scientific basis for the selection and design of the valves, ensuring that they meet the required performance standards in practical applications. This evaluation process not only helps to improve the control accuracy of the system but also provides valuable data support for subsequent optimization design.
3. Thermal Storage Scheme for Secondary Network Bypass Pipelines
Supply–Demand Balance Regulation of Thermal Substations under Secondary Network Bypass Conditions.
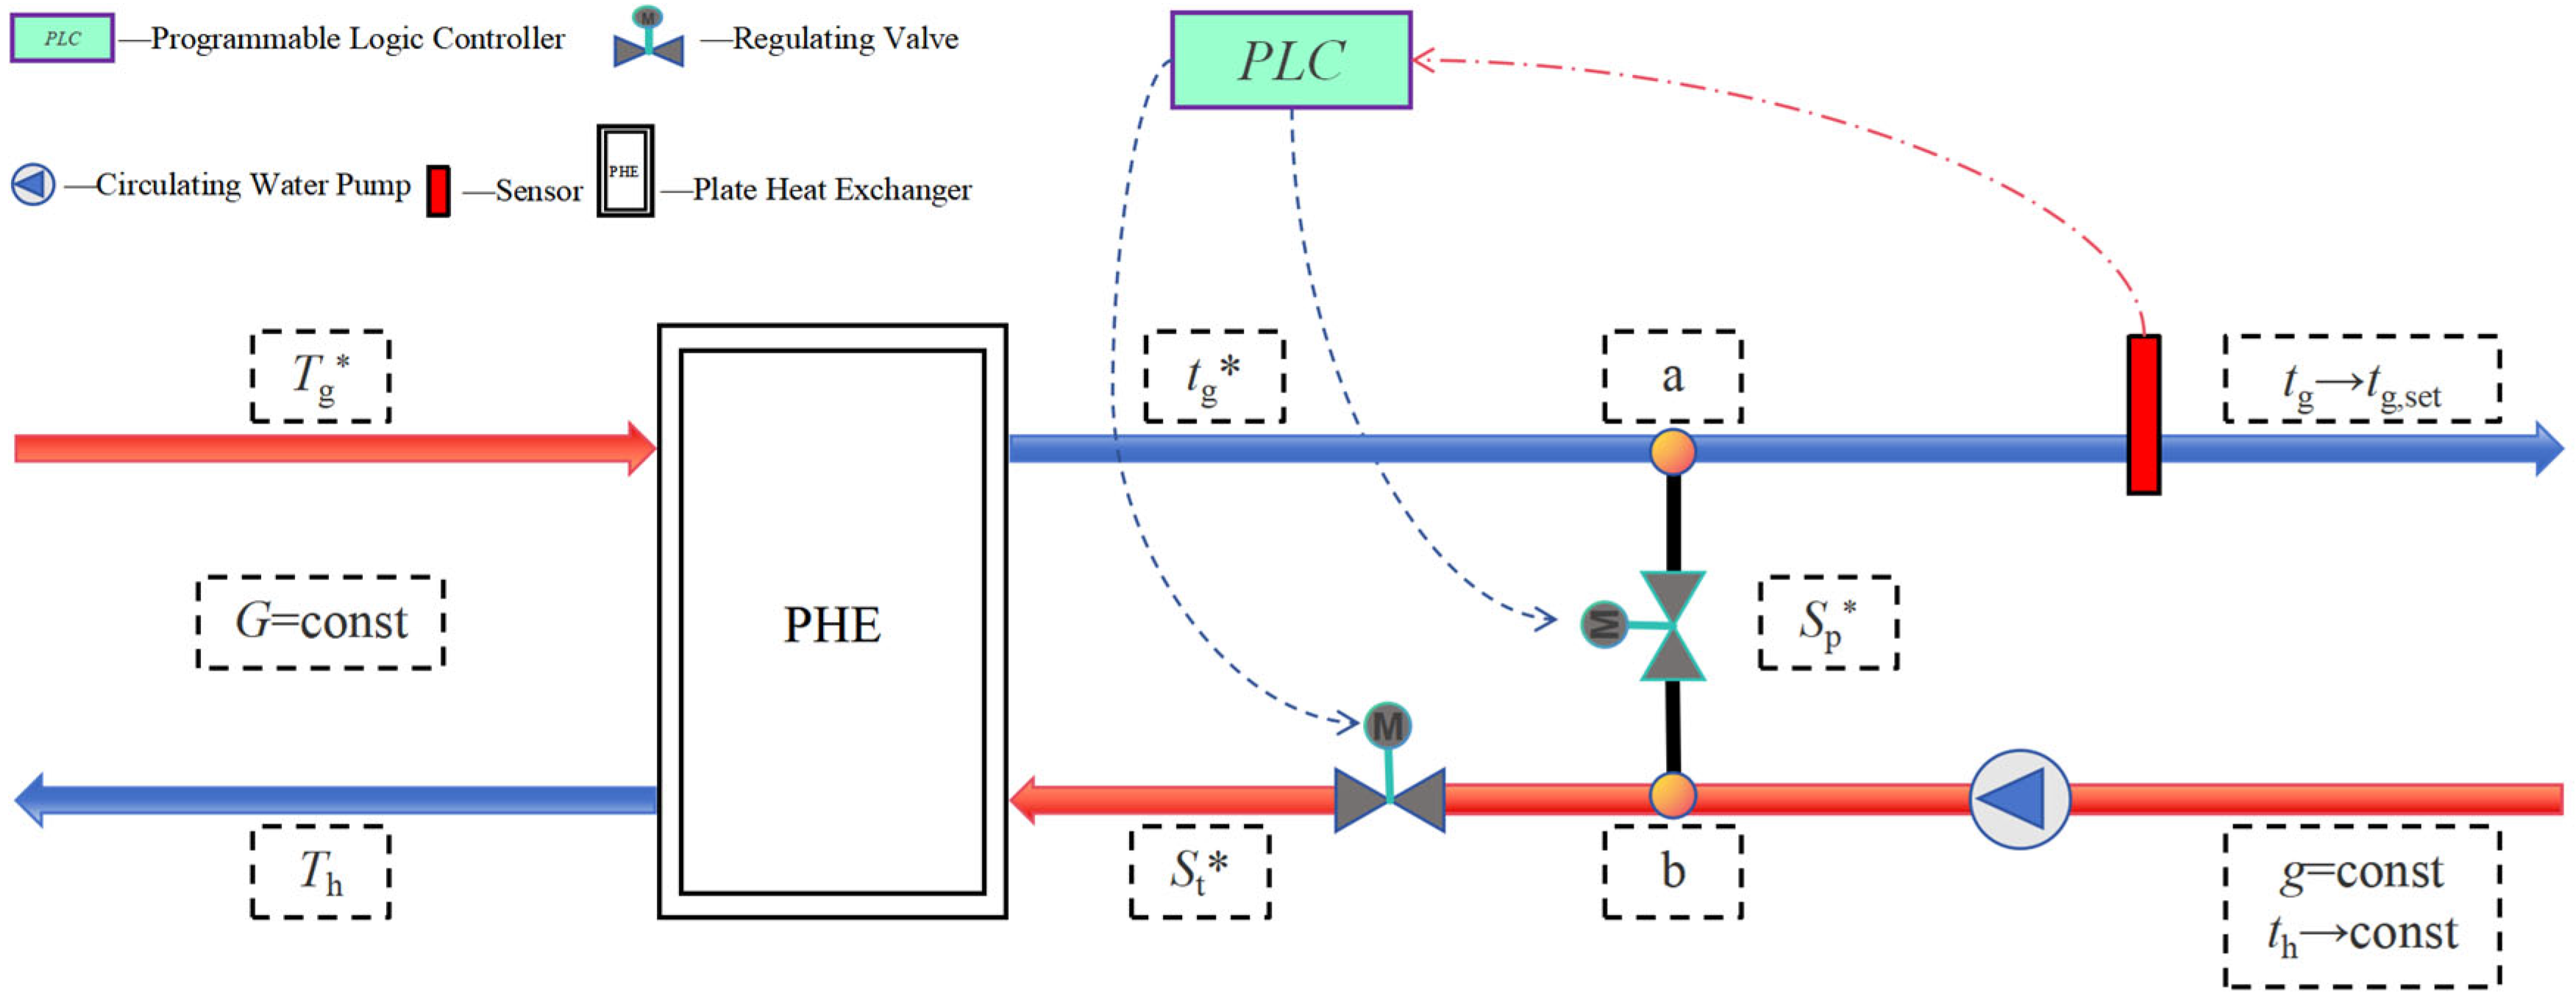
As illustrated in
Figure 2, the circulation flow rate on the primary side of the plate heat exchanger (PHE) remains constant, a configuration designed to ensure system stability and operational reliability. Maintaining a steady primary-side flow rate is critical for preserving thermal equilibrium and operational efficiency, thereby mitigating instability and potential equipment damage caused by flow fluctuations [
17]. For secondary network regulation, constant flow control (i.e., mass regulation) is implemented, ensuring hydraulic stability by minimizing pressure oscillations and hydraulic imbalances induced by flow variations. This approach guarantees a consistent heating service quality for end-users. Under this control strategy, the secondary network supply temperature exhibits a convergence trend toward the set point, while the return water temperature remains nearly constant, reflecting the thermal inertia of buildings [
18]. Furthermore, the PHE’s equivalent impedance in the secondary network is constant, enabling precise prediction and assessment of its hydraulic impacts during system design and commissioning [
19].
4. Research on Thermal-Hydraulic Parameters and Control Valve Characteristics of PHE
4.1. Thermal-Hydraulic Parameters of PHE
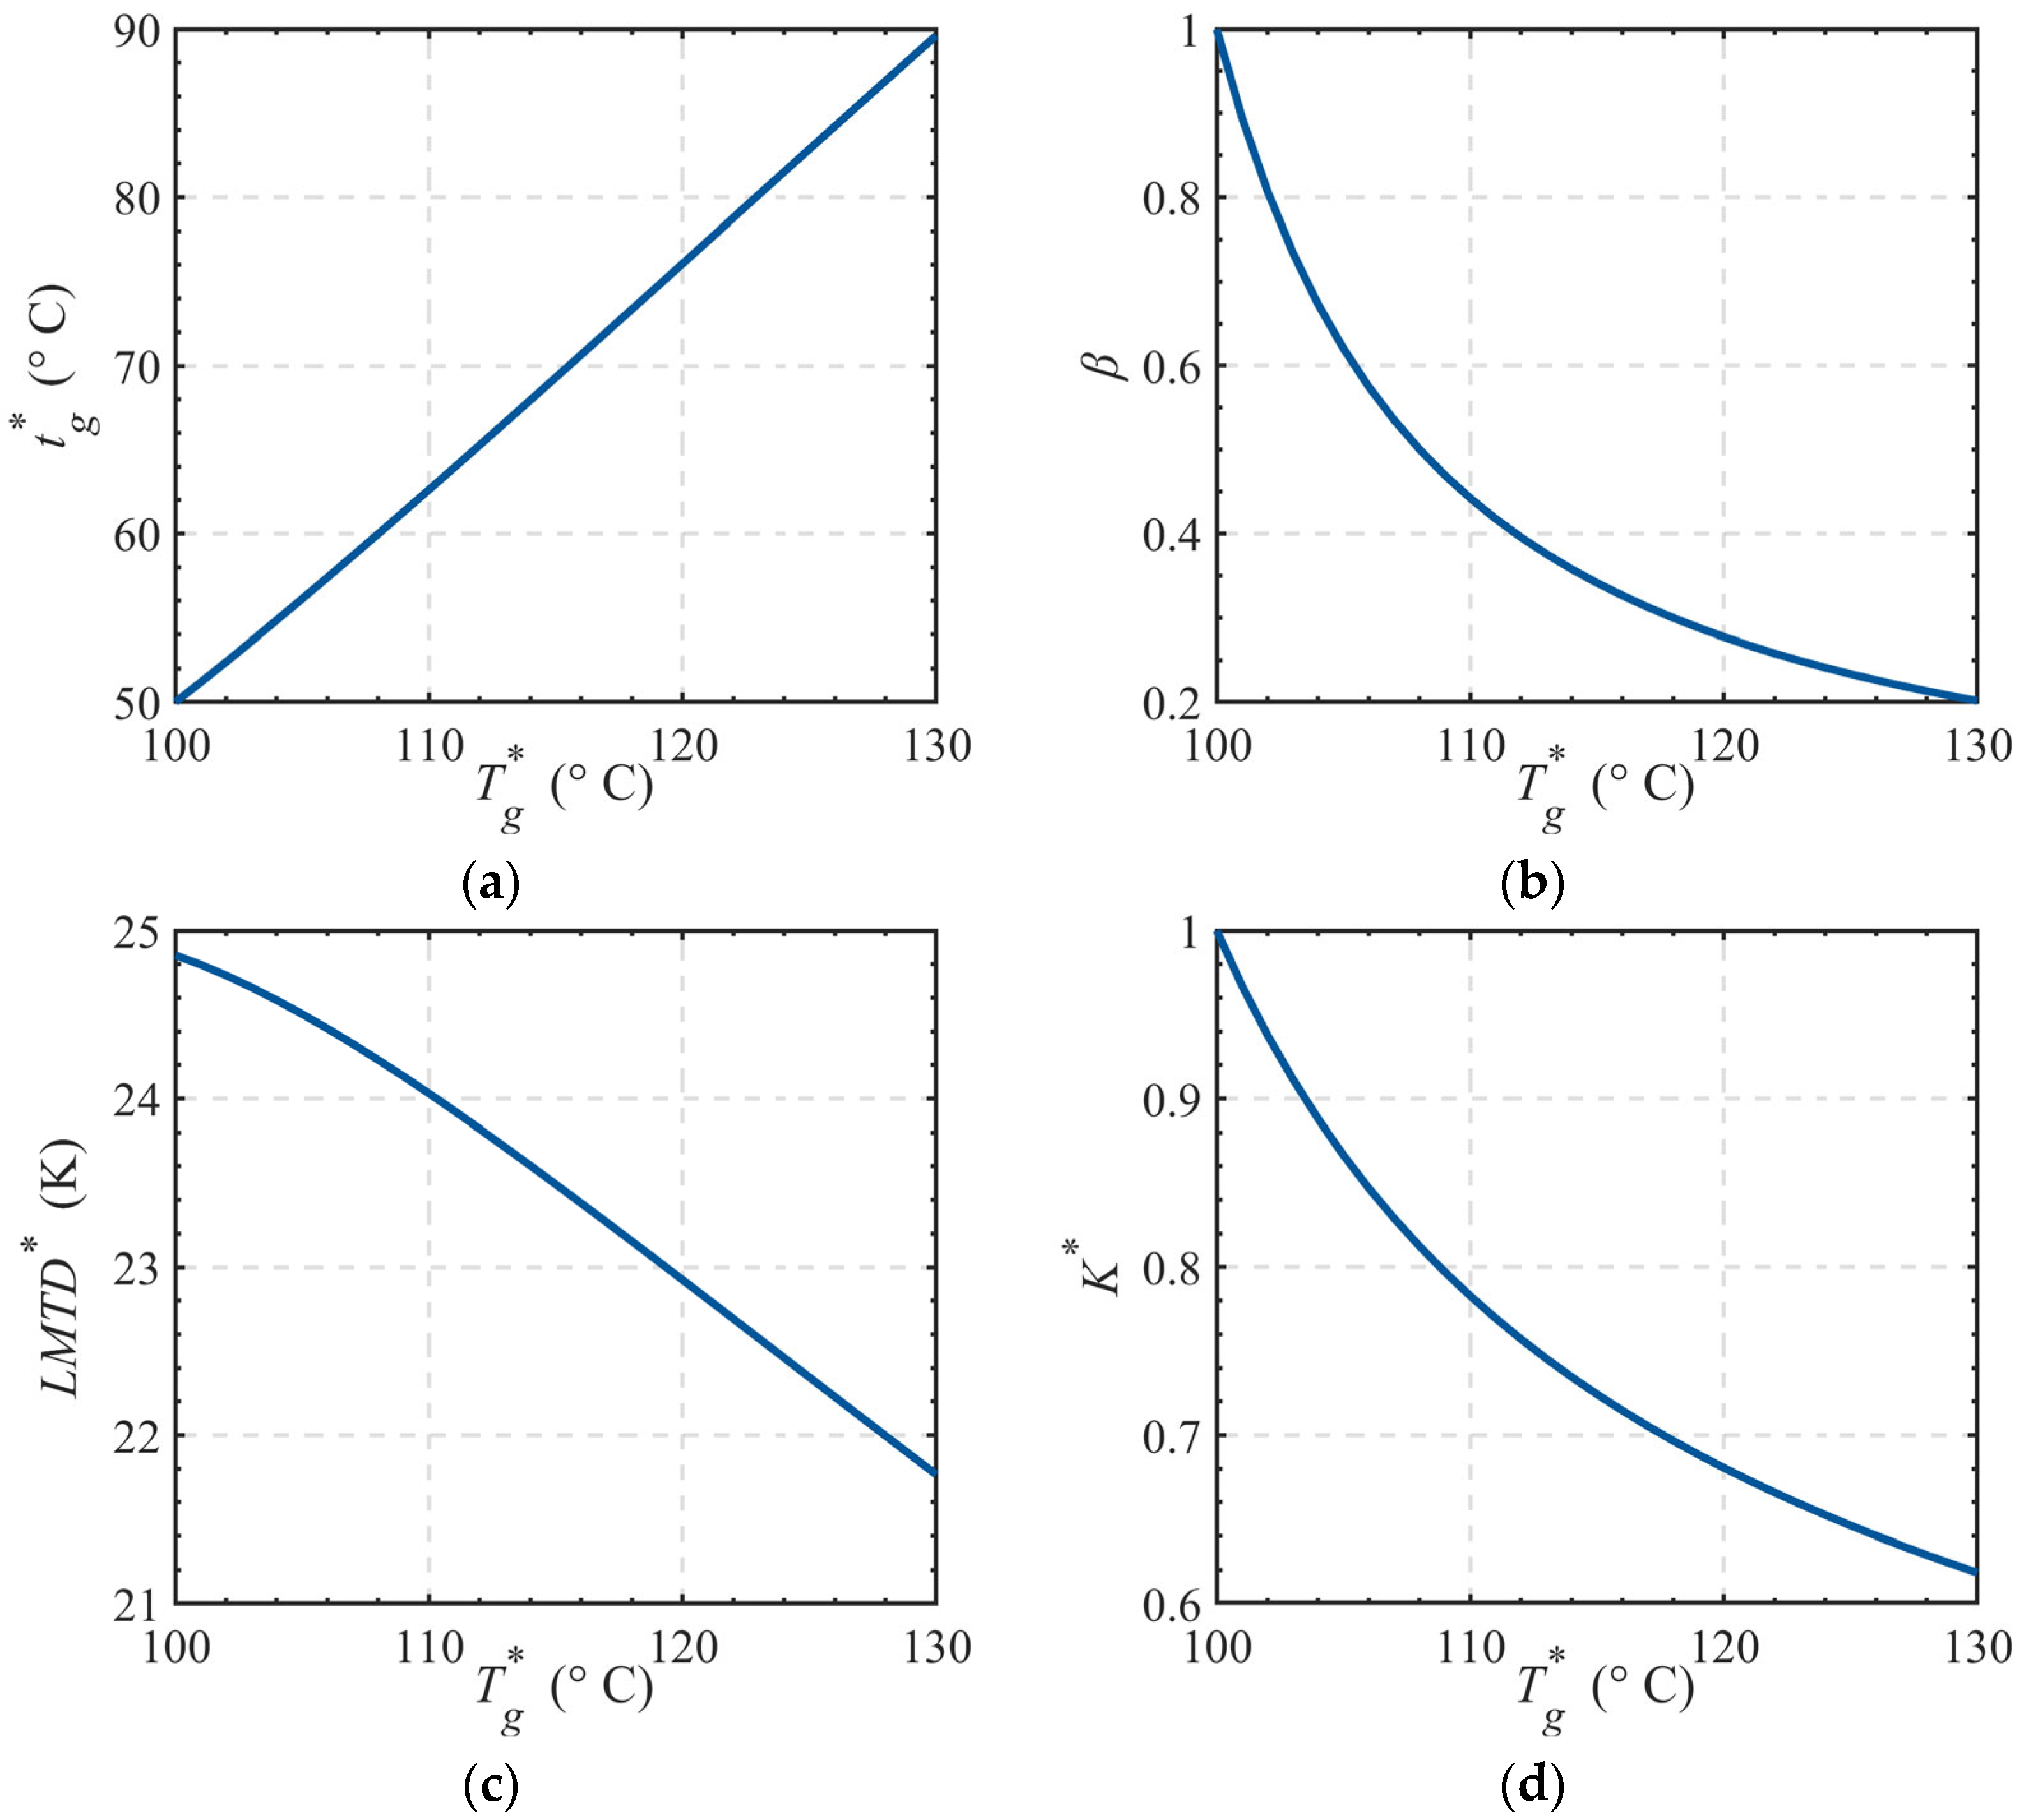
When circulation pumps operate at a fixed frequency, the equivalent impedance between points a and b remains constant, ensuring a stable secondary network circulation flow rate. During pump frequency adjustments, thermal substations dynamically adjust the impedance of the heat exchange control valve and bypass control valve to maintain constant heat transfer power in the plate heat exchanger. Since the heat supply on the demand side remains constant, the set heat supply equals the heat transfer capacity flowing through the heat exchange pipes. The heat flow ratio and heat exchange output temperature are calculated using the Equation (1):
Symbol definitions in Equation (1): cp is specific isobaric heat capacity of water, J/(kg∙°C); g is mass flow rate of heated water through the heat exchange, kg/s; tg,ref is baseline supply temperature of the secondary network, °C; th,ref is baseline return temperature of the secondary network, °C; β is heat exchange flow ratio on the secondary side of the plate heat exchanger (dimensionless); tg* is heat exchange output temperature, °C; B is empirical coefficient (constant value B = 0.3); LMTD is logarithmic mean temperature difference, °C; Tg,ref is baseline supply temperature of the primary network, °C; Th,ref is baseline return temperature of the primary network, °C; Tg* is actual supply temperature of the primary network, °C; Th* is actual return temperature of the primary network, °C.
The logarithmic mean temperature difference (LMTD) is calculated using Equation (2)
Based on Equations (1) and (2), the quantitative expressions for the relative heat transfer coefficient and the adjusted logarithmic mean temperature difference are formulated as Equation (3).
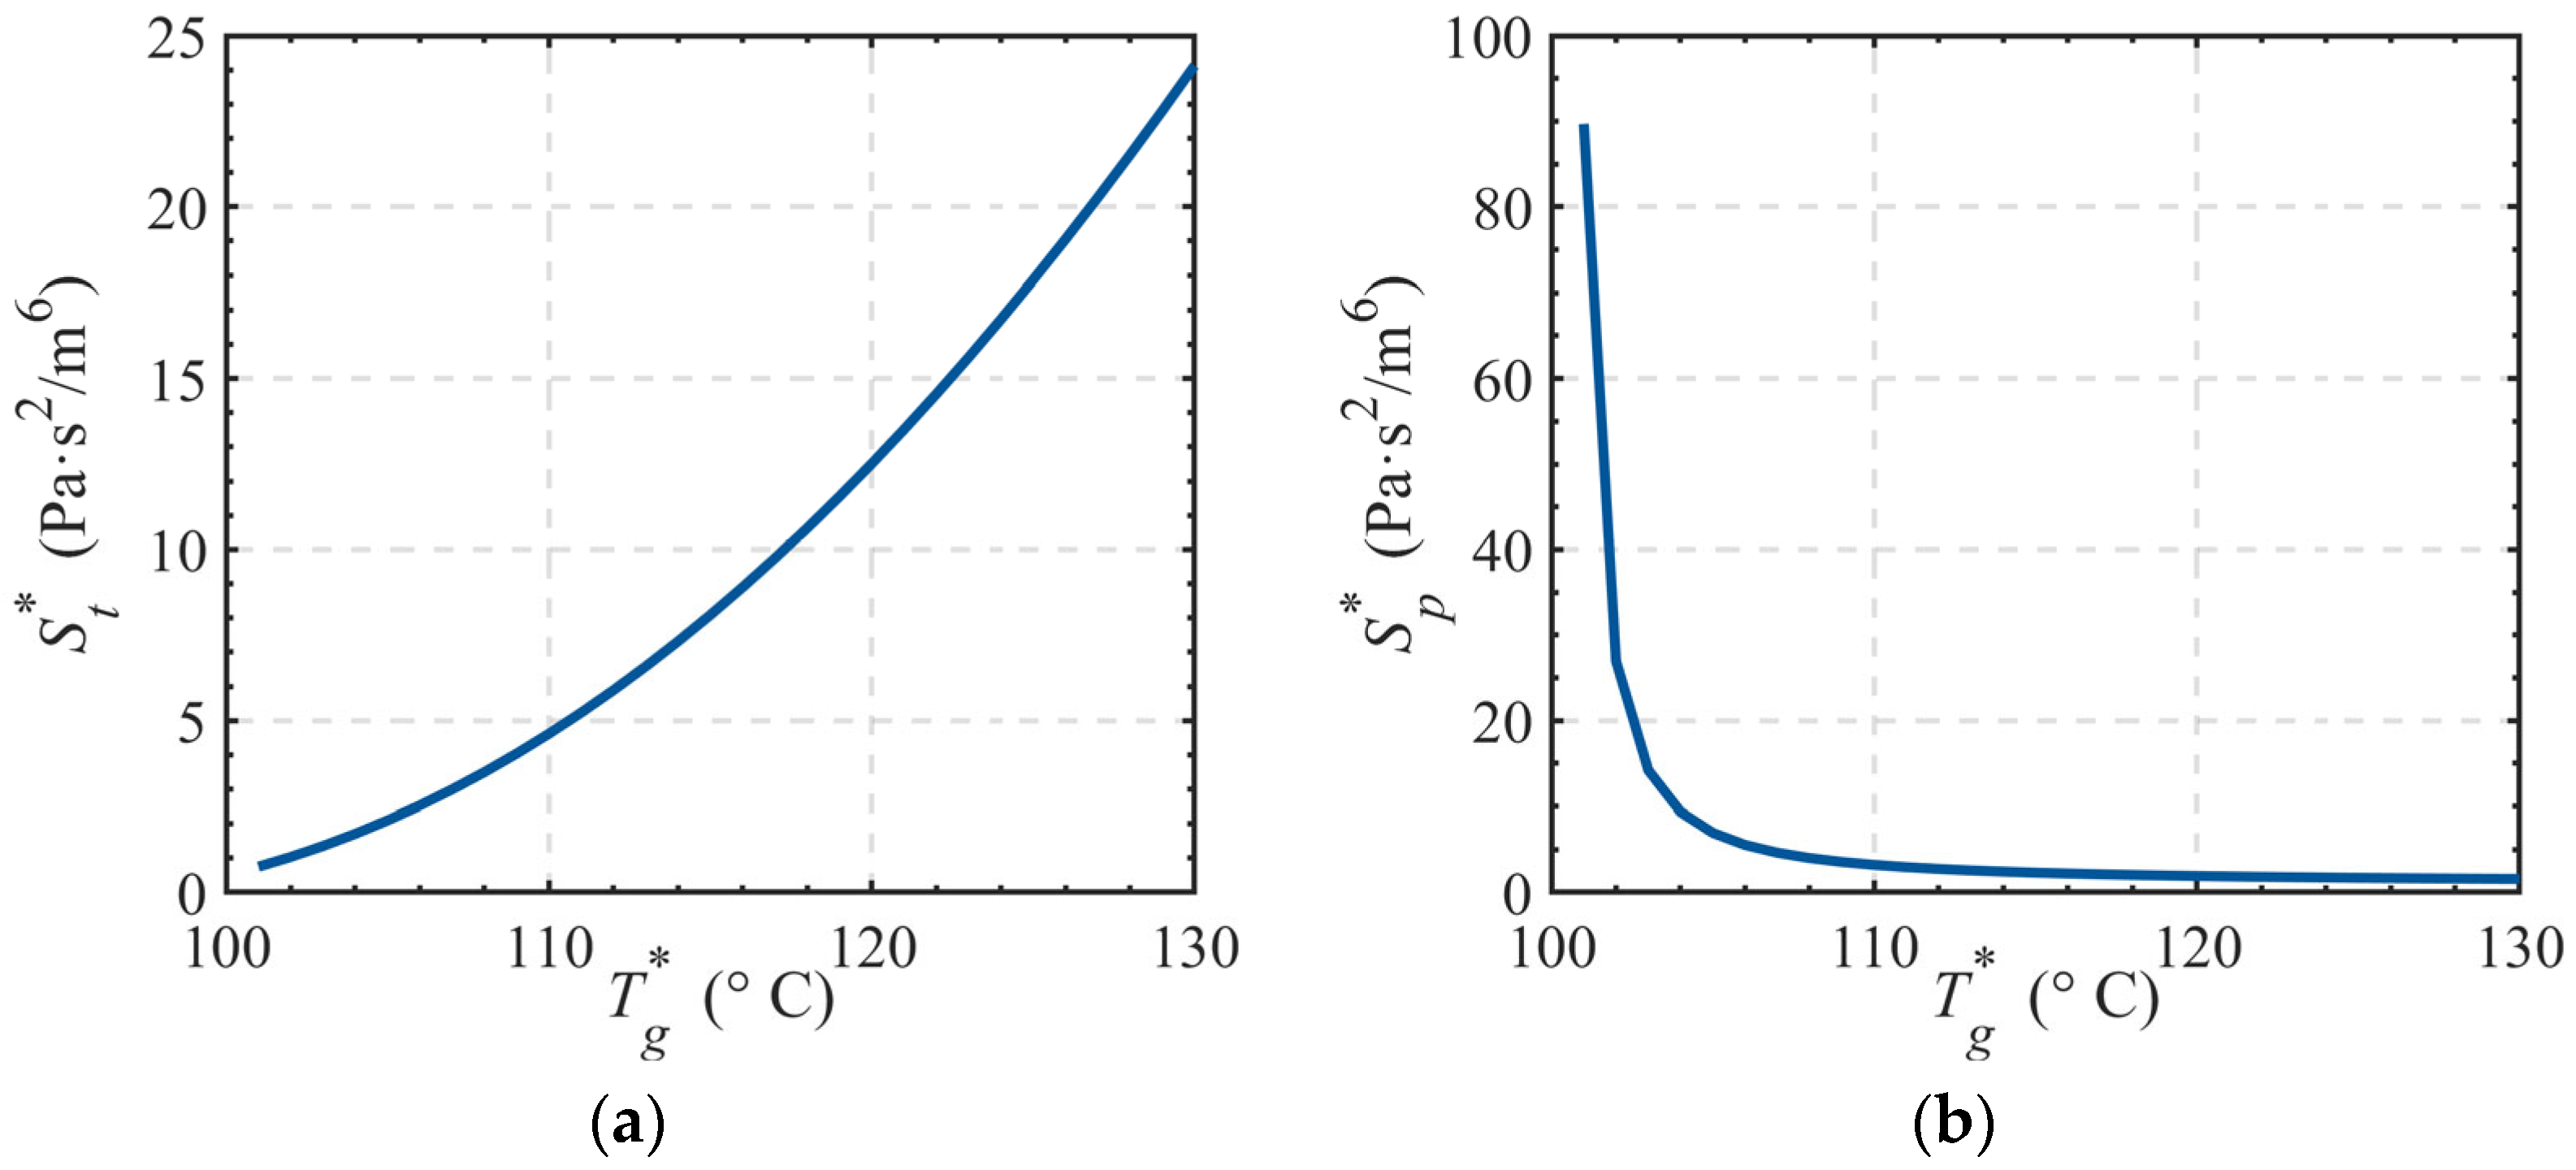
4.2. Control Valve Impedance
In the calculation of heating network impedance, the equivalent impedance between points a and b remains constant. This impedance value corresponds to the original pipeline (i.e., the equivalent impedance of the secondary network without the addition of a bypass pipe). After topological reconstruction, the new equivalent impedance consists of two parts: one is the equivalent impedance of the heat regulation valve and plate heat exchanger in series in the secondary network; the other is the impedance of the bypass control valve. These two parts of the impedance are ultimately combined in parallel to form the reconstructed equivalent impedance.
Impedance Calculation for Heat Exchange and Bypass Control Valves under Different Primary Network Supply Temperatures.
Symbol definitions in Equation (4): Sh is the equivalent impedance of plate heat exchanger in secondary network; St* is impedance of the heat exchange control valve; Sp* is impedance of bypass control valve.
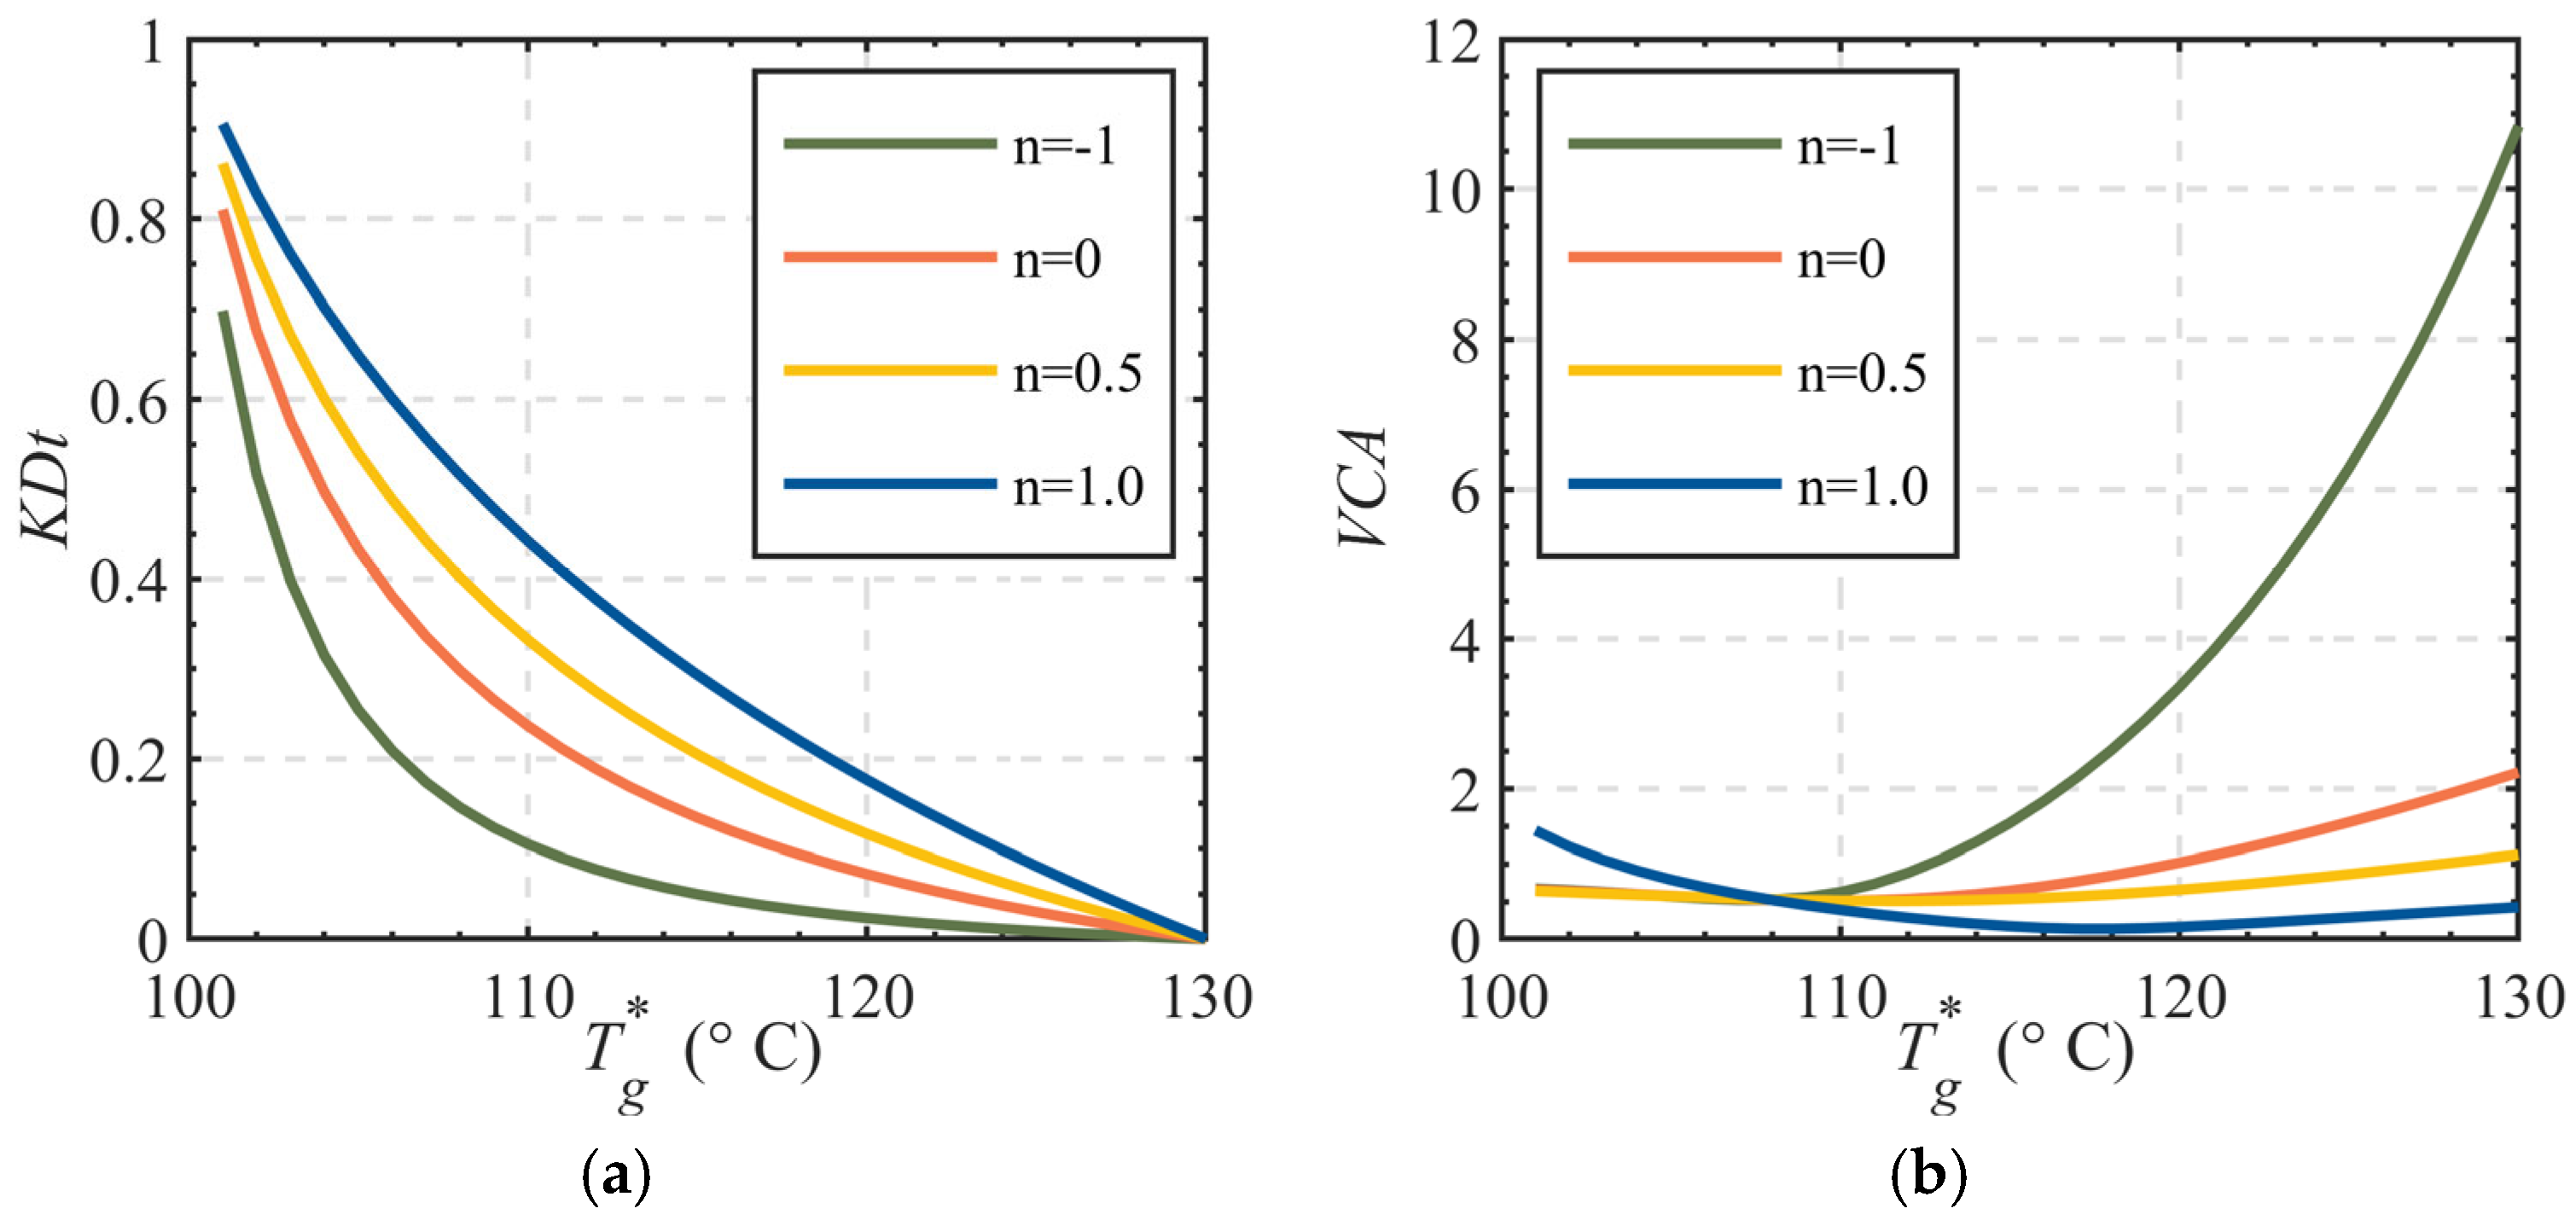
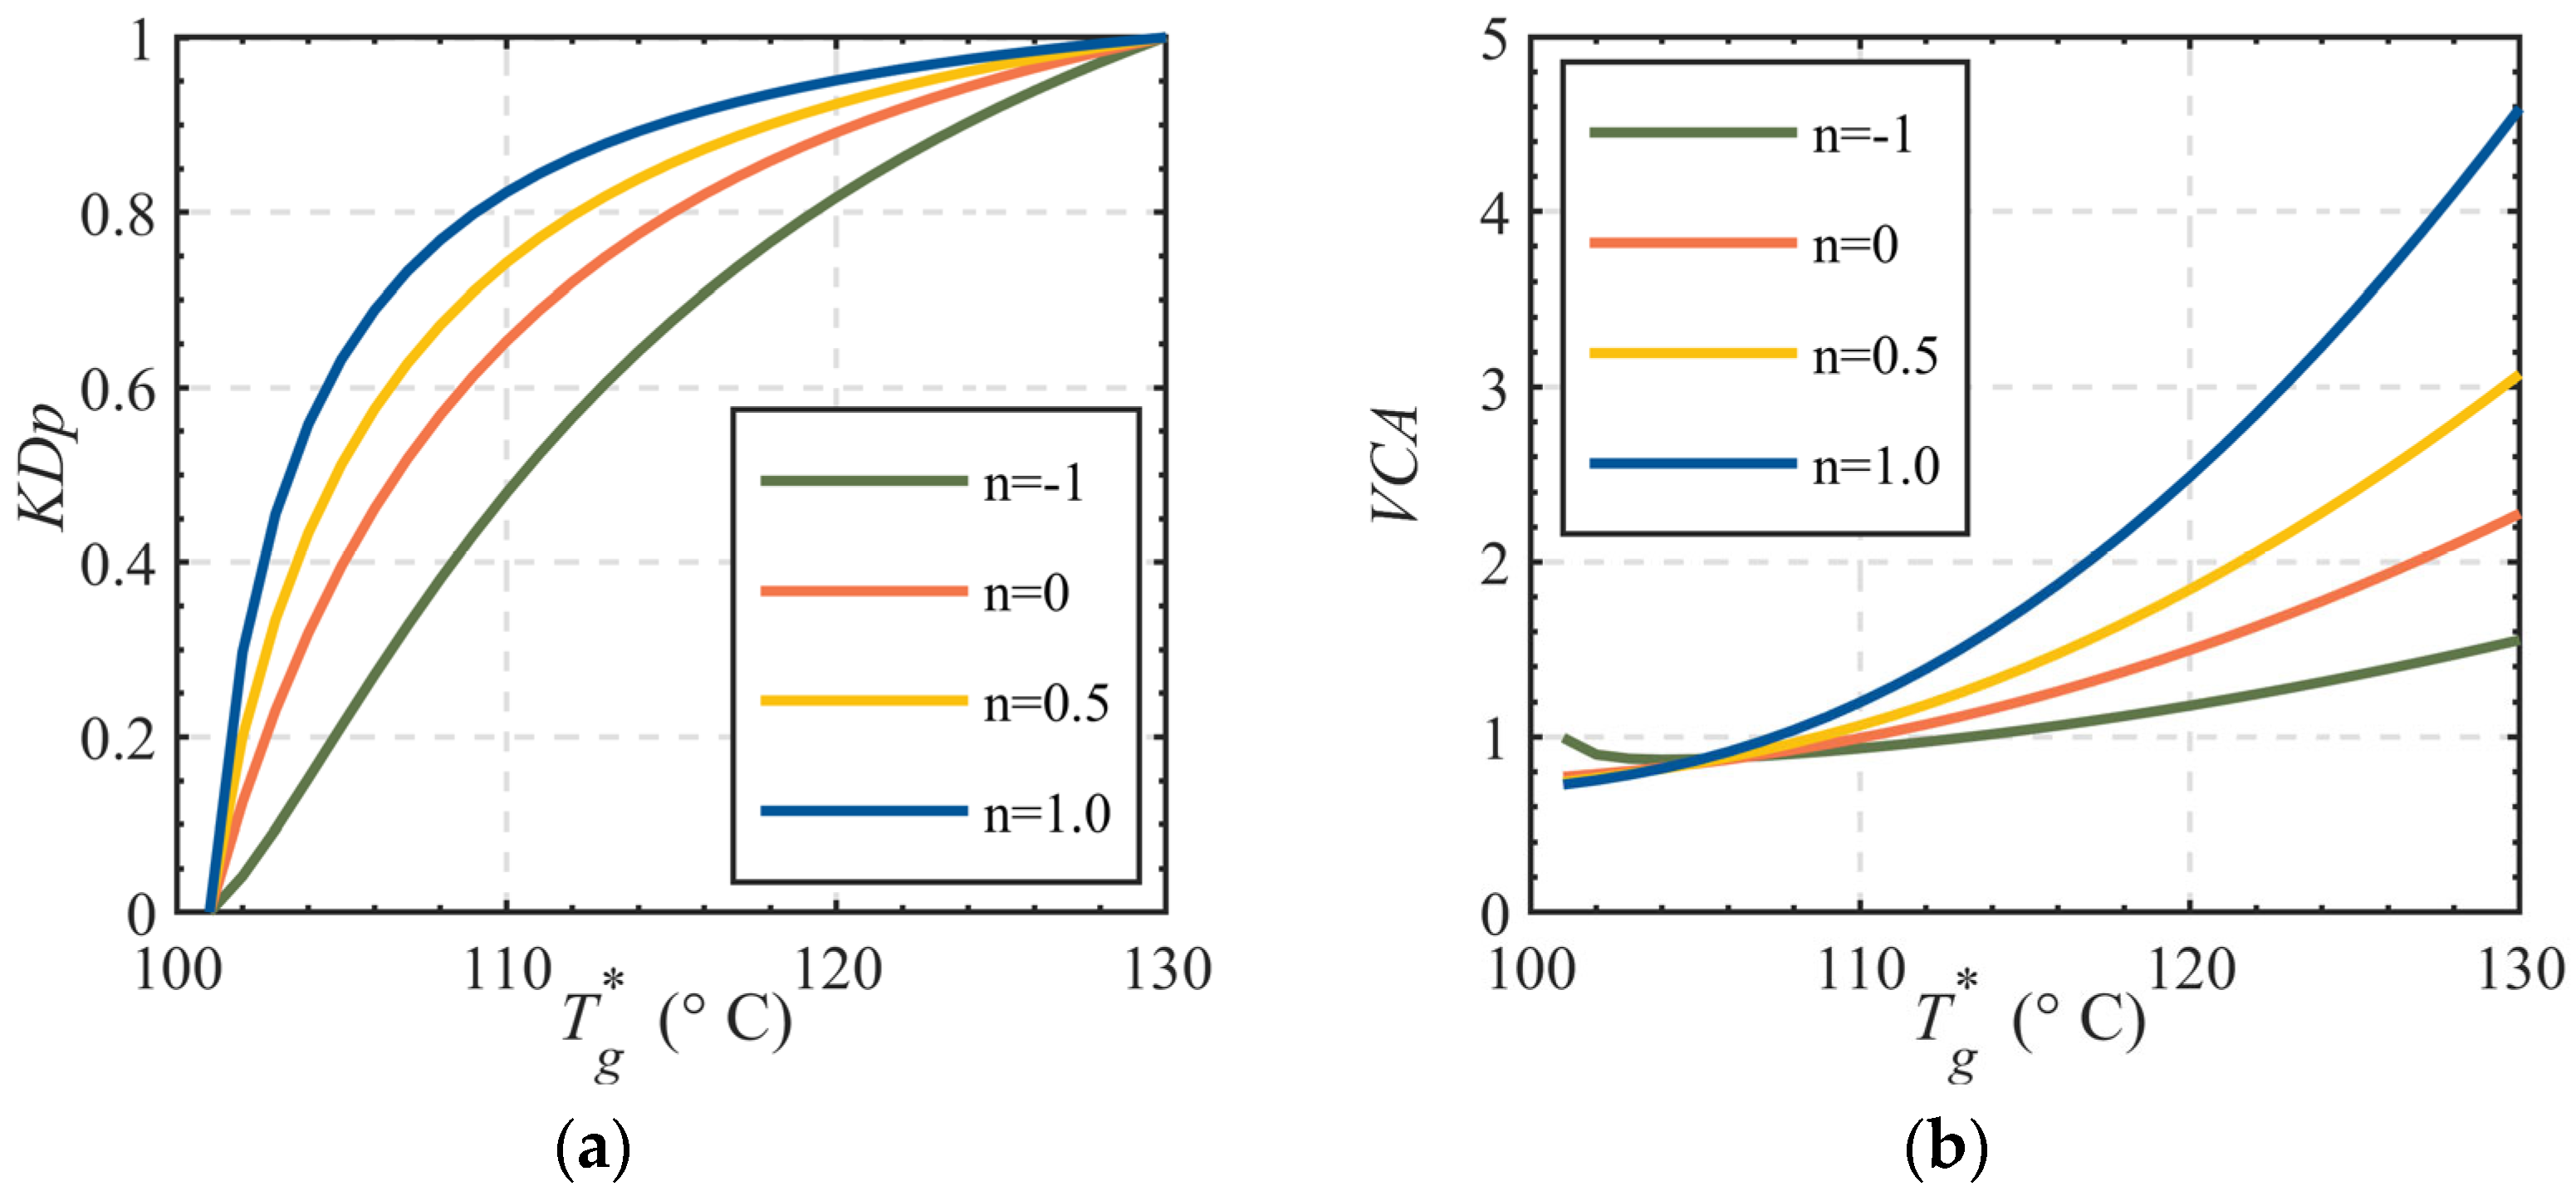
4.3. Valve Opening for Different Flow Characteristics
Control valves play a critical control function in heating systems, where their operation fundamentally relies on precise valve opening adjustments. In practical heating scenarios, the impedance characteristics of control valves significantly influence the fluid flow dynamics within the network [
20]. Changes in valve opening directly alter impedance, thereby affecting flow distribution and heat transfer efficiency across the system. To achieve efficient and accurate regulation, it is essential to establish a quantitative relationship between valve impedance and opening.
Control valves exhibit distinct flow characteristic curves, such as linear flow characteristic, equal percentage flow characteristic, quick-opening flow characteristic, and parabolic flow characteristic [
21]. By analyzing and comparing valves with different flow characteristics, combined with the specific parameters of the heating system (e.g., temperature range, pressure differentials, and load variations), the most suitable flow characteristic can be selected to optimize system performance [
22]. Control valves are defined by two independent parameters: maximum controllable impedance and minimum controllable impedance. Systematic optimization of these parameters ensures the valve meets operational requirements. In real-world applications, deviations between actual valve opening and theoretical valve opening are inevitable. By comparing these values under various operating conditions, error data can be collected and analyzed to identify error distribution patterns and primary influencing factors [
23].
4.3.1. Flow Characteristics of Heat Exchange Control Valves
Symbol definitions in Equation (5):
is functional expression of relative flow vs. relative opening;
R is an adjustable ratio;
ξ is relative opening;
Sv is valve authority.
By substituting Equation (6) into Equation (5), the quantitative relationship between the opening and impedance of the heat exchange control valve is derived, as shown in Equation (7).
4.3.2. Flow Characteristics of Bypass Control Valves
Symbol definitions in Equation (8): Sp,min is full-open impedance of bypass control valve.
By substituting Equation (8) into Equation (6), the quantitative relationship between the valve opening and impedance of the bypass control valve is derived, as shown in Equation (9).
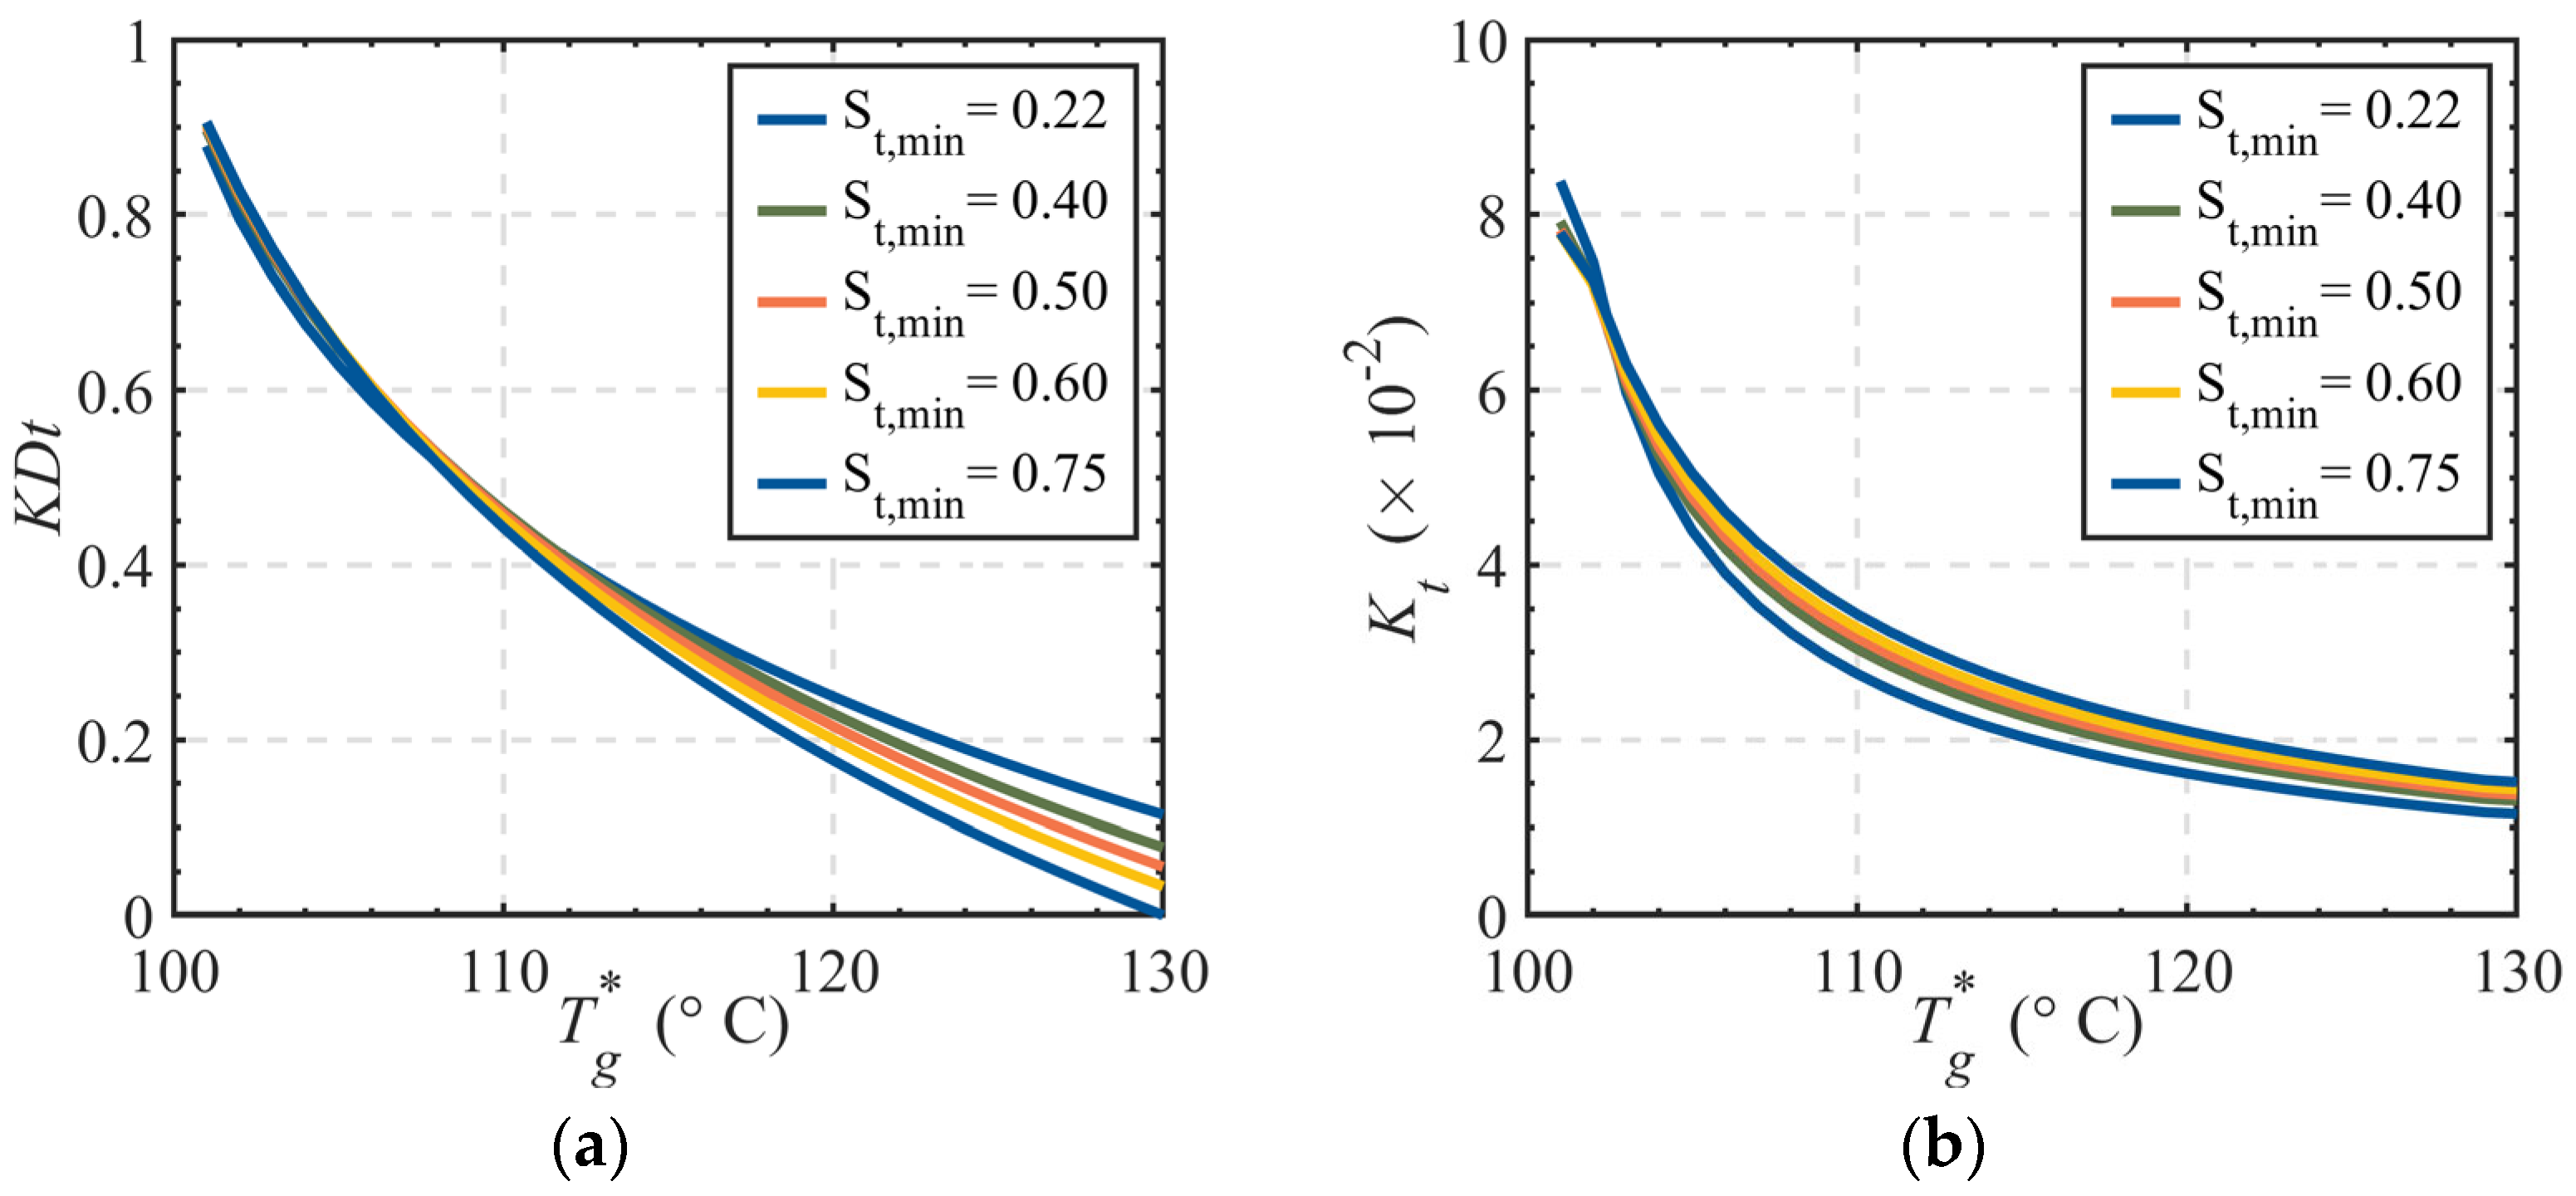
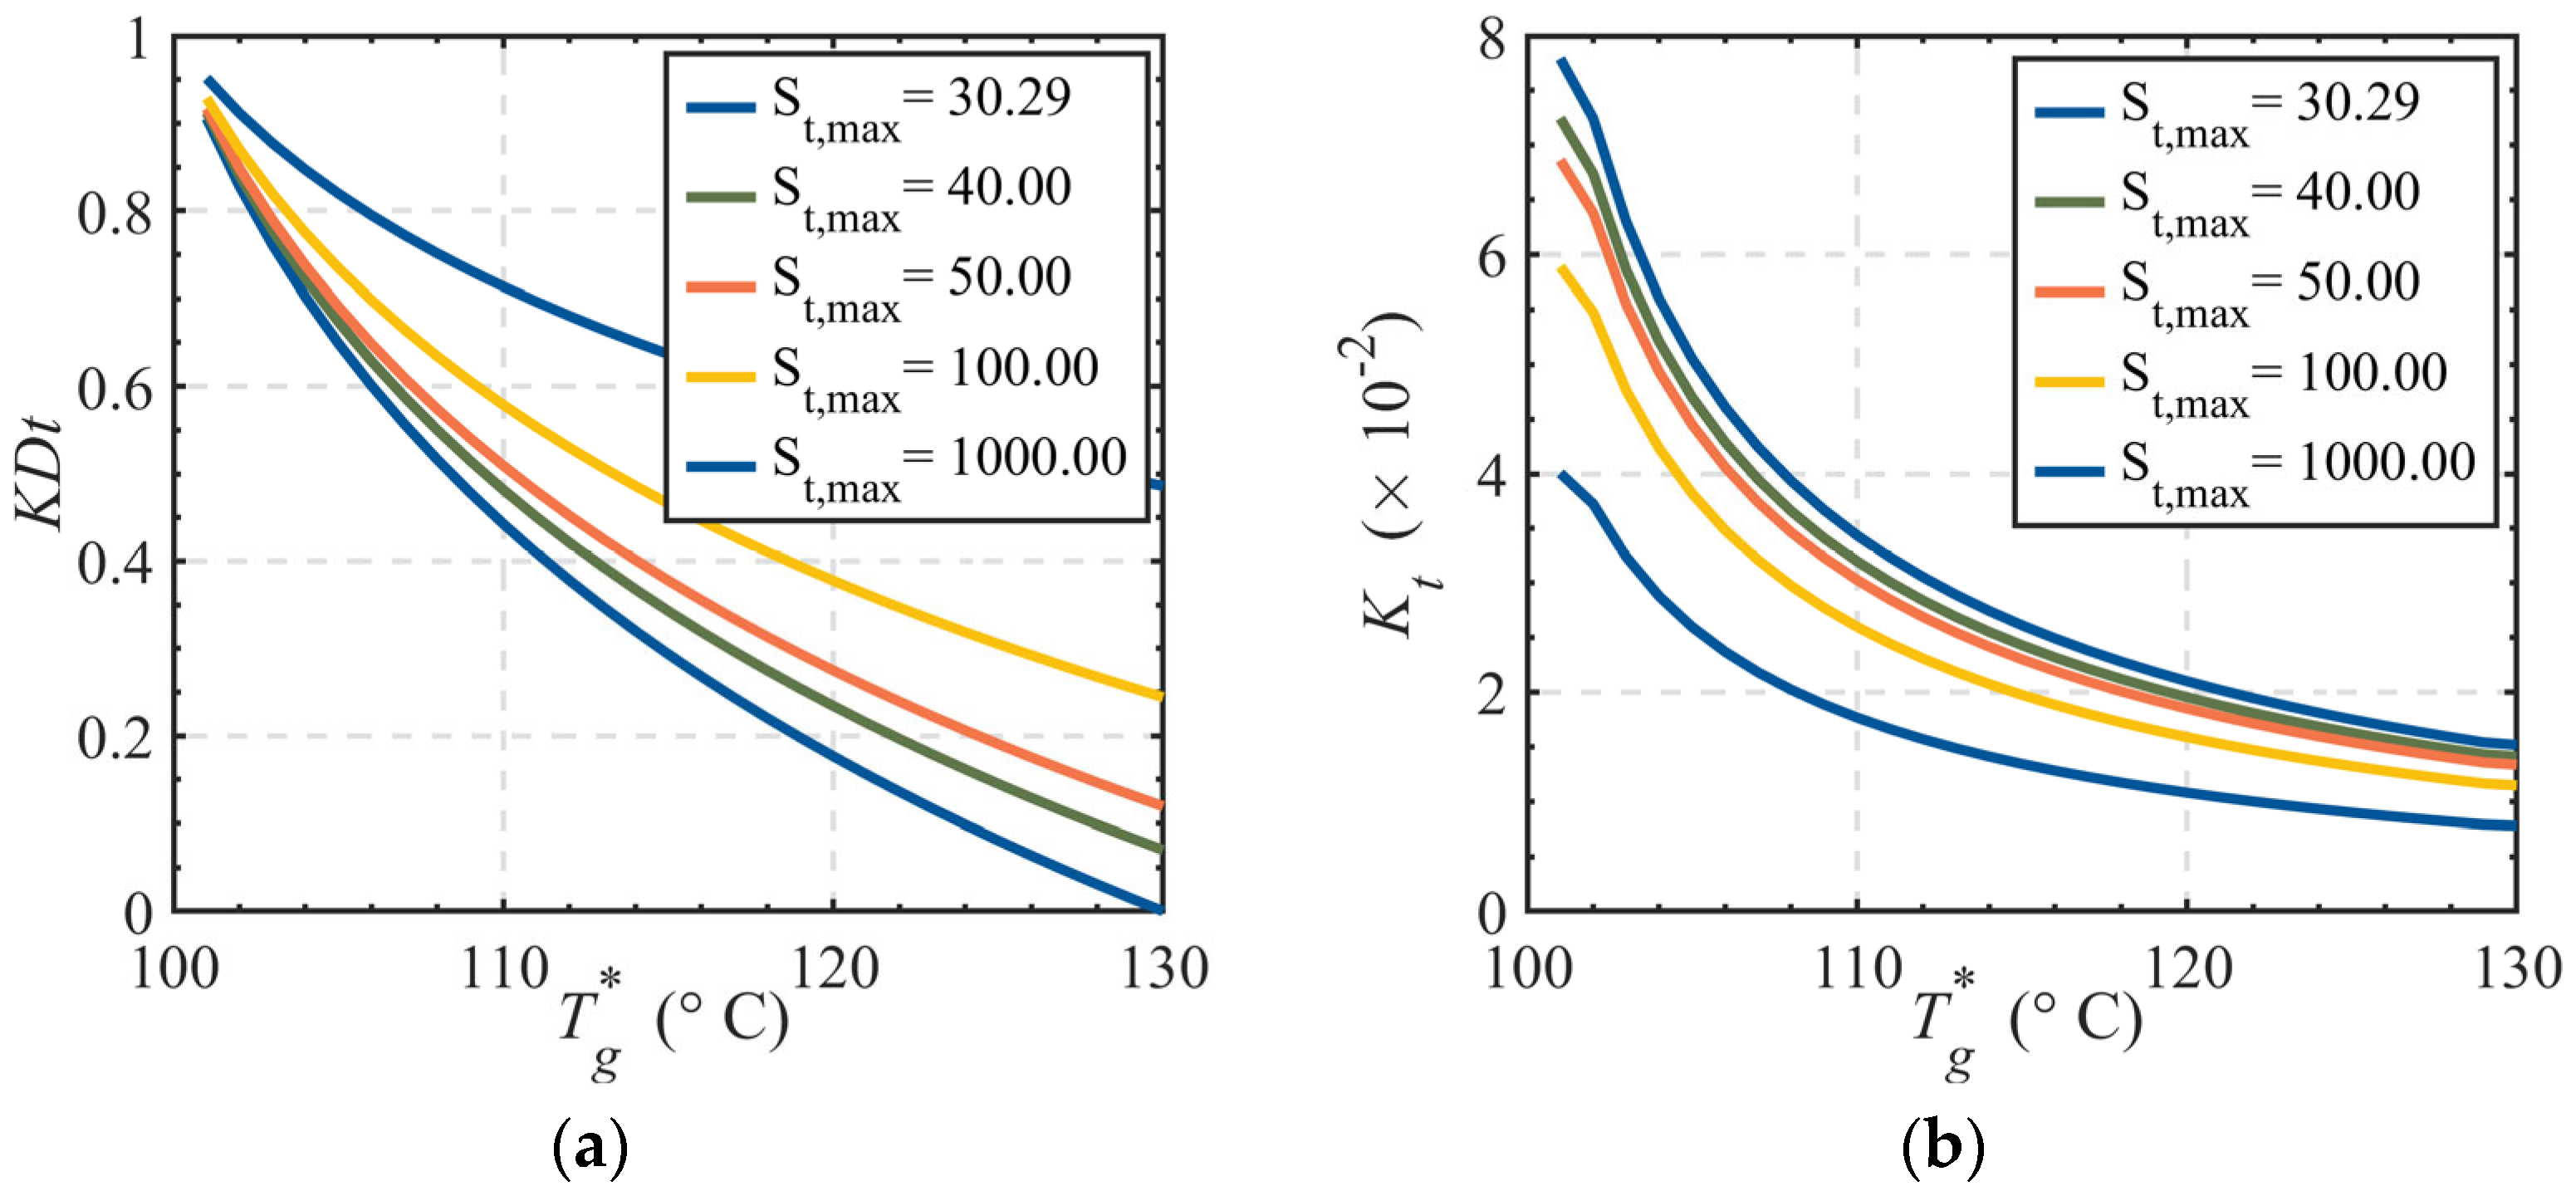
4.4. Characteristic Parameters
The independent parameters defining the regulation characteristics of a control valve are the maximum controllable impedance and minimum controllable impedance. The impact of each parameter on the regulation performance is analyzed. As shown in Equation (11), an increase in the equivalent impedance of the plate heat exchanger in the secondary network reduces the valve authority, leading to a significant distortion in the valve’s flow characteristics. In practical applications, the valve authority should not be less than 0.3 [
24].
Symbol definitions in Equation (10): Qmax is maximum flow rate through the control valve; Qmin is minimum flow rate through the control valve.
The relationship between the valve authority and impedance of the control valve is expressed in the Equation (11).
Symbol definitions in Equation (11): Smin is minimum controllable impedance of the control valve; Sh is equivalent impedance of the plate heat exchanger in the secondary network.
7. Optimization Verification Based on Real Heating Network
7.1. Basic Information of the Heating System
The centralized heating system is located in Zhangjiakou City, Hebei Province. The heating period lasts 141 days (from 1 November to 31 March of the following year). The design heat load was calculated using the climate correction method, with baseline parameters under −13.6 °C temperature conditions. The heating radius is approximately 11.4 km, covering a total heating area of 11.5 million m², and the total design heat load reaches 350 MW. The system comprises one heat source (an extraction condensing turbine cogeneration unit) and 51 heating stations. All heating stations have undergone network topology reconstruction, with bypass branches added to the original pipeline structure.
7.2. Model Control Strategy
This study adopts a Model Predictive Control (MPC) strategy, which integrates historical meteorological data and real-time forecasting information to achieve a 6-h-ahead precise prediction of heat load demand. Based on these predictions, the system dynamically generates reference temperatures as control input parameters. Utilizing a Programmable Logic Controller (PLC), the system flexibly adjusts the opening degrees of heat exchange control valves and bypass control valves, thereby enabling refined control of the district heating network.
7.3. Verification Method
During the 2024–2025 heating season, our team selected 16 heating stations with similar operating conditions from the Zhangjiakou Flexible Heating Network Project. Each station was configured with different control valve types as outlined in
Table 3.
Based on the actual measurement data of each heat station, the stability of the secondary network supply temperature when the primary network supply temperature changes between 70 and 100 °C is observed. If the average deviation between the secondary network supply temperature and the set supply temperature is too large, then the valve configuration is unreasonable; otherwise, the configuration is reasonable.
7.4. Engineering Data Analysis
The average temperature deviation of the secondary network supply for each heat station is shown in
Table 4:
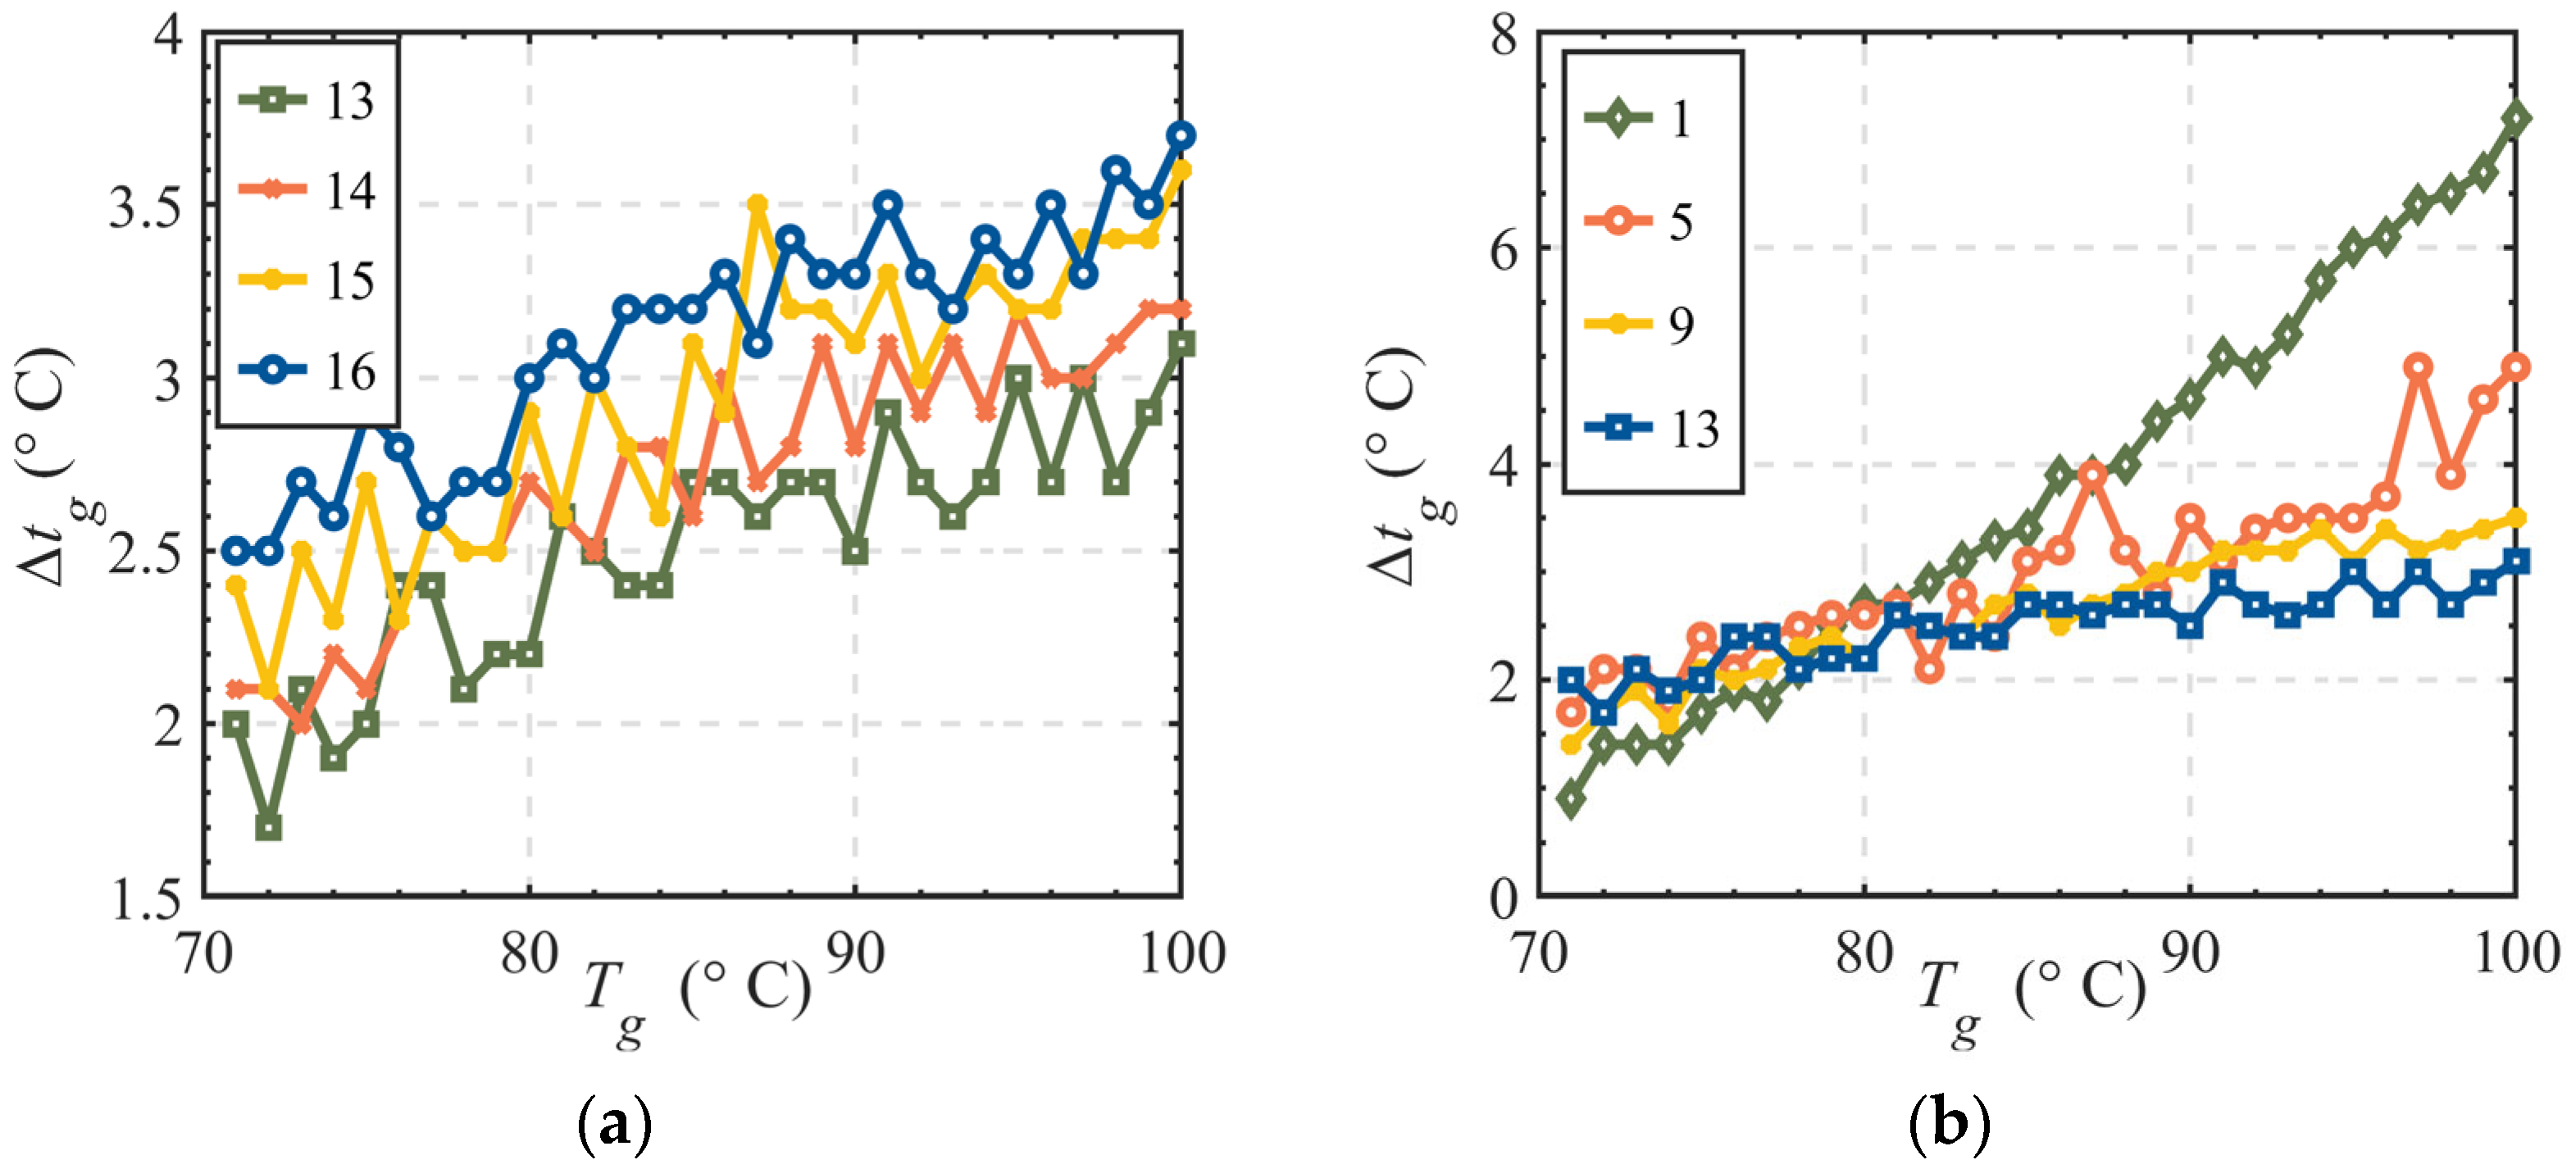
From the figure above, it can be seen that the 13th heating substation has the smallest average temperature deviation, only 2.5 °C. The experimental validation section constructed 16 combination scenarios through pairing four characteristic types of heat exchange control valves with four characteristic types of bypass control valves. From 55 heating stations, 16 typical stations with complete operational data were selected for comparative analysis. Based on the research conclusion—minimum temperature deviation fluctuation occurs when using equal percentage heat exchange control valves paired with quick-opening bypass control valves—the following two contrast groups were specifically chosen:
Group 1 (Numbers 13, 14, 15, 16): The heat exchange control valves are fixed as equal percentage type, with bypass control valve configurations covering various characteristics such as linear and parabolic, to validate the stability advantages of equal percentage heat exchange control valves in diverse bypass scenarios.
Group 2 (Numbers 1, 5, 9, 13): The bypass control valves are fixed as quick-opening type, with heat exchange control valves covering various characteristics such as linear and parabolic, to quantify the enhancement effect of quick-opening bypass control valves on the system’s disturbance rejection capability.
The control valve configurations of each heating substation are shown in
Table 5.
As shown in
Figure 11a, where all heat exchange control valves are equal percentage type control valves, it can be seen that when the bypass control valves are quick-opening type control valves, the fluctuation of the secondary network supply temperature is lower. In
Figure 11b, where all bypass control valves are quick-opening type control valves, it is observed that when the heat exchange control valves are equal percentage type control valves, the fluctuation of the secondary network supply temperature is also lower. The above observed data can intuitively validate the correctness of the conclusion of this paper.
8. Conclusions
This study focuses on a heating network system based on BTS technology, establishing a theoretical framework for valve selection and control strategies with engineering significance through quantitative analysis of dynamic regulation performance under specific operating conditions. By overcoming the limitations of traditional single-performance-index evaluation, the research reveals the intrinsic mechanism between valve control impedance characteristics and supply–demand balance from a system coupling perspective, providing new cognitive dimensions for heating system optimization.
8.1. System Impact Mechanism of Control Impedance Characteristics
This study demonstrates that when the controllable impedance range of control valves covers system operational requirements, a combination of higher minimum control impedance and lower maximum control impedance significantly enhances the regulation stability of heat exchange stations. This is manifested in smoother valve opening adjustments, stabilized dynamic responses in heat exchange processes, and effective suppression of overload phenomena and oscillation effects during regulation. Notably, the minimum control impedance is constrained by a critical threshold of valve authority. When valve authority falls below the theoretical optimal range, nonlinear distortion occurs in valve operating characteristics, leading to systemic attenuation of regulation accuracy.
8.2. Valve Type Selection
Comparative analysis demonstrates that selecting equal percentage valves for heat exchange regulation and quick-opening valves for bypass regulation achieves optimal control performance with minimal variation, enabling control valves to deliver their maximum regulatory efficiency. Experimental verification in practical engineering applications confirms that this configuration attains the most stable supply–demand equilibrium in thermal stations. Critical implementation requires explicit consideration of the operational temperature range in the primary network water supply. For bypass regulation valves, quick-opening valves exhibit enhanced control capability in low-temperature regimes (100–106 °C), while equal percentage valves demonstrate superior control performance in high-temperature ranges (106–130 °C).
8.3. Practical Implications
The research outcomes hold significant real-world applicability. For instance, urban heating network decarbonization retrofits can implement closed-loop control strategies integrating “peak-shifting heat storage—dynamic allocation—energy efficiency optimization”, directly improving energy utilization rates and heating service quality. Additionally, bypass pipeline heat storage technology enhances the peak-shaving capacity of combined heat and power (CHP) units, addressing the core challenge of renewable energy (e.g., wind and solar power) intermittency and volatility, thereby promoting renewable energy integration.
8.4. Research Boundaries and Knowledge Expansion Pathways
Current research is constrained by regional engineering data limitations (Zhangjiakou flexible heating network), leaving theoretical gaps in:
- 1.
Universal applicability validation under extreme cold/humid–hot climates;
- 2.
Nonlinear dynamic modeling of multi-valve coupling in complex networks;
- 3.
Long-term material aging effects on valve characteristics.
Future research will expand along three dimensions:
- 1.
Cross-scale data validation: Establish multi-climate zone data collection networks covering frigid regions (e.g., Shenyang) and hot summer/cold winter zones (e.g., Shanghai), developing GIS-based model parameter correction mechanisms.
- 2.
Complex system modeling: Introduce fluid network theory and Nash equilibrium models to construct impedance distribution optimization models considering multi-valve coupling effects, achieving optimal energy flow allocation through equilibrium solutions.
- 3.
Long-term performance evolution: Implement a 5-year tracking observation program for the Zhangjiakou project, developing time-varying prediction models for valve characteristic degradation and optimizing lifecycle-based control strategies.


