

Optimal Multi-Area Demand–Thermal Coordination Dispatch


Abstract
1. Introduction
- A multi-area DB mechanism is developed to enhance customer–supplier collaboration in DR, aiming to alleviate regional congestion and address supply bottlenecks.
- This paper integrates the multi-area DB platform of energy market and ancillary services market with the actual bidding prices and information from the DR users to enhance the transparency and the efficiency of the day-ahead market.
- An improved technique based on a DSM is proposed to address the multi-area generation and reserve dispatch problem under the DB mechanism of Taipower.
- Simulation results are presented to evaluate the effectiveness and economic benefits of implementing the DB program. The proposed DSM approach demonstrates both practical applicability and operational efficiency.
2. A Brief Introduction of the Demand Bidding Mechanism of Taipower
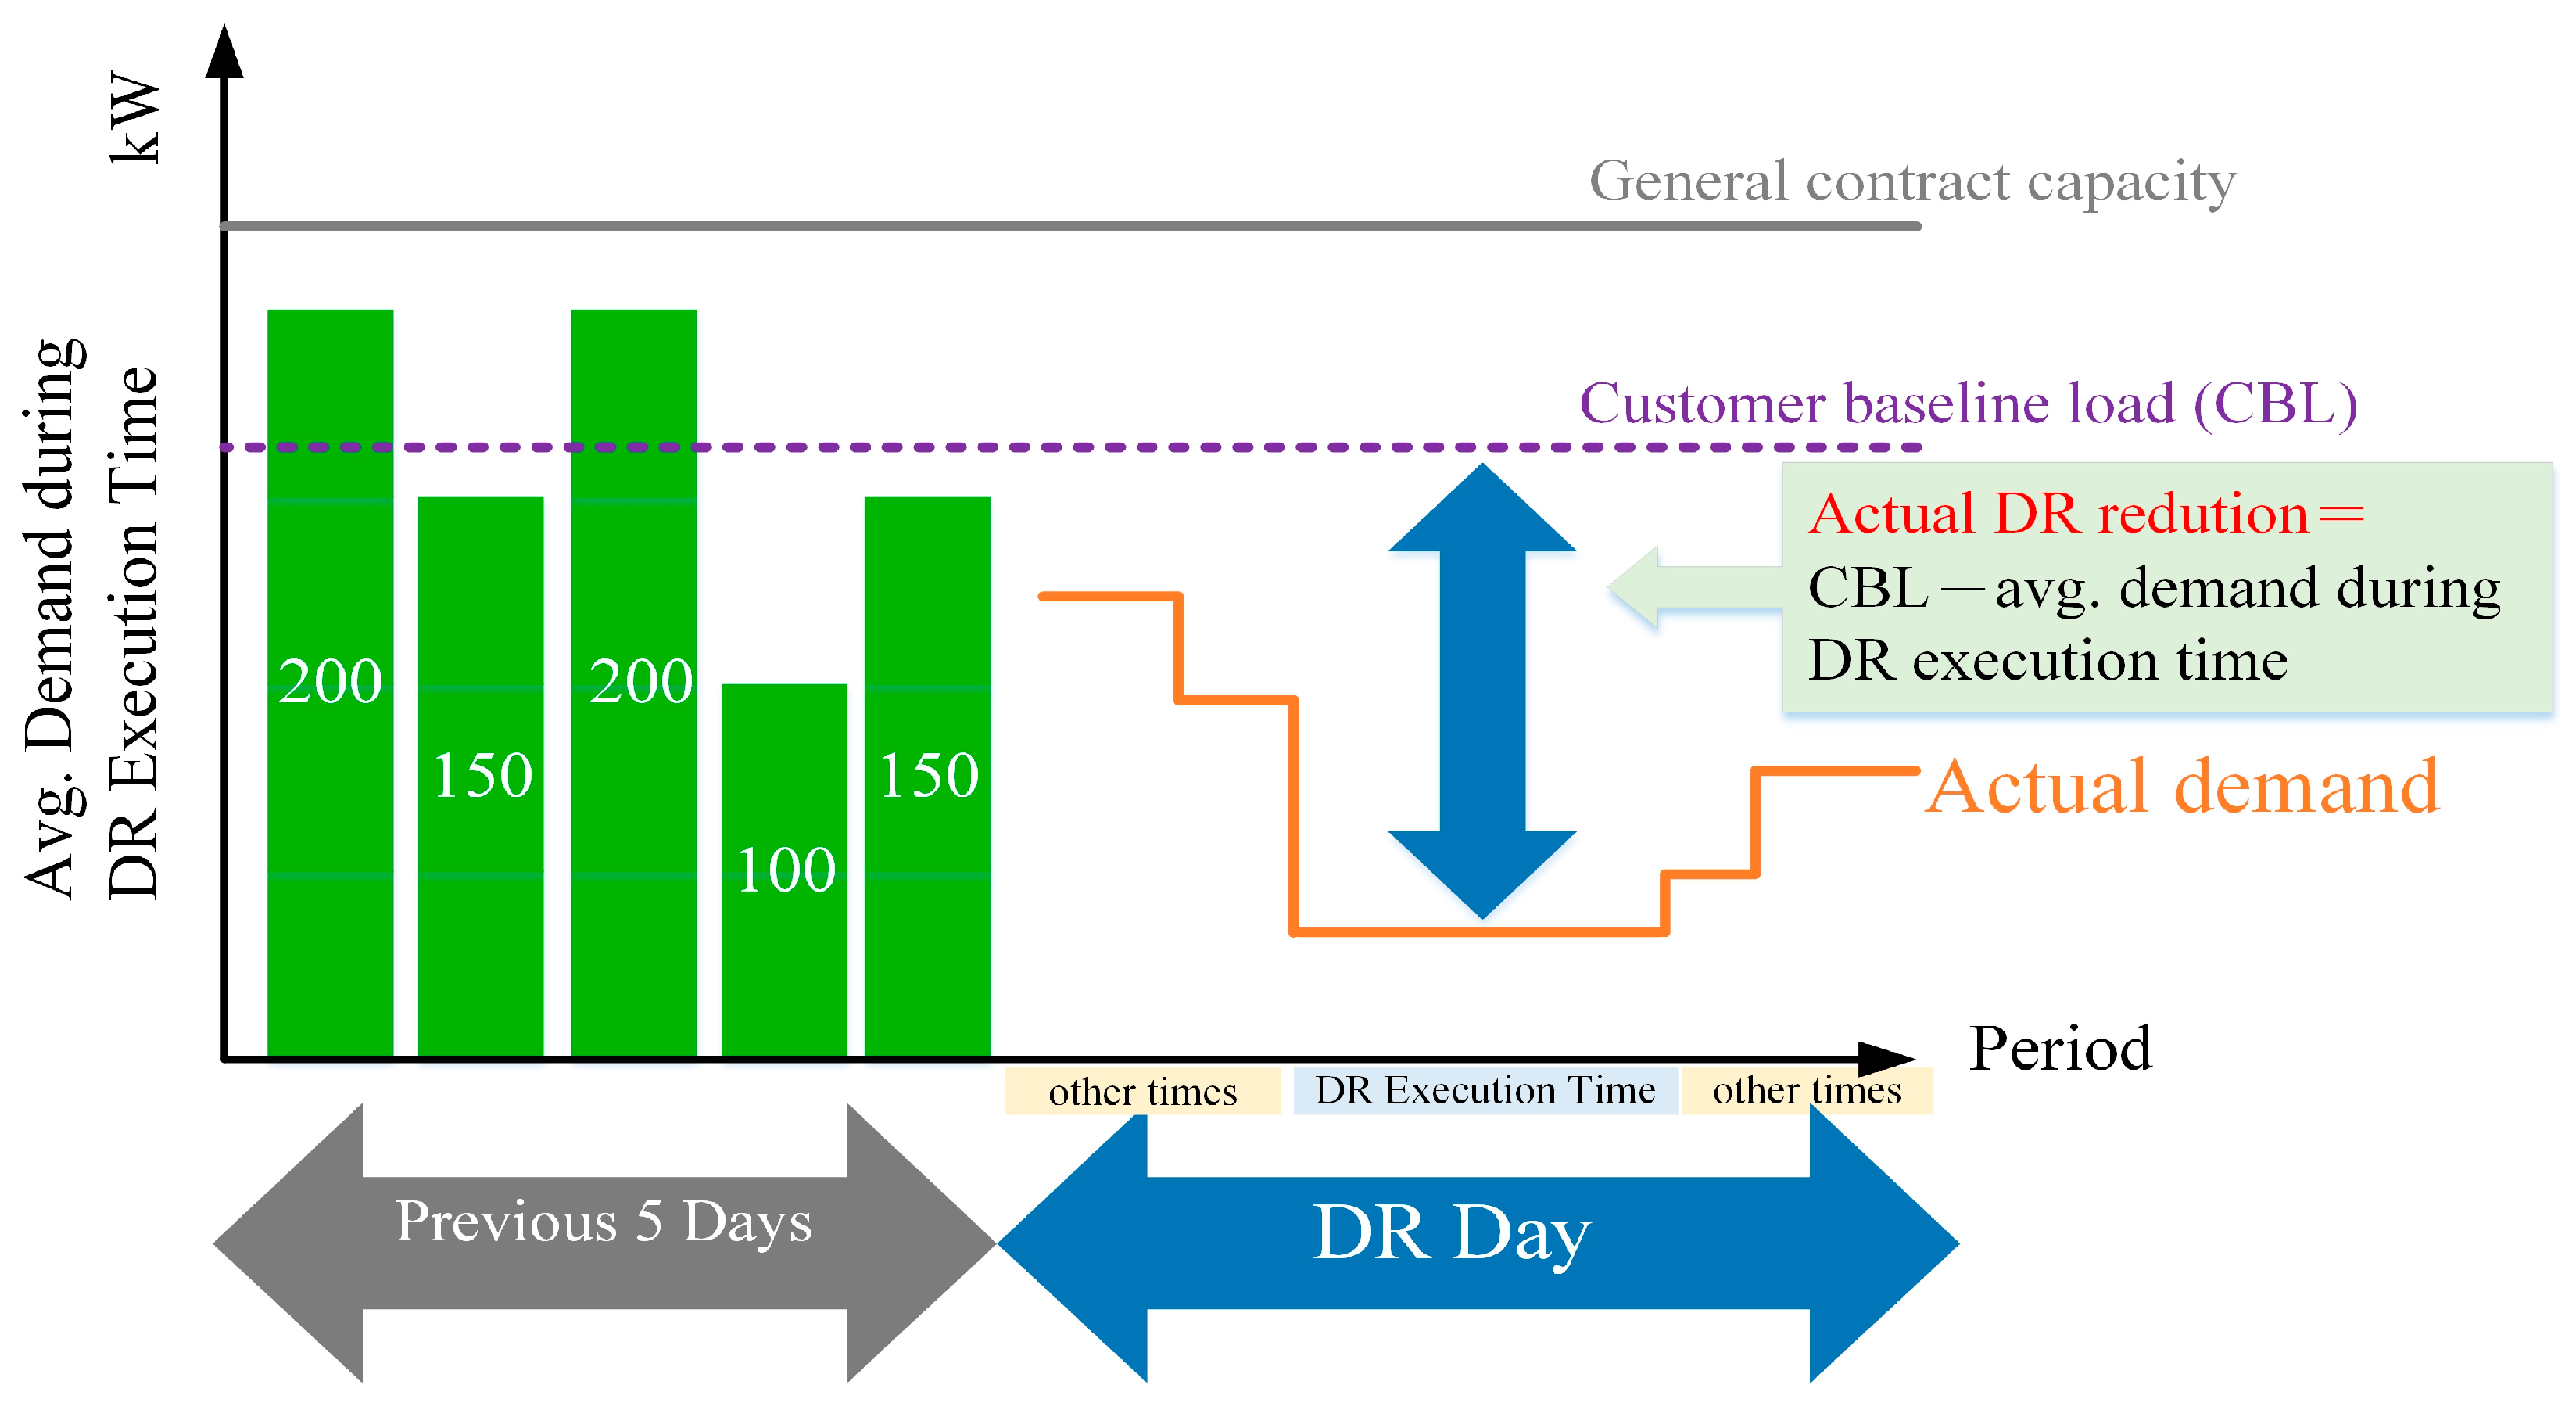
2.1. Regulations of Load Reduction by DR Users
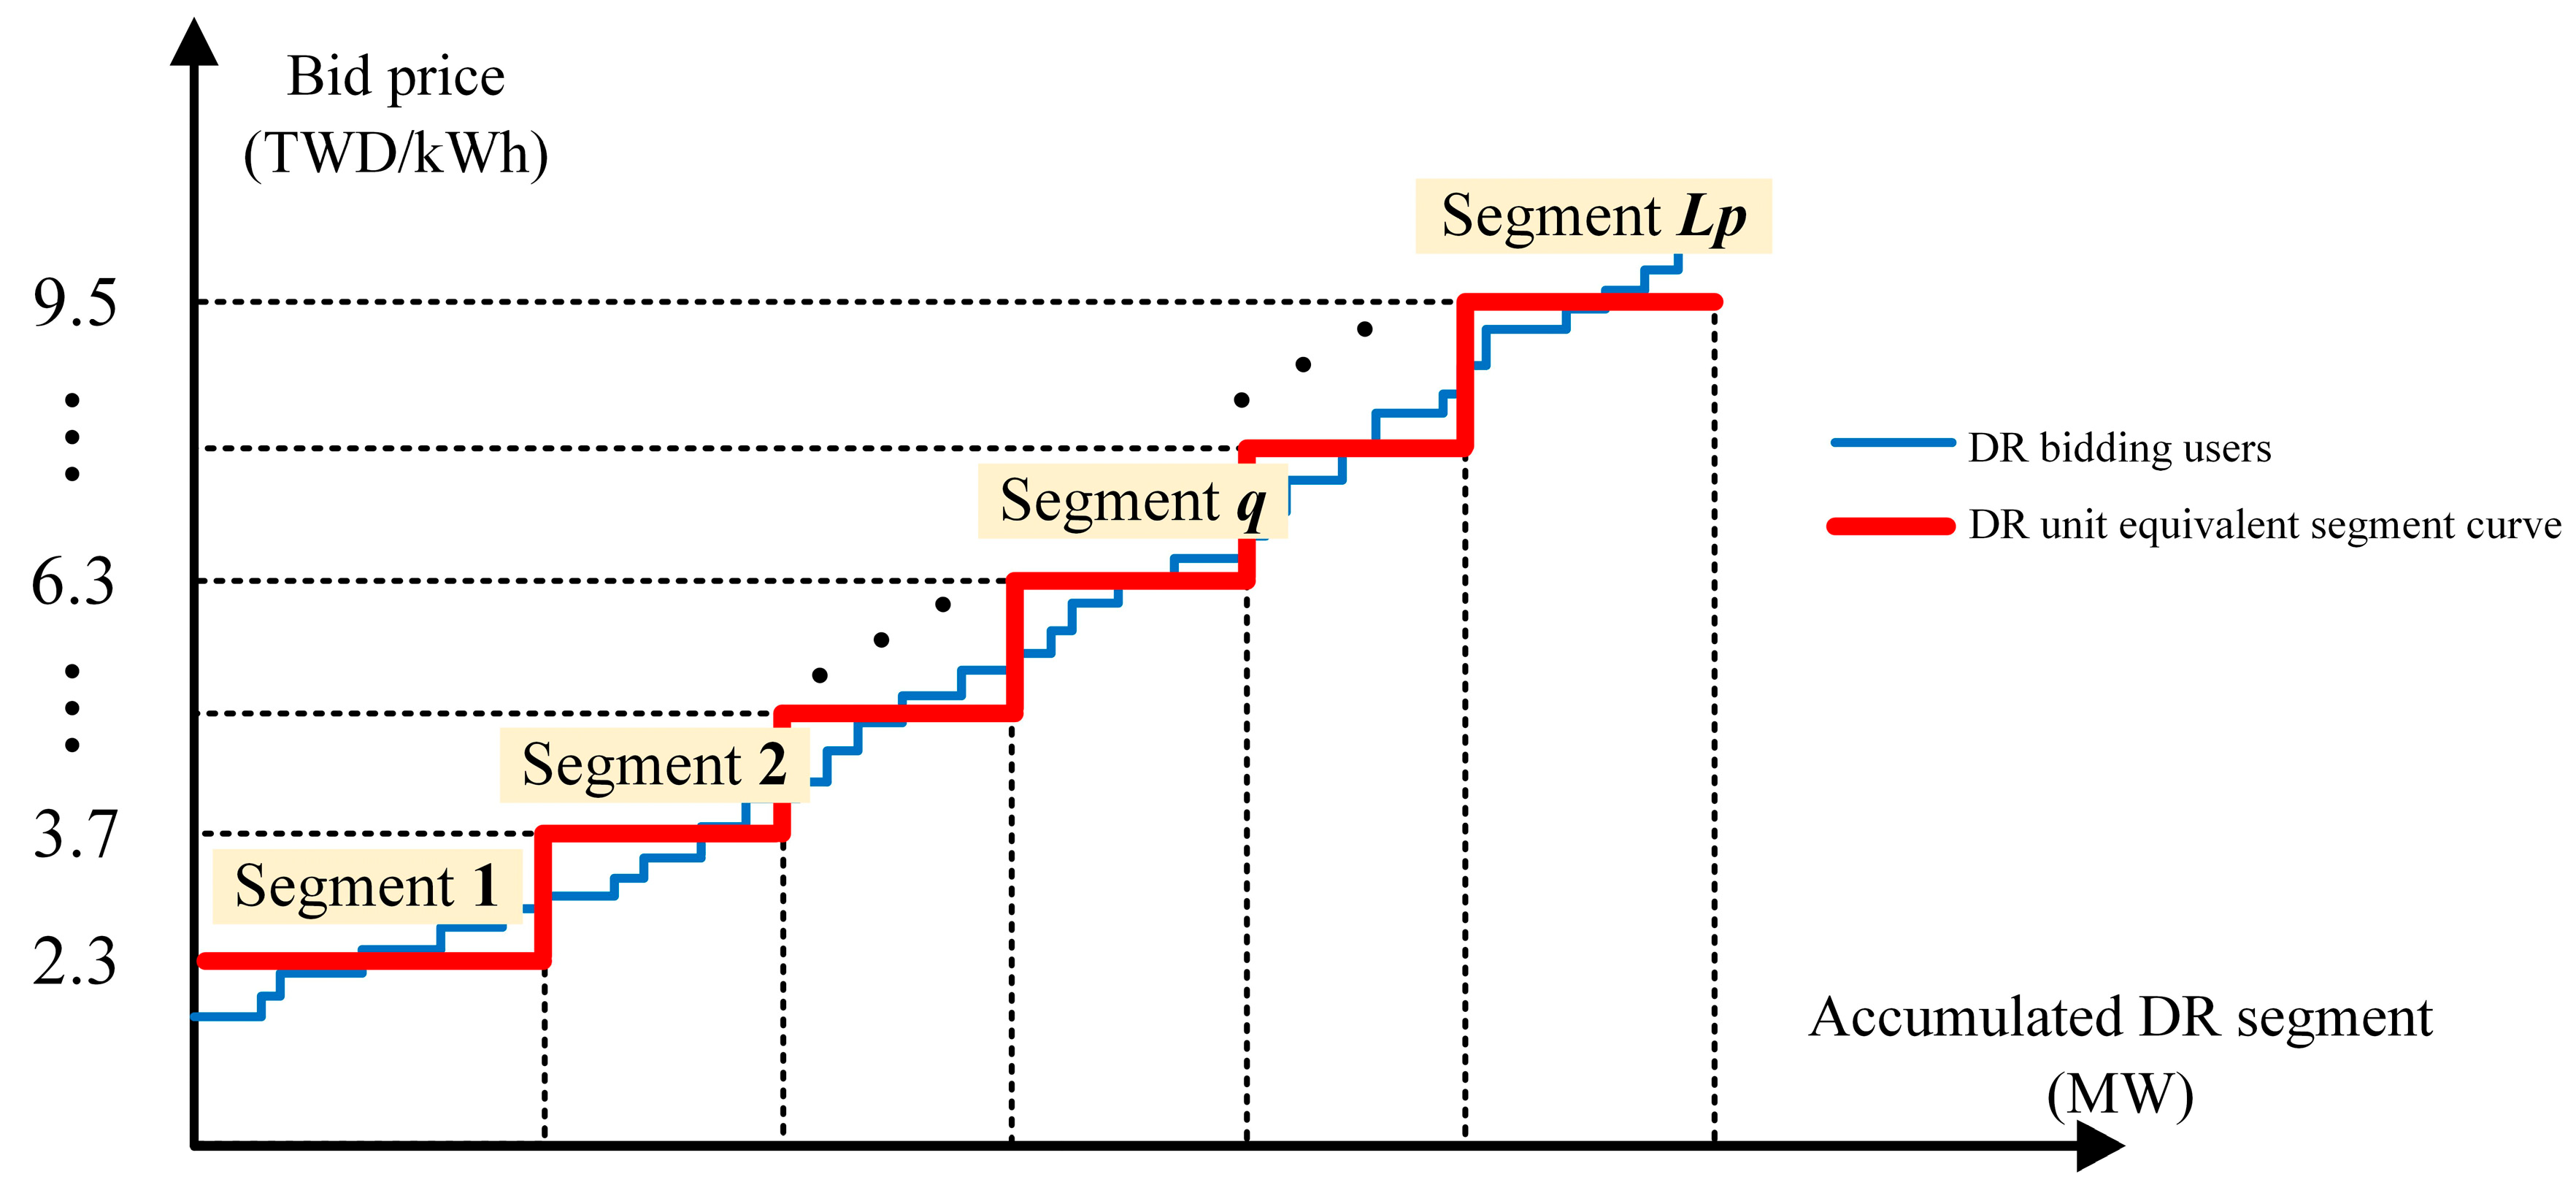
2.2. Equivalent Groups of Multiple DR Users
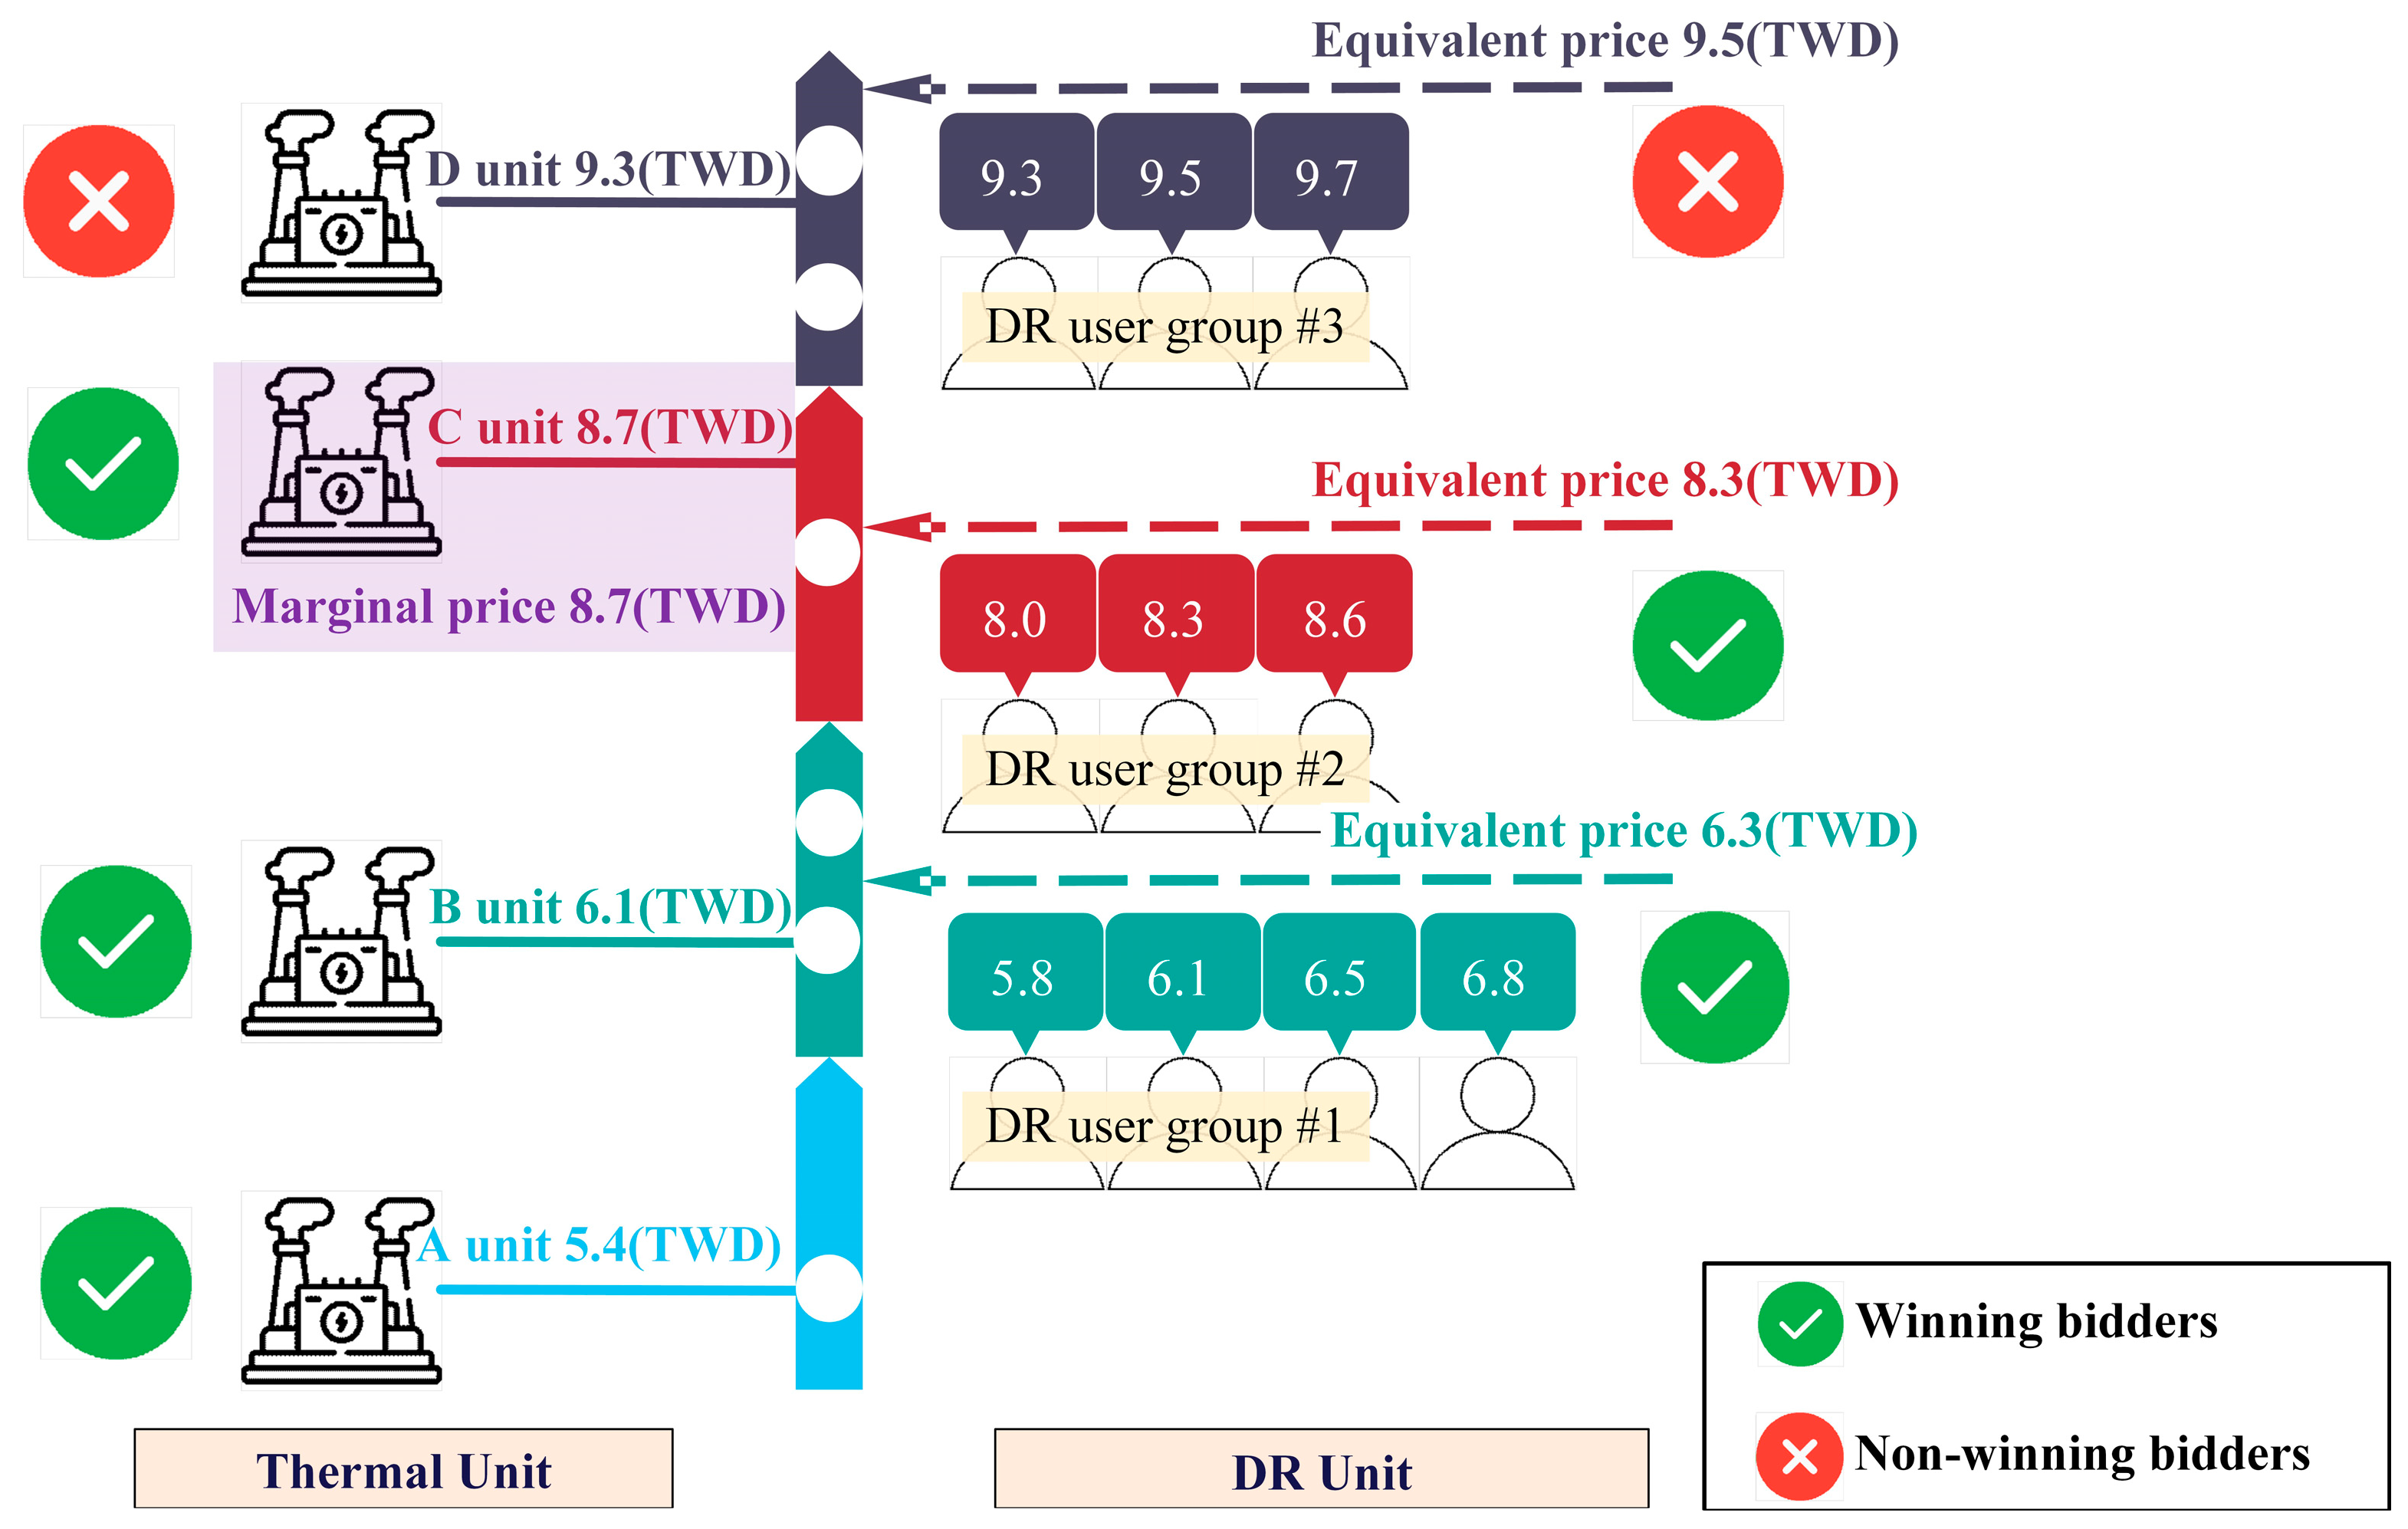
2.3. Determination of the Bid Winner
3. Problem Description Considering Multi-Area Scenario
3.1. Calculation of the Cost for Thermal Unit and DR Unit
3.2. Constrains for System Power Dispatch
- Requirement of power balance for each area:
- Requirement of spinning reserve for each area:
- Transmission capacity constraints for power flow among the areas:
3.3. Constraints for Thermal Units
- Upper limit of spinning reserve for the thermal unit:
- Spinning reserve contribution of thermal unit:
- Output generation constraint of thermal unit:
- Constraints of the energy and reserve capacity:
3.4. Constraints for DR Unit and DR Users
- Constraint of DR unit for energy generation:
- Constraint of a DR user for energy generation:
- Constraint of bidding price of a DR user for energy generation:
- Constraint of a DR unit for spinning reserve:
- Constraint of a DR user for spinning reserve:
- Constraint of the bidding price of a DR user for spinning reserve:
4. The Modified Direct Search Method
| unit step function | |
| penalty coefficient | |
| penalty for the violation of the requirement of area spinning reserve | |
| penalty for the violation of the limits of the transmission line | |
| spinning reserve requirement at each area | |
| actual supply of spinning reserve at each area | |
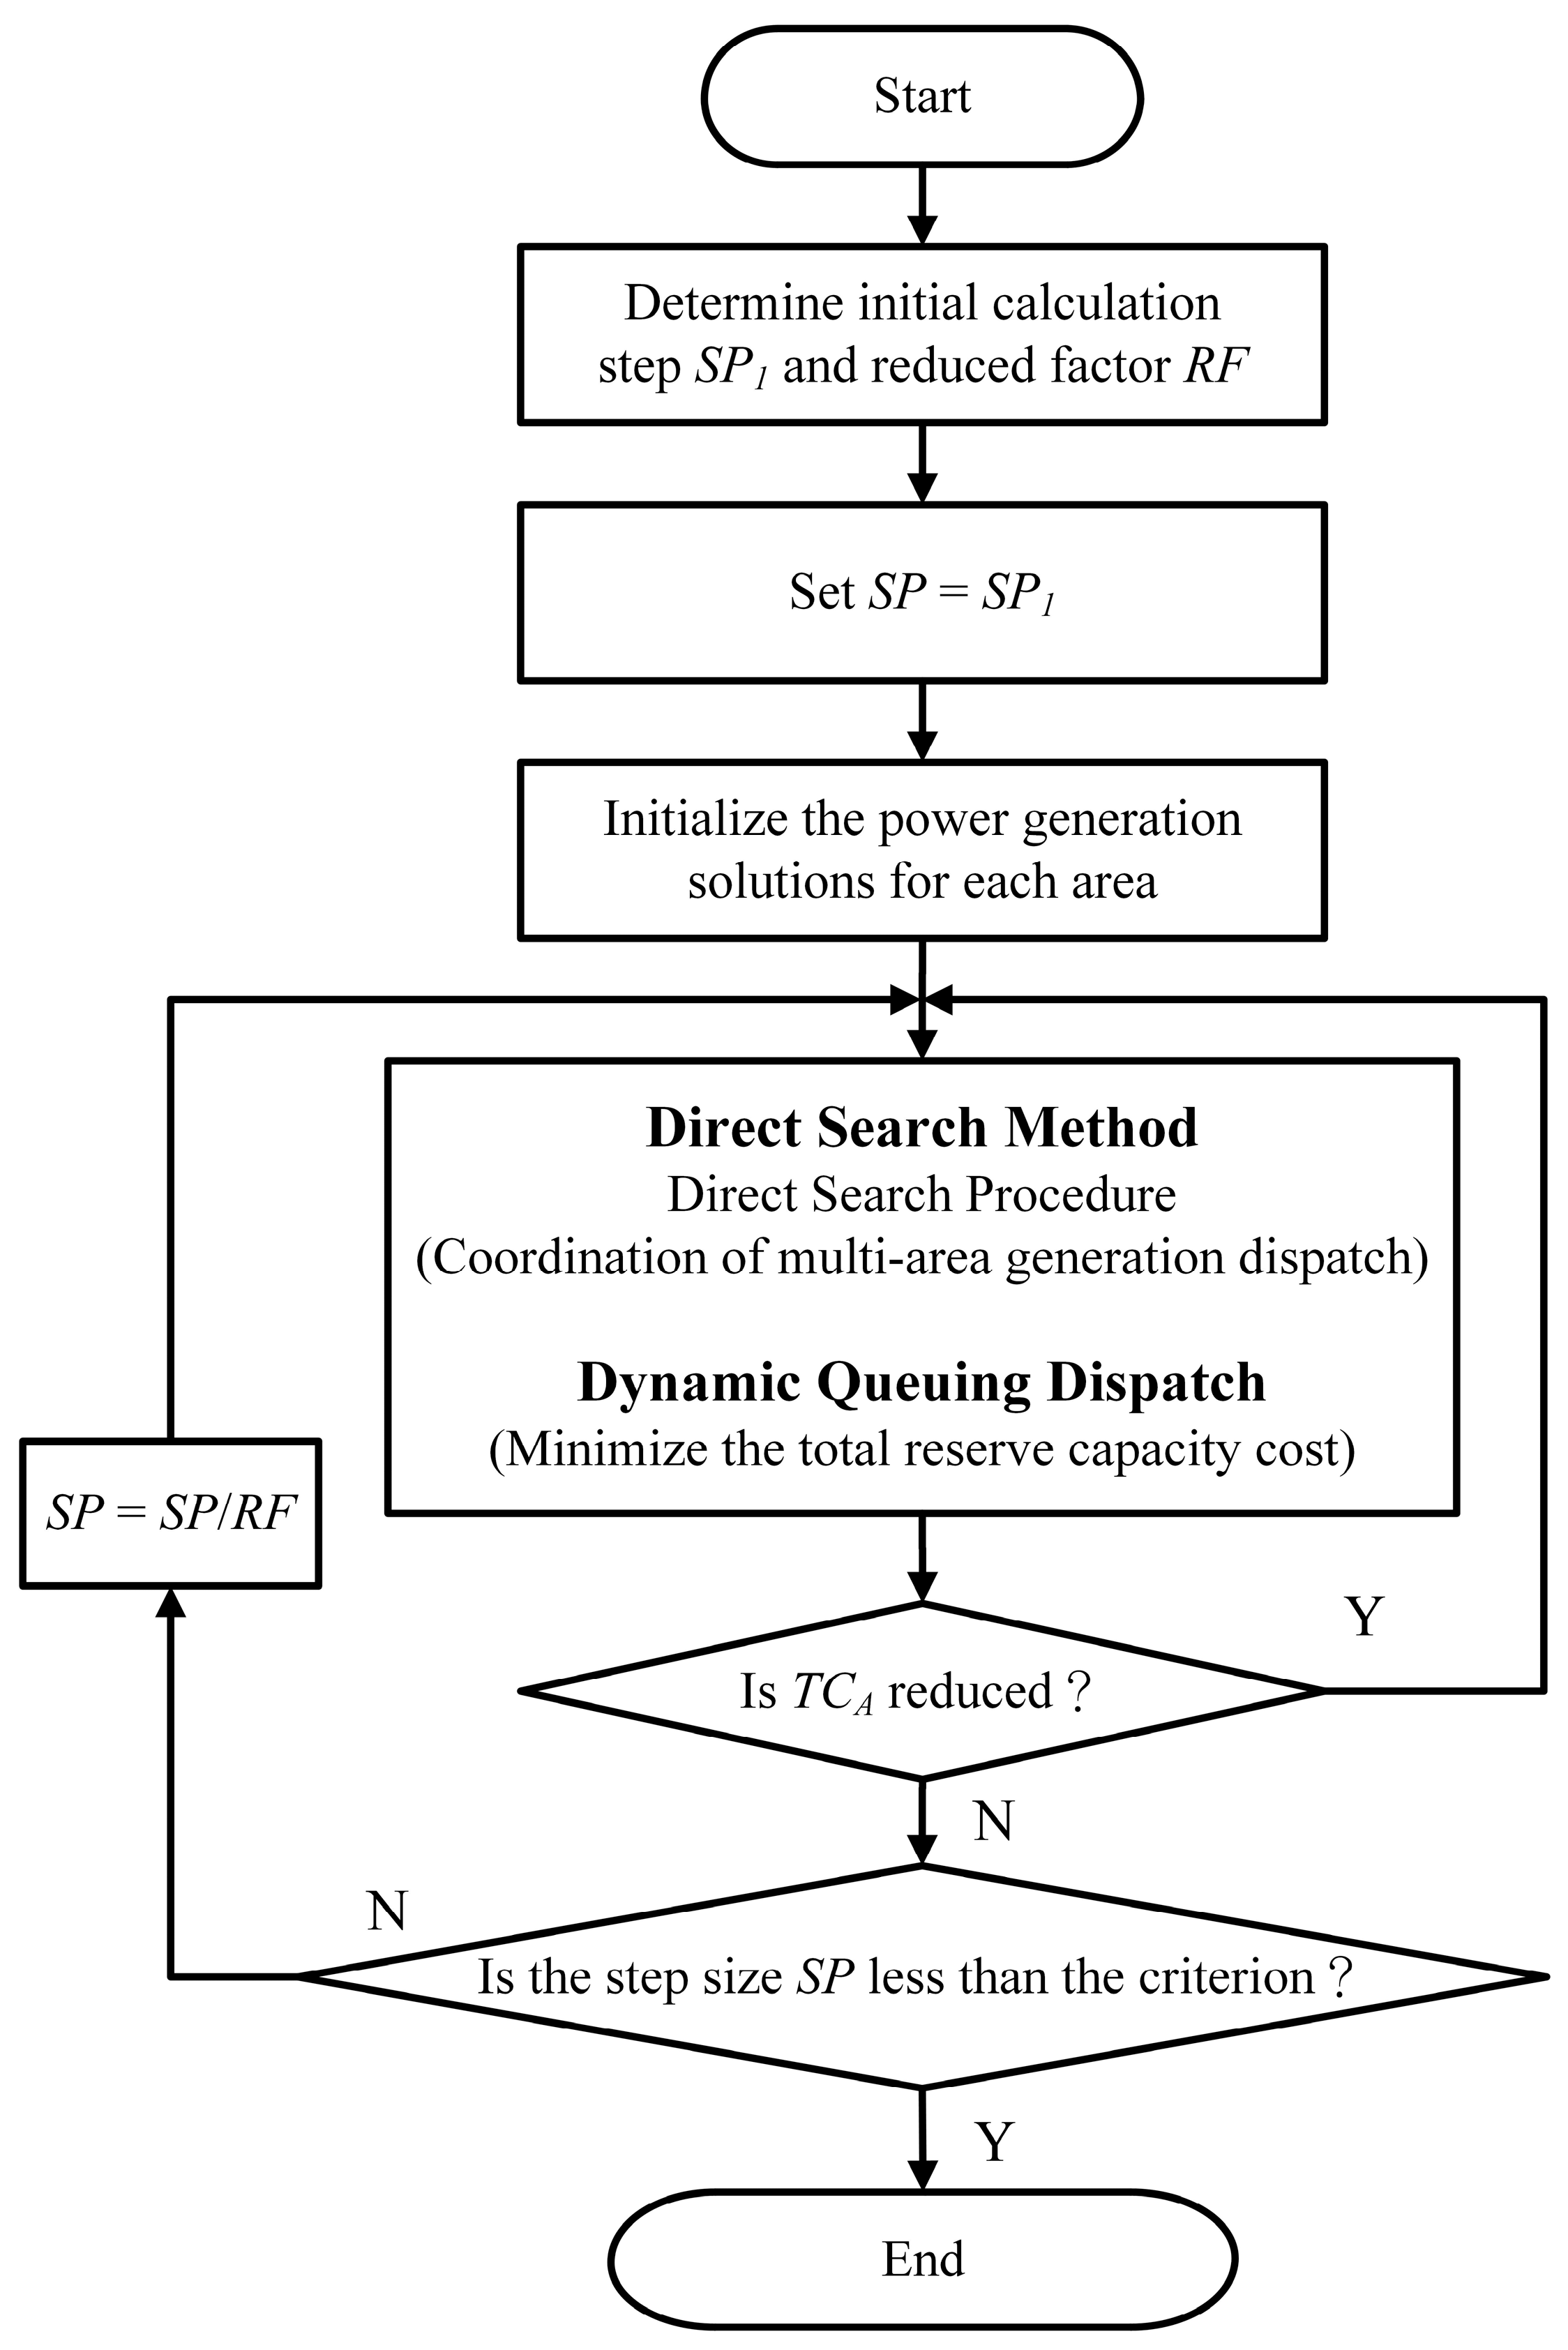
- Step 1:
- Obtain the data from thermal units and DB users.
- Step 2:
- Group the equivalent DR units in each area based on DB participant’s data.
- Step 3:
- Set initial calculation step SP1 and reduced factor RF.
- Step 4:
- Set SP = SP1.
- Step 5:
- Initialize the power generation solutions for each area.
- Step 6:
- Perform the DSM with step SP to optimize the scheduling of generation and handle additional constraints properly for multiple areas.
- Step 7:
- At each possible step SP, the DQD is applied to optimize the scheduling of reserve capacity for multiple areas.
- Step 8:
- Is the step size SP less than the criterion? Yes, proceed to the next step. Otherwise, SP = SP/RF, and return to Step 6.
- Step 9:
- Output the scheduling results and the bid winner in each area. The winning customers in each area are then determined by the area’s marginal prices.
4.1. Establishing the Equivalent DR Unit in Individual Area
4.2. Initial Solution Estimate
- Step 1:
- Allocate a portion of the load to the minimum generation level of units in each area.
- Step 2:
- Dispatch load demand in sequence according to the average cost of generation for all units. The units with lower average costs have priority to supply until the system load demand is met.
- Step 3:
- While maintaining the generation level of the units, optimize the dispatch of multi-area spinning reserve using the DQD method introduced in Section 4.3. If the system violates constraint conditions, evaluate the penalty costs PC1 and PC2.
- Step 4:
- Calculate the initial dispatch cost, which includes the generation cost of thermal power units, bidding costs of DR units for power reduction and ancillary service, as well as the penalties.
4.3. Direct Search Procedure to Solve Multi-Area Power Generation Dispatch
- Step 1:
- Without violating the power generation limits of the units, the incremental costs (ICi and ICa) and the decremental costs (DCi and DCa) for each unit can be calculated when there is an increment or decrement for the adjustment of SP power generation, as shown in Equations (37) to (40).
- Step 2:
- All the pairs of units are examined to check if there is any improvement. If there is no improvement, then stop; otherwise, go to step 3.
- Step 3:
- A pair of units are chosen to perform adjustments to reach the maximum cost reduction. That is, a unit x with the minimum incremental cost ICx is chosen to increase its output by the specific SP adjustment. Simultaneously, a unit y (where x ≠ y) with the maximum decremental cost DCy is chosen to reduce its output by the specific SP adjustment. In this way, the net power balance is satisfied and the dispatch cost can be reduced. It should be noted that all units stay unchanged except x and y units. Subsequently, the DQD procedure is then proceeded to determine the optimal allocation of spinning reserve and satisfy the spinning reserve in each area.
- Step 4:
- The chosen x, y pair will adjust their output by the predefined step size SP, if it does not violate power generation limits. In this process, only the incremental cost for unit x and the decremental cost for unit y will be recalculated.
- Step 5:
- Go to step 2.
4.4. DQD to Solve Multi-Area Spinning Reserve Dispatch
- Step 1:
- Obtain the available capacity of spinning reserve that thermal units are able to provide.
- Step 2:
- Initialize the purchase of spinning reserve from ancillary services market.
- Step 3:
- The spinning reserve demand in each area can be satisfied by adding up the spinning reserve of that area itself and the spinning reserve that other areas can provide without violating inter-regional flow constraints.
- Step 4:
- If the requirement for spinning reserve is satisfied in each area?
- –
- Yes, go to step 7.
- –
- Otherwise, continue to Step 5.
- Step 5:
- If there is a congested area?
- –
- If there is no congestion, the system selects the DR user of ancillary service with the lowest bid for fulfilling the system reserve capacity. In addition, it takes the essential factors into consideration, including the bidding quantity of the DR user, the availability of inter-regional transmission capacity, and the demands for reserve capacity in that area to determine the actual purchase quantity of the DR user for ancillary service as given in (43)–(45).
- –
- If congestion occurs, the congested area allocates the required spinning reserve capacity to the DR user of ancillary service based on their bidding prices from low to high until the reserve capacity demand is satisfied.
- Step 6:
- Back to Step 3.
- Step 7:
- Calculate the purchase cost of reserve capacity and check the reserve capacity requirements in each area as well as the inter-regional flow constraints. If any violation of the constraints occurs, impose a penalty cost of PC1 and PC2.
4.5. Determination of Optimal Load Reduction and Optimal Spinning Reserve
5. Simulation Results and Case Study
5.1. Case Study 1: A System with Four Thermal Units
5.2. Case Study 2: A System of Two Areas with Four Thermal Units
5.3. Case Study 3: A System of Three Areas with 52 Thermal Units
6. Conclusions
Author Contributions
Funding
Data Availability Statement
Conflicts of Interest
Abbreviations
| total operating cost | |
| number of thermal units in system | |
| operation cost function of thermal unit i | |
| index for thermal units | |
| energy generation of thermal unit i | |
| coefficients to calculate the fuel costs for the thermal unit i | |
| energy bidding price function of DR unit for energy generation in area a | |
| energy generation of DR unit in area a | |
| load reduction in the jth user in segment qth of DR unit for energy generation in area a | |
| bidding price of the jth user in segment qth of DR unit for energy generation in area a | |
| the number of users in segment qth of DR unit for energy generation in area a | |
| reserve bidding price function of DR unit for spinning reserve in area a | |
| spinning reserve of DR unit in area a | |
| reserve capacity of the kth user DR unit for spinning reserve in area a | |
| bidding price of the kth user of DR unit for spinning reserve in area a | |
| total number users of DR unit for spinning reserve in area a | |
| load demand in area a | |
| spinning reserve requirements at each area | |
| spinning reserve of thermal unit i | |
| upper generation limit of thermal unit i | |
| lower generation limit of thermal unit i | |
| percentage of maximum unit capacity | |
| maximum spinning reserve contribution of thermal unit i | |
| the maximum energy reduction in DR unit in area a | |
| maximum of DR user for energy generation in area a | |
| minimum of DR user for energy generation in area a | |
| the highest bidding price of DR users for energy generation | |
| the number of the equivalent segment of DR unit for energy generation | |
| the maximum reserve capacity of DR unit for spinning reserve in area a | |
| maximum of DR user for spinning reserve in area a | |
| minimum of DR user for spinning reserve in area a | |
| the highest bidding price of DR users for spinning reserve in area a | |
| transfer power and flow limits from central area to northern area respectively | |
| transfer power and flow limits from southern area to central area respectively | |
| transfer spinning reserve from central area to northern area | |
| transfer spinning reserve from northern area to central are | |
| transfer spinning reserve from southern area to central area | |
| transfer spinning reserve from central area to southern area | |
| DB | demand bidding |
| DQD | dynamic queuing dispatch |
| DSM | direct search method |
| REGS | renewable energy generation system |
| DERs | distributed energy resources |
| VPP | virtual power plant |
| DR | demand response |
| LA | load aggregator |
| FIS | Fuzzy Inference System |
| ED | economic dispatch |
| MPC | Model Predictive Control |
| MESs | multi-energy systems |
| CBL | customer baseline load |
| HDSM | Hybrid Direct Search Method |
| SP | step size |
| RF | reduced factor |
References
- Chuang, Y.S.; Cheng, C.C.; Cheng, H.P. The current development of the energy storage industry in Taiwan: A snapshot. J. Energy Storage 2022, 53, 105117. [Google Scholar] [CrossRef]
- Zakaria, A.; Ismail, F.B.; Lipu, M.H.; Hannan, M.A. Uncertainty models for stochastic optimization in renewable energy applications. Renew. Energy 2020, 145, 1543–1571. [Google Scholar] [CrossRef]
- Tan, Z.; Ju, L.; Reed, B.; Rao, R.; Peng, D.; Li, H.; Pan, G. The optimization model for multi-type customers assisting wind power consumptive considering uncertainty and demand response based on robust stochastic theory. Energy Convers. Manag. 2015, 105, 1070–1081. [Google Scholar] [CrossRef]
- Li, Y.; Wang, C.; Li, G.; Chen, C. Optimal scheduling of integrated demand response-enabled integrated energy systems with uncertain renewable generations: A Stackelberg game approach. Energy Convers. Manag. 2021, 235, 113996. [Google Scholar] [CrossRef]
- Yu, S.; Fang, F.; Liu, Y.; Liu, J. Uncertainties of virtual power plant: Problems and countermeasures. Appl. Energy 2019, 239, 454–470. [Google Scholar] [CrossRef]
- Nosratabadi, S.M.; Hooshmand, R.A.; Gholipour, E. A comprehensive review on microgrid and virtual power plant concepts employed for distributed energy resources scheduling in power systems. Renew. Sustain. Energy Rev. 2017, 67, 341–363. [Google Scholar] [CrossRef]
- Riveros, J.Z.; Bruninx, K.; Poncelet, K.; D’haeseleer, W. Bidding strategies for virtual power plants considering CHPs and intermittent renewables. Energy Convers. Manag. 2015, 103, 408–418. [Google Scholar] [CrossRef]
- Abapour, S.; Mohammadi-Ivatloo, B.; Hagh, M.T. Robust bidding strategy for demand response aggregators in electricity market based on game theory. J. Clean. Prod. 2020, 243, 118393. [Google Scholar] [CrossRef]
- Wang, F.; Ge, X.; Li, K.; Mi, Z. Day-ahead market optimal bidding strategy and quantitative compensation mechanism design for load aggregator engaging demand response. IEEE Trans. Ind. Appl. 2019, 55, 5564–5573. [Google Scholar] [CrossRef]
- Lu, X.; Ge, X.; Li, K.; Wang, F.; Shen, H.; Tao, P.; Hu, J.; Lai, J.; Zhen, Z.; Shafie-khah, M.; et al. Optimal bidding strategy of demand response aggregator based on customers’ responsiveness behaviors modeling under different incentives. IEEE Trans. Ind. Appl. 2021, 57, 3329–3340. [Google Scholar] [CrossRef]
- Vahid-Ghavidel, M.; Javadi, M.S.; Santos, S.F.; Gough, M.; Mohammadi-Ivatloo, B.; Shafie-Khah, M.; Catalão, J.P. Novel hybrid stochastic-robust optimal trading strategy for a demand response aggregator in the wholesale electricity market. IEEE Trans. Ind. Appl. 2021, 57, 5488–5498. [Google Scholar] [CrossRef]
- Sumaiti, A.; Konda, S.R.; Panwar, L.; Gupta, V.; Kumar, R.; Panigrahi, B.K. Aggregated demand response scheduling in competitive market considering load behavior through fuzzy intelligence. IEEE Trans. Ind. Appl. 2020, 56, 4236–4247. [Google Scholar] [CrossRef]
- Long, Y.; Li, Y.; Wang, Y.; Cao, Y.; Jiang, L.; Zhou, Y.; Deng, Y.; Nakanishi, Y. Low-carbon economic dispatch considering integrated demand response and multistep carbon trading for multi-energy microgrid. Sci. Rep. 2022, 12, 6218. [Google Scholar] [CrossRef]
- Wang, L.; Jing, Z.X.; Zheng, J.H.; Wu, Q.H.; Wei, F. Decentralized optimization of coordinated electrical and thermal generations in hierarchical integrated energy systems considering competitive individuals. Energy 2018, 158, 607–622. [Google Scholar] [CrossRef]
- Marzbani, F.; Abdelfatah, A. Economic Dispatch Optimization Strategies and Problem Formulation: A Comprehensive Review. Energies 2024, 17, 550. [Google Scholar] [CrossRef]
- Nelson, J.R.; Johnson, N.G. Model predictive control of microgrids for real-time ancillary service market participation. Appl. Energy 2020, 269, 114963. [Google Scholar] [CrossRef]
- Vahid-Ghavidel, M.; Javadi, M.S.; Gough, M.; Santos, S.F.; Shafie-khah, M.; Catalão, J.P.S. Demand Response Programs in Multi-Energy Systems: A Review. Energies 2020, 13, 4332. [Google Scholar] [CrossRef]
- Liu, L.; Chen, X.; Li, D.; Liu, C.; Liu, D.; Li, G. Evaluation method for assessing the auxiliary service transaction mechanism in regional power markets. Glob. Energy Interconnect. 2023, 6, 238–252. [Google Scholar] [CrossRef]
- Wang, J.; Zhong, H.; Tang, W.; Rajagopal, R.; Xia, Q.; Kang, C.; Wang, Y. Optimal bidding strategy for microgrids in joint energy and ancillary service markets considering flexible ramping products. Appl. Energy 2017, 205, 294–303. [Google Scholar] [CrossRef]
- Das, S.; Basu, M. Day-ahead optimal bidding strategy of microgrid with demand response program considering uncertainties and outages of renewable energy resources. Energy 2020, 190, 116441. [Google Scholar] [CrossRef]
- Rezaei, N.; Pezhmani, Y.; Khazali, A. Economic-environmental risk-averse optimal heat and power energy management of a grid-connected multi microgrid system considering demand response and bidding strategy. Energy 2022, 240, 122844. [Google Scholar] [CrossRef]
- Nikpour, A.; Nateghi, A.; Shafie-Khah, M. Stochastic-risk based approach for microgrid participation in joint active, reactive, and ancillary services markets considering demand response. IEEE Open Access J. Power Energy 2022, 10, 2–13. [Google Scholar] [CrossRef]
- Nikpour, A.; Nateghi, A.; Shafie-khah, M.; Catalão, J.P. Day-ahead optimal bidding of microgrids considering uncertainties of price and renewable energy resources. Energy 2021, 227, 120476. [Google Scholar] [CrossRef]
- Naseri, A.; Fattaheian-Dehkordi, S.; Abbaspour, A.; Lehtonen, M. Day-Ahead Optimal Scheduling of Resources in a Distribution System in Joint Energy, Regulation and Ramp Markets. Int. Rev. Electr. Eng. 2023, 18, 1–14. [Google Scholar] [CrossRef]
- Wu, Y.; Shi, J.; Lim, G.J.; Fan, L.; Molavi, A. Optimal management of transactive distribution electricity markets with co-optimized bidirectional energy and ancillary service exchanges. IEEE Trans. Smart Grid 2020, 11, 4650–4661. [Google Scholar] [CrossRef]
- Taiwan Power Company. Demand Response Bidding Platform. Available online: https://dbp.taipower.com.tw/TaiPowerDBP/Portal/Login (accessed on 18 May 2025).
- Chen, C.L.; Chen, N. Direct search method for solving economic dispatch problem considering transmission capacity constraints. IEEE Trans. Power Syst. 2001, 16, 764–769. [Google Scholar] [CrossRef]
- Wong, K.P.; Fung, C.C. Simulated annealing based economic dispatch algorithm. In IEE Proceedings C Generation, Transmission and Distribution; IET Digital Library: Hertfordshire, UK, 1993; Volume 140, pp. 509–515. [Google Scholar]
- Walters, D.C.; Sheble, G.B. Genetic algorithm solution of economic dispatch with valve point loading. IEEE Trans. Power Syst. 1993, 8, 1325–1332. [Google Scholar] [CrossRef]
- Chaturvedi, K.T.; Pandit, M.; Srivastava, L. Self-organizing hierarchical particle swarm optimization for nonconvex economic dispatch. IEEE Trans. Power Syst. 2008, 23, 1079–1087. [Google Scholar] [CrossRef]
- Pradhan, M.; Roy, P.K.; Pal, T. Grey wolf optimization applied to economic load dispatch problems. Int. J. Electr. Power Energy Syst. 2016, 83, 325–334. [Google Scholar] [CrossRef]
- Taiwan Power Company. Demand Response Bidding Measures. Available online: https://dbp.taipower.com.tw/TaiPowerDBP/Portal/proj_data/%E9%9C%80%E9%87%8F%E7%AB%B6%E5%83%B9%E6%8E%AA%E6%96%BDDM.pdf (accessed on 1 November 2024).
- Taiwan Power Company. Ancillary Services Market. Available online: https://etp.taipower.com.tw (accessed on 18 May 2025).
- Chen, C.L.; Chen, Z.Y.; Lee, T.Y. Multi-area economic generation and reserve dispatch considering large-scale integration of wind power. Int. J. Electr. Power Energy Syst. 2014, 55, 171–178. [Google Scholar] [CrossRef]
- Wood, A.J.; Wollenberg, B.F.; Sheblé, G.B. Power Generation, Operation, and Control; John Wiley & Sons: Hoboken, NJ, USA, 2013. [Google Scholar]
- Chen, C.L. Non-convex economic dispatch: A direct search approach. Energy Convers. Manag. 2007, 48, 219–225. [Google Scholar] [CrossRef]
- Yalcinoz, T.; Short, M.J. Neural networks approach for solving economic dispatch problem with transmission capacity constraints. IEEE Trans. Power Syst. 1998, 13, 307–313. [Google Scholar] [CrossRef]
- Chen, C.L. Key issues of wind capacity integration in congested areas of the Taiwan power system. IET Renew. Power Gener. 2014, 8, 10–21. [Google Scholar] [CrossRef]


| Index of DR User | Load Reduction Capability (kW) | Accumulated Load Reduction (kW) | Price Quote (TWD/kWh) | Equivalent Segment Number | Accumulated Cost (TWD) | Load Reduction in Segment (kW) |
|---|---|---|---|---|---|---|
| 12 | 3.6 | 75.2 | 9.80 | 4 | 607.5 | 16.2 |
| 11 | 4.4 | 71.6 | 9.60 | |||
| 10 | 8.2 | 67.2 | 9.20 | |||
| 9 | 3.2 | 59 | 8.88 | 3 | 454.5 | 12.2 |
| 8 | 2.8 | 55.8 | 8.30 | |||
| 7 | 6.2 | 53 | 8.25 | |||
| 6 | 9.0 | 46.8 | 8.12 | 2 | 351.7 | 25.8 |
| 5 | 8.0 | 37.8 | 8.06 | |||
| 4 | 5.6 | 29.8 | 7.82 | |||
| 3 | 3.2 | 24.2 | 7.60 | |||
| 2 | 12.4 | 21 | 7.20 | 1 | 146.0 | 21.0 |
| 1 | 8.6 | 8.6 | 6.60 |
| Index of Thermal Unit | (MW) | (MW) | α (USD) | β (USD/MW) | γ (USD/MW2) |
|---|---|---|---|---|---|
| 1 | 600 | 150 | 561 | 7.92 | 0.001560 |
| 2 | 200 | 50 | 78 | 7.97 | 0.004820 |
| 3 | 400 | 100 | 310 | 7.85 | 0.001942 |
| 4 | 340 | 70 | 250 | 7.50 | 0.001810 |
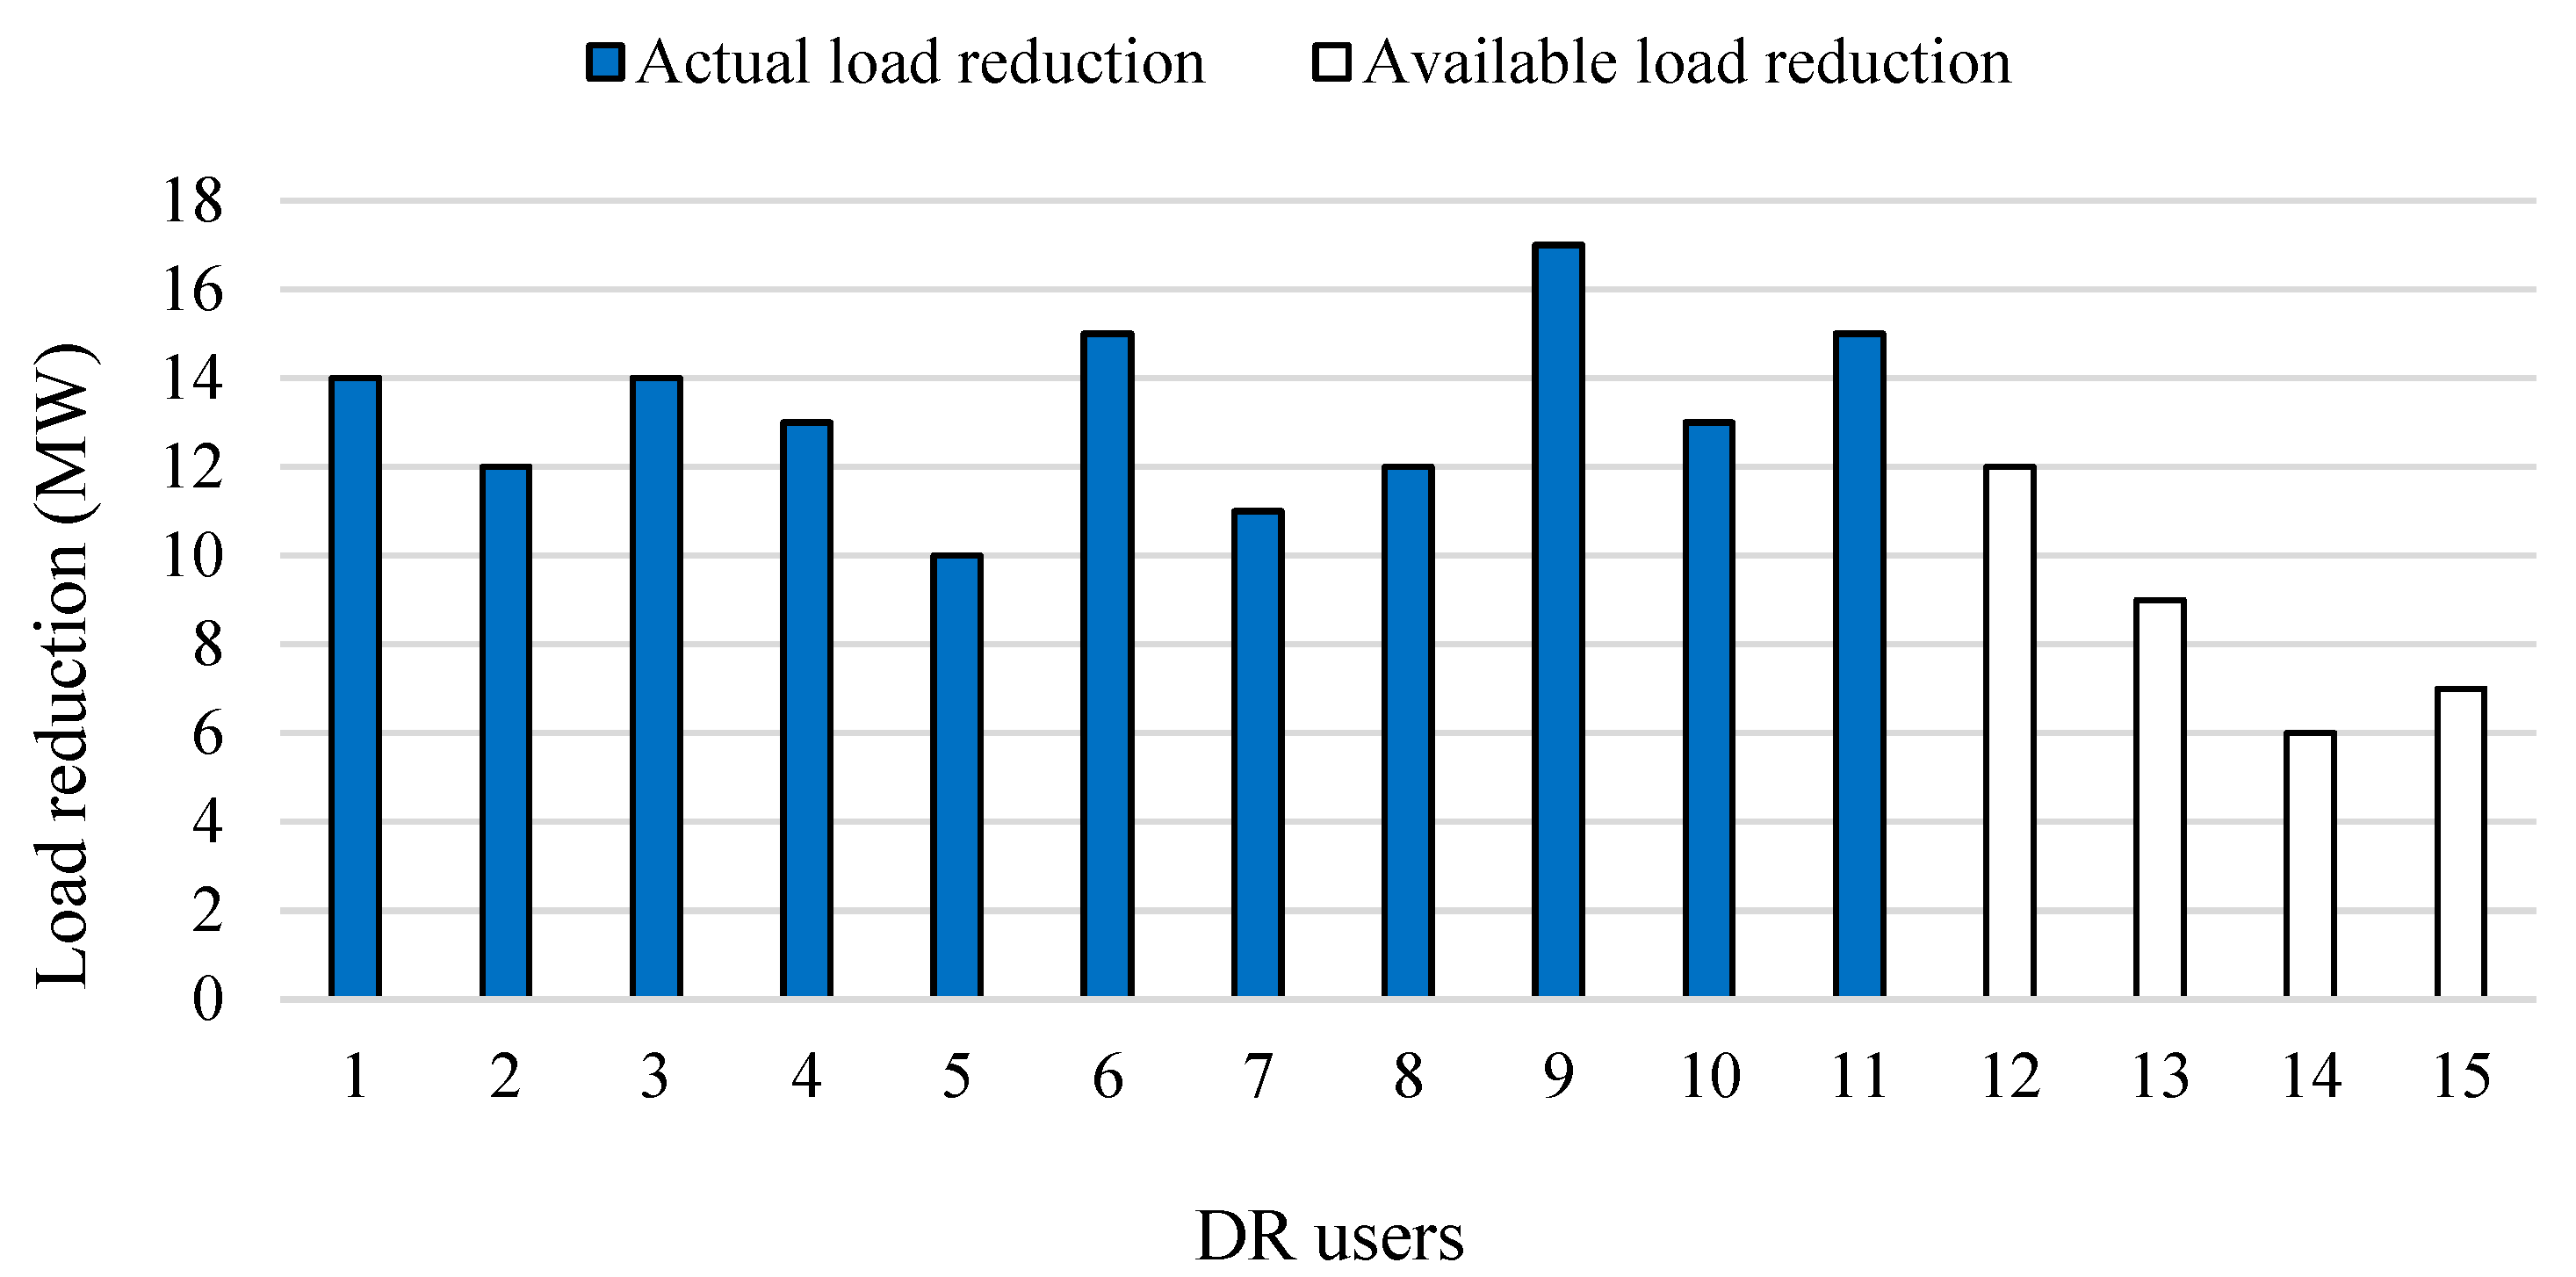
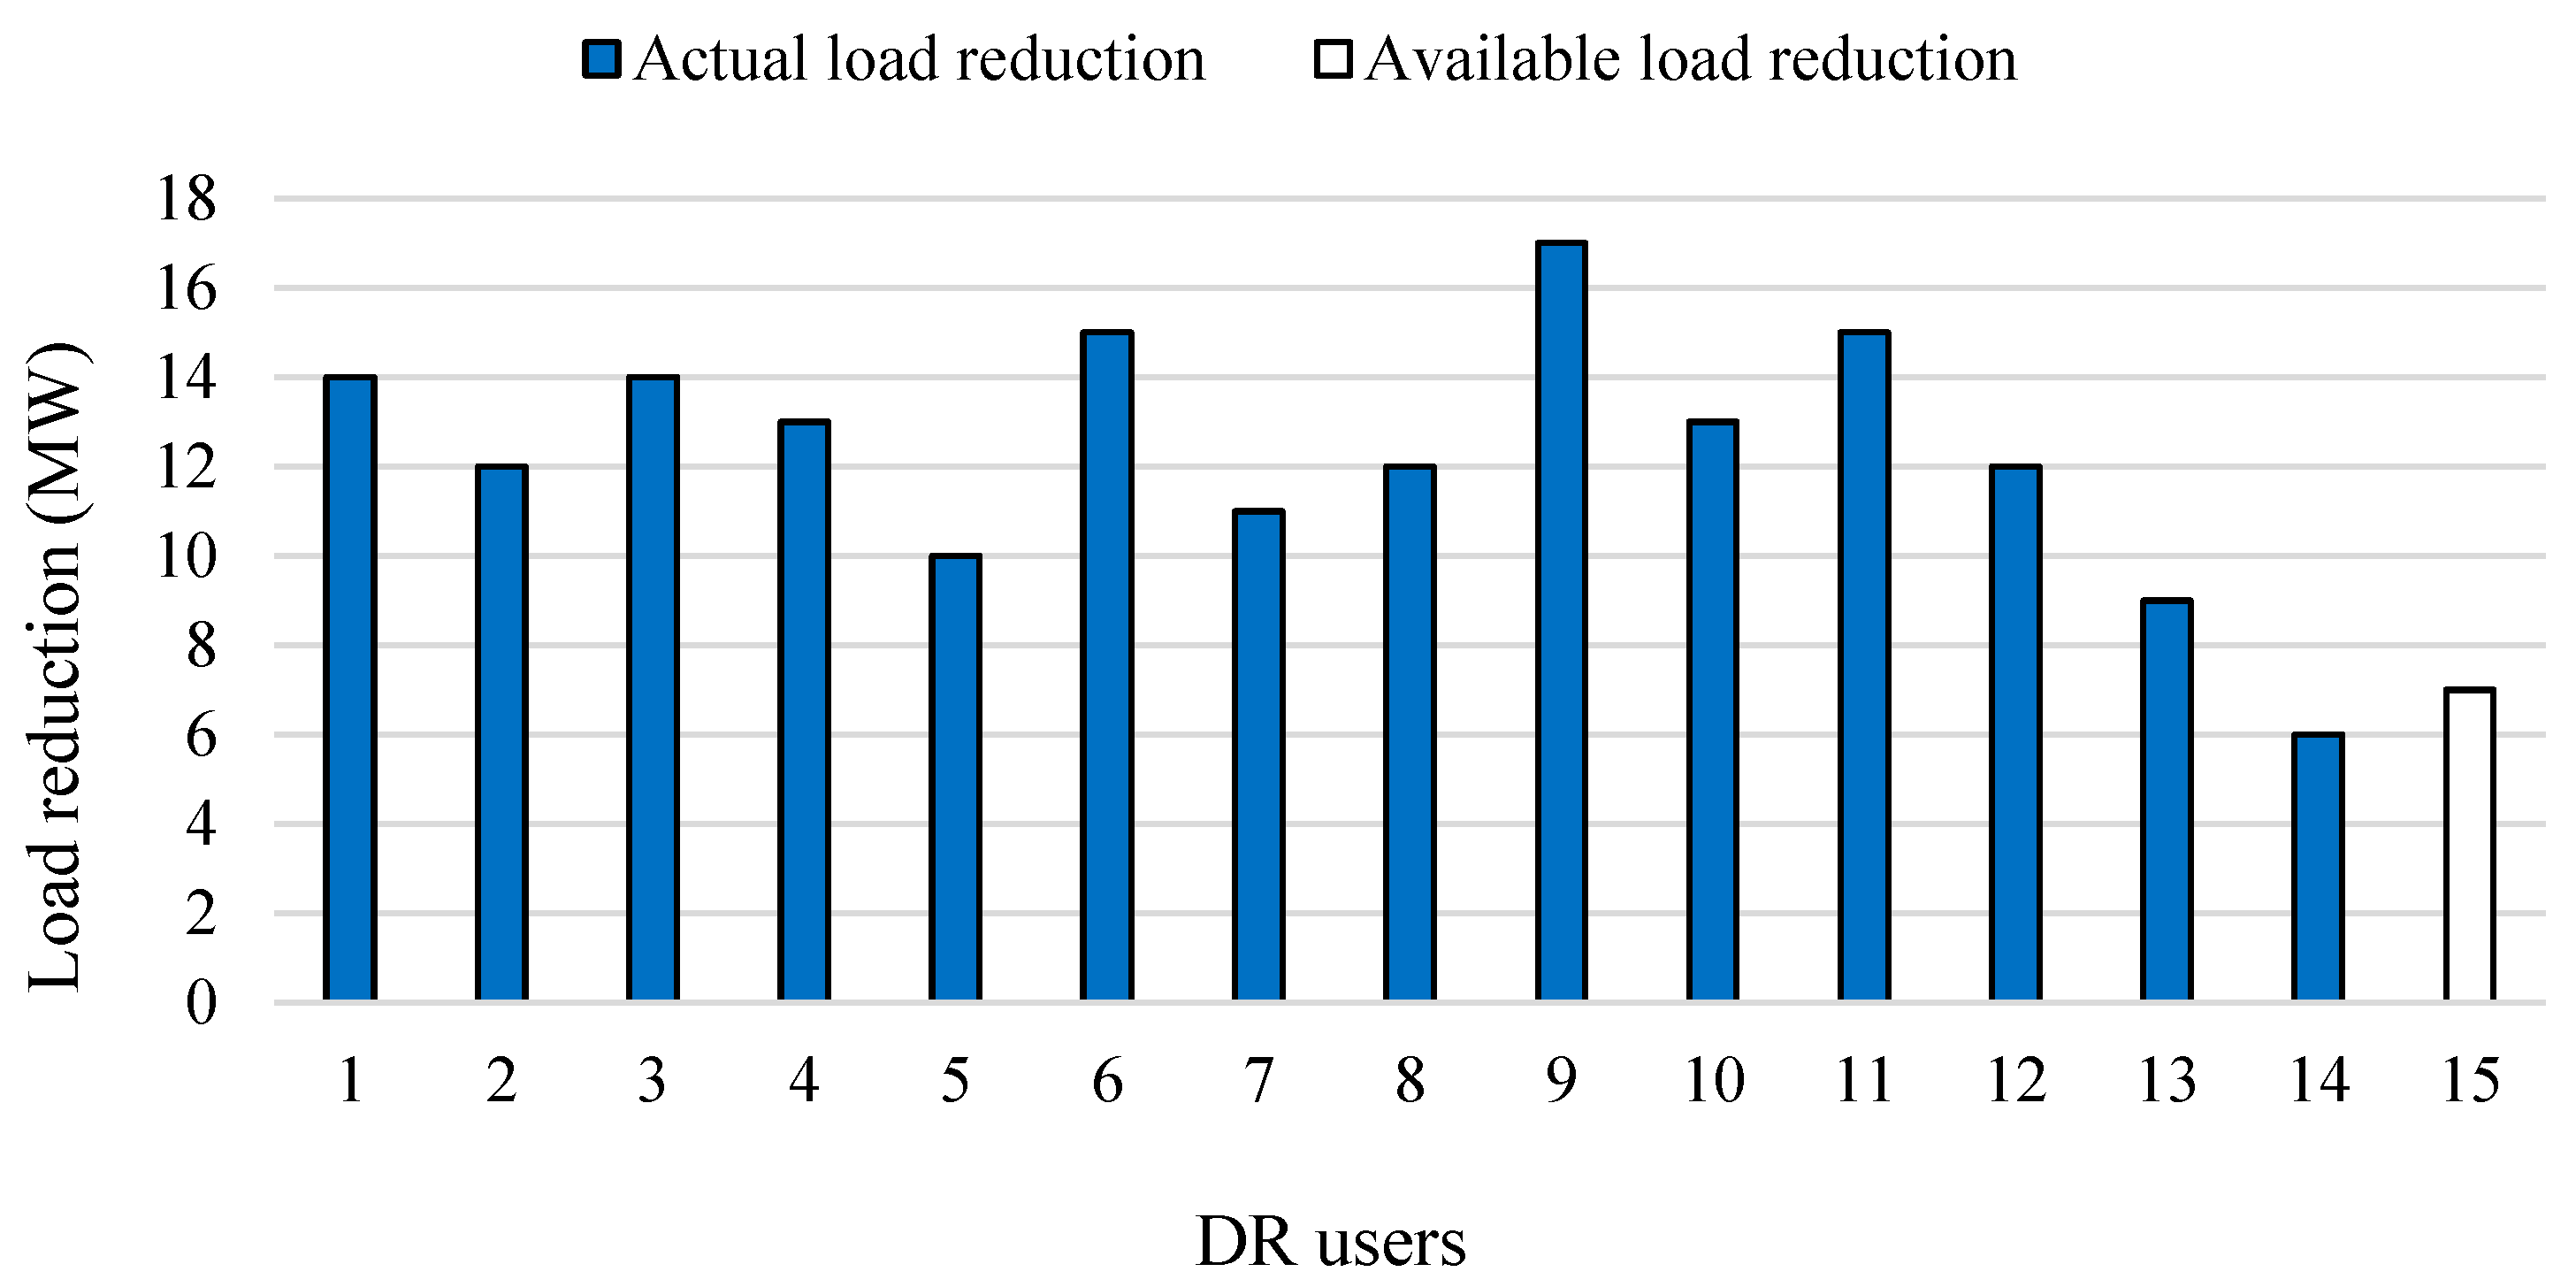
| Index of DR User | Availability of Load Reduction (MW) | Accumulated Load Reduction (MW) | Price Quote (USD/MWh) | Equivalent Segment Number | Accumulated Cost (USD) | Load Reduction in Segment (MW) |
|---|---|---|---|---|---|---|
| 15 | 7 | 180 | 9.86 | 6 | 1477.6 | 13 |
| 14 | 6 | 173 | 9.47 | |||
| 13 | 9 | 167 | 9.15 | 5 | 1351.8 | 21 |
| 12 | 12 | 158 | 9.06 | |||
| 11 | 15 | 146 | 8.85 | 4 | 1160.7 | 28 |
| 10 | 13 | 131 | 8.64 | |||
| 9 | 17 | 118 | 8.41 | 3 | 915.7 | 29 |
| 8 | 12 | 101 | 8.13 | |||
| 7 | 11 | 89 | 7.82 | 2 | 675.1 | 36 |
| 6 | 15 | 78 | 7.79 | |||
| 5 | 10 | 63 | 7.71 | |||
| 4 | 13 | 53 | 7.65 | 1 | 395.2 | 53 |
| 3 | 14 | 40 | 7.57 | |||
| 2 | 12 | 26 | 7.34 | |||
| 1 | 14 | 14 | 7.26 |
| Example | DR Users | Marginal Price (USD/MWh) | DR Unit (MW) | Cost (USD/h) | Bid Winner | Total Cost (USD/h) |
|---|---|---|---|---|---|---|
| 1.1 | Without DR users | 9.20 | --- | --- | --- | 11,310.29 |
| 1.2 | with DR users | 8.99 | 146.00 | 1161 | 1~11 | 11,142.47 |
| Example | DR Users | Thermal Unit (MW) | |||||||
|---|---|---|---|---|---|---|---|---|---|
| P1 | S1 | P2 | S2 | P3 | S3 | P4 | S4 | ||
| 1.1 | Without DR users | 412.40 | 60 | 128.29 | 20 | 349.29 | 40 | 310.00 | 30 |
| 1.2 | With DR users | 343.75 | 60 | 106.07 | 20 | 294.10 | 40 | 310.00 | 30 |
| Variation Step | Iteration | DR Unit | Total Cost (USD/h) | |
|---|---|---|---|---|
| Load Reduction (MW) | Cost (USD/h) | |||
| Initial soluiton | --- | 180 | 1477.63 | 11,257.95 |
| SP1 = 80 MW | 2 | 180 | 1477.63 | 11,175.99 |
| SP2 = 40 MW | 2 | 140 | 1107.62 | 11,157.15 |
| SP3 = 20 MW | 2 | 140 | 1107.62 | 11,146.44 |
| SP4 = 10 MW | 2 | 150 | 1196.96 | 11,145.66 |
| SP5 = 5 MW | 2 | 145 | 1151.87 | 11,143.94 |
| SP6 = 2.5 MW | 2 | 147.5 | 1174.31 | 11,143.23 |
| SP7 = 1.25 MW | 2 | 146.25 | 1162.98 | 11,142.81 |
| SP8 = 0.625 MW | 1 | 146.25 | 1162.98 | 11,142.65 |
| SP9 = 0.3125 MW | 3 | 145.93 | 1160.16 | 11,142.56 |
| SP10 = 0.15625 MW | 2 | 146.09 | 1161.56 | 11,142.52 |
| SP11 = 0.078125 MW | 1 | 146.00 | 1160.86 | 11,142.45 |
| Area | A | B |
|---|---|---|
| Thermal units | #1 and #2 | #3 and #4 |
| Load demand (MW) | 1120 | 480 |
| Required spinning reserve (MW) | 150 | 150 |
| DR users for energy generation (Load reduction) | Refer to Table 3 | Refer to Table 3 |
| DR users for ancillary service (Spinning reserve) | Refer to Table 8 | Refer to Table 8 |
| Load demand (MW) | 1600 | |
| Inter-regional power flow constraints (MW) | 300 | |
| Index for DR User | 1 | 2 | 3 | 4 | 5 |
|---|---|---|---|---|---|
| Price quote (USD/MWh) | 0.62 | 0.68 | 0.72 | 0.76 | 0.79 |
| Available capacity for spinning reserve (MW) | 16 | 10 | 15 | 12 | 13 |
| Index for DR User | 6 | 7 | 8 | 9 | 10 |
| Price quote (USD /MWh) | 0.81 | 0.83 | 0.84 | 0.86 | 0.89 |
| Available capacity for spinning reserve (MW) | 12 | 11 | 12 | 14 | 15 |
| Example | 2.1 | 2.2 | |
|---|---|---|---|
| Load demand (Area A/B) (MW) | 1120/480 | 1120/480 | |
| Required spinning reserve (Area A/B) (MW) | 150/150 | 150/150 | |
| Thermal units | Actual supply of energy generation: Area A (P1/P2) (MW) Area B (P3/P4) (MW) | 446/139 360/320.8 | 522.93/164.06 257.47/340 |
| Actual supply of spinning reserve: Area A (S1/S2) (MW) Area B (S3/S4) (MW) | 60/20 40/19.2 | 60/20 40/0 | |
| DR units for energy generation | Availability for load reduction: Area A/B (MW) | 180/180 | 180/180 |
| Actual supply of load reduction: Area A/B (MW) | 167/167 | 173/142.53 | |
| DR units for ancillary service | Availability for spinning reserve Area A/B (MW) | 130/130 | 130/130 |
| Actual supply of spinning reserve: Area A/B (MW) | 10.8/0 | 30/0 | |
| Power transmission line | Maximum limit (MW) | --- | 300 |
| Actual flow (MW) | 368 | 260 | |
| Economical results | |||
| Marginal prices for energy generation: Area A/B (USD/MWh) | 9.31/9.31 | 9.55/8.85 | |
| Bid winner of DR users for energy generation (Area A/Area B) | 1~13/1~13 | 1~14/1~11 | |
| Marginal prices for spinning reserve: Area A/B (USD/MWh) | 0.62/--- | 0.72/--- | |
| Bid winner of DR users for ancillary service (Area A/B) | 1/--- | 1~3/--- | |
| Total cost (USD/h) | 14,625.0 | 14,672.1 | |
| Variation Step | Iteration | Penalty (USD/h) | Total Cost (USD/h) |
|---|---|---|---|
| Initial solution | --- | 46,666.7 | 61,370.701 |
| SP1 = 80 MW | 2 | 0 | 14,696.362 |
| SP2 = 40 MW | 2 | 0 | 14,676.938 |
| SP3 = 20 MW | 1 | 0 | 14,673.564 |
| SP4 = 10 MW | 2 | 0 | 14,672.511 |
| SP5 = 5 MW | 2 | 0 | 14,672.364 |
| SP6 = 2.5 MW | 2 | 0 | 14,672.142 |
| SP7 = 1.25 MW | 1 | 0 | 14,672.139 |
| SP8 = 0.625 MW | 1 | 0 | 14,672.136 |
| SP9 = 0.3125 MW | 1 | 0 | 14,672.112 |
| SP10 = 0.15625 MW | 1 | 0 | 14,672.103 |
| SP11 = 0.0078125 MW | 2 | 0 | 14,672.098 |
| SP1 (MW) | RF | Total Cost (USD/h) |
|---|---|---|
| 80 | 8 | 14,672.1 |
| 4 | 14,672.1 | |
| 2 | 14,672.1 | |
| 60 | 8 | 14,672.1 |
| 4 | 14,672.1 | |
| 2 | 14,672.1 | |
| 40 | 8 | 14,672.1 |
| 4 | 14,672.1 | |
| 2 | 14,672.1 |
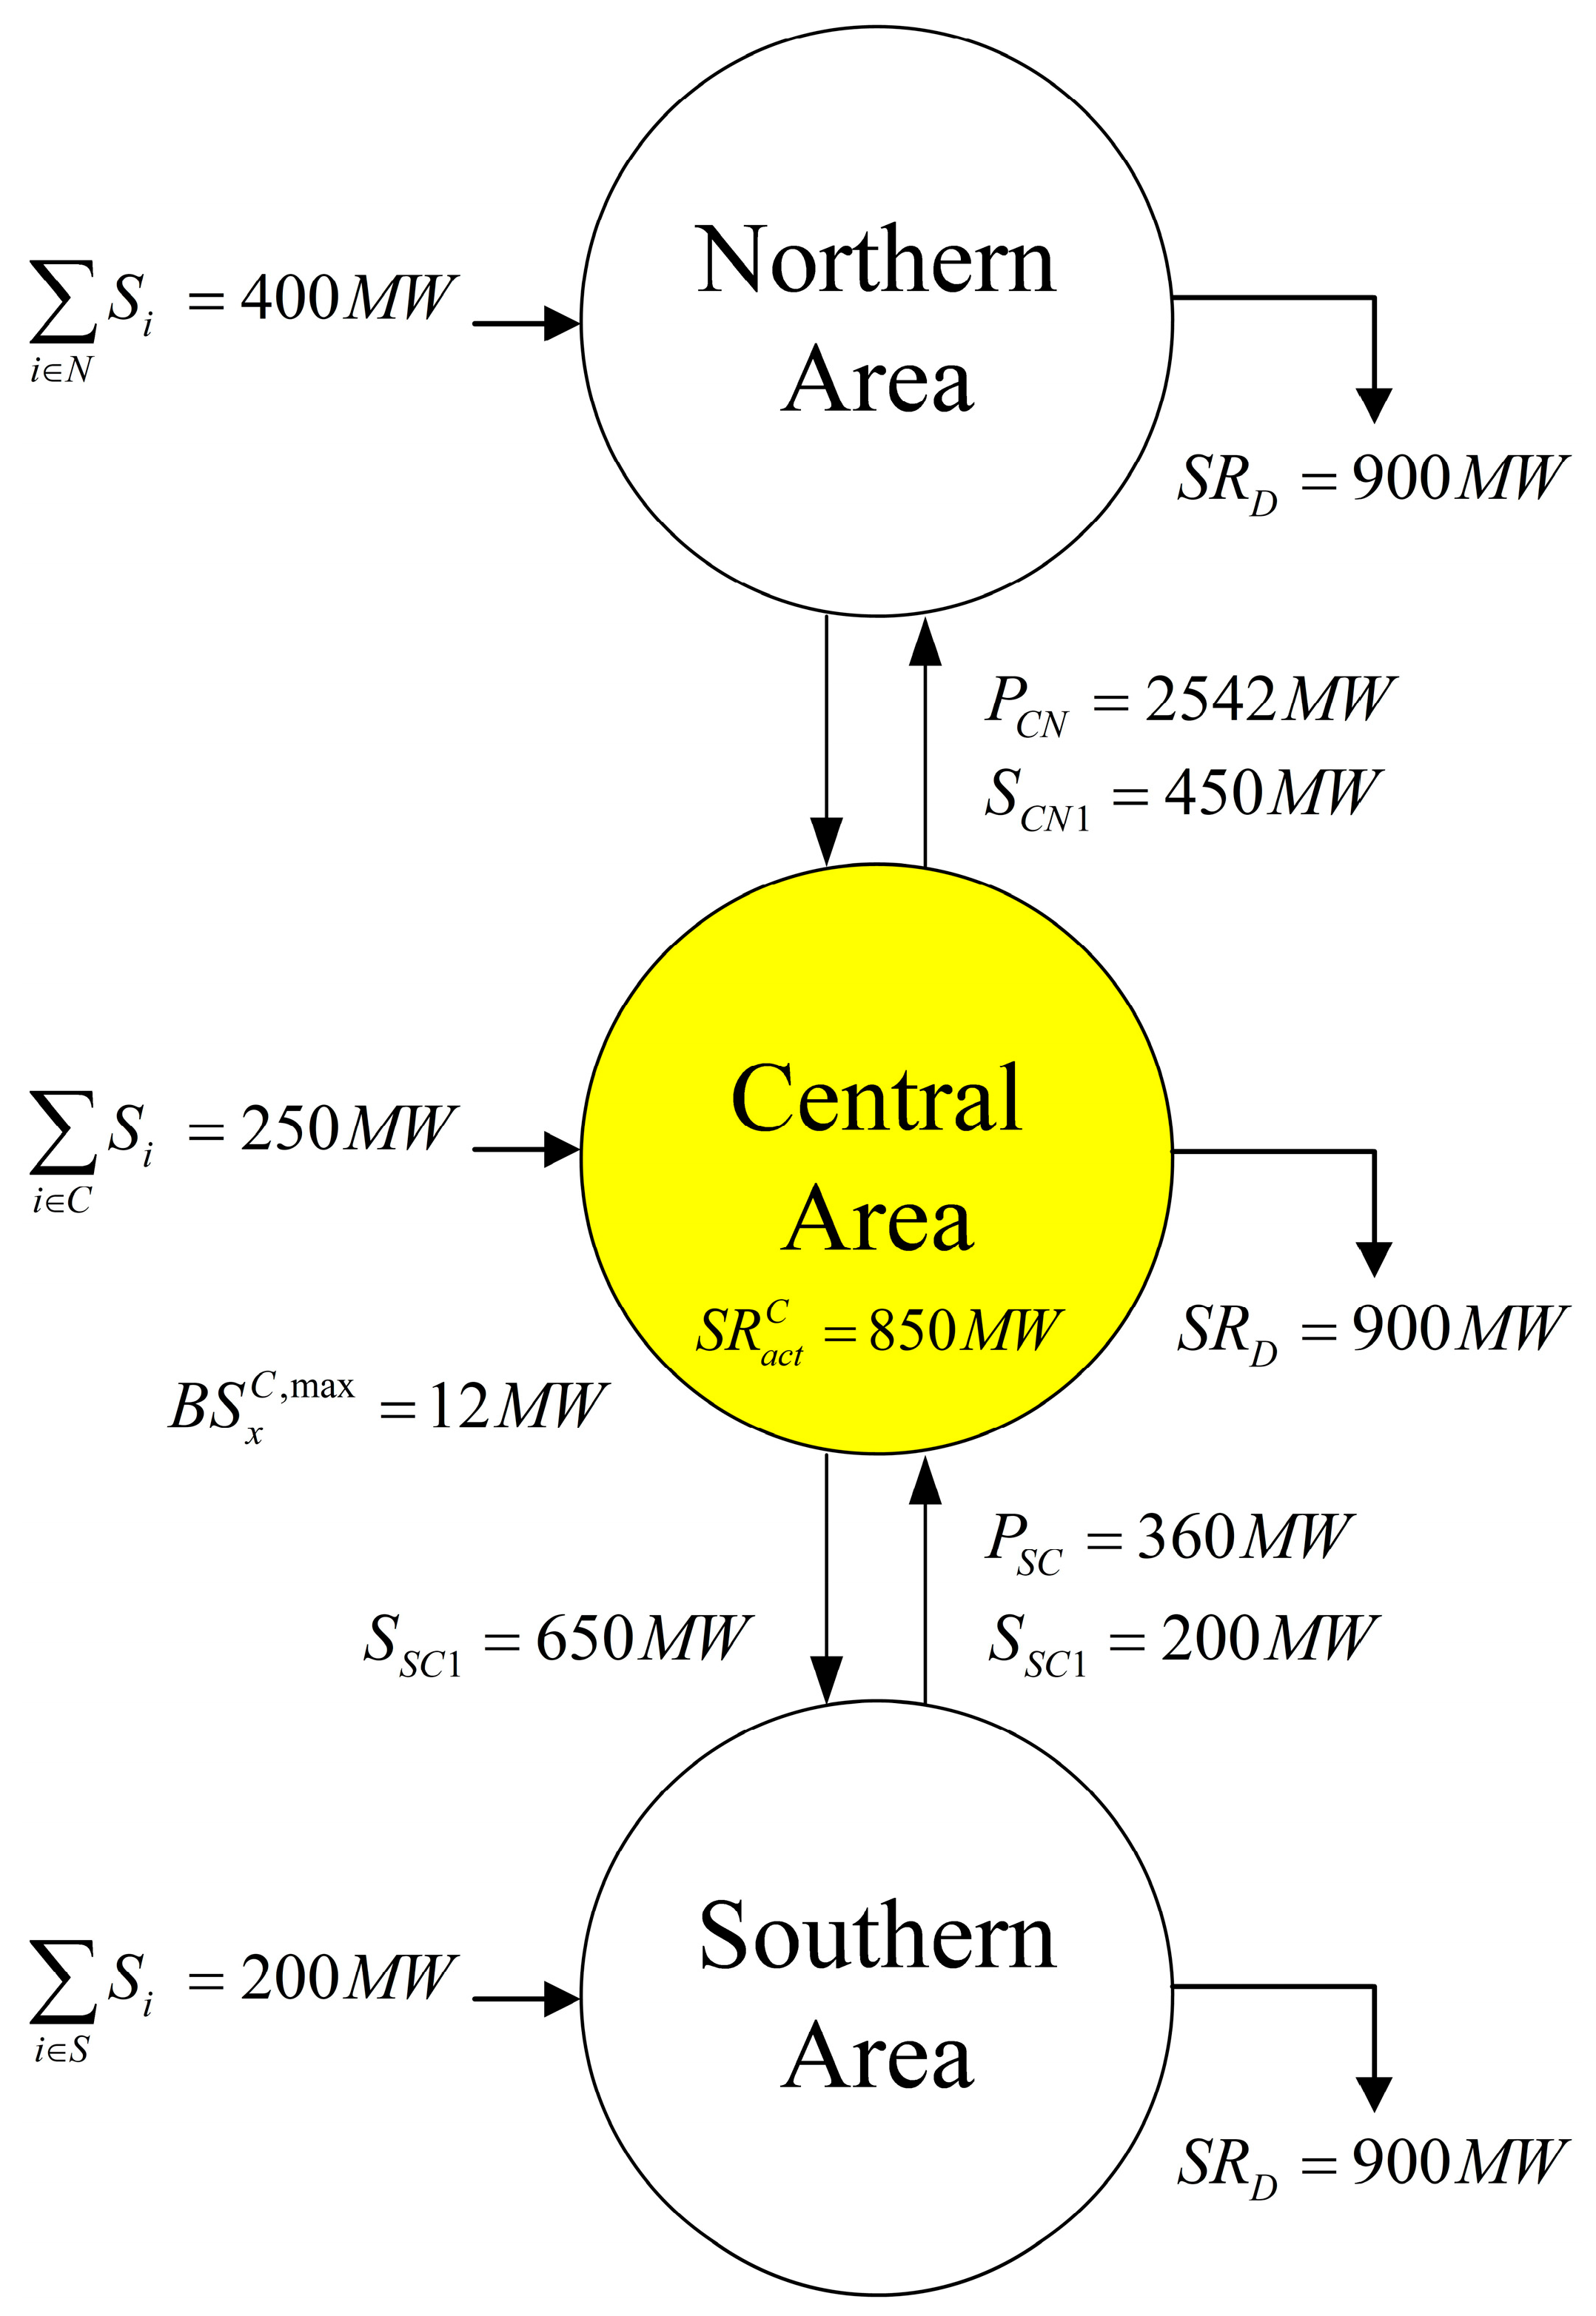
| Example | 3.1 | 3.2.1 | 3.2.2 | 3.3 | |
|---|---|---|---|---|---|
| Load demand (N/C/S) (MW) | 9000/3600/5400 | 9000/3600/5400 | 9000/3600/5400 | 9000/3600/5400 | |
| Required spinning reserve (N/C/S) (MW) | 900/900/900 | 900/900/900 | 900/900/900 | 900/900/900 | |
| Thermal units | Actual supply of energy generation: (N/C/S) (MW) | 6498/5714/5788 | 5509/5596/4849 | 5663/5555/4783 | 5502/5633/4924 |
| Actual supply of spinning reserve: (N/C/S) (MW) | 402/180/318 | 283/170/286 | 402/180/318 | 283/170/297 | |
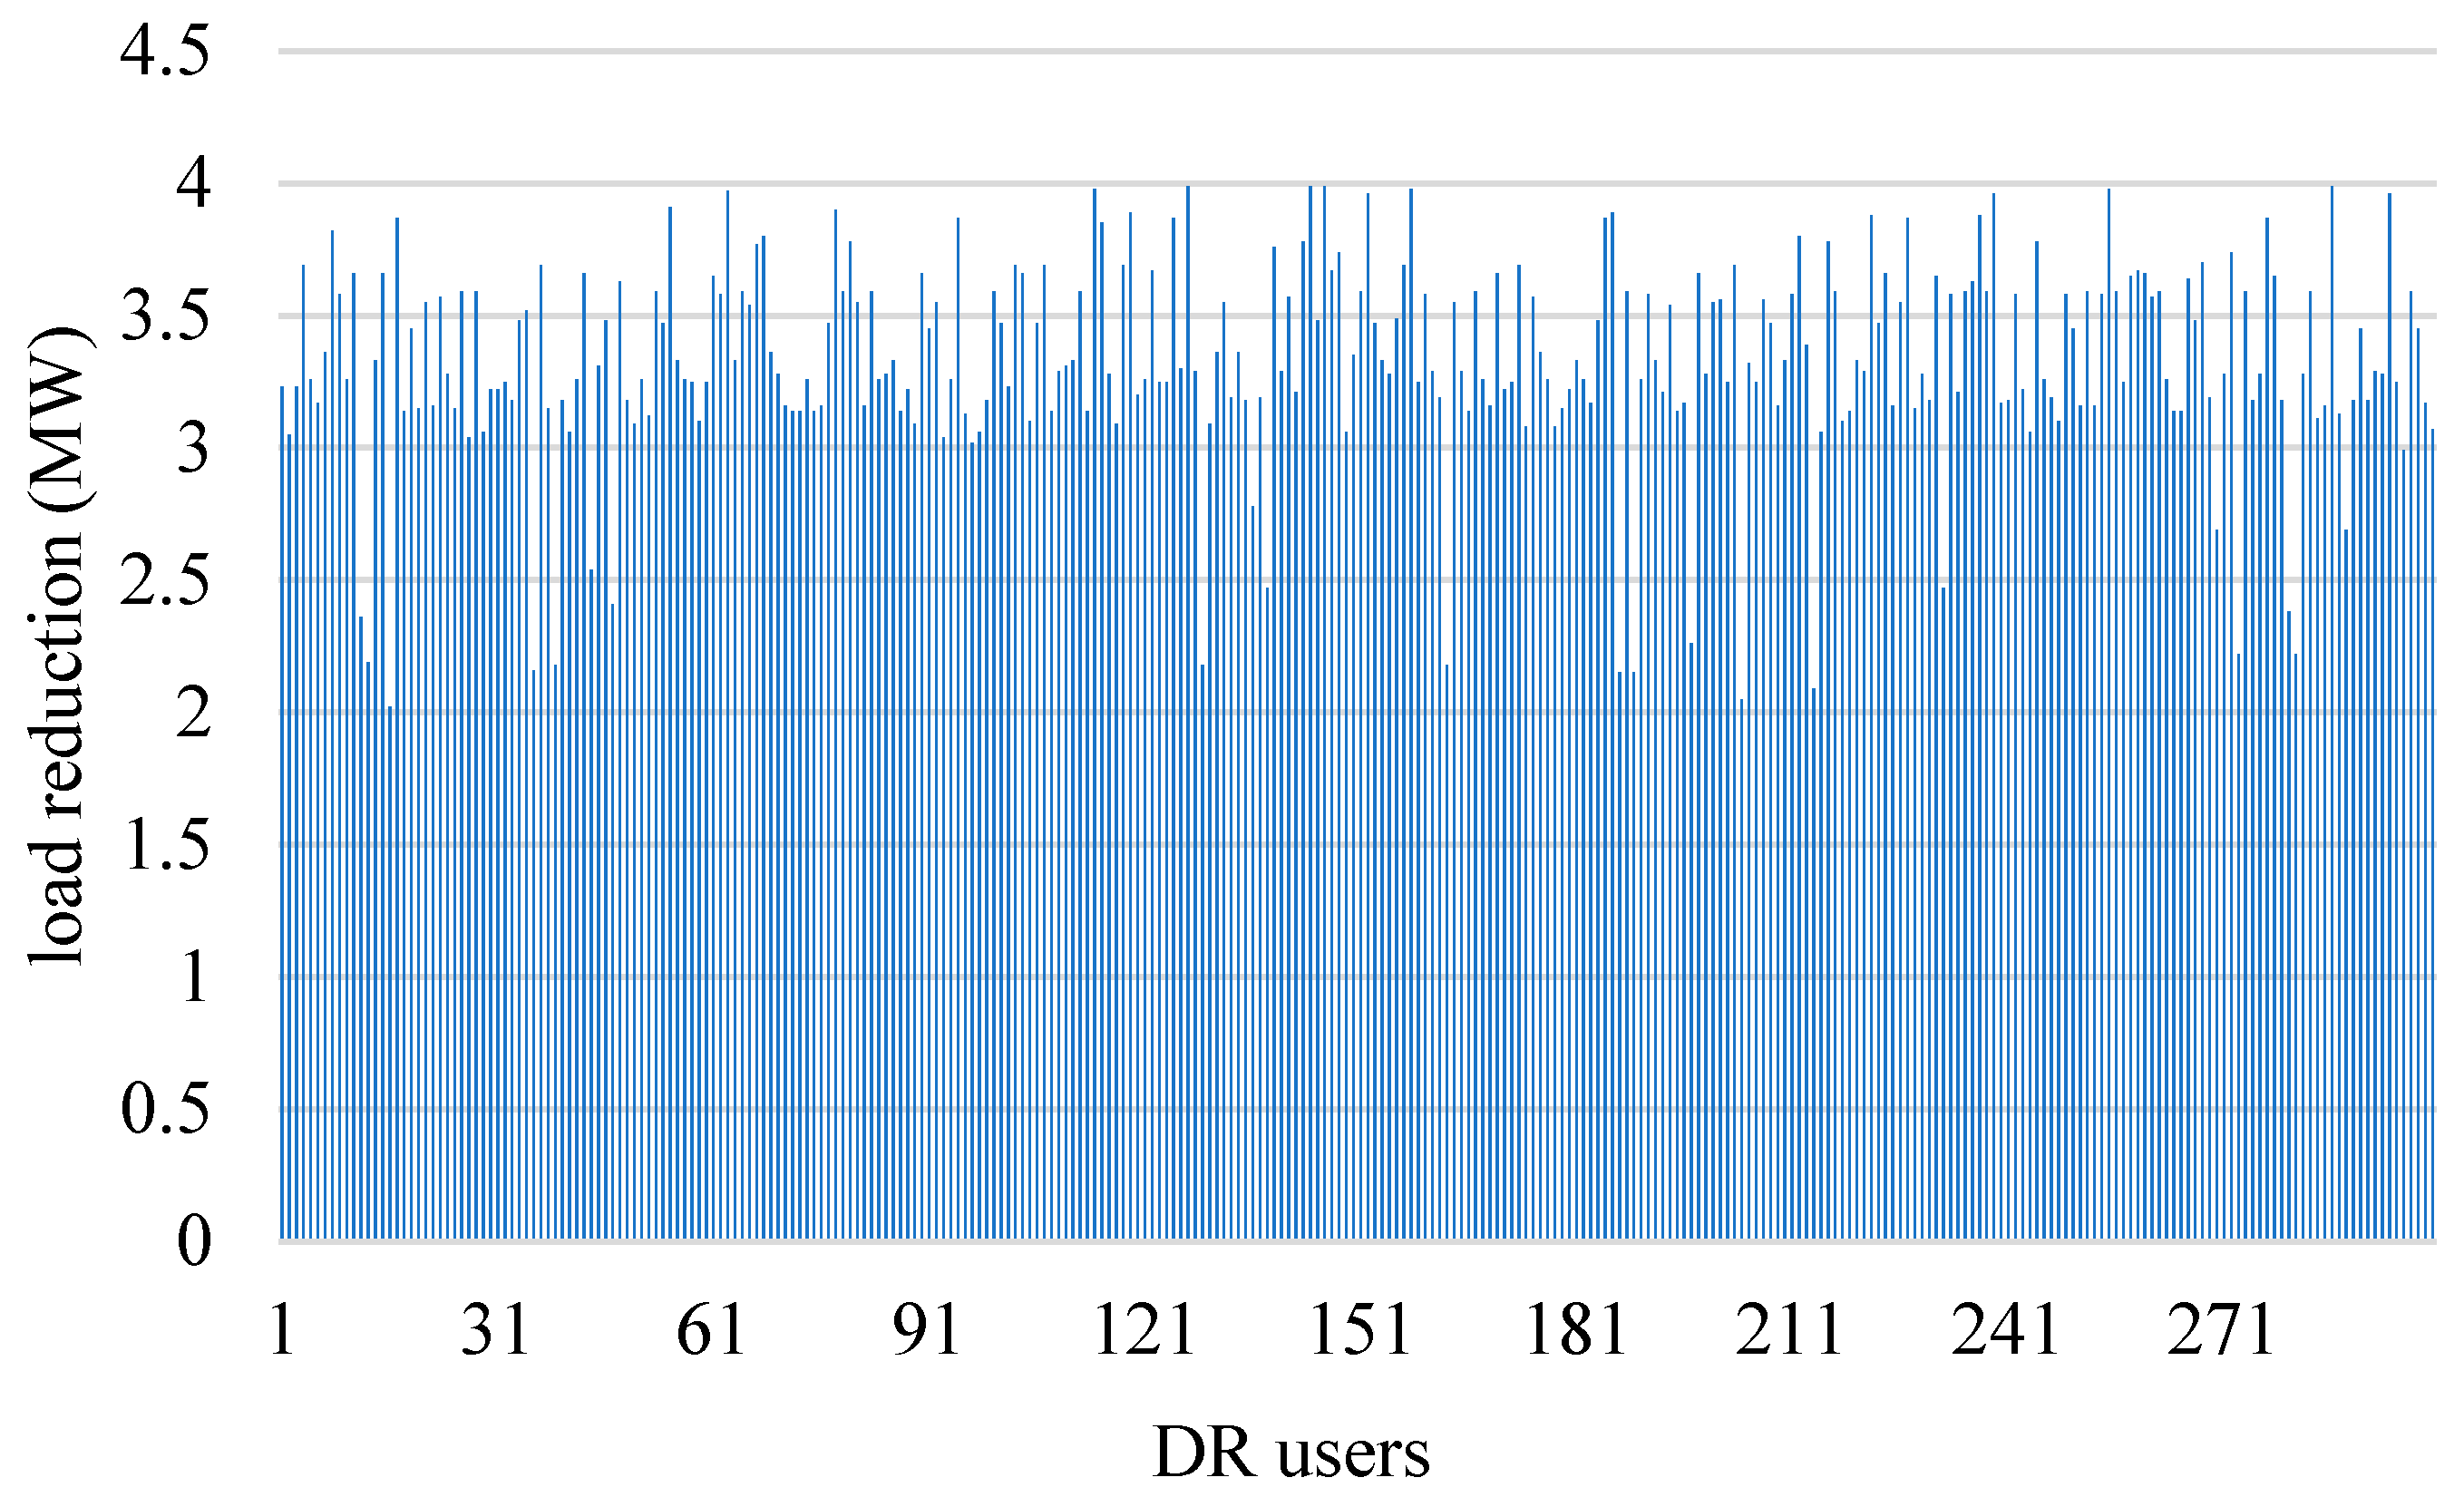
| DR units for energy generation | Availability for load reduction: (N/C/S) (MW) | --- | 1000/1000/1000 | 1000/1000/1000 | 1000/1000/1000 |
| Actual supply of load reduction: (N/C/S) (MW) | --- | 828/609/609 | 834/582/582 | 647/647/647 | |
| DR units for ancillary service | Availability for spinning reserve: (N/C/S) (MW) | --- | 300/300/300 | --- | 300/300/300 |
| Actual supply of spinning reserve: (N/C/S) (MW) | --- | 279/0/0 | --- | 49.71/49.71/49.42 | |
| Power transmission line | Maximum limit (/) (MW) | 3000/3000 | 3000/3000 | 3000/3000 | --- |
| Actual flow (PCN/PSC) (MW) | 2502/388 | 2662/58 | 2502/-35 | 2851/171 | |
| Economical results | |||||
| Marginal prices for energy generation: (N/C/S) (TWD/MWh) | 1436/944/944 | 877/774/774 | 879/762/762 | 791/791/791 | |
| Marginal prices for spinning reserve: (N/C/S) (TWD/MWh) | --- | 96/---/--- | --- | 82.4/82.4/82.4 | |
| Total cost (TWD/h) | 12,360,076 | 11,561,226 | 11,605,252 | 11,540,141 | |
| Variation Step | Iteration | Load Reduction (MW) (North/Center/South) | Spinning Reserve (MW) (North/Center/South) | Total Cost (TWD/h) |
|---|---|---|---|---|
| Initial solution | --- | 1000/812/0 | 123/92/89 | 11,713,046 |
| SP1 = 80 MW | 7 | 840/572/560 | 283/0/0 | 11,567,852 |
| SP2 = 40 MW | 3 | 840/612/600 | 283/0/0 | 11,563,906 |
| SP3 = 20 MW | 2 | 820/612/620 | 303/0/0 | 11,563,247 |
| SP4 = 10 MW | 5 | 830/602/610 | 273/0/0 | 11,562,003 |
| SP5 = 5 MW | 5 | 830/610/610 | 278/0/0 | 11,561,322 |
| SP6 = 2.5 MW | 4 | 828/609/608 | 278/0/0 | 11,561,277 |
| SP7 = 1.25 MW | 5 | 829/609/609 | 278/0/0 | 11,561,243 |
| SP8 = 0.625 MW | 4 | 828/609/609 | 279/0/0 | 11,561,231 |
| SP9 = 0.3125 MW | 3 | 828/609/609 | 279/0/0 | 11,561,228 |
| SP10 = 0.15625 MW | 5 | 828/609/609 | 279/0/0 | 11,561,226.6 |
| SP11 = 0.078125 MW | 2 | 828/609/609 | 279/0/0 | 11,561,226.1 |
| Load (MW) | Marginal Price for Energy Generation (TWD/MWh) | DR Unit for Energy Generation (MW) | Marginal Prices for Spinning Reserve (TWD/MWh) | DR Unit for Spinning Reserve (MW) | Total Cost (TWD/h) | ||||||||
|---|---|---|---|---|---|---|---|---|---|---|---|---|---|
| N | C | S | N | C | S | N | C | S | N | C | S | ||
| 16,000 | 622 | 622 | 622 | 260 | 260 | 260 | --- | --- | --- | --- | --- | --- | 10,128,682 |
| 16,500 | 661 | 661 | 661 | 345 | 345 | 345 | 81 | 81 | 81 | 30 | 30 | 30 | 10,449,880 |
| 17,000 | 724 | 699 | 699 | 496 | 440 | 440 | 87 | 80 | 80 | 124 | 4.3 | 1.3 | 10,791,601 |
| 17,500 | 808 | 728 | 728 | 715 | 507 | 507 | 88.5 | --- | --- | 149 | --- | --- | 11,161,920 |
| 18,000 | 877 | 773 | 773 | 828 | 609 | 609 | 95.8 | --- | --- | 279 | --- | --- | 11,561,226 |
Disclaimer/Publisher’s Note: The statements, opinions and data contained in all publications are solely those of the individual author(s) and contributor(s) and not of MDPI and/or the editor(s). MDPI and/or the editor(s) disclaim responsibility for any injury to people or property resulting from any ideas, methods, instructions or products referred to in the content. |
© 2025 by the authors. Licensee MDPI, Basel, Switzerland. This article is an open access article distributed under the terms and conditions of the Creative Commons Attribution (CC BY) license (https://creativecommons.org/licenses/by/4.0/).
Share and Cite
Cheng, Y.-S.; Chen, Y.-Y.; Tsai, C.-T.; Chen, C.-L. Optimal Multi-Area Demand–Thermal Coordination Dispatch. Energies 2025, 18, 2690. https://doi.org/10.3390/en18112690
Cheng Y-S, Chen Y-Y, Tsai C-T, Chen C-L. Optimal Multi-Area Demand–Thermal Coordination Dispatch. Energies. 2025; 18(11):2690. https://doi.org/10.3390/en18112690
Chicago/Turabian StyleCheng, Yu-Shan, Yi-Yan Chen, Cheng-Ta Tsai, and Chun-Lung Chen. 2025. "Optimal Multi-Area Demand–Thermal Coordination Dispatch" Energies 18, no. 11: 2690. https://doi.org/10.3390/en18112690
APA StyleCheng, Y.-S., Chen, Y.-Y., Tsai, C.-T., & Chen, C.-L. (2025). Optimal Multi-Area Demand–Thermal Coordination Dispatch. Energies, 18(11), 2690. https://doi.org/10.3390/en18112690