Article

Characteristics and Changes in the Properties of Cereal and Rapeseed Straw Used as Energy Feedstock

by
Mariusz Jerzy Stolarski
1,2,
Michał Welenc
1,
Michał Krzyżaniak
1,
Ewelina Olba-Zięty
1,2,
Jakub Stolarski
1 and
Sławomir Wierzbicki
3,*
1
Department of Genetics, Plant Breeding and Bioresource Engineering, Faculty of Agriculture and Forestry, University of Warmia and Mazury in Olsztyn, 10-724 Olsztyn, Poland
2
Centre for Bioeconomy and Renewable Energies, University of Warmia and Mazury in Olsztyn, Plac Łódzki 3, 10-719 Olsztyn, Poland
3
Department of Mechatronics, Faculty of Technical Sciences, University of Warmia and Mazury in Olsztyn, Oczapowskiego 11, 10-719 Olsztyn, Poland
*
Author to whom correspondence should be addressed.
Energies 2024, 17(5), 1243; https://doi.org/10.3390/en17051243
Submission received: 25 January 2024 / Revised: 1 March 2024 / Accepted: 3 March 2024 / Published: 5 March 2024
(This article belongs to the Special Issue New Trends in Biofuels and Bioenergy for Sustainable Development II)

Abstract

:
Solid biofuels, including straw as production residue, are still the largest energy feedstock in the structure of primary energy production from renewable energy sources. However, the properties of straw as a solid biofuel can vary depending on the species from which it was produced and the harvest period and year. Therefore, this study aimed to assess the thermophysical properties and elemental composition of six types of straw (rye, oat, triticale, wheat, corn, and rapeseed straw) obtained over three consecutive years (2020, 2021, 2022). Rye straw had the lowest moisture (mean: 10.55%), ash (mean: 2.71% DM), nitrogen (mean: 0.54% DM) and chlorine (mean: 0.046% DM) contents and the highest carbon content (mean: 47.93% DM), a higher heating value—HHV (mean: 19.03 GJ Mg−1 DM) and a lower heating value—LHV (mean: 15.71 GJ Mg−1). Triticale straw had similar properties, classifying it into the same cluster as rye straw. Corn straw had a remarkably high moisture content (mean: 48.91%), low LHV and high chlorine content. Rapeseed straw contained high levels of Cl, S, N and ash, and they were 643%, 481%, 104% and 169% higher, respectively, than those in rye straw. The sulfur, chlorine and moisture contents of the six straw types under study were highly variable during the three years of the study. Knowledge of the properties of different types of straw as energy feedstocks facilitates the logistics and organization of the supply of bioenergy installations. However, further research is needed, especially studies assessing the energy intensity and logistical costs of different types of straw used for energy purposes.

1. Introduction

Renewable energy sources (RES) play an increasingly important role in the European Union’s (EU’s) energy supply. The average share of energy from RES in the EU was 23.0% in 2022 [1]. Sweden was the leader in this regard (66.0%), although the RES share was also high in Finland, Latvia and Denmark (47.9%, 43.3% and 41.6%, respectively). The share of energy from RES in Poland was much lower during this period and amounted to 16.9%. This value was only lower in five other EU countries. The share of solid biofuels in individual renewable energy carriers is still the highest because they accounted for more than 41.2% in the EU, and the figure was particularly high in Poland (64.5%) [2]. This is why analysis of the available sources and quality of solid biofuels is a topical issue. Solid biomass as an energy feedstock is usually obtained from forests as residue after clearing or logging (e.g., small and large branches and treetops unsuitable for industrial purposes). Considerable amounts of dendromass residues are obtained from the wood processing industry (edgings, shavings, sawdust, bark, etc.) [3,4,5,6]. The food processing industry is also a source of biomass for energy generation, both as solid biofuels and feedstock for biogas production. Agriculture can also provide solid biofuels from plantations of perennial industrial crops, which is particularly interesting when such plantations are set up on marginal soil [7,8,9,10,11]. However, straw is now the main type of solid biomass derived from agriculture. It is a residue generated mainly from cereals and oilseed crops [12].
Straw from cereals and oilseed crops has been used directly in agriculture as bedding, fodder and organic fertilizer to stabilize the organic matter content in soil [12]. Moreover, it can be used as a substrate for the production of mushrooms, as an insulation and construction material [13], and it can find a potential application in the food and biopharmaceutical industries [14] and as a substitute in the paper industry [15,16]. Excessive amounts of straw have been produced recently, mainly due to higher yield resulting from an increase in the share of cereals and rapeseed in crop cultivation and a decrease in the farm animal population, mainly cattle, sheep and horses. Therefore, using excess straw as an energy feedstock is an important element of its utilization, directly contributing to the generation of larger amounts of green energy [17]. It is assumed that, without detriment to animal production and the soil organic matter balance and other alternative uses of straw, 25% of the annual straw output can be used for energy purposes [12].
The volume of obtainable straw directly depends on the surface on which the cereals and oilseed crops are cultivated and the crop species, cultivar, cultivation technology, climate and soil conditions, applied agrotechnical procedures, harvest technology, etc. [12,18]. An analysis of the straw potential in the Baltic Sea Region (BSR) showed that the theoretical potential of straw from cereals and oilseed crops in Poland was 30 million Mg year−1, while it was up to 45 million Mg year−1 in Germany [12]. The technical potential of straw for energy purposes (after its use in agriculture and other sectors is considered) was six times lower than the theoretical potential. Therefore, the technical potential of straw in Poland was 5.1 million Mg year−1, whereas it was nearly 7.5 million Mg year−1 in Germany and ca. 1.6 million Mg year−1 in Denmark (where the area used to cultivate these crops is much smaller). The technical potential of straw in the other BSR countries under analysis was below 1 million Mg year−1. This was calculated to be 34% of such potential in the entire EU.
There will always be differences between countries regarding the amount of straw obtainable for energy purposes, which is a consequence of the abovementioned factors. It is also true that there are considerable amounts of this solid biofuel. Straw is used as feedstock in the production of biogas [19,20], gaseous fuels [21], liquid fuels [22,23] and solid fuels [24]. Straw as a solid fuel (in pressed forms, such as briquette and pellet) is used to generate heat and electricity. Therefore, assessing the properties of straw as a solid biofuel is a topical issue. The research hypothesis assumed that the properties of straw as an energy feedstock would vary significantly depending on the plant species and the period of harvesting. Therefore, this study aimed to assess the thermophysical properties and elemental composition of six types of straw obtained in northeastern Poland for three consecutive years (2020, 2021, 2022).

2. Materials and Methods

2.1. Material and Research Factors

Six types of straw as residue from the production of cereals and oilseed were used as the study material and the first factors in this study. There were five types of cereal straw (rye, oat, triticale, wheat and corn straw) and one type of oilseed crop straw (rapeseed straw). The three years when the straw was obtained (2020, 2021, 2022) constituted the second factor. All straw types were obtained over three years from fields in northeastern Poland owned by the University of Warmia and Mazury in Olsztyn (UWM). Rye, oat, triticale, wheat and rapeseed straws were obtained in August of each year, i.e., in summer during the harvest, when the average monthly air temperature in this region of Poland was about 18 °C. The corn straw was obtained in November when the grain was ripe, which usually happens in late autumn when the average air temperature is only about 4 °C. Samples of pure straw (without weeds and other organic or mineral contaminants) for analyses were collected randomly each year from production fields immediately after the harvest of the main crop (i.e., grain or seeds). A collective sample of a specific type of straw weighing about 1 kg was packed in plastic bags and transported to the UWM laboratory for further analyses and assays. The fertilization rates for individual crop species in each year of the experiment are shown in Table 1.

2.2. Laboratory Analyses

Laboratory samples were isolated from the straw samples supplied from the field. The analyses started with the determination of moisture content (MC). The straw was dried at 105 °C in an FD BINDER drier (BINDER, Tuttlingen, Germany) until a constant mass was achieved, as per the standard PN-EN ISO 18134-2 [25]. Subsequently, the dried straw was ground with a Retsch SM 200 (Retsch, Haan, Germany) mill with a 1 mm mesh mill. The carbon (C), hydrogen (H) and sulfur content (S) of the straw was determined with an ELTRA CHS-500 (ELTRA, Neuss, Germany) automatic analyzer in accordance with PN-EN ISO 16948:2015-07 [26] and PN-EN ISO 16994:2016-10 [27]. The nitrogen (N) content was determined by the Kjeldahl method with a K-435 mineralizer and a BUCHI B-324 (BUCHI, Flawil, Switzerland) distilling device. The chlorine (Cl) content was determined in accordance with PN-ISO 587:2000 with the Eschka mixture [28]. The ash content of the straws under analysis was determined at a temperature of 550 °C, and the fixed carbon (FC) and volatile matter (VM) content at 650 °C, using an Eltra Tga-Thermostep thermogravimetric oven (ELTRA, Neuss, Germany), as per the standards PN-EN ISO 18122:2016-01 [29] and PN-EN ISO 18123:2016-01 [30]. The higher heating value (HHV) was determined in an IKA C2000 calorimeter (IKA, Taufen, Germany) by the dynamic method. In the next step, lower heating value (LHV) was calculated from HHV, MC and H content, as per the norm PN-EN ISO 18125:2017-07 [31] (Equation (1)). It should also be added that there may be different heating value models for the different biomass fuels [32,33]. All laboratory analyses for each straw type in each year were performed in three replicates.
LHV = (HHV − 206 × H) × (1 − 0.01 × MC) − 23.0 × MC
where
  • LHV—lower heating value (J g−1),
  • HHV—higher heating value (J g−1 DM),
  • H—hydrogen content (% DM),
  • MC—moisture content (%).

2.3. Statistical Analysis

The statistical analyses were based on a two-way analysis of variance (ANOVA). The six straw types were the first factor, and the three consecutive harvest years constituted the second factor. The arithmetic means and the standard deviations were calculated for all the thermophysical properties and the elemental composition. Homogeneous groups were identified with Tukey’s honestly significant difference (HSD) test at the level of significance of p < 0.05. The Pearson correlation coefficient between the attributes was also determined. The descriptive statistics, such as mean, coefficient of variance, standard deviation, upper and lower quartile, and minimum and maximum values, were determined for the whole data set for the straw types under study. Moreover, an agglomerative hierarchical clustering analysis by Ward’s method was performed for the straw types and their properties. Clusters were identified with Sneath’s criterion. Two cut-off lines were applied: the first at 2/3 Dmax and the second at 1/3 Dmax, where Dmax denoted the maximum measure of distance D. All the statistical analyses were performed with STATISTICA 13 (TIBCO Software Inc., Palo Alto, CA, USA).

3. Results and Discussion

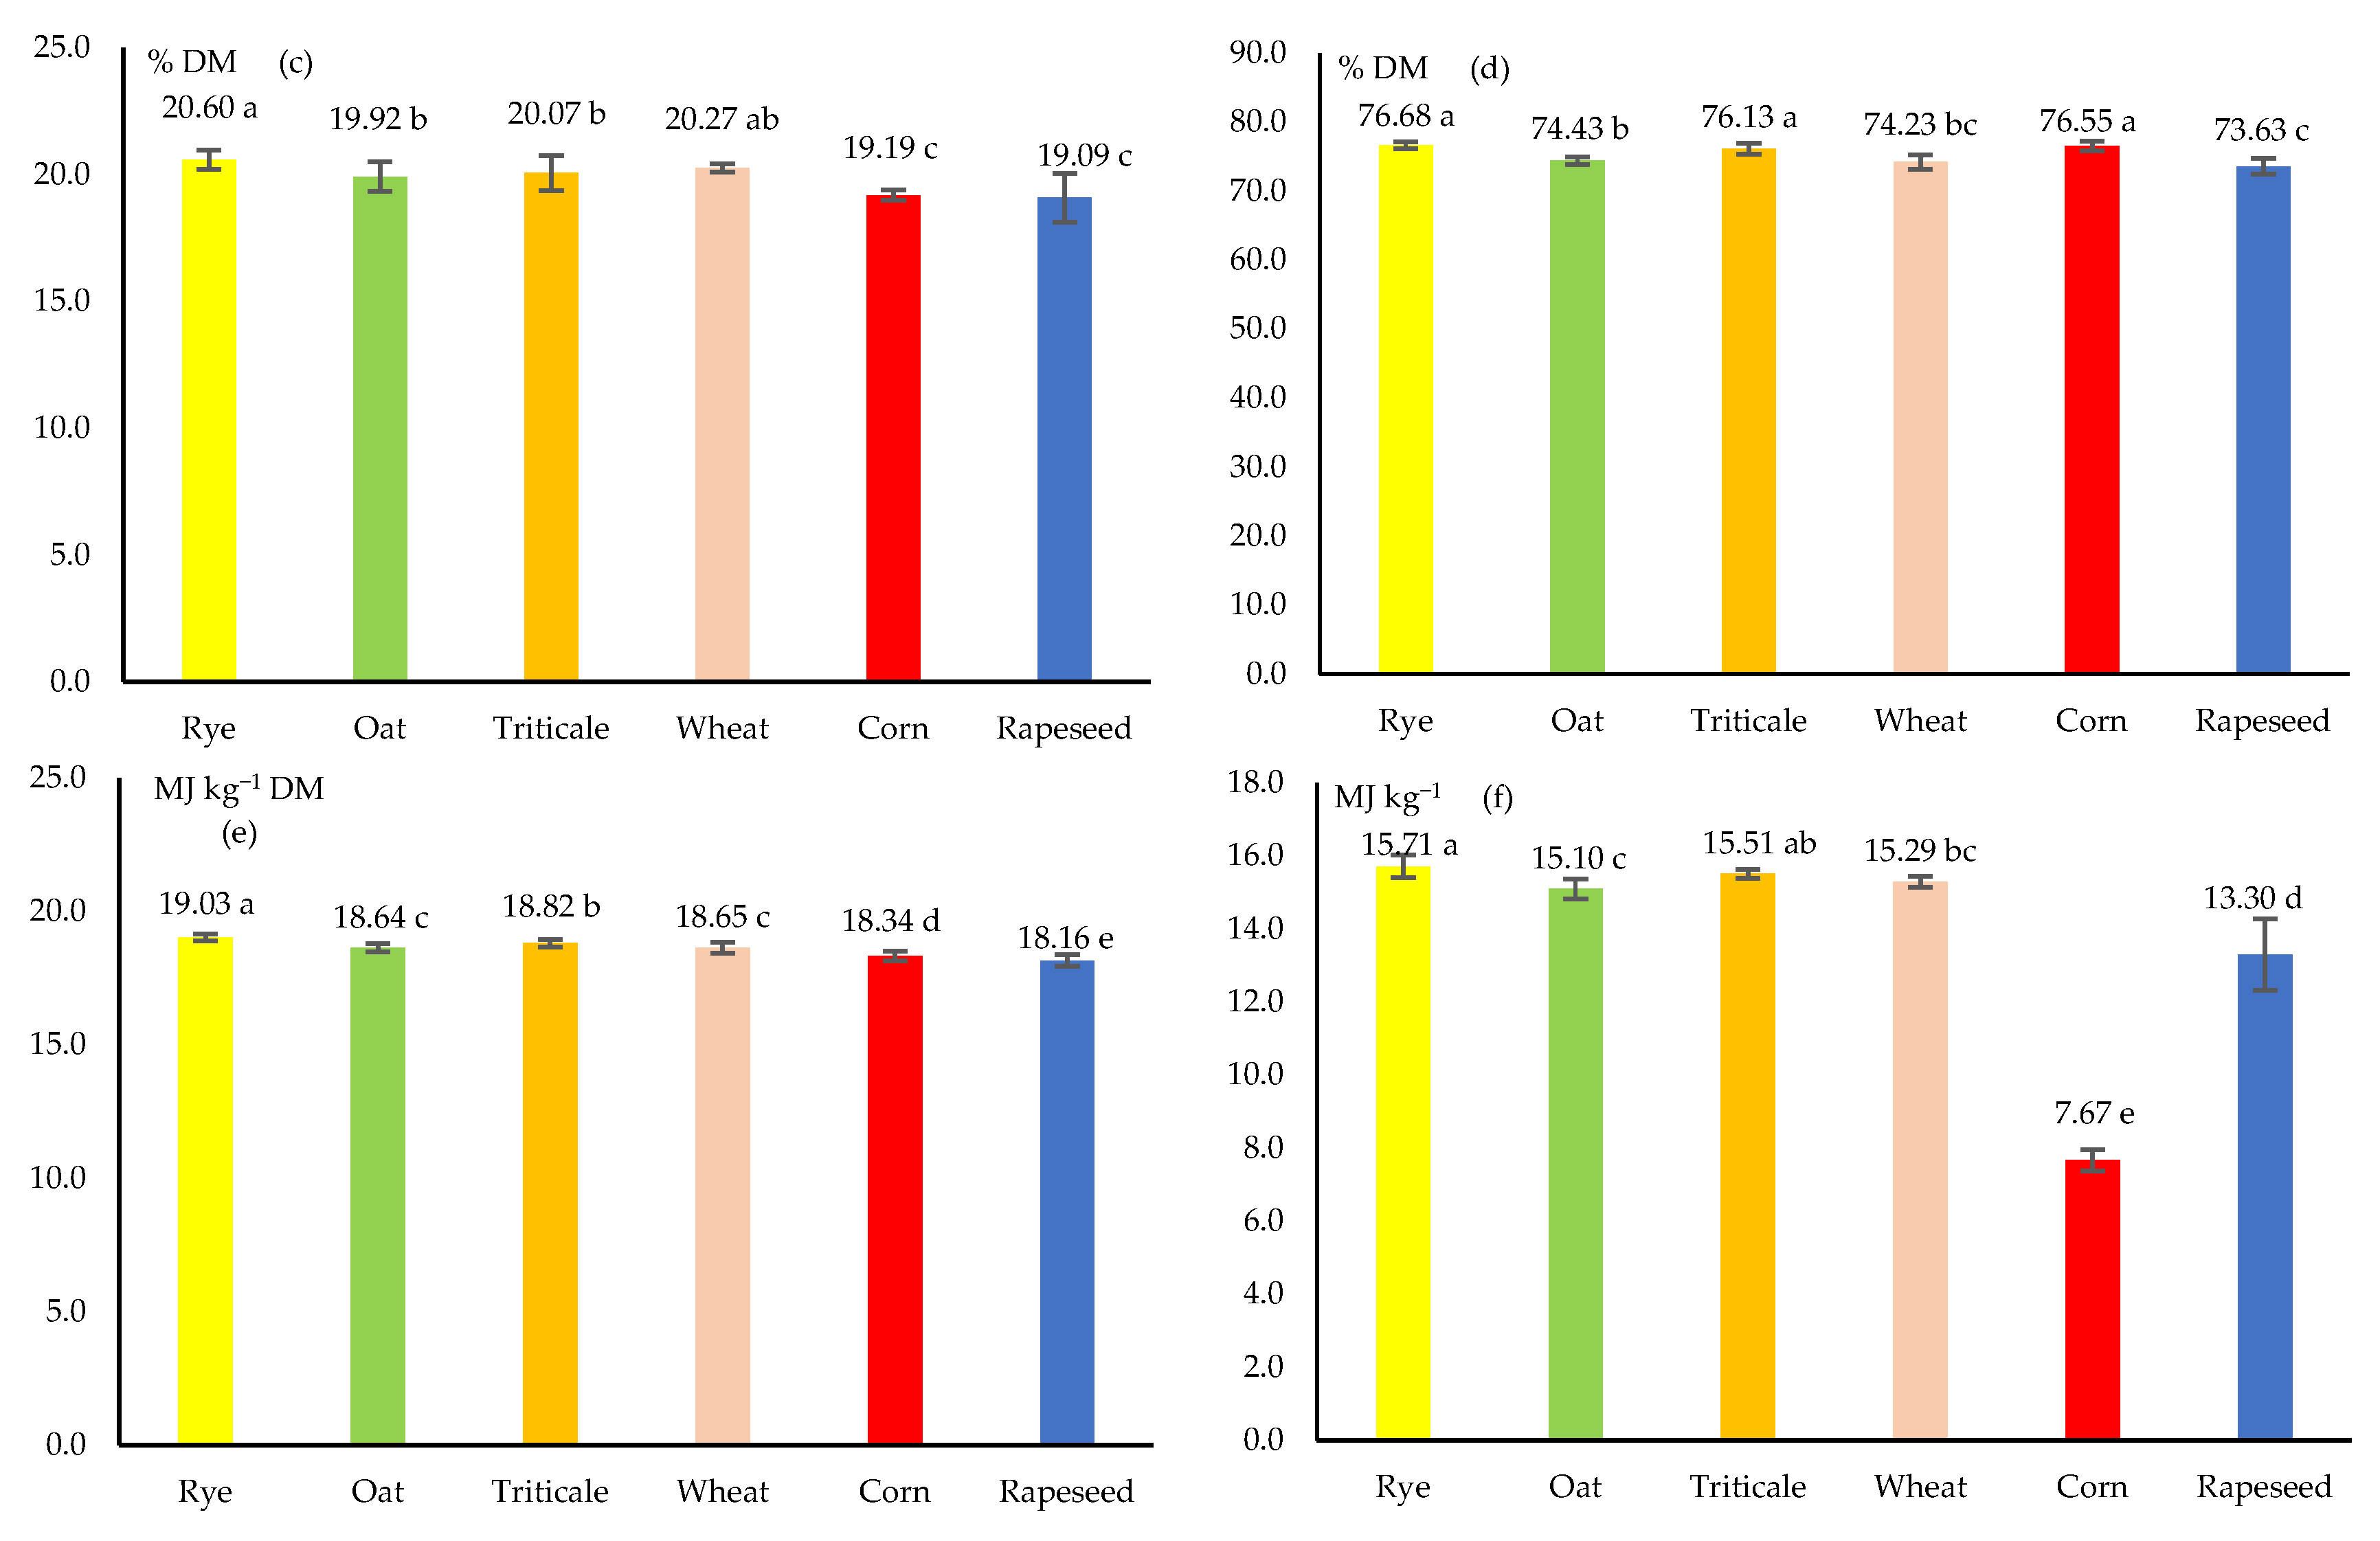
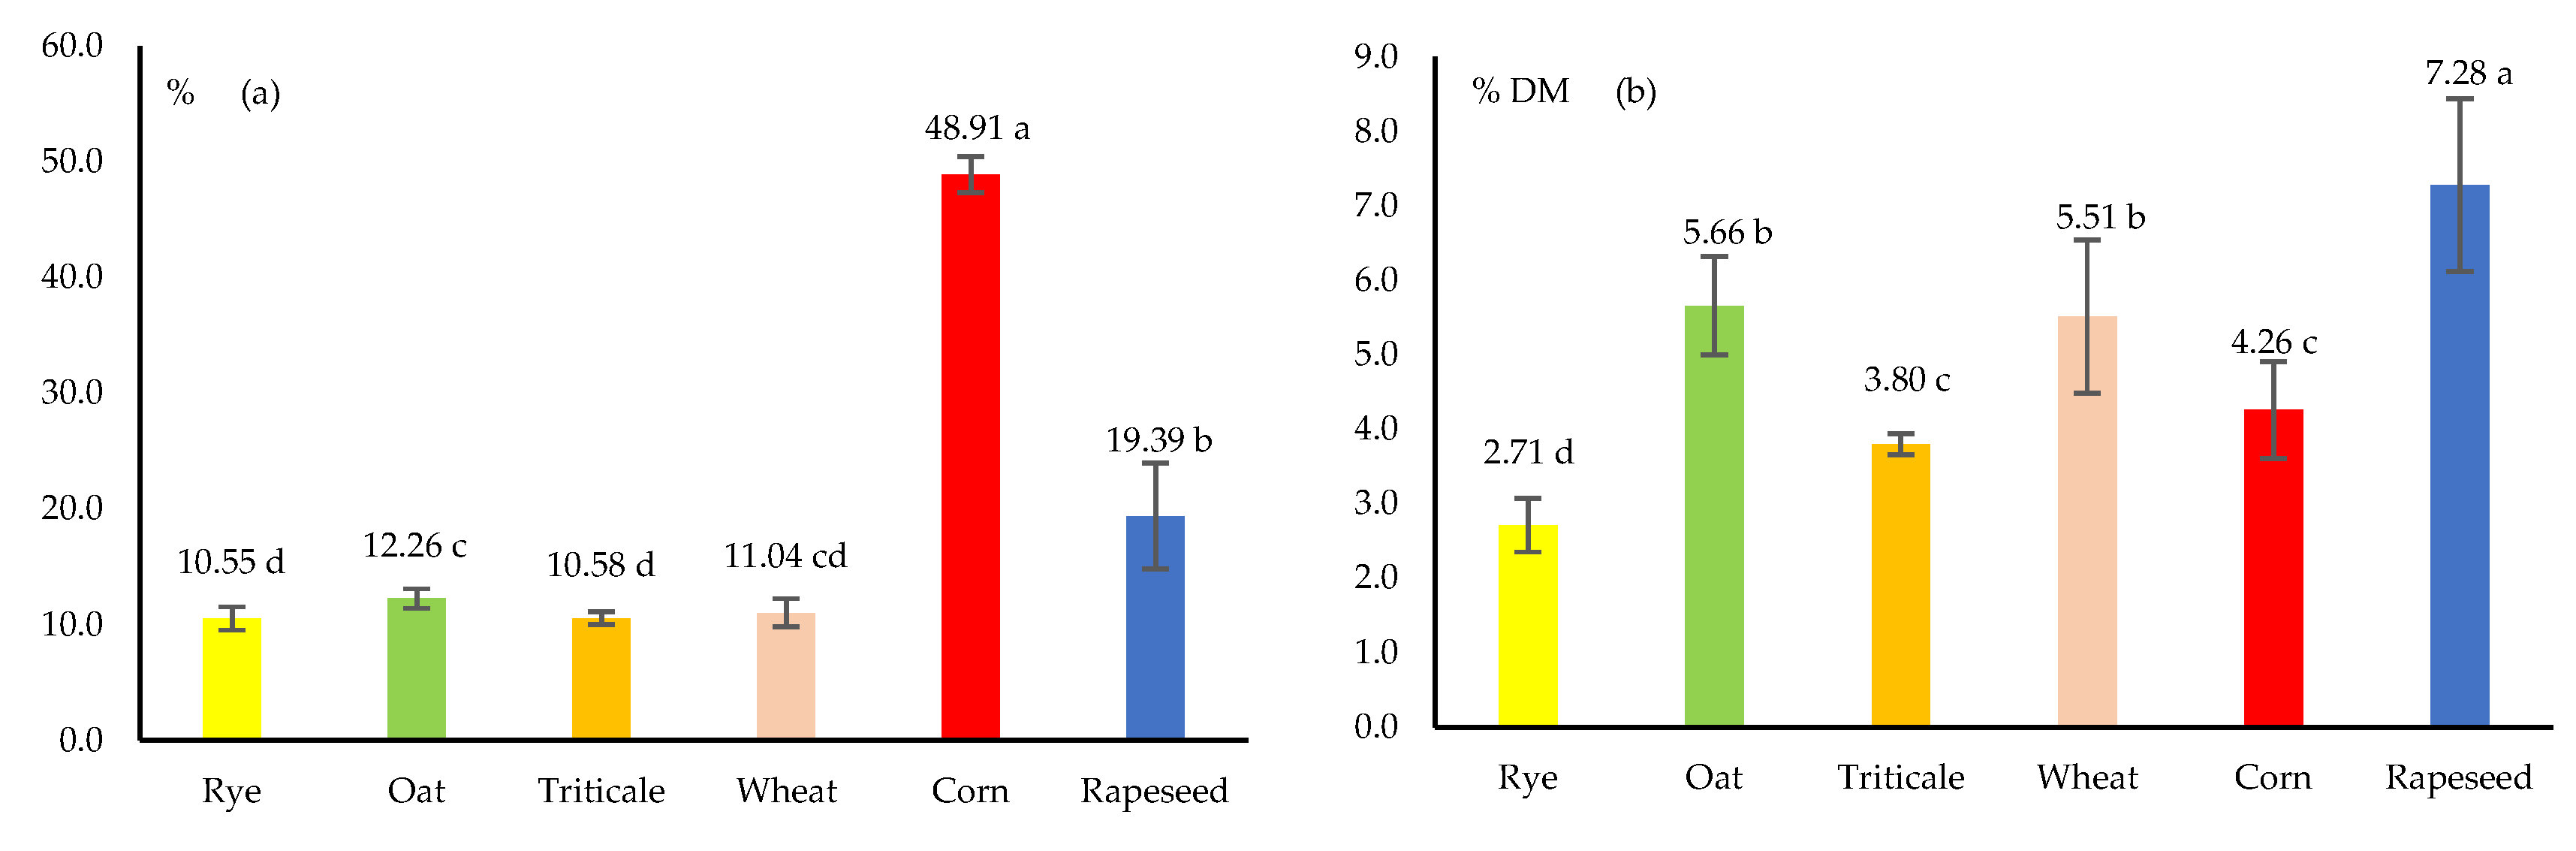
3.1. Thermophysical Characteristics

The moisture content (MC), FC, and LHV of the straw were significantly differentiated by the two main factors, i.e., the straw type and the harvest year, and the interactions between them (Table 2). However, a different relationship was observed in the case of ash, VM and HHV, as these parameters were not differentiated significantly by the harvest year. Cereal (rye, oat, triticale, wheat) straw obtained in the summer contained less moisture (mean: 10.55–12.26%, homogeneous groups “c,d”) compared with rapeseed straw obtained during the same period (mean: 19.39%, homogeneous group “b”) and corn straw (mean: 48.91%, homogeneous group “a”) obtained in late autumn (Figure 1a). This was to be expected because of the lower air temperatures in late autumn; therefore, the moisture content of the corn straw was (significantly) the highest in all three harvest years and amounted to about 49% (Table 3). Among the types under study, the rye straw had the lowest moisture content (10.55%), and it was the lowest in 2022 (under 10%) (Figure 1a, Table 3). The moisture content of all the straw types was the lowest in 2022, whereas it was higher in 2020 and 2021 by 1 and 2 percentage points (pp.), respectively. Although the differences were statistically significant, they were not large from the practical perspective. The moisture content of triticale straw, as determined in a different study (12.6%) [34], was comparable with the findings of this study for straw of cereals harvested in the summer. Gradziuk et al. found that the moisture content of rye straw (12.8%) was also similar, whereas that of wheat straw was higher (15.5%), and that of rapeseed (12.6%) and corn straw (19.6%) were lower [17]. The moisture content ranges determined in other studies were higher (15–20%) for rye, wheat and triticale straws [35]. Much higher moisture content was determined in the straw of rapeseed (30–40%) [35,36] and corn (45–60%) [35], which was more consistent with the findings of this study. Rapeseed straw analyzed in an earlier study was also found to contain higher moisture levels (28%) than that of rye or wheat (16%) [37]. A very high moisture content (mean: 56%) was also determined in camelina and crambe straw [38]. Based on the data, it is evident that the moisture content of straw varies remarkably depending on the species and weather conditions before and during harvest.
Rye straw contained the significantly lowest ash level (mean: 2.71% DM) (Figure 1b). The second homogeneous group, “c”, included triticale and corn straws, which contained 3.80% and 4.26% DM of ash, respectively. The next group, “d”, concerning the ash content, included wheat and oat straws, with contents of 5.51 and 5.66% DM, respectively. The significantly highest ash content was determined in rapeseed straw (7.28% DM), which was disadvantageous from an energy generation perspective. Moreover, this figure was three times higher than for rye straw. The ash content of rapeseed straw, as determined in a different study [37], was lower (5.47% DM), and it was at the same level as that of rye straw, whereas it was higher in wheat straw (6.35% DM). The mean ash content of oat straw was 3.85% DM [39]. Moreover, it decreased with an increasing nitrogen fertilization rate and varied for different cultivars (3.05–4.33% DM). Therefore, those levels were lower than the levels found in the current study. A similar ash content of oat straw (5.0% DM) and of corn straw (4.2% DM) to the ash content determined in the current study was found by Szufa et al. [40]. On the other hand, the ash contents of triticale straw (4.77% DM) [34] and wheat straw (6.34% DM) [41] were higher than in the findings of the current study for these straw types.
The highest FC (mean: 20.60% DM), VM (mean: 76.68% DM), HHV (mean: 19.03 GJ Mg−1 DM), and LHV (mean: 15.71 GJ Mg−1) were determined in the current study for rye straw (Figure 1c–f). On the other hand, the lowest FC, VM and HHV were found for rapeseed straw. Similar HHV values for straw of cereals (18.70 GJ Mg−1 DM) and rapeseed (18.93 GJ Mg−1 DM) were obtained in earlier studies [37]. The lowest HHV was calculated in a different study for corn straw (18.45 GJ Mg−1 DM), followed by rye straw (18.95 GJ Mg−1 DM), wheat straw (19.04 GJ Mg−1 DM), and the highest was found for rapeseed straw (19.28 GJ Mg−1 DM) [17]. The HHV for camelina straw was significantly higher (approximately 18.6 MJ kg−1 DM) than for crambe (17.9 MJ kg−1 DM) [38,42]. Regarding the LHV, it was found in the current study to exceed 15 GJ Mg−1 in all the cereal straw types harvested in summer (rye, oat, triticale, wheat) (Figure 1f). The LHV was the highest for rye (homogeneous group “a”) and the lowest for oat (homogeneous group “c”), and the difference between these types was approximately 4%. The mean LHV for rapeseed straw was 13.30 GJ Mg−1 (homogeneous group “d”), and the lowest value of this attribute was calculated for corn straw (7.67 GJ Mg−1) (homogeneous group “e”). The lower LHVs for rapeseed and corn straws were a direct consequence of the higher moisture content of these straw types. This was confirmed in a correlation analysis, which shows that the LHV was significantly negatively correlated with the moisture content (−1.00) and significantly positively correlated with FC (0.57) and HHV (0.58) (Table 4). This is why the LHV for corn straw was the significantly lowest (under 8 GJ Mg−1) in each study year (Table 3). In consecutive study years, the LHV for rapeseed straw ranged from 12.14 to 14.35 GJ Mg−1 in 2021 and 2022, respectively. The LHV for rapeseed straw was also lower (12.95 GJ Mg−1) in an earlier study [37] than that determined for rye and wheat straws (15.3 GJ Mg−1). Higher LHVs for rapeseed straw (14.8 GJ Mg−1) and wheat straw (16.3 GJ Mg−1) were determined in a different study [43], but the relationships between them were similar to those mentioned above. The LHV for oat straw was 14.83% GJ Mg−1. Moreover, since this was found to decrease with an increasing nitrogen fertilization rate and to vary for different cultivars (14.44–15.22 GJ Mg−1) [39], it was similar to the level determined in the current study.

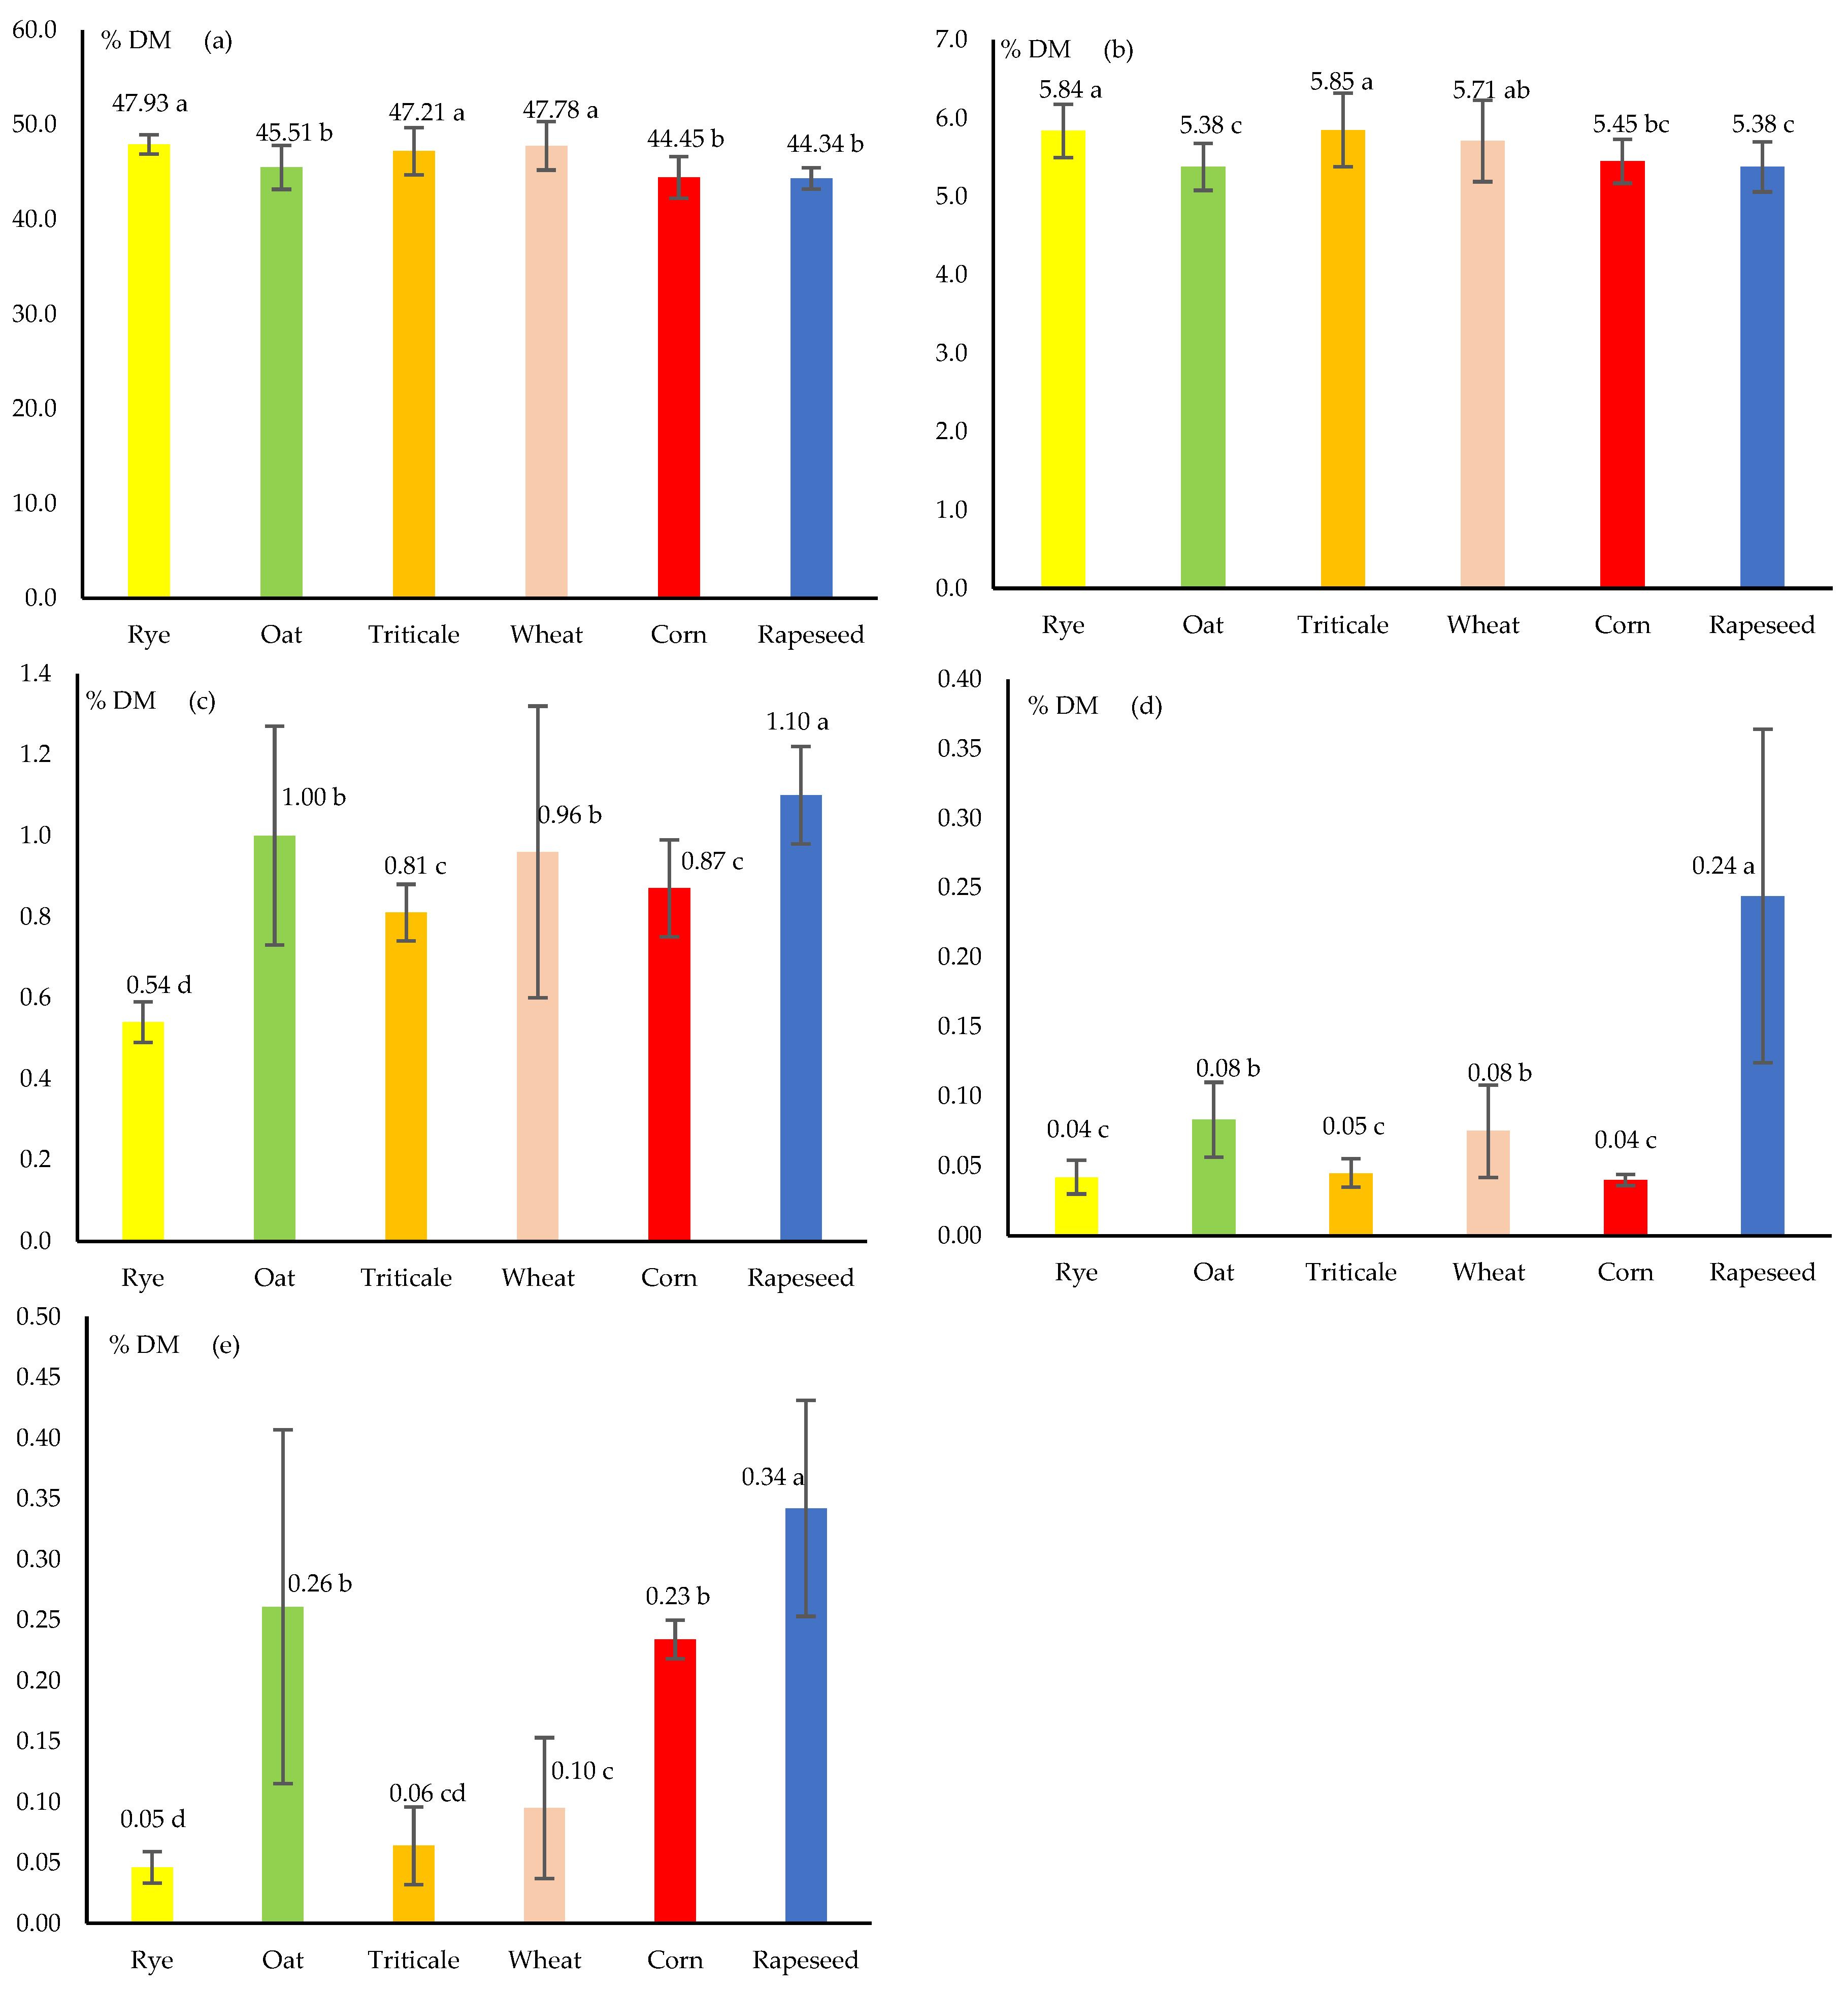
3.2. Elemental Composition

The content of all the elements (C, H, N, S, Cl) was significantly differentiated by the two main factors, i.e., the straw type and the harvest year and their interactions (Table 2). Rye straw contained the significantly highest level of C, with a mean of 47.93% DM (Figure 2a). The same homogeneous group, “a”, included wheat and triticale straws. Oat, corn and rapeseed straws were included in the second homogeneous group, “b”, and the mean C content of these straw types was 2–3 pp. lower, and it was the lowest in rapeseed straw (mean: 44.34% DM). The lowest C content in the entire experiment (42.95% DM) was determined in corn straw in 2021 (Table 5). The highest C content in this study was determined in 2020, and the difference between the years for all the straw types was over 3 pp. The carbon content of corn straw, as determined in a different study, was 42.24% DM [44]. A similar C content in corn straw (42.3% DM) and higher C content in oat straw (44.1% DM) was found in a different study [40]. A low C content (42.5% DM) was found in triticale straw [34] and wheat straw (39.19% DM) [41] compared with the figures in this study for the same straw types. The C content of wheat straw (45.4% DM) and rye straw (46.5% DM) [45], as well as of rapeseed and wheat straws (46.9% DM) and rye straw (47.9% DM) [37] were more similar.
Rapeseed and oat straws contained the lowest levels of hydrogen, with a mean of 5.38% DM (Figure 2b). The hydrogen content in rye, triticale and wheat straws was significantly higher, but its maximum level was 5.85% DM. The hydrogen content was also significantly lower in the third study year (2022) (mean: 5.28% DM) compared with the two preceding years, but the difference was not large (5.77% DM in 2020) (Table 5). A larger difference was found between the straw types under study with respect to the N content (Figure 2c). The significantly lowest content of this element was determined in rye straw, with a mean of 0.54% DM. The second homogeneous group, “c”, concerning the N content, included triticale and corn straws, whose content of this element was 50% and 61% higher, respectively, compared with rye straw. An even higher N content was determined in the wheat, oat, and rapeseed straws, which was 78%, 85%, and 104% higher than the rye straw, respectively. Moreover, the N content of rye straw was the lowest and most stable throughout the study years (Table 5). The N content of wheat and oat straws varied considerably over the study years. The triticale, corn and rapeseed straws were more stable in this regard. The N content was significantly positively correlated with the ash content (0.60) and negatively correlated with FC, VM and HHV (Table 4). The N content of the straw of rapeseed (1.26% DM) [37] and wheat (1.17% DM [37] and 1.14% DM [41] determined in different studies was significantly higher compared with rye straw (0.57% DM) [37]. Barley straw contained less N (0.4% DM) compared with wheat and rye straws (0.6% DM) [45]. A low N content (0.49% DM) was also determined in triticale straw [34] and in corn straw (0.39% DM) [44]. A much higher content of the element was found in corn straw (0.63% DM [40] and 0.88% DM [17] and in oat straw (0.65% DM) [40].
Corn, rye and triticale straws contained significantly less S (0.040–0045% DM) and were classified into one homogeneous group, “c” (Figure 2d). The second homogeneous group, “b”, included wheat and oat straws; their S content was 88% and 108% higher, respectively, compared with the lowest level determined in corn straw. The highest sulfur content (0.244% DM) was found in rapeseed straw, which was 510% higher than corn straw. This remarkably high S content of rapeseed straw resulted from the mineral fertilization of the species with sulfur-containing fertilizers. However, the differences in S content of rapeseed straw between the study years were exceptionally large (Table 5). The lowest value of this attribute (0.133% DM) was determined in 2020, and the highest was obtained in 2021 (0.394% DM). A great diversity of the S content between the study years was also found for oat and wheat straws. The rye, triticale and corn straws were more stable in this regard. The S content was significantly positively correlated with the ash (0.73) and N (0.39) contents and negatively correlated with FC, VM, HHV, C and H contents (Table 4). As determined in a different study, the S content of corn straw was 0.04% DM [44], which was close to the current study’s findings. A remarkably higher content of this element of corn straw (0.07% DM) and oat straw (0.09% DM) was determined in a different study [40]. The S content of triticale straw was also similar to that determined in oat straw [34]. A significantly higher content of S was found for wheat straw (0.20% DM) [41], which was more comparable with the content of rapeseed than this element obtained in the current study. A higher S content of rapeseed straw (0.31% DM), a high content of wheat straw (0.13% DM) and a low content of rye straw (0.06% DM) were determined in an earlier study [37]. The S content in rye and wheat straw was similar, as ascertained in an earlier study (0.08% DM) [45].
The Cl content of rye straw was the lowest, with a mean of 0.046% DM (Figure 2e). The chlorine content of triticale and wheat straws was 37% and 107% higher, respectively. An even higher Cl content was found in corn and oat straws (by 409 and 467%, respectively). The highest chlorine content was found in rapeseed straw (0.342% DM), which was 643% higher than rye straw. It was also found for the Cl content that there were considerable differences between the study years within the straw types (Table 5). The Cl content was significantly positively correlated with the ash (0.58), S (0.62) and moisture (0.38) contents and negatively correlated with FC, VM, HHV, LHV, C and H levels (Table 4). The Cl content of rapeseed straw, as determined in an earlier study [37], was also high (0.42% DM), but the same Cl content was also determined in rye straw, and it was 0.20% DM in wheat straw. A similar relationship between the higher Cl content of rye straw compared with wheat straw was also demonstrated in a different study [45]. The Cl content of corn straw (0.115% DM) and oat straw (0.230% DM) [40] was lower compared with these straw types in the current study.

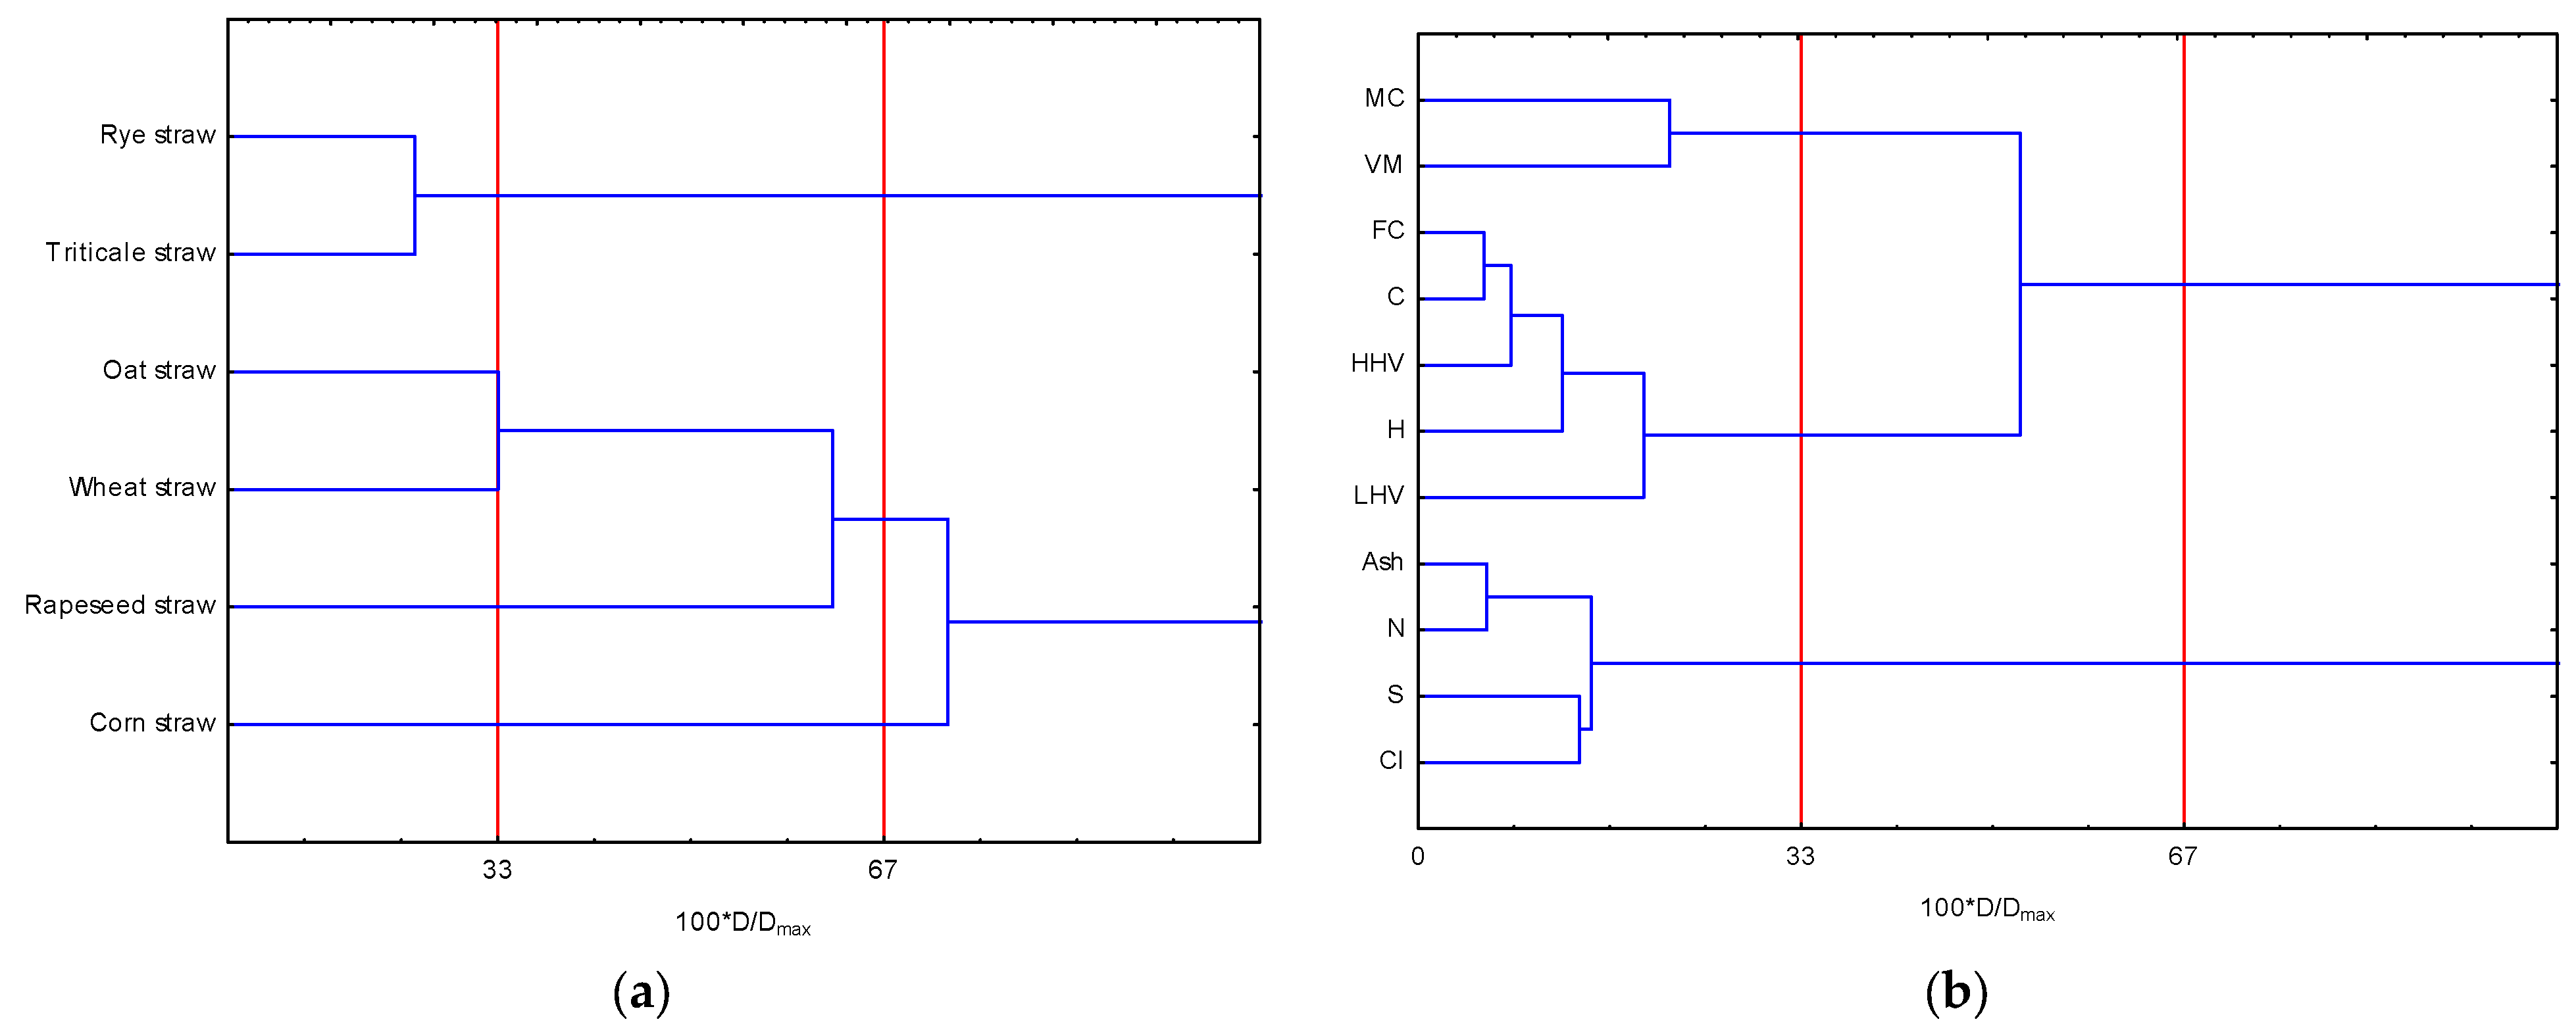
3.3. General Characteristics of Straw as Solid Biofuel

Great diversity concerning S and Cl contents between the types of straw and study years was also confirmed by the very high coefficient of variation for the two parameters (99.7% and 77.6%, respectively) (Table 6). In the case of the Cl content, the span (minimum–maximum) was very large and ranged from 0.009% to 0.476% DM, whereas in the case of S, it was 0.029–0.438% DM. An equally large dispersion of the results was observed for the moisture content of 75.0%, and this attribute ranged from 9.06% to 51.42%. The mean variability of 21–34% was determined for LHV, N and ash contents, and the mean values for these attributes were 13.76 MJ kg−1, 0.88% DM and 4.87%, respectively. The LHV ranged from 7.39 to 16.13 GJ Mg−1, the N content ranged from 0.49% to 1.44% DM, and the ash content ranged from 2.31% to 9.47% DM. For such straw parameters as H, C, FC content, VM and HHV, a low variation level was observed (coefficient of variation < 10%). The highest consistency of results for these parameters was found for HHV (coefficient of variation 1.82%).
Additionally, a cluster analysis based on the values of all the attributes under study showed that the ash content, N, S and Cl, made up one cluster, both at the cut-off of 2/3 Dmax and 1/3 Dmax. (Figure 3b). The second cluster included the other seven parameters under study at a cut-off of 2/3 Dmax. With increased analysis accuracy, the cluster was divided into two at the cut-off of 1/3 Dmax. One included MC and VM, and the other FC, HHV, LHV, C and H. It was found that three main clusters were formed at the cut-off of 2/3 Dmax for the straw types under study (Figure 3a). Rye and triticale straw made up their own cluster. Another independent cluster included corn straw. The other three straw types (oat, wheat, rapeseed) comprised a third separate cluster. With increased analysis accuracy, five clusters were identified at the cut-off of 1/3 Dmax. Only rye and triticale straws comprised one cluster, indicating their similar properties. The other four straw types (corn, oat, wheat, rapeseed) comprised four clusters.

4. Conclusions

Apart from various applications, straw is also used as a solid biofuel for energy generation. This study analyzed the thermophysical properties and elemental composition of six types of straw obtained during three consecutive years. The results are important from the scientific and practical perspectives as they show the potential effectiveness and rationality of various straw types used for energy purposes, mainly as a solid biofuel for generating heat and electricity. The results obtained from this analysis showed that rye straw was the most valuable solid biofuel because of its beneficial thermophysical properties and elemental composition. Its characteristics included a low moisture content, a low S content, the lowest ash, N, Cl contents and the highest LHV. Triticale straw had similar properties, classifying it into the same cluster as rye straw. Wheat straw was assigned into a separate cluster but can also be a good energy feedstock. Oat straw was slightly less attractive, especially because of its lower C content, lower HHV and LHV and high Cl content compared with the straw of the other cereal species harvested in summer. Obtaining corn straw for these purposes in late autumn in the northeast of Poland is impractical due to its high moisture content, low LHV and high Cl content. The properties of rapeseed straw were not sufficiently encouraging for its use as a solid biofuel due to its high Cl, S, N and ash contents. Moreover, it was demonstrated that the sulfur, chlorine and moisture contents of the six straw types under study were highly variable during the three years of the study.
The above results provide important new information about the wide variation in the properties of straw (especially corn and rapeseed) harvested in the northeastern region of Poland. This information is of considerable practical importance since data on the variability of the quality of different cereal and rapeseed straw types is important for farmers, logistics firms and end users generating energy from this solid biofuel. Bioenergy installations are adapted to use various solid biofuels effectively and properly. However, knowledge of the thermophysical characteristics and elemental composition of various types of straw obtained as agricultural production residue can facilitate the organization of a bioenergy installation supply with the optimum solid biofuel in the form of straw. Finally, future research should include aspects related to determining the energy intensity and costs (including external environmental costs) of harvesting and logistics of different types of straw used as energy feedstock.

Author Contributions

Conceptualization, M.J.S.; methodology, M.J.S., M.W. and M.K.; validation, M.J.S., M.K., E.O.-Z. and S.W.; formal analysis, M.J.S. and M.W.; investigation, M.J.S., M.W. and E.O.-Z.; resources, M.J.S. and M.W.; data curation, M.J.S., M.W. and J.S.; writing—original draft preparation, M.J.S. and J.S.; writing—review and editing, M.J.S., M.W., M.K., E.O.-Z., J.S. and S.W.; visualization, M.W., J.S. and M.J.S.; supervision, M.J.S.; project administration, M.J.S.; funding acquisition, M.J.S. and S.W. All authors have read and agreed to the published version of the manuscript.

Funding

The results presented in this paper were obtained as part of a comprehensive study financed by the University of Warmia and Mazury in Olsztyn, Faculty of Agriculture and Forestry, Department of Genetics, Plant Breeding and Bioresource Engineering (grant No. 30.610.007-110) and Faculty of Technical Sciences, Department of Mechatronics (grant No. 16.610.001-110).

Data Availability Statement

The data presented in this study are available on request from the corresponding author.

Acknowledgments

We would like to thank the staff of the Department of Genetics, Plant Breeding and Bioresource Engineering for their technical support during the experiment.

Conflicts of Interest

The authors declare no conflicts of interest.

References

  1. Eurostat 2024 Share of Energy from Renewable Sources. Available online: https://Ec.Europa.Eu/Eurostat/Databrowser/View/Nrg_ind_ren/Default/Table?Lang=en (accessed on 10 January 2024).
  2. Statistics Poland. Energy from Renewable Sources in 2022; Statistics Poland: Warsaw, Poland, 2023. [Google Scholar]
  3. Jankowski, K.J.; Dubis, B.; Sokólski, M.M.; Załuski, D.; Bórawski, P.; Szempliński, W. Productivity and Energy Balance of Maize and Sorghum Grown for Biogas in a Large-Area Farm in Poland: An 11-Year Field Experiment. Ind. Crops Prod. 2020, 148, 112326. [Google Scholar] [CrossRef]
  4. Picchio, R.; Latterini, F.; Venanzi, R.; Stefanoni, W.; Suardi, A.; Tocci, D.; Pari, L. Pellet Production from Woody and Non-Woody Feedstocks: A Review on Biomass Quality Evaluation. Energies 2020, 13, 2937. [Google Scholar] [CrossRef]
  5. Enström, J.; Eriksson, A.; Eliasson, L.; Larsson, A.; Olsson, L. Wood Chip Supply from Forest to Port of Loading—A Simulation Study. Biomass Bioenergy 2021, 152, 106182. [Google Scholar] [CrossRef]
  6. Stolarski, J.; Wierzbicki, S.; Nitkiewicz, S.; Stolarski, M.J. Wood Chip Production Efficiency Depending on Chipper Type. Energies 2023, 16, 4894. [Google Scholar] [CrossRef]
  7. Manzone, M.; Bergante, S.; Facciotto, G. Energy and Economic Evaluation of a Poplar Plantation for Woodchips Production in Italy. Biomass Bioenergy 2014, 60, 164–170. [Google Scholar] [CrossRef]
  8. Serapiglia, M.J.; Cameron, K.D.; Stipanovic, A.J.; Abrahamson, L.P.; Volk, T.A.; Smart, L.B. Yield and Woody Biomass Traits of Novel Shrub Willow Hybrids at Two Contrasting Sites. Bioenergy Res. 2013, 6, 533–546. [Google Scholar] [CrossRef]
  9. Scordia, D.; Papazoglou, E.G.; Kotoula, D.; Sanz, M.; Ciria, C.S.; Pérez, J.; Maliarenko, O.; Prysiazhniuk, O.; von Cossel, M.; Greiner, B.E.; et al. Towards Identifying Industrial Crop Types and Associated Agronomies to Improve Biomass Production from Marginal Lands in Europe. GCB Bioenergy 2022, 14, 710–734. [Google Scholar] [CrossRef]
  10. Matyka, M.; Radzikowski, P. Productivity and Biometric Characteristics of 11 Varieties of Willow Cultivated on Marginal Soil. Agriculture 2020, 10, 616. [Google Scholar] [CrossRef]
  11. Amaducci, S.; Facciotto, G.; Bergante, S.; Perego, A.; Serra, P.; Ferrarini, A.; Chimento, C. Biomass Production and Energy Balance of Herbaceous and Woody Crops on Marginal Soils in the Po Valley. GCB Bioenergy 2017, 9, 31–45. [Google Scholar] [CrossRef]
  12. Stolarski, M.J.; Warmiński, K.; Krzyżaniak, M.; Olba–Zięty, E.; Akincza, M. Bioenergy Technologies and Biomass Potential Vary in Northern European Countries. Renew. Sustain. Energy Rev. 2020, 133, 110238. [Google Scholar] [CrossRef]
  13. Hajj Obeid, M.; Douzane, O.; Freitas Dutra, L.; Promis, G.; Laidoudi, B.; Bordet, F.; Langlet, T. Physical and Mechanical Properties of Rapeseed Straw Concrete. Materials 2022, 15, 8611. [Google Scholar] [CrossRef]
  14. Fu, Y.; Zhang, J.; Guan, T. High-Value Utilization of Corn Straw: From Waste to Wealth. Sustainability 2023, 15, 14618. [Google Scholar] [CrossRef]
  15. Li, Z.; Guan, J.; Yan, C.; Chen, N.; Wang, C.; Liu, T.; Cheng, F.; Guo, Q.; Zhang, X.; Ye, X.; et al. Corn Straw Core/Cellulose Nanofibers Composite for Food Packaging: Improved Mechanical, Bacteria Blocking, Ultraviolet and Water Vapor Barrier Properties. Food Hydrocoll. 2023, 143, 108884. [Google Scholar] [CrossRef]
  16. Shen, T.; Li, M.; Zhang, B.; Zhong, L.; Lin, X.; Yang, P.; Li, M.; Zhuang, W.; Zhu, C.; Ying, H. Enhanced Mechanical Properties of Polyvinyl Chloride-Based Wood–Plastic Composites with Pretreated Corn Stalk. Front. Bioeng. Biotechnol. 2022, 9, 829821. [Google Scholar] [CrossRef] [PubMed]
  17. Gradziuk, P. The Economic Importance and Possibilities of Using Straw for Energy Purposes in Poland; Institute of Soil Science and Plant Cultivation State Research Institute: Puławy, Poland, 2015. [Google Scholar]
  18. Scarlat, N.; Martinov, M.; Dallemand, J.-F. Assessment of the Availability of Agricultural Crop Residues in the European Union: Potential and Limitations for Bioenergy Use. Waste Manag. 2010, 30, 1889–1897. [Google Scholar] [CrossRef] [PubMed]
  19. Neshat, S.A.; Mohammadi, M.; Najafpour, G.D.; Lahijani, P. Anaerobic Co-Digestion of Animal Manures and Lignocellulosic Residues as a Potent Approach for Sustainable Biogas Production. Renew. Sustain. Energy Rev. 2017, 79, 308–322. [Google Scholar] [CrossRef]
  20. Álvaro, A.G.; Palomar, C.R.; Redondo, D.H.; Torre, R.M.; de Godos Crespo, I. Simultaneous Production of Biogas and Volatile Fatty Acids through Anaerobic Digestion Using Cereal Straw as Substrate. Environ. Technol. Innov. 2023, 31, 103215. [Google Scholar] [CrossRef]
  21. Kumar, A.; Demirel, Y.; Jones, D.D.; Hanna, M.A. Optimization and Economic Evaluation of Industrial Gas Production and Combined Heat and Power Generation from Gasification of Corn Stover and Distillers Grains. Bioresour. Technol. 2010, 101, 3696–3701. [Google Scholar] [CrossRef] [PubMed]
  22. Shen, J.; Wyman, C.E. A Novel Mechanism and Kinetic Model to Explain Enhanced Xylose Yields from Dilute Sulfuric Acid Compared to Hydrothermal Pretreatment of Corn Stover. Bioresour. Technol. 2011, 102, 9111–9120. [Google Scholar] [CrossRef]
  23. Liu, J.; Wang, C.; Zhao, X.; Yin, F.; Yang, H.; Wu, K.; Liang, C.; Yang, B.; Zhang, W. Bioethanol Production from Corn Straw Pretreated with Deep Eutectic Solvents. Electron. J. Biotechnol. 2023, 62, 27–35. [Google Scholar] [CrossRef]
  24. Poudel, J.; Oh, S.C. Effect of Torrefaction on the Properties of Corn Stalk to Enhance Solid Fuel Qualities. Energies 2014, 7, 5586–5600. [Google Scholar] [CrossRef]
  25. PN-EN ISO 18134-2; Solid Biofuels–Determination of Moisture Content–Dryer Method–Part 2: Total Moisture–Simplified Method. Polish Standardization Committee: Warsaw, Poland, 2014.
  26. PN-EN ISO 16948:2015-07; Solid Biofuels—Determination of Total Content of Carbon, Hydrogen and Nitrogen. Polish Standardization Committee: Warsaw, Poland, 2015.
  27. PN-EN ISO 16994:2016-10; Solid Biofuels—Determination of Total Content of Sulfur and Chlorine. Polish Standardization Committee: Warsaw, Poland, 2016.
  28. PN-ISO 587:2000; Solid Fuels—Determination of Chlorine Using Eschka Mixture. Polish Standardization Committee: Warsaw, Poland, 2000.
  29. PN-EN ISO 18122:2016-01; Solid Biofuels—Determination of Ash Content. Polish Standardization Committee: Warsaw, Poland, 2016.
  30. PN-EN ISO 18123:2016-01; Solid Biofuels—Determination of Volatile Matter Content. Polish Standardization Committee: Warsaw, Poland, 2016.
  31. PN-EN ISO 18125:2017-07; Solid Biofuels—Determination of Calorific Value. Polish Standardization Committee: Warsaw, Poland, 2017.
  32. Cordero, T.; Marquez, F.; Rodriguez-Mirasol, J.; Rodriguez, J.J. Predicting Heating Values of Lignocellulosics and Carbonaceous Materials from Proximate Analysis. Fuel 2001, 80, 1567–1571. [Google Scholar] [CrossRef]
  33. Qian, X.; Lee, S.; Soto, A.; Chen, G. Regression Model to Predict the Higher Heating Value of Poultry Waste from Proximate Analysis. Resources 2018, 7, 39. [Google Scholar] [CrossRef]
  34. Obidziński, S.; Cwalina, P.; Kowczyk-Sadowy, M.; Krasowska, M.; Sienkiewicz, A.; Faszczewski, D.; Szyszlak-Bargłowicz, J. The Use of Bread Bakery Waste as a Binder Additive in the Production of Fuel Pellets from Straw. Energies 2023, 16, 7313. [Google Scholar] [CrossRef]
  35. Karcz, H.; Kantorek, M.; Grabowicz, M.; Wierzbicki, K. The Feasibility of Straw as a Fuel Source for Power Generating Boilers. Environ. Eng. 2013, XI–XII, 8–15. [Google Scholar]
  36. Kachel-Jakubowska, M.; Kraszkiewicz, A.; Szpryngiel, M.; Niedziółka, I. Analysis of the Characteristics of Raw Materials Used in Production of Solid Biofuels. Agric. Eng. 2013, 2, 103–111. [Google Scholar]
  37. Stolarski, M.; Krzyżaniak, M.; Rybczyńska, B.; Peni, D.; Bordiean, A.; Lajszner, W.; Graban, Ł. Thermophysical Properties and Elemental Composition of Agricultural and Forest Solid Biofuels versus Fossil Fuels. J. Elem. 2019, 24, 1215–1228. [Google Scholar] [CrossRef]
  38. Krzyżaniak, M.; Stolarski, M.J.; Graban, Ł.; Lajszner, W.; Kuriata, T. Camelina and Crambe Oil Crops for Bioeconomy—Straw Utilisation for Energy. Energies 2020, 13, 1503. [Google Scholar] [CrossRef]
  39. Tobiasz-Salach, R.; Stadnik, B.; Bajcar, M. Oat as a Potential Source of Energy. Energies 2023, 16, 6019. [Google Scholar] [CrossRef]
  40. Szufa, S.; Wielgosiński, G.; Piersa, P.; Czerwińska, J.; Dzikuć, M.; Adrian, Ł.; Lewandowska, W.; Marczak, M. Torrefaction of Straw from Oats and Maize for Use as a Fuel and Additive to Organic Fertilizers—TGA Analysis, Kinetics as Products for Agricultural Purposes. Energies 2020, 13, 2064. [Google Scholar] [CrossRef]
  41. Torres Ramos, R.; Valdez Salas, B.; Montero Alpírez, G.; Coronado Ortega, M.A.; Curiel Álvarez, M.A.; Tzintzun Camacho, O.; Beleño Cabarcas, M.T. Torrefaction under Different Reaction Atmospheres to Improve the Fuel Properties of Wheat Straw. Processes 2023, 11, 1971. [Google Scholar] [CrossRef]
  42. Owczuk, M.; Kołodziejczyk, K. Assessment of the Possibility of Using Straw and Pomace of Camelina Sativa as an Alternative Energy Source. Chemik 2011, 65, 537–542. [Google Scholar]
  43. Kacorzyk, P.; Szkutnik, J.; Kasperczyk, M. Energy Value of Selected Plant Species. Interdiscip. Issues Eng. Environ. Prot. 2013, 3, 239–244. [Google Scholar]
  44. Cui, L.; Zhao, W.; Mostafa, E.; Zhang, Y. Heating Performances of Corn Straw Particle with/without SiC Particle in a Microwave Chamber. Environ. Sci. Pollut. Res. 2023. Online ahead of print. [Google Scholar] [CrossRef] [PubMed]
  45. Król, K.; Nowak-Woźny, D. Application of the Mechanical and Pressure Drop Tests to Determine the Sintering Temperature of Coal and Biomass Ash. Energies 2021, 14, 1126. [Google Scholar] [CrossRef]
Figure 1. Thermophysical characteristics of the straw types under study, mean values of the three harvest years. (a) Moisture content; (b) ash content; (c) fixed carbon content; (d) volatile matter content; (e) higher heating value; (f) lower heating value; a, b, c, d, e, denote homogeneous groups for the straw type, separately for each attribute; error bars denote standard deviation.
Energies 17 01243 g001aEnergies 17 01243 g001b
Figure 2. Elemental composition of the straw types under study, mean values of the three harvest years. (a) Carbon content; (b) hydrogen content; (c) nitrogen content; (d) sulfur content; (e) chlorine content; a, b, c, d, denote homogeneous groups for the straw type, separately for each attribute; error bars denote standard deviation.
Energies 17 01243 g002
Figure 3. The dendrogram of a hierarchical cluster analysis showing the similarities between the straw types under study (a) and their thermophysical and elemental characteristics (b). The red vertical line marks the Sneath criterion (2/3 Dmax) and (1/3 Dmax). D—linage distance; Dmax—maximum linage distance.
Energies 17 01243 g003
Table 1. Fertilization levels for the crop species under study.
Crop
Species
Nitrogen
(kg ha−1)
Phosphorus
(kg ha−1)
Potassium
(kg ha−1)
Sulfur
(kg ha−1)
Cattle Manure
(kg ha−1)
Rye90.050.080.0--
Oat100.050.080.0--
Triticale150.050.080.0--
Wheat200.060.0110.0--
Corn165.070.0105.0-30,000
Rapeseed220.080.0160.048.0-
Table 2. Analysis of variance (ANOVA)—p values for the studied attributes.
Source of VariationMCAshFCVMHHVLHVC a
Straw type (A)<0.001 *<0.001 *<0.001 *<0.001 *<0.001 *<0.001 *<0.001 *
Harvest year (B)<0.001 *0.023<0.001 *0.1430.166<0.001 *<0.001 *
A × B<0.001 *<0.001 *<0.001 *<0.001 *<0.001 *<0.001 *<0.001 *
* Significant values (p < 0.05); a for the rest attributes: H, N, S and Cl content—p < 0.001.
Table 3. Thermophysical characteristics of the straw types under study in three consecutive harvest years.
Straw Type and
Harvest Year
MC
(%)
Ash
(% DM)
FC
(% DM)
VM
(% DM)
HHV
(GJ Mg−1 DM)
LHV
(GJ Mg−1)
Rye 202010.38 ± 0.23 d2.68 ± 0.04 d20.21 ± 0.31 ab77.11 ± 0.26 a19.06 ± 0.17 a15.79 ± 0.09 a
Rye 202111.55 ± 0.59 d3.15 ± 0.07 d20.72 ± 0.26 ab76.14 ± 0.31 ab18.93 ± 0.15 ab15.34 ± 0.03 ab
Rye 20229.72 ± 1.07 d2.32 ± 0.01 d20.88 ± 0.18 a76.80 ± 0.18 a19.11 ± 0.03 a16.00 ± 0.19 a
Oat 202012.27 ± 1.18 cd5.60 ± 0.46 b19.44 ± 0.27 b74.96 ± 0.72 b18.52 ± 0.07 bc14.98 ± 0.39 b
Oat 202111.68 ± 0.57 d6.40 ± 0.14 b19.65 ± 0.11 b73.96 ± 0.24 bc18.63 ± 0.23 bc15.20 ± 0.33 ab
Oat 202212.85 ± 0.05 cd4.97 ± 0.01 bc20.66 ± 0.17 ab74.37 ± 0.17 bc18.77 ± 0.05 b15.13 ± 0.06 b
Triticale 202010.38 ± 0.16 d3.65 ± 0.14 c19.64 ± 0.52 b76.72 ± 0.65 a18.83 ± 0.16 ab15.47 ± 0.13 a
Triticale 202110.90 ± 0.80 d3.83 ± 0.07 c19.69 ± 0.37 b76.48 ± 0.33 ab18.94 ± 0.11 ab15.54 ± 0.18 a
Triticale 202210.47 ± 0.56 d3.91 ± 0.01 c20.88 ± 0.05 a75.21 ± 0.04 b18.71 ± 0.04 b15.52 ± 0.07 a
Wheat 202012.43 ± 0.10 cd5.18 ± 0.02 bc20.07 ± 0.07 ab74.75 ± 0.07 b18.84 ± 0.10 ab15.18 ± 0.07 ab
Wheat 202110.59 ± 1.10 d4.52 ± 0.20 bc20.39 ± 0.05 ab75.09 ± 0.22 b18.73 ± 0.06 b15.34 ± 0.22 ab
Wheat 202210.11 ± 0.57 d6.82 ± 0.04 b20.34 ± 0.02 ab72.83 ± 0.02 c18.40 ± 0.01 bc15.36 ± 0.10 a
Corn 202049.07 ± 0.81 a4.35 ± 1.29 bc19.30 ± 0.19 bc76.35 ± 1.33 ab18.20 ± 0.05 c7.53 ± 0.17 f
Corn 202149.36 ± 0.94 a4.27 ± 0.13 c18.99 ± 0.23 c76.74 ± 0.25 a18.30 ± 0.08 c7.59 ± 0.15 f
Corn 202248.32 ± 2.69 a4.16 ± 0.02 c19.27 ± 0.07 bc76.57 ± 0.06 a18.51 ± 0.20 bc7.88 ± 0.43 f
Rapeseed 202017.82 ± 0.24 c7.56 ± 0.14 a19.95 ± 0.70 b72.48 ± 0.58 c17.97 ± 0.01 c13.41 ± 0.07 d
Rapeseed 202125.09 ± 1.06 b8.32 ± 1.01 a17.97 ± 0.29 d73.71 ± 1.04 bc18.09 ± 0.22 c12.14 ± 0.13 e
Rapeseed 202215.25 ± 1.84 cd5.95 ± 0.07 b19.35 ± 0.07 bc74.69 ± 0.14 b18.41 ± 0.03 bc14.35 ± 0.37 c
Mean 202018.72 ± 14.21 B4.84 ± 1.66 AB19.77 ± 0.48 B75.40 ± 1.7218.57 ± 0.4013.73 ± 2.96 B
Mean 202119.86 ± 14.57 A5.08 ± 1.84 A19.57 ± 0.95 B75.35 ± 1.2918.60 ± 0.3513.53 ± 2.99 C
Mean 202217.78 ± 14.24 C4.69 ± 1.50 B20.23 ± 0.70 A75.08 ± 1.3918.65 ± 0.2714.04 ± 2.89 A
A,B,C homogenous groups for the harvest year separately for each attribute; a,b,c,d,e,f homogenous groups for the straw type and harvest year interaction separately for each attribute; no letters denote no significant differences; ± standard deviation.
Table 4. Pearson correlation coefficients for the studied attributes.
FeatureMCFCVMAshHHVLHVCHN SCl
MC (%)1.00
FC (% DM)−0.54 *1.00
VM (% DM)0.260.001.00
Ash (% DM)0.03−0.47 *−0.88 *1.00
HHV (MJ kg−1 DM)−0.52 *0.59 *0.51 *−0.72 *1.00
LHV (MJ kg−1)−1.00 *0.57 *−0.20−0.090.58 *1.00
C (% DM)−0.41 *0.37 *0.28 *−0.42 *0.49 *0.42 *1.00
H (% DM)−0.220.190.33 *−0.38 *0.35 *0.220.78 *1.00
N (% DM)0.08−0.44 *−0.45 *0.60 *−0.50 *−0.13−0.20−0.011.00
S (% DM)−0.02−0.60 *−0.51 *0.73 *−0.53 *−0.03−0.37 *−0.31 *0.39 *1.00
Cl (% DM)0.38 *−0.54 *−0.37 *0.58 *−0.62 *−0.41 *−0.45 *−0.51 *0.240.62 *1.00
* Significant values (p < 0.05).
Table 5. Elemental composition of the straw types under study in three consecutive harvest years.
Straw Type and
Harvest Year
C
(% DM)
H
(% DM)
N
(% DM)
S
(% DM)
Cl
(% DM)
Rye 202048.65 ± 0.47 a5.72 ± 0.09 ab0.53 ± 0.03 d0.057 ± 0.001 e0.056 ± 0.005 cd
Rye 202148.40 ± 0.85 a6.26 ± 0.13 a0.60 ± 0.01 d0.037 ± 0.003 e0.034 ± 0.005 d
Rye 202246.76 ± 0.04 b5.53 ± 0.02 bc0.50 ± 0,01 d0.030 ± 0.001 e0.050 ± 0.017 d
Oat 202048.51 ± 0.29 a5.47 ± 0.55 bc0.96 ± 0.06 b0.111 ± 0.022 cd0.376 ± 0.105 a
Oat 202143.43 ± 0.55 c5.44 ± 0.09 bc1.32 ± 0.07 a0.081 ± 0.007 d0.082 ± 0.003 c
Oat 202244.57 ± 0.05 bc5.22 ± 0.06 bc0.71 ± 0.10 cd0.056 ± 0.004 e0.326 ± 0.020 ab
Triticale 202049.70 ± 0.83 a6.32 ± 0.12 a0.85 ± 0.04 bc0.037 ± 0.010 e0.024 ± 0.013 d
Triticale 202146.73 ± 2.92 b5.87 ± 0.41 ab0.85 ± 0.03 bc0.043 ± 0.006 e0.022 ± 0.007 d
Triticale 202245.20 ± 0.22 bc5.36 ± 0.02 bc0.72 ± 0.01 cd0.056 ± 0.001 e0.145 ± 0.007 bc
Wheat 202049.21 ± 0.39 a5.72 ± 0.02 ab0.60 ± 0.02 d0.073 ± 0.003 de0.163 ± 0.010 bc
Wheat 202149.67 ± 0.97 a6.29 ± 0.20 a1.42 ± 0.02 a0.039 ± 0.004 e0.029 ± 0.003 d
Wheat 202244.45 ± 0.25 bc5.11 ± 0.03 c0.87 ± 0.01 bc0.114 ± 0.007 cd0.092 ± 0.006 c
Corn 202047.30 ± 0.93 ab5.80 ± 0.16 ab0.99 ± 0.06 b0.037 ± 0.002 e0.243 ± 0.025 b
Corn 202142.95 ± 0.24 d5.22 ± 0.09 bc0.88 ± 0.07 bc0.040 ± 0.004 e0.227 ± 0.012 b
Corn 202243.09 ± 0.37 c5.33 ± 0.01 bc0.74 ± 0.01 cd0.043 ± 0.004 e0.233 ± 0.007 b
Rapeseed 202045.70 ± 0.31 bc5.61 ± 0.18 bc0.97 ± 0.02 b0.133 ± 0.019 c0.233 ± 0.023 b
Rapeseed 202143.41 ± 0.51 c5.40 ± 0.44 bc1.18 ± 0.15 ab0.394 ± 0.052 a0.425 ± 0.045 a
Rapeseed 202243.91 ± 0.45 c5.12 ± 0.01 c1.14 ± 0.01 ab0.205 ± 0.004 b0.367 ± 0.012 a
Mean 202048.18 ± 1.46 A5.77 ± 0.35 A0.82 ± 0.19 B0.075 ± 0.039 B0.182 ± 0.128 A
Mean 202145.77 ± 2.95 B5.75 ± 0.49 A1.04 ± 0.30 A0.106 ± 0.135 A0.136 ± 0.152 B
Mean 202244.66 ± 1.19 C5.28 ± 0.15 B0.78 ± 0.20 B0.084 ± 0.062 B0.202 ± 0.121 A
A,B,C homogenous groups for the harvest year separately for each attribute; a,b,c,d,e homogenous groups for the straw type and harvest year interaction separately for each attribute; ± standard deviation.
Table 6. Selected statistical analysis indicators for the attributes under study (N Valid = 54).
FeatureMeanMinimum ValueMaximum ValueLower QuartileUpper QuartileStandard DeviationCoefficient of
Variation (%)
MC (%)18.799.0651.4210.5317.8714.0975.00
FC (% DM)19.8617.6621.0719.3420.430.783.91
VM (% DM)75.2871.8277.7474.3776.571.461.94
Ash (% DM)4.872.319.473.815.951.6533.91
HHV (MJ kg−1 DM)18.6117.8519.1718.3818.830.341.82
LHV (MJ kg−1)13.767.3916.1313.4015.452.9021.06
C (% DM)46.2042.6850.6743.9948.742.475.36
H (% DM)5.604.846.425.305.790.427.48
N (% DM)0.880.491.440.711.020.2629.70
S (% DM)0.0880.0290.4380.0380.1030.08899.721
Cl (% DM)0.1740.0090.4760.0500.2550.13577.611
Disclaimer/Publisher’s Note: The statements, opinions and data contained in all publications are solely those of the individual author(s) and contributor(s) and not of MDPI and/or the editor(s). MDPI and/or the editor(s) disclaim responsibility for any injury to people or property resulting from any ideas, methods, instructions or products referred to in the content.

