Abstract
Electric power distribution networks are exposed to both internal and external disturbances. Lightning strikes are among the latter and are responsible for a significant percentage of damage in distribution transformers, especially in rural areas. Electric utilities must pay special attention to prevent damage and service interruption due to these unforeseeable events. In this context, Surge Protection Devices (SPDs) combined with a series of external air gaps are designed to safeguard electric equipment and systems from transient over-voltages. There are several well-known models of SPDs in the specialized literature; nonetheless, few studies have been carried out with external gaps and multi-gaps. The main contribution of this paper is a methodology to model the disruptive effect in an external air gap by determining the parameters of Kind’s and Chowdhuri’s models using the integration method. The adjustment of the model parameters is carried out by a genetic algorithm (GA). The proposed model was tested and validated using experimental measurements, and its capability to predict the time-to-breakdown under different impulse voltages was verified.
1. Introduction
Electric transmission and distribution systems transport electricity from generation plants to power demand centers such as industries and cities, generally located far away from the centralized generation. Electric power utilities must guarantee the reliability of the service; that is, the power supply must be maintained under any unforeseen event or disturbance, whether internal or external to the electric network [1,2]. In this context, lightning strikes are among the most difficult disturbances to deal with in distribution networks [3]; they cause between 30% and 50% of all interruptions or outages in medium voltage distribution systems, significantly affecting the reliability and quality indexes of power utilities [4,5,6,7]. Furthermore, lightning strikes are responsible for up to 50% of damages in distribution transformers in rural areas, mainly due to failures in transformer insulation caused by overvoltages that exceed the dielectric withstand level of the equipment [6,8].
Distribution networks and especially transformers are affected by direct and indirect lightning strikes. To handle this problem, different protection schemes against their effects have been proposed, mainly including surge protection devices (SPDs) or surge arresters, grounding systems, and spatial shielding devices or schemes [9,10].
In some countries, for smaller and less expensive transformers, under 200 kVA, only an air gap is used as SPD [11]. The main advantages of air gaps are their low cost and the fact that they can be inspected with the naked eye. On the other hand, the main disadvantage is that animals and objects such as tree branches can make accidental contact with the electrodes, causing their erroneous operation. Moreover, in ungrounded medium voltage networks, the arc between the gap electrodes cannot self-extinguish and the operation of breakers is required to open the circuit. Likewise, using these elements does not protect the transformer from very fast front overvoltages, that is, impulse wavefront times of less than one microsecond [11].
Other devices used to protect distribution transformers are zinc oxide (ZnO) SPDs, which have a smoother and faster operation than their air gap counterparts. The use of these elements renders the operation of circuit breakers unnecessary, and therefore, voltage sags are prevented. Nonetheless, ZnO SPDs are costly and difficult to inspect and diagnose using the basic maintenance procedures applied in distribution networks [12]. Due to the high current intensity and magnitude of energy of the atmospheric discharge, added to the large number of operations that ZnO SPDs must withstand, the physical limits of these devices are often exceeded, causing their damage or premature ageing and the failure of the circuit [13,14].
An alternative that combines the advantages of both devices is the so-called EGLA (externally gapped metal-oxide surge arrester), which as defined in the IEC 60099-8 standard, consists of a SPD in series with an external air gap [15,16]. In this case, the metal oxide SPD (mainly ZnO) is used to limit the current. Since the stresses to which the SPD would be subjected are lower than in the no-gap case, the SPD will not have to dissipate as much energy as in the case without the external gap, which also implies lower costs [17]. The ZnO disks are the only active part of this SPD, which must withstand the applied surge stresses and change their conductivity the instant a threshold value is exceeded, allowing a current pulse to flow. Once the voltage decreases below an extinction value, the disks return to their high impedance condition. When external gaps are placed in series with ZnO SPDs, the gap becomes the surge withstand device and defines the inception voltage, while the ZnO disks in the SPDs limit the current, extinguish the arc in the gap, and control the extinction voltage. This is completed within the first half cycle of the industrial AC frequency signal, avoiding the action of the circuit breakers. Because the gap controls the turn-on function of the discharge process, less ZnO material is required to quench the discharge current flowing through the device, resulting in very desirable characteristics concerning the protection capability of the SPD, i.e., lower values of lightning impulse protection levels [18,19]. These elements have already been used in different countries as IEC-certified devices [15] for shunt-type surge protection [20].
Some studies have shown an increase of reliability in distribution networks when using EGLAs in the primary of the transformers [21] as long as their protection level is low, i.e., with the lowest possible value of inception voltage, or combined with grounding systems of special characteristics, such as resonant grounding [22,23]. When grounding resistance values are greater than or equal to 5 Ohm, EGLAs perform better in terms of reducing backflow currents [24]. However, the use of these devices presents certain challenges in terms of stochastic operation of the gap discharge ignition and fast forward residual voltage pulses applied to the primary of the protected transformers. This implies an electrical overstress that puts the equipment at high risk [12]. On the other hand, in the face of very fast-front transient electromagnetic disturbances, the discharge inception delay due to the non-uniformity of the electric field in the external gap of EGLAs increases the probability of insulation failure risk below times of around nanoseconds; this is when compared to protective devices without external gap [5,25]. This application must start from an analysis of the trade-off between the reduction of the costs associated with the protection devices and the risk of distribution transformer insulation failure. Likewise, these devices make insulation coordination analyses difficult [17,26], so adequate models of their components are required that allow studies based on simulations.
Given the challenges described above regarding the protection of distribution transformers, a device known as a “three-electrode gap” or “multi-gap” was proposed [27]. A Three-electrode gap is an arrangement of three electrodes as follows: an upper extreme electrode is connected to the line to be protected, the lower extreme electrode is connected to the ground, and the intermediate electrode is floating, creating two gaps, one between the upper and intermediate electrode and the second gap, between the intermediate electrode and the lower electrode. By increasing the number of gaps, it is possible to adjust the inception time of the discharge process, from nanoseconds to microseconds, and also improve the self-extinguishing capability of the arc [28,29].
Regardless of the protection measure used, a study of the effect of a lightning strike must always be performed in which, through modeling and simulation, the effectiveness of the protection scheme is evaluated to verify that the electrical stresses applied to the equipment during lightning events are maintained within their support margins [30,31]. For these studies, adequate modeling of all parts and components, such as line insulators, poles, grounding, transformers, and protection devices, among others, is required, since the reliability of the results depends directly on the quality and accuracy of the models used [24,32].
There are several widely recognized and accepted models in the technical literature for SPDs [33,34,35,36]. However, few studies focus on the use of EGLA for the reduction of the risks associated with lightning strike inductions [24]. In this regard, to the best of the authors’ knowledge, this is the first paper to empirically model a three-electrode external gap to lightning-type impulses. In this paper, we propose a methodology for modeling external air gaps to provide a useful tool for the implementation of electrical insulation coordination studies in distribution networks where such kind of lightning arresters in series with SPDs are used as protection devices for distribution transformers and other sensitive equipment. To summarize, the main features and contributions of this paper are as follows:
- A new methodology is proposed to model the disruptive effect in an external air gap using the integration method.
- The adjustment of the model parameters is carried out by defining an optimisation problem.
- The proposed methodology is validated using experimental measurements for a case study. Furthermore, the results are compared with those obtained by other authors using different methodologies.
- Based on experimental measurements, the proposed methodology is applied to model a three-electrode-gap or multi-gap device and the capability of the model to predict the time-to-breakdown under different voltages is evaluated.
The rest of this document is organized as follows: a conceptual theoretical framework for air gap modeling is shown in Section 2. The proposed method for determining the parameters of the three-electrode gap disruptive model is presented in Section 3. The case study used is shown in Section 4. tests and results are analyzed in Section 5. Finally, the conclusions are presented in Section 6.
2. Air Gap Modeling
The essence of the air gap representation lies in modeling the change of state of the device (from insulator to conductor) once disruption conditions through the air between the gap electrodes are met. The IEC TR 60071-4 standard [37] proposes an electrical circuit model for air gaps consisting of a voltage-controlled switch in series with an inductance. The voltage-controlled switch closes when the overvoltage conditions are met and the time has elapsed for the arcing mechanism to be established, which for interelectrode distances of less than 1 m, corresponds to a streamer-type discharge. The inductance in series with the voltage-controlled switch, which represents the inductance of the discharge channel, is calculated from the total length of the gap taking as a reference a value of 1 H/m.
The assumption that such a voltage-controlled switch closes as soon as the voltage between its terminals reaches an inception value is unsuitable for transient analysis. Therefore, it is necessary to model the breakdown voltage characteristic vs. time-to-breakdown, with the voltage-time curve obtained by laboratory testing using standard lightning impulses, combined with the integration method, also known as the Disruptive Effect Model [37].
Integration Method Formulation
The discharge processes in gaseous, liquid, and solid insulation depends both on impulse voltage magnitude and its duration [38]. Electric power utilities must build acceptable methods of evaluating the influence of voltage surges of the non-standard wave shape on the apparatus’s electrical insulation and any method finally adopted should be substantiated by laboratory tests. The discharge process which leads to insulation breakdown is known as the disruptive effect () of an applied impulse [38,39,40]. The integration method was proposed for evaluating the of non-standard voltage wave shapes on oil-insulated transformers [41]. In ref. [39], the of a voltage impulse in an insulation system is defined by Equation (1), where is the applied voltage impulse expressed as a function of time and are constants that depend on the results of the transformer surge test:
This formulation was established on the basis that the transformer insulation could withstand a given voltage magnitude, , for a long period of time without significantly affecting its useful life. It was realized that the is a function of both voltage magnitude and time, but that these two factors should not be given equal weight. The constant was introduced to allow for some variation in the relative weight given to the voltage magnitude or time. The constants and for transformer insulation systems can be estimated from standard impulse tests [39]. This definition of the constants gives the integration method high flexibility; that is, with the proper values of and the voltage-time curve closely approximates the measurements, aligning with the observed data [40]. A generalized version of the integration method for predicting the strength of insulation subject to non-standard impulse wave shapes was presented in [38] and is given by Equation (2):
where DE is a constant which is dependent on the type of insulation system and applied voltage, is the applied voltage as a function of time, is the inception voltage required to initiate any discharge process, which depends on the type of gap and the applied impulse voltage, is the instant of time at which , and is the time-to-breakdown. Calculations with this method are based on determining ; by solving Equation (2), DE is equal to a specific constant of the insulation system (gap) under a specific voltage waveform, independent of its magnitude. This value can be determined from the results of laboratory tests under standard impulse voltages. The time-to-breakdown corresponding to an instantaneous voltage value, , is obtained as the abscissa of the point of intersection with the voltage-time (U-t) curve of the device [42,43].
The main drawback of this approach lies in the fact that empirically determined knowledge of the device’s performance under the standardized impulse voltage is not sufficient to predict its behavior under any type of applied voltage stress. Furthermore, it cannot be assumed that the discharge will always occur at the same instant of time, , under the same applied stress and provided that the condition established by the left side of Equation (2) are met, due to the stochastic behavior of the streamer inception phenomenon. Finally, the experimental voltage-time characteristic is only adequate to relate the peak value of standard impulse voltage wave shapes to the time-to-breakdown.
As previously mentioned, k, , and are parameters corresponding to a gap configuration and overvoltage polarity and must be determined using experimental measurements (at least two points of the experimental U-t curve). In the approach proposed by Kind, also known as Kind’s model [44], k is assumed to be 1 in Equation (2). Since the dimensions of in Kind’s model are [V·s], this model is also known as the equal areas criterion [45] (see Figure 1).
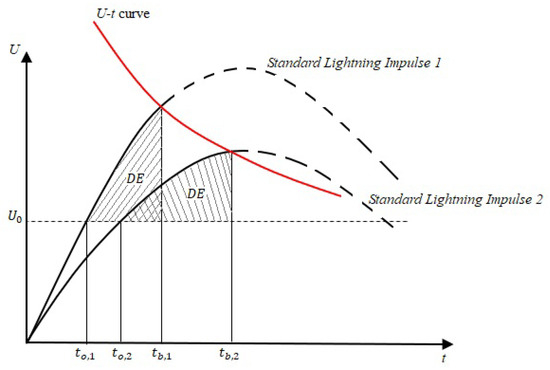
Figure 1.
Representation of the equal areas criterion model used to calculate the DE.
An alternative to Kind’s model is Chowdhuri’s model proposed by Chowdhuri et al. [46]. This model establishes that the propagation velocity of the streamer is proportional to the magnitude of the overvoltage across the gap. Chowdhuri’s model is shown in Equation (3), where is a constant in the applied overvoltage function that replaces the constant k in Equation (2). The value of depends on the type of gap and the waveform of the applied voltage; furthermore, it can be determined from the experimental voltage-time curve:
The main advantage of the models in Equations (2) and (3) is that they are derived from the integration method to evaluate the and therefore their operating principle can be correlated with the energy required for dielectric breakdown [38]. For this same reason, they can be applied for modeling gaps under non-standard impulses. These models are recommended for air gaps of length less than 1.2 m [37] and have been implemented for modeling short gaps under different waveforms [47,48], for transformer insulation systems [49], and for suspension insulators [50,51]. Nonetheless, according to the literature review, they have not been applied for modeling three-electrode gaps such as the one described in this paper.
3. Proposed Methodology
To model any insulation system, such as the two- or three-electrode gap, using the integration method given by Equations (2) and (3), it is necessary to obtain the corresponding , , k, or parameters from the results of the experimental tests carried out on the insulation system to be modeled.
The methodology proposed in this paper to obtain the parameters of Kind’s and Chowdhuri’s models is illustrated in Figure 2. It starts by obtaining the voltage-time curve data of the insulation system under study and its corresponding statistical analysis; then, it proceeds with the estimation of the parameters of the standard voltage impulse waveform using voltage values obtained at different points of the voltage-time curve and taken as the peak-values to reproduce the . Finally, the parameters of the models presented in Equations (2) and (3) are estimated by solving an optimization problem through a GA.
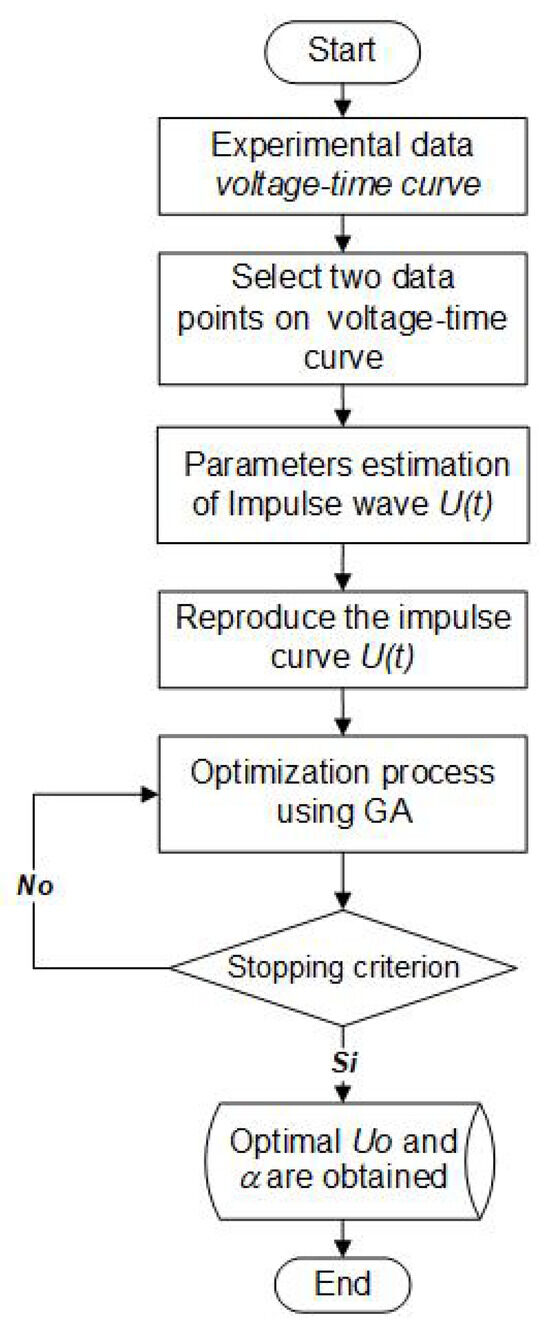
Figure 2.
Flowchart for computing the parameters of the model.
The 1.2/50 µs standard voltage impulse applied to the gap to produce the disruption or arcing between the terminals is modeled using the double exponential wave formulation as indicated in Equation (4):
In this case, A and B are constants that allow controlling the values of front () and tail times (). The definitions of and established by the IEC 60660-1 standard [52] are used for calculating A and B in Equation (4) through a curve fitting process which is carried out as an optimization problem. Therefore, the objective function corresponding to the derivative with respect to time of the double exponential function is minimized, and as constraints the definition of the instants corresponding to 30% and 90% of as presented in Equations (5) and (6) are enforced:
To solve the aforementioned optimization problem, the Matlab R2017a fminsearch function is used [53]. This function uses the simplex search method of Lagarias et al. [54], which is a direct search method that does not use numerical or analytical gradients.
An optimization problem is formulated from the U-t curve data and the standard voltage impulse waveforms. This information is used to identify the parameters of the disruptive effect model using the integration method with Kind’s and Chowdhuri’s models. The optimization problem seeks the parameters on the right side of Equations (2) and (3) with which, for two different experimental values of applied voltage and , the left side has the same value; that is, the same estimated disruptive effect (). Taking as an example Kind’s model, Equation (2) with , the above is formulated with Equation (7):
where a and b represent the two experimental values taken from the U-t curve used for the calculations. A similar formulation to that in Equation (7) can be obtained for Chowdhuri’s model, replacing Equation (3) in the integral forms at the right side of Equation (7).
An optimization process is proposed to find the optimal set of parameter values and , which can reproduce the U-t curve for a particular gap configuration under standard impulse voltages. The optimization process requires at least two ordered pairs from the experimental U-t curve. The first set (, ) is used to estimate , and the second one (, ) is used to estimate . It is recommended that the two selected data points are separated in time between 1.5 and 8 s, lightning impulses [38]. It is assumed that is a characteristic of the gap configuration and is independent of the applied voltage waveform. For the optimization process, the mathematical formulation presented in Equations (8)–(10) is proposed, where is the fifty per cent disruptive discharge voltage, defined as the value of the breakdown voltage with a 50% probability of occurrence [55], and corresponds to the standard deviation found in the measurements made to estimate the .
Minimize:
Subject to:
The above formulation used to obtain the parameters of Kind’s and Chowdhuri’s models corresponds to a Non-Linear Programming (NLP) problem. These types of problems are better handled by metaheuristic approaches than by classical mathematical programming techniques [56]. In this case, a run-of-the-mill GA was implemented; nonetheless, any other metaheuristic might have been used. GAs are widely known metaheuristic techniques inspired by the process of natural evolution that start from a randomly generated population that must go through states of selection, crossover, and mutation to find better solutions. Figure 3 shows the proposed chromosome to obtain the parameters of Chowdhuri’s model. On the other hand, the chromosome to obtain the parameter of Kind’s model only has one gene that corresponds to the first one in Figure 3.
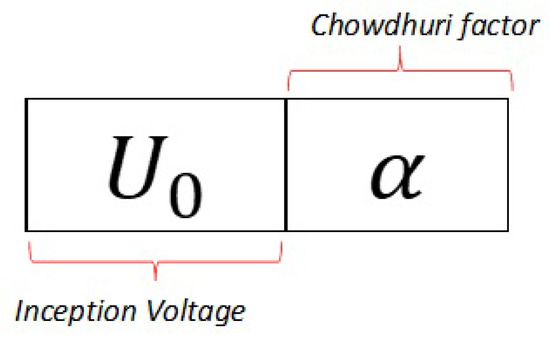
Figure 3.
Chromosome used to obtain the parameters of Chowdhuri’s model.
To set the initial population, the determination of the inception voltage, , is established from the experimental measurements and their fit to a normal distribution [46,57,58]. It was found that is in the range from 35% to 73% of [47,55]. The results shown in Table 1 were obtained fitting the experimental results for the positive polarity pulses presented in [27] to a normal distribution and following the procedure established in Section 15 of the IEEE 4-2013 standard [55]. In this case, corresponds to the standard deviation, while the confidence intervals of the 95th percentile are shown in square brackets. The p-value resulting from the Kolmogorov–Smirnov test is 0.12.

Table 1.
Results of the statistical analysis of the experimental tests for positive polarity pulses presented in [27].
Taking into account the recommendation in [47] and the results of Table 1, the search space for was defined as . The GA was implemented using a population of 50 individuals with mutation and selection rates of 0.4 and 0.5, respectively. The tournament method is used for the selection of parents to make the crossover to build the new individuals of the next generation.
4. Case Studies
Two case studies were conducted. Case study 1 is used to validate the performance of the methodology proposed in the previous section by contrasting the results obtained through simulation with experimental measurements reported in [47]. The device tested in this reference corresponds to a simple tip-tip spark-gap in air, constructed with vertical electrodes of 0.4 m length in the form of cylindrical brass rods whose diameter is 0.01 m and with beveled ends. The upper electrode is connected to a Marx-type high voltage generator while the lower electrode is connected to ground. The tip of the lower electrode was kept at 1.4 m to the ground plane. The gap was tested under standard and short-tail lightning impulses of positive and negative polarity for 0.1 m and 0.2 m spacings. For this case study, only the results corresponding to the gap with 0.1 m spacing under positive polarity standard lightning impulses are considered. The values of and the standard deviation calculated using the multi-level method reported in [47] are 94 kV and 3.1 kV, respectively. The experimental measurements were conducted using a 400 kV, 10 kJ four-stage Marx type impulse generator. Impulse voltages were measured using a digital peak voltmeter through a 400 kV resistive voltage divider, with a response time of less than 60 ns, the accuracy of the measurement is in the range +/−3%. The time-to-breakdown was directly measured from the oscillograms recorded by a digital oscilloscope Yokogawa Type DL 1520, 150 MHz bandwidth, with a sampling rate 200 MS/s. The breakdown frequency and standard deviation of the flashover voltage for every voltage level were determined from sets between 10 and 20 applied impulses. The difference of applied voltages between consecutive intervals was no more than 3% of the expected 50% disruptive-discharge voltage [47].
Case study 2 was previously analyzed in [27]; nonetheless, major details on the experimental set-up, related to the high voltage generator or measurement devices, are not provided. It corresponds to a three-electrode gap built on a 0.5 m polymeric insulator. The three electrodes are made of copper and are arranged as shown in Figure 4.
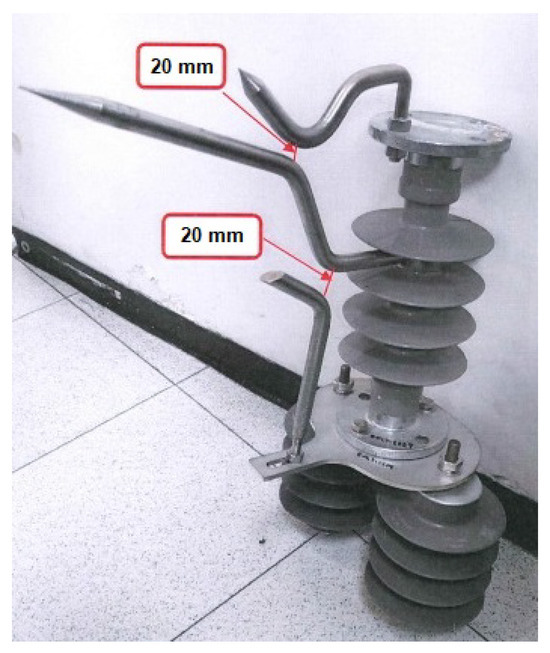
Figure 4.
Three-electrode-gap or multi-gap device.
Note that the resulting models are deterministic in the sense that the inception of the streamer is not considered a stochastic phenomenon [59]. However, as the models are related to the energy required to generate the breakdown of the protective devices, they can be used with stochastic models of induced lightning impacts on distribution networks for estimating the outage rates for distribution networks based on simulation results.
The separation between each pair of electrodes, at the closest points, is 20 mm. Tests were carried out in the laboratory of the National University of Colombia, Bogota, at an altitude of 2600 masl, following the IEC 60060-1 standard [52] to determine the breakdown voltage of the three-electrode gap, alone and with a pin-type insulator in parallel. Appendix C of [27] presents the results of tests performed considering 1.2/50 s standard voltage impulses, with peak values, , in the ranges of 49.5–53.9 kV, negative polarity, and 50.6–61.2 kV, positive polarity. Table 2 summarizes the results for the positive polarity pulses. For each polarity and voltage level, 15 tests were carried out. It was found that the differences between the Basic Insulation Level (BIL) of the three-electrode gap under both polarities was below 4%.

Table 2.
Summary of three-electrode gap measurement results under standard positive polarity pulses, adapted from [27].
One of the conclusions in [27] is that the basic insulation level (BIL) of the device does not depend on the polarity of the applied pulses; therefore, only positive polarity pulses will be considered in this study. In addition, in [27] it is established that the U-t characteristic curve conforms to Equation (11):
5. Results and Analyses
To obtain Kind’s and Chowdhuri’s models for Case study 1, (represented by Equations (2) and (3), respectively), two ordered pairs, namely 1.5 s, 117.4 kV and 0.76 s, 184.3 kV, were taken from the experimental measurements reported in [47]. From the values corresponding to the two test points, the remaining parameters in Equations (2) and (3) were calculated using a GA with the objective function described in Section 4. The results are shown in the second and third columns of Table 3, where the resultant value of the Objective Function (O.F) and the number of iterations of the genetic algorithm (GA generations) after the parameters calculation process are also included for each case study.

Table 3.
Summary of the results of Kind’s and Chowdhuri’s models calculated for the two case studies.
The U-t curve for Case study 1 was reproduced using the circuit illustrated in Figure 5 for each ordered pair reported in [47]. This circuit was implemented in ATPDraw according to the guidelines of the IEC TR 60071-4 Standard [37] with the parameters presented in Table 3 [60].
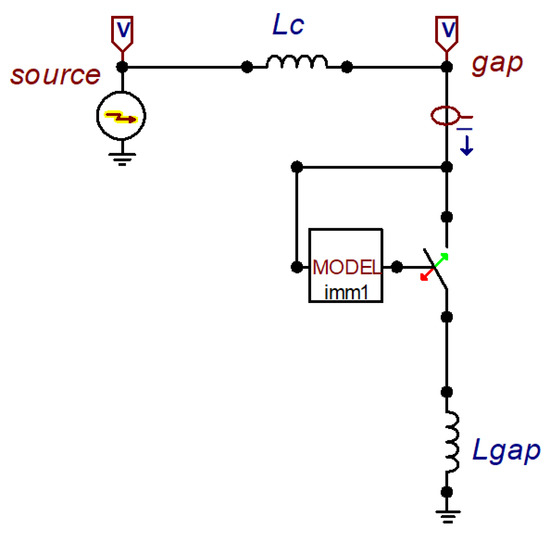
Figure 5.
Model implemented in ATPDraw for the prediction of the U-t curve of the three-electrode gap.
In this case, , is the inductance of the connecting circuit on the high voltage side of the source [27] and is the streamer channel inductance, which is calculated as 1 H/m [37]. The Model block in Figure 5 allows controlling the switch that simulates the dielectric breakdown. The results are illustrated in Figure 6. It can be seen that both models reproduce U-t curves very close to the characteristic curve measured experimentally. However, in the range between 130 kV and 165 kV, Chowdhuri’s model performs better than the Kind’s model and the opposite occurs between 100 kV and 120 kV.
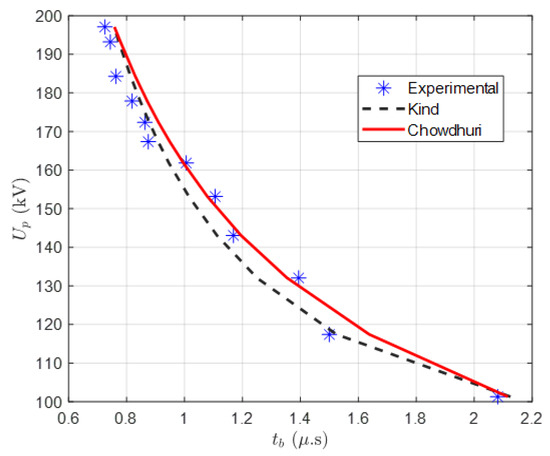
Figure 6.
Comparison between experimental values reported in [47] and calculated with the proposed methodology.
The average value of the difference between the experimental and calculated using Kind’s model is 0.051 s, while the one obtained using Chowdhuri’s model is 0.049 s. Ancajima et al. [47] reported 0.1 s and 0.01 s as differences, calculated with Kind’s and Chowdhuri’s models, respectively. From the above, it can be evidenced that the proposed methodology is reliable and presents similar results to those obtained with other proposed and widely accepted methodologies, even with smaller differences for Kind’s model.
To derive Kind’s and Chowdhuri’s models for the three-electrode gap in Case study 2, the two ordered pairs (4.236 s, 56.3 kV) and (2.630 s, 61.2 kV), taken from the experimental U-t curve defined by Equation (11), were used. These ordered pairs correspond to levels 4 and 7 of Table 2, and were chosen because they have a relative frequency that allows assuming as negligible the stochastic behavior of the dielectric breakdown process. The parameters of the models calculated following the methodology described in Section 4 are shown in the fourth and fifth columns of Table 3. It can be seen that both models for the three-electrode gap have different parameters due to the effect of the exponential function in Equation (3). However, note that the inception voltage obtained with both models is relatively close, with a difference of 4.311%. Furthermore, the value of the objective function, for both cases, is less than 1 × . This evidences that the models can reproduce with a very low error the two ordered pairs on the U-t curve.
Figure 7 shows the results obtained using the circuit in Figure 5 for the conditions defined by levels 4 and 7 in Table 2 and using Kind’s and Chowdhuri’s models with the parameters in Table 3.
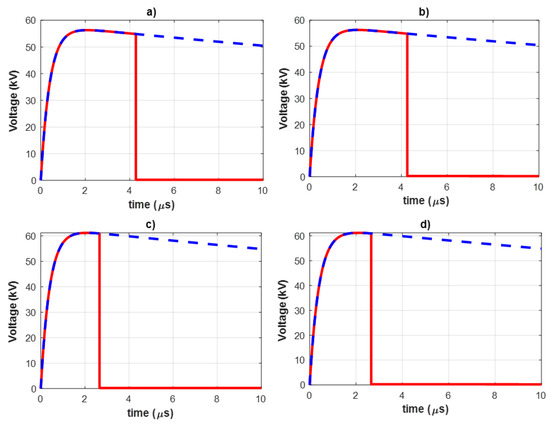
In Figure 7, the blued dashed curve corresponds to the standard impulse voltage generated by the high voltage source, while the red curve corresponds to the residual voltage at the terminals of the three-electrode gap. To validate the performance of the obtained models, the U-t curve is reproduced using 1.2/50 s standard impulse voltages, with peak values defined by levels 3 to 7 of Table 2. Table 4 shows the results of obtained with the implemented models and its comparison with the values estimated from the experimental U-t curve.

Table 4.
Prediction of the voltage-time curve using the computed models.
In Table 4, (%) and (%) correspond to the percentage errors obtained with Kind’s and Chowdhuri’s models, respectively, with respect to the values inferred from the experimental curve for each value of the test voltage amplitude. These results are depicted in Figure 8.
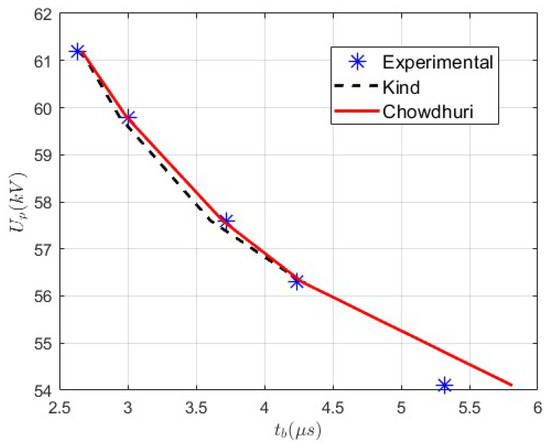
Figure 8.
Comparison of voltage-current curves determined with the implemented models and experimentally measured [27].
From Table 4 and Figure 8, it can be inferred that for voltage levels in the range 56.3 kV to 61.2 kV, both models adequately reproduce the U-t curve. The highest error (3.026%) is obtained with Kind’s model for = 57.6 kV, while the lowest one (0.331%) is obtained with Chowdhuri’s model for = 59.8 kV. On the other hand, for the voltage level of 54.1 kV, according to Kind’s model, the discharge does not occur, while according to Chowdhuri’s model, is 5.813 s, which implies an error of 9.281% when compared to that determined according to the experimental U-t curve. This allows inferring that Chowdhuri’s model has a greater capacity to predict values of the time-to-breakdown when stresses lower than those used for the determination of the model parameters are applied. However, for this specific case, it should be taken into account that the relative frequency of the discharges for the voltage level of 54.1 kV is only 0.267 (see Table 2), so a more detailed analysis should be made, including the stochastic behavior of the discharges process.
6. Conclusions
Surge protection devices play a key role in safeguarding the reliability and functionality of distribution networks against lightning strikes. This paper presented a new methodology to model the disruptive effect in external air single-gap and multi-gap lighting arresters using the integration method. Two modeling approaches, Kind’s and Chowdhuri’s models, were used, whose parameters were adjusted using a GA.
Two case studies were carried out to show the applicability of the proposed methodology for external air gap modeling. Simulations were carried out in ATPDraw following the guidelines established in the IEC TR 600071-4 standard. When compared with experimental measurements, it was found that the models determined using the proposed methodology are capable of reproducing the experimentally measured U-t curve with precision suitable for engineering analyses.
The simulation results of the first case study show that the precision depends on the range of the magnitude of the applied voltage, with the Kind’s model being more accurate for the range between 100 kV and 120 kV, while in the range between 130 kV and 165 kV, Chowdhuri’s model is more precise. When the results of the methodology proposed in this paper are compared with those presented by other authors, similar errors are obtained, even smaller ones using the Kind’s model.
In this paper, for the first time, the disruptive effect on a three-electrode-gap or multi-gap device is modeled using the integration method, as was presented in the second case study. It was shown that the proposed methodology can also be applied to this type of devices and that the simulation results are consistent with the experimental measurements. When compared with experimental measurements, Chowdhuri’s model presents lower errors than Kind’s model, and allows us to infer that it is capable of estimating values of the U-t curve, beyond the points used for determining the parameters.
The developed models obtained through the proposed methodology can be used to simulate the behavior of protection devices against lightning impulses and, in conjunction with high-frequency models of different components of the distribution network, to evaluate the capacity of the insulation coordination system to protect sensitive equipment.
Author Contributions
Conceptualization, J.M.R.-S. and W.M.V.-A.; Data curation, J.M.R.-S. and W.M.V.-A.; Formal analysis, J.M.R.-S., W.M.V.-A. and J.M.L.-L.; Funding acquisition, J.M.R.-S., W.M.V.-A. and J.M.L.-L.; Investigation, J.M.R.-S. and W.M.V.-A.; Methodology, J.M.R.-S. and W.M.V.-A.; Project administration, J.M.R.-S., W.M.V.-A. and J.M.L.-L.; Resources, J.M.R.-S., W.M.V.-A. and J.M.L.-L.; Software, J.M.R.-S. and W.M.V.-A. Supervision, J.M.R.-S., W.M.V.-A. and J.M.L.-L.; Validation, J.M.R.-S. and W.M.V.-A.; Experimental testing, J.M.R.-S. and W.M.V.-A.; Visualization, J.M.R.-S., W.M.V.-A. and J.M.L.-L.; Writing—original draft, J.M.R.-S. and W.M.V.-A.; Writing—review and editing, J.M.R.-S., W.M.V.-A. and J.M.L.-L. All authors have read and agreed to the published version of the manuscript.
Funding
This research was funded by Universidad de Antioquia (Medellin, 050010, Colombia).
Data Availability Statement
Data are available through authors via e-mail.
Acknowledgments
The authors gratefully acknowledge the financial support provided by the Colombian Ministry of Science, Technology, and Innovation “MinCiencias” through “Patrimonio Autónomo Fondo Nacional de Financiamiento para la Ciencia, la Tecnología y la Innovación, Francisco José de Caldas” (Perseo alliance Contract No. 112721-392-2023). The authors would also like to thank Carlos A. Cárdenas of Hirdrocol S.A.S. for the information shared.
Conflicts of Interest
The authors declare no conflicts of interest.
References
- Agudelo, L.; López-Lezama, J.M.; Muñoz-Galeano, N. Vulnerability assessment of power systems to intentional attacks using a specialized genetic algorithm. Dyna 2015, 82, 78–84. [Google Scholar] [CrossRef]
- López-Lezama, J.M.; Cortina-Gómez, J.; Muñoz-Galeano, N. Assessment of the Electric Grid Interdiction Problem using a nonlinear modeling approach. Electr. Power Syst. Res. 2017, 144, 243–254. [Google Scholar] [CrossRef]
- Torres Sánchez, H. El Rayo: Mitos, Leyendas, Ciencia y Tecnología; UNIBIBLOS; Universidad Nacional de Colombia, Facultad de Ingeniería: Bogotá, Colombia, 2002. [Google Scholar]
- Sakshaug, E. Influence of Rate-of-Rise on Distribution Arrester Protective Characteristics. IEEE Trans. Power Appar. Syst. 1979, PAS-98, 519–526. [Google Scholar] [CrossRef]
- van der Mescht, M.; van der Mescht, C.; van Schalkwyk, W.D. Protection of Medium Voltage Pole-mount Installations against Lightning. In Proceedings of the 2022 36th International Conference on Lightning Protection (ICLP), Cape Town, South Africa, 2–7 October 2022; pp. 741–744. [Google Scholar] [CrossRef]
- Aranguren, H.D.; Tovar, C.; Inampues, J.; Lopez, J.; Soto, E.; Torres, H. Lightning effects on distribution transformers and reliability of power distribution systems in Colombia. Ing. Investig. 2015, 35, 28–33. [Google Scholar] [CrossRef]
- Georgilakis, P.S.; Kagiannas, A.G. A novel validated solution for lightning and surge protection of distribution transformers. Int. J. Electr. Power Energy Syst. 2014, 63, 373–381. [Google Scholar] [CrossRef]
- Piantini, A.; Janiszewski, J.M.; de Carvalho, T.O.; Obase, P.F.; dos Santos, G.J.G. Lightning-caused transformer failures in distribution systems. In Proceedings of the 2014 International Conference on Lightning Protection (ICLP), Shanghai, China, 11–18 October 2014; pp. 955–960. [Google Scholar] [CrossRef]
- Andreotti, A.; Araneo, R.; Mahmood, F.; Piantini, A.; Rubinstein, M. An Analytical Approach to Assess the Influence of Shield Wires in Improving the Lightning Performance Due to Indirect Strokes. IEEE Trans. Power Deliv. 2021, 36, 1491–1498. [Google Scholar] [CrossRef]
- Arevalo, L.; Mejia, A.; Diaz, O. Design and construction of surge protection devices for rural distribution transformers based on the hygroscopic properties of sand. In Proceedings of the 2007 International Symposium on Lightning Protection (IX SIPDA), Foz do Iguazu, Brazil, 26–30 November 2007; pp. 1–8. [Google Scholar]
- Heine, P.; Lehtonen, M.; Niskanen, J.; Oikarinen, A. Limiting the number of the most severe voltage sags in rural medium voltage networks. In Proceedings of the 2008 Power Quality and Supply Reliability Conference, Parnu, Estonia, 27–29 August 2008; pp. 99–104. [Google Scholar] [CrossRef]
- Lahti, K.K.; da Silva, D.A. Possibilities to protect pole-mounted distribution transformers by means of externally gapped MO arresters. In Proceedings of the 2014 ICHVE International Conference on High Voltage Engineering and Application, Poznan, Poland, 8–11 September 2014; pp. 1–4. [Google Scholar] [CrossRef]
- Khanmiri, D.T.; Ball, R.; Mosesian, J.; Lehman, B. Degradation of low voltage metal oxide varistors in power supplies. In Proceedings of the 2016 IEEE Applied Power Electronics Conference and Exposition (APEC), Long Beach, CA, USA, 20–24 March 2016; pp. 2122–2126. [Google Scholar] [CrossRef]
- Wang, M.; Ren, X.; Zhou, Q.; Li, Z.; Yang, H.; Jiang, H.; Yan, Y.; Ruan, X.; Yu, W.; Jin, L.; et al. High improvement of degradation behavior of ZnO varistors under high current surges by appropriate Sb2O3 doping. J. Eur. Ceram. Soc. 2021, 41, 436–442. [Google Scholar] [CrossRef]
- IEC60099-8; Metal-Oxide Surge Arresters with External Series Gap (EGLA) for Overhead Transmission and Distribution Lines of A.C. Systems above 1 kV. International Electrotechnical Commission—IEC: London, UK, 2017.
- Woodworth, J. Externally gapped line arrester a comprehensive review. In Proceedings of the IEEE PES T&D 2010, New Orleans, LA, USA, 19–22 April 2010; pp. 1–6. [Google Scholar] [CrossRef]
- Giraudet, F. Various Benefts for Line Surge Arrester Application and Advantages of Externally Gapped Line Arresters. In Proceedings of the 2019 International Conference on High Voltage Engineering and Technology (ICHVET), Hyderabad, India, 7–8 February 2019; pp. 1–6. [Google Scholar] [CrossRef]
- Mansoor, A.; Martzloff, F.; Phipps, K. Gapped arresters revisited: A solution to cascade coordination. IEEE Trans. Power Deliv. 1998, 13, 1174–1181. [Google Scholar] [CrossRef]
- IEC 60099-4:2014; Surge Arresters—Part 4: Metal-Oxide Surge Arresters without Gaps for A.C. Systems. International Electrotechnical Commission—IEC: London, UK, 2014.
- Woodworth, J. Externally gapped line arresters a critical design review. In Proceedings of the 2014 IEEE PES T&D Conference and Exposition, Chicago, IL, USA, 14–17 April 2014; pp. 1–5. [Google Scholar] [CrossRef]
- Plummer, C.; Goedde, G.; Pettit, E.; Godbee, J.; Hennessey, M. Reduction in distribution transformer failure rates and nuisance outages using improved lightning protection concepts. IEEE Trans. Power Deliv. 1995, 10, 768–777. [Google Scholar] [CrossRef]
- Martinez, M.; Wanderley, E.; Nunes, A. Externally Gapped Distribution Arresters to Solve TOV Issues. In Proceedings of the 2013 INMR World Congress, Vancouver, BC, Canada, 8–11 September 2013; pp. 1–10. [Google Scholar] [CrossRef]
- Khodsuz, M. Externally gapped line arrester performance in high voltage transmission line using frequency grounding system: Absorbed energy and expected life assessment. IET Sci. Meas. Technol. 2022, 16, 426–440. [Google Scholar] [CrossRef]
- Omar, A.I.; Mohsen, M.; Abd-Allah, M.A.; Salem Elbarbary, Z.M.; Said, A. Induced Overvoltage Caused by Indirect Lightning Strikes in Large Photovoltaic Power Plants and Effective Attenuation Techniques. IEEE Access 2022, 10, 112934–112947. [Google Scholar] [CrossRef]
- Burrage, L.; Shaw, J.; McConnell, B. Distribution transformer performance when subjected to steep front impulses. IEEE Trans. Power Deliv. 1990, 5, 984–990. [Google Scholar] [CrossRef]
- Ahmadi, M.E.; Niasati, M.; Barzegar-Bafrooei, M.R. Enhancing the lightning performance of overhead transmission lines with optimal EGLA and downstream shield wire placement in mountainous areas: A complete study. IET Sci. Meas. Technol. 2019, 14, 564–575. [Google Scholar] [CrossRef]
- Arias, J. Análisis teórico experimental de la efectividad del sistema de protección contra descargas atmosféricas del transformador de distribución rural de energía en Colombia. Master’s Thesis, Universidad Nacional de Colombia, Bogotá, Colombia, 2003. [Google Scholar]
- Liu, X.; Rong, J. The Application of Multi-Gap Arresters in 10–35kV Overhead Transmission Line. In Proceedings of the 2019 11th Asia-Pacific International Conference on Lightning (APL), Hong Kong, China, 12–14 June 2019; pp. 1–4. [Google Scholar] [CrossRef]
- Guo, T.; Zhou, W.; Su, Z.; Li, H.; Yu, J. A Multigap Structure for Power Frequency Arc Quenching in 10-kV Systems. IEEE Trans. Plasma Sci. 2016, 44, 2622–2631. [Google Scholar] [CrossRef]
- Brignone, M.; Delfino, F.; Procopio, R.; Rossi, M.; Rachidi, F. Evaluation of Power System Lightning Performance—Part II: Application to an Overhead Distribution Network. IEEE Trans. Electromagn. Compat. 2017, 59, 146–153. [Google Scholar] [CrossRef]
- Mestriner, D.; Brignone, M.; Procopio, R.; Nicora, M.; Fiori, E.; Piantini, A.; Rachidi, F. An Efficient Methodology for the Evaluation of the Lightning Performance of Overhead Lines. IEEE Trans. Electromagn. Compat. 2021, 63, 1137–1145. [Google Scholar] [CrossRef]
- Khadka, N.; Bista, A.; Bista, D.; Sharma, S.; Adhikary, B. Direct Lightning Impact Assessment on a Rural Mini-Grid of Nepal. In Proceedings of the 2021 35th International Conference on Lightning Protection (ICLP) and XVI International Symposium on Lightning Protection (SIPDA), Colombo, Sri Lanka, 20–26 September 2021; Volume 1, pp. 1–7. [Google Scholar] [CrossRef]
- Working Group 3.4.11 on Surge Arrester Modeling. Modeling of metal oxide surge arresters. IEEE Trans. Power Deliv. 1992, 7, 302–309. [Google Scholar] [CrossRef]
- Pinceti, P.; Giannettoni, M. A simplified model for zinc oxide surge arresters. IEEE Trans. Power Deliv. 1999, 14, 393–398. [Google Scholar] [CrossRef]
- Unahalekhaka, P. Simplified Modeling of Metal Oxide Surge Arresters. Energy Procedia 2014, 56, 92–101. [Google Scholar] [CrossRef]
- Christodoulou, C.; Ekonomou, L.; Mitropoulou, A.; Vita, V.; Stathopulos, I. Surge arresters’ circuit models review and their application to a Hellenic 150kV transmission line. Simul. Model. Pract. Theory 2010, 18, 836–849. [Google Scholar] [CrossRef]
- IEC TR 60071-4; Insulation Co-Ordination–Part 4: Computational Guide to Insulation Co-Ordination and Modelling of Electrical Networks. International Electrotechnical Commission—IEC: London, UK, 2004.
- Darveniza, M. The generalized integration method for predicting impulse volt-time characteristics for non-standard wave shapes-a theoretical basis. IEEE Trans. Electr. Insul. 1988, 23, 373–381. [Google Scholar] [CrossRef]
- Witzke, R.L.; Bliss, T.J. Co-ordination of Lightning Arrester Location with Transformer Insulation Level. Trans. Am. Inst. Electr. Eng. 1950, 69, 964–975. [Google Scholar] [CrossRef]
- Jones, A.R. Evaluation of the Integration Method for Analysis of Nonstandard Surge Voltages [includes discussion]. Trans. Am. Inst. Electr. Eng. Part III Power Appar. Syst. 1954, 73, 984–990. [Google Scholar] [CrossRef]
- Witzke, R.L.; Bliss, T.J. Surge Protection of Cable-Connected Equipment. Trans. Am. Inst. Electr. Eng. 1950, 69, 527–542. [Google Scholar] [CrossRef]
- CIGRE WG 33.01. Guide to Procedures for Estimating the Lightning Performance of Transmission Lines; Technical Brochures 063; CIGRE: Paris, France, 1991. [Google Scholar]
- Anderson, J.G. Lightning Performance of Transmission Lines. In Transmission Line Reference Book; Electric Power Research Institute: Palo Alto, CA, USA, 2017; p. 1194. [Google Scholar]
- Kind, D.; Kurrat, M.; Kopp, T.H. Voltage-time characteristics of air gaps and insulation coordination—Survey of 100 years research. In Proceedings of the 2016 33rd International Conference on Lightning Protection (ICLP), Estoril, Portugal, 25–30 September 2016; pp. 1–8. [Google Scholar] [CrossRef]
- Trotsenko, Y.; Brzhezitsky, V.; Masluchenko, I. Circuit simulation of electrical breakdown in air using Kind’s equal-area criterion. Technol. Audit. Prod. Reserv. 2017, 3, 44–49. [Google Scholar] [CrossRef][Green Version]
- Chowdhuri, P.; Mishra, A.; McConnell, B. Volt-time characteristics of short air gaps under nonstandard lightning voltage waves. IEEE Trans. Power Deliv. 1997, 12, 470–476. [Google Scholar] [CrossRef]
- Ancajima, A.; Carrus, A.; Cinieri, E.; Mazzetti, C. Breakdown characteristics of air spark-gaps stressed by standard and short-tail lightning impulses: Experimental results and comparison with time to sparkover models. J. Electrost. 2007, 65, 282–288. [Google Scholar] [CrossRef]
- Silva, A.R.; Piantini, A.; Silva, D.A.d.; Shigihara, M. Breakdown of 15 kV Insulators Under Bipolar Oscillating Impulse Voltage. In Proceedings of the 2018 34th International Conference on Lightning Protection (ICLP), Rzeszow, Poland, 2–7 September 2018; pp. 1–6. [Google Scholar] [CrossRef]
- Venkatesan, S.; Usa, S. Impulse Strength of Transformer Insulation with Nonstandard Waveshapes. IEEE Trans. Power Deliv. 2007, 22, 2214–2221. [Google Scholar] [CrossRef]
- Inthoulath, K.; Banmongkol, C. A simulation of breakdown characteristics of suspension insulators under standard lightning impulse voltages. In Proceedings of the TENCON 2014—2014 IEEE Region 10 Conference, Bangkok, Thailand, 22–25 October 2014; pp. 1–4. [Google Scholar] [CrossRef]
- Shigihara, M.; Piantini, A.; Ramos, M.; Braz, C.; Mazzetti, C.; Ancajima, A. Comparison of different procedures to predict the volt-time curves of 15kV insulators. Electr. Power Syst. Res. 2017, 153, 82–87. [Google Scholar] [CrossRef]
- IEC 60060-1:2010; High-Voltage Test Techniques–Part 1: General Definitions and Test Requirements. International Electrotechnical Commission—IEC: London, UK, 2010.
- The MathWorks Inc. MATLAB Version: 9.13.0 (R2022b); The MathWorks Inc.: Natick, MA, USA, 2022. [Google Scholar]
- Lagarias, J.C.; Reeds, J.A.; Wright, M.H.; Wright, P.E. Convergence Properties of the Nelder–Mead Simplex Method in Low Dimensions. Siam J. Optim. 1998, 9, 112–147. [Google Scholar] [CrossRef]
- IEEE Std 4-2013 (Revision of IEEE Std 4-1995)—Redline; IEEE Standard for High-Voltage Testing Techniques—Redline. Institute of Electrical and Electronics Engineers: Piscataway, NJ, USA, 2013; pp. 1–500.
- Pérez Posada, A.F.; Villegas, J.G.; López-Lezama, J.M. A Scatter Search Heuristic for the Optimal Location, Sizing and Contract Pricing of Distributed Generation in Electric Distribution Systems. Energies 2017, 10, 1449. [Google Scholar] [CrossRef]
- Ancajima, A.; Carrus, A.; Cinieri, E.; Mazzetti, C. Behavior of MV Insulators Under Lightning-Induced Overvoltages: Experimental Results and Reproduction of Volt–Time Characteristics by Disruptive Effect Models. IEEE Trans. Power Deliv. 2010, 25, 221–230. [Google Scholar] [CrossRef]
- Ancajima, A.; Carrus, A.; Cinieri, E.; Mazzetti, C. Optimal selection of disruptive effect models parameters for the reproduction of MV insulators volt-time characteristics under standard and non standard lightning impulses. In Proceedings of the 2007 IEEE Lausanne Power Tech, Lausanne, Switzerland, 1–5 July 2007; pp. 760–765. [Google Scholar] [CrossRef]
- Rodríguez-Serna, J.M.; Albarracín-Sánchez, R. Numerical Simulation of Temperature and Pressure Changes due to Partial Discharges in Spherical Cavities within Solid Dielectrics at Different Ageing Conditions. Energies 2019, 12, 4771. [Google Scholar] [CrossRef]
- Høidalen, H. ATPDraw™ The Graphical Preprocessor to ATP. 2023. Available online: https://citeseerx.ist.psu.edu/document?repid=rep1&type=pdf&doi=9f3c41d43a0b20a045aad260e2eb83bca7eb6890 (accessed on 1 February 2024).
Disclaimer/Publisher’s Note: The statements, opinions and data contained in all publications are solely those of the individual author(s) and contributor(s) and not of MDPI and/or the editor(s). MDPI and/or the editor(s) disclaim responsibility for any injury to people or property resulting from any ideas, methods, instructions or products referred to in the content. |
© 2024 by the authors. Licensee MDPI, Basel, Switzerland. This article is an open access article distributed under the terms and conditions of the Creative Commons Attribution (CC BY) license (https://creativecommons.org/licenses/by/4.0/).