Article

The Influence of the Changes in Natural Gas Supplies to Poland on the Amount of Hydrogen Produced in the SMR Reactor

1
Faculty of Drilling, Oil and Gas, AGH University of Krakow, al. Adama Mickiewicza 30, 30-059 Krakow, Poland
2
Academic Centre for Materials and Nanotechnology, AGH University of Krakow, al. Adama Mickiewicza 30, 30-059 Krakow, Poland
*
Authors to whom correspondence should be addressed.
Energies 2024, 17(5), 1221; https://doi.org/10.3390/en17051221
Submission received: 26 July 2023 / Revised: 25 February 2024 / Accepted: 27 February 2024 / Published: 4 March 2024
(This article belongs to the Special Issue Hydrogen Energy Generation, Storage, Transportation and Utilization)

Abstract

:
Thanks to investments in diversifying the supply of natural gas, Poland did not encounter any gas supply issues in 2022 when gas imports from Russia were ceased due to the Russian Federation’s armed intervention in Ukraine. Over the past few years, the supply of gas from routes other than the eastern route has substantially grown, particularly the supplies of liquefied natural gas (LNG) via the LNG terminal in Świnoujście. The growing proportion of LNG in Poland’s gas supply leads to a rise in ethane levels in natural gas, as verified by the review of data taken at a specific location within the gas system over the years 2015, 2020, and 2022. Using measurements of natural gas composition, the effectiveness of the steam hydrocarbon reforming process was simulated in the Gibbs reactor via Aspen HYSYS. The simulations confirmed that as the concentration of ethane in the natural gas increased, the amount of hydrogen produced, and the heat required for reactions in the reformer also increased. This article aims to analyze the influence of the changes in natural gas quality in the Polish transmission network caused by changes in supply structures on the mass and heat balance of the theoretical steam reforming reactor. Nowadays, the chemical composition of natural gas may be significantly different from that assumed years ago at the plant’s design stage. The consequence of such a situation may be difficulties in operating, especially when controlling the quantity of incoming natural gas to the reactor based on volumetric flow without considering changes in chemical composition.

1. Introduction

Poland’s natural gas market is among the fastest growing in European Union (EU) countries. Gas demand in Poland rose by over 33% between 2011 and 2021, compared to just a 3.8% increase throughout the EU [1]. The recent armed conflict between the Russian Federation and Ukraine in 2022 has significantly impacted gas supply sources in both Poland and the EU. The EU implemented measures to reduce gas imports from Russia, decreasing from 153.4 billion cubic meters (bcm) to 67.4 bcm in 2021, and witnessed a significant rise in liquefied natural gas (LNG) imports, increasing from 73.7 to 123.2 bcm. Additionally, gas supplies from Azerbaijan increased from 8.1 to 11.4 bcm. In 2022, Europe became the foremost destination for U.S. LNG exports, accounting for 64% of the overall exports. Notably, France, the United Kingdom, Spain, and the Netherlands collectively accounted for 74% of U.S. LNG exports to Europe [2]. In 2022, Norway surpassed Russia to become the largest natural gas supplier to the EU. Russia’s share of gas exports to the EU has plummeted from 41.1% in 2021 to 18.75% in 2022. Compared to the previous year, gas deliveries from Norway to the EU rose by over 7% [3].
Although global LNG supply increased by 5.5% in 2022, Europe experienced the largest increase in fuel demand, at 66 bcm. High natural gas prices, which exceeded 340 euros/MWh in August 2022, were the primary driver of a significant decrease of 55 bcm in demand in EU countries, a 13% decrease from 2021. The most considerable declines in gas demand happened in Finland, Lithuania, and Sweden, whereas only Malta and Ireland slightly raised their gas consumption. If we examine the gas consumption by the economic sector, the EU sector saw the most significant drop in consumption, amounting to 28 bcm; the buildings sector observed a 20% reduction (including both households and commercial and public buildings). A substantial reduction in gas consumption was recorded in the industrial sector in 2022, namely by 25 bcm (25% compared to 2021). This decrease was mainly due to the vast increases in gas prices and the uncertain situation of gas supplies. Many EU countries have had production curtailments or periodic halts, especially for the mineral fertilizer industry [4,5]. The European Commission announced a new action plan REPowerEU to address the upcoming energy crisis and reduce Europe’s dependence on Russia for energy before 2030 [6,7]. For years, the Russian Federation has pursued an active foreign policy, particularly towards Central and Eastern European countries. It uses natural gas supplies to exert political pressure and achieve its strategic geopolitical objectives [8,9].
Both the current Energy Policy of Poland until 2040 and earlier government strategic documents have indicated that the primary goal regarding gas is to diversify natural gas supplies [10]. The most critical infrastructure projects implemented over the past decade include the construction of an LNG terminal in Świnoujście and the Baltic Pipe, providing direct gas supplies to Poland from the Norwegian Continental Shelf. The commissioning of the LNG Terminal in Świnoujście and other investments in constructing gas connections that integrate with other markets, for example, the Czech Republic, Lithuania, and Slovakia, formed part of the development of the North–South corridor. These investments have enabled the provision of natural gas to Poland through alternative routes. As a result of diversifying gas supplies through investments, Poland’s natural gas supply sources have been altered. In recent years, the proportion of gas flows originating from Russia has gradually declined, while the percentage of gas from sources alternative to the Eastern route has increased (Figure 1) [11]. Gas deliveries from Russia ended in April 2022. To address the natural gas demand in Poland, similar to other EU countries, there has been a notable surge of approximately 50% in LNG supplies in 2022 when compared to 2021 (Figure 2). The leading suppliers of LNG to Poland in 2022 were the United States and Qatar, the world leaders in terms of LNG exports. These countries are investing in LNG liquefaction capacity, which is expected to increase by 42 million tons annually by 2027. As a result, U.S. gas is set to surpass all other countries in LNG supply growth by 2027 [12]. Table 1 demonstrates that the majority of LNG terminals in the EU, including the one in Świnoujście, experienced significant growth in usage throughout 2022 compared to the previous four-year period (2018–2021) [13]. The initial regasification capacity of the LNG Terminal in Świnoujście amounted to 5 bcm/y. Since 2022, it has increased to 6.2 bcm/y, and there is an ongoing plant expansion program that aims to elevate the regasification capacity to 8.3 bcm/y by 2024 [14]. The development of the regasification capacity of the LNG Terminal in Świnoujście and the construction of a new Floating Storage Regasification Unit (FSRU) in the Gulf of Gdansk is in line with Poland’s energy policy goals [15].
While the natural gas market in Poland has shown dynamic growth over the past decade, there was a significant drop of almost 17% in gas sales in 2022. As with other EU countries, the main cause for the decline in demand for natural gas was due to its high prices in the wholesale market. Table 2 reveals that the majority of gas in Poland is supplied to industrial customers. In 2022, the industrial sector received 56.4% of all gas deliveries, whereas only 32.7% of gas sales went towards households. In 2021, natural gas sales to industrial customers experienced a notable drop of 23.1%. However, the decline in sales for households was smaller, at just 5.2% [17]. The COVID-19 restrictions put in place between 2020 and 2021 had an adverse effect on gas sales, particularly to households and trade and services sector customers [18]. It is worth noting that Poland’s primary industrial gas consumers are the refining and chemical industries.
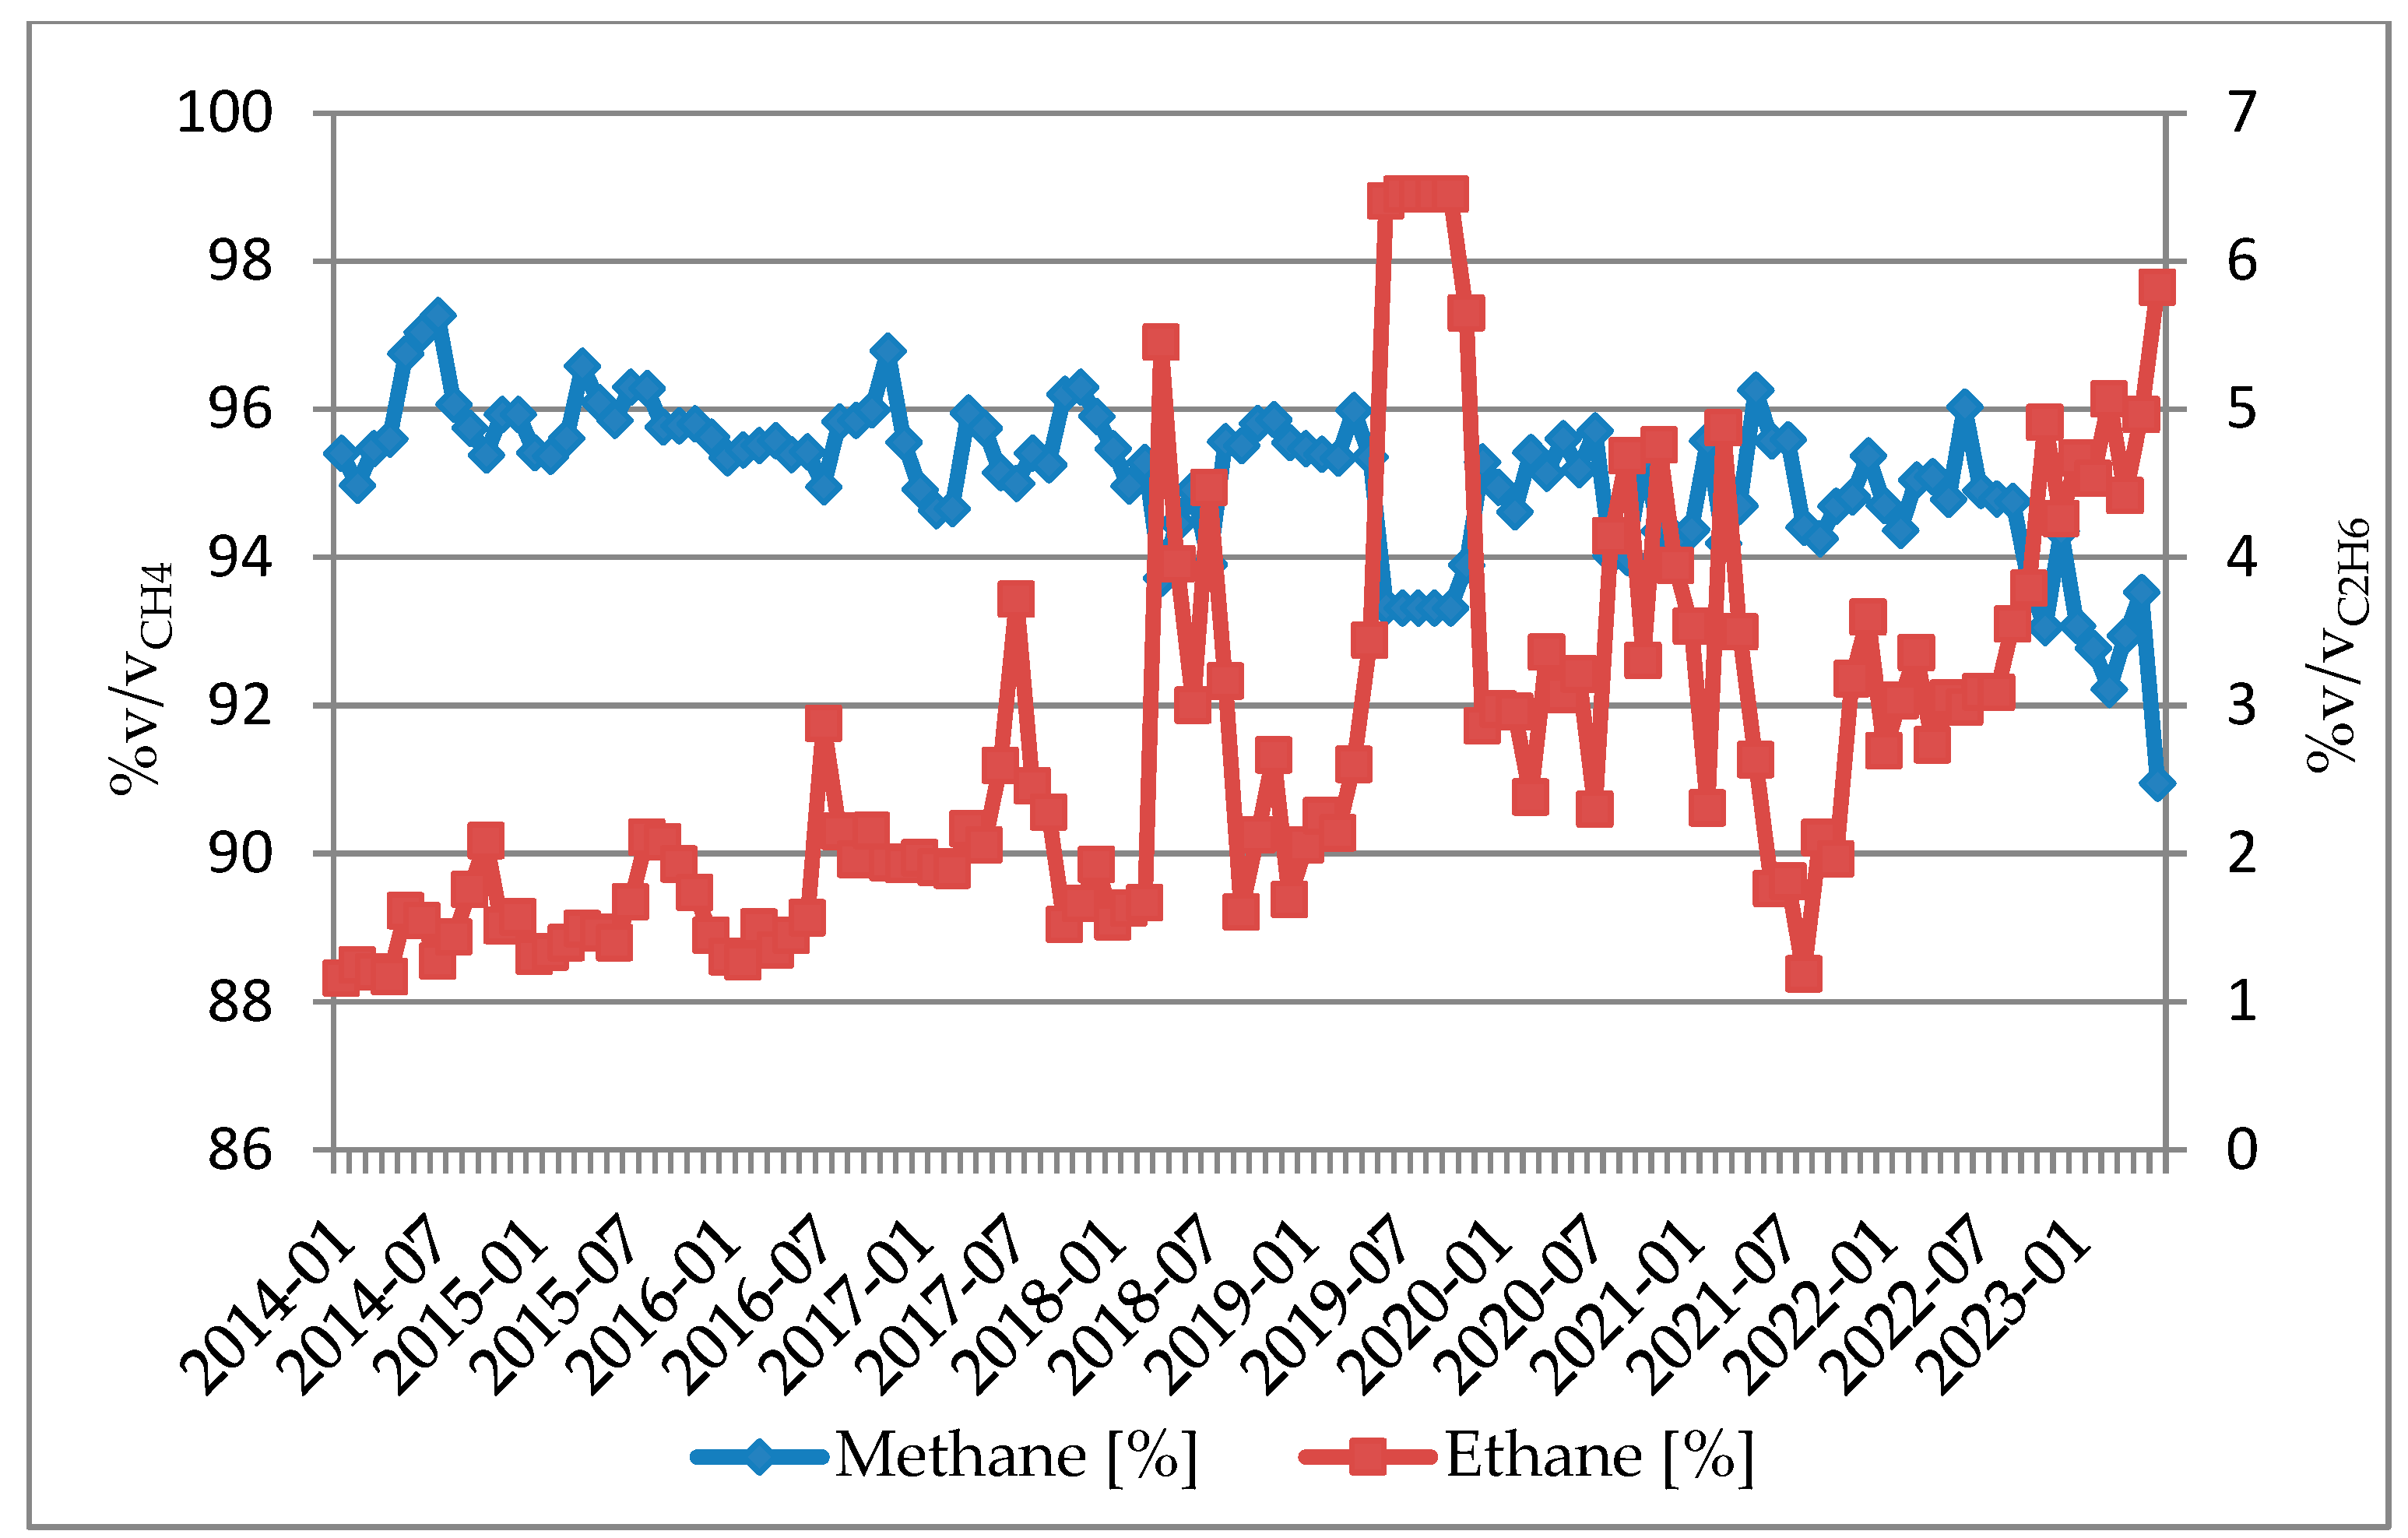
As of April 2022, gas imports from Russia have come to an end, with an increase in supplies of LNG, and the beginning of supplies from Norwegian fields via the Baltic Pipe in October 2022. As previously mentioned, there has been a noticeable change in the sources of gas supply in Poland in recent years. This shift in gas supply sources has affected the composition of natural gas in Poland. Regarding Russian gas, methane accounted for approximately 97% and ethane for 1%. In contrast, for LNG, the rate of methane is generally lower, typically below 95%, with ethane ranging from 2% (Egypt), to approximately 6% (Norway, Nigeria, Qatar) and up to 13% (Libya) [19,20,21,22]. The growing use of LNG to meet domestic gas demand has an impact on the levels of methane and ethane present in natural gas, as seen in Figure 3. Since mid-2021, there has been a reduction in the proportion of methane present in natural gas, which is largely attributable to a corresponding increase in the concentration of ethane [23].
Further changes in the composition of natural gas transported through the transmission grid are anticipated, particularly due to the injection of renewable gases such as biomethane and hydrogen into the grid [24,25,26,27,28]. In 2022, global demand for hydrogen increased to 95 million tons. New production volumes were primarily generated through fossil fuel conversion processes [29]. In Poland, the third largest hydrogen producer in the EU, natural gas currently dominates as the source of hydrogen production [30]. Nevertheless, it is anticipated that there will be changes in the production structure, and low- and zero-emission hydrogen will become increasingly important. In this context, the regions of the Baltic Sea designated for offshore wind energy development appear to be particularly attractive [31]. Another crucial aspect of the energy transition could involve utilizing hydrogen for large-scale energy storage, such as in salt caverns. This solution would partially address the energy storage issue associated with the growing use of renewable energy sources (RES) in the electricity generation mix. In 2022, RES accounted for 17.4% of Poland’s electricity generation mix. To implement this solution, hydrogen must be introduced into the natural gas grid, and a natural gas–hydrogen mixture must be transmitted [32,33,34]. Material design aspects must be considered in this case. High-strength and advanced high-strength steels are utilized among the pipe materials for natural gas pipelines, as required by legal conditions and applicable standards. Classic arc welding methods are used for the welding processes. When introducing hydrogen into gas, particularly around fittings, new automated welding techniques with high power density, such as electron beam or laser welding, are being utilized more regularly [35,36]. The welding area and the heat-affected zone could potentially be the weakest area due to crystallization conditions or as a result of thermal conductivity during welding [37].
This study aims to demonstrate that a structural change in the supply of natural gas to Poland could noticeably affect the amount of hydrogen produced in the steam methane reforming process at existing production facilities that receive gas directly from the transmission network. The impact of changes occurring in the chemical composition of the feedstock on the reforming process in the SMR reactor has been analyzed in previous studies, including [38,39,40,41,42]. Based on these studies, a model for which simulations were conducted by assuming changes in the quality of the supplied natural gas corresponding to accurate measurements was developed. In the authors’ opinion, the novelty of this work is not the SMR reactor model but the obtained characteristic results on how the plants were impacted with the changes of the natural gas quality, as noted in Poland due to changes in the supply structure.

2. Materials and Methods

2.1. Materials

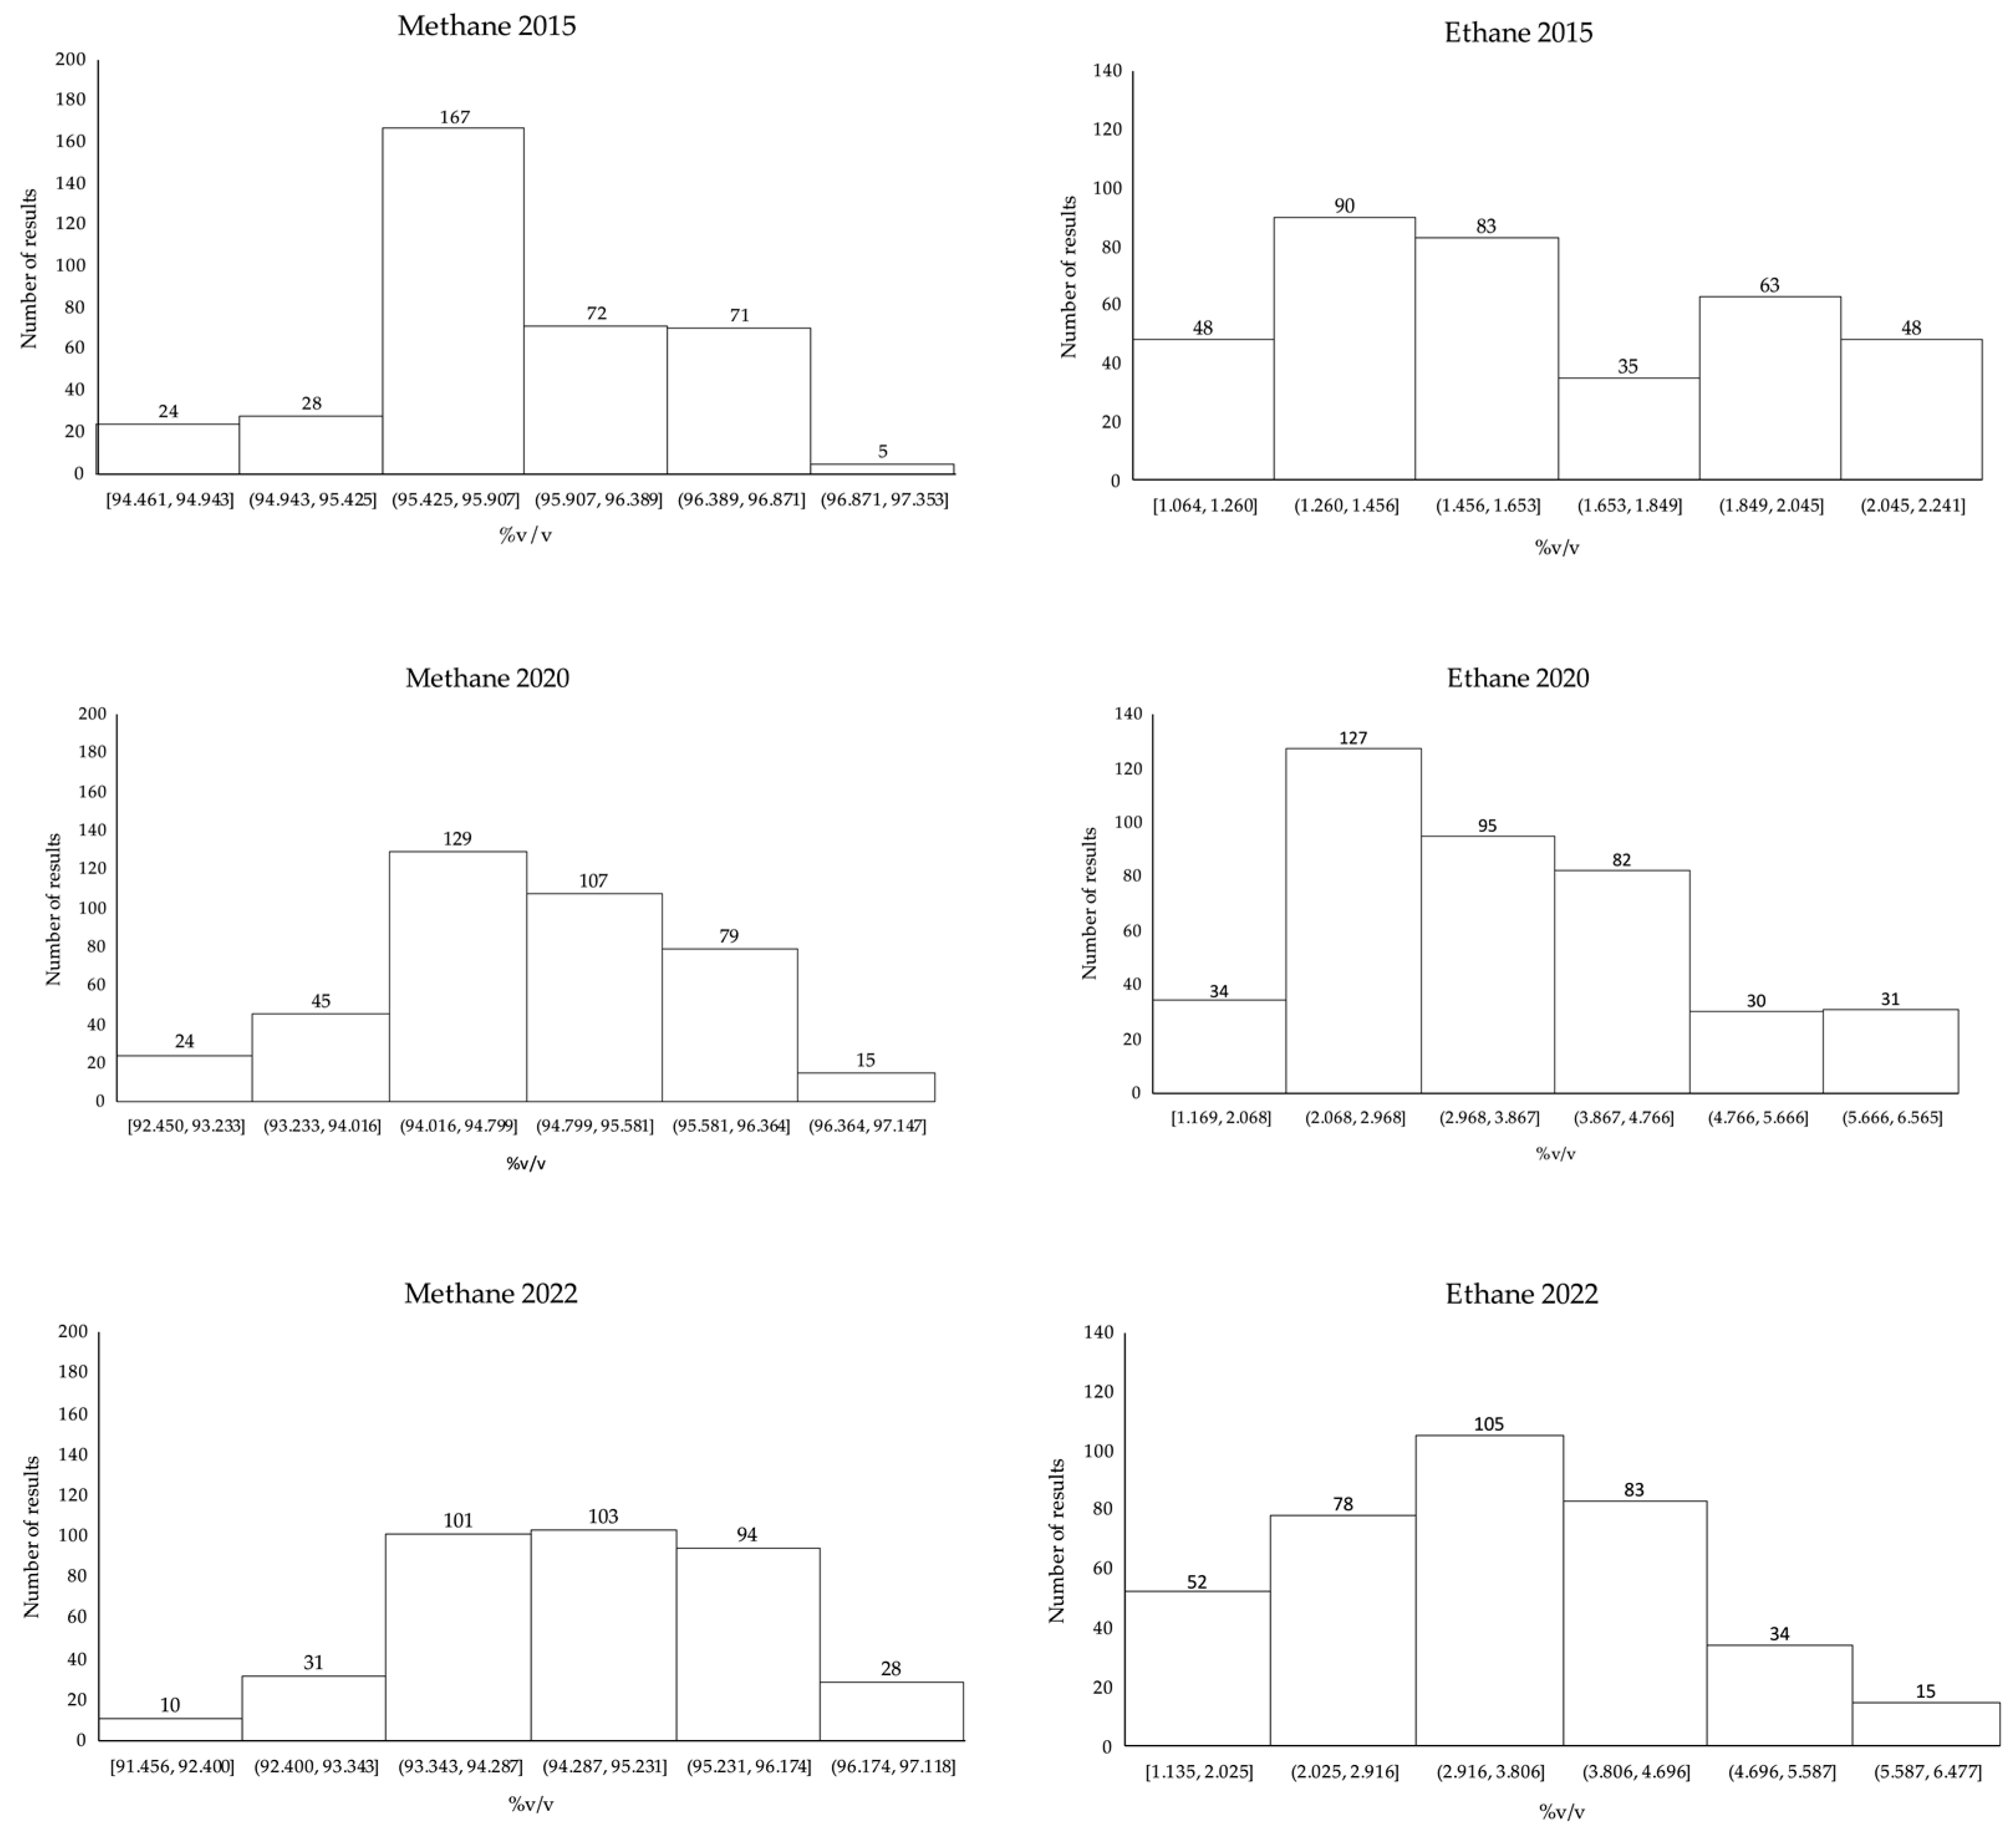
To illustrate the effects of modifications in the structure of the natural gas supply to Poland on the quality of natural gas, publicly available information from the information exchange system SWI GAZ-SYSTEM S.A. was examined about a selected point located in the southern part of Poland. The exit point Area No. 308 Opole was chosen as an example [23]. Figure 4 shows histograms depicting the annual measurements of methane (on the left) and ethane (on the right) concentrations at the analyzed exit point in 2015, 2020, and 2022. Data were extracted from the SWI database. The results were divided into six groups on individual histograms. The study of the graph indicates that in 2020 and 2022, following the launch of the LNG terminal, there was a substantial increase in the frequency of samples containing natural gas with a lower methane content when compared to the samples analyzed in 2015, where the average concentration of methane was 95.875% v/v and ethane was 1.616% v/v. Based on the analyzed data, the minimum methane level was identified as 94.461% v/v, with the maximum level at 97.353% v/v. Similarly, the minimum ethane concentration was noted as 1.604% v/v, while the maximum concentration was found to be 2.241% v/v.
In 2020, the average calculated from the available and analyzed methane results at the exit point decreased to about 94.818% v/v compared to the 2015 average. However, ethane’s calculated average noticeably increased to 3.477% v/v. Additionally, due to the higher supplies of LNG, the lowest measured concentration of methane at the analyzed point was 92.450% v/v this year, and the highest was 97.147% v/v. The decline in methane concentration within natural gas was offset by a rise in ethane concentration, ranging from 1.169% v/v at a minimum to 6.565% v/v at a maximum.
With the continued high level of LNG supply in 2022, an increase in the frequency of analytical results with higher concentrations of ethane was observed in comparison to the conditions in 2015. Subsequently, the average methane concentration was determined to be 94.629% v/v and ethane at 3.379% v/v. The minimum measured methane concentration was 91.456% v/v, whereas the maximum was 97.118% v/v. As for ethane, the minimum was determined to be 1.135% v/v, and the maximum at 6.477% v/v.
The above analysis confirms that alterations in the configuration of natural gas supply to the Polish gas system have impacted the quality of gas customers receive from the transmission grid. Tracking the changes in ethane concentration enables us to postulate that the gas received at the LNG terminal in Świnoujście, situated in the northern part of Poland, directly reaches both the transmission infrastructure elements and the customers located in the southern part of the country.
The natural gas quality measurements from the years 2015, 2020, and 2022 were surveyed for methane concentrations, and the values with the highest and lowest concentrations were recorded. These data formed the basis for Table 3, which presents the findings of the study. Chemical compositions formed the basis for preparing six scenarios used in simulations to illustrate the impact of quality changes in natural gas caused by the shift in the supply structure on the amount of hydrogen produced in a theoretical steam reforming reactor located in the southern part of Poland.

2.2. Methods

2.2.1. Simulation Method

A simplified model was subsequently developed using Aspen HYSYS V11 to evaluate the effects of modifications to natural gas quality on the changes in the amount of hydrogen produced in the reforming reactor.
The model is based on the assumption that changes in natural gas quality in industrial hydrogen plants with an SMR reactor are particularly noticeable in terms of quantity and quality when the reforming node is in operation.
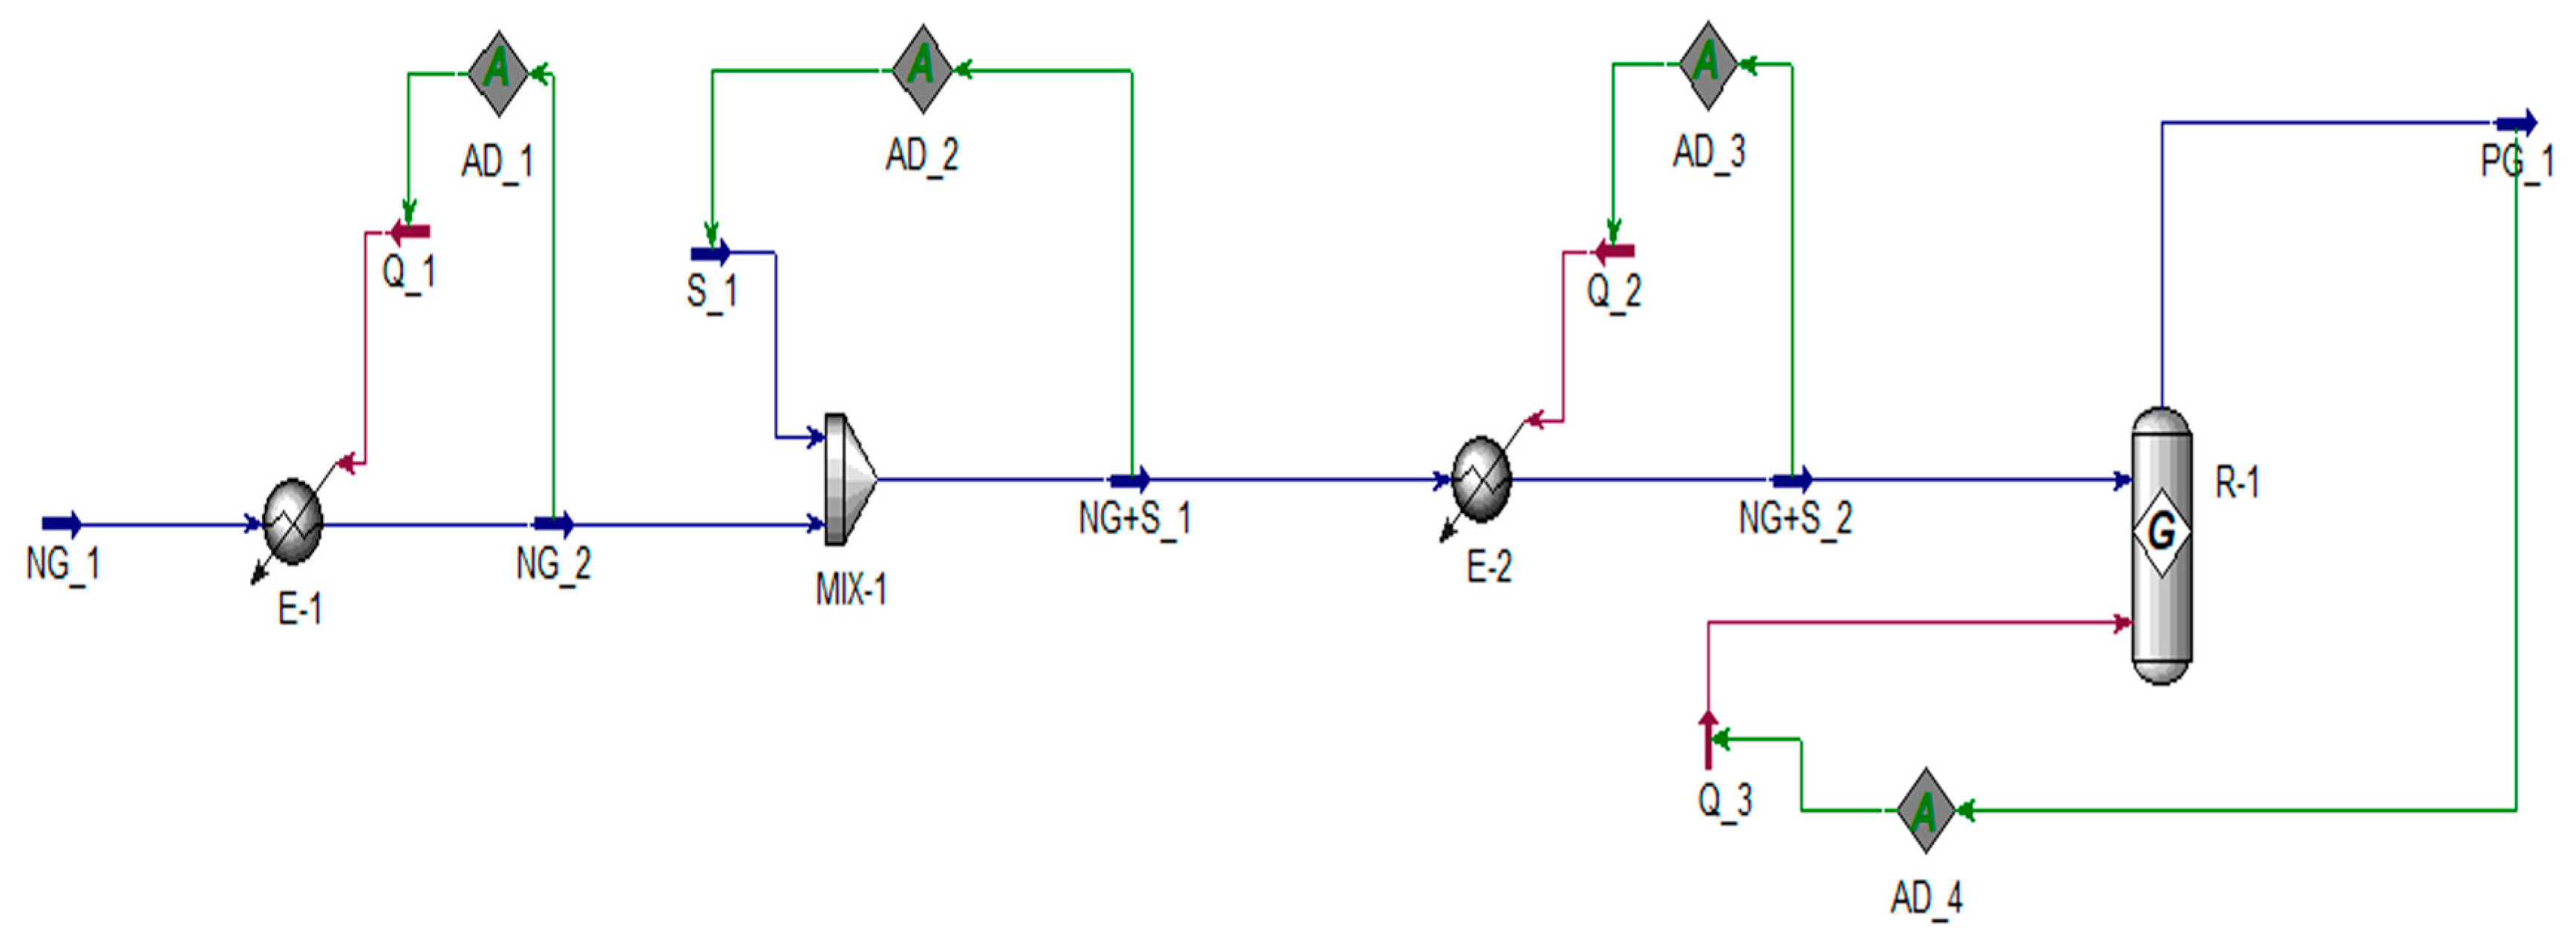
Therefore, the model consisted of a node responsible for preparing a natural gas/steam mixture, as well as a component representing the catalytic tubes of the reforming furnace. A visual display of this model is depicted in Figure 5.
The modelling assumes that natural gas is taken directly from the grid, then heated to the desired temperature and mixed with a stream of steam. The natural gas/steam mixture is then heated to reaction conditions and fed into the reactor.
Reactions under industrial conditions occur on a nickel catalyst within catalytic tubes. In the model, the reactions in the catalytic tubes are described by means of a Gibbs-type reactor. The Gibbs reactor assumes that minimizing the free enthalpy of the reaction system enables one to estimate the degree of conversion for equilibrium reactions by considering information on the reagents’ composition. The assumption is that the system’s free energy is minimal when the change in the Gibbs free enthalpy is zero. This condition is satisfied when the product of temperature and total entropy change equals zero, achieved when p, T = const., limiting the process to equilibrium conditions. One notable drawback of the approach is that the computations are limited to equilibrium values, failing to account for the temperature gradient across the flow inside the reactor. The reactor’s design and the catalysts’ characteristics are not considered either [43]. The determination of minimum free enthalpy using a Gibbs reactor is based on a non-stoichiometric formula and assumes the simulation of an ideal mixture. At the same time, it is not necessary to write equations for the reactions taking place or to possess knowledge of empirically determined parameters that describe their kinetics, which is a significant simplification [44]. The accuracy of the results is sufficient from the point of view of the purpose of this study.

2.2.2. Process Description

A stream of natural gas NG_1 with a flow rate of 300 kmol/h, temperature of 40 °C, and pressure of 3.2 MPaA is extracted from the grid and directed to heat exchanger E-1. The heat flux Q_1 is also supplied to the exchanger, which is regulated by the logic element AD_1. The purpose of this element is to maintain a constant temperature of the gas stream NG_2 at the outlet of E-1, at 370 °C. The heated natural gas is guided towards the mixer MIX-1. The stream NG_2 is mixed with the stream of steam S_1 in the mixer. It is assumed that steam is externally supplied at a temperature of 243.4 °C and a pressure of 3.5 MPaA. The logic element AD_2 ensures that the steam-to-carbon ratio in the natural gas stream is always 3.3 kmol H2O/kmol C. By performing this procedure, a mixture of steam and natural gas NG + S_1 is produced at the outlet of MIX-1. This stream is then fed to the exchanger E-2, to which the heat flux Q_2 is also provided. Consistently maintaining a temperature of 570 °C for the NG + S_2 stream at the outlet of E-2 is achievable by utilizing the logic element AD_3 across all simulation scenarios. The NG + S_2 stream is subsequently routed to reactor R-1. The heat flux Q_3 regulated by AD_4 is injected into the reactor R-1 to achieve the temperature of the process gas PG_1 of approximately 830 °C in each simulation scenario.

2.2.3. Assumptions

The following assumptions and simplifications were made in constructing the model:
-
The process does not result in heat loss to the ambient through the walls of the piping, exchangers, mixer, and reactor shell.
-
The key elements influencing the steam reforming process in the tube reactor are the chemical composition of the feedstock, the heat balance, the temperature and pressure of the process, the properties and mass of the catalyst used, and the reactor design (including, inter alia, the material and thickness of the catalytic tubes, the operating characteristics of the burners, etc.). These elements directly influence the reactions taking place, the mass and heat transport through the porous catalyst grains, the mass and heat transfer processes between the catalyst grains and the fluid core, the heat transfer between the flue gases and the process gas flowing through the catalytic tubes, and the heat transfer of the flue gases from the burners to the combustion chamber, taking into account the furnace parameters and the catalysts used. These elements influence the overall kinetics and thermodynamics of the process, which has a direct impact on the degree of feedstock reactivity and the energy intensity of the process. Currently, the most accurate SMR reactor models are based on empirical models. Their development requires knowledge of detailed reaction kinetics and thermodynamics parameters, detailed information on the reformer design, catalyst-specific constants (e.g., catalyst density, grain density, grain porosity, pore curvature factor, average pore radius), and bed (specific surface area, bulk density, porosity). Some of the parameters can be found in the literature, while others need to be determined empirically or obtained directly from manufacturers. To simplify the model to a degree acceptable to the subject of the work, it was assumed that the processes taking place in the catalytic tube space could be described by a Gibbs reactor.
-
Pressure losses of gas flowing through the pipelines and apparatus are not taken into account (except for pressure drops in the exchanger E-2 = 0.02 MPa and R-1 = 0.07 MPa).
-
The heat supplied to the exchangers E-1, E-2, and reactor R-1 (Q_1, Q_2, and Q_3, respectively) depends on the desired temperatures maintained by the corresponding logic element. For the NG_2 stream via AD_1 with an expectation value of 370 °C, a tolerance of 0.1 °C and an iteration step of 1000 kJ/h. For the NG + S_2 stream, the desired temperature was maintained via AD_3 with an expectation value of 570 °C, a tolerance of 0.1 °C and an iteration step of 2000 kJ/h. The temperature of the PG_1 stream was maintained by AD_4 with a tolerance of 0.1 °C and an iteration step of 10,000 kJ/h. The model did not include the combustion of fuel gases for the heat input to the reaction space of the catalytic tubes.
-
The steam supplied to MX-1 remains at a constant temperature and pressure, while the amount directed to the mixer varies. Stream S_1 is derived from the expected value taken in AD-2. The desired number of moles in S_1 was calculated based on the number of moles of C in NG_2, while keeping S/C constant at 3.3 kmol H2O/kmol C (to the nearest 0.01). It is assumed that the steam is supplied from an external source.

2.2.4. Limitations

The limitations of this work are primarily related to the variability in the quality of the natural gas used in the simulations and the assumptions made during the model development stage.
The analysis of the variability in natural gas quality was limited to a review of the results from the historical determinations recorded at transmission system exit point No. 308 Opole. Analysis of determination results at other exit points may require an adjustment of Table 2.
The simulation results may differ from the process parameters obtained at production facilities under real conditions due to the assumptions made. Additionally, it is important to note that the model is not a digital twin of any of the existing production facilities. Furthermore, excluding the exhaust gas utilization section and the boilers utilizers from the model makes it impossible to assess the impact of changes in natural gas quality on the steam balance and overall economy of the process. This is due to the necessity, adopted within the framework of the work, to keep the S/C ratio and the inlet and outlet temperatures of R-1 constant during the simulation.

3. Results

Six simulations were conducted utilizing a dedicated model and natural gas compositions specified in Table 3. The crucial assumptions and outcomes from the simulations are shown in Figure 6. The numbers 1 to 6 on the coordinate axes of each graph represent the simulations that utilized the gas quality outlined in the corresponding rows of Table 3 (matching numbers in column #).
To demonstrate alterations in the levels of methane, ethane, and propane within natural gas NG_1 streams subjected to simulations, we have prepared Figure 6a. The lowest methane concentration recorded in the natural gas stream was 91.46% v/v, while the highest was 97.35% v/v. The range of ethane content varied from 1.20% to 6.44% v/v, while propane varied from 0.11% to 1.34% v/v. It is assumed that hydrogen is not added to natural gas, which is usually done if the installation is equipped with a hydrodesulfurization node. Consequently, the raw material sent for mixing with steam in the mixer MIX-1 is qualitatively identical to the natural gas received from the transmission grid.
As the quality of natural gas varied, the number of carbon atoms present in the NG_1 stream also changed accordingly. To maintain consistency in the simulations, it was presumed that the molar flow of natural gas would remain constant at 300 kmol/h every time. Knowing the chemical composition and molar flow, the number of carbon moles were calculated. The results obtained varied noticeably from 294.1 kmol C/h in Simulation No. 1 to 326.1 kmol C/h in Simulation No. 3. As the concentration of ethane and propane increased, the number of carbon moles in NG_1 increased. For each simulation, the number of carbon moles in natural gas and the molar flow of natural gas are shown in Figure 6b. Figure 6c presents variations in the amount of steam directed to the mixer MIX-1 and the S/C ratio. Following the assumptions, the S/C ratio in NG_2 was kept at 3.3 kmol H2O/kmol C. Steam was assumed to be imported from an external source. As the number of moles in the natural gas stream rose, so did the amount of steam fed into the mixer. In these examined cases, the steam directed to the process varied from 970.6 to 1076.0 kmol H2O/h.
During the simulations, as the quality of the mixture NG + S_2 changed, so did the quantity and quality of the process gas PG_1 exiting the reactor R-1. The findings indicated that the variation in the concentrations of hydrogen present in PG_1 ranged from 43.07 to 43.37% v/v, methane from 4.75 to 4.83% v/v, carbon (IV) oxide from 5.88 to 6.02% v/v, and carbon (II) oxide from 6.72 to 6.83% v/v. Changes in the concentrations of these components in the process gas exiting the reactor are shown in Figure 6d. Quantitative changes were observed in addition to alterations in the quality of the process gas attained through the simulations, as demonstrated in Figure 6e. These changes were mainly related to fluctuations in the amount of steam fed into the reforming process and the chemical composition of natural gas. The results showed that the amount of process gas produced varied between 1697 and 1852 kmol/h. The most significant amount of gas was produced in Simulation No. 3, while the smallest in Simulation No. 1. To lessen the impact of temperature variations and corresponding changes in reactivity levels on the outcomes, we assumed a constant gas temperature at the inlet and outlet of the reactor, regardless of the raw material’s quantity and quality. The graph of temperature changes in the streams NG + S_1 and PG_1 is shown in Figure 6f. It can be assumed that during each simulation, the steam/natural gas mixture at the inlet of the reactor was 570 °C, and the temperature of the process gas leaving the reactor was 830 °C.
A conclusion that can be drawn from the results is that as the concentration of ethane and propane in the natural gas increases, so does the amount of hydrogen produced in the reactions occurring in reactor R-1. Thus, it has been verified that, based on the assumptions made, variations in the quality of natural gas could potentially result in a discrepancy of up to 8% in the amount of hydrogen derived from methane steam reformation (producing a minimum of 732.6 kmol/h in Simulation No. 1 and a maximum of 797.7 kmol/h in Simulation No. 3).
In practice, increasing hydrogen production using natural gas with increased ethane levels is not always possible. Figure 7 shows changes in the amount of heat delivered to the exchangers E-1, E-2, and the reactor R-1 in the form of Q_1, Q_2, and Q_3. The heat flux Q_1 delivered to E_1 varied from 4.60 × 10⁶ to 4.89 × 10⁶ kJ/h. To ensure that the temperature of the natural gas/steam mixture (NG + S_2) remains constant at the inlet of reactor R-1 throughout the simulation, the Q_2 flux was modified in response to any alterations in the process mixture’s composition. In the simulations, the range of variation of Q_2 was 1.67 × 10⁷–1.84 × 10⁷ kJ/h, primarily because of fluctuations in the quantity of steam supplied to MIX-1. The least amount of heat was applied to E-2 during Simulation No.1, where the process mixture was also exposed to the least amount of steam compared to other simulations (970.6 kmol H2O/h). Conversely, the highest quantity of heat was administered in Simulation No. 3 (1076.0 kmol H2O/h). The heat flux Q_3 varied in the range of 6.06 × 10⁷–6.58 × 10⁷ kJ/h. When running an industrial plant at full capacity, higher levels of ethane in natural gas can cause a plant overload leading to disruptions in heat balance at vulnerable points. This will happen if the composition of natural gas differs significantly from the chemical composition of the gas used in the design assumptions. In practice, preventing plant overloading can be achieved by maintaining nominal hydrogen production at a lower level than the projected amount of natural gas fed into the process. The obtained results generally align with findings from other studies, encompassing at least [45,46,47].

4. Conclusions

In recent years, Poland has expanded its import infrastructure, enabling it to start importing gas in the form of LNG from sources that provide an alternative to natural gas traditionally transported via pipelines from the east. These measures have led to a rise in the concentration of ethane in the natural gas transmission grid compared to the situation before the commissioning of the LNG terminal in Świnoujście. The examination of the SWI database confirmed this outcome. The information extracted from the database was also used to create a table depicting the variability of the chemical composition of natural gas at a specific exit point (Area No. 308) in the southern part of Poland. Historical gas composition results were extracted based on the minimum and maximum methane concentrations measured in 2015, 2020, and 2022. These compositions were utilized to simulate the influence of changes in the quality of natural gas, caused due to supply diversification, on the efficiency of the steam hydrocarbon reforming carried out in the Gibbs reactor. The simulations confirmed that these changes had a noticeable effect on the amount of hydrogen produced when the natural gas intake control was implemented using a constant molar flow rate each time.
In conclusion, the six simulations conducted to study the impact of natural gas composition on hydrogen production and process heat balance yielded several important findings.
  • The methane concentration in the analyzed natural gas stream ranged from 91.46% to 97.35% v/v, while ethane and propane concentrations varied between 1.20% and 6.44% v/v, and between 0.11% and 1.34% v/v, respectively.
  • The number of moles of carbon (C) in the natural gas varied from 294.1 kmol C/h in Simulation No. 1 to 326.1 kmol C/h in Simulation No. 3.
  • The water steam fed into the process ranged from 970.6 to 1076.0 kmol H2O/h, and it depended on the quality of the natural gas. More steam was introduced as the number of C moles in the natural gas stream increased. The simulations were run so that the ratio of steam atoms to carbon atoms in the feedstock (S/C = 3.3).
  • Changes in the water steam–natural gas mixture led to variations in the quality and quantity of the process gas PG_1 exiting the reactor. Key components in PG_1, including hydrogen, methane, carbon (IV) oxide, and carbon (II) oxide, showed slight fluctuations.
  • The amount of process gas produced ranged from 1697 to 1852 kmol/h, with Simulation No. 3 yielding the maximum and Simulation No. 1 the minimum,
  • To minimize the impact of temperature changes on the results, a constant temperature assumption was applied. The inlet temperature to the reactor was set at 570 °C, and the outlet temperature at 830 °C.
  • Notably, as the concentration of ethane and propane in natural gas increased, the amount of hydrogen generated in the reactor increased. This observation implies that variations in the analyzed natural gas quality could theoretically affect hydrogen production by up to 8%. The simulations recorded a change in the amount of hydrogen produced contained in the process gas in the range of 732.6–797.7 kmol/h. As the ethane concentration in the process gas increased, the heat demand of the reactions occurring in the reformer also increased. The molar heat of the gas stream also changed, affecting the thermal balance of the process.
  • The simulations highlighted the potential challenge of overloading the plant when using natural gas with a high ethane content. This overload could disrupt the heat balance and other critical processes. Thus, maintaining nominal hydrogen production might require limiting the amount of natural gas fed into the process.
In practical terms, these findings underscore the importance of carefully considering natural gas composition and its potential impact on hydrogen production and plant operations in industries relying on steam reforming of methane. Adjustments and safeguards may be necessary to ensure the stable and efficient operation of such processes when dealing with variable natural gas compositions.

Author Contributions

Conceptualization, R.B. and A.S.; methodology, R.B.; software, R.B.; validation, R.B. and A.Ż.; formal analysis, A.Ż.; investigation, R.B.; resources, A.S.; data curation, A.S. and R.B.; writing—original draft preparation, R.B.; writing—review and editing, A.Ż.; visualization, R.B. and A.S.; supervision, A.Ż.; project administration, A.S.; funding acquisition, A.Ż. All authors have read and agreed to the published version of the manuscript.

Funding

This work has been prepared as a part of Natural Gas Department research at AGH University of Krakow, Drilling, Oil & Gas Faculty, no. 16.16.190.779.

Data Availability Statement

Data is contained within the article.

Conflicts of Interest

The authors declare no conflicts of interest.

References

  1. 2023 Statistical Review of World Energy. Available online: https://www.bp.com/en/global/corporate/energy-economics/statistical-review-of-world-energy.html (accessed on 30 June 2023).
  2. EIA. Europe Was the Main Destination for U.S. LNG Exports in 2022. Available online: https://www.eia.gov/todayinenergy/detail.php?id=55920 (accessed on 30 June 2023).
  3. Łoskot-Strachota, A. The EU Gas Market: Revolutionary Changes and the Spectre of Another Winter. OSW COMMENTARY 2023-05-25. Available online: https://www.osw.waw.pl/en/publikacje/osw-commentary/2023-05-25/eu-gas-market-revolutionary-changes-and-spectre-another-winter (accessed on 30 June 2023).
  4. International Energy Agency, Gas Market Report, Q1 2023, including Gas Market Highlights 2022. February 2023. Available online: https://iea.blob.core.windows.net/assets/c6ca64dc-240d-4a7c-b327-e1799201b98f/GasMarketReportQ12023.pdf (accessed on 30 June 2023).
  5. International Energy Agency. Natural Gas Supply-Demand Balance of the European Union in 2023. Available online: https://iea.blob.core.windows.net/assets/227fc286-a3a7-41ef-9843-1352a1b0c979/Naturalgassupply-demandbalanceoftheEuropeanUnionin2023.pdf (accessed on 29 June 2023).
  6. European Commission, REPowerEU: Joint European Action for More Affordable, Secure and Sustainable Energy. European Commission, 2022. Available online: https://ec.europa.eu/commission/presscorner/detail/en/ip_22_1511 (accessed on 30 June 2023).
  7. Lambert, L.A.; Tayah, J.; Lee-Schmid, C.; Abdalla, M.; Abdallah, I.; Ali, A.H.M.; Esmail, S.; Ahmed, W. The EU’s natural gas Cold War and diversification challenges. Energy Strategy Rev. 2022, 43, 100934. [Google Scholar] [CrossRef]
  8. Haines, R.J. The geopolitics of Russian’s networked energy infrastructure. Orbis 2015, 59, 557–599. [Google Scholar] [CrossRef]
  9. Ruszel, M. The significance of the Baltic Sea Region for natural gas supplies to the V4 countries. Energy Policy 2020, 146, 1–9. [Google Scholar] [CrossRef]
  10. Szurlej, A. The state policy for natural gas sector. Arch. Min. Sci. 2013, 58, 925–940. [Google Scholar]
  11. Pikus, P.; Korda-Burza, A.; Szurlej, A. Transformation of the domestic natural gas market—Structural and regulatory aspects (Transformacja krajowego rynku gazu ziemnego—Aspekty strukturalne i regulacyjne). Rynek Energii 2020, 5, 3–10. (In Polish) [Google Scholar]
  12. The Institute for Energy Economics and Financial Analysis (IEEFA), Global LNG Outlook 2023–2027. February 2023. Available online: https://ieefa.org/resources/global-lng-outlook-2023-27 (accessed on 12 July 2023).
  13. ACER. Key Developments in EU Gaswholesale Markets 2023 Market Monitoring Report. Available online: https://www.acer.europa.eu/sites/default/files/documents/Publications/ACER_MMR_Key_Developments_Gas_2023.pdf (accessed on 29 June 2023).
  14. LNG Terminal Expansion Program. Available online: https://www.gaz-system.pl/pl/terminal-lng/program-rozbudowy-terminalu-lng.html (accessed on 12 July 2023).
  15. Energy Policy of Poland until 2040. Warsaw. 2021. Available online: https://www.gov.pl/web/climate (accessed on 30 June 2023).
  16. Ministry of Climate and Environment. Available online: https://www.gov.pl/web/climate (accessed on 30 June 2023).
  17. Energy Regulatory Office. Available online: https://www.ure.gov.pl/en (accessed on 10 July 2023).
  18. Cieślik, T.; Narloch, P.; Szurlej, A.; Kogut, K. Indirect Impact of the COVID-19 Pandemic on Natural Gas Consumption by Commercial Consumers in a Selected City in Poland. Energies 2022, 15, 1393. [Google Scholar] [CrossRef]
  19. Pellegrino, S.; Lanzini, A.; Leone, P. Greening the gas network—The need for modelling the distributed injection of alternative fuels. Renew. Sustain. Energy Rev. 2017, 70, 266–286. [Google Scholar] [CrossRef]
  20. Rosłonek, G. Liquefied Natural Gas—LNG. Part I—General issues and basics of the settlement process (Skroplony gaz ziemny—LNG. Część I—Zagadnienia ogólne i podstawy procesu rozliczeniowego). Naft. -Gaz 2016, 2, 87–94. (In Polish) [Google Scholar] [CrossRef]
  21. Szoplik, J.; Stelmasińska, P. Analysis of gas network storage capacity for alternative fuels in Poland. Energy 2019, 172, 343–353. [Google Scholar] [CrossRef]
  22. Mozgovoy, A.; Burmeister, F.; Albus, R. Contribution of LNG use for the low calorific natural gas network’s safe and sustainable operation. Energy Procedia 2015, 64, 83–90. [Google Scholar] [CrossRef]
  23. GAZ-SYSTEM. Katalog Punktów Systemu Przesyłowego. Available online: https://swi.gaz-system.pl/swi/public/#!/ksp/points?lang=pl (accessed on 30 June 2023).
  24. Kuczyński, S.; Kogut, K. Selected aspects of hydrogen transmission safety: Monitoring and hydrogen explosion limits and its admixture with natural gas (Wybrane aspekty bezpieczeństwa przesyłu wodoru: Monitoring oraz granice wybuchowości wodoru i jego mieszaniny z gazem ziemnym). Wiadomości Naft. I Gazow. 2023, 4, 142–149. (In Polish) [Google Scholar]
  25. Kuczyński, S.; Łaciak, M.; Szurlej, A.; Włodek, T. Impact of liquefied natural gas composition changes on methane number as a fuel quality requirement. Energies 2020, 13, 5060. [Google Scholar] [CrossRef]
  26. Kuczyński, S.; Łaciak, M.; Olijnyk, A.; Szurlej, A.; Włodek, T. Thermodynamic and Technical Issues of Hydrogen and Methane-Hydrogen Mixtures Pipeline Transmission. Energies 2019, 12, 569. [Google Scholar] [CrossRef]
  27. Czekała, W.; Jasiński, T.; Dach, J. Profitability of the agricultural biogas plants operation in Poland, depending on the substrate use model. Energy Rep. 2023, 9, 196–203. [Google Scholar] [CrossRef]
  28. Grządzielski, W. Sieci gazowe wsparciem dla rozwoju OZE. Rynek Energii 2023, 3, 18–22. [Google Scholar]
  29. International Energy Agency. Global Hydrogen Review 2023. Available online: https://www.iea.org/reports/global-hydrogen-review-2023 (accessed on 20 September 2023).
  30. Biały, R.; Szurlej, A.; Sikora, A.P.; Potempa, M. The challenges facing the European chemical industry in the context of the EU’s Hydrogen Strategy (Wyzwania stojące przed europejskim przemysłem chemicznym w kontekście unijnej strategii wodorowej). Przemysł Chem. 2020, 8, 1101–1105. (In Polish) [Google Scholar]
  31. Komorowska, A.; Benalcazar, P.; Kamiński, J. Evaluating the competitiveness and uncertainty of offshore wind-to-hydrogen production: A case study of Poland. Int. J. Hydrogen Energy 2023, 48, 14577–14590. [Google Scholar] [CrossRef]
  32. Blacharski, T.; Kogut, K.; Szurlej, A. The perspectives for the use of hydrogen for electricity storage considering the foreign experience. In Proceedings of the E3S Web of Conferences, ENERGY AND FUELS 2016, Cracow, Poland, 21–23 September 2016. [Google Scholar]
  33. Włodek, T.; Polański, K.; Panek, W. Effect of hydrogen on natural gas pipeline transmission system in aspect of possibilities of hydrogen energy storage in northern Poland (Wpływ obecności wodoru na system przesyłowy gazu ziemnego w północnej Polsce w aspekcie możliwości magazynowania energii w postaci wodoru). Przemysł Chem. 2019, 98, 817–820. (In Polish) [Google Scholar]
  34. Jędral, W. Energy storage and hydrogen power as an outcome of the energy transition (Magazynowanie energii i energetyka wodorowa jako wynik tranformacji energetycznej). Rynek Energii 2022, 4, 8–15. (In Polish) [Google Scholar]
  35. Tuz, L.; Kąc, S.; Sierakowski, D. Technology of electron beam welding of 10CrMo9-10 steel with the specific quality requirements. Manuf. Lett. 2023, 35, 53–57. [Google Scholar] [CrossRef]
  36. Tuz, L. Evaluation of microstructure and selected mechanical properties of laser beam welded S690QL high-strength steel. Adv. Mater. Sci. 2018, 18, 34–42. [Google Scholar] [CrossRef]
  37. Tuz, L. Determination of the causes of low service life of the air fan impeller made of high-strength steel. Eng. Fail. Anal. 2021, 127, 105502. [Google Scholar] [CrossRef]
  38. El Hajj Chehade, A.M.; Daher, E.A.; Assaf, J.C.; Riachi, B.; Hamd, W. Simulation and optimization of hydrogen production by steam reforming of natural gas for refining and petrochemical demands in Lebanon. Int. J. Hydrogen Energy 2020, 45, 33235–33247. [Google Scholar] [CrossRef]
  39. Holt, J.E.; Kreusser, J.; Herritsch, A.; Watson, M. Numerical modelling of a steam methane reformer. ANZIAM J. 2018, 59, 112–127. [Google Scholar] [CrossRef]
  40. Hou, K.; Hughes, R. The kinetics of methane steam reforming over a Ni/a-Al2O catalyst. Chem. Eng. J. 2001, 82, 311–328. [Google Scholar] [CrossRef]
  41. Xu, J.; Froment, G.F. Methane steam reforming, methanation and water-gas shift: I. Intrinsic kinetics. AICheE J. 1989, 35, 88–96. [Google Scholar] [CrossRef]
  42. Zyryanova, M.M.; Snytnikov, P.V.; Shigarov, A.B.; Belyaev, V.D.; Kirillov, V.A.; Sobyanin, V.A. Low temperature catalytic steam reforming of propane-methane mixture into methane-rich gas: Experiment and microkinetic modeling. Fuel 2014, 135, 76–82. [Google Scholar] [CrossRef]
  43. Øyen, S.B.; Jakobsen, H.A.; Haug-Warberg, T.; Solvik, J. Differential Gibbs and Helmholtz reactor models for ideal and non-ideal gases: Applications to the SMR and methanol processes. Chem. Eng. Sci. 2021, 234, 116257. [Google Scholar] [CrossRef]
  44. Solvik, J.; Haug-Warberg, T.; Jakobsen, H.A. Implementation of chemical reaction equilibrium by Gibbs and Helmholtz energies in tubular reactor models: Application to the steam-methane reforming process. Chem. Eng. Sci. 2016, 140, 261–278. [Google Scholar] [CrossRef]
  45. Bahadori, A.; Kashiwao, T. Modeling and analysis of hydrogen production in steam methane reforming (SMR) process. Petroleum Sci. Technol. 2019, 37, 1425–1435. [Google Scholar] [CrossRef]
  46. Izquierdo, U.; Barrio, V.L.; Cambra, J.F.; Requies, J.; Guemez, M.B.; Arias, P.L.; Kolb, G.; Zapf, R.; Gutierrex, A.M.; Arraibi, J.R. Hydrogen production from methane and natural gas steam reforming in conventional and microreactor reaction systems. Int. J. Hydrogen Energy 2012, 8, 7026–7033. [Google Scholar] [CrossRef]
  47. Shokrollahi Yancheshmeh, M.S.; Seifzadeh Haghighi, S.; Gholipour, M.R.; Dehghani, O.; Rahimpour, M.R.; Raeissi, S. Modeling of ethane pyrolysis process: A study on effects of steam and carbon dioxide on ethylene and hydrogen productions. Chem. Eng. J. 2013, 215–216, 550–560. [Google Scholar] [CrossRef]
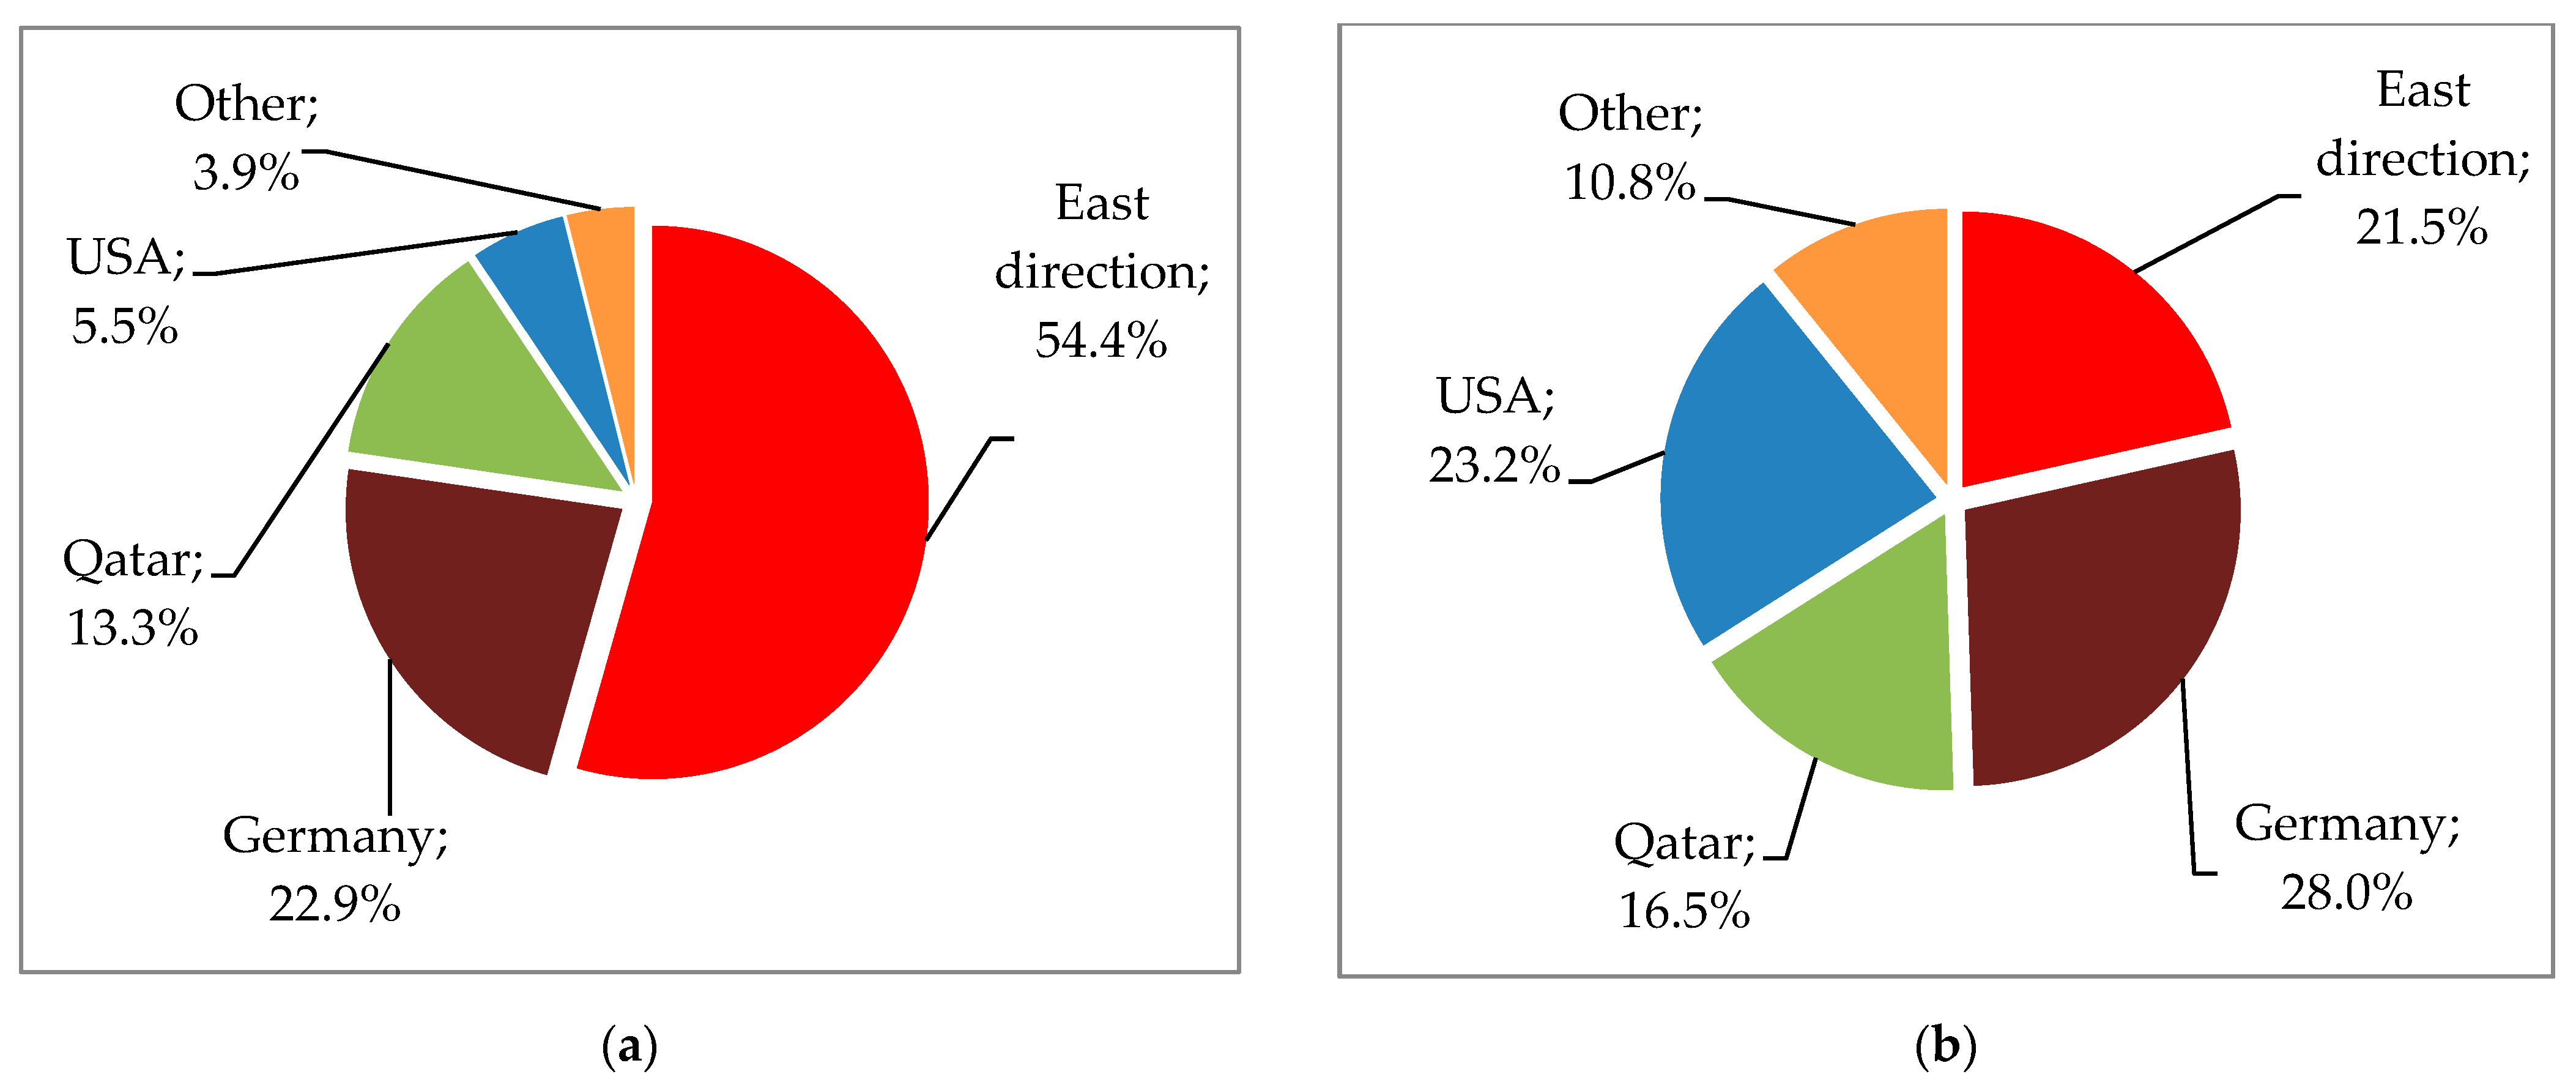
Figure 1. Directions of natural gas imports to Poland: (a) in 2019; (b) in 2022 [16].
Energies 17 01221 g001
Figure 2. LNG imports to Poland, 2016–2022 [bcm] [16].
Energies 17 01221 g002
Figure 3. Change in methane and ethane content of natural gas from 2014 to 2023 (half) at the Opole exit point [%] [23].
Energies 17 01221 g003
Figure 4. Histograms developed from historical measurements of methane (left) and ethane (right) concentrations at the Opole exit point in 2015, 2020, and 2022 [23].
Energies 17 01221 g004
Figure 5. Model of the node for preparing the natural gas/steam mixture considering the natural gas reforming process developed via Aspen HYSYS.
Energies 17 01221 g005
Figure 6. (a)—Changes in the concentration of CH4, C2H6, and C3H8 in the stream NG_1; (b)—changes in the flow and number of moles of C in the stream NG_1; (c)—changes in steam flow in S_1 and S/C ratio in the stream NG + S_1; (d)—changes in the concentration of H2, CH4, CO, and CO2 in the stream PG_1; (e)—changes in the flow and number of moles of H2 in the stream PG_1; (f)—changes in the temperature of streams NG + S_2 and PG_1.
Energies 17 01221 g006aEnergies 17 01221 g006b
Figure 7. A graph showing changes in the amount of heat delivered to E-1, E-2, and R-1 during the simulations performed.
Energies 17 01221 g007
Table 1. The utilization ratio in EU LNG selected terminals [%] [13].
TerminalCountryAverage Utilization
2018–2021
Average
Utilization
2022
Zeebrugge LNG TerminalBE2961
Barcelona LNG TerminalES2323
Bilbao LNG TerminalES6076
Sagunto LNG TerminalES1646
Dunkerque LNG TerminalFR2575
Fos Cavaou LNG TerminalFR4892
Revythoussa LNG TerminalGR2739
Panigaglia LNG TerminalIT4254
FSRU IndependenceLT3772
Rotterdam Gate TerminalNL4192
Świnoujście LNG TerminalPL6180
Sines LNG TerminalPT7782
Table 2. Natural gas consumption by sector in Poland, years 2020–2022 [GWh] [17].
202020212022
Gas sales to
end users
201,133.2206,626.7171,795.0
Industry132,731.7126,137.196,963.7
Trade and services14,570.015,639.311,913.4
Households49,878.759,265.256,200.9
Total203,145.9208,626.0173,763.2
Table 3. Historical results of natural gas quality measurements at the analyzed transmission system exit point with the highest and lowest methane levels in 2015, 2020, and 2022 [23].
# YearCH4 [%v/v]C2H6 [%v/v]C3H8 [%v/v]N2 * [%v/v]i-C4H10 [%v/v]i-C5H12 [%v/v]n-C4H10 [%v/v]n-C5H12 [%v/v]
1201594.461.200.243.990.040.010.060.01
297.351.470.250.840.040.010.040.00
3202092.455.261.340.530.110.020.290.00
497.151.640.160.940.030.010.090.00
5202291.466.440.701.230.060.010.100.01
697.122.570.110.180.010.010.010.00
* As the sum of percentages of N2, CO2, and C6+.
Disclaimer/Publisher’s Note: The statements, opinions and data contained in all publications are solely those of the individual author(s) and contributor(s) and not of MDPI and/or the editor(s). MDPI and/or the editor(s) disclaim responsibility for any injury to people or property resulting from any ideas, methods, instructions or products referred to in the content.