Article

An Experimental Study on the Effectiveness of the Backward-Facing Step Technique on Small-Scale Horizontal-Axis Wind Turbine Rotor Blades

1
Faculty of Mechanical Engineering, University of Prishtina “Hasan Prishtina”, 10000 Prishtina, Kosovo
2
Faculty of Mechanical Engineering, Niğde Ömer Halisdemir University, 51240 Niğde, Turkey
*
Author to whom correspondence should be addressed.
Energies 2024, 17(5), 1170; https://doi.org/10.3390/en17051170
Submission received: 30 December 2023 / Revised: 19 February 2024 / Accepted: 25 February 2024 / Published: 1 March 2024
(This article belongs to the Special Issue Advanced Wind Energy Conversion Systems)

Abstract

:
The aim of this research work was to explore how modifying the design of small-scale HAWT rotor blades through the backward-facing step technique affects their efficiency under varying wind speeds. The study involved altering step parameters such as location, length, and depth to create four distinct stepped blade shapes and enhance the aerodynamic performance of a rotor with a diameter of 280 mm. A specific blade profile, NREL S822, was selected to meet both aerodynamic and structural criteria. The rotor models were examined at a Reynolds number of 4.7 × 10⁴ for wind speeds between 8.5 and 15.5 m/s and tip-speed ratios between 2 and 5. The experimental results indicated that for certain geometric step parameter values, the efficiency of the rotor model (B3) increased by approximately 47% compared to the base model (B1), particularly for tip-speed ratios lower than around 3.2. However, beyond this point, the rotor efficiency dropped significantly, reaching approximately 60% in one case. Additionally, a hybrid rotor model (B6) was generated by combining the shape of the rotor model (B4) with the most efficient rotor model from the literature, generated using the leading-edge wavy shape technique. This hybrid rotor model enhanced rotor efficiency for specific values of tip-speed ratio and also ensured its smoother operation. Overall, the rotor model (B2), distinguished by smaller step parameter values and a shift as well as broadening of the power coefficient curve towards lower tip-speed ratio values, exhibited a higher peak power coefficient, approximately 1.4% greater than the base rotor (B1). This increase occurred at a lower tip-speed ratio, allowing the rotor to operate with higher efficiency across a broader range of tip-speed ratios.

1. Introduction

In ancient times, people mainly utilized wind energy to enhance their physical power, as their own bodily exertions proved insufficient for fulfilling their labour requirements. As quality of life improved and technology advanced, human necessities underwent a profound change. In the contemporary era, wind, functioning as a renewable energy reservoir, is expected to become a plentiful source capable of satisfying energy needs multiple times over [1,2,3]. However, it has been estimated that only a fraction of this resource can be practically harnessed due to various factors, with technological limitations being one of them.
The push for advanced wind turbine technology in meeting global electricity demands by 2040, as projected by the IEA Net Zero Emissions Scenario [4], has led to extensive use of both horizontal- and vertical-axis wind turbines. Despite progress, limitations within this technology impact efficiency, primarily concerning rotor blade aerodynamics and cost considerations. Addressing these concerns has become imperative to find cost-effective solutions for efficient wind energy generation.
In general, small wind turbines are characterized by lower efficiency compared to large ones. This is because these small machines with high solidity, which usually operate under conditions where viscous forces in the fluid are highly evident in creating a severe and very sensitive operating environment, also suffer from a more specific blade shape. In fact, for such working conditions when Reynolds number is lower than 1 × 10⁵, there is a very limited number of airfoil profiles [5,6]. Therefore, airfoil sections intended exclusively for small wind turbines can be considered as the closest solution for such circumstances. To improve the aerodynamic characteristics of these airfoils, solutions implemented successfully in other technologies can be adopted to achieve certain goals. Furthermore, considering the varying Reynolds number across the blade span, with the hub area exhibiting minimal values and therefore contributing the least to the production of the torque of the power, stands as another crucial factor requiring consideration when modifying the blade’s geometry.
Drawing inspiration from successful implementations of passive flow control techniques in aerospace and automotive engineering [7,8], the exploration of analogous strategies within wind turbine technology has gained prominence. One such strategy, the backward-facing step technique, traces its origins to seminal works in the early 1960s and 1970s [9,10]. This technique involves modifying rotor blade geometries on the suction side by introducing a channel with flat surfaces along their length to manipulate flow fields, fostering vortex entry into the blade interiors and creating zones of intense recirculation that delay flow separation. By altering flow characteristics and stabilizing the flow surrounding rotor blades, this technique enhances lift and delay stall conditions. The induced vortex promotes controlled flow separation, mitigating performance losses associated with traditional blade designs. Understanding and manipulating these mechanisms allow tailoring blade designs for enhanced efficiency, control, and performance across different operational conditions. Although the backward-facing step technique serves as a valuable tool for studying flow separation and reattachment, its effectiveness is subject to limitations influenced by many factors, such as Reynolds number range, flow speed, surface roughness, geometric variations, boundary conditions, and sensitivity to turbulence models. Awareness of these limitations has guided researchers and engineers in the judicious application of this technique.
In 1994, Fertis [11], the patent holder of this technique, explored a novel airfoil design idea by employing the backward-facing step on the suction side of the NACA 23012 airfoil section. This was achieved through experimental analysis across various angles of attack (between 2° and 38°), wind speeds (12.2 m/s to 79.25 m/s), and Reynolds numbers (1.0 × 10⁵ and 5.5 × 10⁵), with the aim of achieving improved aerodynamic coefficients. Various configurations by changing the step depth (0%t to 50%t) and its location (40%c to 60%c) were assessed to ascertain their impact on aerodynamics. The outcomes indicated that the innovative airfoil shape exhibited enhanced stall properties and improved lifts and lift-to-drag ratios compared to the unchanged airfoil geometry. Additionally, Finaish and Witherspoon [12] in their study reported limited enhancements in the aerodynamic characteristics of several NACA 0012 airfoil configurations with backward-facing step on the upper surface. The research work was numerical using a CFD code and experimental in the wind tunnel at Reynolds number 5.0 × 10⁵. Their findings indicate that an increase in lift values is attained by placing the backward-facing step between 50% and 75% of the chord length, as opposed to positioning it from 50% of the chord to the trailing edge, particularly for angles of attack below 20 degrees. Moreover, they suggest that situating the step on the pressure side of the airfoil, starting from the middle of the chord length towards the trailing edge at a depth equal to 50% of its chord length, could result in substantial improvements in both lift and lift-to-drag ratios. In a more recent computational analysis conducted by Mishriky and Walsh [13], it was demonstrated that incorporating a backward-facing step on the upper surface of the airfoil, as opposed to utilizing a smooth airfoil, detrimentally impacts the lift, drag, and maximum angle of attack. The lift coefficient displayed a clear correlation with the step’s position; as the step’s location moved from the front edge to the back edge, the lift values consistently rose. Conversely, the drag values exhibited an inversely proportional association with the step’s placement. Many other authors have also reported the effectiveness of this technique for their given conditions [8,14,15,16,17,18]. However, there are reports from several authors regarding the shortcomings of this methodology. Based on these reports, it can be concluded that even this technique has its limitations; therefore, being such, it may not provide satisfactory outputs for any situation during its implementation [19,20].
From the point of view of previous studies, it can be observed that the selected airfoil profile differs in the research works. Similarly, the conditions under which the profiles are examined, as well as the location and size of the step, also vary. Therefore, considering the significant impacts of this technique, especially evident at low Reynolds numbers, the stepped shape according to Fertis [11], Witherspoon and Finaish [12], and Finaish and Witherspoon [16] has been adopted as a promising solution for addressing highly unfavourable conditions faced by the rotors of small wind turbines and particularly when they employ sections that operate under their design points and at very low Reynolds numbers.
In this study, a wind tunnel research is performed to explore the effect of backward-facing step on the performance of small-scale fixed-pitch wind turbine rotor blades under different wind speeds at a very low tip-chord-based Reynolds number of 4.7 × 10⁴. The selected airfoil profile is the NREL S822, specifically crafted for use in small wind-converting machines [21]. The stepped blade form will determine the complete span of the blade, from root to tip. Geometric parameters, such as the step location along the airfoil’s chord, its length, and depth, are considered as design variables to produce five different stepped blade shapes. The wind tunnel data, including power coefficients and tip-speed ratios, were initially corrected to enable valid comparisons.
The article is structured as follows: Section 2 introduces the original rotor blade geometry and the generation of modified blade models, along with details about the experimental setup. The findings and discussion are outlined in Section 3, while Section 4 provides a conclusion to the paper along with the suggested recommendations.

2. Material and Methodology

2.1. Baseline Rotor Blade Geometry Generation

Blade Shape Design

When designing a blade shape of a small wind turbine rotor, it is very common to choose thin airfoil sections [5,22,23,24,25]. However, owing to the high speed of the rotor shaft and structural issues, using thicker airfoils would sometimes be almost inevitable. Thus, in this study, the NREL S822 section, having a thickness of 16% of the chord length, was chosen to meet the aerodynamic and structural conditions [26] (see Figure 1). This blade section is dedicated for small wind turbines, specifically for the rotor blade tip region [5,21].
The optimal blade model, referred to in this study as the baseline model, was generated by scaling down the original geometry of the blade model with a diameter of 600 mm (see Table 1) to a diameter of 280 mm, as described in our previous studies [27,28].
Similarly, the Blade Element Momentum Theory (BEMT) and Schmitz equations [Equations (1)–(4)] were used to generate the optimum geometry of the original blade model according to the literature references [27,28].
The local tip-speed ratio is computed as
λ i = λ r i R
The local optimum relative inflow angle is computed as
φ i = 2 3 × a t a n 1 λ i
The local optimum chord length is computed as
c i = 16 × π × r i B × C L × sin 1 3 × arctan 1 λ i 2
The local optimum twist angle is computed as
β i = φ i α
In Table 2, values of chords and twist angles of the baseline blade model (B1) are presented.
The blade models were prepared following the same procedure as described in our previous studies [27,28]. Depending on the measurement direction at flow and normal to flow, the average value of the surface roughness for the baseline blade model was 0.001 mm, whereas for the blade models generated using the backward-facing step technique, it was 0.011 mm.

2.2. Generation of Stepped Blade Models

Implementing the backward-facing step approach and adhering to the methodologies outlined by Fertis [11], Witherspoon and Finaish [12], and Finaish and Witherspoon [16], four different blade models were produced by modifying the step location, length, and depth parameters on their suction sides [28], as depicted in Figure 2.
The step extends from the first station (20%R) and continues to the tip of the blade, and it was constructed in alignment with Equation (5). This involved determining the step distance, X, from the leading edge. The value of X was established by multiplying the average chord length (cavg) of the rotor blade by 0.3, 0.4, and 0.5. Likewise, the dimension of the step, denoted as L, was determined by multiplying the blade’s average chord length (cavg) by 0.1, 0.2, 0.25, and 0.3. Correspondingly, the depth of the step, represented as D, was computed by multiplying the airfoil thickness, t, by 0.19, 0.20, 0.35, and 0.5.
X = % c ; L = % c ; D = % t
In accordance with this methodology, four blade model configurations labeled with a capital letter B and a corresponding ordinal number are introduced in Table 3. Additionally, a hybrid blade model was built by combining the B4 configuration (X50cL25cD19t) with the leading-edge tubercles technique (A1λ3.5) that has shown the highest aerodynamic efficiency according to the reference literature [27].
The design values of the wing models are given in Table 4. As can be seen here, the stepped structures of model B4 and B6 are the same, but the B6 model also includes a wavy structure on the leading edge of the wing. The A1λ3.5 model wavy wave amplitude and length given here had the best performance compared to our previous study [27] and are obtained by multiplying the wave amplitude of 0.03 and length of 0.11 by the average blade chord length (cavg).

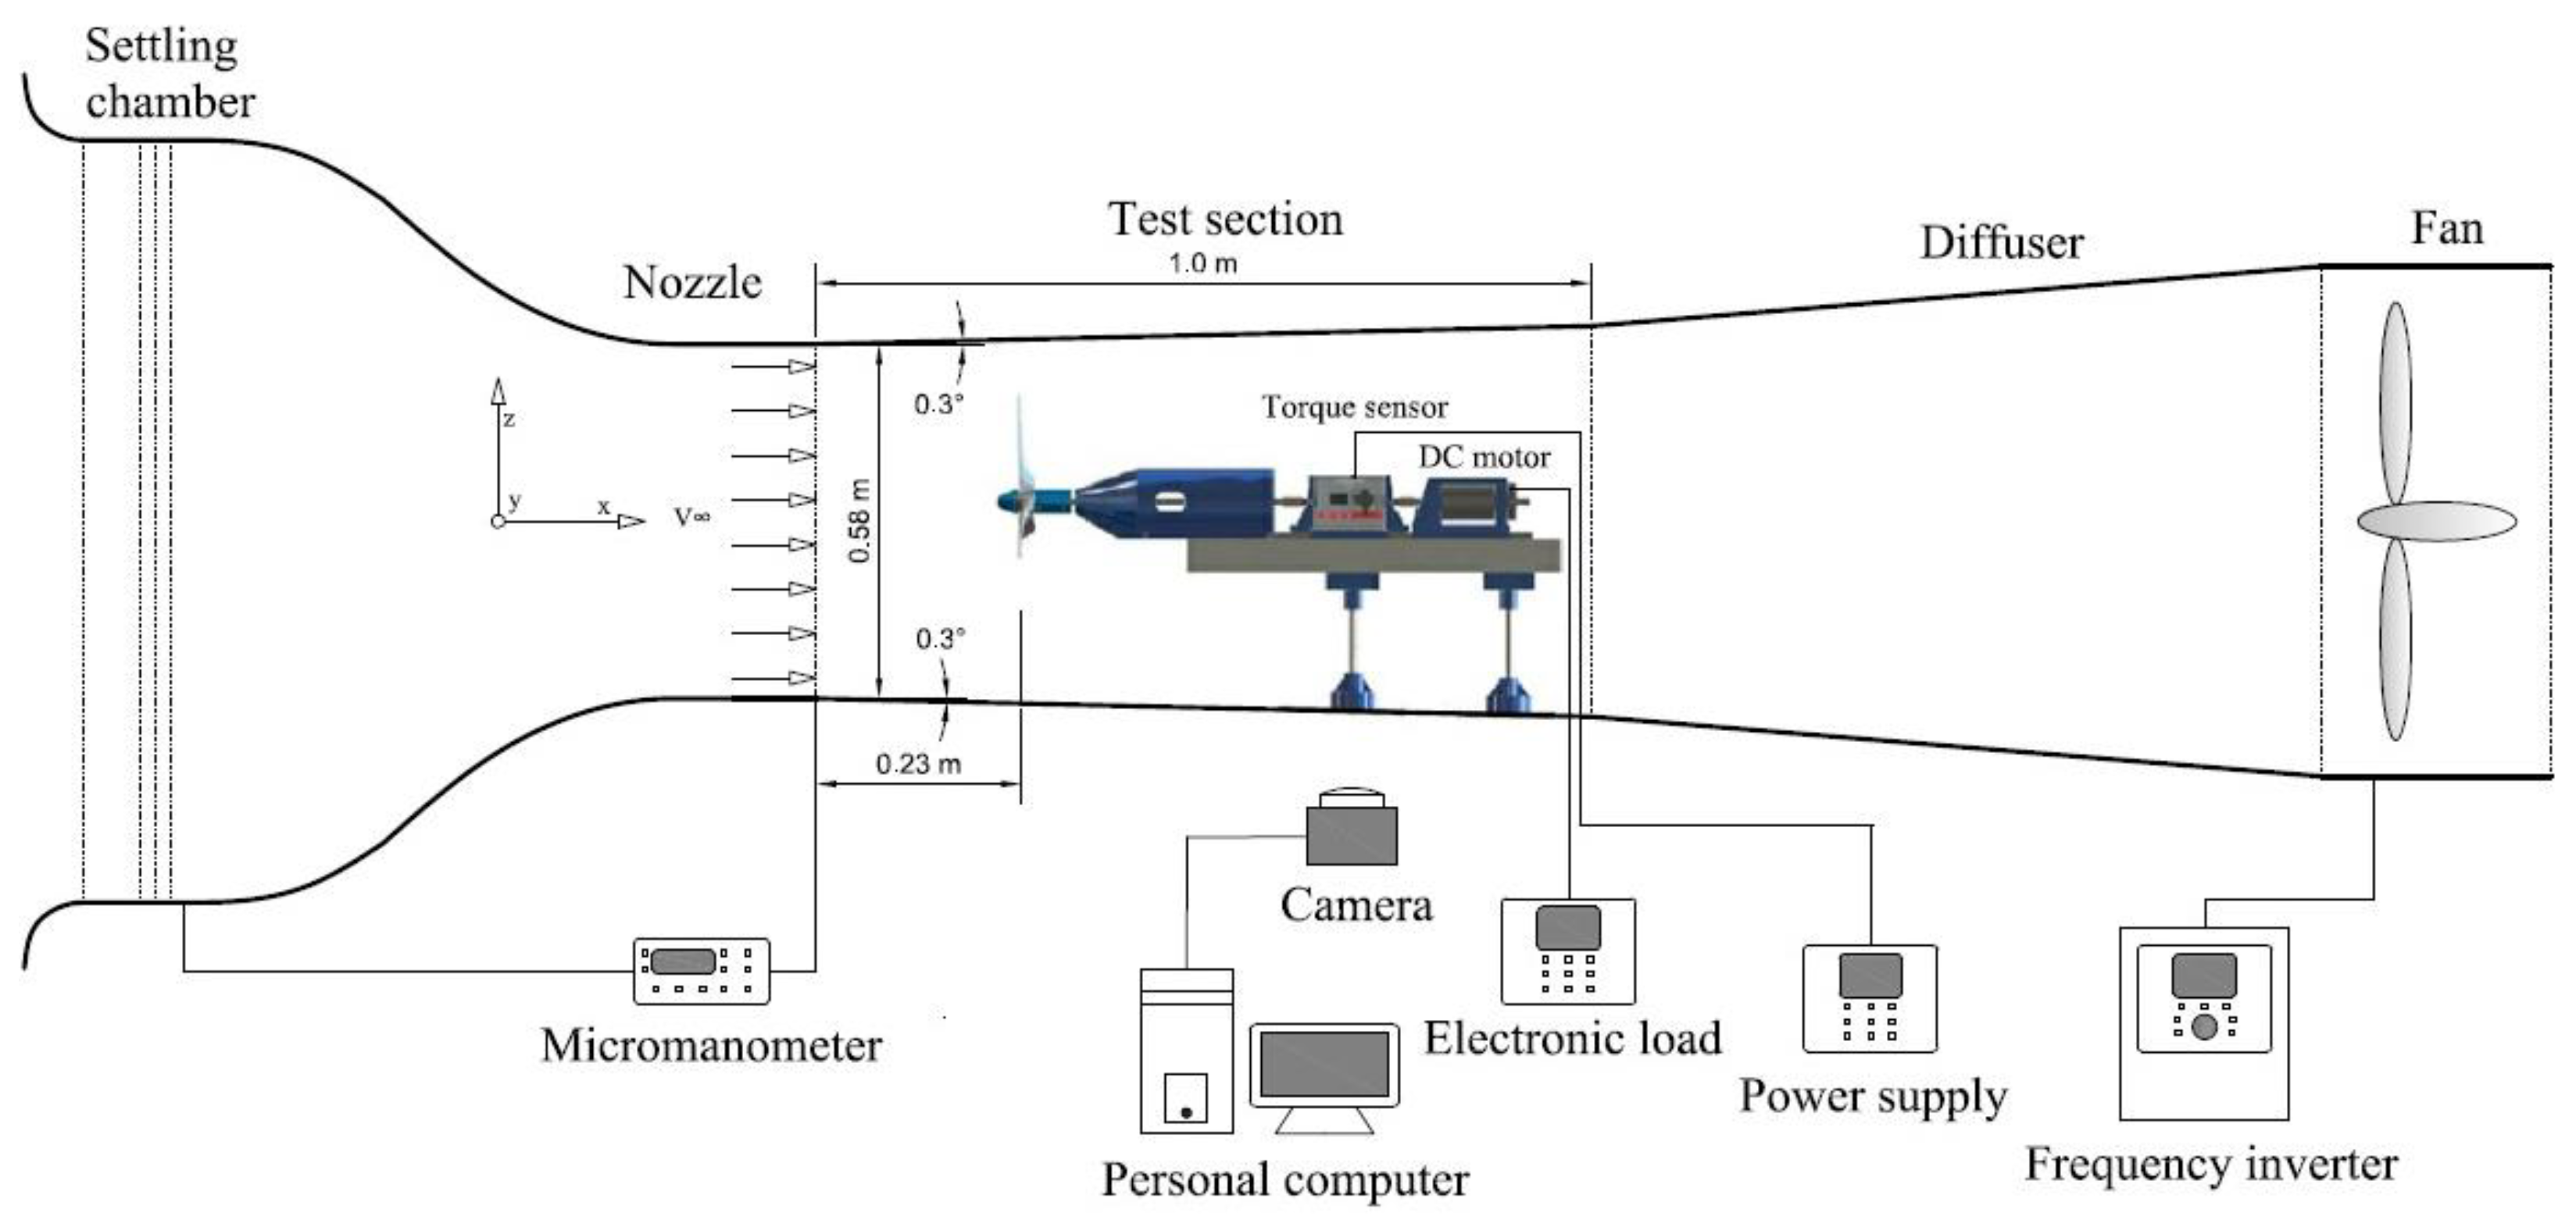
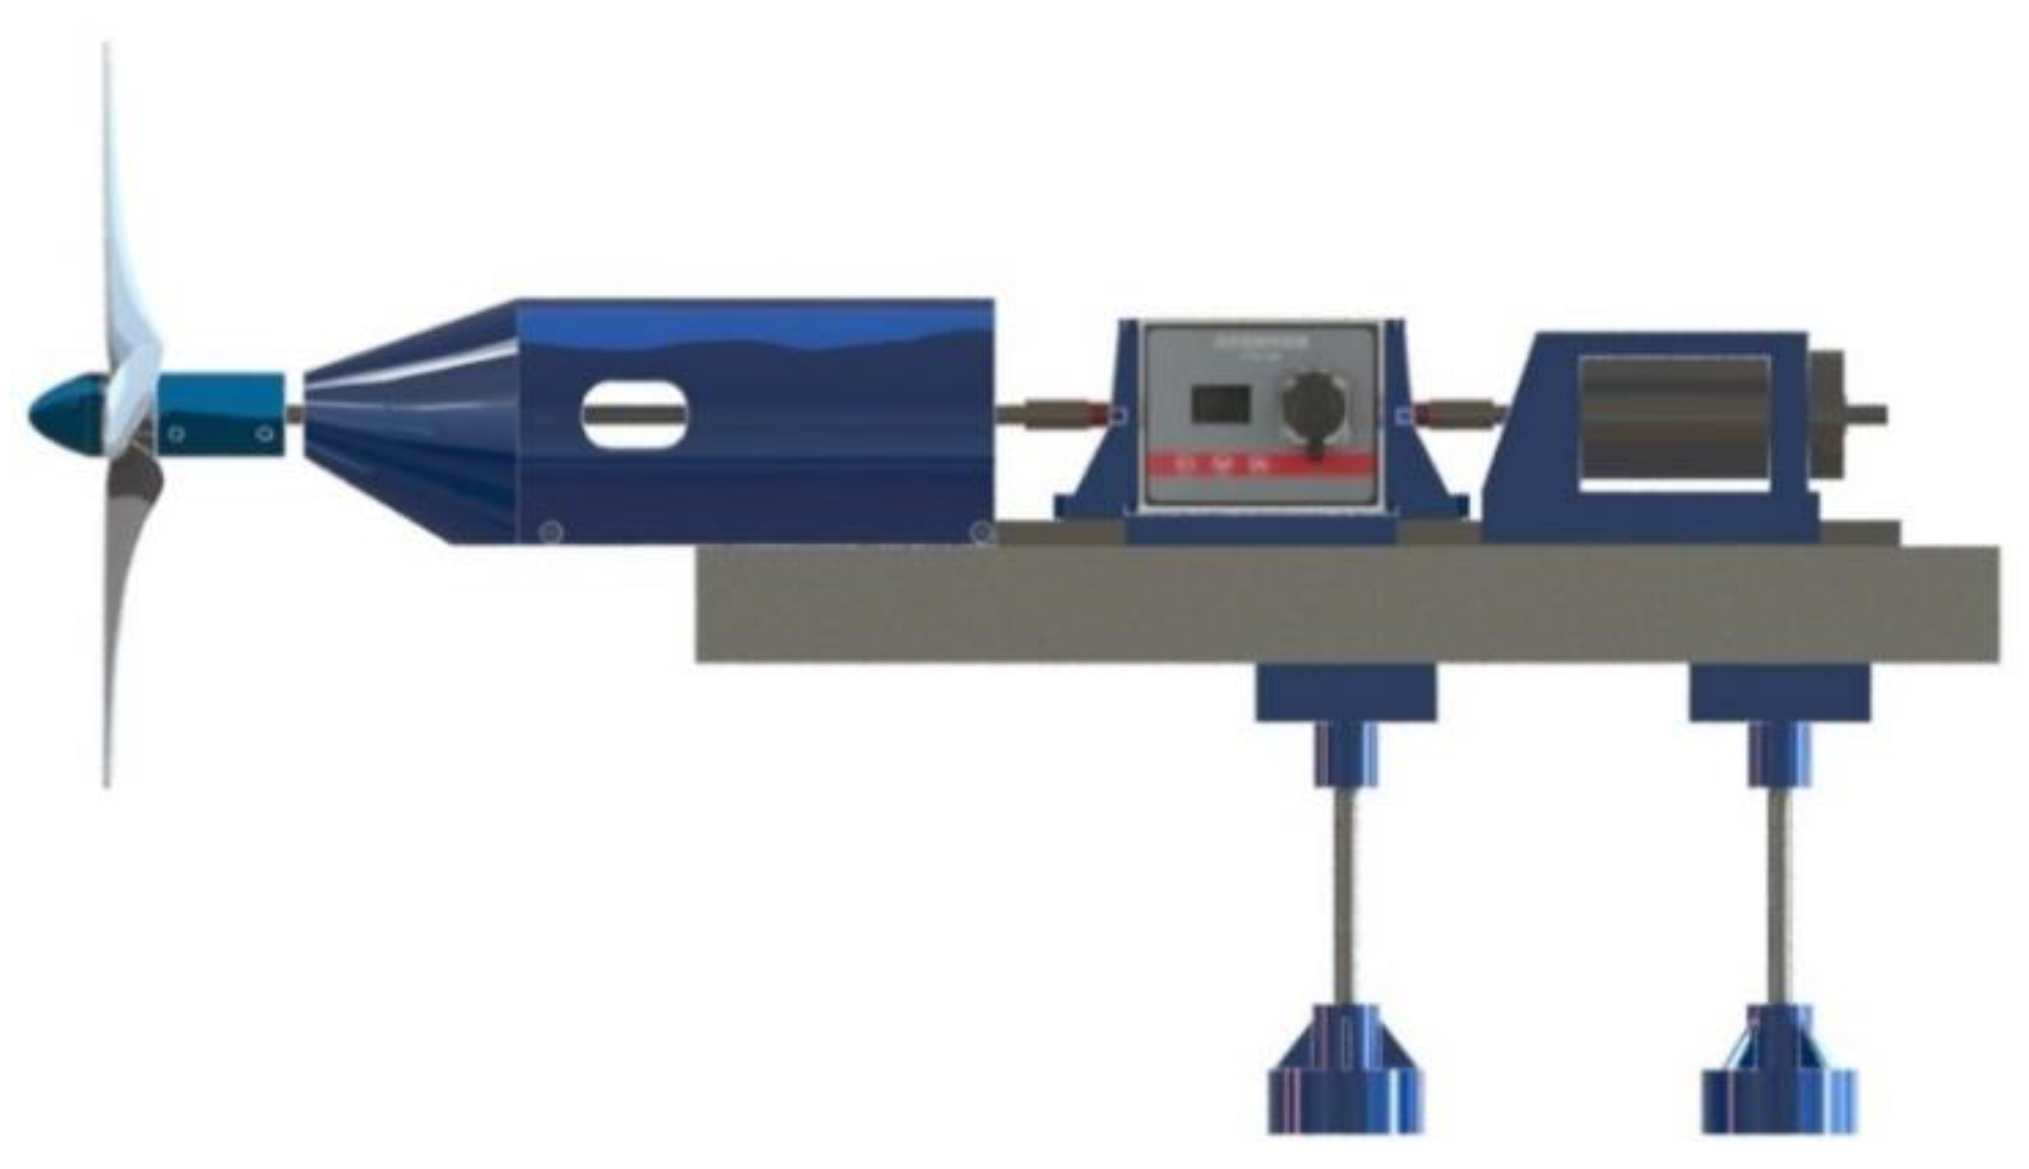
2.3. Experimental Setup and Validation

To perform the experimental tests for measuring the aerodynamic performance of the rotors, the same testing procedure was followed, and the same apparatuses (instruments) were used as described in our previous studies [27,28]. In this study, the wind tunnel is an open circuit with a closed square-shape test section capable of reaching speeds of up to 30 m/s (see Figure 3). Due to a slight wall angling from the entrance to the exit of the test section, the static pressure remains uniform throughout the test area. As described in the reference literature, measurements of velocity, temperature, and pressure were taken using specific apparatuses (instruments), and the rotor shaft speed was monitored with an optical laser. As shown in Figure 3, a frequency inverter regulates the wind tunnel’s flow velocity, and a dynamic torque sensor (DYN-200, China) measures mechanical torque and rotor speed. The wind turbine rotor is horizontally mounted on two screw rods, and tests were replicated three times to obtain average values. A braking system is established by linking an electronic load device (Rigol DL3021 Precision, China) to the direct current motor (Maxon RE50 Ø 50 mm, Switzerland). This arrangement ensured the consistent maintenance of the desired rpm for the rotor shaft, irrespective of variations in flow conditions. Data were collected using the NI PCle-6323 DAQ card (National Instruments, Austin, TX, USA) and data acquisition software.
Regarding testing methodology, several studies suggest matching Reynolds number, tip-speed ratio, and geometric scaling when down-scaling small-scale wind turbine models for wind tunnel testing [26,28,29,30,31]. However, this led to impractical conditions due to high wind speeds causing vibrations in the supporting structure and high noise levels. Instead, experiments were conducted at lower wind speeds while maintaining a constant tip chord-based Reynolds number and a range of tip-speed ratios (2 to 5) as suggested by Kishore et al. [32]. In the test, we set the rotor spinning at a speed of 2866 revolutions per minute, making the blade tips move at forty-two metres per second. The relative velocity at the blade tip reached forty-three and twenty-nine hundredths metres per second, considering a tip-speed ratio of four and a wind speed of ten and five-tenths metres per second. For this particular case, the average blade tip chord-based Reynolds number was calculated to be 4.7 × 10⁴ using Equation (6). In the current work, we used a blade tip chord length of twenty millimetres, estimated an air density of one kilogram per cubic metre, determined the relative velocity as forty-three and twenty-nine hundredths metres per second using Equation (7), and used an air dynamic viscosity of approximately 18.56 × 10⁻⁶ in our calculations. The atmospheric pressure was set at eighty-six kilopascals to represent the conditions in Niğde, Turkey. These values were considered at an air temperature of twenty-seven Celsius.
The Reynolds number parameter is determined using the equation
R e = ρ × V r e l × c a v g μ
where  ρ  is air density,  V r e l  is relative velocity,  c a v g  is average chord length, and  μ  is dynamic viscosity of the air.
The relative velocity is defined by
V r e l = V 2 + V t i p 2
where  V  is wind speed and  V t i p  is blade tip-speed.
At the beginning stage of testing, it was noticed that the rotors did not start rotating at flow speeds lower than around 10 m/s. This was primarily because of the resistance produced by the two bearings that hold the shaft of the rotor and the direct current motor. As a result, an initial flow velocity greater than this threshold was employed to set the rotors in motion. Afterward, it was fine-tuned to reach the intended operational flow speed.
To address wind tunnel blockage, which in this case was about 18.9%, and correct power coefficients, the Van Treuren approach [6] was implemented, determining blockage factors for each rotor tested under different wind speeds, both with and without the rotor in the test section.
An examination of uncertainties using Akbıyık’s approach [33] in conditions of maximum performance for the baseline rotor model (B1) indicated variations of approximately 1.3% in flow speed, 1.4% in tip-speed ratio, 4.1% in power coefficient, and 1.8% in Reynolds number.
Meanwhile, to authenticate the suggested rotor model, findings from experiments conducted in the wind tunnel were contrasted with information found in the literature specifically referencing the study by Lanzafame et al. [34]. This comparison was undertaken based on the recommendation of Bakırcı and Yılmaz [35], who proposed that the power coefficient and optimal tip-speed ratio are contingent on the number of blades rather than the turbine radius. The selected rotor model for comparison has specific characteristics, including a rotor radius of 112.5 mm, three blades, an operational Reynolds number below 8 × 10⁴, an optimal tip-speed ratio around 3.3, an NACA 4415 airfoil, a rotor solidity of about 19%, a rotational speed of 2450 rpm, a wind speed from 5 to 30 m/s, and a blockage ratio of 0.159 [34].

3. Results and Discussion

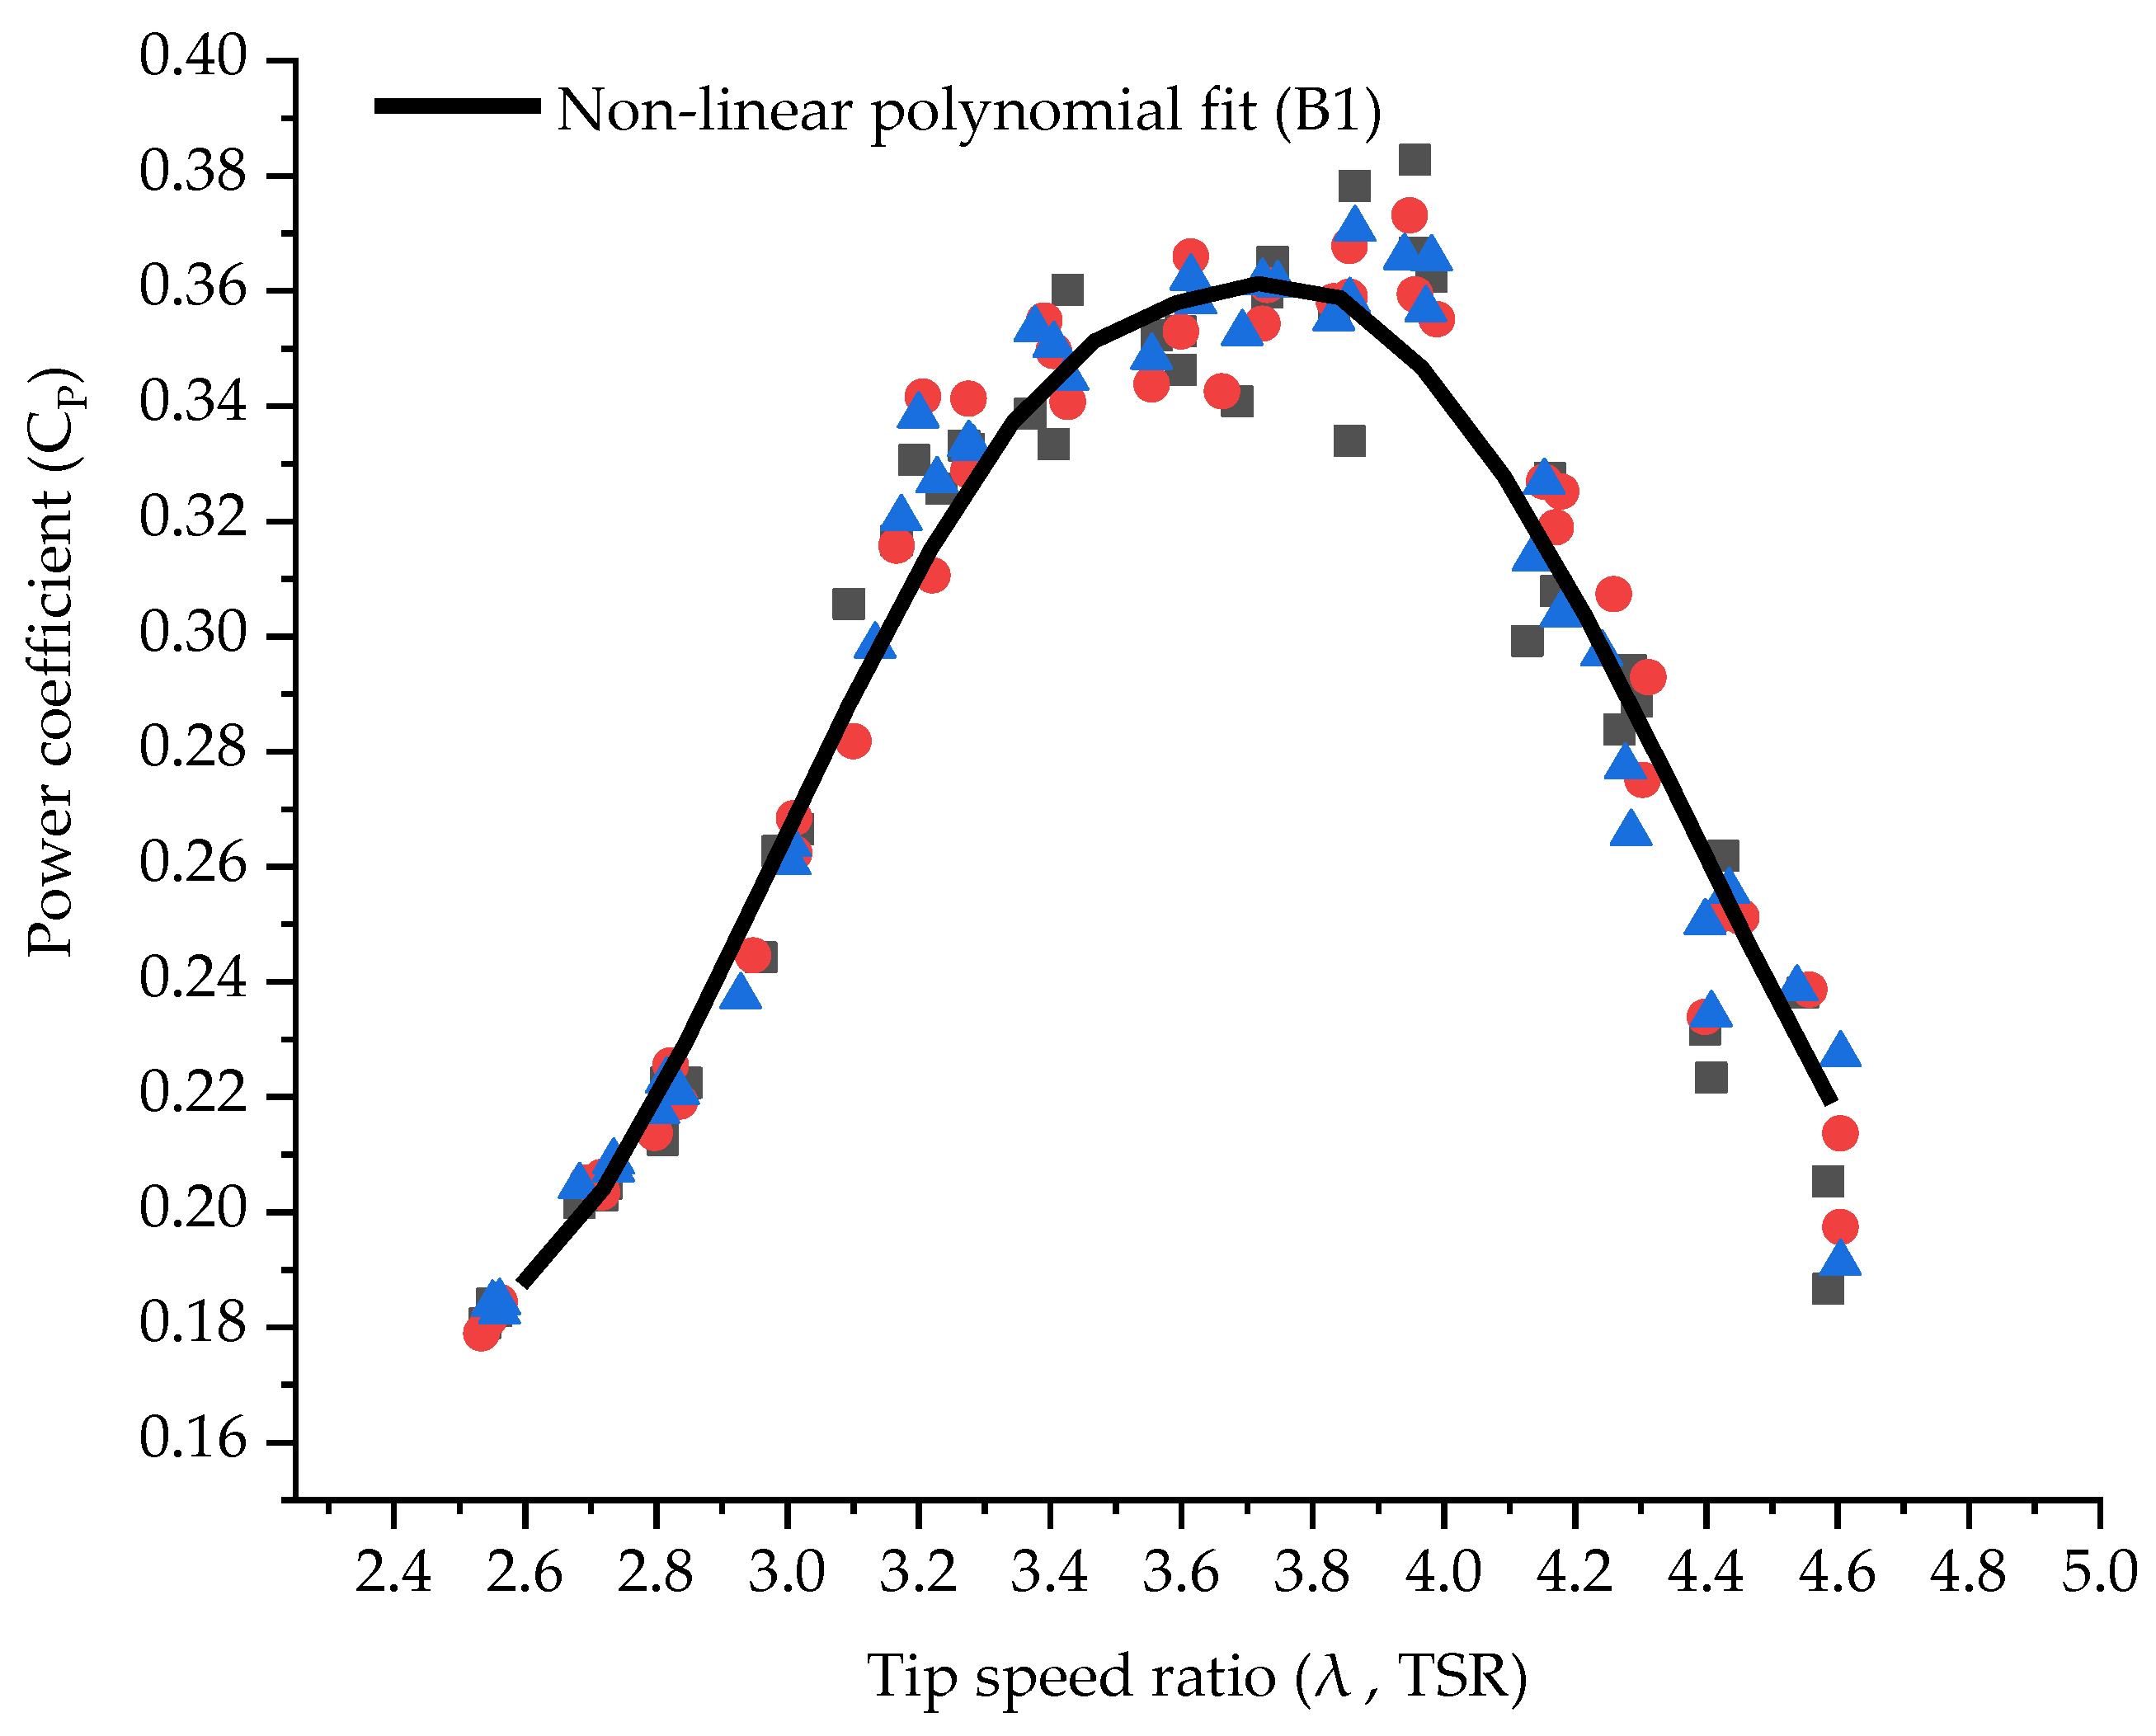
3.1. Representative Power Coefficient Curve and Validation

Following the same procedure, material, baseline rotor blade model, and testing facility and conditions as described in the previous studies of the authors [27,28], wind tunnel experiments were conducted to study the influence of the adopted passive flow control technique, the backward-facing step technique, on the efficiency of wind turbine rotors. The tests were conducted for various wind speeds between 8 and 15 m/s at the entry point of the test section, and tunnel data were collected across tip-speed ratios between 2 and 5. To counteract the resistance forces in the bearings and the direct current motor, it was necessary to initially elevate the wind flow speed above 10 m/s and then adjust it to the desired value.
The rotor model (B1) is fixed on the support frame as depicted in Figure 4. For generating the representative power coefficient curve depicted in Figure 5, the baseline rotor model (B1) (unmodified model) was used [27].
To derive the representative curve of the average power coefficient, three measurement cycles were performed, and blockage corrections were applied. The graph depicted in Figure 6 displays the power coefficient curve derived through a non-linear polynomial fit, wherein the total error in the experimental data indicates a scatter of ±4.1%. The blockage factor, calculated individually for each rotor model at various free-stream velocities, represents the ratio of measured wind speed with the rotor inside the test section to that without it [6].
In Figure 6, the outcomes for a rotor model sourced from the literature are presented, showcasing its performance with respect to CP (power coefficient) and TSR (tip-speed ratio) under conditions similar to the present study. Upon comparing the curves in Figure 6, it becomes evident that the rotor design found in the existing literature [34] excels at lower TSR s, especially below 3.2, which closely aligns with its optimal TSR, achieving a peak CP of around 0.294. However, beyond this threshold, the rotor’s performance declines as the TSR increases to just about 4.5. This decline is likely attributed to alternations in the design parameters of the rotor, including the airfoil section. This observation validates the chosen approach when there is a lack of data for rotor models with identical parameters and test conditions.

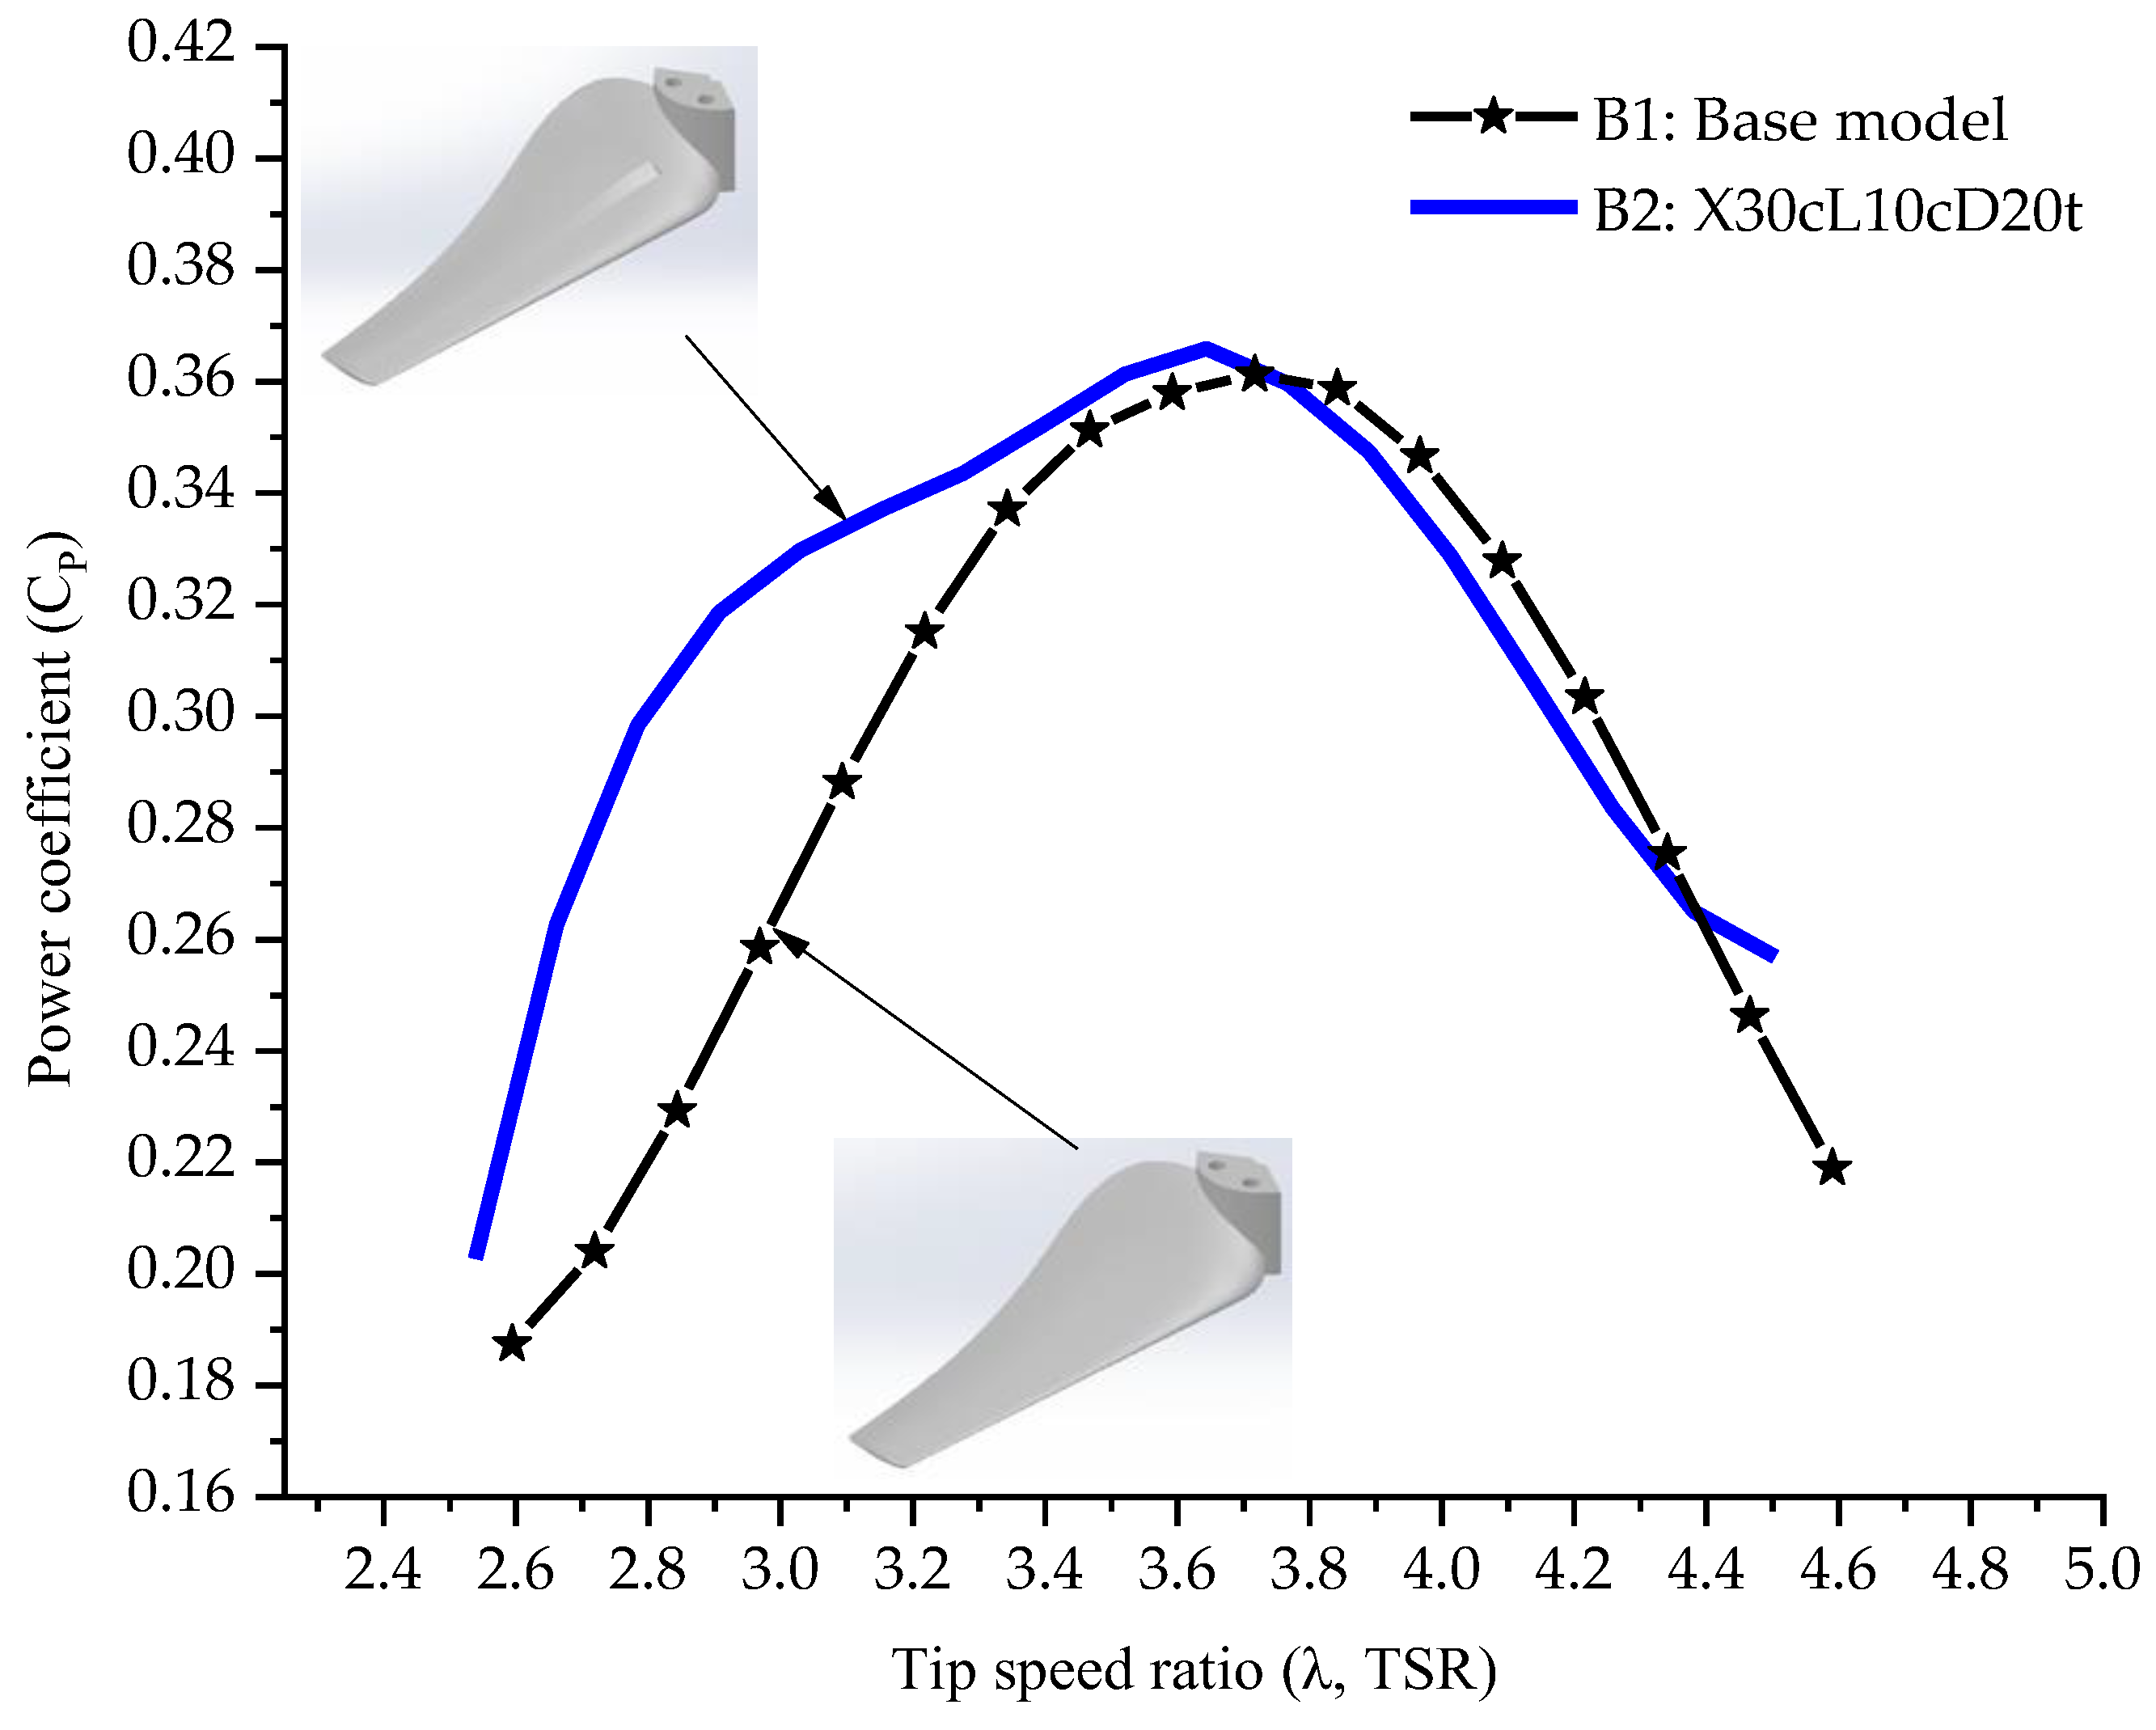
3.2. B2 Rotor Blade Model

In Figure 7, the CP (power coefficient) curves for the rotor model B2 and the rotor model B1 are showcased. The rotor model B2 demonstrated superior performance at lower TSRs (tip-speed ratios) up to 3.76, achieving an efficiency of about 36% more compared to the base rotor model B1 at a TSR around 2.82. A slight increase was observed beyond 4.38. However, between 3.76 and 4.38 the base model B1 exhibited a slight advantage over the rotor model B2. Furthermore, the graph reveals both a shift and an expansion of the CP curve for rotor model B2 towards lower TSR values. This enables the rotor to operate with higher efficiency over a broader TSR range. A peak CP of 0.366 was achieved at a lower TSR than that of the base rotor model B1, specifically at 3.644, representing a 1.4% increase compared to the base model B1 (0.361).

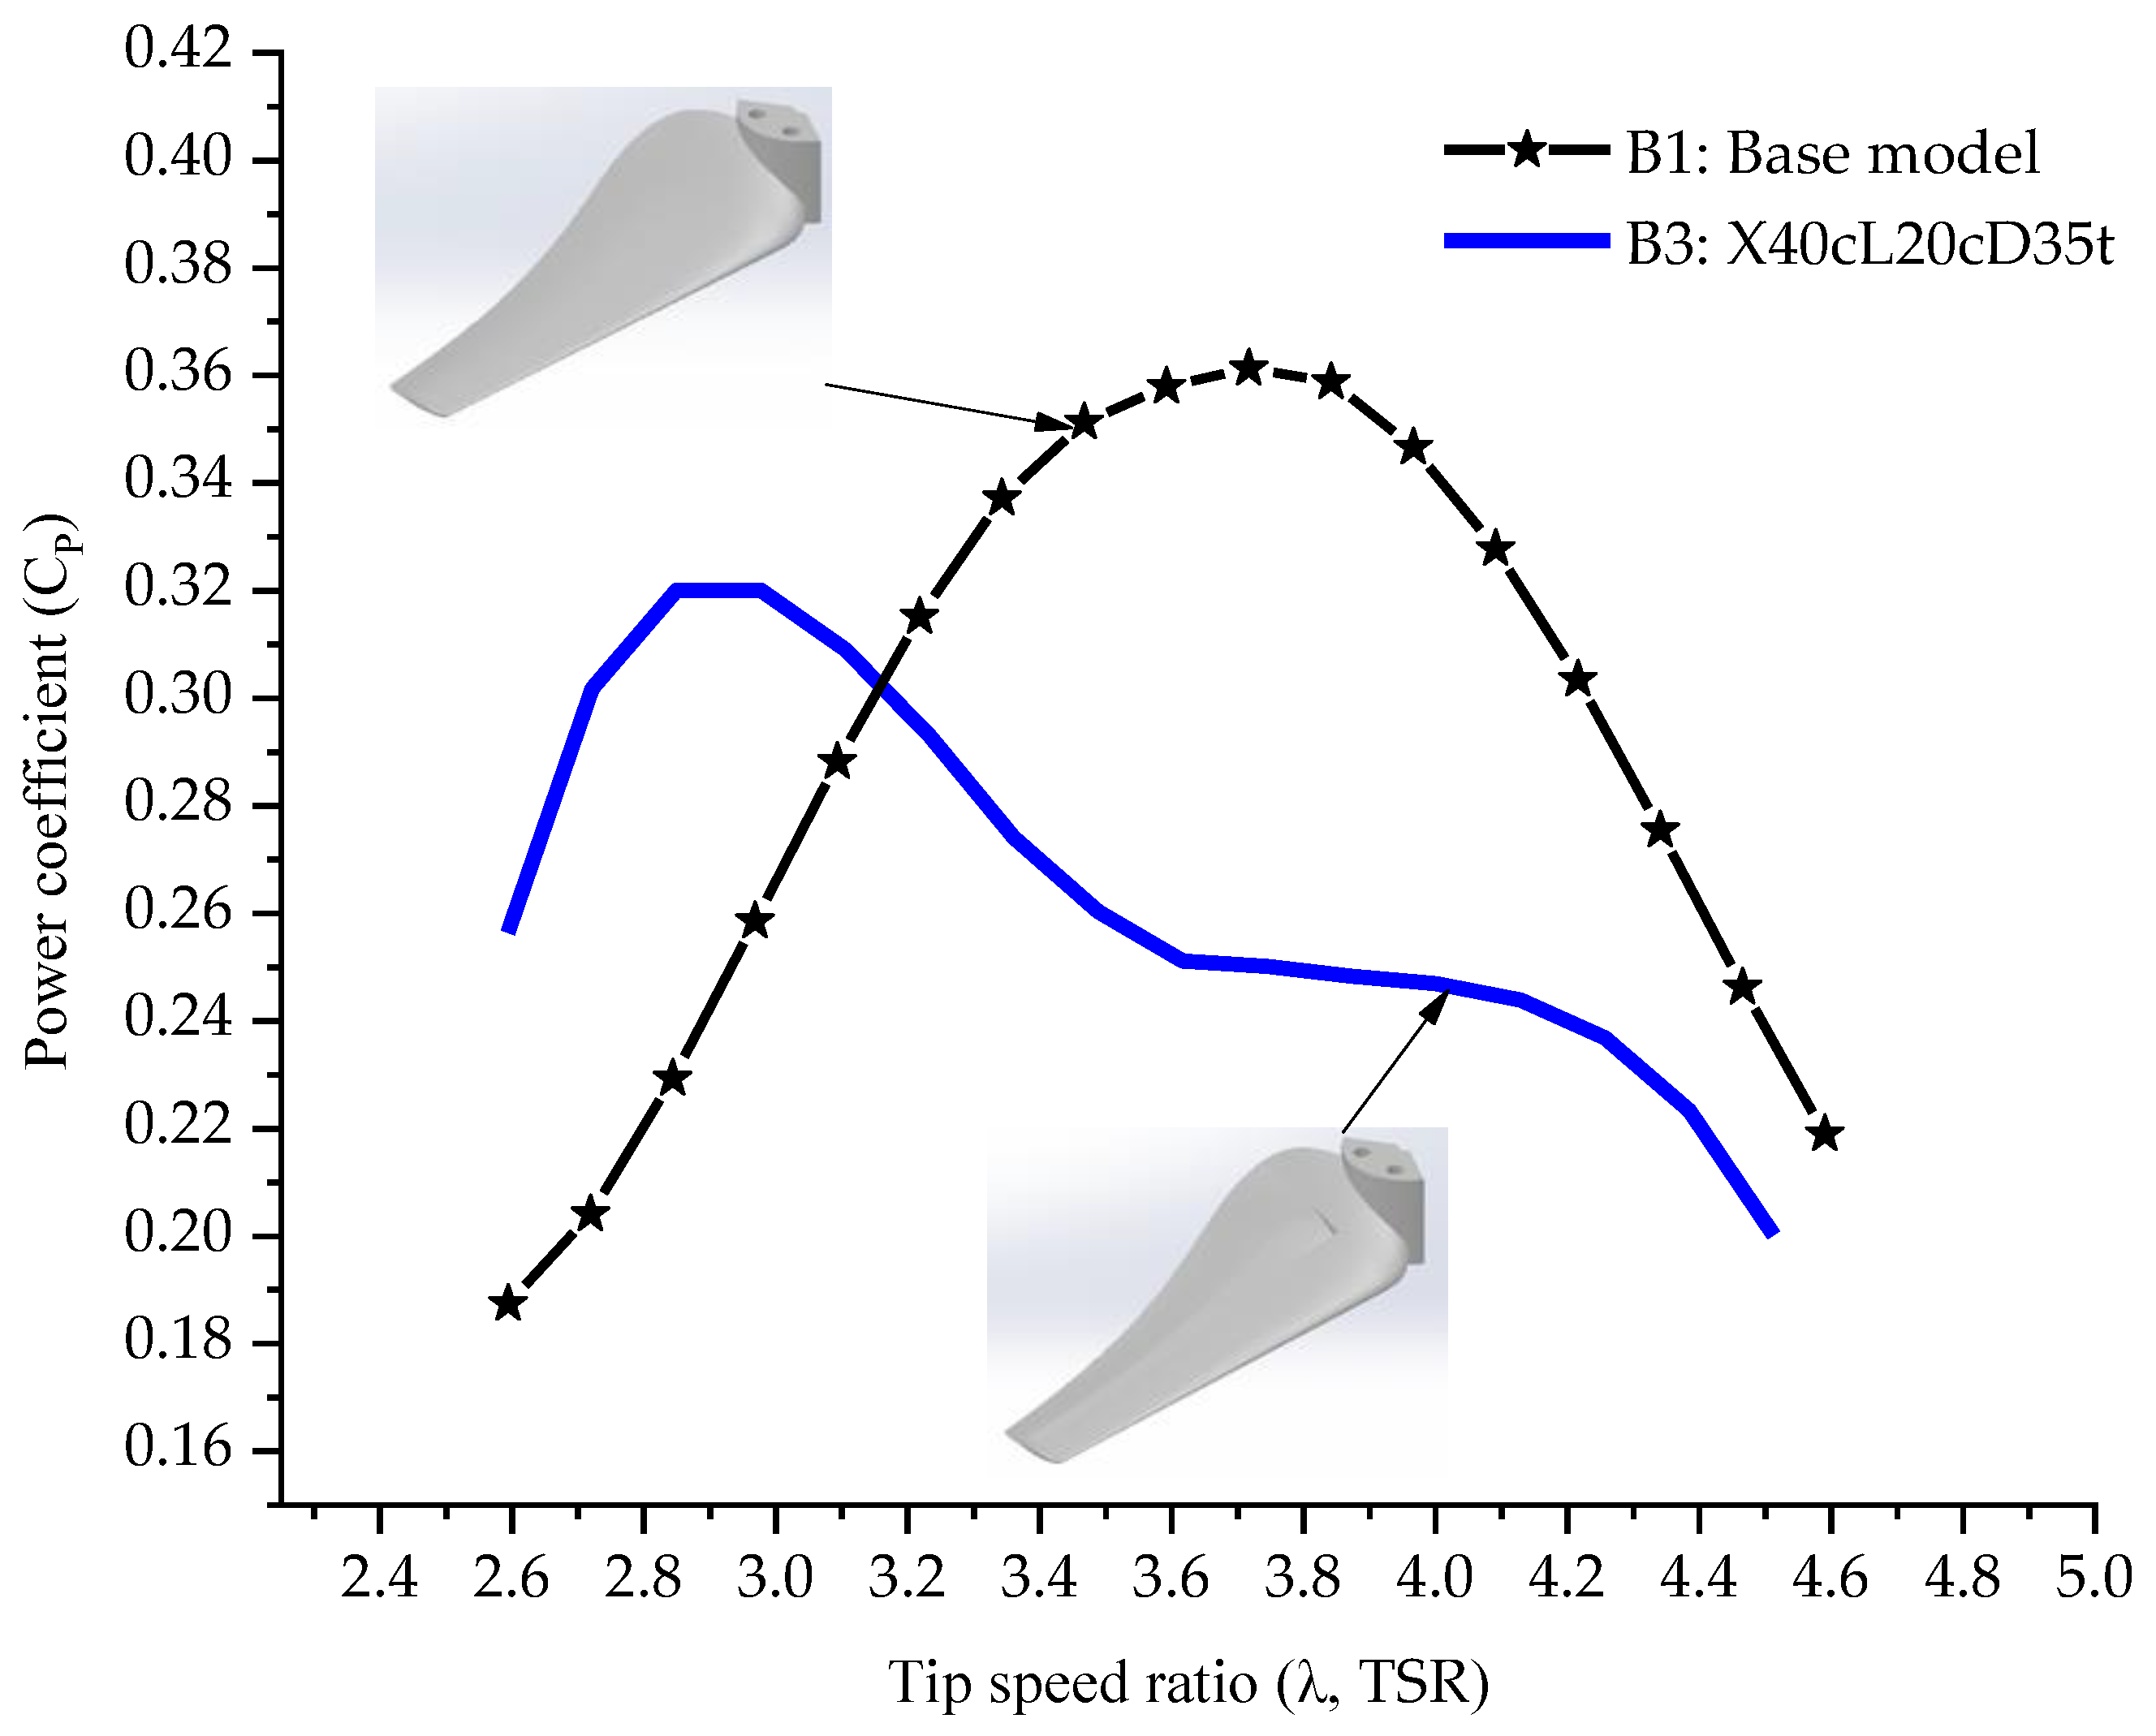
3.3. B3 Rotor Blade Model

As the location of the step moves from 30c to 40c, its length from 10c to 20c, and its depth from 20t to 35t, the performance of the rotor model B3 drops drastically by about 44% compared to the maximum CP (0.361) of the base model B1 (Figure 8). This happens for TSR numbers larger than 3.155. On the other hand, for lower TSRs, this model has indicated a significantly improved performance by about 47% at a TSR around 2.71 more than the base model B1. From the graph, it can be observed that the maximum CP of around 0.32 obtained at a TSR of 2.849 is shifted to a much smaller TSR than the base rotor B1, which is at 3.717.

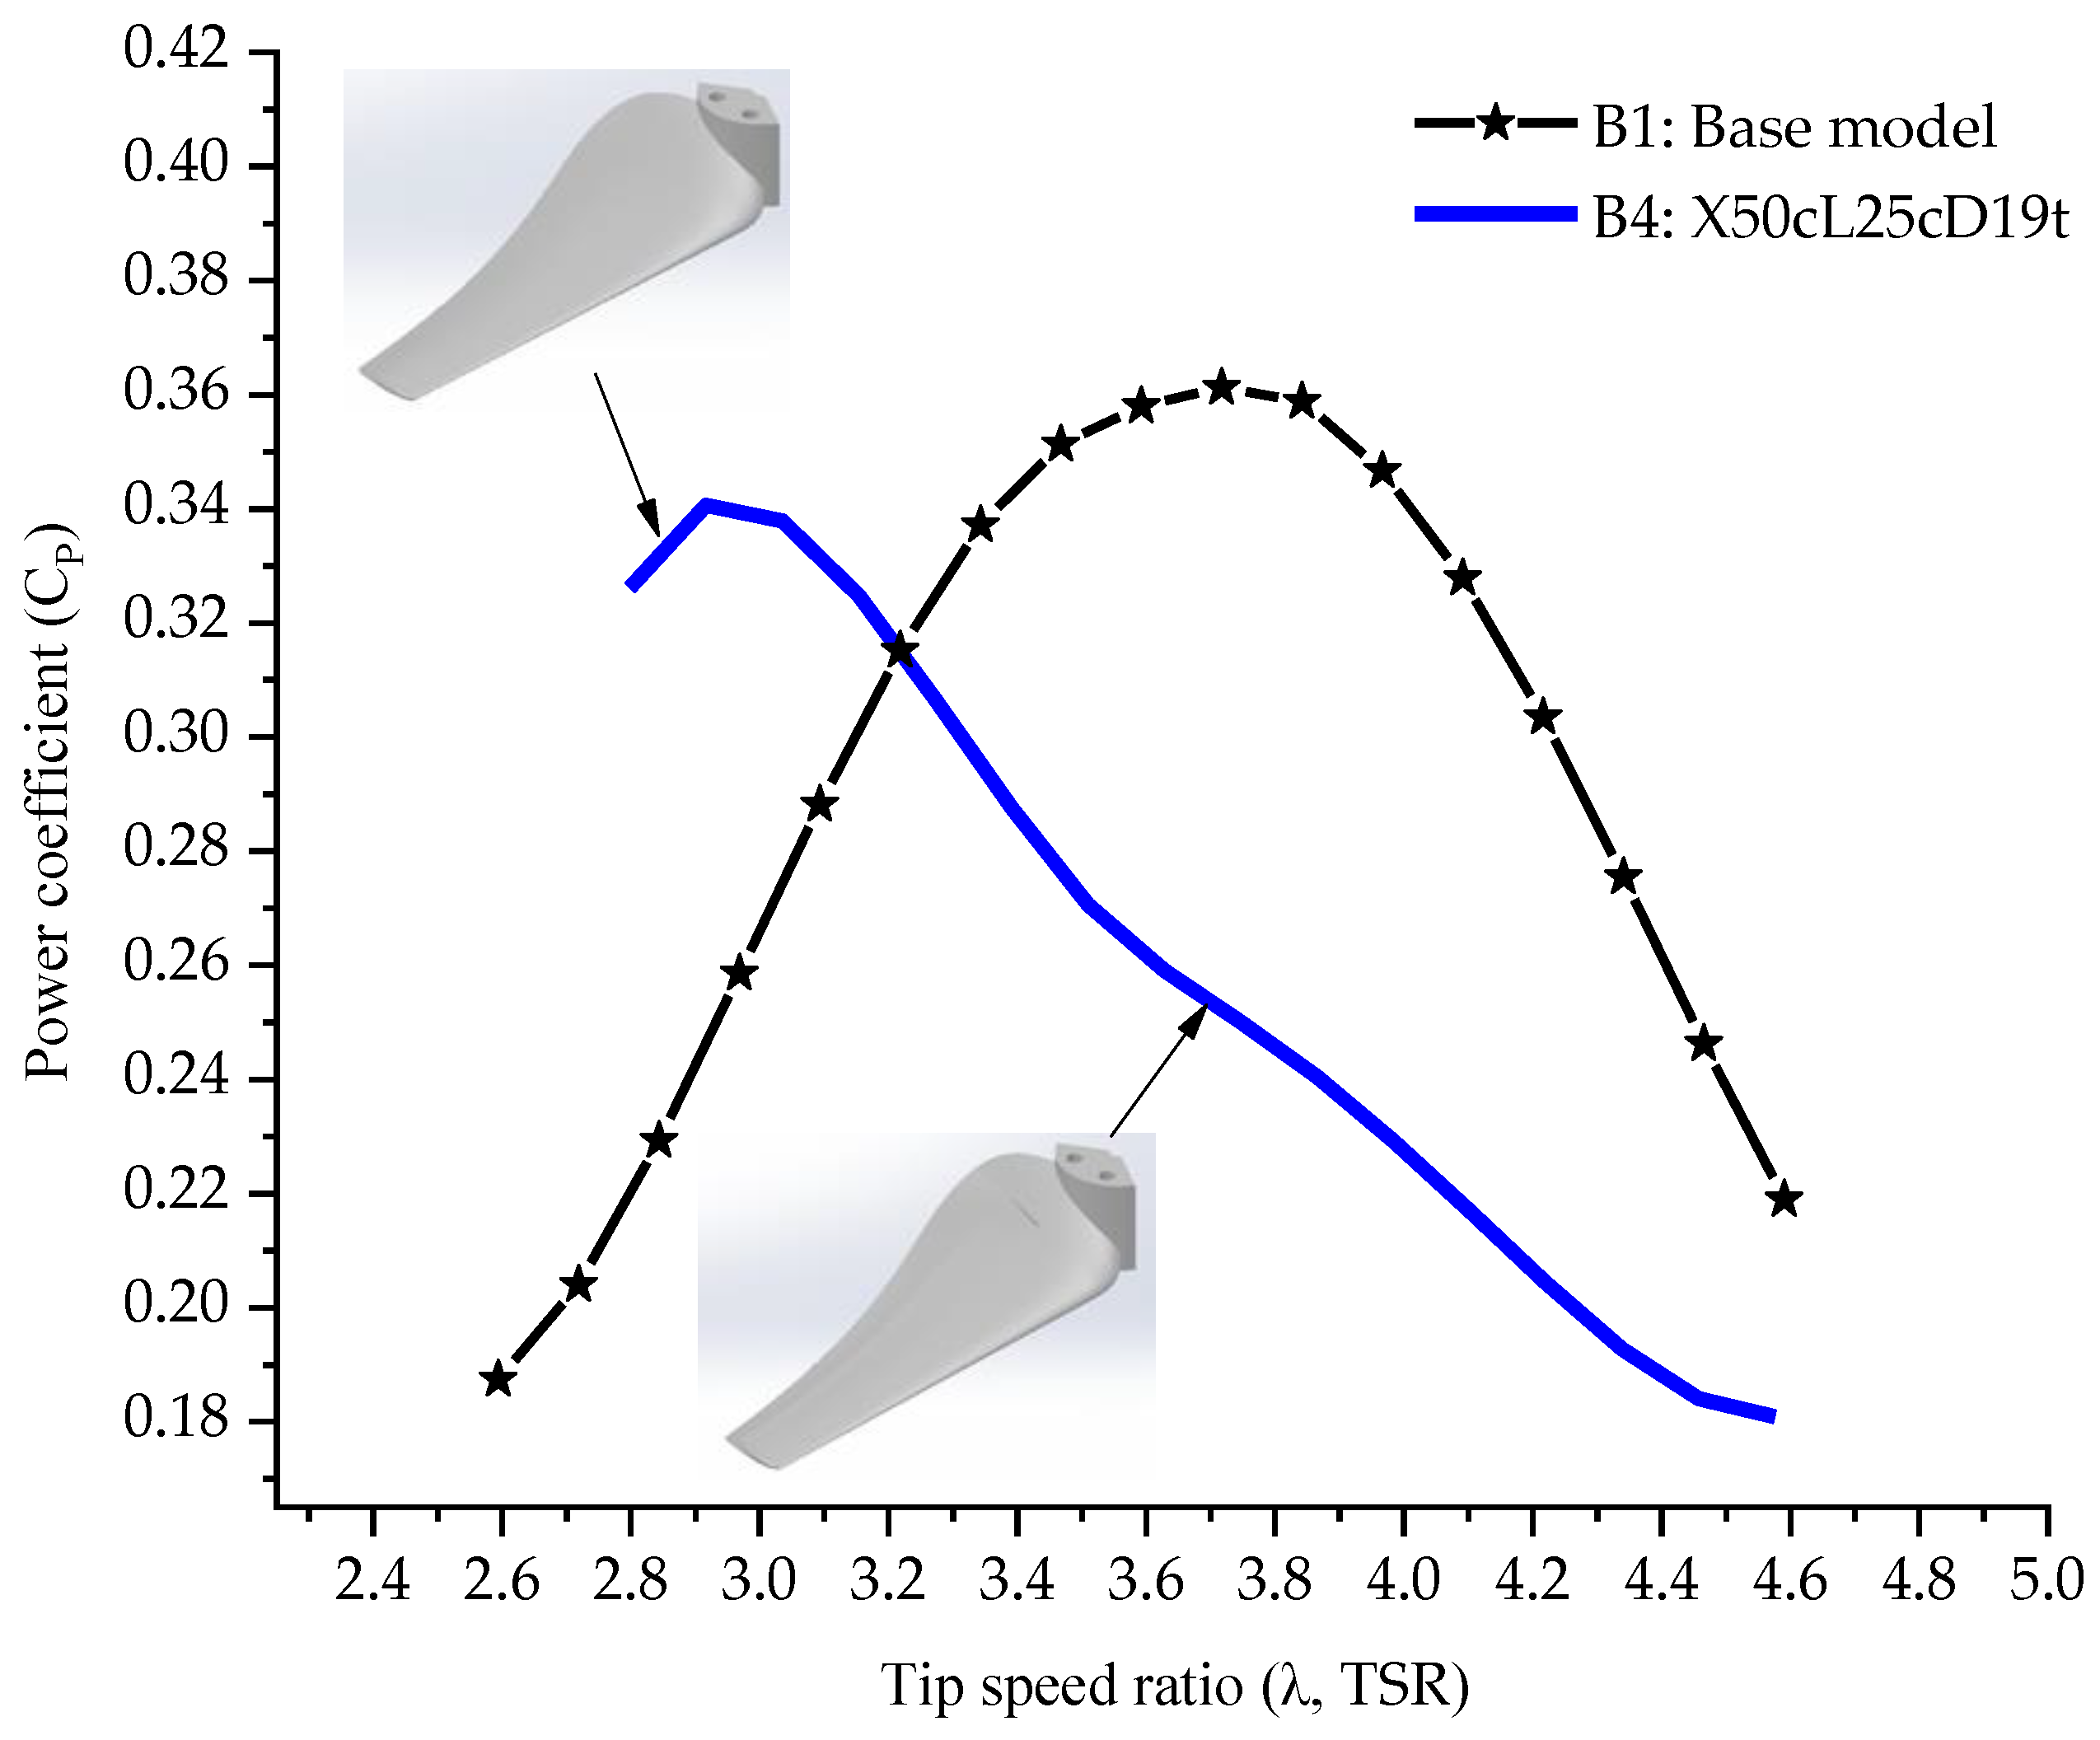
3.4. B4 Rotor Blade Model

By further increasing the step distance from 40c to 50c from the leading edge and its length from 20c to 25c while reducing its depth from 35t to 19t, the performance of the rotor model B4 did not show any significant improvement. In referring to the graph below, Figure 9, it can be noted that the efficiency of the rotor model B4 is higher by about 39% for TSRs up to about 3.22 compared to the base model B1. However, this advantage is reversed continuously for TSRs larger than around 3.22. At a TSR of around 3.717, the disadvantage is about 43% compared to the base model B1. For values of TSRs smaller than around 2.79, it was impossible to measure the torque values due to the occurrence of vibrations. The maximum CP for this case is around 0.34 for a TSR of 2.917.

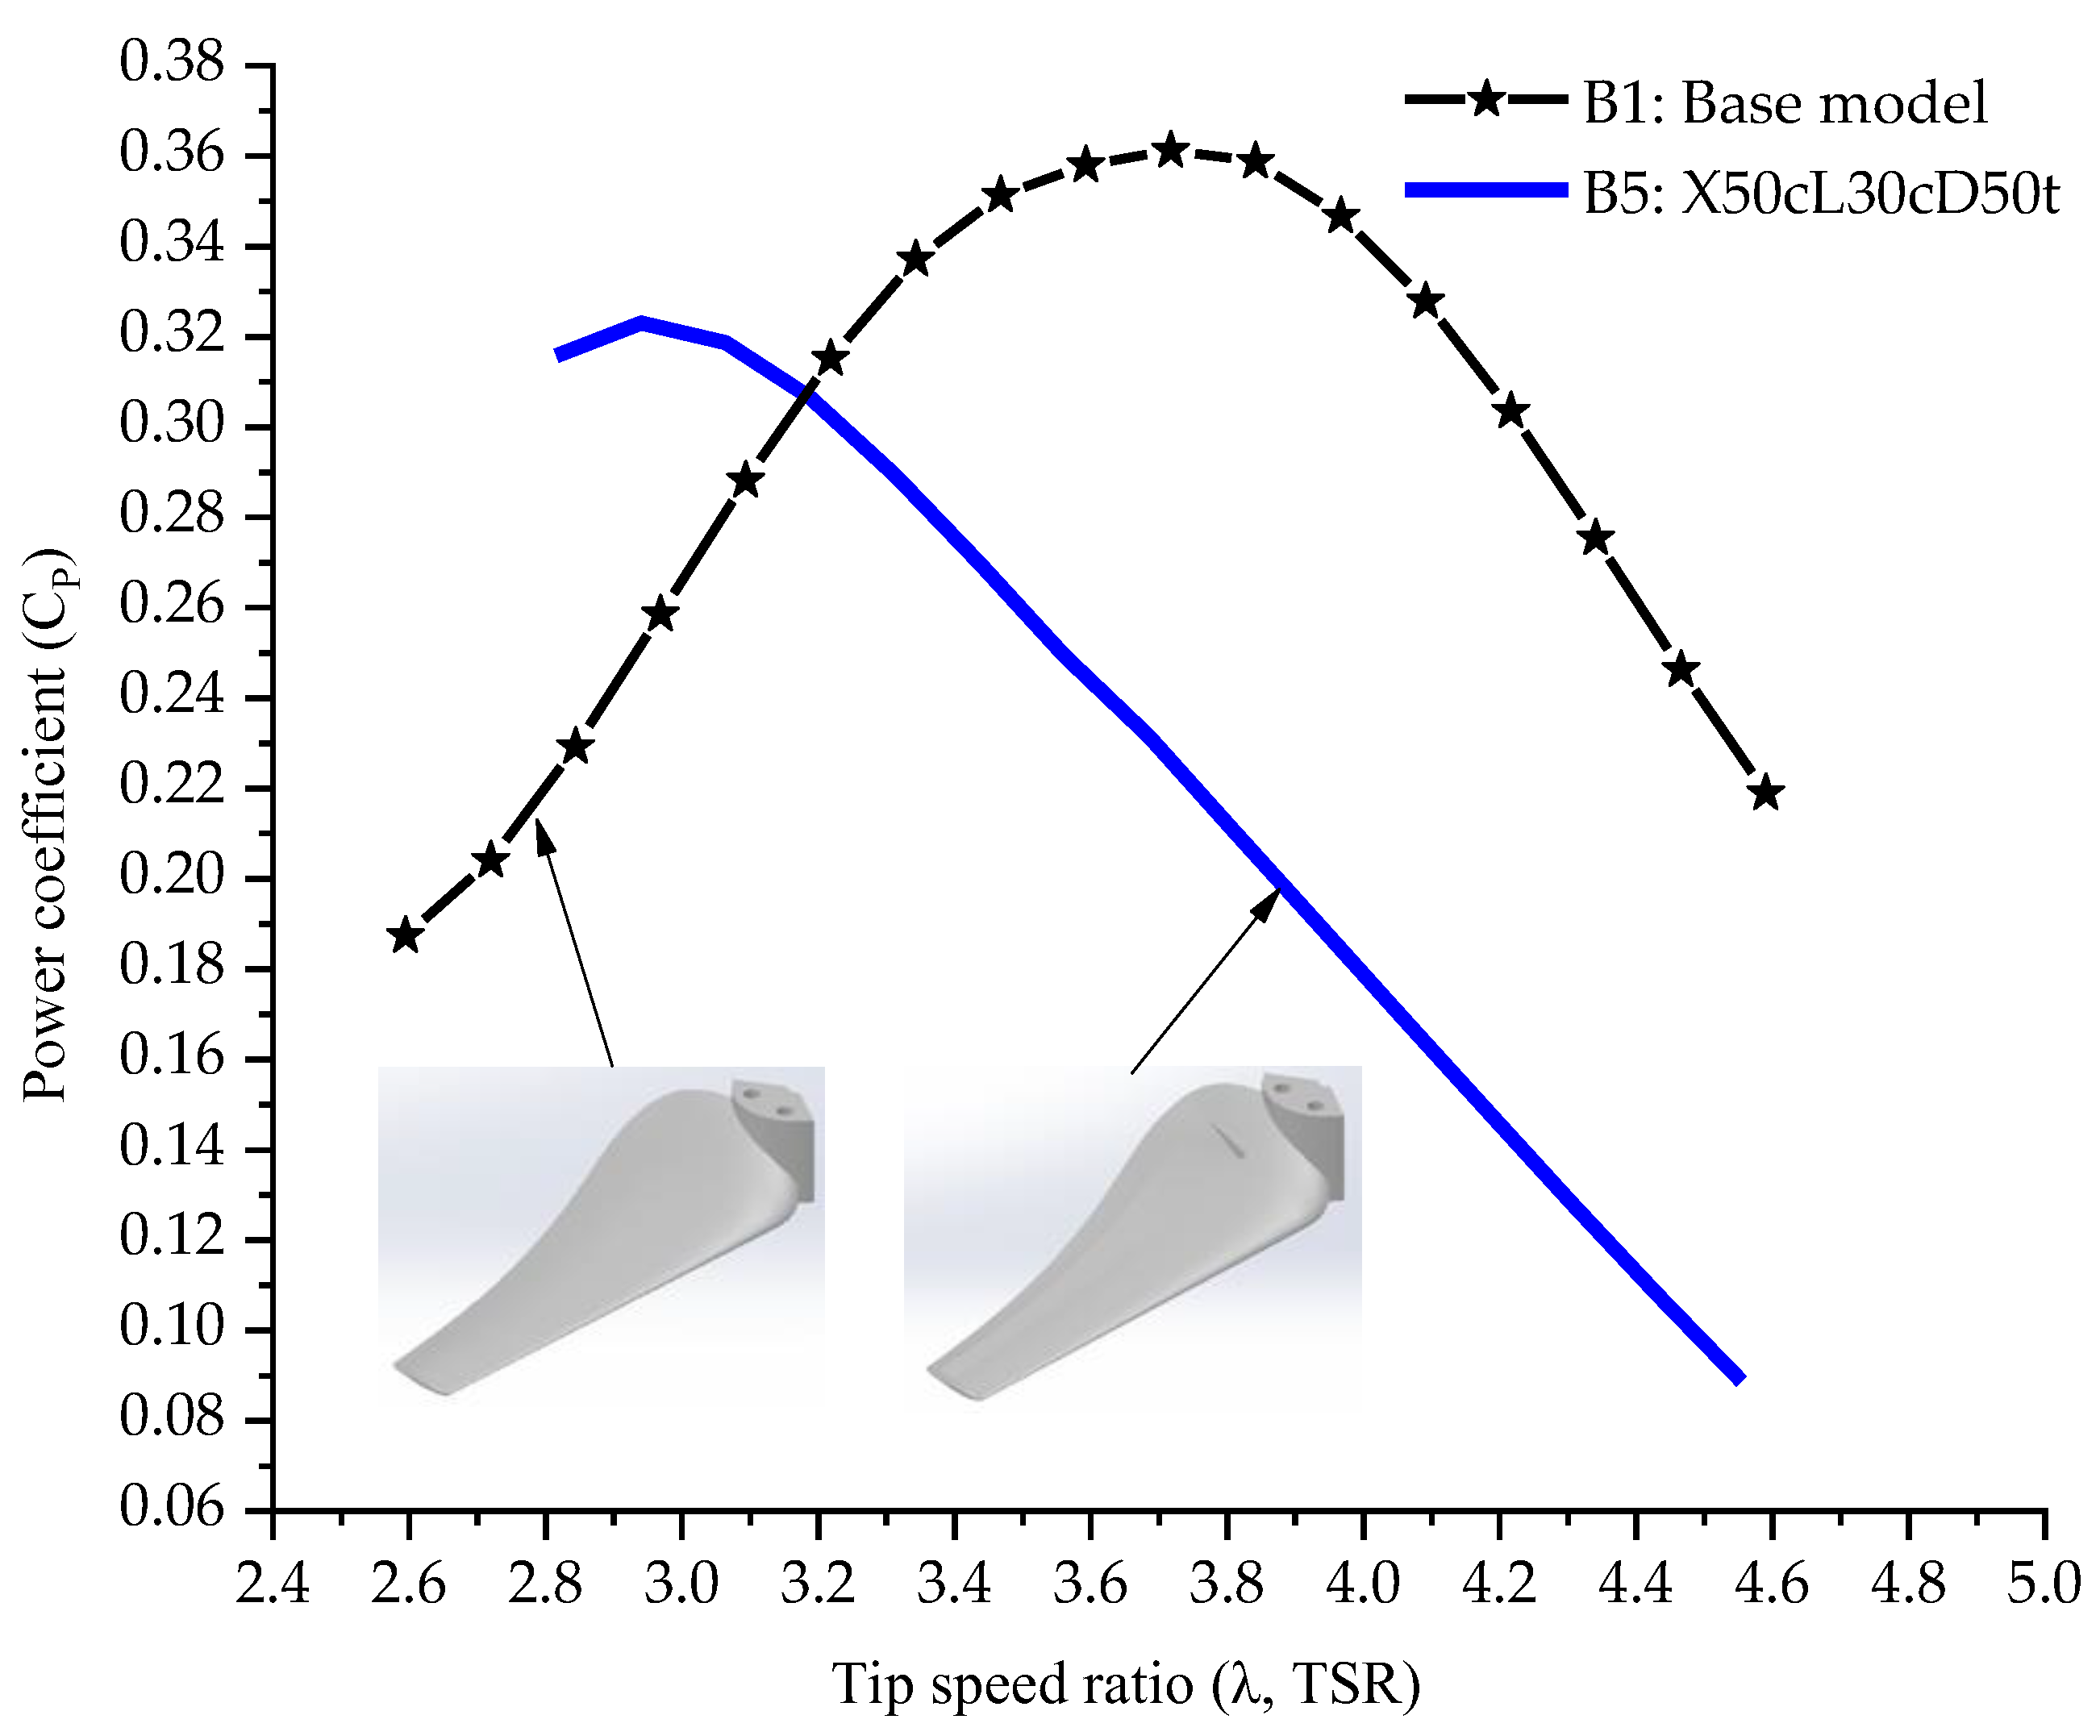
3.5. B5 Rotor Blade Model

In this case, the step distance remained the same as that of the previous rotor model B4, while the length of the step increased from 25c to 30c and its depth from 19t to 50t. With respect to Figure 10, for TSRs lower than 3.2, this model has shown a much better performance by about 38% compared to the base model B1. However, for TSR values higher than around 3.2, a disadvantage in efficiency of the rotor model B5 of about 60% was observed. The maximum CP 0.323 is achieved at a TSR of 2.939. Even in this case, the vibrations appeared for TSR values smaller than nearly 2.82.
If all stepped blade models are evaluated collectively, the highest performance is observed in the case of the B2 model, where the X-step position and L-step length are the smallest. For the B3, B4, and B5 models, where the X-step position, L-step length and D-step depth increase, both Cp values decrease, and peak Cp values occur at smaller TSR values. This occurrence can be elucidated in the following manner: In the B2 model, the X-step position, being close to the leading edge of the blade and having the narrowest length, creates an effect similar to a vortex generator on the suction side of the blade, suppressing the separation of the flow from the surface. On the other hand, in the cases of the B3, B4, and B5 models, shifting the X-step position toward the trailing edge makes it difficult for the flow to follow the surface, potentially increasing stall effects. Additionally, a larger step length and depth disrupt the general aerodynamic structure of the blade, negatively impacting the ability to generate aerodynamic forces.

3.6. B6 Rotor Blade Model

As shown in Figure 11, the hybrid rotor model B6, a combination of the rotor model B4 and the RB2 (A1λ3.5) generated using the leading-edge wavy shape technique from our previous studies [27,28], displayed a similar curve shape to that of the base model B1, giving significant indications of improvement for TSRs larger than around 3.25. In referring to the graph, it can be noticed that there has been an increase of about 20% in the efficiency of this rotor model compared to the rotor model B4 (X50cL25cD19t) at TSR of 3.717, which represents the value where the rotor base model B1 reaches its maximum performance value. Also, it is worth noting that this model has manifested a significantly improved performance (about 31%) for TSRs lower than around 3.2 compared to the base rotor model B1, covering even the smallest values of the TSR in contrast to the B4 and B5 rotor models. A peak CP of 0.319 is achieved at a TSR of 3.451.

4. Conclusions

This research focused on assessing the aerodynamic efficiency of small-scale horizontal-axis wind turbine rotor blades with various designs using the backward-facing step technique. An NREL S822 airfoil profile was used to build the rotor blade configurations. Four distinct blade shapes were produced (B2, B3, B4, B5) by manipulating the step geometric parameters, such as size, location, and depth, and one hybrid blade shape (B6) was derived by combining the most effective blade configuration from our previous work [27] and B4. The B1 rotor model served as the reference for comparing the modified rotor blade models.
The wind tunnel experiments yielded the following key findings:
-
Rotor model B2, with a step location close to the leading edge (30c), a length of 10c, and nearly a 20c depth, exhibited a peak CP around 1.4% higher than the base model B1. This enhancement performance was observed at TSRs up to 3.76, showcasing an efficiency improvement of approximately 36% over the base rotor model B1 at a TSR of 2.82. The advantages are attributed to the modified rotor blade’s poorer surface quality, promoting vortex formation, flow reattachment, and preventing separation through suction for improved flow quality;
-
Rotor models B3, B4, and B5 showed effectiveness (up to 47%, rotor model B3 at a tip-speed ratio around 2.72) for TSRs smaller than 3.2 compared to the base model B1. This situation can be explained as follows: In the B2 model, due to the step position’s proximity to the leading edge of the blade and its narrow length, it creates an effect akin to a vortex generator on the blade’s suction surface, suppressing flow separation from the surface. Conversely, in the cases of the B3, B4, and B5 models, the shift of the step position toward the trailing edge makes it challenging for the flow to adhere to the surface, potentially amplifying stall effects. Furthermore, a larger step length and depth disrupt the general aerodynamic structure of the blade, detrimentally impacting the generation of aerodynamic forces. Experimental measurements for the rotor models B4 and B5 at smaller TSRs than approximately 2.82 were hindered by vibrations;
-
The hybrid rotor model B6 outperformed the base model B1 for TSRs smaller than 3.22, achieving an efficiency improvement of nearly 31%. Efficiency increased by approximately 20% for higher TSRs than 3.22 compared to the rotor model B4, indicating significant improvement.
In this study, considering that the modified blade models were derived from suggestions in the literature, it is advisable to ascertain the optimal position and the geometry of the step that would yield the highest efficiency. Placing the step further upstream and exploring smaller step dimensions are recommended. As this study was purely experimental, extending the research by incorporating Computational Fluid Dynamics (CFD) would provide a more comprehensive understanding of flow physics around the blade and rotor, allowing for a better assessment of how the applied technique influences the outcomes.

Author Contributions

Conceptualization, R.M. and Y.E.A.; Methodology, R.M. and Y.E.A.; Software, R.M. and Y.E.A.; Validation, Y.E.A.; Investigation, R.M.; Resources, R.M.; Data curation, R.M.; Writing—original draft, R.M.; Writing—review & editing, R.M. and Y.E.A.; Visualization, R.M. and Y.E.A.; Supervision, Y.E.A. All authors have read and agreed to the published version of the manuscript.

Funding

This research received no external funding.

Data Availability Statement

Data are contained within the article.

Conflicts of Interest

The authors declare no conflict of interest.

Nomenclature

α angle of attack
A wave amplitude
β i local twist angle
B number of blades
c a v g average chord length of the blade
c i local chord
C L lift coefficient
C D drag coefficient
C P power coefficient
D r diameter of rotor
D step depth
φ i local inflow angle
λ tip-speed ratio
λ i local tip-speed ratio
L step length
μ dynamic viscosity of the air
N number of blade elements
r i local radius
R rotor radius
R e Reynolds number
t thickness of airfoil
ρ air density
σ rotor solidity
V t i p blade tip-speed
V r e l relative velocity
V wind speed
X step position

References

  1. Corke, T. Wind Energy Design; CRC Press: Boca Raton, FL, USA, 2018. [Google Scholar]
  2. Hau, E. Wind Turbines: Fundamentals, Technologies, Application, Economics; Springer Science & Business Media: Berlin/Heidelberg, Germany, 2013. [Google Scholar]
  3. Nelson, V.; Starcher, K. Wind Energy: Renewable Energy and the Environment; CRC Press: Boca Raton, FL, USA, 2018. [Google Scholar]
  4. IEA Net Zero Emissions Scenario 2050. Available online: https://www.iea.org/reports/net-zero-by-2050 (accessed on 1 December 2023).
  5. Giguère, P.; Selig, M.S. Low Reynolds Number Airfoils for Small Horizontal Axis Wind Turbines. Wind. Eng. 1997, 21, 367–380. [Google Scholar]
  6. Van Treuren, K.W. Small-Scale Wind Turbine Testing in Wind Tunnels under Low Reynolds Number Conditions. J. Energy Resour. Technol. Trans. ASME 2015, 137, 051208. [Google Scholar] [CrossRef]
  7. IMechE. The International Vehicle Aerodynamics Conference; Woodhead Publishing: Sawston, UK, 2014. [Google Scholar]
  8. Olsman, W.F.J.; Colonius, T. Numerical Simulation of Flow over an Airfoil with a Cavity. AIAA J. 2011, 49, 143–149. [Google Scholar] [CrossRef]
  9. Ringleb, F.O. Separation Control by Trapped Vortices. In Boundary Layer and Flow Control; Lachmann, G.V., Ed.; Pergamon Press: Oxford, UK, 1961; Volume 1, pp. 265–294. [Google Scholar]
  10. Adkins, R.C. A Short Diffuser with Low Pressure Loss. J. Fluids Eng. 1975, 97, 297–302. [Google Scholar] [CrossRef]
  11. Fertis, D.G. New Airfoil-Design Concept with Improved Aerodynamic Characteristics. J. Aerosp. Eng. 1994, 7, 328–339. [Google Scholar] [CrossRef]
  12. Finaish, F.; Witherspoon, S. Aerodynamic Performance of an Airfoil with Step-Induced Vortex for Lift Augmentation. J. Aerosp. Eng. 1998, 11, 9–16. [Google Scholar] [CrossRef]
  13. Mishriky, F.; Walsh, P. Effect of the Backward-Facing Step Location on the Aerodynamics of a Morphing Wing. Aerospace 2016, 3, 25. [Google Scholar] [CrossRef]
  14. Boroomand, M.; Hosseinverdi, S. Numerical Investigation of Turbulent Flow around a Stepped Airfoil at High Reynolds Number. In Proceedings of the ASME 2009 Fluids Engineering Division Summer Meeting, Vail, CO, USA, 2–6 August 2009. [Google Scholar]
  15. Donelli, R.S.; De Gregorio, F.; Pierluigi, I. Flow Separation Control by Trapped Vortex. In Proceedings of the 48th AIAA Aerospace Sciences Meeting Including the New Horizons Forum and Aerospace Exposition, Orlando, FL, USA, 4–7 January 2010. [Google Scholar]
  16. Witherspoon, S.; Finaisht, F. Experimental and Computational Studies of Flow Developments around an Airfoil with Backward-Facing Steps. In Proceedings of the 14th Applied Aerodynamics Conference, New Orleans, LA, USA, 17–20 June 1996. [Google Scholar]
  17. Chowdhury, M.S.; Mau, M.M.; Shayok, M.I.; Mallick, R.B.; Ali, M. Effect of Backward Facing Step on the Aerodynamic Characteristics of NACA 0015 Airfoil. In Proceedings of the 8th BSME International Conference on Thermal Engineering, Dhaka, Bangladesh, 19–21 December 2018. [Google Scholar]
  18. Rowley, C.; Juttijudata, V.; Williams, D. Cavity Flow Control Simulations and Experiments. In Proceedings of the 43rd AIAA Aerospace Sciences Meeting and Exhibit, Reno, NV, USA, 10–13 January 2005. [Google Scholar]
  19. Shi, S.; New, T.H.; Liu, Y. On the Flow Behaviour of a Vortex-Trapping Cavity NACA0020 Aerofoil at Ultra-Low Reynolds Number. In Proceedings of the 17th International Symposium on Applications of Laser Techniques to Fluid Mechanics, Lisbon, Portugal, 7–10 July 2014. [Google Scholar]
  20. De Gregorio, F.; Fraioli, G. Flow Control on a High Thickness Airfoil by a Trapped Vortex Cavity. In Proceedings of the 14th International Symposium on Applications of Laser Techniques to Fluid Mechanics, Lisbon, Portugal, 7–10 July 2008. [Google Scholar]
  21. Tangler, J.; Somers, D. NREL Airfoil Families for HAWTs; National Renewable Energy Lab. (NREL): Golden, CO, USA, 1995.
  22. Winslow, J.; Otsuka, H.; Govindarajan, B.; Chopra, I. Basic Understanding of Airfoil Characteristics at Low Reynolds Numbers (104–105). J. Aircr. 2018, 55, 1050–1061. [Google Scholar] [CrossRef]
  23. Hansen, M.O.L. Aerodynamics and Design of Horizontal-Axis Wind Turbines. In Wind Energy Engineering: A Handbook for Onshore and Offshore Wind Turbines; Academic Press: Cambridge, MA, USA, 2017. [Google Scholar]
  24. McLean, D. Understanding Aerodynamics: Arguing from the Real Physics; Wiley: Hoboken, NJ, USA, 2012. [Google Scholar]
  25. Schetz, J.A.; Fuhs, A.E. Handbook of Fluid Dynamics and Fluid Machinery; Wiley: Hoboken, NJ, USA, 1996. [Google Scholar]
  26. Wood, D. Small Wind Turbines: Analysis, Design, and Application; Green Energy and Technology; Springer: Berlin/Heidelberg, Germany, 2011. [Google Scholar]
  27. Morina, R.; Akansu, Y.E. The Effect of Leading-Edge Wavy Shape on the Performance of Small-Scale HAWT Rotors. Energies 2023, 16, 6405. [Google Scholar] [CrossRef]
  28. Morina, R. Development of a Horizontal Axis Wind Turbine Blade Profile Based on Passive Flow Control Methods. Ph.D. Thesis, Niğde Ömer Halisdemir University, Niğde, Turkey, 2021. [Google Scholar]
  29. Gasch, R.; Twele, J. Wind Power Plants: Fundamentals, Design, Construction and Operation, 2nd ed.; Springer Science & Business Media: Berlin/Heidelberg, Germany, 2012. [Google Scholar]
  30. Burdet, T.A.; Van Treuren, K.W. Van. Scaling Small-Scale Wind Turbines For Wind Tunnel Testing. In Turbo Expo: Power for Land, Sea, and Air; American Society of Mechanical Engineers: New York, NY, USA, 2012. [Google Scholar]
  31. Burdett, T.A.; Van Treuren, K.W. A Theoretical and Experimental Comparison of Optimizing Angle of Twist Using BET and BEMT. In Proceedings of the ASME Turbo Expo 2012: Turbine Technical Conference and Exposition, Copenhagen, Denmark, 11–15 June 2012. [Google Scholar]
  32. Kishore, R.; Stewart, C.; Priya, S. Wind Energy Harvesting: Micro-to-Small Scale Turbines; Walter de Gruyter GmbH & Co KG: Berlin, Germany, 2018. [Google Scholar]
  33. Akbıyık, H. Control of Flow around a Circular Cylinder by Using Active and Passive Control Methods. Master’s Thesis, NÖHU Graduate School of Natural and Applied Sciences, Niğde, Türkiye, 2014; pp. 53–59. [Google Scholar]
  34. Lanzafame, R.; Mauro, S.; Messina, M. Numerical and Experimental Analysis of Micro HAWTs Designed for Wind Tunnel Applications. Int. J. Energy Environ. Eng. 2016, 7, 199–210. [Google Scholar] [CrossRef]
  35. Bakırcı, M.; Yılmaz, S. Theoretical and Computational Investigations of the Optimal Tip-Speed Ratio of Horizontal-Axis Wind Turbines. Eng. Sci. Technol. Int. J. 2018, 21, 1128–1142. [Google Scholar] [CrossRef]
Figure 1. Section view of the NREL S822 airfoil.
Energies 17 01170 g001
Figure 2. Design parameters: X—position, L—length, D—depth [28].
Energies 17 01170 g002
Figure 3. A view of the wind tunnel and experimental setup [28].
Energies 17 01170 g003
Figure 4. Rotor model (B1) installed on the supporting frame.
Energies 17 01170 g004
Figure 5. Representative power coefficient curve (Cp) versus tip-speed ratio (λ, TSR) with all measurement points (red circle—first measurement, gray square—second measurement, blue triangle—third measurement) [27,28].
Energies 17 01170 g005
Figure 6. Power coefficient (Cp) versus tip-speed ratio (λ, TSR) of the baseline rotor model (B1) and the rotor model from the CFD study of Lanzafame et al. [34].
Energies 17 01170 g006
Figure 7. Power coefficient (Cp) versus tip-speed ratio (λ, TSR) for the B2 rotor model [27,28].
Energies 17 01170 g007
Figure 8. Power coefficient (Cp) versus tip-speed ratio (λ, TSR) for the B3 rotor model [27,28].
Energies 17 01170 g008
Figure 9. Power coefficient (Cp) versus tip-speed ratio (λ, TSR) for the B4 rotor model [27,28].
Energies 17 01170 g009
Figure 10. Power coefficient (Cp) versus tip-speed ratio (λ, TSR) for the B5 rotor model [27,28].
Energies 17 01170 g010
Figure 11. Power coefficient (Cp) versus tip-speed ratio (λ, TSR) for the B6 rotor model [27,28].
Energies 17 01170 g011
Table 1. Design parameters of the original rotor blade geometry [27,28].
ParameterValueUnit
Diameter (Dr)600mm
Wind speed (V)9m/s
Density of air (ρ)1.225kg/m3
Reynolds number (Re)1 × 10⁵-
Number of blades (B)3pcs
Tip-speed ratio (TSR, λ)3.658-
Solidity (σ)22.1%
Lift coefficient (CL) (XFoil 6.9)0.9256-
Drag coefficient (CD) (XFoil 6.9)0.02168-
Angle of attack (α)8.5degree (°)
Glide ratio (CL/CD) (XFoil 6.9)42.7-
Number of elements (N)10pcs
Ncrit (XFoil 6.9)9-
Table 2. Chordwise length and twist angle distribution of the baseline blade model [27,28].
StationRadius, ri (mm)Chord Length, ci (mm) Twist Angle, βi (°)
Hub16.33--
128.048.127.4
239.246.121.0
350.442.116.3
461.637.912.7
572.834.010.0
684.030.77.8
795.227.86.1
8106.425.44.7
9117.623.33.5
10128.821.52.5
11140.020.01.7
cavg = 32.4
Table 3. The four blade shape configurations [27,28].
B1—Base Model
Energies 17 01170 i001
B2—X30cL10cD20t
Energies 17 01170 i002
B3—X40cL20cD35t
Energies 17 01170 i003
B4—X50cL25cD19t
Energies 17 01170 i004
B5—X50cL30cD50t
Energies 17 01170 i005
B6—X50cL25cD19t—A1λ3.5
Energies 17 01170 i006
Table 4. All blade shape models [27,28].
NoBlade ModelsX-Step Position (%c)L-Step Length (%c)D-Step Depth (%t)Wavy Shape Amplitude A (mm) Wavy Shape Wave Length
λ (mm)
1B1-Base model-----
2B2-X30cL10cD20t301020--
3B3-X40cL20cD35t402035--
4B4-X50cL25cD19t502519--
5B5-X50cL30cD50t503050--
6B6-X50cL25cD19t—A1λ3.550251913.5
Disclaimer/Publisher’s Note: The statements, opinions and data contained in all publications are solely those of the individual author(s) and contributor(s) and not of MDPI and/or the editor(s). MDPI and/or the editor(s) disclaim responsibility for any injury to people or property resulting from any ideas, methods, instructions or products referred to in the content.

