
Perspectives of Electricity Production from Biogas in the European Union

 ,
,  ,
, 
 ,
,  and
and
Abstract
1. Introduction
- What is the production of biogas in the world?
- How has the production of electricity from biogas changed in 2012–2021 in the EU?
- What is the future of electricity production from biogas in the EU?
- What is the prognosis of electricity production from biogas in European Union countries?
1.1. The Role of Biogas in the Energy Strategy of the European Union (EU)
1.2. Problems and Barriers to Biogas Production
1.3. Environmental Aspects on Biogas Production
- Improvement in fertilization conditions in agricultural fields compared to raw slurry;
- Reducing the amount of nitrate nitrogen in favor of ammonium nitrogen;
- Ability to maintain humus balance in the soil;
- Destruction of weed seeds—reduction in herbicide consumption;
- Elimination of pathogens thanks to, e.g., hygienist processes;
- Reducing the use of artificial fertilizers;
- Reducing the risk of contamination in ground and surface waters, limiting the spread of pathogens contained in animal feces, such as Salmonella, Escherichia coli, tuberculosis bacteria, foot and mouth disease, viruses, etc.;
2. Materials and Methods
2.1. Data Sources
2.2. Methods
- B—the delay operator;
- Y—the analyzed variable;
- E—the random component;
- θ—autoregression parameters;
- q—the amount of delay [57].
3. Results
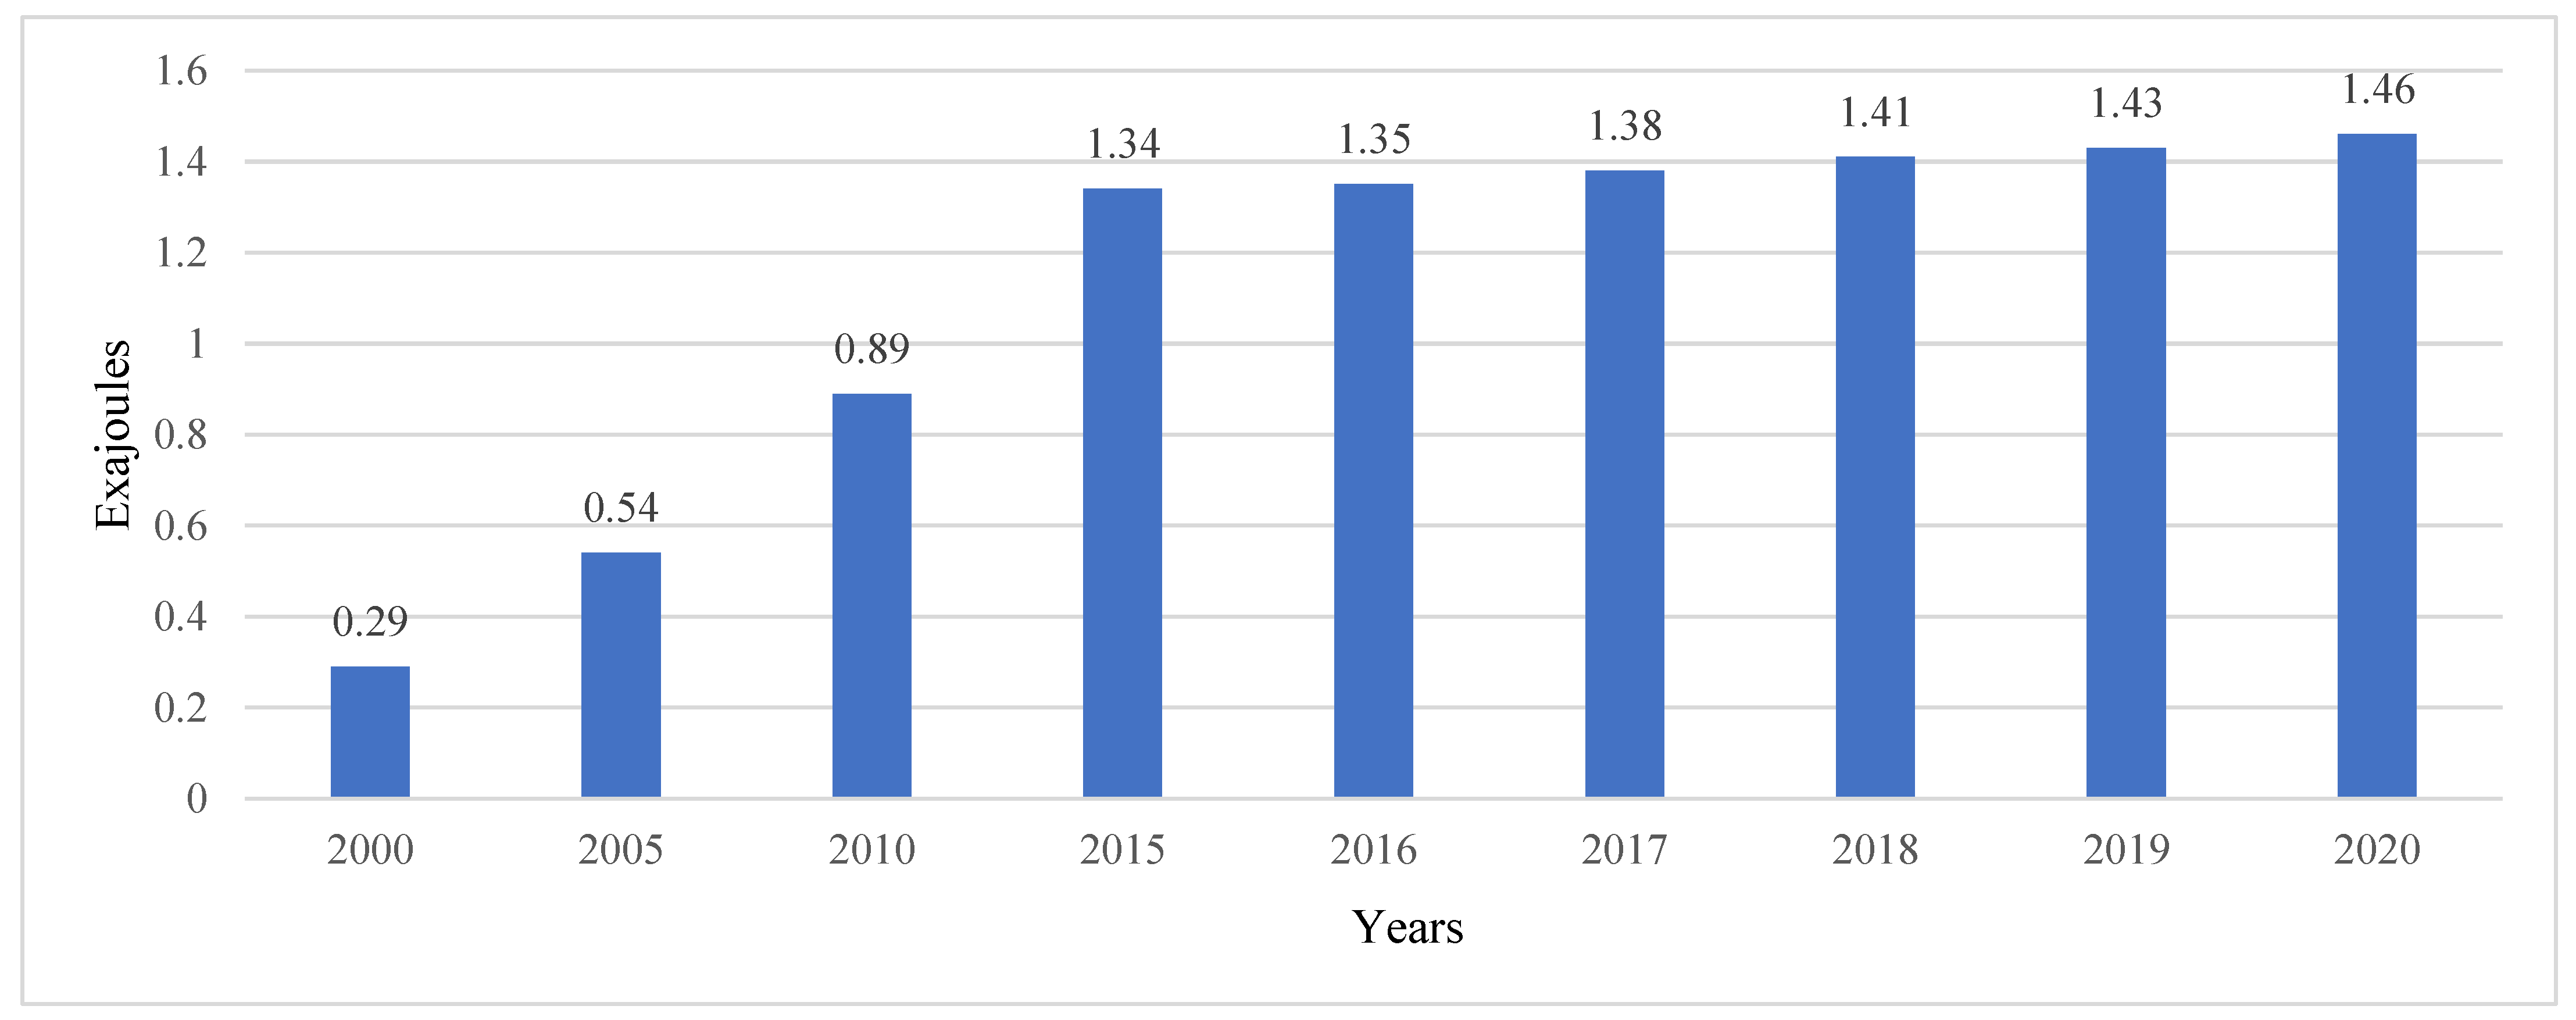
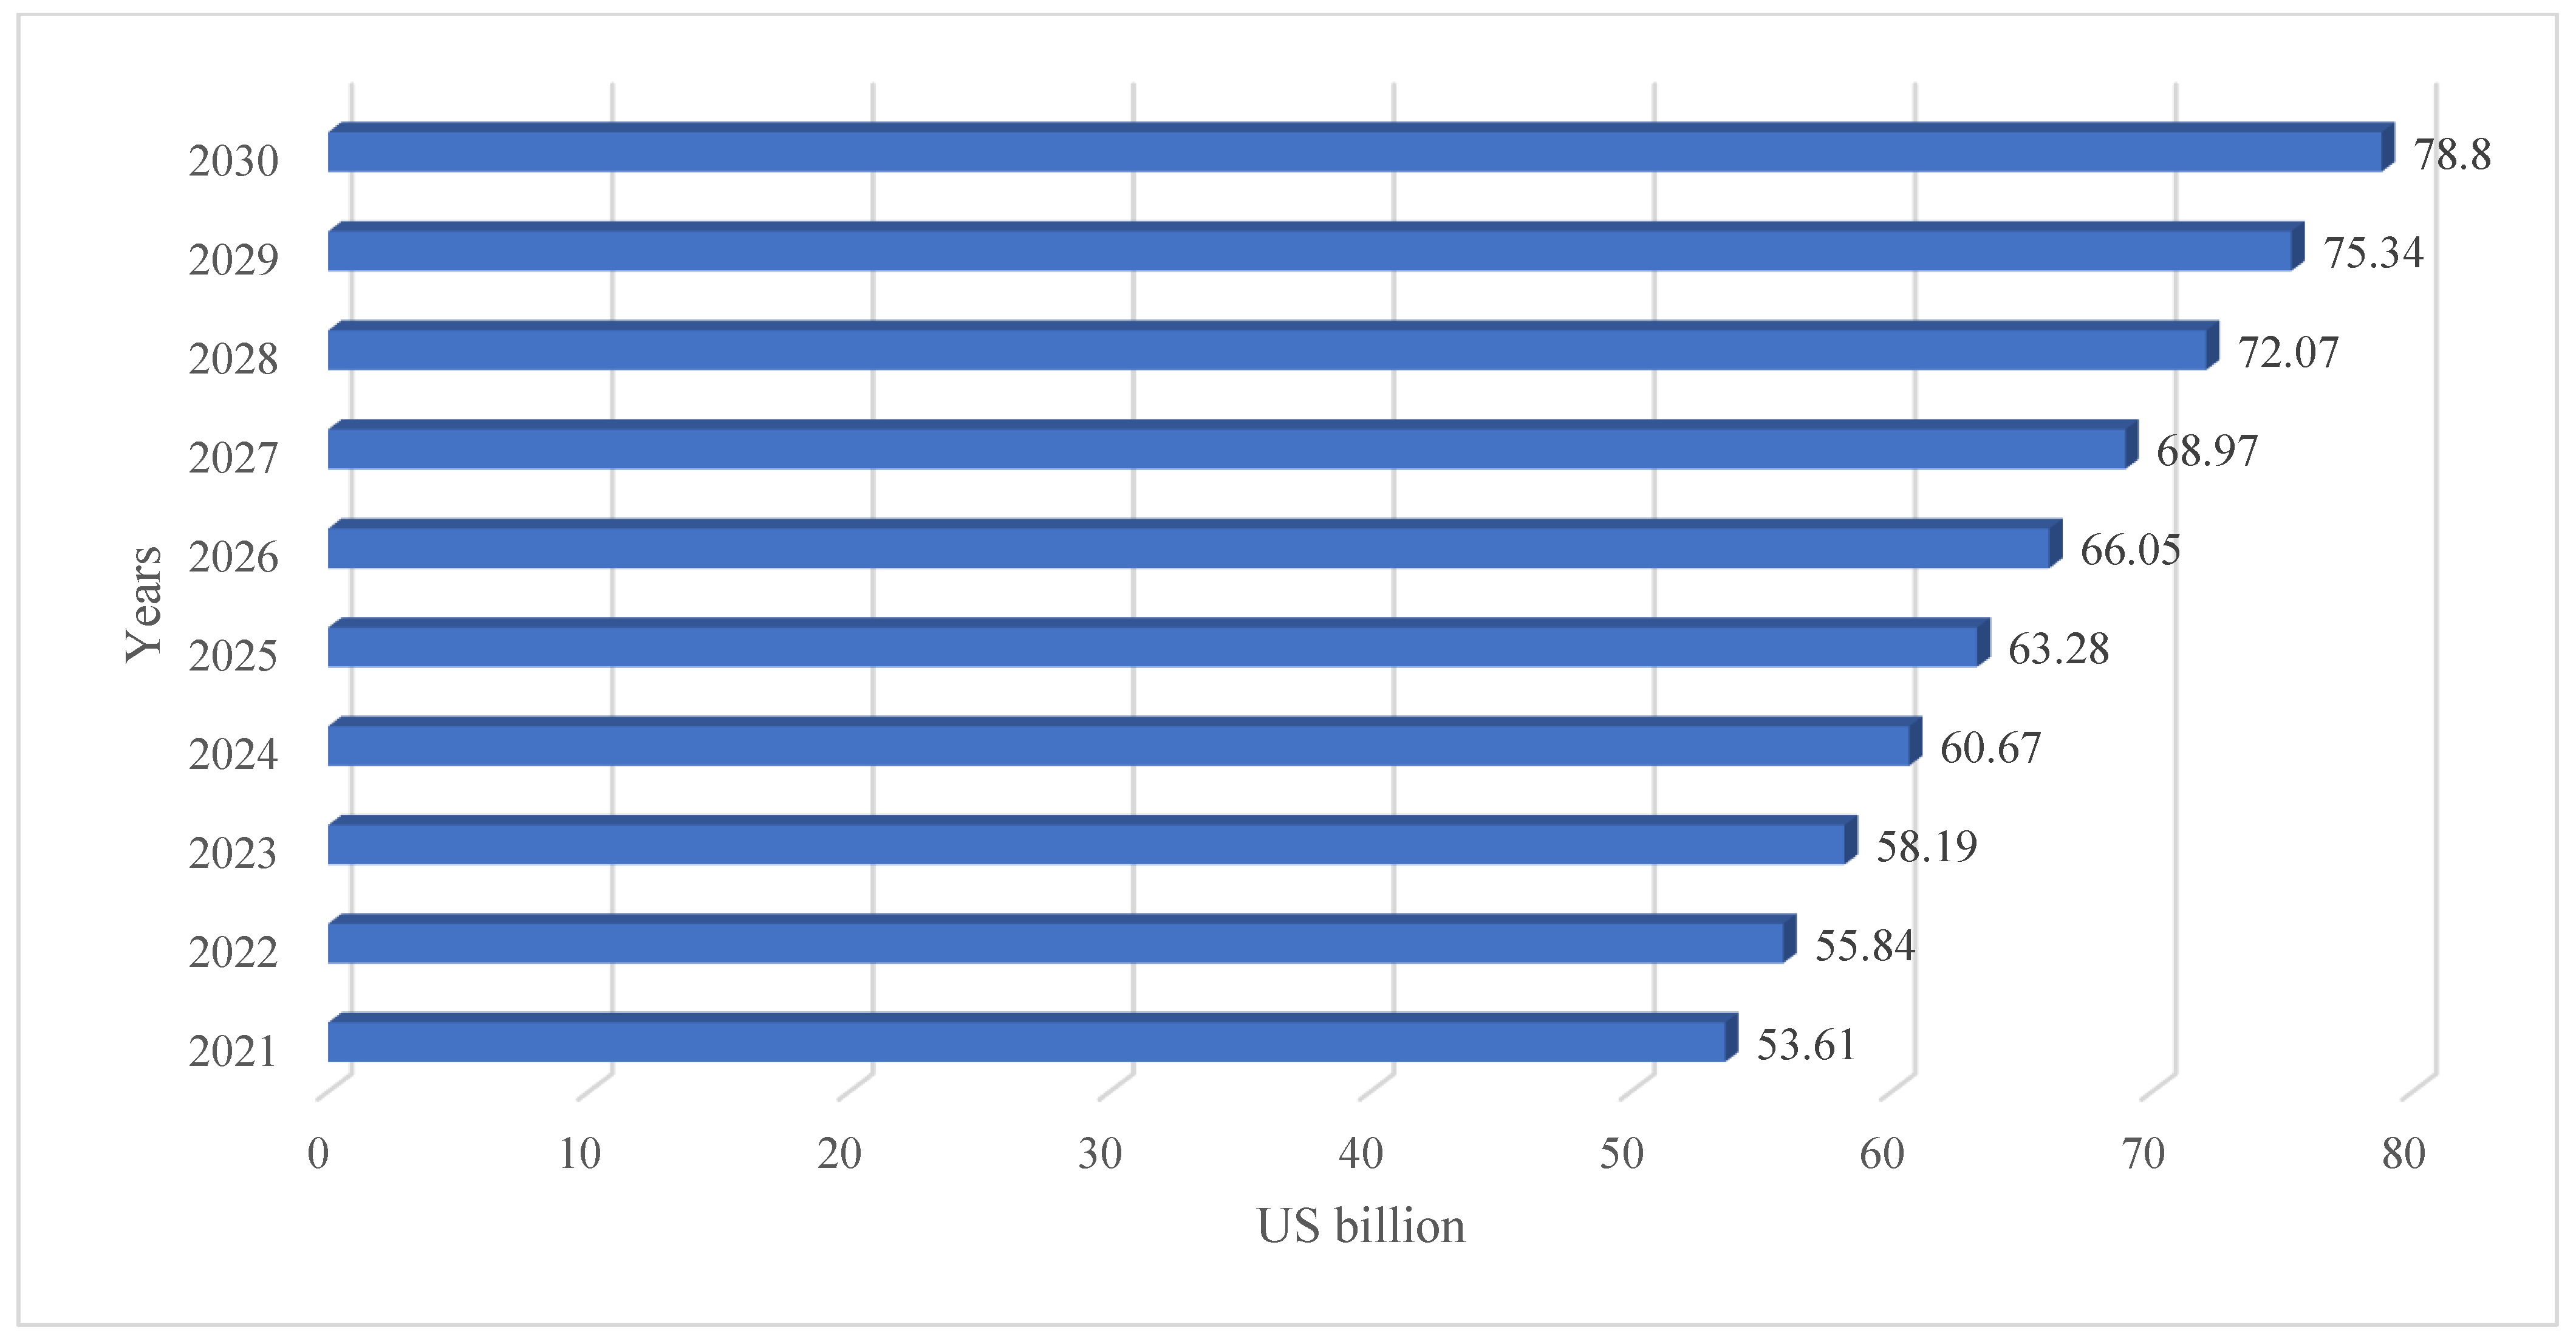
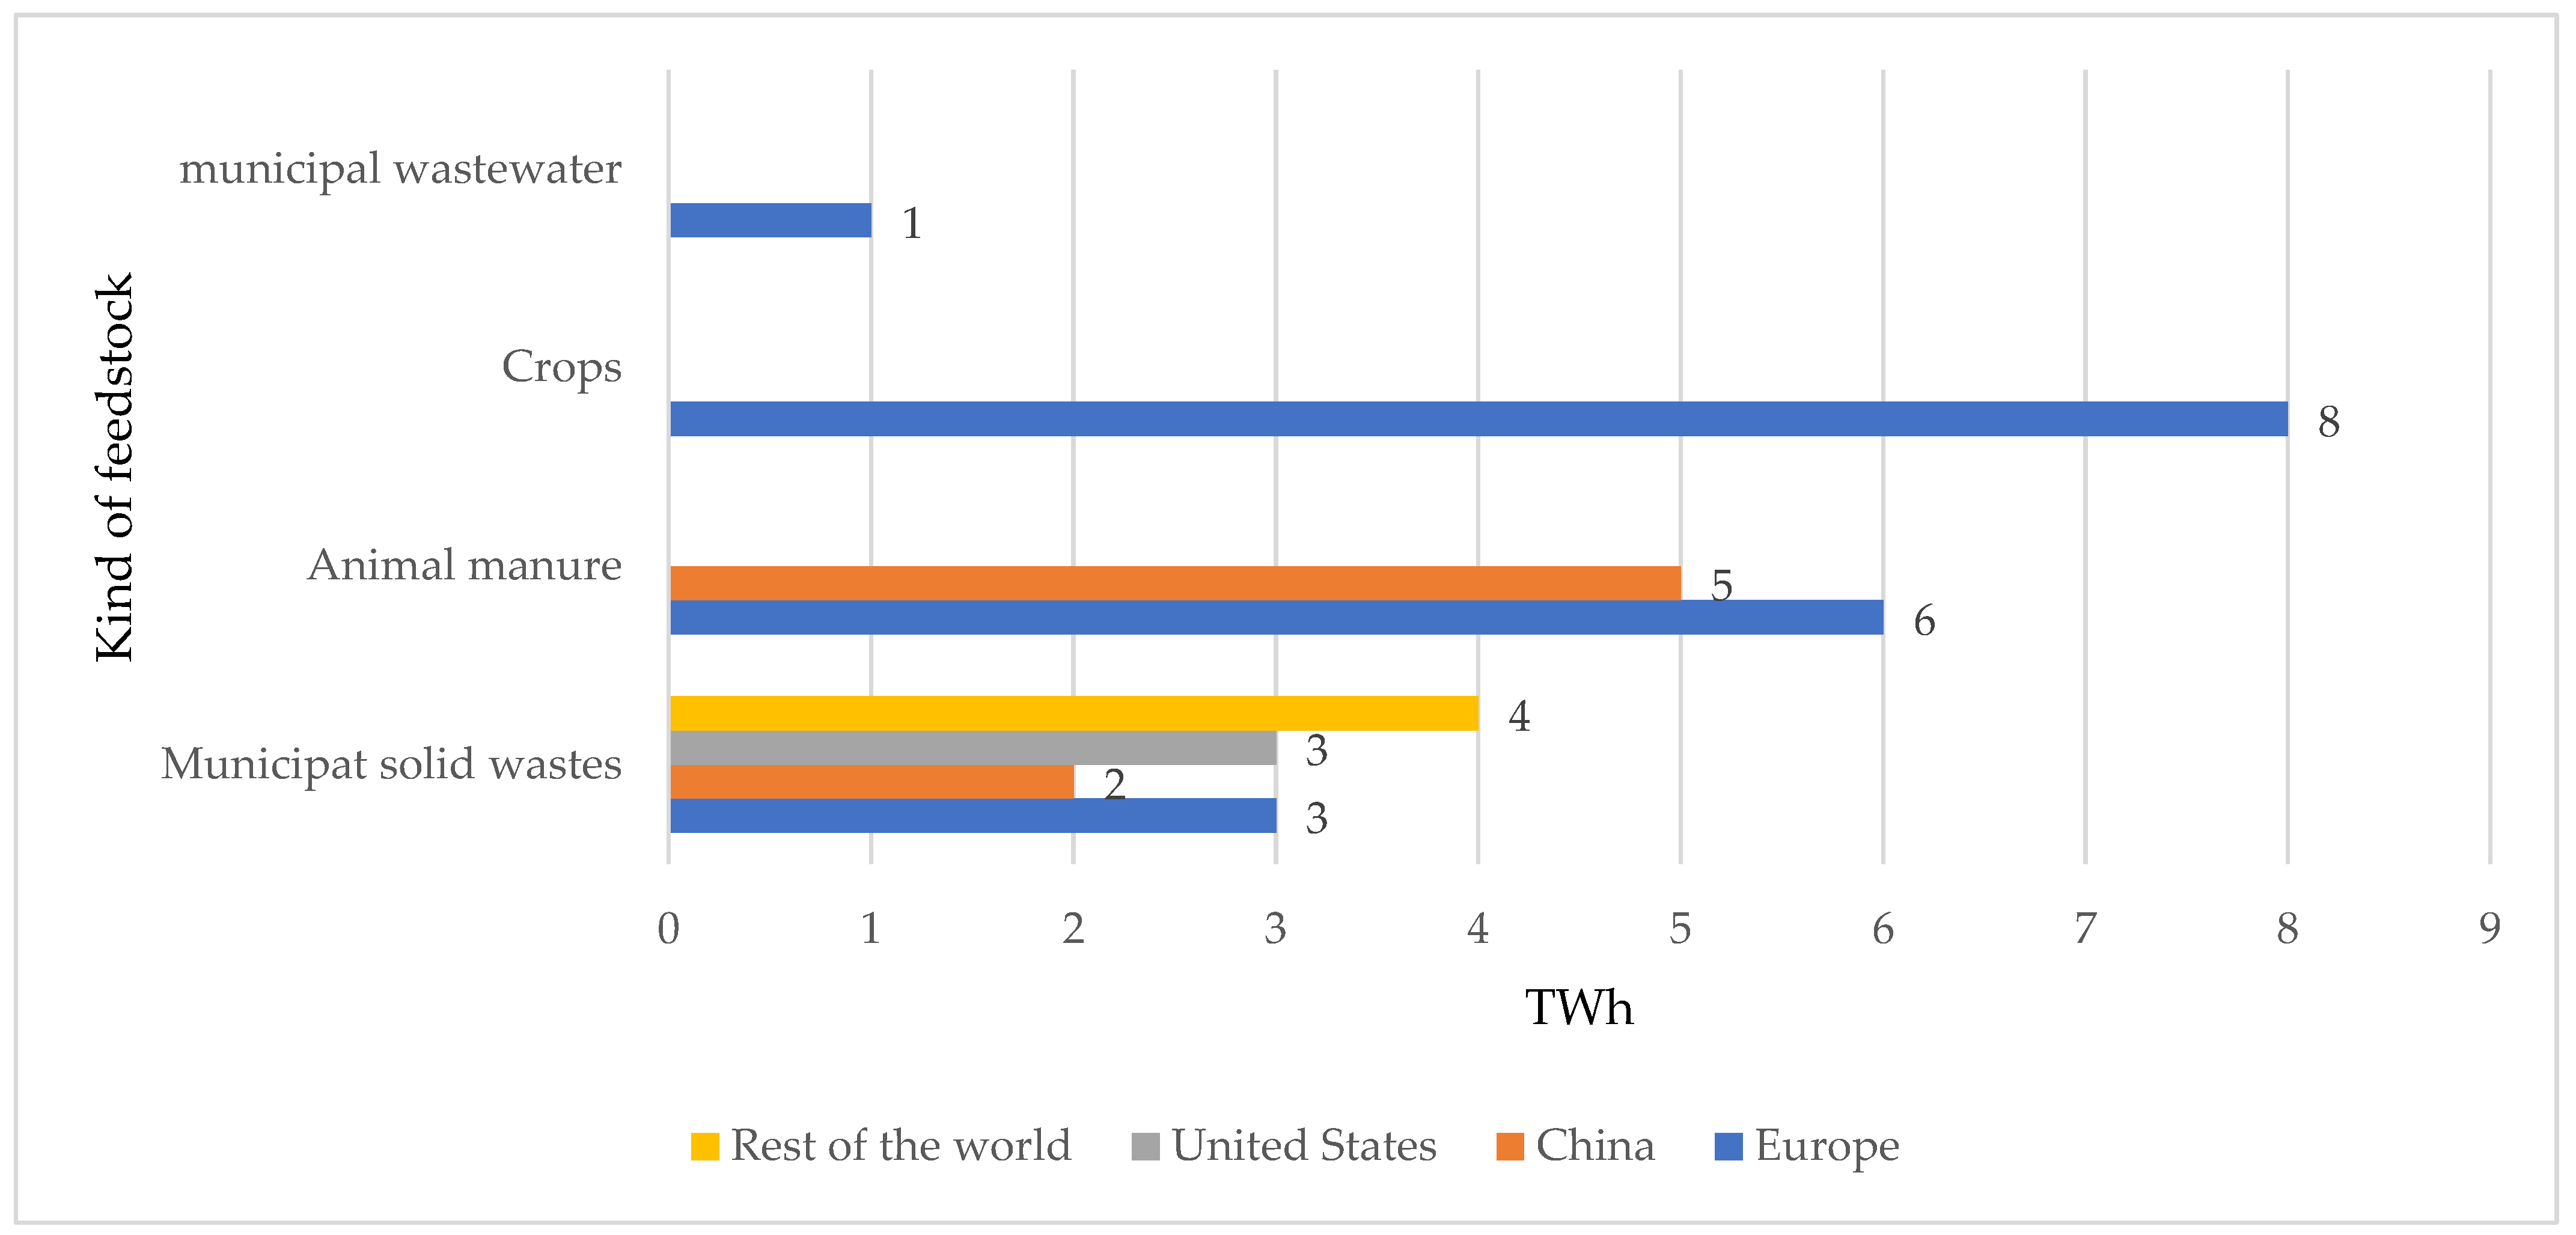
3.1. Biogas Production in the World
3.2. Stationarity and Prognosis for Global Biogas Production
3.3. Descriptive Statistics of Electricity Production from Biogas in EU Countries in 2012–2021
3.4. Prognosis of Electricity Production from Biogas in EU Countries in 2022–2026
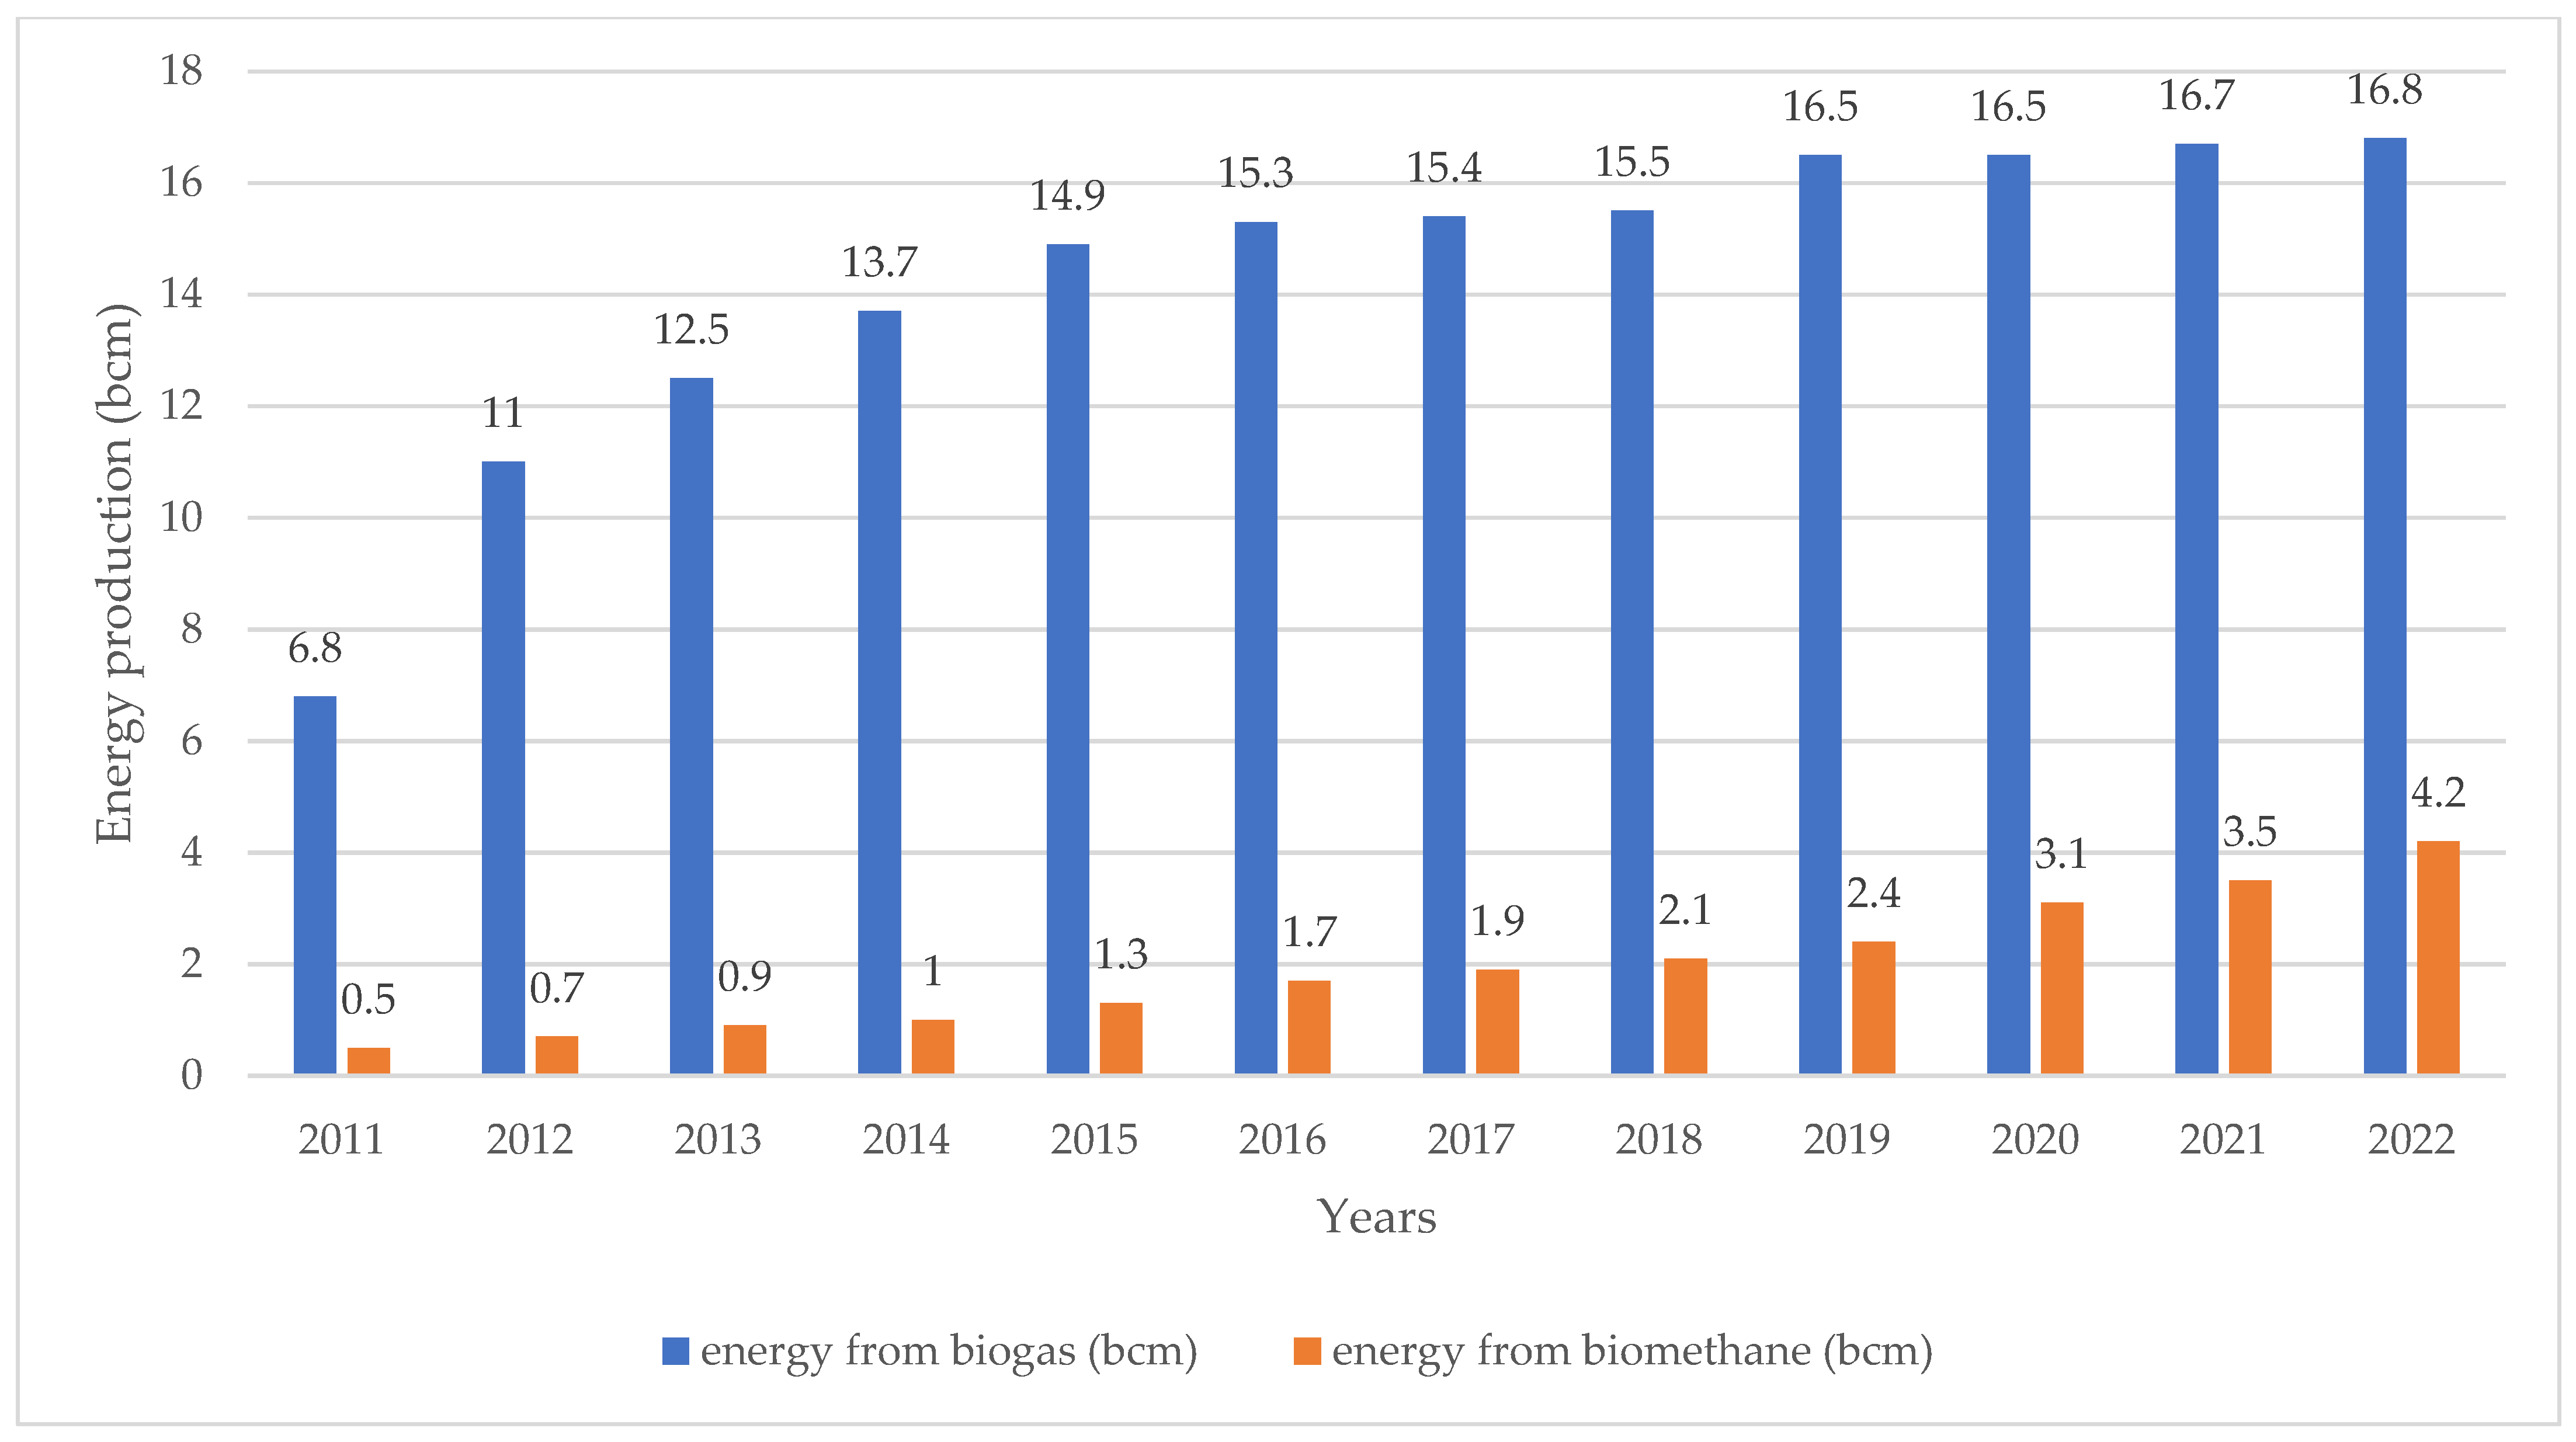
3.5. Hydrogen, Biomethane and Green Methanol Production in the EU
3.6. Biogas Consumption in the EU
4. Discussion
5. Conclusions
Author Contributions
Funding
Data Availability Statement
Conflicts of Interest
Nomenclature
| AD | Anaerobic digestion |
| ARiMA | Autoregressive Moving Average |
| BBI | Biobased Industries |
| BCM | Billion cubic meters |
| C | Carbon |
| CH4 | Methane |
| CO2 | Carbon dioxide |
| EC | European Commission |
| EU | European Union |
| GDP | Gross Domestic Product |
| GHG | Greenhouse gas |
| GW | Giga Watt |
| H2 | Hydrogen |
| MG | Megagram |
| M3 | Cubic meter |
| NOx | Nitrogen oxides |
| NH4 | Ammonium |
| O2 | Oxygen |
| PPP | Public–private partnership |
| RED | Renewable Energy Directive |
| RES | Renewable energy sources |
| T | Ton |
| USA | United States of America |
| USD | United States Dollar |
References
- Noorollahi, N.; Kheirrouz, M.; Asi, H.F.; Yousefi, H.; Hajinezhad, A. Biogas production potential from livestock manure in Iran. Renew. Sustain. Energy Rev. 2015, 50, 748–754. [Google Scholar] [CrossRef]
- Sikora, J.; Stawowski, W.; Woźniak, A.; Zemanek, J. Determining the amount of biogas derived from various municipal wastes. Infrastruct. Ecol. Rural. Areas 2008, 8, 169–178. [Google Scholar]
- Plugge, C.M. Biogas. Microb. Biotechnol. 2017, 10, 1128–1130. [Google Scholar] [CrossRef]
- Kougias, P.G.; Angelidaki, I. Biogas and its opportunities—A review. Front. Environ. Sci. Eng. 2018, 12, 3. [Google Scholar] [CrossRef]
- Chávez-Fuentes, J.J.; Capobianco, A.; Barbušová, J.; Hutňan, M. Manure from our agricultural animals: A quantitative and qualitative analysis focused on biogas production. Waste Biomass Valor 2017, 8, 1749–1757. [Google Scholar] [CrossRef]
- Rasi, S.; Veijanen, A.; Rintala, J. Trace compounds of biogas from different biogas production plants. Energy 2007, 32, 1375–1380. [Google Scholar] [CrossRef]
- Alhassan, K.A.; Abdullahi, B.T.; Shah, M.M. A review on biogas production as the alternative source of fuel. J. Appl. Adv. Res. 2019, 4, 61–65. Available online: https://www.researchgate.net/profile/Mohammad-Shah-33/publication/331473386_A_review_on_biogas_production_as_the_alternative_source_of_fuel/links/5c7ad9b0299bf1268d333993/A-review-on-biogas-production-as-the-alternative-source-of-fuel.pdf (accessed on 1 March 2023). [CrossRef]
- Hamelin, L.; Møller, H.B.; Jørgensen, U. Harnessing the full potential of biomethane towards tomorrow’s bioeconomy: A national case study coupling sustainable agricultural intensification, emerging biogas technologies and energy system analysis. Renew. Sustain. Energy Rev. 2021, 138, 110506. [Google Scholar] [CrossRef]
- Yu, Q.; Liu, R.; Li, R.; Ma, R. A review of crop straw pretreatment methods for biogas production by anaerobic digestion in China. Renew. Sustain. Energy Rev. 2019, 107, 51–58. [Google Scholar] [CrossRef]
- Scarlat, N.; Dallemand, J.F.; Fahl, F. Biogas: Developments and perspectives in Europe. Renew. Energy 2018, 129, 457–472. [Google Scholar] [CrossRef]
- Dagnall, S.; Hill, J.; Pegg, D. Resource mapping and analysis of farm livestock manure– assessing the opportunities for biomass-to-energy schemes. Bioresour. Technol. 2000, 71, 225–234. [Google Scholar] [CrossRef]
- Moeller, H.B.; Sommer, S.G.; Ahring, B.K. Methane productivity of manure, straw, and solid fractions of manure. Biomass Bioenergy 2004, 26, 485–495. [Google Scholar] [CrossRef]
- Demirbas, A.; Taylan, O.; Kaya, D. Biogas production from municipal sewage sludge (MSS). Energy Resour. Part A Recovery Util. Environ. Eff. 2016, 38, 3027–3033. [Google Scholar] [CrossRef]
- Salihu, A.; Alam, M.Z. Pretreatment methods of organic wastes for biogas production. J. Appl. Sci. 2016, 16, 124–137. [Google Scholar] [CrossRef]
- Patinvoh, R.J.; Osadolor, O.A.; Chandolias, K.; Horváth, I.S.; Taherzadeh, M.J. Innovative pretreatment strategies for biogas production. Bioresour. Technol. 2017, 224, 13–24. [Google Scholar] [CrossRef]
- Yang, S.; Liu, Y.; Wu, N.; Zhang, Y.; Svoronos, S.; Pullammanappallil, P.P. Low-cost, Arduino-based, portable device for measurement of methane composition in biogas. Renew. Energy 2019, 138, 224–229. [Google Scholar] [CrossRef]
- Scarlat, N.; Fahl, F.; Dallemand, J.F.; Monforti, F.; Motola, V. A spatial analysis of biogas potential from manure in Europe. Renew. Sustain. Energy Rev. 2018, 94, 915–930. [Google Scholar] [CrossRef]
- COM. 15 Final. A Policy Framework for Climate and Energy in the Period from 2020 to 2030. Communication to the Commissions to the European Parliament. 2014. Available online: http://refhub.elsevier.com/S0960-1481(18)30301-X/sref17 (accessed on 1 March 2023).
- Lainez, M.; González, J.M.; Aguilar, A.; Vela, C. Spanish strategy on bioeconomy: Towards a knowledge based sustainable innovation. New Bioeconomy 2018, 40, 87–95. [Google Scholar] [CrossRef] [PubMed]
- 013/743/EU: Council Decision of 3 December 2013 Establishing the Specific Programme Implementing Horizon 2020—The Framework Programme for Research and Innovation (2014–2020) and Repealing Decisions. Available online: https://eur-lex.europa.eu/legal-content/EN/ALL/?uri=celex%3A32013D0743 (accessed on 1 March 2023).
- EPSO. The European Bioeconomy in 2030: Delivering Sustainable Growth by Addressing the Grand Societal Challenges; European Plant Science Organization, 2011; Available online: http://www.europabio.org/EU%20Projects/bioeconomy-2030-becoteps-final-white-paper.pdf (accessed on 15 July 2016).
- Countries-Leaders in the Production of Biomethane. Available online: https://uabio.org/en/materials/analytics/14227/ (accessed on 5 January 2024).
- WBA. WBA Global Bioenergy Statistics 2019. Available online: https://www.worldbioenergy.org/uploads/191129%20WBA%20GBS%202019_HQ.pdf (accessed on 5 January 2024).
- Bremond, U.; Bertrandias, A.; Steyer, J.-P.; Bernet, N.; Carrère, H. A vision of European biogas sector development towards 2030: Trends and challenges. J. Clean. Prod. 2021, 287, 125065. [Google Scholar] [CrossRef]
- McCormick, K.; Kautto, N. The bioeconomy in Europe: An overview. Sustainability 2013, 5, 2589–2608. [Google Scholar] [CrossRef]
- Staffas, L.; Gustavsson, M.; McCormick, K. Strategies and policies for the bioeconomy and bio-based economy: An analysis of official national approaches. Sustainability 2013, 5, 2751–2769. [Google Scholar] [CrossRef]
- Ollikainen, M. Forestry in bioeconomy—Smart green growth for the humankind. Scand. J. For. Res. 2014, 29, 360–366. [Google Scholar] [CrossRef]
- Abanades, S.; Abbaspour, H.; Ahmadi, A.; Das, B.; Whyaei, M.A.; Esmaeilion, F.; Haj Assad, M.; Hajilounezhad, T.; Jamali, D.H.; Hmida, A.; et al. A critical review of biogas production and usage with legislations framework across the globe. Int. J. Environ. Sci. Technol. 2022, 19, 3377–3400. [Google Scholar] [CrossRef] [PubMed]
- Lubaek, R.; Kjaer, T. Biogas Technology as an “Engine” for facilitating circular bioeconomy in Denmark—The case of Lolland&Falster Municipalities within region Zealand. Front. Energy Res. 2021, 9, 695685. [Google Scholar] [CrossRef]
- Tasmaganbetov, A.B.; Ataniyazov, Z.; Basshieva, Z.; Muhammedov, A.U.; Yessangeldina, A. World practice of using biogas as alternative energy. Int. J. Energy Econ. Policy 2020, 10, 348–352. [Google Scholar] [CrossRef]
- European Commission 2012. The EU. Climate and Energy Package. Available online: https://www.eea.europa.eu/en/analysis/indicators/primary-and-final-energy-consumption (accessed on 1 March 2023).
- Murray, B.C.; Galik, C.S.; Vegh, T. Biogas in the United States: Estimating future production and learning from international experiences. Mitig. Adapt. Strateg. Glob. Chang. 2017, 22, 485–501. [Google Scholar] [CrossRef]
- Available online: https://www.precedenceresearch.com/biogas-market (accessed on 21 February 2023).
- IEA. Available online: https://www.iea.org/reports/outlook-for-biogas-and-biomethane-prospects-for-organic-growth/an-introduction-to-biogas-and-biomethane (accessed on 21 February 2023).
- Mustafi, N.N.; Agarwal, A.K. Biogas for Transport Sector: Current Status, Barriers, and Path Forward for Large-Scale Adaptation. In Alternative Fuels and Their Utilization Strategies in Internal Combustion Engines; Singh, A., Sharma, Y., Mustafi, N., Agarwal, A., Eds.; Energy, Environment, and Sustainability; Springer: Singapore, 2020. [Google Scholar] [CrossRef]
- IRENA. Biogas for Road Vehicles: Technology Brief; International Renewable Energy Agency: Abu Dhabi, United Arab Emirates, 2018; Available online: https://www.irena.org/-/media/Files/IRENA/Agency/Publication/2017/Mar/IRENA_Biogas_for_Road_Vehicles_2017.pdf (accessed on 21 February 2023).
- Yoo, M.; Han, S.-J.; Wee, J.H. Carbon dioxide capture capacity of sodium hydroxide aqueous solution. J. Environ. Manag. 2003, 114, 512–519. [Google Scholar] [CrossRef]
- Nevzorova, T.; Kutcheroy, V. Barriers to the wider implementation of biogas as a source of energy: A state-of-the-art review. Energy Strategy Rev. 2019, 26, 100414. [Google Scholar] [CrossRef]
- Alam Hossain Mondal, J.M.; Kamp, L.M.; Pachova, N.I. Drivers, barriers, and strategies for implementation of renewable energy technologies in rural areas in Bangladesh-An innovation system analysis. Energy Policy 2010, 38, 4626–4634. [Google Scholar] [CrossRef]
- Valerio, P.; Francesco, P.; Marco, S.; Laura, T.; Nour, N.; Angelo, C. Environmental impact of biogas: A short review of current knowledge. J. Environ. Sci. Health Part A 2018, 53, 899–906. [Google Scholar] [CrossRef]
- Thiangchanta, S.; Khiewwijit, R.; Mon, Y. Environmental impact of the biogas production from dairy cows. 7th International Conference on Advances on Clean Energy Research, ICACER 2022 April 20–22, 2022, Barcelona, Spain. Energy Rep. 2022, 8 (Suppl. 16), 290–295. [Google Scholar] [CrossRef]
- Werkneh, A.A. Biogas impurities: Environmental and health implications, removal technologies and future perspectives. Heliyon 2022, 8, e10929. [Google Scholar] [CrossRef] [PubMed]
- Paglini, R.; Gandiglio, M.; Lanzini, A. Technologies for Deep Biogas Purification and Use in Zero-Emission Fuel Cells Systems. Energies 2022, 15, 3551. [Google Scholar] [CrossRef]
- Papurello, D.; Silvestri, S.; Tomasi, L.; Belcari, I.; Biasioli, F.; Santarelli, M. Biowaste for SOFCs. Energy Procedia 2016, 101, 424–431. [Google Scholar] [CrossRef]
- Herrmann, A. Biogas production from maize: Current state, challenges and prospects. 2. Agronomic and environmental aspects. BioEnergy Res. 2013, 6, 372–387. [Google Scholar] [CrossRef]
- Jung, S.; Lee, J.; Moon, D.H.; Kim, K.-H.; Kwon, E.E. Upgrading biogas into syngas through dry reforming. Renew. Sustain. Energy Rev. 2021, 143, 110949. [Google Scholar] [CrossRef]
- Stürmer, B.; Theuretzbacher, F.; Saracevic, E. Opportunities for the integration of existing biogas plants into the Austrian electricity market. Renew. Sustain. Energy Rev. 2021, 138, 110548. [Google Scholar] [CrossRef]
- Hewitt, J.; Holden, M.; Robinson, B.L.; Jewitt, S.; Clifford, M.J. Not quite cooking on gas: Understanding biogas plant failure and abandonment in Northern Tanzania. Renew. Sustain. Energy Rev. 2022, 165, 112600. [Google Scholar] [CrossRef]
- Maranon, E.; Salter, A.M.; Castrillon, L.; Heaven, S.; Fernandez-Nova, Y. Reducing the environmental impact on methane emission from dairy farms by anaerobic digestion of cattle waste. Waste Manag. 2011, 31, 1745–1751. [Google Scholar] [CrossRef]
- Novak, S.M.; Fiorelli, J.L. Greenhouse gases and ammonia emissions from organic mixed crop-dairy systems: A critical review of mitigation options. Agron. Sustain. Dev. 2010, 30, 215–236. [Google Scholar] [CrossRef]
- Act of August 19, 2011 Amending the Energy Law and Some Other Acts, Journal of Laws No. 205, Item 1208. Available online: https://isap.sejm.gov.pl/isap.nsf/DocDetails.xsp?id=WDU20112051208 (accessed on 1 March 2023). (In Polish)
- Curkowski, A. Biogaz Rolniczy—Produkcja i Wykorzystanie MAE Sp.z.o.o., 2009. Available online: http://www.mae.com.pl/files/5_biogaz-rolniczy_farma_sobotkak.pdf (accessed on 26 March 2023).
- Maczyszyn, B. Małe Biogazownie Rolnicze—Mini Poradnik KRIR. 2010. Available online: https://cdr.gov.pl/images/wydawnictwa/2013/2013-ODNAWIALNE-ZRODLA-ENERGII-W-GOSPODARSTWACH-ROLNYCH.pdf (accessed on 26 March 2023).
- Renewable Energy Directive (2009/28/EC). Available online: https://www.fao.org/faolex/results/details/en/c/LEX-FAOC088009 (accessed on 27 January 2024).
- Directive on Waste Recycling and Recovery (2008/98/EC). Available online: https://eur-lex.europa.eu/legal-content/EN/TXT/PDF/?uri=CELEX:02008L0098-20180705&from=SV (accessed on 27 January 2024).
- Directive on Landfills (1999/31/EC). Available online: https://archive.epa.gov/epawaste/nonhaz/municipal/web/pdf/wte-euro.pdf (accessed on 27 January 2024).
- Kozyra, J. Nowe Wyzwania dla Rolnictwa w Dobie Zmian Klimatu” IUNG PuławyMinisterstwo Gospodarki (2011 r.) „Przewodnik dla Inwestorów Zainteresowanych Budową Biogazowni Rolniczych”. Available online: https://www.cdr.gov.pl/images/Radom/pliki/oze/243E%20BIOGAZOWNIE%20ROLNICZE.pdf (accessed on 26 March 2023).
- Horváth, I.S.; Tabatabaei, M.; Karimi, K.; Kumar, R. Recent updates on biogas production—A review. Biofuel Res. J. 2016, 10, 394–402. [Google Scholar] [CrossRef]
- Eurostat. Available online: https://ec.europa.eu/eurostat/databrowser/view/NRG_BAL_PEH__custom_4565358/default/table?lang=e (accessed on 27 January 2024).
- European Parliament; Council of the European Union. Directive 2008/98/EC of the European Parliament and of the Council of 19 November 2008 on Waste Brussels, 2008. Available online: https://eur-lex.europa.eu/legal-content/EN/TXT/?uri=celex%3A32008L0098 (accessed on 1 March 2023).
- European Parliament; Council of the European Union. Directive 91/156/EEC of 18 March 1991 Amending Directive 75/442/EEC on Waste Brussels, 1991. Available online: https://eur-lex.europa.eu/legal-content/EN/ALL/?uri=celex%3A31991L0156 (accessed on 2 January 2024).
- Commission Of The European Communities—EU. Regulation Amending Annexes VI and VIII to Regulation (EC) No 1774/2002 of the EU Parliament and of the Council as Regards Processing Standards for Biogas and Composting Plants and Requirements for Manure EU Commission Regulation 208/2006; Brussels, Belgium, 2006; Available online: https://eur-lex.europa.eu/legal-content/EN/TXT/PDF/?uri=CELEX:32006R0208&from=SK (accessed on 27 January 2024).
- Brownlee, J. How to Create an ARIMA Model for Time Series Forecasting in Python, Machine Learning Mastery. Available online: https://machinelearningmastery.com/arima-for-time-series-forecasting-with-python/ (accessed on 27 January 2024).
- Dittmann, I.; Dittmann, P.; Szabela-Pasierbińska, E.; Szpulak, A. Prognozowanie w Zarządzaniu Sprzedażą i Finansami Przedsiębiorstwa; Wolters Kluwer: Alphen aan den Rijn, The Netherlands, 2011. [Google Scholar]
- Fattah, J.; Ezzine, L.; Aman, Z.; Moussami, H.E.; Lachhab, A. Forecasting of demand using ARIMA model. Int. J. Eng. Bus. Manag. 2018, 10, 1–9. [Google Scholar] [CrossRef]
- Dickey, D.A.; Fuller, W.A. Distribution of the Estimators for Autoregressive Time Series with a Unit Root. J. Am. Stat. Assoc. 1979, 74, 427–431. [Google Scholar]
- Ozturk, S.; Ozturk, F. Forecasting energy consumption of Turkey by ARIMA model. J. Asian Sci. Res. 2018, 8, 82. [Google Scholar] [CrossRef]
- Khan, F.M.; Gupta, R. ARIMA and NAR based prediction model for time series analysis of COVID-19 cases in India. J. Saf. Sci. 2020, 1, 12–18. [Google Scholar] [CrossRef]
- Bórawski, P.; Guth, M.; Truszkowski, W.; Zuzek, D.; Bełdycka-Bórawska, A.; Mickiewicz, B.; Szymańska, E.J.; Harper, J.K.; Dunn, J.W. Milk price changes in Poland in the context of the Common Agricultural Policy. Agric. Econ. Czech 2020, 66, 19–26. [Google Scholar] [CrossRef]
- Box, G.E.P.; Jenkins, G. Time Series Analysis, Forecasting and Control; Holden-Day: San Francisco, CA, USA, 1970. [Google Scholar]
- Kashpruk, N. Identyfikacja i prognozowanie szeregów czasowych na przykładzie modeli Boxa–Jenkinsa. In Nauka–Technika–Technologia, Tom 1; 2021; pp. 91–100. Available online: https://winntbg.bg.agh.edu.pl/skrypty4/0591/NTT_tom1_091.pdf (accessed on 27 January 2024).
- Żurek Ziółkowski, J.; Borucka, A. Research of automotive vehicles operation process using the Markov model, Safety and Reliability. In Proceedings of the Theory and Applications, ESREL, Portorož, Slovenia, 18–22 June 2017; pp. 2353–2362. [Google Scholar]
- European Parliament. Resolution on Sustainable Agriculture and Biogas: A Need of Review of the EU Legislation; Committee on the Environment, Public Health and Food Safety: Brussels, Belgium, 2008. [Google Scholar]
- GLOBAL BIOENERGY STATISTICS. World Bioenergy Association. 2020. Available online: https://www.google.com/url?sa=t&rct=j&q=&esrc=s&source=web&cd=&cad=rja&uact=8&ved=2ahUKEwiyrvCOpYX9AhX_S_EDHcF9CKcQFnoECAoQAQ&url=https%3A%2F%2Fwww.worldbioenergy.org%2Fuploads%2F201210%2520WBA%2520GBS%25202020.pdf&usg=AOvVaw1wSZN5RqQ7sWpVX9rbJywb (accessed on 27 January 2024).
- IEA 2020. Available online: https://www.iea.org/data-and-statistics/charts/biogas-production-by-region-and-by-feedstock-type-2018 (accessed on 27 January 2024).
- Yousuf, A.; Khan, M.R.; Pirozzi, D.; Ab Aahid, Z. Financial sustainability of biogas technology: Barrers, opportunities, and solutions. Energy Sources Part B Econ. Plan. Policy 2016, 11, 841–848. [Google Scholar] [CrossRef]
- Available online: https://www.terega.fr/en/lab/what-is-the-difference-between-biogas-and-biomethane (accessed on 1 March 2023).
- Outlook for Biogas and Biomethane: Prospects for Organic Growth; World Energy Outlook Special Report; IEA: Paris, France, 2020; Available online: https://www.iea.org/reports/outlook-for-biogas-and-biomethane-prospects-for-organic-growth/the-outlook-for-biogas-and-biomethane-to-2040 (accessed on 24 January 2024).
- JRamos-Suárez, J.L.; Ritter, A.; González, J.M.; Pérez, A.C. Biogas from animal manure: A sustainable energy opportunity in the Canary Islands. Renew. Sustain. Energy Rev. 2019, 104, 137–150. [Google Scholar] [CrossRef]
- Yücenur, G.N.; Çaylak, S.; Gönül, G.; Postalcioğlu, M. An integrated solution with SWARA&COPRAS methods in renewable energy production: City selection for biogas facility. Renew. Energy 2020, 145, 2587–2597. [Google Scholar] [CrossRef]
- Al Seadi, T.; Rutz, D.; Prassl, H.; Köttner, M.; Finsterwalder, T.; Volk, S.; Janssen, R. Biogas Handbook; University of Southern Denmark: Esbjerg, Denmark, 2008. [Google Scholar]
- Maciejczak, M. Bioeconomy as a complex adaptive system of sustainable development. J. Int. Bus. Res. Mark. 2017, 2, 7–10. [Google Scholar] [CrossRef]
- Pieri, E.; Kyprianou, A.; Phinikarides, A.; Makrides, G.; Georghiou, G.E. Forecasting degradation rates of different photovoltaic systems using robust principal component analysis and ARIMA. IET Renew. Power Gener. 2017, 11, 1245–1252. [Google Scholar] [CrossRef]
- Phinikarides, A.; Makrides, G.; Kindyni, N.; Kyprianou, A.; Georghiou, G.E. ARIMA modeling of the performance of different photovoltaic technologies. In Proceedings of the Conference Record of the IEEE Photovoltaic Specialists Conference, Tampa, FL, USA, 16–21 June 2013; pp. 797–801. [Google Scholar] [CrossRef]
- Wan, C.; Zhao, J.; Song, Y.; Xu, Z.; Lin, J.; Hu, Z. Photovoltaic and solar power forecasting for smart grid energy management. CSEE J. Power Energy Syst. 2015, 1, 38–46. [Google Scholar] [CrossRef]
- Phinikarides, A.; Makrides, G.; Zinsser, B.; Schubert, M.; Georghiou, G.E. Analysis of photovoltaic system performance time series: Seasonality and performance loss. Renew. Energy 2015, 77, 51–63. [Google Scholar] [CrossRef]
- Lindig, S.; Kaaya, I.; Weiss, K.-A.; Moser, D.; Topic, M. Review of statistical and analytical degradation models for photovoltaic modules and systems as well as related improvements. IEEE J. Photovolt. 2018, 8, 1773–1786. [Google Scholar] [CrossRef]
- Sharagda, H.; Hajimirza, S.; Balog, R.S. Time series forecasting of solar power generation for large-scale photovoltaic plants. Renew. Energy 2020, 150, 797–807. [Google Scholar] [CrossRef]
- Vidola-Barrero, F.; Baena-Moreno, F.; Preciado-Cárdenas, C.; Villanueva-Perales, Á.; Reina, T.R. Hydrogen production from landfill biogas: Profitability analysis of a real case study. Fuel 2022, 324, 124438. [Google Scholar] [CrossRef]
- Hrycak, B.; Mizeraczyk, J.; Czylkowski, D.; Dors, M.; Budnarowska, M.; Jasiński, M. Hydrogen production by the steam reforming of synthetic biogas in atmospheric-pressure microwave (915 M Hz) plasma. Sci. Rep. 2023, 13, 2204. [Google Scholar] [CrossRef] [PubMed]
- Kumar, R.; Kumar, A.; Pal, A. Hydrogen Production from Biogas: Methods and Economic Analysis. Available online: https://assets.researchsquare.com/files/rs-457836/v1/624beb21-1a29-4d05-b1f9-fb5a08736158.pdf?c=1631884212 (accessed on 27 January 2024).
- Available online: https://iea.blob.core.windows.net/assets/c5bc75b1-9e4d-460d-9056-6e8e626a11c4/GlobalHydrogenReview2022.pdf (accessed on 30 January 2024).
- Li, H.; Mehmood, D.; Thorin, E.; Yu, Z. Biomethane production via anaerobic digestion and biomass gasification. The 8th International Conference on Applied Energy—ICAE2016. Energy Procedia 2017, 105, 1172–1177. [Google Scholar] [CrossRef]
- Available online: https://www.euractiv.com/section/energy-environment/opinion/biomethane-production-up-20-in-2022-boosting-renewable-gas-ramp-up/ (accessed on 29 January 2024).
- Market State and Trends in Renewable and Low-Carbon Gases in Europe a Gas for Climate Report. December 2023. Available online: https://www.europeanbiogas.eu/wp-content/uploads/2021/12/Gas-for-Climate-Market-State-and-Trends-report-2021.pdf (accessed on 27 January 2024).
- Alotaibi, M.A.; Ud Din, I.; Alharthi, A.I.; Bakht, M.A.; Centi, G.; Shaharun, M.S.; Naeem, A. Green methanol synthesis by catalytic CO2 hydrogenation, deciphering the role of metal-metal interaction. Sustain. Chem. Pharm. 2021, 21, 100420. [Google Scholar] [CrossRef]
- Available online: https://bisresearch.com/industry-report/green-methanol-market.html (accessed on 30 January 2024).
- Available online: https://www.chemanalyst.com/industry-report/green-methanol-market-310 (accessed on 30 January 2024).
- Growth Potential. Available online: https://www.europeanbiogas.eu/benefits/#growth-potential (accessed on 5 January 2024).
- Geographical Analysis of Biomethane Potential and Costs in Europe in 2050. Biomethane: Potential and Cost in 2050.ENGIE 2023. Available online: https://www.engie.com/sites/default/files/assets/documents/2021-07/ENGIE_20210618_Biogas_potential_and_costs_in_2050_report_1.pdf (accessed on 27 January 2024).
- Eurostat. Available online: https://ec.europa.eu/eurostat/databrowser/view/nrg_cb_rw/default/table?lang=en (accessed on 27 January 2024).
- The Outlook for Biogas and Biomethane to 2040. Available online: https://www.iea.org/reports/outlook-for-biogas-and-biomethane-prospects-for-organic-growth/the-outlook-for-biogas-and-biomethane-to-2040 (accessed on 27 January 2024).
- Raboni, M.; Urbini, G. Production and use of biogas in Europe: A survey of current status and perspectives. An Interdisciplinary J. Appl. Sci. 2014, 9, 191–202. [Google Scholar] [CrossRef]
- Torrijos, M. State of Development of Biogas Production in Europe. International Conference on Solid Waste Management, 5IconSWM 2015. Procedia Environ. Sci. 2016, 35, 881–889. [Google Scholar] [CrossRef]
- Havrysh, V.; Kalinichenko, A.; Mentel, G.; Olejarz, T. Commercial Biogas Plants: Lessons for Ukraine. Energies 2020, 13, 2668. [Google Scholar] [CrossRef]


| EU Countries | 2012 | 2013 | 2014 | 2015 | 2016 | 2017 | 2018 | 2019 | 2020 | 2021 |
|---|---|---|---|---|---|---|---|---|---|---|
| European Union—27 countries (from 2020) | 3494.388 | 4056.994 | 4375.53 | 4626.114 | 4733.206 | 4784.927 | 4737.394 | 4728.44 | 4794.98 | 4523.057 |
| Euro area—19 countries (2015–2022) | 3260.716 | 3730.544 | 3998.977 | 4227.326 | 4307.372 | 4333.192 | 4279.138 | 4271.587 | 4319.059 | 4045.928 |
| Belgium | 57.051 | 66.518 | 74.936 | 82.494 | 85.408 | 80.671 | 81.23 | 81.41 | 87.24 | 83.947 |
| Bulgaria | 0.05 | 1.44 | 5.334 | 10.242 | 16.408 | 18.553 | 18.254 | 19.838 | 19.401 | 18.593 |
| Czechia | 126.198 | 197.213 | 222.129 | 224.502 | 222.616 | 226.936 | 224.179 | 217.376 | 223.254 | 222.939 |
| Denmark | 32.464 | 32.846 | 38.765 | 39.603 | 42.855 | 48.739 | 52.565 | 53.859 | 57.833 | 52.67 |
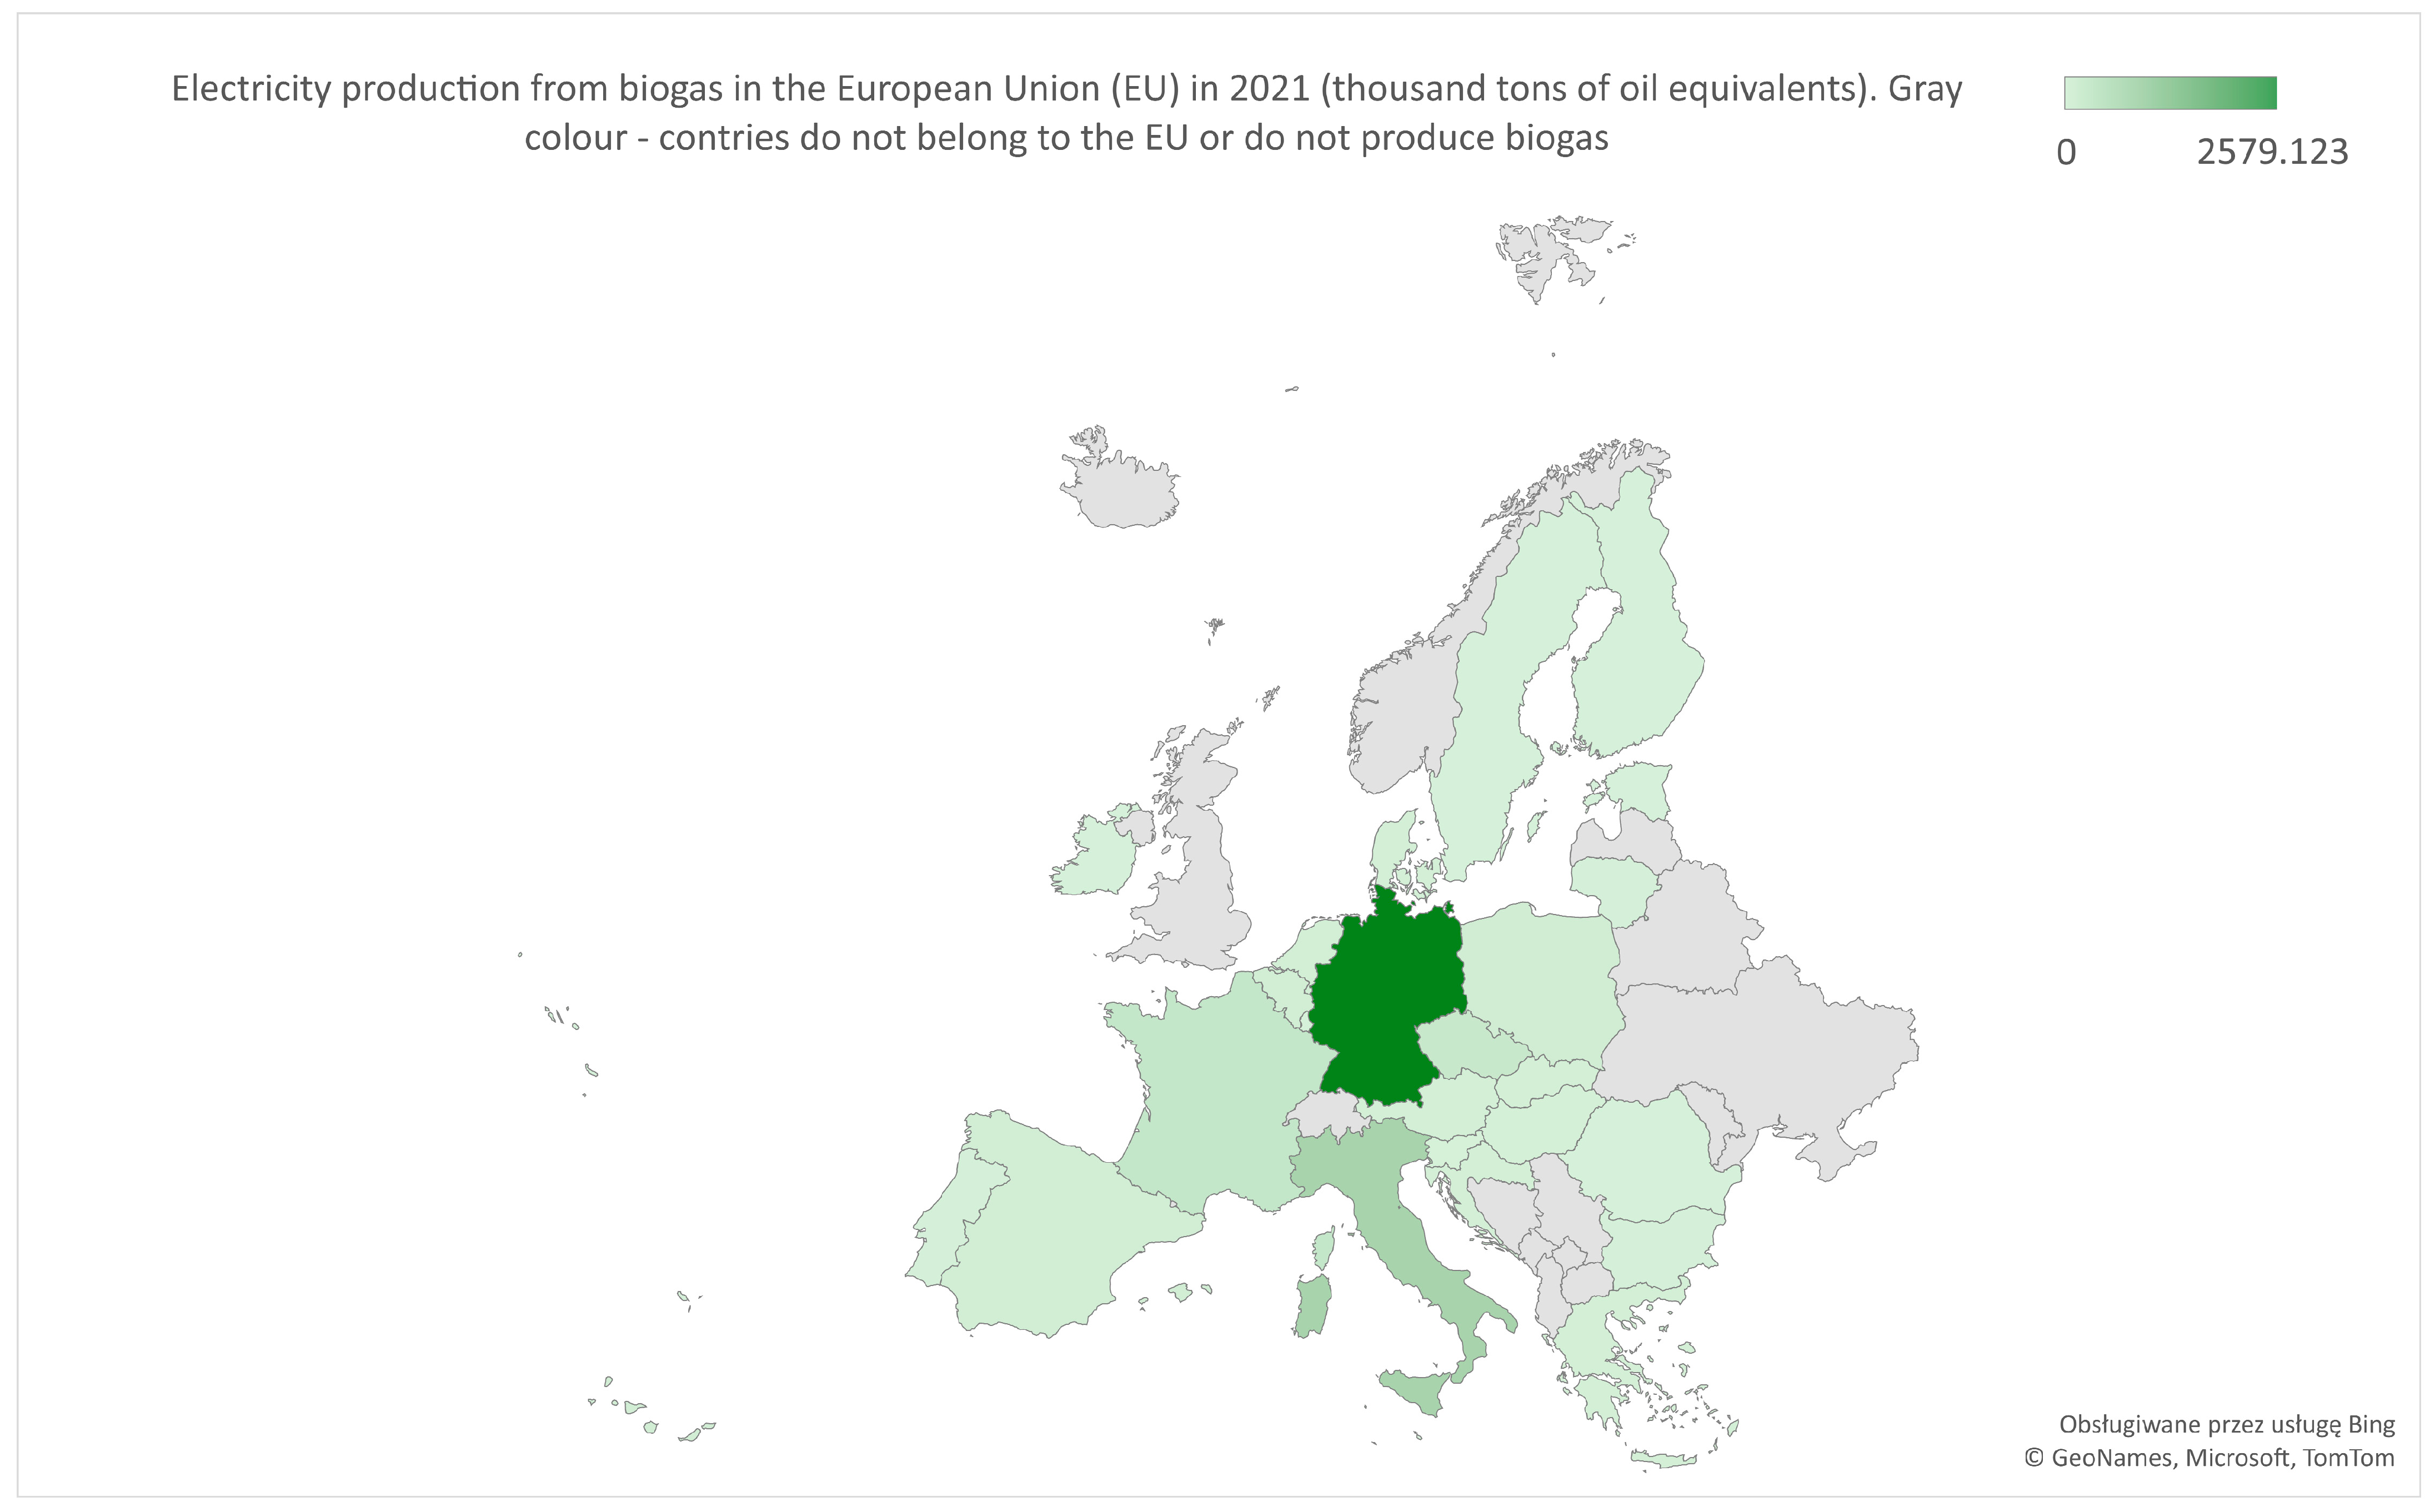
| Germany | 2348.581 | 2515.477 | 2672.915 | 2845.916 | 2898.624 | 2913.07 | 2853.052 | 2833.362 | 2880.31 | 2579.123 |
| Estonia | 1.355 | 1.72 | 2.322 | 4.299 | 3.869 | 3.59 | 3.267 | 3.34 | 2.664 | 1.414 |
| Ireland | 16.948 | 15.869 | 17.509 | 17.609 | 1.,882 | 17.463 | 15.829 | 16.165 | 14.424 | 14.852 |
| Greece | 17.566 | 18.608 | 18.887 | 19.808 | 23.185 | 25.816 | 25.979 | 32.462 | 34.729 | 39.281 |
| Spain | 74.463 | 83.663 | 77.988 | 84.437 | 77.902 | 80.911 | 79.364 | 77.73 | 75.752 | 84.179 |
| France | 111.467 | 132.822 | 137.013 | 157.683 | 171.206 | 181.744 | 203.762 | 222.659 | 237.879 | 271.168 |
| Croatia | 4.857 | 6.682 | 9.833 | 15.14 | 20.407 | 26.629 | 30.516 | 34.497 | 36.062 | 37.85 |
| Italy | 397.238 | 640.385 | 704.94 | 706.095 | 710.123 | 713.596 | 713.634 | 711.66 | 702.188 | 698.557 |
| Cyprus | 4.284 | 4.202 | 4.341 | 4.406 | 4.473 | 4.45 | 4.892 | 4.98 | 5.213 | 5.154 |
| Latvia | 19.207 | 24.642 | 30.097 | 33.681 | 34.127 | 34.855 | 32.163 | 30.301 | 29.635 | 25.098 |
| Lithuania | 3.611 | 5.073 | 6.707 | 7.395 | 10.576 | 10.941 | 12.029 | 13.276 | 12.846 | 13.474 |
| Luxembourg | 4.97 | 4.855 | 5.203 | 5.297 | 6.251 | 6.235 | 6.489 | 6.123 | 5.432 | 5.243 |
| Hungary | 18.103 | 22.972 | 24.738 | 25.193 | 28.657 | 29.923 | 28.891 | 27.601 | 27.859 | 25.365 |
| Malta | 0.765 | 0.507 | 0.555 | 0.571 | 0.714 | 0.837 | 0.77 | 0.55 | 0.506 | 0.622 |
| Netherlands | 86.73 | 84.252 | 86.456 | 89.288 | 85.454 | 79.521 | 76.667 | 76.963 | 74.794 | 70.101 |
| Austria | 55.174 | 53.55 | 52.734 | 54.473 | 57.241 | 57.639 | 54.025 | 52.611 | 54.059 | 51.728 |
| Poland | 48.612 | 59.305 | 70.187 | 77.936 | 88.359 | 94.276 | 96.958 | 97.593 | 106.092 | 112.41 |
| Portugal | 18.011 | 21.461 | 23.826 | 25.274 | 24.467 | 24.637 | 23.334 | 22.739 | 22.31 | 23.012 |
| Romania | 1.668 | 4.272 | 4.363 | 5.226 | 5.579 | 5.733 | 6.033 | 4.627 | 4.56 | 6.27 |
| Slovenia | 13.165 | 12.119 | 11.156 | 11.376 | 12.221 | 11.187 | 10.219 | 8.113 | 9.717 | 8.826 |
| Slovakia | 16.337 | 18.315 | 41.187 | 46.518 | 49.527 | 51.075 | 46.346 | 45.916 | 43.852 | 41.874 |
| Finland | 13.793 | 26.506 | 30.205 | 30.706 | 34.122 | 34.954 | 36.087 | 31.227 | 25.509 | 28.292 |
| Sweden | 1.72 | 1.72 | 1.204 | 0.946 | 0.953 | 0.946 | 0.86 | 1.462 | 0.86 | 1.032 |
| Specification | Arithmetic Mean of the Dependent Variable | Mean of Random Perturbations | R-Squared Determination Coefficient | Likelihood Logarithm | Critical Bayesian Schwarz Criterion | Standard Deviation of Dependent Variable | Standard Deviation of Random Disturbances | Corrected R-Square | Critical Information Akaike Criterion | Critical Hannan–Quinn Criterion |
|---|---|---|---|---|---|---|---|---|---|---|
| Global world biogas production | 53.340 | 0.658 | 0.905 | −12.039 | 30.514 | 9.164 | 2.687 | 0.873 | 32.077 | 27.884 |
| AR | MA | |||||||||
| Specification | Coefficient | Std. error | Z | p value | coefficient | Std. error | Z | p value | ||
| Global world biogas production | 0.577 | 0.138 | 4.175 | 0.002 | −1.000 | 0.899 | −1.113 | 0.266 | ||
| Specification | Prognosis | |||||||||||||||
|---|---|---|---|---|---|---|---|---|---|---|---|---|---|---|---|---|
| 2019 | 2020 | 2021 | 2022 | 2023 | 2024 | 2025 | 2026 | |||||||||
| Prediction | Std. Error | Prediction | Std. Error | Prediction | Std. Error | Prediction | Std. Error | Prediction | Std. Error | Prediction | Std. Error | Prediction | Std. Error | Prediction | Std. Error | |
| Global biogas production | 62.300 | 2.690 | 63.000 | 2.920 | 63.500 | 2.990 | 63.700 | 3.010 | 63.800 | 3.000 | 63.900 | 3.030 | 64.000 | 3.030 | 64.000 | 3.030 |
| Countries | Average | Median | Minimal | Maximal | Std. Dev. | Coefficient of Variation | Skewedness | Kurtosis |
|---|---|---|---|---|---|---|---|---|
| Austria | 54.323 | 54.042 | 51.728 | 57.639 | 1.9207 | 0.035358 | 0.57645 | −0.69096 |
| Belgium | 78.091 | 81.320 | 57.051 | 87.240 | 9.4576 | 0.12111 | −1.2967 | 0.48233 |
| Bulgaria | 12.811 | 17.331 | 0.050000 | 19.838 | 7.8629 | 0.61374 | −0.66501 | −1.2564 |
| Croatia | 22.247 | 23.518 | 4.8570 | 37.850 | 12.581 | 0.56553 | −0.14034 | −1.5232 |
| Cyprus | 4.6395 | 4.4615 | 4.2020 | 5.2130 | 0.37982 | 0.081866 | 0.42960 | −1.4497 |
| Czechia | 210.73 | 222.78 | 126.20 | 226.94 | 30.881 | 0.14654 | −2.3467 | 3.9676 |
| Denmark | 45.220 | 45.797 | 32.464 | 57.833 | 9.1299 | 0.20190 | −0.14232 | −1.4061 |
| Estonia | 2.7840 | 2.9655 | 1.3550 | 4.2990 | 1.0511 | 0.37755 | −0.12421 | −1.3568 |
| Finland | 29.140 | 30.456 | 13.793 | 36.087 | 6.4222 | 0.22039 | −1.3318 | 1.3409 |
| France | 182.74 | 176.47 | 111.47 | 271.17 | 50.903 | 0.27855 | 0.29540 | −0.97870 |
| Germany | 2734.0 | 2839.6 | 2348.6 | 2913.1 | 194.70 | 0.071212 | −0.86121 | −0.62686 |
| Greece | 25.632 | 24.500 | 17.566 | 39.281 | 7.5693 | 0.29531 | 0.60054 | −0.98220 |
| Hungary | 25.930 | 26.483 | 18.103 | 29.923 | 3.5112 | 0.13541 | −1.0443 | 0.44426 |
| Ireland | 16.455 | 16.556 | 14.424 | 17.882 | 1.2134 | 0.073743 | −0.40709 | −1.1697 |
| Italy | 669.84 | 705.52 | 397.24 | 713.63 | 98.207 | 0.14661 | −2.4519 | 4.3545 |
| Latvia | 29.381 | 30.199 | 19.207 | 34.855 | 4.9939 | 0.16997 | −0.81316 | −0.34778 |
| Lithuania | 9.5928 | 10.759 | 3.6110 | 13.474 | 3.6102 | 0.37634 | −0.44879 | −1.2901 |
| Luxembourg | 5.6098 | 5.3645 | 4.8550 | 6.4890 | 0.60064 | 0.10707 | 0.25833 | −1.5422 |
| Malta | 0.63970 | 0.59650 | 0.50600 | 0.83700 | 0.12150 | 0.18994 | 0.38421 | −1.3862 |
| Netherlands | 81.023 | 81.886 | 70.101 | 89.288 | 6.2916 | 0.077653 | −0.31302 | −1.1513 |
| Poland | 85.173 | 91.317 | 48.612 | 112.41 | 20.679 | 0.24278 | −0.47981 | −0.92065 |
| Portugal | 22.907 | 23.173 | 18.011 | 25.274 | 2.0686 | 0.090306 | −1.2903 | 1.2214 |
| Romania | 4.8331 | 4.9265 | 1.6680 | 6.2700 | 1.3206 | 0.27324 | −1.3282 | 1.3773 |
| Slovakia | 40.095 | 44.884 | 16.337 | 51.075 | 12.387 | 0.30895 | −1.2823 | −0.0080354 |
| Slovenia | 10.810 | 11.171 | 8.1130 | 13.165 | 1.5842 | 0.14655 | −0.31059 | −0.88804 |
| Spain | 79.639 | 78.676 | 74.463 | 84.437 | 3.5403 | 0.044455 | 0.15088 | −1.2747 |
| Sweden | 1.1703 | 0.99250 | 0.86000 | 1.7200 | 0.34158 | 0.29188 | 0.76945 | −1.0407 |
| AR | MA | |||||||
|---|---|---|---|---|---|---|---|---|
| Country | Coefficient | Std. Error | Z | p Value | Coefficient | Std. Error | z | p Value |
| Austria | 0.004 | 0.604 | 0.007 | 0.994 | 0.999 | 0.374 | 2.669 | 0.008 |
| Belgium | 0.803 | 0.223 | 3.601 | 0.000 | 0.447 | 0.301 | 1.487 | 0.137 |
| Bulgaria | 0.849 | 0.108 | 7.838 | 0.000 | 0.489 | 0.483 | 1.013 | 0.312 |
| Croatia | 0.971 | 0.056 | 17.420 | 0.000 | 0.413 | 0.656 | 0.630 | 0.529 |
| Cyprus | 0.863 | 0.462 | 5.328 | 0.000 | 0.121 | 0.260 | 0.466 | 0.642 |
| Czechia | 0.765 | 0.276 | 2.774 | 0.006 | 1.000 | 0.732 | 1.367 | 0.172 |
| Denmark | 0.827 | 0.199 | 4.149 | 0.000 | 0.382 | 0.408 | 0.937 | 0.349 |
| Estonia | 0.406 | 0.584 | 0.695 | 0.487 | 0.466 | 0.406 | 1.147 | 0.251 |
| Finland | 0.588 | 0.362 | 1.625 | 0.104 | 1.000 | 0.316 | 3.168 | 0.002 |
| France | 0.953 | 0.067 | 14.120 | 0.000 | 0.675 | 0.345 | 1.955 | 0.051 |
| Germany | 0.501 | 0.354 | 1.415 | 0.157 | −0.162 | 1.538 | −0.105 | 0.916 |
| Greece | 0.931 | 0.094 | 9.915 | 0.000 | 0.265 | 0.259 | 1.024 | 0.306 |
| Hungary | 0.458 | 0.874 | 0.525 | 0.560 | 0.356 | 1.058 | 0.336 | 0.737 |
| Ireland | 0.747 | 0.656 | 1.139 | 0.254 | −0.010 | 0.759 | −0.132 | 0.895 |
| Italy | 0.228 | 0.039 | 5.769 | 0.000 | 0.360 | 0.349 | 1.031 | 0.302 |
| Latvia | 0.536 | 0.197 | 2.724 | 0.006 | 0.999 | 0.652 | 1.534 | 0.125 |
| Lithuania | 0.925 | 0.102 | 9.029 | 0.000 | 0.269 | 0.292 | 0.923 | 0.356 |
| Luxembourg | 0.631 | 0.327 | 1.932 | 0.053 | 0.157 | 1.009 | 0.156 | 0.876 |
| Malta | 0.000 | 0.488 | 0.000 | 0.999 | 0.600 | 0.423 | 1.418 | 0.156 |
| Netherlands | 0.843 | 0.171 | 4.929 | 0.000 | 0.999 | 0.295 | 3.395 | 0.000 |
| Poland | 0.875 | 0.094 | 9.258 | 0.000 | 0.112 | 0.408 | 0.275 | 0.784 |
| Portugal | 0.393 | 0.524 | 0.751 | 0.453 | 0.366 | 0.459 | 0.796 | 0.426 |
| Romania | 0.525 | 0.741 | 0.710 | 0.478 | 0.146 | 0.996 | 0.146 | 0.884 |
| Slovakia | 0.558 | 0.119 | 4.695 | 0.000 | −0.387 | 0.436 | −0.889 | 0.374 |
| Slovenia | 0.747 | 0.310 | 2.413 | 0.016 | −0.033 | 0.406 | −0.084 | 0.933 |
| Spain | −0.979 | 0.209 | −4.686 | 0.000 | 0.769 | 1.339 | 0.575 | 0.566 |
| Sweden | 0.626 | 0.177 | 3.543 | 0.000 | −0.999 | 0.535 | −1.867 | 0.062 |
| Country | Arithmetic Mean of the Dependent Variable | Mean of Random Perturbations | R-Squared Determination Coefficient | Likelihood Logarithm | Critical Bayesian/ Schwarz Criterion | Standard Deviation of Dependent Variable | Standard Deviation of Random Disturbances | Corrected R-Square | Critical Information Akaike Criterion | Critical Hannan–Quinn Criterion |
|---|---|---|---|---|---|---|---|---|---|---|
| Austria | 54.229 | −0.110 | 0.524 | −15.410 | 39.609 | 2.012 | 1.341 | 0.456 | 38.820 | 37.117 |
| Belgium | 78.090 | 1.631 | 0.736 | −31.169 | 71.549 | 9.457 | 4.975 | 0.703 | 70.339 | 69.011 |
| Bulgaria | 14.229 | 0.166 | 0.933 | −17.617 | 44.024 | 6.851 | 1.714 | 0.924 | 43.235 | 41.533 |
| Croatia | 24.180 | 0.087 | 0.984 | −15.852 | 40.493 | 11.665 | 1.408 | 0.982 | 39.704 | 38.001 |
| Cyprus | 4.640 | 0.049 | 0.786 | 2.394 | 4.422 | 0.380 | 0.176 | 0.759 | 3.211 | 1.884 |
| Czechia | 210.734 | 5.656 | 0.693 | −45.169 | 99.549 | 30.881 | 17.841 | 0.654 | 98.339 | 97.011 |
| Denmark | 45.220 | 1.034 | 0.836 | −28.086 | 65.383 | 9.129 | 3.657 | 0.815 | 64.173 | 62.845 |
| Estonia | 2.943 | 0.009 | 0.377 | −9.931 | 28.651 | 0.979 | 0.729 | 0.288 | 27.862 | 26.159 |
| Finland | 29.140 | 0.912 | 0.659 | −29.111 | 67.432 | 6.422 | 3.700 | 0.616 | 66.221 | 64.894 |
| France | 182.740 | 8.829 | 0.944 | −43.520 | 96.250 | 50.903 | 15.390 | 0.937 | 95.039 | 93.712 |
| Germany | 2776.872 | −1.150 | 0.449 | −54.564 | 117.916 | 148.355 | 103.926 | 0.371 | 117.127 | 115.425 |
| Greece | 25.632 | 1.339 | 0.895 | −26.169 | 61.549 | 7.569 | 2.919 | 0.882 | 60.338 | 59.011 |
| Hungary | 26.800 | 0.004 | 0.651 | 15.058 | 38.904 | 2.315 | 1.289 | 0.601 | 38.115 | 36.413 |
| Ireland | 16.400 | −0.007 | 0.354 | −12.455 | 33.699 | 1.274 | 0.966 | 0.261 | 32.910 | 31.208 |
| Italy | 700.131 | 0.106 | 0.938 | −28.250 | 65.289 | 22.998 | 5.584 | 0.929 | 65.500 | 62.798 |
| Latvia | 30.511 | −0.443 | 0.728 | −18.417 | 45.624 | 3.699 | 1.873 | 0.689 | 44.835 | 43.132 |
| Lithuania | 9.593 | 0.667 | 0.881 | −18.474 | 46.157 | 3.610 | 1.358 | 0.866 | 44.948 | 43.621 |
| Luxembourg | 5.681 | 0.007 | 0.511 | −4.295 | 17.378 | 0.591 | 0.390 | 0.441 | 16.590 | 14.887 |
| Malta | 0.639 | −0.007 | 0.236 | 8.507 | −7.804 | 0.122 | 0.101 | 0.140 | −9.014 | −10.342 |
| Netherlands | 81.023 | −0.584 | 0.887 | −24.298 | 57.806 | 6.292 | 2.165 | 0.872 | 56.596 | 55.268 |
| Poland | 89.235 | 0.006 | 0.976 | −20.945 | 50.679 | 17.187 | 2.480 | 0.973 | 49.891 | 48.188 |
| Portugal | 23.451 | 0.010 | 0.589 | −10.040 | 28.869 | 1.219 | 0.738 | 0.531 | 28.080 | 26.377 |
| Romania | 4.833 | 0.221 | 0.226 | −15.686 | 40.583 | 1.321 | 1.133 | 0.129 | 39.373 | 38.045 |
| Slovakia | 42.734 | −0.363 | 0.682 | −28.005 | 64.799 | 9.707 | 5.434 | 0.636 | 64.011 | 62.308 |
| Slovenia | 10.810 | −0.249 | 0.466 | −15.763 | 40.736 | 1.584 | 1.126 | 0.399 | 39.525 | 38.198 |
| Spain | 79.639 | −0.126 | 0.472 | −23.800 | 56.811 | 3.540 | 2.453 | 0.406 | 55.601 | 54.273 |
| Sweden | 1.109 | 0.040 | 0.669 | 2.352 | 4.085 | 0.299 | 0.186 | 0.622 | 3.296 | 1.594 |
| Countries | 2022 | Error | 2023 | Error | 2024 | Error | 2025 | Error | 2026 | Error |
|---|---|---|---|---|---|---|---|---|---|---|
| Austria | 51.928 | 1.3408 | 54.186 | 1.900 | 54.196 | 1.900 | 54.196 | 1.900 | 54.196 | 1.900 |
| Belgium | 87.766 | 4.874 | 88.521 | 7.965 | 89.324 | 9.402 | 90.142 | 10.153 | 91.154 | 11.865 |
| Bulgaria | 19.052 | 1.713 | 19.790 | 2.863 | 20.417 | 3.463 | 20.949 | 3.838 | 21.401 | 4.087 |
| Croatia | 40.664 | 1.408 | 43.595 | 2.405 | 46.441 | 3.059 | 49.203 | 3.568 | 51.885 | 3.989 |
| Cyprus | 5.173 | 0.176 | 5.288 | 0.246 | 5.332 | 0.289 | 5.398 | 0.316 | 5.398 | 0.335 |
| Czechia | 223.945 | 17.840 | 224.404 | 36.185 | 233.637 | 43.459 | 239.229 | 47.195 | 239.858 | 49.248 |
| Denmark | 57.302 | 3.657 | 58.101 | 57.403 | 59.285 | 6.807 | 59.446 | 7.451 | 59.751 | 7.861 |
| Estonia | 1.745 | 0.729 | 2.389 | 0.968 | 2.650 | 1.001 | 2.756 | 1.007 | 2.799 | 1.008 |
| Finland | 30.355 | 3.699 | 28.720 | 6.643 | 27.758 | 7.754 | 27.192 | 8.0165 | 26.860 | 8.104 |
| France | 273.769 | 15.3902 | 277.906 | 29.404 | 282.248 | 37.857 | 286.804 | 44.181 | 287.563 | 49.211 |
| Germany | 2738.199 | 103.926 | 2775.953 | 109.7291 | 2794.856 | 111.136 | 2804.320 | 111.487 | 2809.000 | 111.574 |
| Greece | 39.776 | 2.19 | 39.966 | 4.552 | 40.003 | 6.595 | 40.261 | 6.362 | 40.356 | 6.959 |
| Hungary | 25.558 | 1.289 | 26.500 | 1.663 | 26.932 | 1.731 | 27.129 | 1.745 | 27.220 | 1.748 |
| Ireland | 15.083 | 0.965 | 15.249 | 1.150 | 15.373 | 1.241 | 15.465 | 1.289 | 15.535 | 1.316 |
| Italy | 704.691 | 5.584 | 708.398 | 6.478 | 709.242 | 6.522 | 709.435 | 6.524 | 709.479 | 6.524 |
| Latvia | 24.349 | 1.873 | 27.996 | 3.343 | 29.950 | 3.762 | 30.996 | 3.852 | 31.557 | 3.877 |
| Lithuania | 13.405 | 1.357 | 13.061 | 2.114 | 12.744 | 2.592 | 12.450 | 2.940 | 12.178 | 3.201 |
| Luxembourg | 5.379 | 0.389 | 5.497 | 0.496 | 5.572 | 0.533 | 5.619 | 0.547 | 5.649 | 0.552 |
| Malta | 0.658 | 0.101 | 0.651 | 0.117 | 0.651 | 0.118 | 0.651 | 0.118 | 0.651 | 0.118 |
| Netherlands | 69.026 | 2.165 | 70.678 | 4.538 | 72.070 | 5.647 | 73.243 | 6.318 | 74.232 | 6.754 |
| Poland | 115.923 | 2.480 | 118.796 | 3.484 | 121.309 | 4.089 | 123.508 | 4.498 | 125.431 | 4.787 |
| Portugal | 23.534 | 0.738 | 23.693 | 0.926 | 23.756 | 0.953 | 23.781 | 0.957 | 23.790 | 0.957 |
| Romania | 5.743 | 1.133 | 5.224 | 1.365 | 4.951 | 1.422 | 4.807 | 1.438 | 4.732 | 1.442 |
| Slovakia | 46.098 | 5.434 | 46.621 | 5.513 | 46.913 | 5.537 | 47.076 | 5.545 | 47.168 | 5.547 |
| Slovenia | 9.383 | 1.126 | 9.760 | 1.383 | 10.042 | 1.508 | 10.253 | 1.574 | 10.411 | 1.609 |
| Spain | 84.304 | 2.453 | 87.473 | 2.506 | 88.565 | 2.556 | 89.653 | 2.606 | 90.431 | 2.913 |
| Sweden | 0.883 | 0.186 | 0.907 | 0.199 | 0.922 | 0.203 | 0.931 | 0.205 | 0.937 | 0.206 |
| EU Countries | 2013 | 2014 | 2015 | 2016 | 2017 | 2018 | 2019 | 2020 | 2021 | 2022 | Changes (%) |
|---|---|---|---|---|---|---|---|---|---|---|---|
| European Union—27 countries (from 2020) | 497,823.315 | 530,918.025 | 551,325.869 | 568,982.066 | 581,985.260 | 580,267.668 | 592,251.404 | 614,908.409 | 625,835.295 | 641,002.324 | 128.0 |
| Euro area—20 countries (from 2023) | 451,411.483 | 480,224.794 | 497,847.621 | 509,626.081 | 519,596.712 | 515,202.221 | 524,627.337 | 540,838.083 | 545,597.788 | 555,207.273 | 122.9 |
| Belgium | 8358.600 | 9129.900 | 9860.400 | 9814.400 | 9423.100 | 9546.600 | 9698.000 | 10,261.400 | 10,291.500 | 10,575.000 | 126.5 |
| Bulgaria | 93.000 | 435.000 | 820.000 | 2511.000 | 1958.390 | 2244.673 | 2133.311 | 2231.674 | 2499.393 | 2180.253 | 2344.3 |
| Czechia | 23,910.000 | 25,457.000 | 25,681.000 | 25,161.000 | 25,443.789 | 25,279.127 | 24,331.895 | 24,888.839 | 25,529.529 | 26,000.000 | 108.7 |
| Denmark | 4587.832 | 5561.231 | 6285.248 | 9047.985 | 10,906.278 | 13,333.410 | 16,481.514 | 21,151.581 | 26,194.576 | 31,695.437 | 690.8 |
| Germany | 280,646.000 | 298,275.000 | 314,418.000 | 320,998.000 | 323,250.000 | 318,527.000 | 317,935.000 | 325,115.000 | 314,773.000 | 317,236.000 | 113.0 |
| Estonia | 302.000 | 403.000 | 550.000 | 722.000 | 540.000 | 571.000 | 581.000 | 832.000 | 762.400 | 700.000 | 231.8 |
| Ireland | 2061.661 | 2186.842 | 2317.499 | 2327.724 | 2321.780 | 2108.248 | 2120.085 | 2105.006 | 2178.973 | 2229.546 | 108.1 |
| Greece | 3704.000 | 3640.000 | 3826.000 | 4258.000 | 4484.000 | 4723.900 | 5232.830 | 5665.000 | 5325.642 | 6215.269 | 167.8 |
| Spain | 20,072.000 | 14,791.000 | 10,954.000 | 11,557.000 | 12,237.000 | 12,374.000 | 12,184.000 | 13,539.000 | 13,644.000 | 13,902.579 | 69.3 |
| France | 24,013.607 | 25,423.321 | 28,801.248 | 31,412.412 | 33,817.190 | 36,609.292 | 40,716.538 | 45,640.314 | 58,793.004 | 68,115.438 | 283.6 |
| Croatia | 693.370 | 1096.494 | 1506.133 | 1952.042 | 2671.634 | 3081.243 | 3441.762 | 3480.516 | 4154.180 | 3811.788 | 549.7 |
| Italy | 76,013.000 | 82,105.000 | 78,355.000 | 78,505.000 | 79,452.908 | 79,220.551 | 84,288.213 | 84,484.094 | 87,007.196 | 85,115.660 | 111.9 |
| Cyprus | 466.000 | 475.000 | 471.000 | 492.000 | 504.345 | 553.550 | 578.767 | 556.275 | 559.040 | 231.619 | 49.7 |
| Latvia | 2695.000 | 3136.000 | 3674.000 | 3762.000 | 3902.011 | 3643.253 | 3376.039 | 3358.877 | 2763.421 | 2322.853 | 86.2 |
| Lithuania | 649.000 | 876.000 | 981.000 | 1341.000 | 1350.000 | 1554.000 | 1632.000 | 1617.000 | 1682.000 | 1750.000 | 269.6 |
| Luxembourg | 653.087 | 701.203 | 739.381 | 832.910 | 866.983 | 915.433 | 753.191 | 755.440 | 690.900 | 548.266 | 83.9 |
| Hungary | 3336.000 | 3323.000 | 3335.000 | 3708.000 | 4141.000 | 3916.000 | 3785.000 | 3748.000 | 3518.000 | 4085.000 | 122.4 |
| Malta | 59.000 | 73.000 | 77.000 | 80.000 | 77.000 | 69.834 | 73.381 | 60.398 | 54.547 | 70.677 | 119.8 |
| Netherlands | 12,777.000 | 13,094.000 | 13,733.059 | 13,377.410 | 13,508.671 | 13,696.226 | 14,913.297 | 17,428.542 | 17,926.824 | 17,617.699 | 137.9 |
| Austria | 8006.158 | 11,899.034 | 12,340.901 | 12,515.183 | 13,021.335 | 9504.878 | 8983.395 | 8787.162 | 6684.902 | 7420.478 | 92.7 |
| Poland | 7593.000 | 8685.000 | 9581.000 | 10,924.000 | 11,738.620 | 12,068.301 | 12,498.053 | 13,498.148 | 13,371.974 | 13,355.326 | 175.9 |
| Portugal | 2763.000 | 3432.000 | 3457.000 | 3364.000 | 3561.284 | 3453.040 | 3355.158 | 3464.321 | 3651.991 | 3418.598 | 123.7 |
| Romania | 822.000 | 810.000 | 767.000 | 739.000 | 755.471 | 864.936 | 794.294 | 772.084 | 970.035 | 970.035 | 118.0 |
| Slovenia | 1454.000 | 1290.000 | 1242.000 | 1264.000 | 1076.471 | 1018.173 | 929.681 | 1128.738 | 1044.268 | 1014.803 | 69.8 |
| Slovakia | 2300.000 | 4025.000 | 6223.000 | 6357.000 | 6384.000 | 6228.000 | 5984.000 | 5479.000 | 5472.000 | 5500.000 | 239.1 |
| Finland | 3725.000 | 4173.000 | 4321.000 | 4694.000 | 7147.000 | 7804.000 | 7851.000 | 7080.000 | 8138.000 | 7411.000 | 198.9 |
| Sweden | 6070.000 | 6422.000 | 7009.000 | 7265.000 | 7445.000 | 7359.000 | 7600.000 | 7780.000 | 8154.000 | 7509.000 | 123.7 |
Disclaimer/Publisher’s Note: The statements, opinions and data contained in all publications are solely those of the individual author(s) and contributor(s) and not of MDPI and/or the editor(s). MDPI and/or the editor(s) disclaim responsibility for any injury to people or property resulting from any ideas, methods, instructions or products referred to in the content. |
© 2024 by the authors. Licensee MDPI, Basel, Switzerland. This article is an open access article distributed under the terms and conditions of the Creative Commons Attribution (CC BY) license (https://creativecommons.org/licenses/by/4.0/).
Share and Cite
Bórawski, P.; Bełdycka-Bórawska, A.; Kapsdorferová, Z.; Rokicki, T.; Parzonko, A.; Holden, L. Perspectives of Electricity Production from Biogas in the European Union. Energies 2024, 17, 1169. https://doi.org/10.3390/en17051169
Bórawski P, Bełdycka-Bórawska A, Kapsdorferová Z, Rokicki T, Parzonko A, Holden L. Perspectives of Electricity Production from Biogas in the European Union. Energies. 2024; 17(5):1169. https://doi.org/10.3390/en17051169
Chicago/Turabian StyleBórawski, Piotr, Aneta Bełdycka-Bórawska, Zuzana Kapsdorferová, Tomasz Rokicki, Andrzej Parzonko, and Lisa Holden. 2024. "Perspectives of Electricity Production from Biogas in the European Union" Energies 17, no. 5: 1169. https://doi.org/10.3390/en17051169
APA StyleBórawski, P., Bełdycka-Bórawska, A., Kapsdorferová, Z., Rokicki, T., Parzonko, A., & Holden, L. (2024). Perspectives of Electricity Production from Biogas in the European Union. Energies, 17(5), 1169. https://doi.org/10.3390/en17051169