Article

Wind Resource Assessment over the Hellenic Seas Using Dynamical Downscaling Techniques and Meteorological Station Observations

by
Georgios V. Kozyrakis
1,*,
Constantinos Condaxakis
2,
Antonios Parasyris
1 and
Nikolaos A. Kampanis
1
1
Coastal & Marine Research Laboratory (CMRL), Institute of Applied and Computational Mathematics (IACM), Foundation for Research and Technology—Hellas (FORTH), 70013 Heraklion, Crete, Greece
2
Power Plant Synthesis Laboratory, Hellenic Mediterranean University, Hellas, Estavromenos, 71410 Heraklion, Crete, Greece
*
Author to whom correspondence should be addressed.
Energies 2023, 16(16), 5965; https://doi.org/10.3390/en16165965
Submission received: 3 July 2023 / Revised: 2 August 2023 / Accepted: 11 August 2023 / Published: 13 August 2023
(This article belongs to the Special Issue Advanced Wind Energy Conversion Systems)

Abstract

:
The current work focuses on establishing the parameters that influence the wind’s behavior over the Aegean and Ionian Seas and estimating the wind potential in the region based on long-term historic climate data. Combining a downscaling technique performed with the well-founded WRF-ARW computational algorithm and a number of simultaneous meteorological station time series, an attempt is made to investigate how regional changes may affect low-altitude wind speed distribution at hub height (100 m a.s.l.). The provided time-series coastal data span the entire region of interest from north to south. WRF-ARW v.3.9 is utilized to associate the geostrophic wind distribution obtained from long-term Copernicus ERA5 wind data with the localized wind potential over lower altitudes. Evaluation and correlation of the observational data to the predicted wind climate are performed, and the statistical differences that arise are investigated. High-accuracy wind resource potential maps are thus obtained in the region. Also, a few distinctive flow patterns are identified, such as wind speed cut-off regions and very high wind speed distributions, which are presented in specific southern regions of the Aegean Sea.

1. Introduction

In order to enhance the precision of results in regions of interest located near coastlines and incorporate long-term historical wind data, downscaling techniques for climatic data are employed. Numerous wind-related projects (see, e.g., [1,2,3,4,5]) utilize both satellite and local climate data, owing to their capability to link microscale and mesoscale weather events. This approach effectively accounts for the driving geostrophic winds to estimate low-altitude wind distribution. In Weather Research & Forecasting Model (WRF) Advanced Research WRF (WRF-ARW) v.3.9 [6], a 1/3 nesting ratio is utilized to enhance the spatial resolution of the spatial grid, resulting in a 3000 × 3000 m grid, which leads to increased computational accuracy in the investigated regions, thereby enabling the detection of finer-wind-scale phenomena.
Since large-scale satellite data merely take the orography into account, it is necessary to correct the computational results by incorporating input from actual local wind measurements from meteorological stations located at different positions that span the investigated region. The role of the meteorological station data is twofold. First, cross-correlating simultaneous results over large distances provides an accurate estimate of the local wind distribution for large periods of time. One could argue that, in lack of other supporting tools, this could provide a rough estimate of how the regional topography may influence the wind distribution, by comparison to a nearby region. Second, meteorological station data distribution can be easily incorporated into the current numerical methodology to account for wind changes arising from the influence of local climatology and topography.
Dynamic downscaling relies on high-resolution modeling by calculating the regional atmospheric flow. This is a much more computationally expensive approach compared to statistical downscaling and is itself subject to errors due to imperfect parametrizations and numerical diffusion. Wang et al. [7], Fowler et al. [8] and Solomon et al. [9] provide a detailed overview of current regional modeling techniques. One commonly utilized method is the nesting technique or dynamical downscaling approach, which involves employing measurements from global circulation models (GCMs) to establish lateral boundary conditions, sea-surface temperature (SST) and initial land-surface conditions for a subspace model. Due to the localized nature of extreme events and their close relationship with topography, it is anticipated that regional downscaled projections of extreme events will exhibit significantly improved accuracy compared to those obtained solely from GCMs. This expectation has already motivated numerous investigations focusing on climate extremes at the regional level, as evidenced by studies conducted by Kim [10], Solomon et al. [9] and others.
Downscaling techniques based on WRF-ARW have been extensively employed in various research fields, e.g., climate change, extreme weather phenomena, ecodiversity impacts, wind energy resource assessments and wave modeling. For instance, Larsen et al. [11] used the WRF mesoscale model to better understand storm episodes over an extended domain. Mentaschi et al. [12] utilized WRF for improving the spatial resolution of wind forcing data in order to enhance coastal and marine computational models. Galanis et al. [13] downscaled 10-year forcing data using WRF to investigate wave energy potential in the eastern Mediterranean Sea (Med.) area. Zodiatis et al. [14] applied WRF downscaling techniques to enhance the CYCOFOS (CYprus Coastal Ocean Forecasting and Observing System) and to evaluate the final results using a novel Calibrate/Validate (Cal/Val) methodology [15]. García-Díez et al. [16] and Soares [4] utilized downscaled wind datasets to estimate the accuracy of wind-power projects in Spain and Portugal, respectively, by correlating them with in situ land and sea datasets. Li et al. [17] downscaled forcing parameters to drive WAVEWATCH III [18] and SWAN [19] wave models around the Hawaiian Islands using WRF. Similarly, Markina et al. [20] utilized WRF and WAVEWATCH III for similar investigations in the North Atlantic. The utilization of WRF-ARW in the above-mentioned methodologies is mainly due to the need for the input grid of forcing parameters to be of similar size to the resulting wave parameter grid. While it is common practice to utilize coarser resolution for the former, in order to conserve computing power, this practice can have a negative impact on the precision of the outcomes. This is especially true in near-coastal areas where the interaction between wind and dry land plays a significant role. The authors of [21] for example, using just the reanalysis wind data without downscaling, showed great reliability for offshore and flat areas and lower reliability for coastal and mountainous sites. Sensitivity studies of the WRF in offshore areas show great promise as well; see, for example, an application in the Baltic Sea in [22].
In weather prediction, regardless of the chosen grid resolution, there exist important physical procedures that inherently occur on smaller spatiotemporal scales (subgrid scales), such as cloud microphysics, boundary layer turbulent vertical mixing, and interactions between the atmosphere and the underlying surface. These processes must be parameterized within the numerical model by an approximation method which is based on known fixed parameters, or on semiempirical functions, that attempt to account for the arising subgrid-scale phenomenon. To account for turbulent flow between WRF-ARW vertical atmospheric levels, one must resolve turbulent closure functions. A full three-dimensional representation of the atmospheric boundary layer (which WRF and other mesoscale models are incapable of performing by design) will require immense computational resources in order to capture the intricate flow interactions that take place. Also, certain arising processes occur in such minuscule spatial and temporal scales (e.g., cloud microphysics) that are merely impossible to be accounted for. While guided to some extent by theory, these parameterizations are largely empirical in nature and are treated as such. To allow for a better parametrization of the WRF-ARW v.3.9 model, the problem setup found in the work of Caldwell et al. [23] is used. This setup is widely referenced and reportedly provides better results for regional analysis. The parameterizations that can be chosen by the user in the latest model distribution are as follows: Thompson microphysics (Thompson et al. [24]), Kain and Fritsch [25] convection, Rapid Radiative Transfer Model (RRTM) longwave radiation (Mlawer et al. [26]), Dudhia [27] shortwave radiation, Yonsei University (YSU) boundary layer scheme (Hong et al. [28]) and Rapid Update Cycle (RUC) surface parameterization (Smirnova et al. [29,30]). The motive behind the specific choices is given by Chin [31]. Arasa et al. [32] and Aligo et al. [33] also present detailed information on parametrization and vertical level selection.
Various techniques have been developed to adjust regional climate models (RCMs) towards large-scale input data. These techniques range from tuning to nudging, with the aim of minimizing the drift of the RCMs and improving their accuracy. Examples of nudging techniques include reinitializing the RCMs from the Global Circulation Model (GCM) data on a monthly basis and nudging the model towards large-scale fields throughout the RCM domain. These techniques have been found to significantly influence the model results. Studies by Kida et al. [34] and von Storch et al. [35] have investigated various nudging techniques for improving RCM performance. Similarly, Caldwell et al. [23] have employed monthly reinitialization from GCM data to prevent the regional model from deviating. Furthermore, this approach offers the advantage of enabling the execution of simulations for multiple months simultaneously, resulting in a substantial enhancement of the processing capacity. The current work focuses on the application of a coupled downscaling method by using the RCM to downscale the ERA5 data [36], applying the output to the calculation of the wind energy potential and producing the necessary data parameters over a very fine computational grid. The uncertainties associated with using reanalysis datasets like the ERA5 for wind data are critically reviewed in [21] and show great promise.
The RCM [6] is used to perform the downscaling of ERA5 meteorological data to higher-resolution grids (3000 m × 3000 m) for the Aegean and Ionian Seas. The input data collected and archived have been used as initial and boundary conditions for the WRF model. The sea-surface and near-sea-surface level data originating from the observation buoys [37] and meteorological stations [38] in the eastern Med. region are used to correct the local climatology within the WRF model and produce high-quality results over the finer computational grids. The produced results have been thoroughly tested using correlation and sensitivity analysis techniques, given in detail in the current paper. Both model input and setup parameters have been thoroughly modified to examine case and parameter sensitivities.
The wind potential (U) and power density (PD = 1/2ρU3, where ρ is the air density), can be derived from the wind speed, which is obtained either from models [39,40] or reanalysis datasets [41,42,43] or observed by satellites [44,45]. These studies aim at assessing the wind resource spatial characteristics under future climate change to better inform decisions. A study that combines the Sentinel-1 satellite images and downscaling WRF model can be found in [46] with the same goal. Lastly, clustering techniques have been used for offshore wind resource management; for example, see [47], which uses self-organizing maps. The interest in this field of research is increasing as power needs increase and the transition to renewable and sustainable energy is being implemented.
The novelties and new findings that this study presents are as follows: (i) A 40-year duration (1980–2019), 3000 m grid-size investigation of the regional nearshore and offshore wind distribution over Greek waters is presented. This is the first instance in the literature where this particular grid size and duration combination is used. (ii) The WRF algorithm is calibrated and evaluated for the entire Greek island complex and the eastern Mediterranean Sea using ERA5 reanalysis as forcing input data, also a first in the area. (iii) Aegean Sea locations with heightened wind speed and power density distributions are pinpointed and studied. This study aims to identify regions with wind energy potential suitable for sustainable nearshore and offshore wind farm installations. In terms of power density distribution, it is important to show all possible locations (both with higher and lower values) and namely isolate only those that display a promising wind potential. (iv) This study includes the presentation and evaluation of the temporal history of and variability in the local wind speed and power density over a 40-year period using annual and 5-year temporal averaging techniques. This presents the interannual variability in the wind energy potential and at the same time provides a more detailed insight into the way the wind potential changes over time.
This paper is structured as follows: In the next section, the region of interest is discussed along with the description of the downscaling model for meteorological data. Details about the calibration and validation of the model are given as well. After that, the results section follows, where outputs of the model focusing on wind speed and power density over 40 years in the area of interest are shown. Finally, the paper concludes with a discussion of the results.

2. Downscaling of Meteorological Data

2.1. Region of Interest

The study region comprises the Aegean Sea and the Ionian Sea near the shoreline, as well as parts of the Cretan Sea and Libyan Sea, particularly those in the vicinity of Crete and surrounding areas, covering the entire Hellenic waters. Figure 1 shows the entirety of the proposed study area, along with some specifically mentioned key locations.

2.2. Model Description

The meteorological model WRF produces time-series data of wind vector distribution, air temperature, humidity, total solar radiation, sensible and evaporative heat fluxes, etc. at each grid cell. The following flowchart summarizes the entire calculation process starting from the stored data in the database, followed by the calculation processes and finally the postprocessing of results and output storage (Figure 2).
The datasets used for topography, land use and land–water mask interpolation were obtained from the USGS Global Multi-resolution Terrain Elevation Dataset (GMTED2010) [48,49] and the Copernicus Land Monitoring Service EU-DEM product. The initial and boundary conditions for the atmosphere model were derived from the ERA5 “reanalysis” dataset [36] that provides meteorological data from 1950 onwards. The ERA5 reanalysis dataset is a fifth-generation ECMWF atmospheric reanalyzed dataset that integrates models with satellite-sourced information as well as in situ land-based sensors to create a consistent historical record of meteorological conditions. Throughout the entire hindcast period, annual simulations were conducted with updated analyses. More specifically, the atmospheric initial conditions were reinitialized every 24 h. The boundary conditions were imposed every 3 h to ensure accurate and consistent results. This setup is similar to the work carried out in [50].
WRF-ARW [6] is a FORTRAN 90-based algorithm. The Weather Research and Forecasting (WRF) model’s equation set is non-hydrostatic, fully compressible and Eulerian, with an option for hydrostatic run-time. It is built to conserve the scalar variables and employs a terrain-following, hydrostatic pressure coordinate system. The horizontal grid follows the Arakawa-C convention and spatial discretization ranges from a 2nd- to 6th-order Runge–Kutta scheme. The model can be set up with various lateral boundary condition options and for spatial nesting; there is availability for one-way, two-way or moving nest options. The model is built for a distributed memory environment and uses the Message Passing Interface (MPI) for calculations, which were performed at the Greek National HPC facility—ARIS.
WRF version 3.9.1 was applied to ERA5 forcing data to produce results on a horizontal grid spacing of 3000 m. The simulation period spanned a hindcast period of 40 years and 6 months, from 1 January 1980 to 30 June 2020. The model domain covers the eastern and western Med. Sea to be able to capture the predominant wind direction. The vertical structure of the model domain is divided into 50 levels, where the first 400 m of height are discretized into increments of approximately 25 m with a gradual increase in the increment size. The model has approximately 22 levels below 1 km height and is topped at 50 hPa. The setup parameterization follows the one documented in [3].

2.3. Choice of Model Parameters and Setup

The physical parameterizations employed in the study consist of several schemes, including the microphysics WSM 3 class and 5 class single-moment scheme [51], the Kain–Fritsch Scheme cumulus scheme [52] and the Yonsei University Scheme (YSU) planetary boundary layer scheme [28]. In addition, the study uses the Rapid Radiative Transfer Model (RRTM) [26] longwave radiation, the Revised MM5 Surface Layer Scheme [53], the Unified Noah Land Surface Model [54] and the Dudhia shortwave radiation [27]. These parameterizations were selected based on their reliability and computational cost, as supported by previous studies. The details of the motivation for their selection are provided in [23,31]. Moreover, these options have been utilized in previous climate studies [55].
Certain authors have highlighted the challenges that regional climate models (RCMs) such as WRF may encounter when attempting to depict large-scale characteristics due to the constraints imposed by boundary forcing [56]. To mitigate this problem, grid nudging [57,58] was used at the full extent of the computational domain. Every 6 h, the nudging process is carried out on all levels above the planetary boundary layer, except for those below the 10th grid level. The technique of nudging was initially presented in the work of Waldron et al. [59] and von Storch et al. [35] and has since been further improved and explored in numerous studies. However, its implementation is not universally adopted, as evidenced by the works of Alexandru et al. [60] and Miguez-Macho et al. [61]. This disagreement arises from debates surrounding the benefits of constraining the large scales of RCMs and the potential adverse effects that may arise. Some of the errors observed at shorter time scales may be due to challenges in effectively coupling boundaries across different models that the WRF uses.
Various methods of nudging have been developed; some involve fine-tuning while others involve nudging towards larger regions across the entire domain of the RCM. Examples of these techniques are described by Kida et al. [34] and von Storch et al. [35]. In the present simulation, in order to avoid model drift, each run is reinitialized every three months using ERA5 data. This method, which is proposed among others by Pan et al. [62], offers an added advantage as it enables the concurrent execution of simulations for multiple months, leading to a substantial augmentation in computational output. It also circumvents a problem that most regional climate models like WRF exhibit, which is that they cannot conserve mass for longer temporal calculations due to the fact that they were not designed for long runs.

2.4. Computational Environment

The required computational resources, for the dynamic downscaling of the climatic conditions in the region using WRF 3.9.1., were provided by the National Infrastructures for Research and Technology S.A. (GRNET S.A.) in the National HPC facility—ARIS.
In the current work, WRF 3.9.1 was successfully installed and configured to model the entirety of the Hellenic region using a 3000 m × 3000 m grid. The vertical layer calculation includes 50 layers. Each yearly calculation requires approximately 350 × 250 grid points and 50 vertical layers in order to cover the entire Hellenic region for the finer grid. Using a moderate time-stepping of 15 s to 20 s for the finer grid, this translates to over 1.6 × 10⁶ iterations for a yearly calculation. Several calculations were performed to validate the accuracy of the results under different spatial and temporal resolutions. The aforementioned setup yields the best results possible and is in agreement with the literature. Our method of calculation of the wind climate of the area incorporates grid-nudging techniques which are very sensitive to changes in boundary and initial conditions as well as changes in the local topography.
In order to correctly set up a nudging-based calculation that will systematically produce realistic results, a significant number of calculations had to be performed over different temporal periods in the past and with different parametrizations. Grid (or analysis) nudging is prone to numerical error, especially when inappropriate nudging coefficients are used, which are in many cases dependent on the locality of the terrain and on the climatic conditioning. Additional computing power was used to further investigate how to efficiently set up grid nudging and tackle unexpected segmentation faults that occurred almost randomly during the computational session, thus terminating the simulation procedure.
To check the validity of the results and investigate the reasons for the occurring segmentation faults, multiple seasonal calculations were performed (approximately 30 calculations). With a 15 s time-step and a time-stepping duration of the order of 0.04 s for a 480 core calculation (nudging is somewhat associated with weak scaling) and a total of 518,400 iterations (see Table 1 for details) the required core-hours amount to 2764.8 h. For 30 test calculations, this sums up to 80,000 core-hours approximately.
In order to downscale the entirety of the domain for the 40-year hindcast period, an excess of 250,000 core-hours was required, in addition to the aforementioned 80,000 core-hours.

2.5. Sensitivity Analysis and Model Calibration

Several computations were conducted to accurately configure the model and effectively simulate the climate characteristics within the computational domain in a customized way that can address the complexity of the local climate. Both the Aegean and Ionian Seas are confined by high-altitude mountainous regions, created as a result of the Hellenic Volcanic Arc [63], thus creating a unique funnel-like wind flow in the area, especially in the Aegean Sea, where the northern and northwestern wind directions are predominant. This unique topography-dominated wind flow needs to be modeled with specific parametrization. To validate the realism of the model, it is necessary to use a stationary observational dataset as a reference to establish the most appropriate model parameters.
In order to estimate how the changes in model parameters influence the results, this study validated the proposed WRF test case results using observations from land-based meteorological stations. The goal was the development of a validation system using in situ ground observations versus the numerical model results. Four statistical indices were utilized to evaluate the accuracy of the WRF test case results. These indices, namely bias, RMSE, Nash–Sutcliffe model efficiency coefficient, and correlation coefficient, were chosen for their established reliability. During the implementation of the methodology, the respective statistical indices were calculated at each meteorological station and were correlated with the corresponding WRF result at the same location for all the available times that both simulated and observed data were available. Similarly, to derive one statistical index per year, the mean value for all the locations that fell within the region of interest was computed. Additional information about this methodology is shown in the work of Kozyrakis et al. [15], Zhuk et al. [64] and Zodiatis et al. [14].
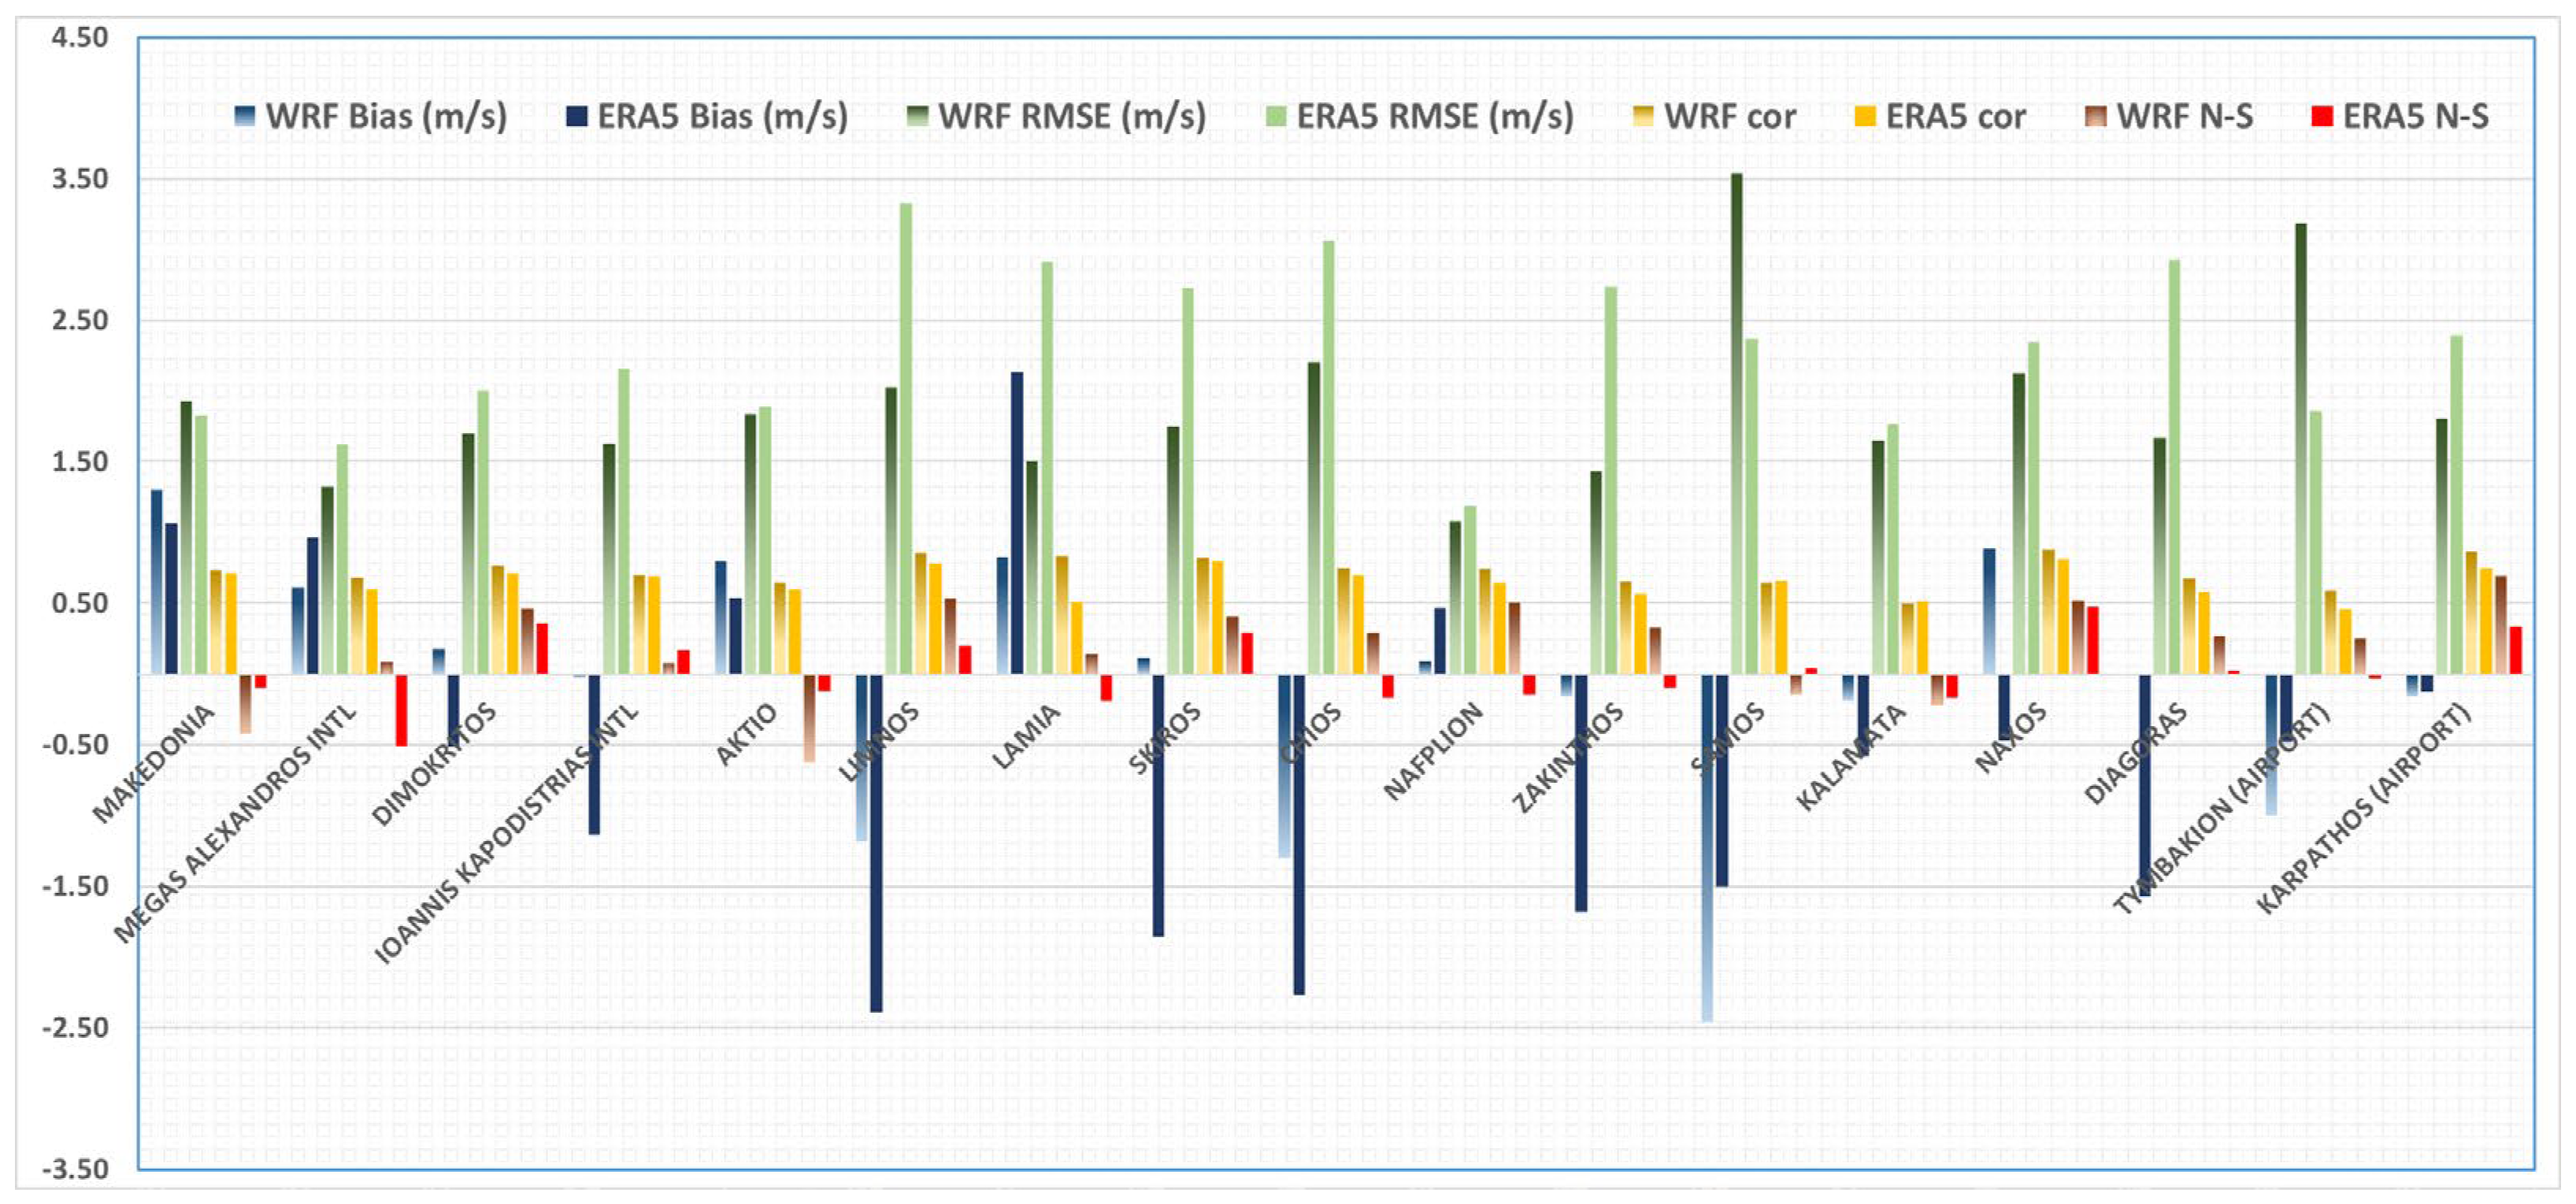
To evaluate the accuracy of the WRF results, several data sources were used, including daily NOAA METAR ISH ground data obtained from the “NOAA National Centers for Environmental Information (2001): Global Surface Hourly” [38]. Priority was given to meteorological stations that fell within the border of the finer-grid domain and covered the Hellenic waters (as shown in Figure 3). ISD/ISH is the Integrated Surface Database/Integrated Surface Hourly data [65,66] composed of worldwide surface weather observations from over 35,000 stations, providing mean hourly results. The meteorological station data used in the study are based mainly on airport meteorological stations (summarized in Figure 3 and Figure 4). The stations used in the study use cup anemometers and wind vanes and the provided results are quality-monitored by NOAA’s National Centers for Environmental Information (NCEI). Wind parameters are normalized in accordance with WMO format and quality standards so that a unified output format is consistent for the entire database. The advantages of using the aforementioned data are that they practically cover the entire globe, are easy to download, are readily available and in some cases span over 50 years in the past, making them ideal for long-term evaluation campaigns.
The results were compared to the NOAA ISD/ISH METAR near-coast stations, effectively demonstrating that the use of grid nudging gives larger correlation coefficient values that enhance performance. The literature consistently reports and anticipates the presence of higher wind-speed bias and root-mean-square error (RMSE) values; please refer to the work of Mass et al. [67] and Lorenz and Barstad [3]. The dynamical downscaling in most locations reduces the RMSE; although, a higher wind-speed RMSE is observed at some stations, as demonstrated in Figure 4. Considering that a downscaling from 27.75 km to 3 km grid spacing is performed, the amount by which the RMSE increases is reasonable. As described by Mass et al. [67], increasing the horizontal grid resolution typically leads to improved resolution of mesoscale atmospheric flow features. However, timing errors in the synchronization between the model and the actual flow are likely to be magnified and subsequently penalized in terms of RMSE. In Figure 4, the bar graph of the aforementioned statistical error indices is shown per meteorological station in the area of interest for the wind speed variable. The indices are calculated for the ERA5 wind input data (without downscaling) and the WRF. The downscaled results demonstrate significant enhancement for all four statistical indices, with lower values of bias and RMSE observed throughout the annual mean and better values of correlation and N-S efficiency coefficients. This improvement is significant when compared to the non-downscaled ERA5 wind data and is observable for the entirety of the year in question, thus demonstrating a highly promising outcome of the methodology followed.
The ERA5-WRF case is more accurate with respect to the bias, RMSE and correlation coefficient indices. By introducing full grid-nudging to the ERA5 input data, the results are significantly improved over all the calculated statistical indices. Other researchers in the literature have also advocated for the use of analysis (grid) nudging [57,58] in wind-related dynamical downscaling projects, including references [3,4,23,34,35,57,58,59,67,68].
On the contrary, tests carried out using spectral nudging [61] generated outcomes that were comparatively less precise than the non-nudged ones, always using the land meteorological station data as a baseline. Therefore, the use of the aforementioned setup parameters, utilizing analysis nudging, is proposed as optimal parametrization for the subsequent calculations.

3. Results

Due to the sheer volume of the results for a 40-year period, the results are post-processed and presented as annual and interannual mean distributions and seasonal and deviational distributions.
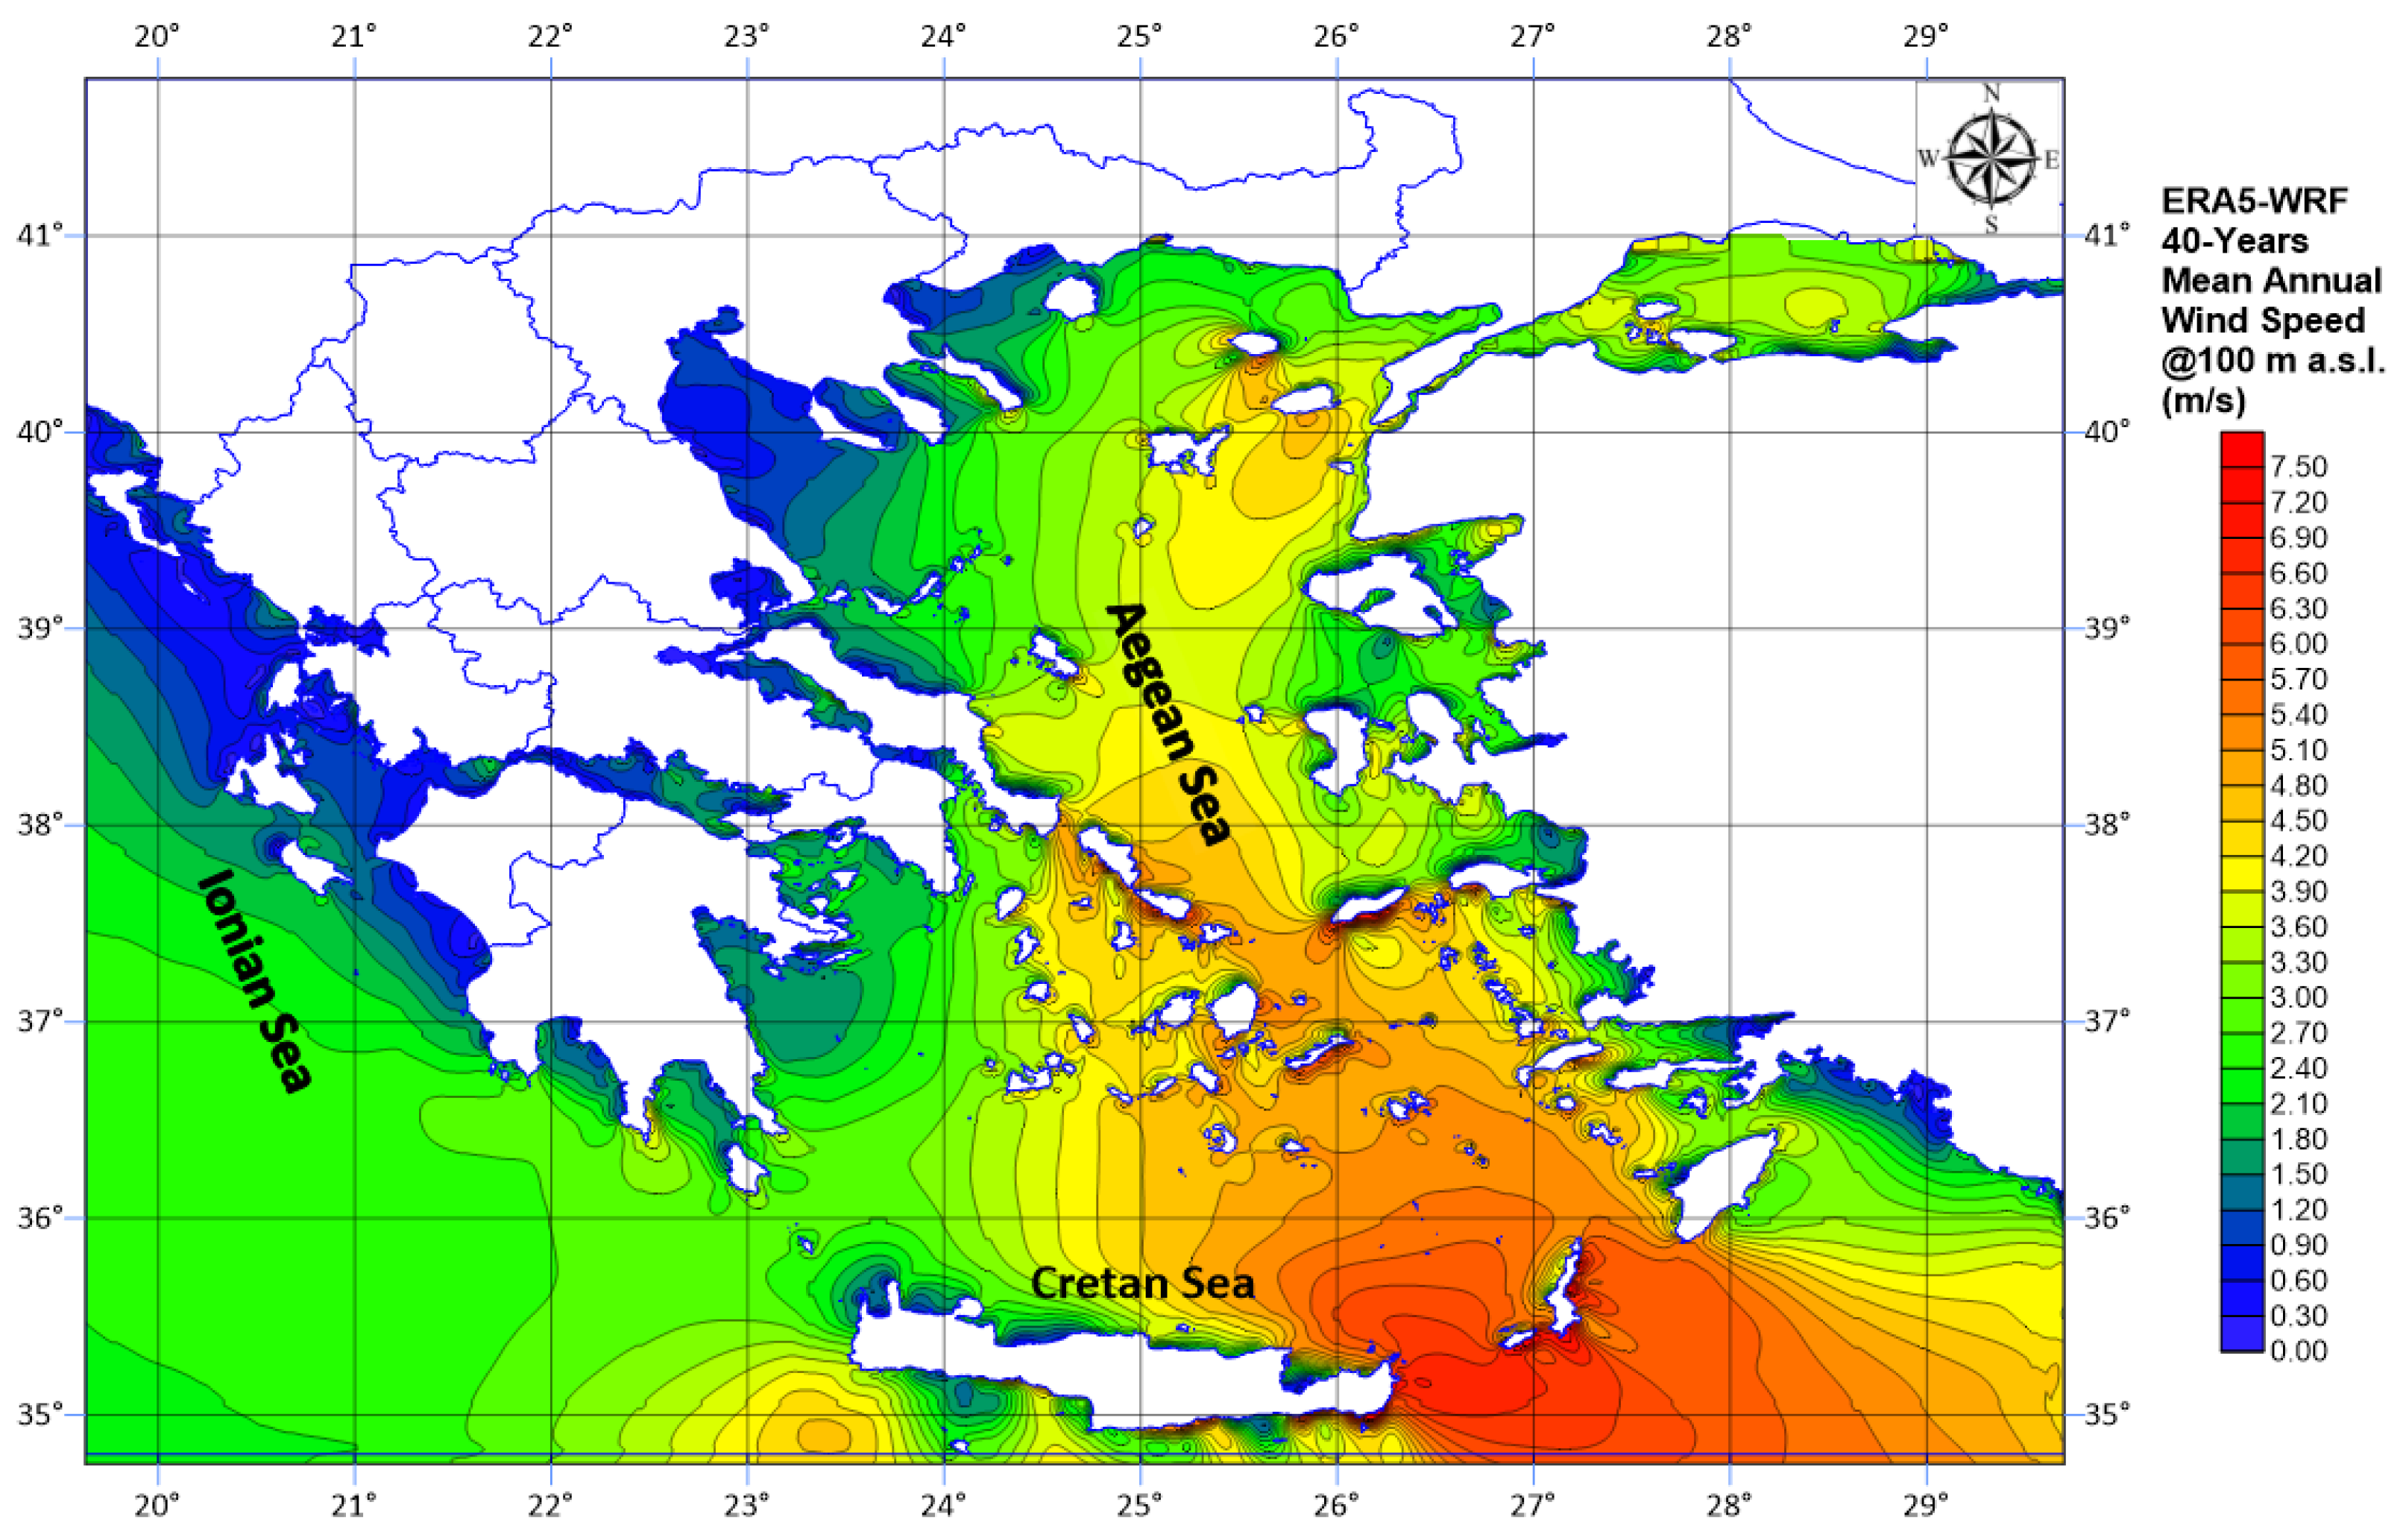
There is significant variability in the downscaled wind climate during the 40-year hindcast period. The reason is twofold: firstly, the long-term climate periodicity; secondly, the climate-change effects. Long-term yearly periodicity is easily monitored, whereas climate-change variability is more difficult to prove, and as it is not within the scope of this project, it will not be further analyzed. The wind distribution obtained by the 3000 × 3000 m grid resolution is not detailed enough to capture accurately the highest wind speeds near the coast in the southeastern Aegean Sea. It is expected that even finer grids would reveal higher wind speed values. However, this is not feasible with the current grid size. Despite this limitation, the wind results (Figure 5 and Figure 6) agree well with the results reported in previous studies [44,69,70]. All given results are computed at 100 m a.s.l. (meters above sea level), unless otherwise mentioned.
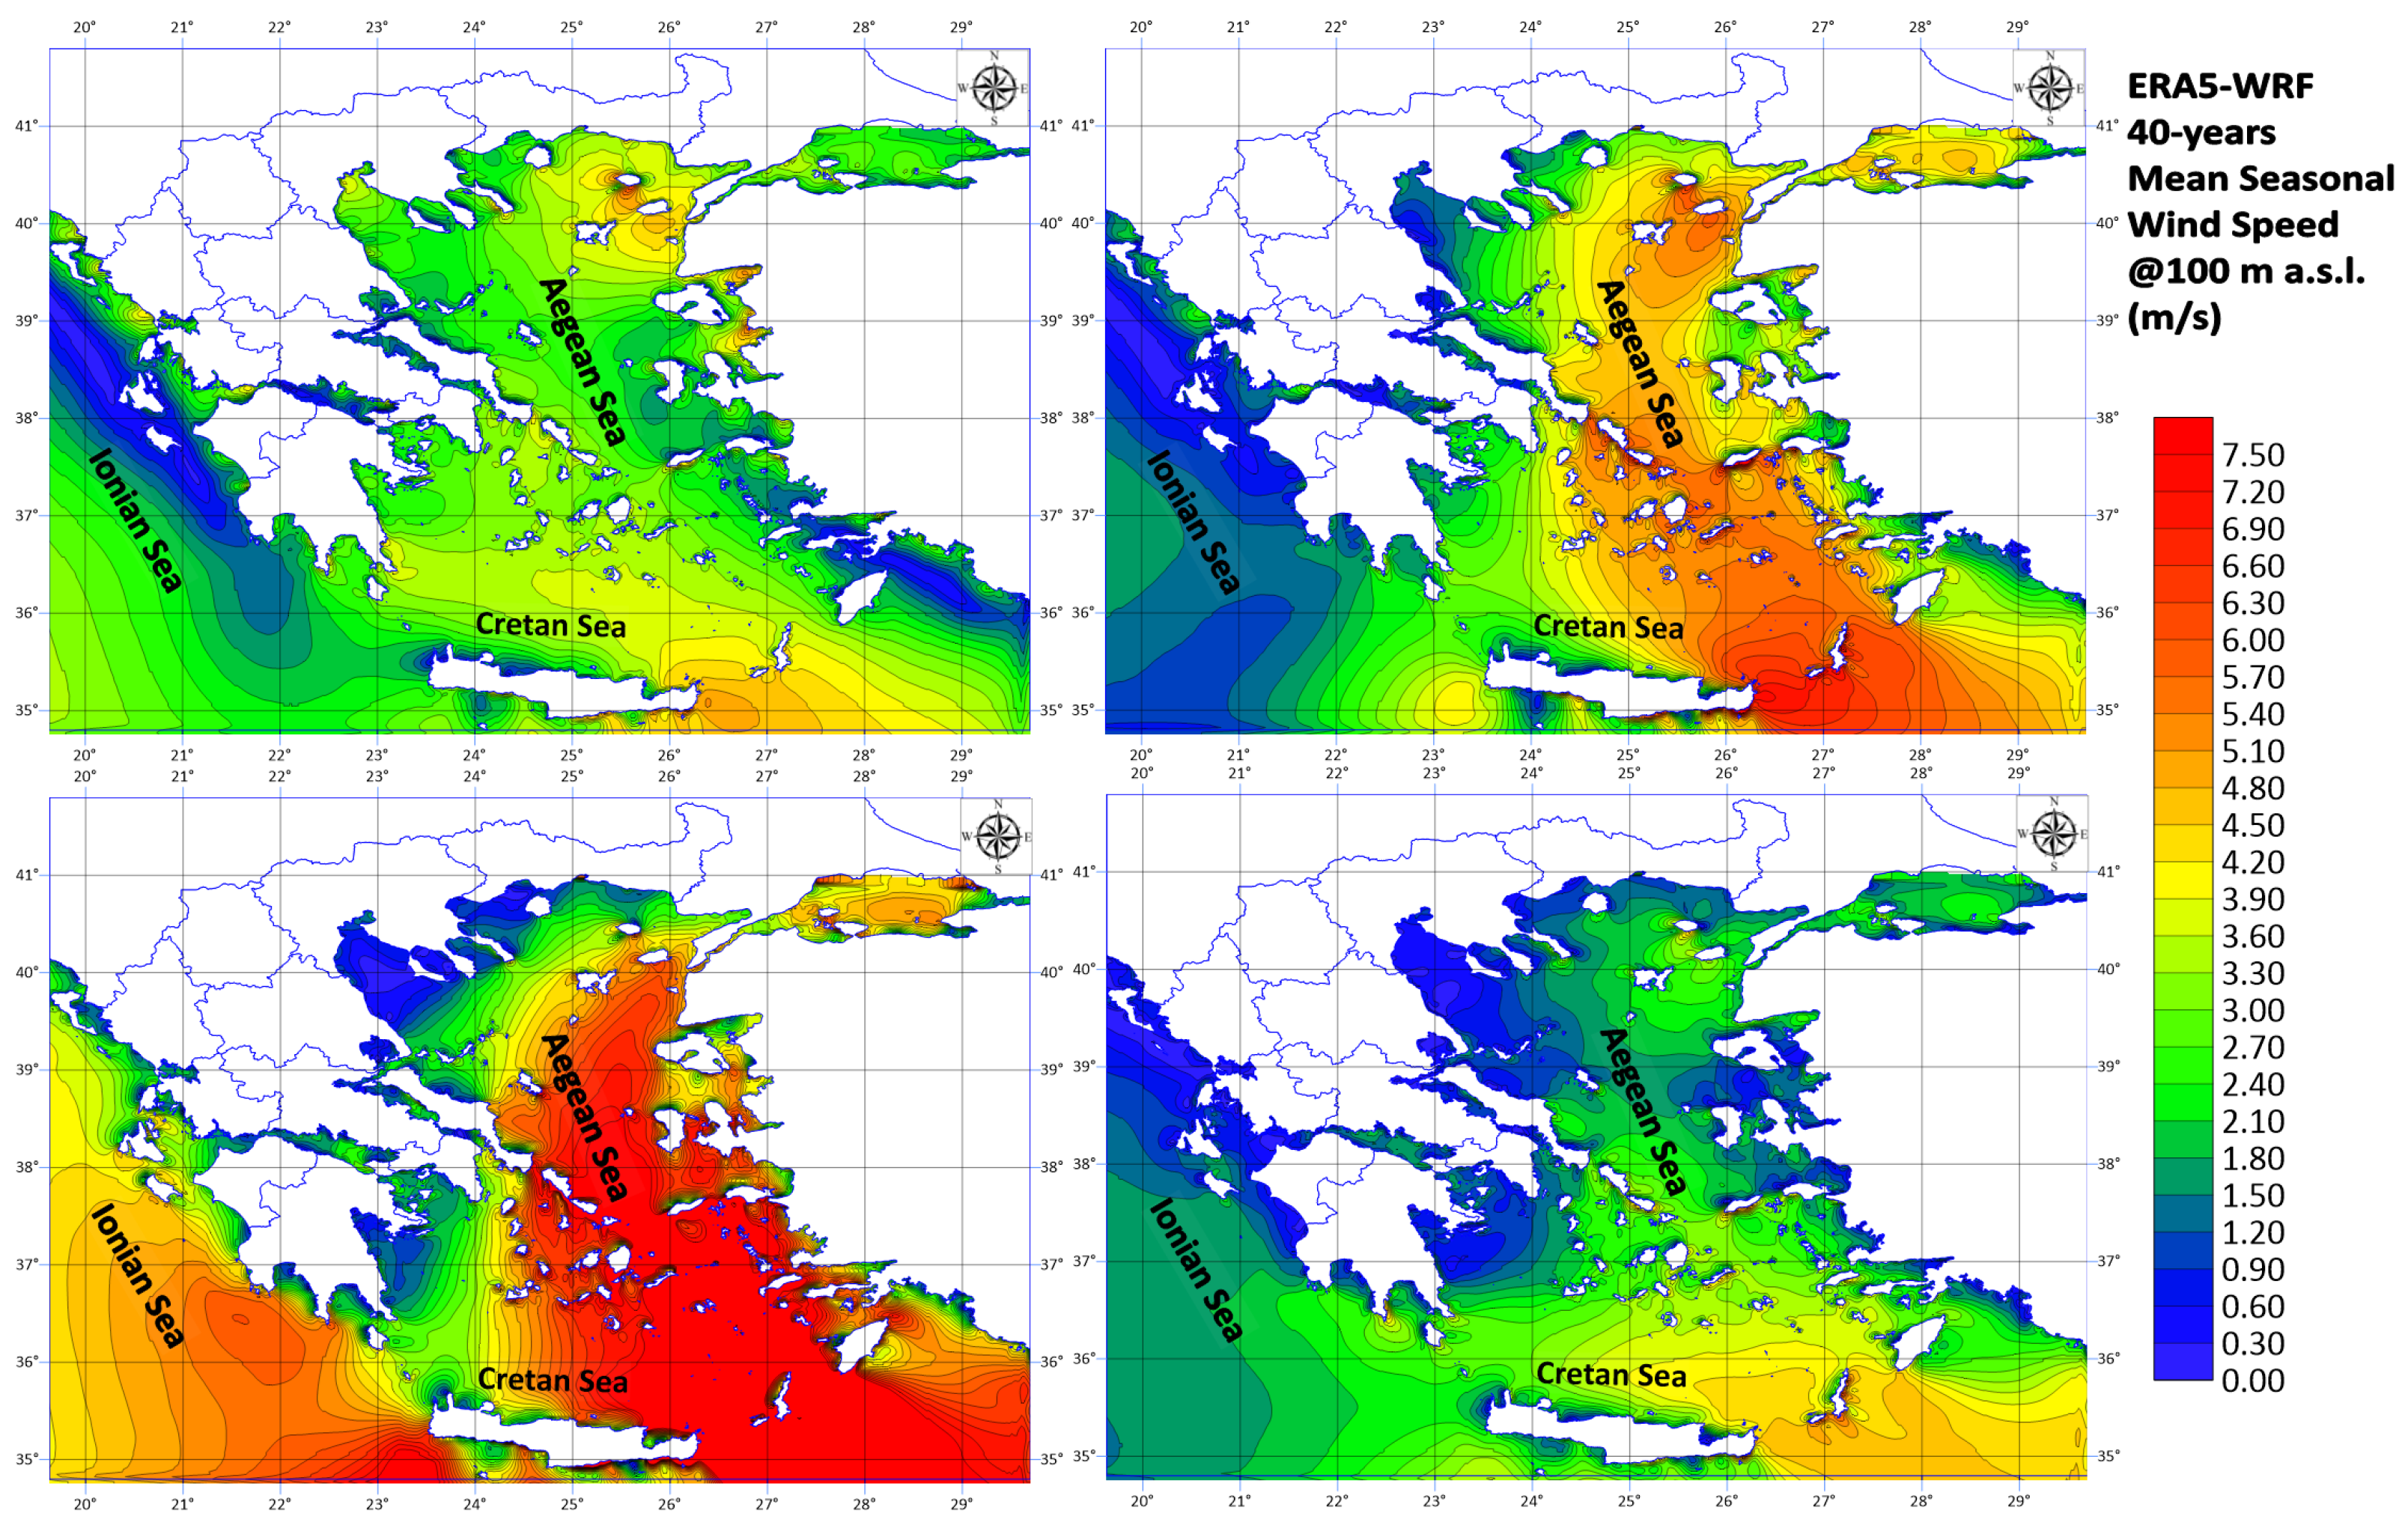
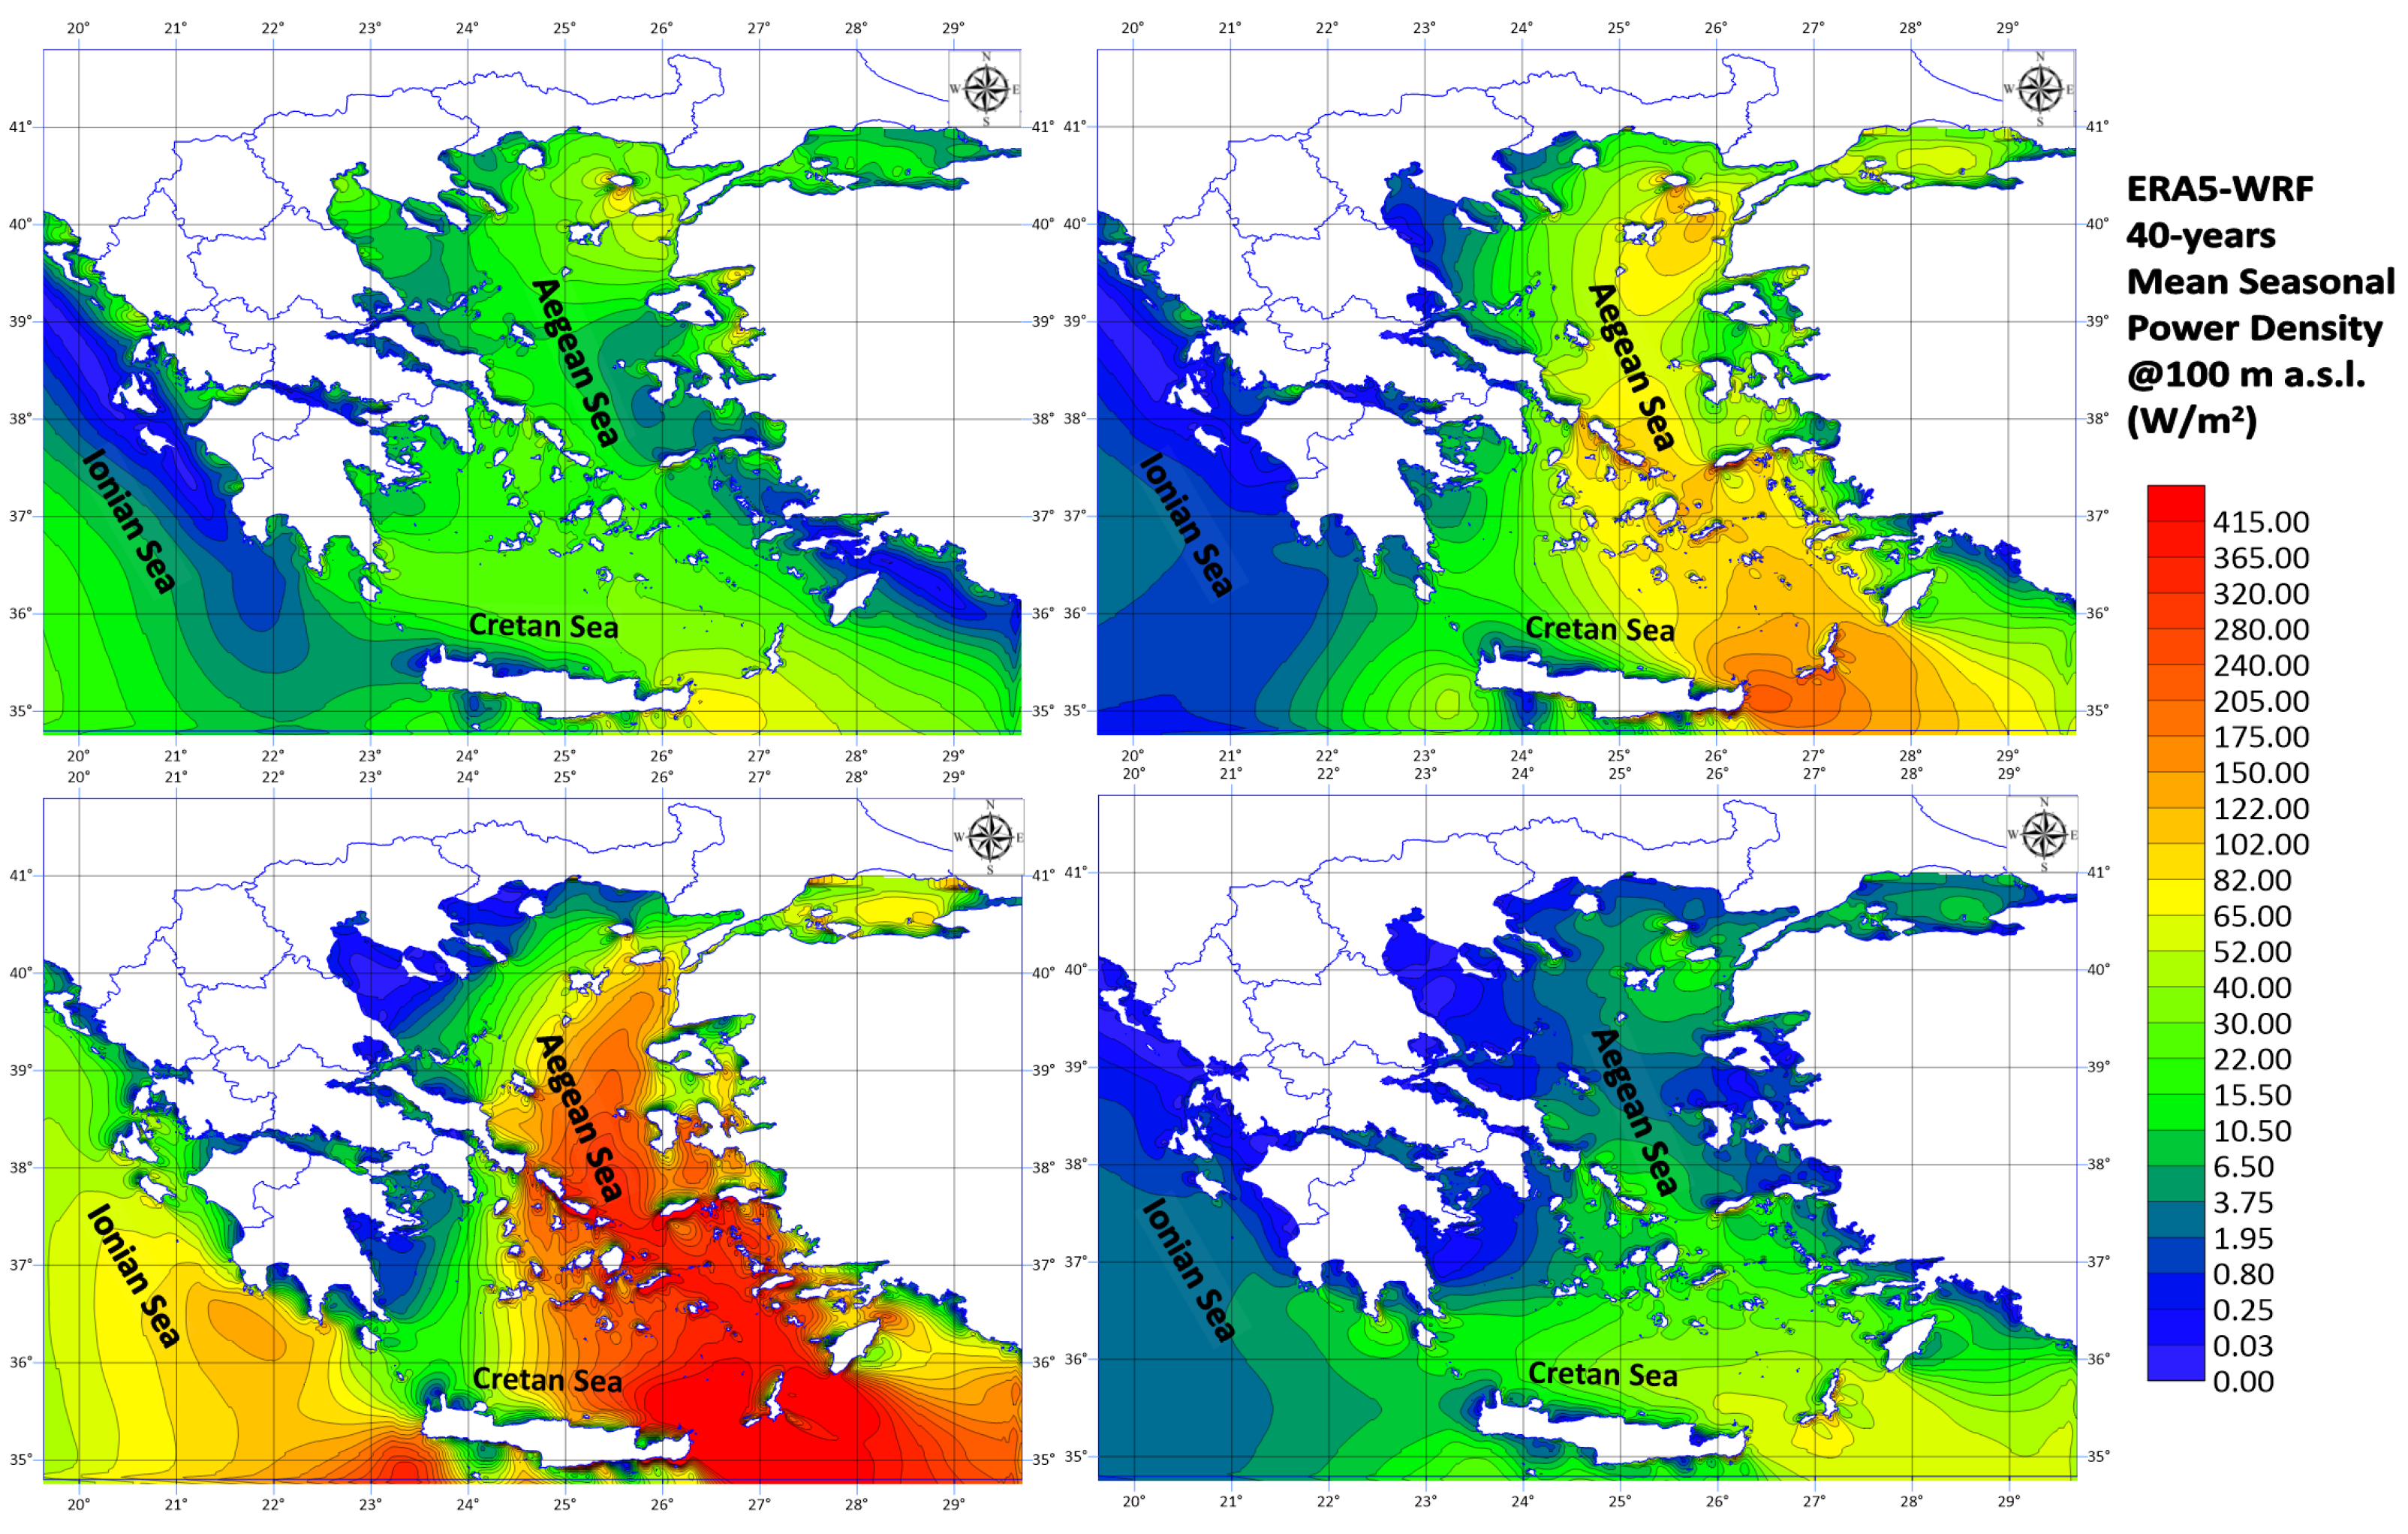
Seasonal variability in wind speed is evident over the 40-year period (Figure 7 and Figure 8). The wind speed distribution during summer and winter is milder than that in other studies. During summer, high wind speeds are observed at the same time as the emergence of Etesian winds [71,72] and occasional intense winds with a southern direction which are usually accompanied by Sahara dust incidents [73]. The wind flow during summer is typically north-northeasterly over the central Aegean, turning northwesterly over the southeastern Aegean, which is a common characteristic of the Etesian flow [71,72]. The spring and autumn distributions are found to be consistent with the literature. During the spring season, wind speeds in the southeastern region of the Aegean Sea, specifically between the islands of Karpathos, Rhodes and eastern Crete, exhibit a more gradual distribution with higher values. The consistent high wind speeds between Karpathos and eastern Crete throughout the year can be attributed to the distinctive local topography of these islands, where certain areas have terrain elevations exceeding 1200 m above sea level. The presence of orographic speed-up effects and flow constriction, also known as Venturi effects [71], causes the near-surface wind to follow specific pathways over the sea, resulting in a shift towards northwesterly directions and naturally increasing the distribution of wind speeds in the region.
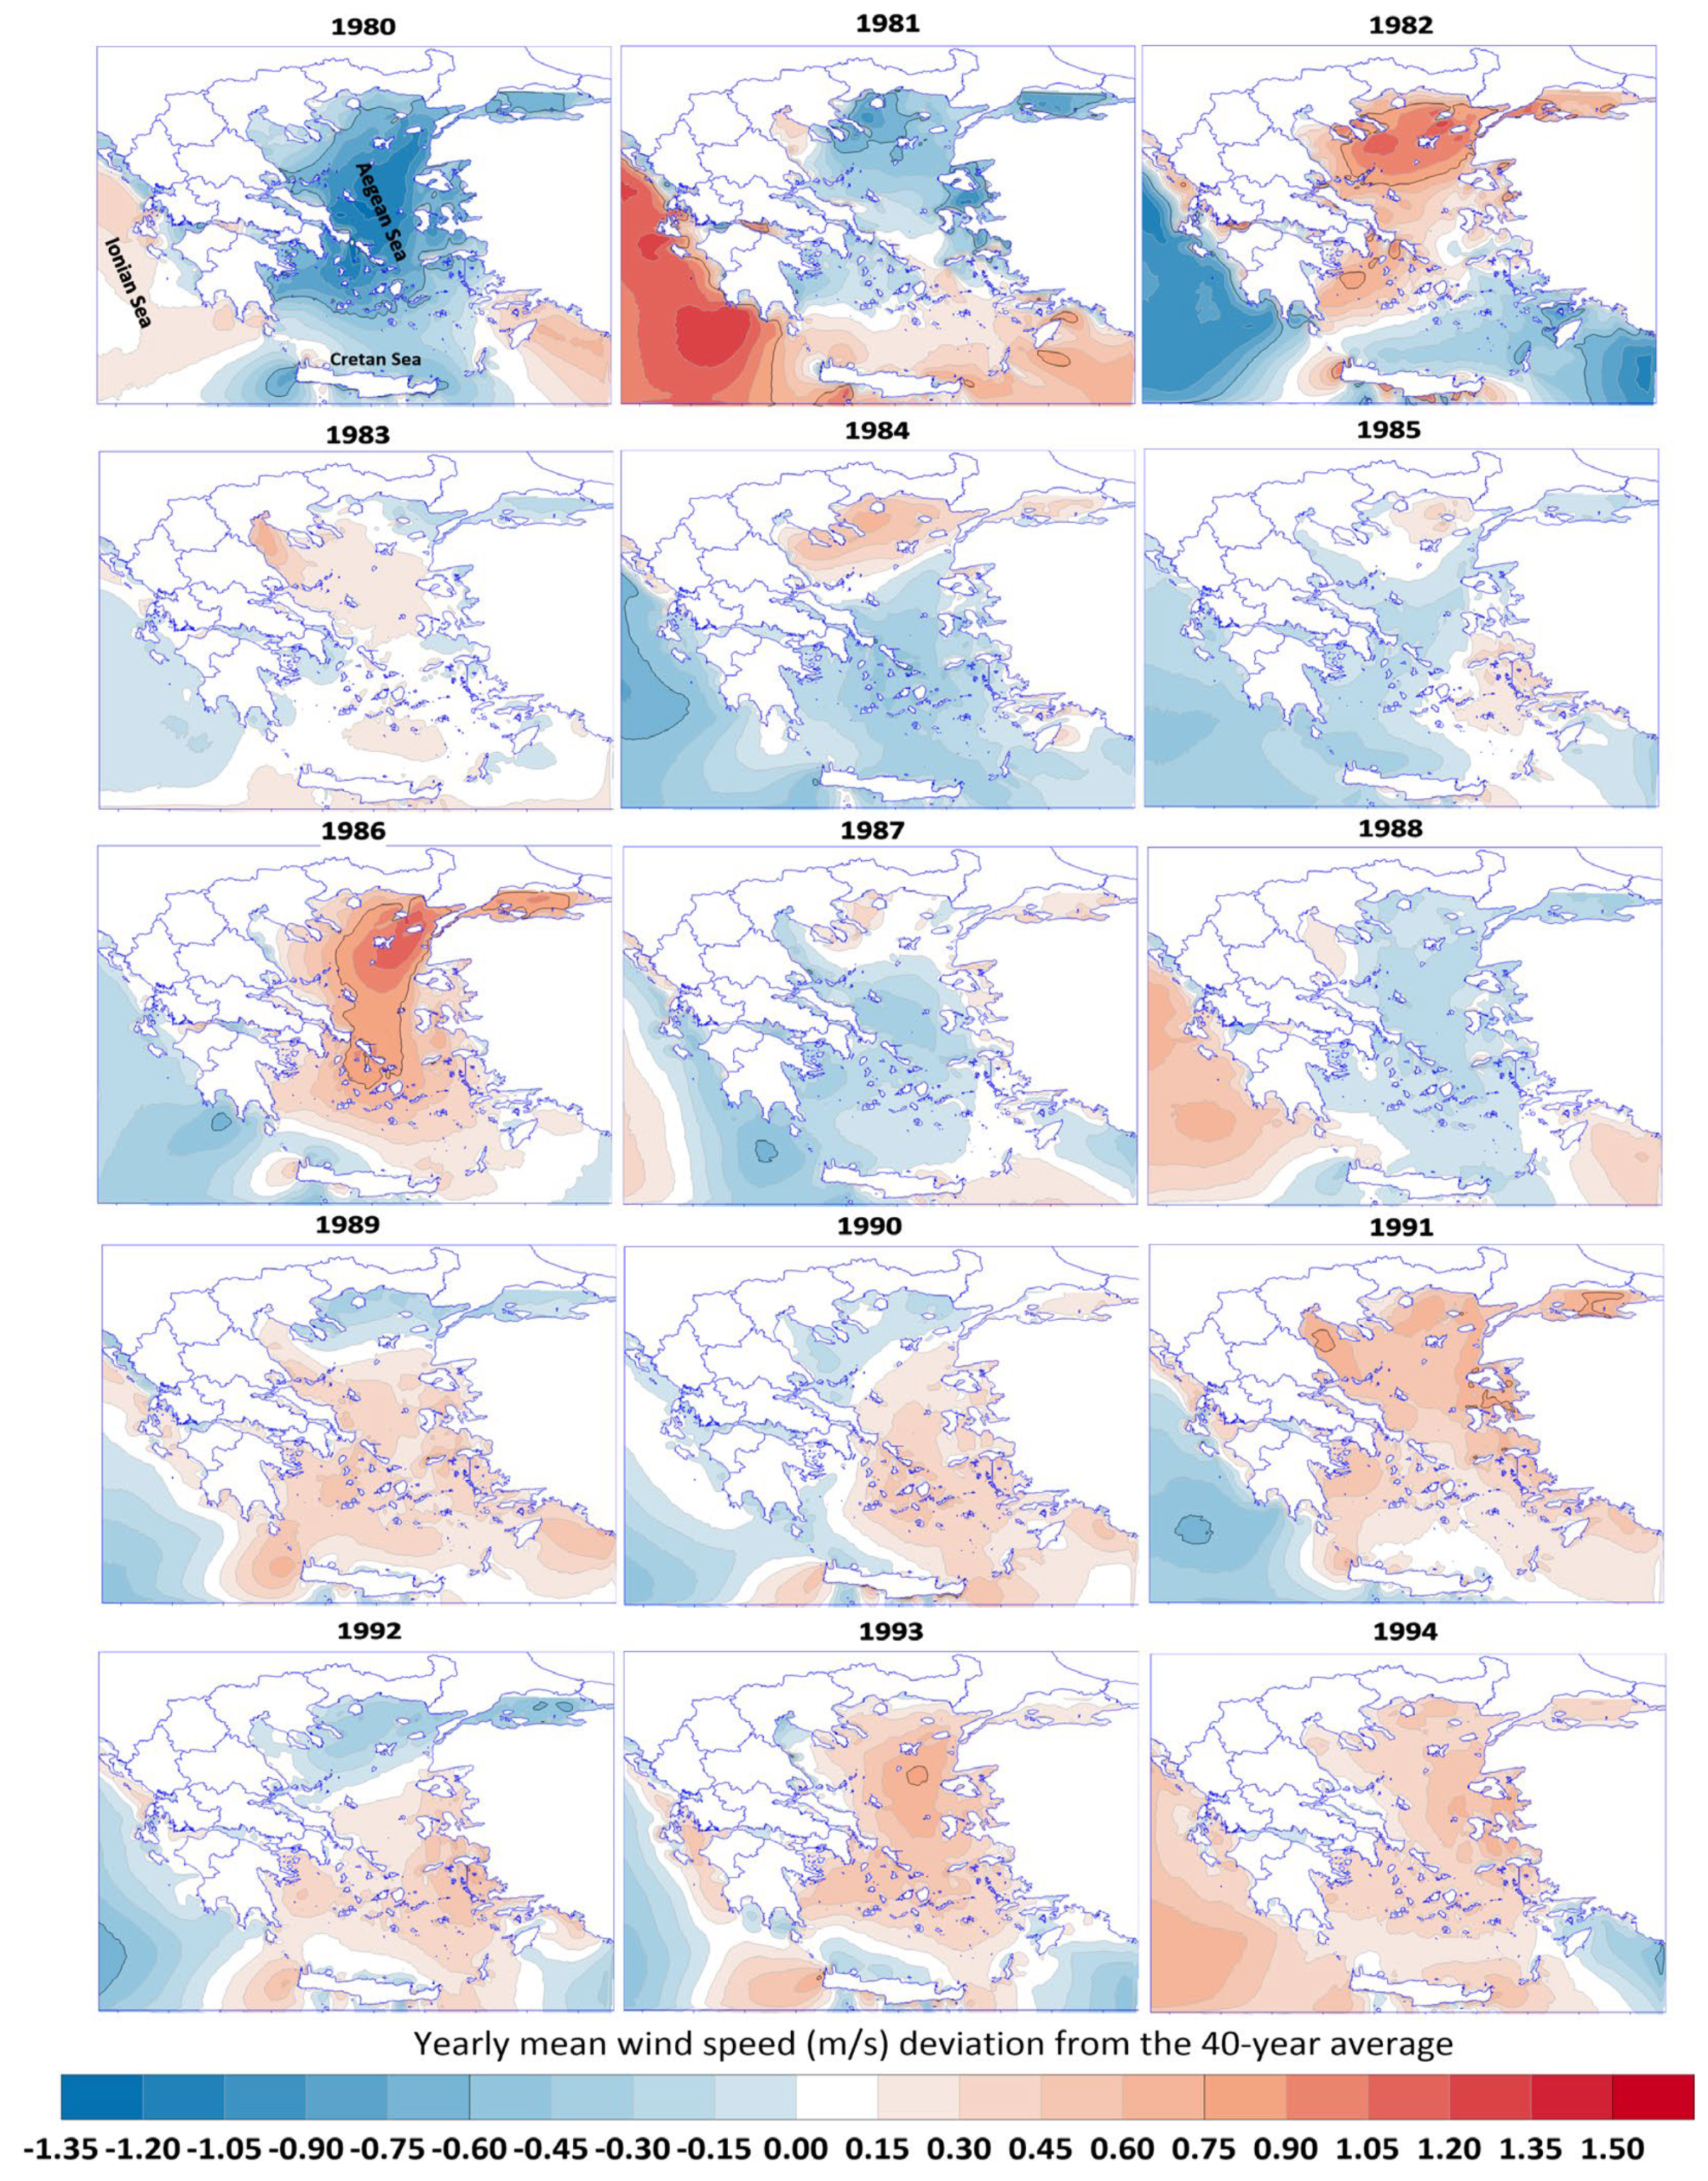
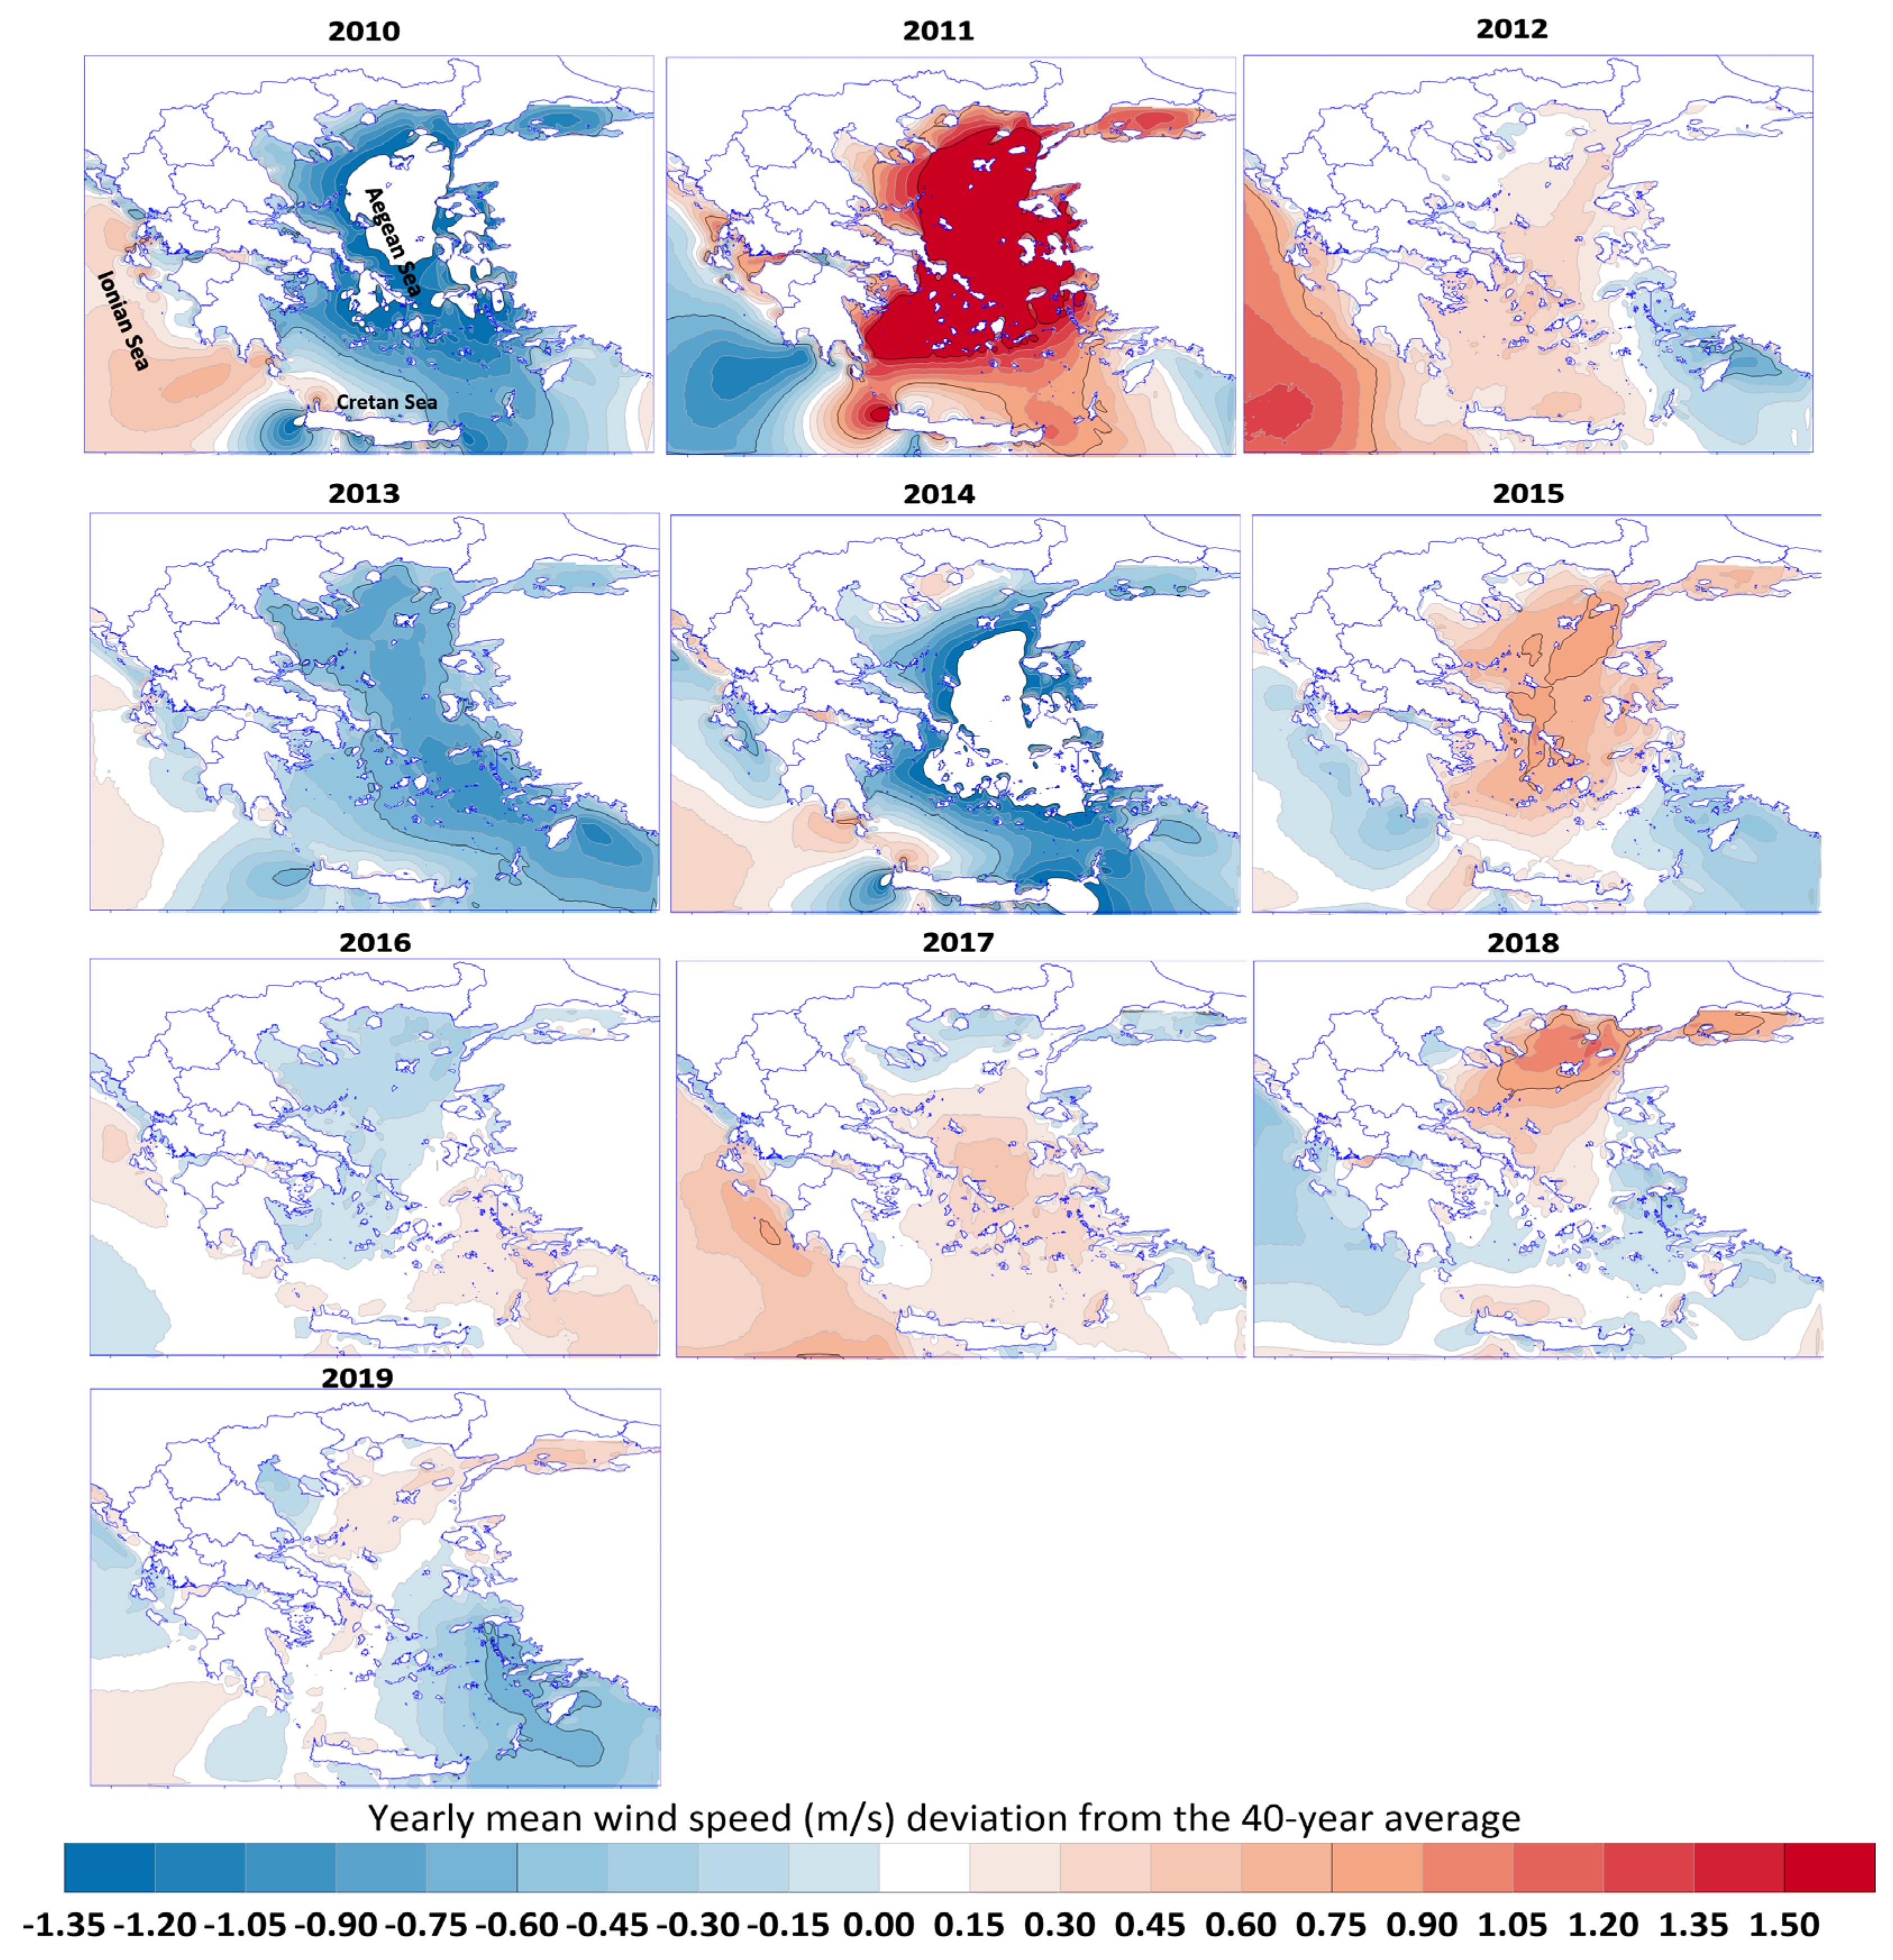
Annual variability (Figure 9, Figure 10, Figure 11 and Figure 12) is also of great importance and presents an interesting variation throughout the 40-year period. The 5-year and yearly mean wind speed deviations from the 40-year averaged distribution were used in this case because a much finer temporal variation can be observed compared to the mean yearly wind speed distribution. White contoured regions depict no variation from the 40-year mean, hot regions (red spectrum) show increased wind speed and cold regions (blue spectrum) show decreased speed compared to the 40-year mean. During the first decade (1980–1989), stronger yearly wind speeds are found during the years 1981, 1982 and 1986. For 1982 and 1986, higher values are found in the northeastern Aegean Sea. During the second decade (1990–1999), the year 1994 shows higher wind speed values in the entire area of interest, whereas for the third decade (2000–2009), the years 2000, 2003 and 2006 display peak average wind speeds. During the last decade (2010–2019), the year 2011 displays a very distinct difference compared to all the previous years throughout the 40-year period. Such a strong wind distribution is unique in the 40-year calculations. This wind distribution is strongly connected to the double-dip La Niña event [74,75] that occurred in late 2010 and early and middle 2011. La Niña is a well-studied periodic cooling of ocean surface temperatures in the central and east-central equatorial Pacific Ocean and accounts for the cold phase of the El Niño–Southern Oscillation (ENSO) cycle. Although it seems unrelated to the local wind climate, its influence has been documented in the literature on multiple occasions. For example, Feng et al. [74] illustrate how sea level, sea-surface temperature and wind stress anomalies were distributed under La Niña’s lasting influence during the 2010–2011 extreme event. During the 40-year period, there exists an obvious alternating pattern in the wind velocity, interchanging between the Aegean and Ionian Seas, but it is very difficult to determine an exact frequency of alternation. The overall distribution remains bounded throughout the years, displaying only occasional and non-periodic extremities.
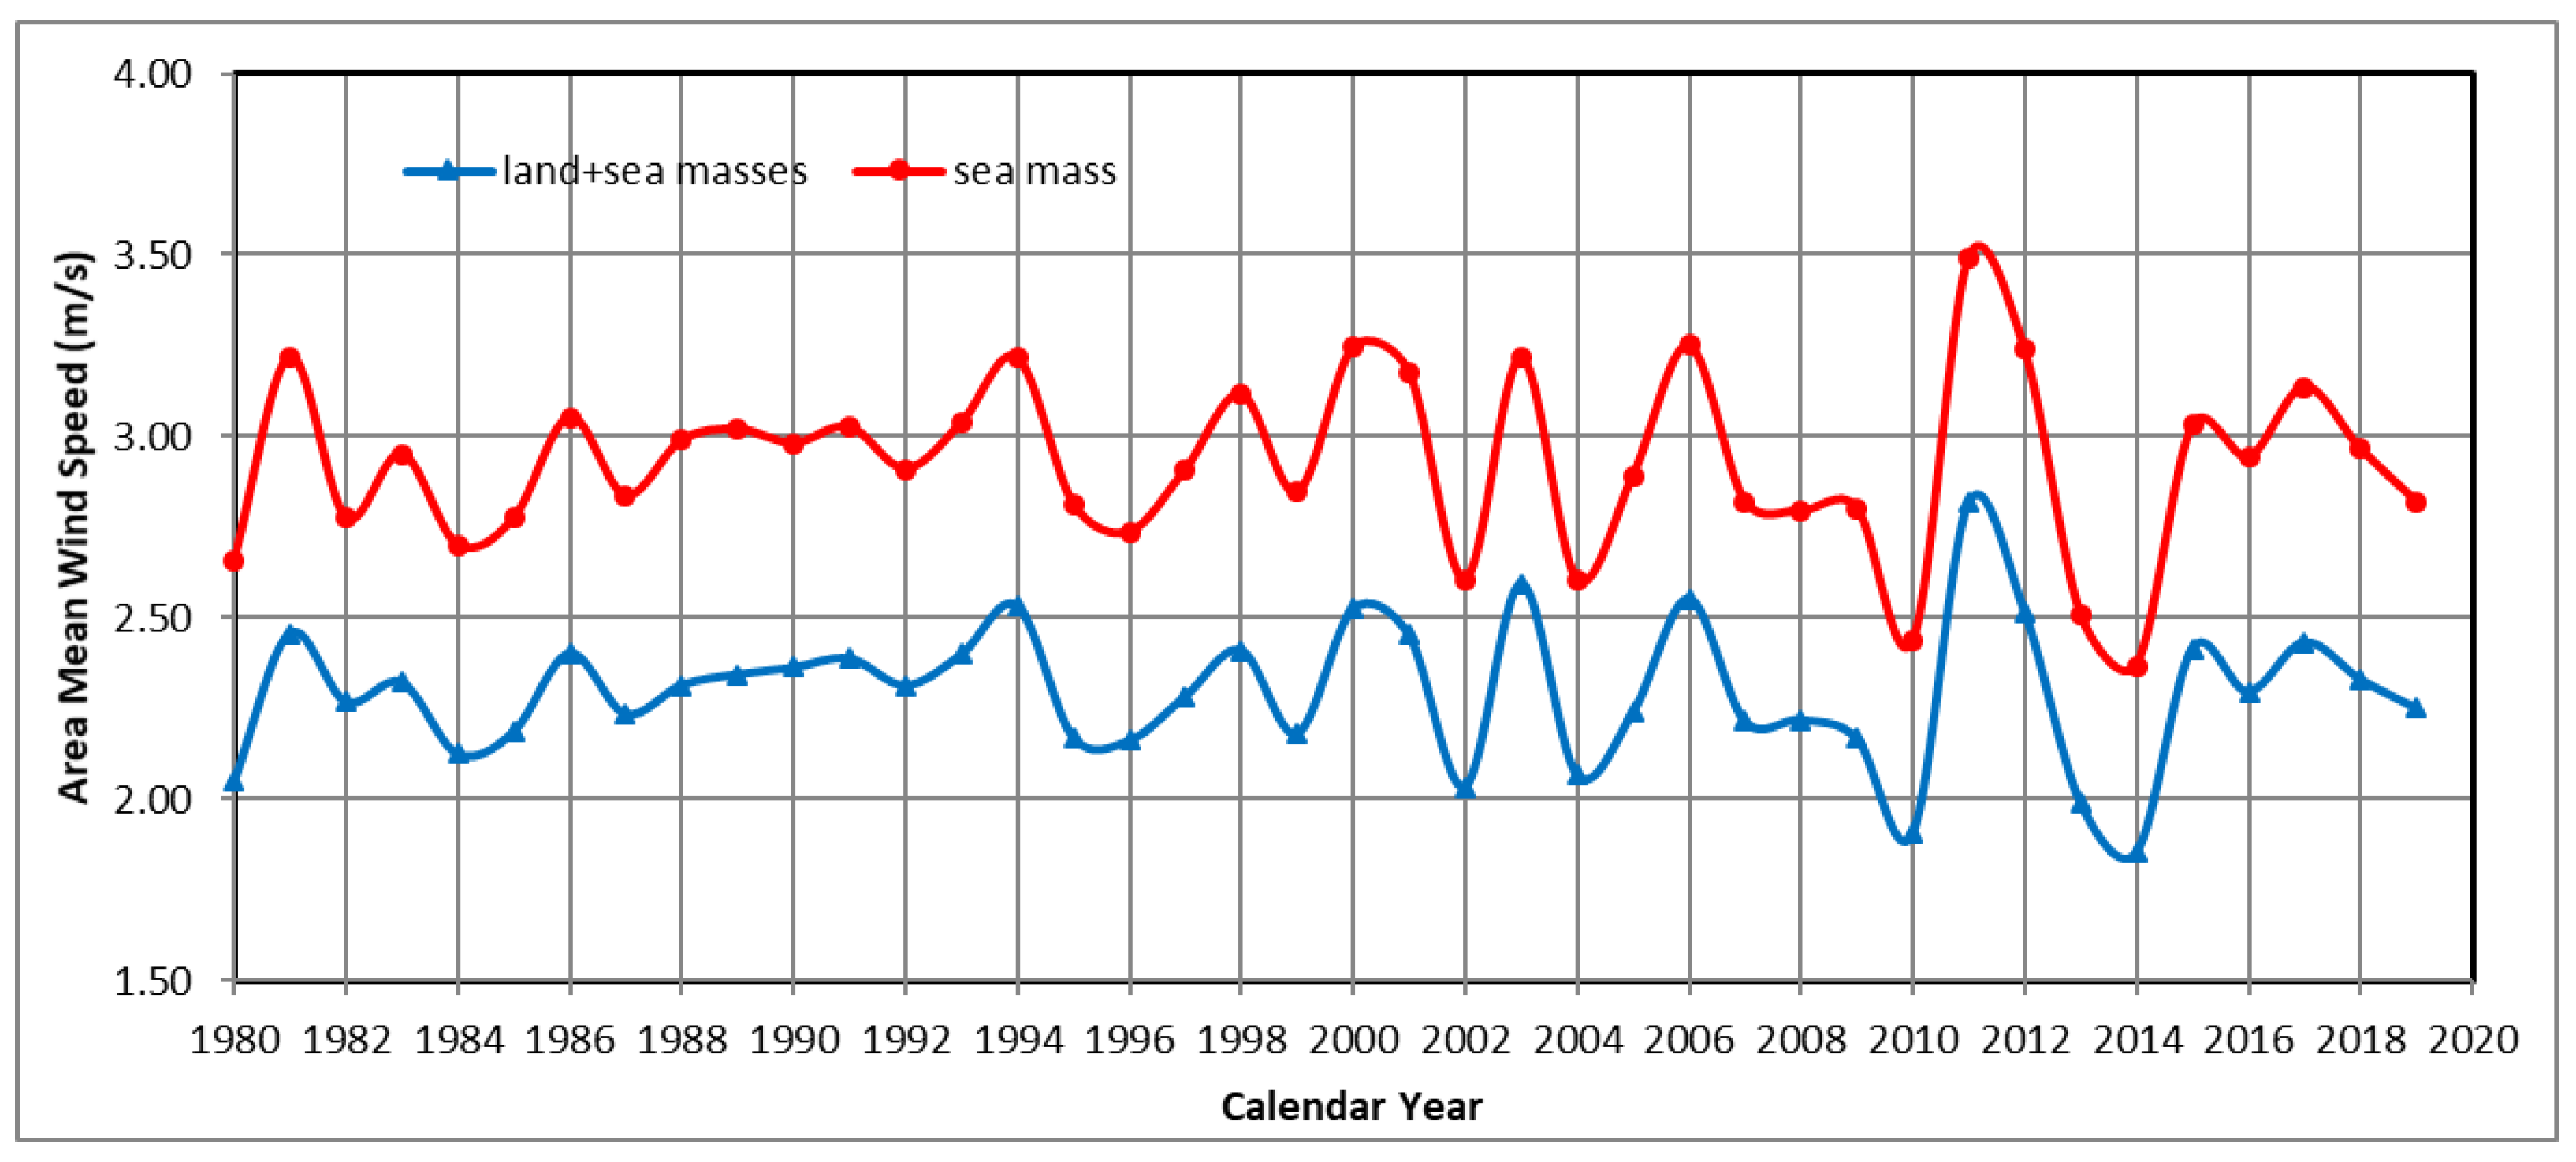
Figure 13 shows details on the area-mean wind speed over “Sea-only” and “Sea+Land” masses for the region of interest, calculated within the limits of the computational grid. This figure summarizes which years present higher wind speed values during the 40-year period and how the area-mean wind speed over sea mass correlates to the wind speed over the entire domain (both land and sea masses). The wind flow over the complex terrain of the eastern Med. displays significantly lower velocities compared to the flow over sea masses in the Aegean and Ionian Seas. Wind flow over terrestrial domains is characterized by higher turbulence intensity distributions, flow separation and deflection due to terrestrial formations, blockage effects, flow deceleration due to increased roughness heights, etc. These effects significantly decrease terrestrial flow velocities compared to the wind flow over sea masses, where these dependencies are less influential and the sea-surface roughness (dynamic roughness due to wind-generated waves), fetch length, flow duration and direction play a more important role.

4. Discussion

An interesting phenomenon demonstrated in our results, more frequently observed around the Aegean islands, is the existence of an upwind cut-off region in many islands, accompanied by an orographic speed-up effect on the lee side of the island, with respect to the prevailing wind direction [1,76] (Figure 5). Although this is counterintuitive at first, it can easily be explained: On the upwind side, especially near islands with taller topographic features (mountainous regions, hills, etc.), flow recirculation can be caused by an elevated obstacle acting as a physical barrier to the oncoming wind flow. Additionally, rapid changes in surface roughness occurring along the coastline significantly slow down the wind flow. On the leeward side, a short distance from specific islands (e.g., locally in Crete and Evia, Kasos, Karpathos, Ikaria, Samos, Amorgos and others), an increase in wind flow velocity can be found, mainly due to orographic speed-up effects caused by the same mountainous regions. Flow separation can easily occur along the ridgeline of the mountainous formation, causing flow recirculation and a decrease in velocity on the downwind side, but while moving further away from the obstacle, the influence of the orographic speed-up effect is sustained, thus locally increasing the flow velocity. These occurrences are found in specific regions in the Aegean Sea and are absent in others. This is partly due to local atmospheric conditions; the shape, steepness, elevation and orientation (aspect) of the terrestrial formations with respect to the prevailing wind direction; the local wind intensity and quality (turbulence levels, wind shearing, etc.); and possibly other factors.
The wind potential in the northern Ionian Sea is relatively low. The Ionian Sea experiences significantly lower wind potential compared to the Aegean Sea, primarily due to its geographical position that shields it from the northern and northeastern land masses of Albania, western Greece and Epirus. The difference in wind potential between the two regions is substantial, reaching several orders of magnitude. The annual wind speeds in the region are generally low, ranging from 2.5–3.5 m/s close to the north up to 3.5–4.5 m/s in the southern Ionian Sea. However, certain individual years within the 40-year calculation period have shown annual mean wind speeds of up to 4.5 m/s in the area surrounding southern Peloponnesus, Kithira Island and the western Cretan Sea, where the presence of open fronts from the eastern and western ends provides greater fetch lengths, particularly when north-northwesterly and westerly wind directions prevail. These wind directions have a higher likelihood of occurring in the region. The mean wind speed distribution during the summer months in the area can reach up to 6 m/s, while in the Aegean Sea, it can exceed 7.5 m/s in certain locations during the same period. The region commonly encounters wind directions predominantly from the north to northwesterly directions, which further shift towards the northwesterly direction in the vicinity of the Cretan Sea. The land areas of Peloponnesus and Crete, with their mountainous topography shaped under the influence of the Hellenic Volcanic Arc, are primarily influenced by these principal wind directions while obstructing the rest.

5. Conclusions

Seasonal variations in wind speed distribution have been well established based on 40-year calculations. The wind speed distribution during summertime is generally mild, while that for winter is more pronounced. The regions with high wind speeds have been identified, with the southeastern Aegean Sea presenting a clear increase in wind speed, showing the highest magnitude in the eastern Med. Sea, near Karpathos Island. The wind potential in the northern Ionian Sea is relatively low. This is due to the region being shielded by the northern and northeastern orography of Albania, western Greece and Epirus, which significantly reduces its wind potential compared to the Aegean. However, the area between the southern Ionian Sea and the western Cretan Sea displays increased wind speed values. In the winter, the mean wind speed distribution can be as high as 6 m/s, while in some specific locations in the Aegean Sea, it is more than 7.5 m/s during the same period. Annual variability is evident in the region throughout the 40-year period with some occasional and non-periodic extremities. There exists an alternating pattern in the wind velocity, interchanging between the Aegean and Ionian Seas, but it is currently difficult to quantify. This study has identified the high-wind regions within the Hellenic waters. These findings provide valuable insights into the wind patterns and high-wind regions of the Hellenic waters, which can inform future research and planning for renewable energy projects. There is growing interest in harvesting the wind energy potential of the central and southern Aegean Sea. Compared to the wind speed magnitudes, for example, of the northeastern Atlantic coasts, the wind speeds are lower in the Hellenic region, but the Hellenic Archipelago offers a number of significant benefits to potential investors. These include the close proximity of the potential sites to the coastlines, the shorter connections to the regional power grids, the existence of pockets of high wind energy in the central and southern Aegean Sea and Cretan Sea, the increase in supplemented energy capacity, and the additional electrification of Hellenic islands with renewable energy resources, thus making future wind energy exploitation in the region very rewarding.

Author Contributions

Conceptualization, G.V.K. and C.C.; methodology, G.V.K. and C.C.; software, G.V.K., C.C. and A.P.; validation, G.V.K., C.C. and A.P.; formal analysis, G.V.K., C.C. and N.A.K.; investigation, G.V.K.; resources, G.V.K.; data curation, G.V.K., C.C. and A.P.; writing—original draft preparation, G.V.K., C.C., A.P. and N.A.K.; writing—review and editing, G.V.K., C.C., A.P. and N.A.K.; visualization, G.V.K. and A.P.; supervision, G.V.K., C.C. and N.A.K.; project administration, G.V.K. and C.C.; funding acquisition, G.V.K., C.C. and N.A.K. All authors have read and agreed to the published version of the manuscript.

Funding

This project has received funding from the Hellenic Foundation for Research and Innovation (HFRI) and the General Secretariat for Research and Innovation (GSRI), under grant agreement No. 1237. This publication is financed by the Project “Strengthening and optimizing the operation of MODY services and academic and research units of the Hellenic Mediterranean University”, funded by the Public Investment Program of the Greek Ministry of Education and Religious Affairs.

Data Availability Statement

Data are available from the corresponding author upon reasonable request.

Acknowledgments

This work was supported by computational time granted from the National Infrastructures for Research and Technology S.A. (GRNET S.A.) in the National HPC facility—ARIS—under project ID PA200603/DyDoWind.

Conflicts of Interest

The authors declare no conflict of interest.

References

  1. Badger, J.; Frank, H.; Hahmann, A.N.; Giebel, G. Wind-Climate Estimation Based on Mesoscale and Microscale Modeling: Statistical–Dynamical Downscaling for Wind Energy Applications. J. Appl. Meteorol. Climatol. 2014, 53, 1901–1919. [Google Scholar] [CrossRef]
  2. Cox, R.M.; Sontowski, J.; Dougherty, C.M. An evaluation of three diagnostic wind models (CALMET, MCSCIPUF, and SWIFT) with wind data from the Dipole Pride 26 field experiments. Meteorol. Appl. 2005, 12, 329–341. [Google Scholar] [CrossRef]
  3. Lorenz, T.; Barstad, I. A dynamical downscaling of ERA-Interim in the North Sea using WRF with a 3 km grid—For wind resource applications. Wind Energy 2016, 19, 1945–1959. [Google Scholar] [CrossRef]
  4. Soares, P.M.M.; Cardoso, R.M.; Miranda, P.M.A.; de Medeiros, J.; Belo-Pereira, M.; Espirito-Santo, F. WRF high resolution dynamical downscaling of ERA-Interim for Portugal. Clim. Dyn. 2012, 39, 2497–2522. [Google Scholar] [CrossRef]
  5. Tammelin, B.; Vihma, T.; Atlaskin, E.; Badger, J.; Fortelius, C.; Gregow, H.; Horttanainen, M.; Hyvönen, R.; Kilpinen, J.; Latikka, J.; et al. Production of the Finnish Wind Atlas. Wind Energy 2013, 16, 19–35. [Google Scholar] [CrossRef]
  6. Skamarock, W.C.; Klemp, J.B.; Dudhia, J.; Gill, D.O.; Barker, M.; Duda, K.G.; Huang, Y.; Wang, W.; Powers, J.G. A Description of the Advanced Research WRF Version 3; National Center for Atmospheric Research: Boulder, CO, USA, 2008; pp. 1–113. [Google Scholar]
  7. Wang, Y.; Leung, L.R.; McGregor, J.L.; Lee, D.-K.; Wang, W.-C.; Ding, Y.; Kimura, F. Regional Climate Modeling: Progress, Challenges, and Prospects. J. Meteorol. Soc. Japan. Ser. II 2004, 82, 1599–1628. [Google Scholar] [CrossRef] [Green Version]
  8. Fowler, H.J.; Blenkinsop, S.; Tebaldi, C. Linking climate change modelling to impacts studies: Recent advances in downscaling techniques for hydrological modelling. Int. J. Climatol. 2007, 27, 1547–1578. [Google Scholar] [CrossRef]
  9. Solomon, S.; Qin, D.; Manning, M.; Chen, Z.; Marquis, M.; Averyt, K.; Tignor, M.; Miller, H. Climate Change 2007: The Physical Science Basis. Contribution of Working Group I to the Fourth Assessment Report of the Intergovernmental Panel on Climate Change; Cambridge University Press: Cambridge, UK, 2007. [Google Scholar]
  10. Kim, J.; Lee, J.-E. A Multiyear Regional Climate Hindcast for the Western United States Using the Mesoscale Atmospheric Simulation Model. J. Hydrometeorol. 2003, 4, 878–890. [Google Scholar] [CrossRef]
  11. Larsén, X.G.; Badger, J.; Hahmann, A.N.; Mortensen, N.G. The selective dynamical downscaling method for extreme-wind atlases. Wind. Energy 2013, 16, 1167–1182. [Google Scholar] [CrossRef] [Green Version]
  12. Mentaschi, L.; Besio, G.; Cassola, F.; Mazzino, A. Performance Evaluation of Wavewatch III in the Mediterranean Sea. Ocean. Model. 2015, 90, 92–94. [Google Scholar] [CrossRef]
  13. Galanis, G.; Emmanouil, G.; Kalogeri, C.; Kallos, G. Mathematical and Physical Models for the Estimation of Wind-Wave Power Potential in the Eastern Mediterranean Sea. In Mathematics of Planet Earth, Proceedings of the 15th Annual Conference of the International Association for Mathematical Geosciences, Madrid, Spain, 2–6 September 2013; Pardo-Igúzquiza, E., Guardiola-Albert, C., Heredia, J., Moreno-Merino, L., Durán, J.J., Vargas-Guzmán, J.A., Eds.; Springer: Berlin/Heidelberg, Germany, 2014; pp. 561–564. [Google Scholar]
  14. Zodiatis, G.; Radhakrishnan, H.; Galanis, G.N.; Nikolaidis, A.; Emmanouil, G.; Nikolaidis, G.; Lardner, R.; Stylianou, S.; Nikolaidis, M.; Sofianos, S.S.; et al. OM14A-2027: Downscaling the Copernicus marine service in the Eastern Mediterranean. In Proceedings of the Advances in Coastal Ocean Modelling, Prediction and Ocean Observing System Evaluation, Ocean Science meeting, AGU 2018, Portland, OR, USA, 11–16 February 2018. [Google Scholar]
  15. Kozyrakis, G.V.; Galanis, G.; Spanoudaki, K.; Kampanis, N.A.; Zodiatis, G.; Zhuk, E. Long-Term validation of forecasting results based on in situ ground measurements for contributing to the cal/val of the Mediterranean Monitoring and Forecasting Centre (Med-MFC). In Proceedings of the EGU General Assembly 2018, Vienna, Austria, 8–13 April 2018; Volume 20, p. EGU2018–5341. [Google Scholar]
  16. García-Díez, M.; Fernández, J.; San-Martín, D.; Herrera, S.; Gutiérrez, J.M. Assessing and Improving the Local Added Value of WRF for Wind Downscaling. J. Appl. Meteorol. Climatol. 2015, 54, 1556–1568. [Google Scholar] [CrossRef] [Green Version]
  17. Li, N.; Cheung, K.F.; Stopa, J.E.; Hsiao, F.; Chen, Y.-L.; Vega, L.; Cross, P. Thirty-four years of Hawaii wave hindcast from downscaling of climate forecast system reanalysis. Ocean Model. 2016, 100, 78–95. [Google Scholar] [CrossRef] [Green Version]
  18. Tolman, H.L. User manual and system documentation of WAVEWATCH III TM version 3.14. Tech. Note MMAB Contrib. 2009, 276, 220. [Google Scholar]
  19. Booij, N.; Ris, R.C.; Holthuijsen, L.H. A third-generation wave model for coastal regions: 1. Model description and validation. J. Geophys. Res. Oceans 1999, 104, 7649–7666. [Google Scholar] [CrossRef] [Green Version]
  20. Markina, M.; Gavrikov, A.; Gulev, S.; Barnier, B. Developing configuration of WRF model for long-term high-resolution wind wave hindcast over the North Atlantic with WAVEWATCH III. Ocean Dyn. 2018, 68, 1593–1604. [Google Scholar] [CrossRef]
  21. Gualtieri, G. Analysing the uncertainties of reanalysis data used for wind resource assessment: A critical review. Renew. Sustain. Energy Rev. 2022, 167, 112741. [Google Scholar] [CrossRef]
  22. Li, H.; Claremar, B.; Wu, L.; Hallgren, C.; Körnich, H.; Ivanell, S.; Sahlée, E. A sensitivity study of the WRF model in offshore wind modeling over the Baltic Sea. Geosci. Front. 2021, 12, 101229. [Google Scholar] [CrossRef]
  23. Caldwell, P.; Chin, H.-N.S.; Bader, D.C.; Bala, G. Evaluation of a WRF dynamical downscaling simulation over California. Clim. Chang. 2009, 95, 499–521. [Google Scholar] [CrossRef] [Green Version]
  24. Thompson, G.; Rasmussen, R.M.; Manning, K. Explicit Forecasts of Winter Precipitation Using an Improved Bulk Microphysics Scheme. Part I: Description and Sensitivity Analysis. Mon. Weather Rev. 2004, 132, 519–542. [Google Scholar] [CrossRef]
  25. Kain, J.S.; Fritsch, J.M. A One-Dimensional Entraining/Detraining Plume Model and Its Application in Convective Parameterization. J. Atmos. Sci. 1989, 47, 2784–2802. [Google Scholar] [CrossRef]
  26. Mlawer, E.J.; Taubman, S.J.; Brown, P.D.; Iacono, M.J.; Clough, S.A. Radiative transfer for inhomogeneous atmospheres: RRTM, a validated correlated-k model for the longwave. J. Geophys. Res. Atmos. 1997, 102, 16663–16682. [Google Scholar] [CrossRef] [Green Version]
  27. Dudhia, J. Numerical Study of Convection Observed during the Winter Monsoon Experiment Using a Mesoscale Two-Dimensional Model. J. Atmos. Sci. 1988, 46, 3077–3107. [Google Scholar] [CrossRef]
  28. Hong, S.-Y.; Noh, Y.; Dudhia, J. A New Vertical Diffusion Package with an Explicit Treatment of Entrainment Processes. Mon. Weather Rev. 2006, 134, 2318–2341. [Google Scholar] [CrossRef] [Green Version]
  29. Smirnova, T.G.; Brown, J.M.; Benjamin, S.G. Performance of Different Soil Model Configurations in Simulating Ground Surface Temperature and Surface Fluxes. Mon. Weather Rev. 1997, 125, 1870–1884. [Google Scholar] [CrossRef]
  30. Smirnova, T.G.; Brown, J.M.; Benjamin, S.G.; Kim, D. Parameterization of cold-season processes in the MAPS land-surface scheme. J. Geophys. Res. Atmos. 2000, 105, 4077–4086. [Google Scholar] [CrossRef]
  31. Chin, H. Dynamical Downscaling of GCM Simulations: Toward the Improvement of Forecast Bias over California (No. LLNL-TR-407576); Lawrence Livermore National Lab. (LLNL): Livermore, CA, USA, 2008. [Google Scholar]
  32. Arasa, R.; Porras Alegre, I.; Domingo-Dalmau, A.; Picanyol, M.; Codina, B.; Ángeles González, M.; Piñón, J. Defining a Standard Methodology to Obtain Optimum WRF Configuration for Operational Forecast: Application over the Port of Huelva (Southern Spain). Atmos. Clim. Sci. 2016, 6, 329–350. [Google Scholar] [CrossRef] [Green Version]
  33. Aligo, E.A.; Gallus, W.A.; Segal, M. On the Impact of WRF Model Vertical Grid Resolution on Midwest Summer Rainfall Forecasts. Weather Forecast. 2009, 24, 575–594. [Google Scholar] [CrossRef] [Green Version]
  34. Kida, H.; Koide, T.; Sasaki, H.; Chiba, M. A new approach for coupling a limited area model to a GCM for regional climate simulations. J. Meteorol. Soc. Japan Ser. II 1991, 69, 723–728. [Google Scholar] [CrossRef] [Green Version]
  35. von Storch, H.; Langenberg, H.; Feser, F. A Spectral Nudging Technique for Dynamical Downscaling Purposes. Mon. Weather Rev. 2000, 128, 3664–3673. [Google Scholar] [CrossRef]
  36. Copernicus Climate Change Service(C3S). ERA5: Fifth generation of ECMWF atmospheric reanalyses of the global climate. Copernic. Clim. Chang. Serv. Clim. Data Store (CDS) 2017, 15, 2020. [Google Scholar]
  37. EMODnet Bathymetry Consortium. EMODnet Digital Bathymetry (DTM 2018). 2018. Available online: https://emodnet.ec.europa.eu/en (accessed on 20 June 2018).
  38. NOAA National Centers for Environmental Information. Global Surface Hourly [1988–2018]; NOAA National Centers for Environmental Information: Asheville, NC, USA, 2019.
  39. Koletsis, I.; Kotroni, V.; Lagouvardos, K.; Soukissian, T. Assessment of offshore wind speed and power potential over the Mediterranean and the Black Seas under future climate changes. Renew. Sustain. Energy Rev. 2016, 60, 234–245. [Google Scholar] [CrossRef]
  40. Salvação, N.; Guedes Soares, C. Wind resource assessment offshore the Atlantic Iberian coast with the WRF model. Energy 2018, 145, 276–287. [Google Scholar] [CrossRef]
  41. Onea, F.; Rusu, E. A spatial analysis of the offshore wind energy potential related to the Mediterranean islands. Energy Rep. 2022, 8, 99–105. [Google Scholar] [CrossRef]
  42. Soukissian, T.H.; Karathanasi, F.E.; Zaragkas, D.K. Exploiting offshore wind and solar resources in the Mediterranean using ERA5 reanalysis data. Energy Convers. Manag. 2021, 237, 114092. [Google Scholar] [CrossRef]
  43. Soukissian, T.; Papadopoulos, A.; Skrimizeas, P.; Karathanasi, F.; Axaopoulos, P.; Avgoustoglou, E.; Kyriakidou, H.; Tsalis, C.; Voudouri, A.; Gofa, F.; et al. Assessment of offshore wind power potential in the Aegean and Ionian Seas based on high-resolution hindcast model results. AIMS Energy 2017, 5, 268–289. [Google Scholar] [CrossRef]
  44. Majidi Nezhad, M.; Groppi, D.; Marzialetti, P.; Fusilli, L.; Laneve, G.; Cumo, F.; Garcia, D.A. Wind energy potential analysis using Sentinel-1 satellite: A review and a case study on Mediterranean islands. Renew. Sustain. Energy Rev. 2019, 109, 499–513. [Google Scholar] [CrossRef]
  45. Soukissian, T.; Karathanasi, F.; Axaopoulos, P. Satellite-Based Offshore Wind Resource Assessment in the Mediterranean Sea. IEEE J. Ocean. Eng. 2017, 42, 73–86. [Google Scholar] [CrossRef]
  46. Tuy, S.; Lee, H.S.; Chreng, K. Integrated assessment of offshore wind power potential using Weather Research and Forecast (WRF) downscaling with Sentinel-1 satellite imagery, optimal sites, annual energy production and equivalent CO2 reduction. Renew. Sustain. Energy Rev. 2022, 163, 112501. [Google Scholar] [CrossRef]
  47. Yang, S.; Yuan, H.; Dong, L. Offshore wind resource assessment by characterizing weather regimes based on self-organizing map. Environ. Res. Lett. 2022, 17, 124009. [Google Scholar] [CrossRef]
  48. Danielson, J.J.; Gesch, D.B. Global Multi-Resolution Terrain Elevation Data 2010 (GMTED2010); U.S. Geological Survey Open-File Report 2011–1073; U.S. Department of the Interior: Washington, DC, USA, 2011.
  49. Friedl, M.A.; Sulla-Menashe, D.; Tan, B.; Schneider, A.; Ramankutty, N.; Sibley, A.; Huang, X. MODIS Collection 5 global land cover: Algorithm refinements and characterization of new datasets. Remote Sens. Environ. 2010, 114, 168–182. [Google Scholar] [CrossRef]
  50. Besio, G.; Mentaschi, L.; Mazzino, A. Wave energy resource assessment in the Mediterranean Sea on the basis of a 35-year hindcast. Energy 2016, 94, 50–63. [Google Scholar] [CrossRef]
  51. Hong, S.-Y.; Dudhia, J.; Chen, S.-H. A Revised Approach to Ice Microphysical Processes for the Bulk Parameterization of Clouds and Precipitation. Mon. Weather Rev. 2004, 132, 103–120. [Google Scholar] [CrossRef]
  52. Kain, J.S. The Kain–Fritsch Convective Parameterization: An Update. J. Appl. Meteorol. 2004, 43, 170–181. [Google Scholar] [CrossRef]
  53. Jiménez, P.A.; Dudhia, J.; González-Rouco, J.F.; Navarro, J.; Montávez, J.P.; García-Bustamante, E. A Revised Scheme for the WRF Surface Layer Formulation. Mon. Weather Rev. 2012, 140, 898–918. [Google Scholar] [CrossRef] [Green Version]
  54. Tewari, M.; Chen, F.; Wang, W.; Dudhia, J.; LeMone, M.; Mitchell, K.; Ek, M.; Gayno, G.; Wegiel, J. Implementation and verification of the unified NOAH land surface model in the WRF model (Formerly Paper Number 17.5). In Proceedings of the 20th Conference on Weather Analysis and Forecasting/16th Conference on Numerical Weather Prediction, Seattle, WA, USA, 22–26 January 2017; pp. 11–15. [Google Scholar]
  55. Argüeso, D.; Hidalgo-Muñoz, J.M.; Gámiz-Fortis, S.R.; Esteban-Parra, M.J.; Dudhia, J.; Castro-Díez, Y. Evaluation of WRF Parameterizations for Climate Studies over Southern Spain Using a Multistep Regionalization. J. Clim. 2011, 24, 5633–5651. [Google Scholar] [CrossRef]
  56. Jones, R.; Murphy, J.; Noguer, M. Simulation of climate change over Europe using a nested regional-climate model. I: Assessment of control climate, including sensitivity to location of lateral boundaries. Q. J. R. Meteorol. Soc. 1995, 121, 1413–1449. [Google Scholar]
  57. Liu, Y.; Warner, T.T.; Bowers, J.F.; Carson, L.P.; Chen, F.; Clough, C.A.; Davis, C.A.; Egeland, C.H.; Halvorson, S.F.; Huck, T.W., Jr.; et al. The Operational Mesogamma-Scale Analysis and Forecast System of the U.S. Army Test and Evaluation Command. Part I: Overview of the Modeling System, the Forecast Products, and How the Products Are Used. J. Appl. Meteorol. Climatol. 2008, 47, 1077–1092. [Google Scholar] [CrossRef] [Green Version]
  58. Stauffer, D.R.; Seaman, N.L. Multiscale Four-Dimensional Data Assimilation. J. Appl. Meteorol. 1994, 33, 416–434. [Google Scholar] [CrossRef]
  59. Waldron, K.M.; Paegle, J.; Horel, J.D. Sensitivity of a Spectrally Filtered and Nudged Limited-Area Model to Outer Model Options. Mon. Weather Rev. 1996, 124, 529–547. [Google Scholar] [CrossRef]
  60. Alexandru, A.; de Elia, R.; Laprise, R.; Separovic, L.; Biner, S. Sensitivity Study of Regional Climate Model Simulations to Large-Scale Nudging Parameters. Mon. Weather Rev. 2009, 137, 1666–1686. [Google Scholar] [CrossRef] [Green Version]
  61. Miguez-Macho, G.; Stenchikov, G.L.; Robock, A. Spectral nudging to eliminate the effects of domain position and geometry in regional climate model simulations. J. Geophys. Res. Atmos. 2004, 109, D13. [Google Scholar] [CrossRef] [Green Version]
  62. Pan, Z.; Takle, E.; Gutowski, W.; Turner, R. Long Simulation of Regional Climate as a Sequence of Short Segments. Mon. Weather Rev. 1999, 127, 308–321. [Google Scholar] [CrossRef]
  63. Pichon, X.L.; Angelier, J. The hellenic arc and trench system: A key to the neotectonic evolution of the eastern mediterranean area. Tectonophysics 1979, 60, 1–42. [Google Scholar] [CrossRef]
  64. Zhuk, E.; Kozyrakis, G.V.; Galanis, G.; Zodiatis, G.; Spanoudaki, K.; Kampanis, N.; Soloviev, D. On-line visualization of the cal/val indices for the Mediterranean Monitoring and Forecasting Centre. In Proceedings of the International Conference on Marine Data and Information Systems, IMDIS 2018, Barcelona, Spain, 5–7 November 2018. [Google Scholar]
  65. Lott, J.N. 7.8 the Quality Control of the Integrated Surface Hourly Database; American Meteorological Society: Seattle, WA, USA, 2004. [Google Scholar]
  66. Smith, A.; Lott, N.; Vose, R. The Integrated Surface Database: Recent Developments and Partnerships. Bull. Am. Meteorol. Soc. 2011, 92, 704–708. [Google Scholar] [CrossRef] [Green Version]
  67. Mass, C.F.; Ovens, D.; Westrick, K.; Colle, B.A. Does Increasing Horizontal Resolution Produce More Skillful Forecasts? The Results of Two Years of Real-Time Numerical Weather Prediction over the Pacific Northwest. Bull. Am. Meteorol. Soc. 2002, 83, 407–430. [Google Scholar] [CrossRef]
  68. Deng, A.; Stauffer, D.; Dudhia, J.; Hunter, G.; Bruyère, C. WRF-ARW analysis nudging update and future development plan. In Proceedings of the 9th Annual WRF Users Workshop, Boulder, CO, USA, 22–27 June 2008. [Google Scholar]
  69. Bray, L.; Reizopoulou, S.; Voukouvalas, E.; Soukissian, T.; Alomar, C.; Vázquez-Luis, M.; Deudero, S.; Attrill, M.J.; Hall-Spencer, J.M. Expected Effects of Offshore Wind Farms on Mediterranean Marine Life. J. Mar. Sci. Eng. 2016, 4, 18. [Google Scholar] [CrossRef] [Green Version]
  70. Görmüş, T.; Aydoğan, B.; Ayat, B. Offshore wind power potential analysis for different wind turbines in the Mediterranean Region, 1959–2020. Energy Convers. Manag. 2022, 274, 116470. [Google Scholar] [CrossRef]
  71. Koletsis, I.; Lagouvardos, K.; Kotroni, V.; Bartzokas, A. The interaction of northern wind flow with the complex topography of Crete Island—Part 1: Observational study. Nat. Hazards Earth Syst. Sci. 2009, 9, 1845–1855. [Google Scholar] [CrossRef] [Green Version]
  72. Kotroni, V.; Lagouvardos, K.; Lalas, D. The effect of the island of Crete on the Etesian winds over the Aegean Sea. Q. J. R. Meteorol. Soc. 2001, 127, 1917–1937. [Google Scholar] [CrossRef]
  73. Lorentzou, C.; Kouvarakis, G.; Kozyrakis, G.V.; Kampanis, N.A.; Trahanatzi, I.; Fraidakis, O.; Tzanakis, N.; Kanakidou, M.; Agouridakis, P.; Notas, G. Extreme desert dust storms and COPD morbidity on the island of Crete. Int. J. Chronic Obstr. Pulm. Dis. 2019, 14, 1763. [Google Scholar] [CrossRef] [Green Version]
  74. Feng, M.; McPhaden, M.J.; Xie, S.-P.; Hafner, J. La Niña forces unprecedented Leeuwin Current warming in 2011. Sci. Rep. 2013, 3, 1277. [Google Scholar] [CrossRef] [PubMed] [Green Version]
  75. Park, J.-H.; An, S.-I.; Kug, J.-S.; Yang, Y.-M.; Li, T.; Jo, H.-S. Mid-latitude leading double-dip La Niña. Int. J. Climatol. 2021, 41, E1353–E1370. [Google Scholar] [CrossRef]
  76. Ulbrich, U.; Lionello, P.; Belušić, D.; Jacobeit, J.; Knippertz, P.; Kuglitsch, F.G.; Leckebusch, G.C.; Luterbacher, J.; Maugeri, M.; Maheras, P.; et al. 5-Climate of the Mediterranean: Synoptic Patterns, Temperature, Precipitation, Winds, and Their Extremes. In The Climate of the Mediterranean Region; Lionello, P., Ed.; Elsevier: Oxford, UK, 2012; pp. 301–346. [Google Scholar] [CrossRef]
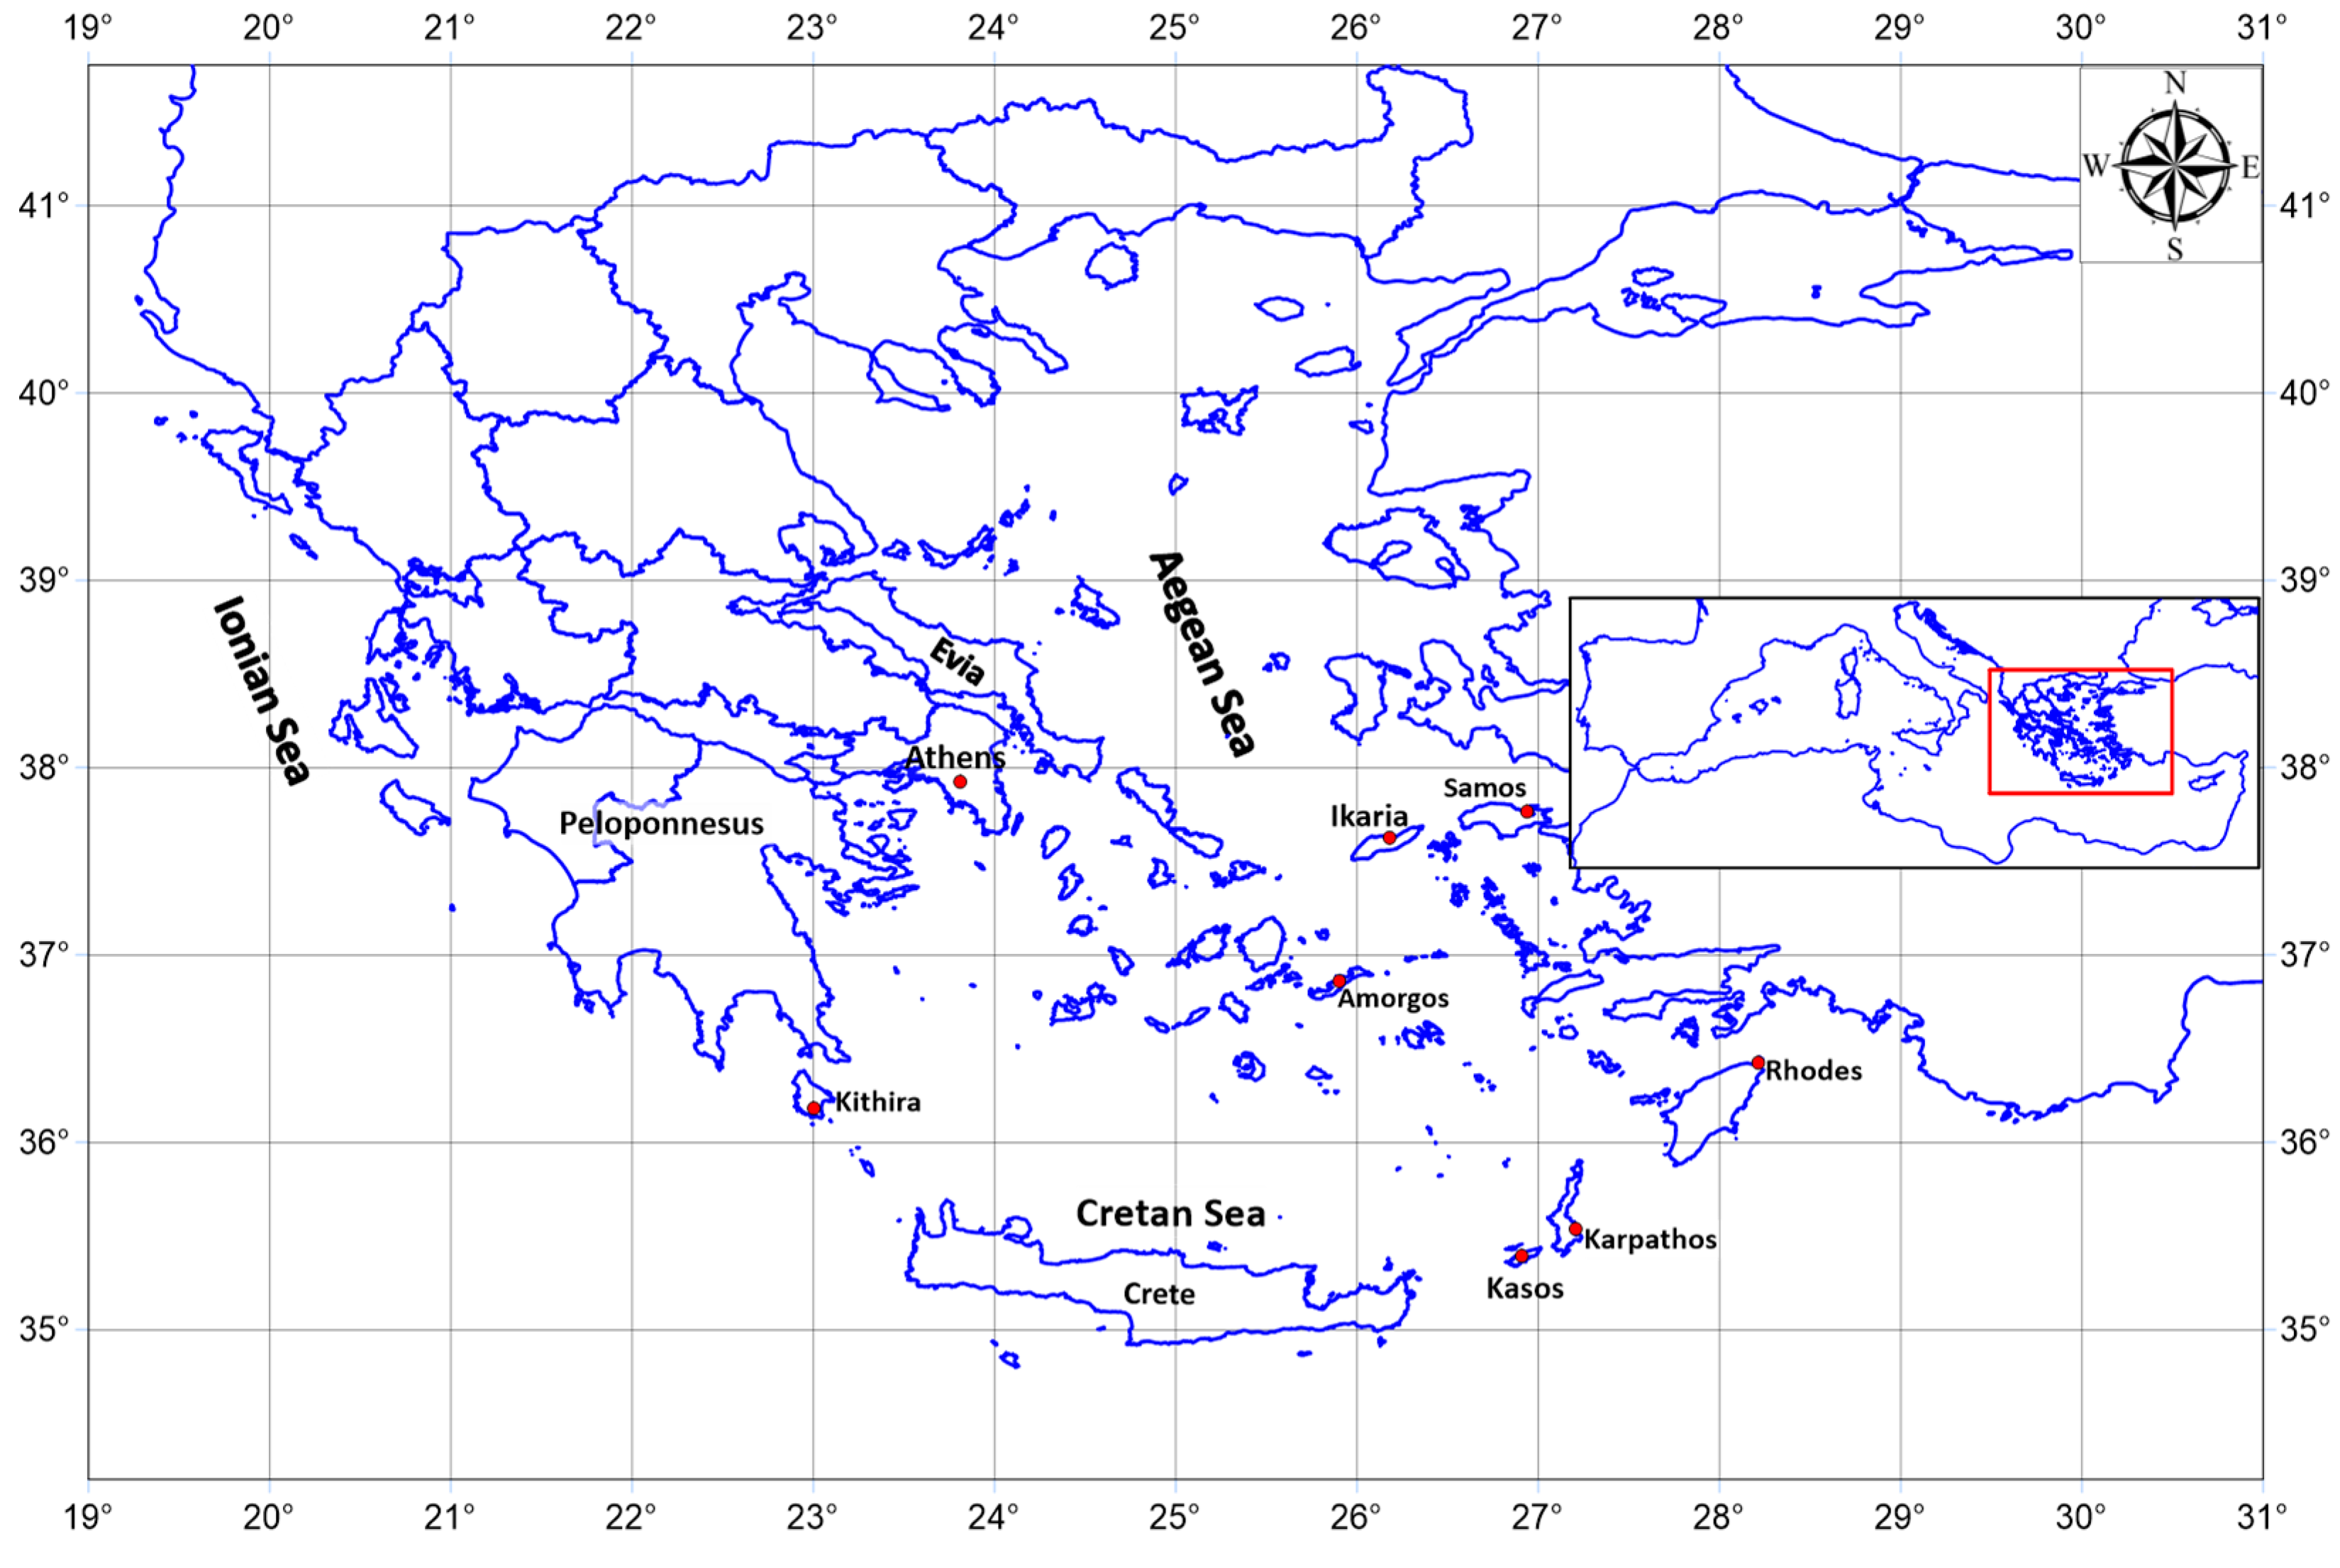
Figure 1. Orientation map and extent of the computational domain. Specific locations that are mentioned in the current work are identified.
Energies 16 05965 g001
Figure 2. Proposed flowchart summarizing the calculation process.
Energies 16 05965 g002
Figure 3. NOAA ISD/ISH METAR station positions along the coastline of the Mediterranean Sea and selected stations for the Hellenic region (red rectangle).
Energies 16 05965 g003
Figure 4. Bar graph with wind speed error metrics for one reference year based on the NOAA ISD/ISH METAR near-coast stations for the Hellenic region. The gradient lines symbolize WRF-ERA5 results, while the same colors in solid fills are the corresponding ERA5 errors per station.
Energies 16 05965 g004
Figure 5. Mean yearly wind speed distribution over sea at 100 m a.s.l., based on long-term averaging (40 years).
Energies 16 05965 g005
Figure 6. Mean yearly power density distribution over sea at 100 m a.s.l., based on long-term averaging (40 years).
Energies 16 05965 g006
Figure 7. Summer (upper left), autumn (upper right), winter (lower left) and spring (lower right) wind distribution over sea at 100 m a.s.l., based on long-term averaging (40 years).
Energies 16 05965 g007
Figure 8. Summer (upper left), autumn (upper right), winter (lower left) and spring (lower right) power density distribution over sea at 100 m a.s.l., based on long-term averaging (40 years).
Energies 16 05965 g008
Figure 9. Five-year mean wind speed (m/s) deviation from the 40-year averaged distribution over sea at 100 m a.s.l.
Energies 16 05965 g009
Figure 10. The 1980–1994 mean wind speed (m/s) deviation from the 40-year averaged distribution over sea at 100 m a.s.l.
Energies 16 05965 g010
Figure 11. The 1995–2009 mean wind speed (m/s) deviation from the 40-year averaged distribution over sea at 100 m a.s.l.
Energies 16 05965 g011
Figure 12. The 2010–2019 mean wind speed (m/s) deviation from the 40-year averaged distribution over sea at 100 m a.s.l.
Energies 16 05965 g012
Figure 13. Area-mean wind speed over “Sea-only” and “Sea+Land” masses for the Hellenic region calculated within the limits of the computational grid.
Energies 16 05965 g013
Table 1. Justification of required core-hours.
(A) Core No. (B) Days/ Season(C) Hours/Day(D) Seconds/Hour(E = B × C × D) Total No. S/SeasonNo. of Iterations
(F = E/15 s)
(G) Duration of Iteration(H = A × F × G/3600) Core–Hours
480902436007,776,000518,4000.04 s2764.8
Disclaimer/Publisher’s Note: The statements, opinions and data contained in all publications are solely those of the individual author(s) and contributor(s) and not of MDPI and/or the editor(s). MDPI and/or the editor(s) disclaim responsibility for any injury to people or property resulting from any ideas, methods, instructions or products referred to in the content.