Abstract
Simultaneous multiple-fracture treatments in horizontal wellbores have become an essential technology for the economic development of shale gas reservoirs. During hydraulic fracturing, fracture initiation and propagation always induce additional stresses on the surrounding rock. When multiple fractures develop simultaneously, the development of some fractures is limited due to the stress-shadow effect. An in-depth understanding of the multiple-fracture propagation mechanism as reflected by fracture morphology and flow rate distribution can help to set reasonable operation parameters for improving the uniformity of multiple fractures and forming a complex fracture network according to the different in situ stress conditions in a reservoir to increase the shale gas recovery and reduce the cost. In this study, a two-dimensional (2D) fracture propagation model was developed based on the extended finite element method (XFEM). Then, the influences of various factors, including geological and operational factors, on the development of multiple fractures were studied. The results of numerical simulations showed that increasing the cluster spacing or injecting fracturing fluid with lower viscosity can help reduce the stress-shadow effect. In the case of smaller in situ stress differences, the deflection of the fractures was larger due to the stress-shadow effect. As the stress difference increased, the direction of the propagation of the fracture was gradually biased towards the direction of maximum horizontal stress. In addition, the injection rate had some effects on the fracture morphology and flow rate distribution. However, as the injection rate increased, the dominant fracture developed rapidly, and the fracture length significantly increased.
1. Introduction
The development of gas in low-porosity/permeability reservoirs such as shale gas reservoirs is a solution to the growing demand for energy resources [,]. Meanwhile, shale gas, as a clean energy source like geothermal energy, has low-carbon and green characteristics and has taken on an important role in global clean energy []. Shale gas reservoirs have poorer physical properties and more complex in situ stress conditions than those of conventional reservoirs, which has led to the use of a number of stimulation techniques during shale gas development [,]. Over the last decades, reservoir stimulation techniques combining horizontal well technology with multi-stage hydraulic fracturing have played an important role in shale gas development, enlarging the drainage area by arranging multiple perforation clusters within a stage, thereby increasing recovery and reducing operating costs. Although this technique has been applied more often in practical engineering, the mechanism of the influences of different geological and operational parameters on the simultaneous development of multiple fractures is not completely clear, and in-depth studies are needed [,,].
During the fracturing process, it is desired that multiple fractures develop and propagate uniformly with minimal resistance. However, the results of mine experiments and laboratory tests have shown that even in homogeneous formations, hydraulic fractures have characteristics such as deflection and offsets that are opposite to the two-wing and planar characteristics []. The morphology of fractures is decided by various factors, such as the injection rate and in situ stress conditions. Warpinski et al. [] conducted mine experiments in ash-fall tuffs with low permeability and showed that in situ stress affects the propagation mode of hydraulic fractures. Zeng et al. [] carried out experiments on the development of hydraulic fractures using cement samples. When the well pipe position was changed, the complexity of the hydraulic fracture morphology was different due to the stress differences. Some researchers have investigated the effects of operation factors on hydraulic fracture morphology [,]. The experimental results showed that the complexity of the fractures and the probability of fracture deflection increased with the increase in the viscosity of the injected fluid. In addition, the higher the injection rate, the lower the complexity of the fracture and the greater the likelihood of planar fracture.
Meanwhile, when multiple fractures develop simultaneously, the induced stresses generated between the fractures will change the in situ stress distribution, causing the hydraulic fracture’s propagation direction to deviate from the direction of the maximum principal stress, resulting in a complex fracture morphology. This phenomenon is known as the stress-shadow effect, and it usually results in the suppression of the center fracture, while the fractures on either side are overextended and show varying degrees of deflection []. Qu et al. [] found that when multiple fractures occur simultaneously, the induced stresses arise at the fracture tip, and the stress field around each fracture is different. Fractures in which stress is concentrated at the tip require more energy to promote fracture propagation. Fallahzadeh et al. [] set up two perforation clusters in mortar samples. Once two fractures were initiated, they propagated in opposite directions, and fracture tortuosity occurred in an area near the wellbore. The proportion of fluid in a fracture after applying fracturing fluid determines the morphology and development of the fracture. In general, fracturing fluids tend to flow into fractures with minimal resistance. The stress-shadow effect generates compressive stress on fracture surfaces, resulting in a different resistance to flow within each fracture. During the process of the flow rate distribution, more fluid enters fractures with lower compressive stress [,,]. As a result, each fracture develops differently. Miller et al. [] concluded from production logging data from a large number of horizontal shale wells that most shale hydrocarbons came from a small number of perforation clusters. Ketterij et al. [] set up multiple clusters and carried out hydraulic fracturing experiments. Their experiment showed that the amount of fluid entering each fracture varied. While it has been recognized that stress-shadow effects can directly affect the complexity of fracture networks, more work needs to be performed to explore the specific roles of different parameters in fracture morphology and flow rate distributions.
Due to the lack of effective diagnostic techniques for fractures, complex fracture geometries caused by the development of multiple fractures are not accurately characterized during mine experiments [,]. In laboratory experiments, it is difficult to ensure that conditions are completely consistent, especially with true samples, and the scale of simulations is limited. With the improvement of various numerical methods and computer efficiency, numerical simulation methods have gradually been applied to larger-scale fracture studies in shale reservoirs [,,]. In previous studies, researchers used the finite element method (FEM) to simulate fracture generation processes. In this method, the cohesive zone model (CZM), which is commonly used to describe fracture initiation and propagation, obeys a law called “traction–separation” [,,,,,,]. Guo et al. [] established a three-dimensional model to study the simultaneous generation of multiple fractures in shale reservoirs with a thick pay zone. Shin et al. [] discussed the effects of the number of perforation clusters, injected fluid viscosity, and elastic modulus on the development state of multiple fractures that were initiated simultaneously. The results showed that geological and operational factors have a significant impact on the morphology of the fractures and the distribution of fluids in them. Recently, the extended finite element method (XFEM) has been applied in the field of computational mechanics [,,,]. This method represents fractures or material interfaces in a computational region by means of discontinuous form functions that are independent of the element network. The advantage of XFEM is that there is no need to update the finite element mesh to trace the location of a fracture. In addition, fractures can propagate along arbitrary paths. Compared to CZM, XFEM is better suited for showing the complexities of fracture development, such as with the deflection angle [,]. Currently, researchers mainly discuss the patterns of interactions between induced fractures and pre-existing fractures through XFEM. More work needs to be performed to study the simultaneous propagation of multiple fractures by considering more factors [,,]. The complexity of a fracture network depends on the morphology of each fracture. Importantly, the stress-shadow effect plays a crucial role in the degree of uniform planar propagation of multiple fractures. Therefore, the influences of various factors (i.e., geological and operational factors) on the stress-shadow effect should be discussed. Reduction in the negative impact of the stress-shadow effect and the formation of a complex fracturing network are essential for improving the efficiency of shale gas extraction.
In this study, a two-dimensional hydraulic fracture propagation model based on the XFEM was established. Five fractures were embedded in a coupled hydro-mechanic model. The competing propagation of fractures was simulated under different conditions. Several factors were considered, including in situ stress differences, cluster space, fracturing fluid viscosity, and injection rate. The effects of geological and operational factors on the fracture network’s morphology are discussed. This study contributes to the understanding of the mechanism of the stress-shadow effect on multiple-fracture propagation. These conclusions help in recognizing the key factors in controlling the uniform growth of multiple fractures, which can help to improve the uniformity of multiple fractures and form a complex fracture network, which will be conducive to improving shale gas recovery and reducing costs.
2. Governing Equations
2.1. Model Assumptions
The hydraulic fracturing process involves the complex dynamic coupling of fluids and solids. In order to comprehensively study the process of the simultaneous propagation of multiple fractures with reduced computational burden, some assumptions need to be considered []:
- (1)
- The rock matrix material is considered to be homogeneous and elastic;
- (2)
- The injected fluid is considered incompressible;
- (3)
- The proppant transport within multiple fractures is not taken into account;
- (4)
- The influence of the temperature field is not considered in the simulation.
2.2. The Flow Mode of the Fluid
During fracture generation, the continuous injection of a fluid triggers a fracture to propagate. To describe this complex phenomenon, we need two sets of laws []:
- (1)
- In the fluid section, we need to describe the fluid flow process and the fluid filtration loss process within the fracture;
- (2)
- In the soil section, we need some initiation and propagation criteria to describe the whole process from the deformation to the destruction of rocks.
The directions of fluid flow within a fracture include the tangential and normal directions (Figure 1). Along the tangential direction, fluid flows into the fracture, while along the other direction, fluid is lost by filtering from the fracture into the rock mass. The equation of fluid flow in the tangential direction was given by Reynold []:
where q represents the flow rate along with tangential direction, w represents the width of the fracture, μ represents the viscosity of the injected fluid, and ▽p represents the pressure variation inside the fracture.
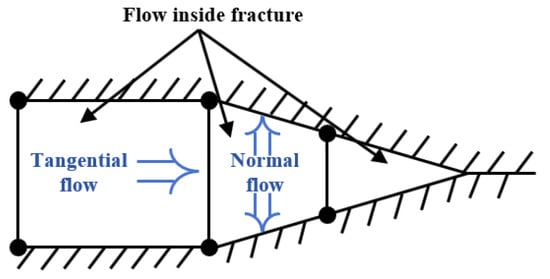
Figure 1.
Fluid flow in the fracture.
The equation of the fluid flow along the normal direction can be written as follows []:
where qt represents the flow rate at the upper fracture surface, qb represents the flow rate at the lower fracture surface, ct represents the coefficient of filtration loss at the upper fracture surface, cb represents the coefficient of filtration loss at the lower fracture surface, pi represents the pressure at the mid-face, pt represents the pore pressure at the upper face, and pb represents the pore pressure at the bottom face.
2.3. The Formula for Effective Stress
For rock with a certain porosity, the stress can be expressed as follows []:
where σtotal represents all stress in the rock, σ′ represents the effective stress, pw represents the pressure in the pores of the rock, α represents the coefficient proposed by Biot, and δ represents the constant proposed by Kronecker.
2.4. XFEM Approximation
Belytschko and Black [] introduced the XFEM to overcome the shortcomings of the FEM when simulating the propagation of various discontinuities.
In order to characterize a fracture, it is necessary to construct discontinuous displacement functions. A discontinuous displacement function consists of an asymptotic function and a discontinuity function []. The displacement vector u is written as follows:
where uI represents the continuous node displacement vector associated with the element in the conventional finite element solution, I represents the total number of nodes within the element, NI(x) represents the conventional node shape function, H(x) represents the correlation function of the discontinuous jumps of the fracture propagation element, aI represents the additional degrees of freedom of the fracture propagation element, Fα(x) represents the additional function of the fracture tip, and represents the additional degrees of freedom of the fracture tip element.
The values of the discontinuity jump functions are as follows []:
where x represents the node under investigation, x* represents the node on the fracture with the shortest distance from x, and n represents the unit outward normal vector at x*.
The additional function Fα(x) for the tip of the fracture (Figure 2) is given by the following equation []:
where r and θ represent the values of the polar coordinates in the localized frame of the element at the tip of the fracture.
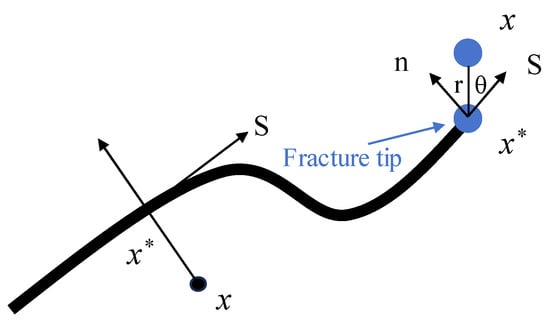
Figure 2.
Schematic diagrams of smooth fractures and their normal and tangential coordinates for elements at different locations.
To accurately describe the singularity of a fracture tip through modeling, it is essential to constantly track the location of the fracture propagation. As shown in Figure 3, the discontinuities of the fracture elements can be characterized in terms of initial real nodes and phantom nodes covering the initial real nodes. Both types of nodes are independent. Therefore, when an element is penetrated by a fracture, it is divided into two parts consisting of two types of nodes, while the phantom nodes are constrained by the initial real nodes in the complete element. In order to construct a complete set of interpolations, certain fracture elements belonging to the real domain Ω0 will be extended into the phantom domain Ωp. Displacements of Ω0 can be interpolated through the degree of freedom of Ωp. The jump in the displacement field is realized by integrating from the real node side to the fracture region [,,].
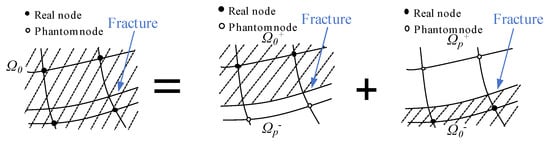
Figure 3.
Schematic for introducing virtual nodes superimposed on the initial nodes to characterize the discontinuities of fracture elements.
2.5. The Mechanism of Fracture Failure
The mechanism of fracture failure consists of two processes: (1) the initiation of a fracture and (2) the evolution of fracture damage.
In elastic mechanics, failure initiation is defined as a weakening of the stiffness of a material.
During hydraulic fracturing, the maximum stress criterion is usually adopted to determine whether the stress in the reservoir rock meets the fracture initiation conditions, that is, i.e., the tensile strength of the rock is reached. Therefore, the initiation criterion can be derived from the following equation []:
where f represents the ratio of the maximum stress value, represents the allowable maximum stress value, and <> represents Macaulay Brackets. When f reaches 1, damage is initiated.
During the propagation of hydraulic fracturing, we use the Bengeggagh–Kenane law (BK law) as a criterion for describing the evolution of fracture damage [,]. The criterion proposed by Bengeggagh–Kenane [,] can be written as follows:
where GequivC represents the critical energy release rate of the fracture, GIC represents the energy release rate for the tensile failure of the fracture, GIIC represents the energy release rate for the shear failure of the fracture due to sliding, and GIIIC is the energy release rate for the shear failure of the fracture due to tearing. The fracture propagation demand is equal to the energy release rate of the fracture between the fracture tip node and the critical value.
3. Model Establishment and Verification
3.1. Establishment of a Multiple-Fracture Development Model and the Parameterization of Different Cases
In order to explore the influences of geological and operational factors on fracture morphology and flow rate distribution during multiple-fracture development, a 2D multiple-fracture development model based on the XFEM was established, and five fractures were embedded in a reservoir. Horizontal wells were oriented in the direction of the horizontal stress with the minimum value, and five perforation clusters were oriented in the direction of the horizontal stress with the maximum value. The model was a square with a side length of 140 m (Figure 4). The number of grid elements in the model was 19,600. Table 1 establishes the basic properties of the reservoir. The conditions in the model with respect to the displacement boundary are shown in Figure 4. The displacement around the boundary was constrained to zero in the vertical direction. Incompressible fluid was injected at a constant rate into the five perforation clusters.
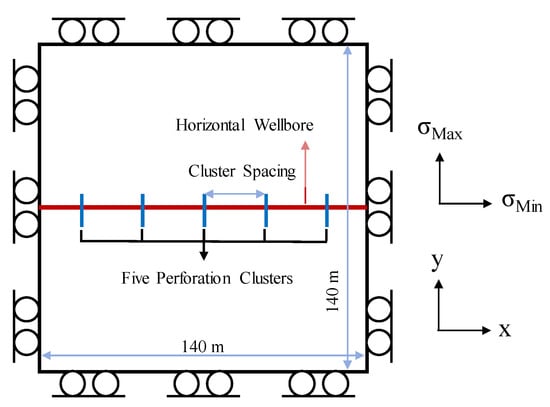
Figure 4.
Simulation model of a single horizontal well with five perforation clusters and the corresponding boundary conditions.

Table 1.
Constant parameters of the model used in the simulation.
Using the developed model, it was possible to explore the simultaneous initiation and development of five fractures in a single stage. Different geological and operational factors were considered in this study, and the parameter settings for different cases are shown in Table 2.
Table 2.
Design parameters for nine cases.
3.2. The Validation of Fracture Propagation
The performance of the fracture propagation model based on the XFEM was evaluated by using experimental results. Jiang et al. [] conducted triaxial experiments to investigate the effect of oriented perforation on fracture development. Hydraulic fracturing was performed on cubic concrete samples measuring 300 mm × 300 mm × 300 mm. A borehole was drilled in the center of each sample, with a 60° angle between the borehole and the maximum horizontal principal stress. The results showed that when the direction of perforation did not coincide with the maximum horizontal principal stress, the fracture was deflected. To verify the validation of our model, the fracture propagation results simulated with the experimental parameters (Table 3) were compared with the results of the experiment (Figure 5). The results of the model consisted of the direction of fracture propagation, the morphology, and element displacement values (U). The element displacement values were able to represent the degree of fracture opening at different locations. The results of the numerical simulation showed that in the square model with a side length of 0.3 m, the hydraulic fracture first initiated along the 60° perforation azimuth with a larger displacement vector value at the location of the initiation, and then the fracture was deflected, was shifted to the direction of the maximum principal stress, and propagated to the model boundary. Fractures in the vicinity of the initiation site had large displacement values that gradually decreased after the fracture had turned. The numerical results were in general agreement with the fracture deflection and morphology observed in the experimental results of Jiang et al. [].
Table 3.
Basic parameters used for model verification.
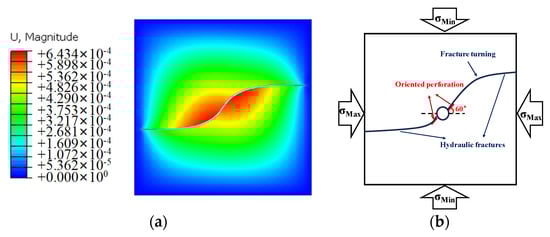
Figure 5.
Comparison between the numerical model and the experimental result (unit: m). (a) the numerical simulation result, (b) the schematic diagram of experimental results.
4. Results and Discussion
In this section, the developed model was utilized to investigate the simultaneous initiation and development of five fractures in a single stage. When a certain amount of injected fluid flowed into the five fractures, the amount of fluid flowing into each fracture was redistributed and constantly changed. By comparing the morphology of the fractures and the flow rate distribution, the influence of stress-shadow effects during the development of multiple fractures can be discussed. Here, different geological and operational factors are considered, as shown in Table 3.
4.1. The Effect of In Situ Stress Difference (Cases 1–3)
Differences in in situ stresses are an important factor in fracture propagation. The direction of fracture propagation is usually the direction of the horizontal stress with the minimum value. However, under the condition of the simultaneous development of multiple fractures, the stress field around the fracture tip region can be disturbed due to stress-shadow effects. Then, the fracture undergoes different degrees of deflection. In order to explore the effects of in situ stress differences on the development of multiple fractures, three values of stress difference were used, i.e., 0 MPa, 8 MPa, and 16 MPa.
The morphology of the five fractures after 240 s of fluid injection is shown in Figure 6. Figure 6 shows that brighter-colored locations represent fractures with higher displacement values. It was observed that the fractures (except for the center fracture) developed symmetrically and had the same morphology. Regarding the propagation process of the fractures, the first five fractures extended along the direction of the horizontal stress with the maximum value. Then, based on the stress-shadow effects, the side fracture and sub-center fracture deviated from the center fracture. Apparently, the center fracture was compressed by the sub-center fractures, and little deflection occurred. In addition, the deflections of the side and sub-center fractures decreased with the increase in stress difference. In particular, Figure 6a shows that at a stress difference of 0 MPa, all fractures except the center fracture underwent significant deflection. For the sub-center fractures, the bottom tip was connected to the side fracture. The presence of this phenomenon greatly reduced the effectiveness of the side and sub-center fractures.
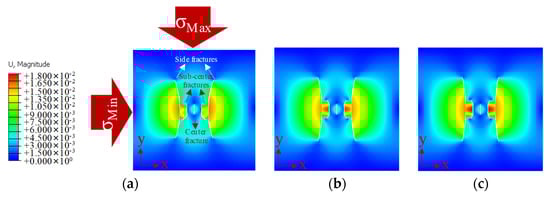
Figure 6.
Displacement values and fracture geometries for three different in situ stress differences (unit: m). (a) The value of the in situ stress difference was 0 MPa; (b) the value of the in situ stress difference was 8 MPa; (c) the value of the in situ stress difference was 16 MPa.
Figure 7 depicts the length of each fracture after 240 s of fluid injection. It can be seen that the length of the sub-center fracture significantly increased as the in situ stress difference increased. The length variations in the other fractures were negligible. This was because the magnitude of deformation in the side fractures was suppressed with higher stress differences. Also, less energy was required for fracture propagation along the direction of the horizontal stress with the maximum value compared to that in the other directions. The length of a reasonably oriented fracture was larger for the same fluid flow rate. When the deflection amplitude of the side fractures decreased, the stress field around the side fractures enhanced the effect of stress interference on the sub-center fractures and central fracture. As a result, the length of the sub-center fracture did not significantly increase as the deflection amplitude decreased. On the contrary, the length of the otherwise flat center fracture decreased.
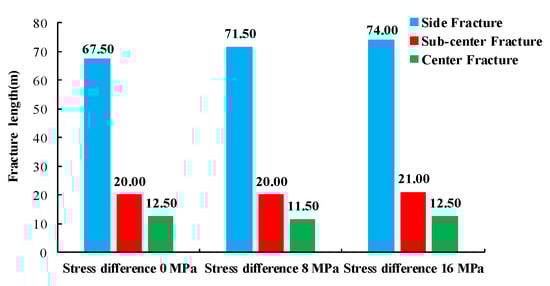
Figure 7.
Fracture lengths for simultaneous development with three different in situ stress differences.
Figure 8 shows the amount of fluid injected into each fracture. It can be noticed that five fractures were initiated at the beginning of the fluid injection, and the fluid flow rate inside each fracture rapidly increased. When the fractures were in the propagation stage, the fluid flow rate in each fracture tended to stabilize. In contrast to the side fractures, the development of the sub-center fractures and center fracture was limited by stress-shadow effects and accounted for a significantly smaller proportion of the total fluid volume.
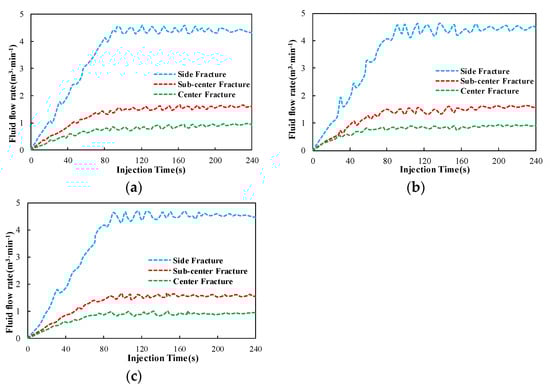
Figure 8.
Fluid flow rates of simultaneously propagating fractures with three different in situ stress differences. (a) The value of the in situ stress difference was 0 MPa; (b) the value of the in situ stress difference was 8 MPa; (c) the value of the in situ stress difference was 16 MPa.
For example, with a stress difference of 0 MPa, the proportions of fluid entering the center fracture, the single sub-center fracture, and the single side fracture were 7.22%, 12.63%, and 33.76%, respectively, after 240 s of fluid injection (Figure 9). The side fractures were hardly affected by stress-shadow effects and could develop well. However, the center fracture was most affected by stress-shadow effects, and less fluid entered it.
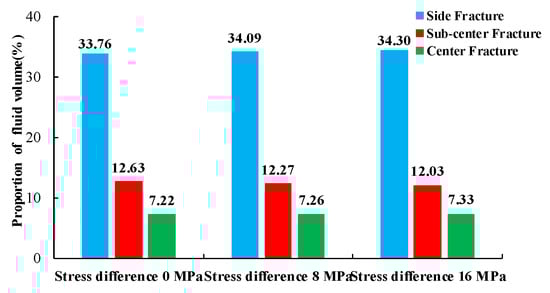
Figure 9.
Proportions of fluid volume entering the fractures after 240 s of fluid injection for three different in situ stress difference conditions.
In general, as the in situ stress difference increased, the fractures deflected by the stress-shadow effect gradually returned to the direction of the horizontal stress with the maximum value. The propagation of the internal fractures was more strongly inhibited. However, there was little change in the fluid within each fracture.
4.2. The Effects of Cluster Spacing (Cases 2, 4, and 5)
In actual hydraulic fracturing processes, the geological parameters are usually fixed. It is more practical to reduce the effects of stress interferences by optimizing the operating parameters. Cluster spacing plays an important role in the uniform development of multiple fractures. In order to discuss the specific effects of cluster spacing on the morphology and fluid flow of each fracture, three different cluster spacings (8 m, 9 m, and 10 m) were set up in the model.
Figure 10 shows the morphology of the five fractures after 240 s of fluid injection with three cluster spacings. In Figure 10, brighter-colored locations represent fractures with higher displacement values. As the spacing of the perforation clusters increased, the degree of deflection of the side fractures increased. When the clusters were spaced 10 m apart, the side fractures propagated in a direction almost away from the center fracture at the location of initiation. The sub-center fracture initially propagated in the direction of the horizontal stress with the maximum value. Then, the direction was away from the center fracture. The center fracture propagated in a straight line along the direction of the horizontal stress with the maximum value. The development of the center fracture significantly increased with the increase in the cluster spacing.
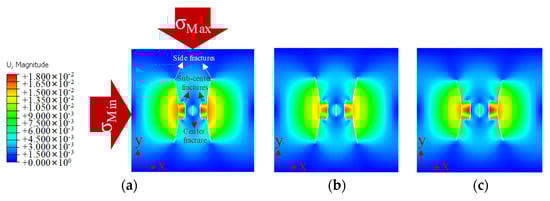
Figure 10.
Displacement values and fracture geometries for three different cluster spacings (unit: m). (a) The spacing of the perforation clusters was 8 m; (b) the spacing of the perforation clusters was 9 m; (c) the spacing of the perforation clusters was 10 m.
Figure 11 depicts the length of each fracture after 240 s of fluid injection. The length of the side fractures increased and then decreased as the spacing of the perforation cluster increased. The length of the sub-center fracture first increased and then remained stable. The length of the center fracture continuously increased. It was observed that the larger cluster spacing contributed to the uniform development of multiple fractures, which was favorable for improving the fracturing effect.
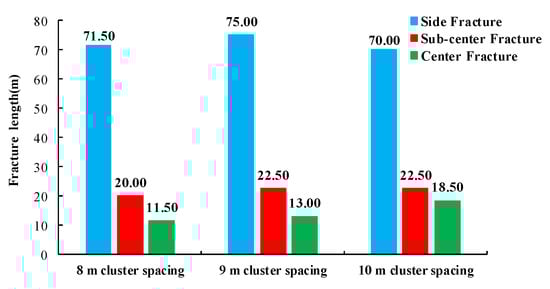
Figure 11.
Fracture length of simultaneously developed fractures with three different cluster spacings.
Figure 12 shows the amount of fluid injected into each fracture. The proportion of the fluid volume in each fracture after 240 s of fluid injection is shown in Figure 13. By comparing the change curves of the fluid flowing into each fracture, it was found that the proportion of each type of fracture gradually stabilized after reaching the maximum value. Combined with the fracture morphology after 240 s of fluid injection (Figure 10), it was found that the initial propagation of the side fractures inhibited the development of the sub-center fractures and center fracture. However, the stress-shadow effects of the sub-center fractures and center fracture were weakened with the increase in the cluster spacing and side fracture deflection. The fracture development was improved to different degrees. After 240 s of fluid injection, the proportion of fluid in the side, sub-center, and center fracture changed from 34.16%, 12.33%, and 7.02% to 30.9%, 14.28%, and 9.64%, respectively, with the increase in the cluster spacing. The uniformity of the flow distribution in each fracture was significantly improved.
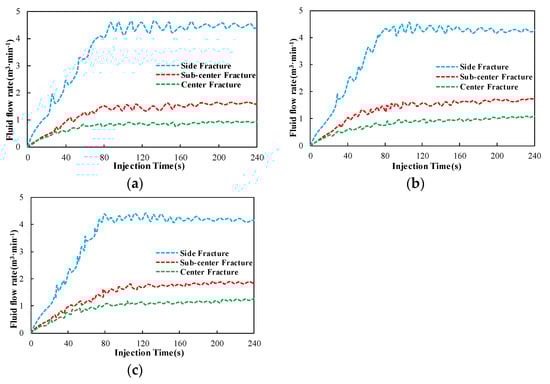
Figure 12.
Fluid flow rates of simultaneously propagating fractures with three different cluster spacings. (a) The spacing of the perforation clusters was 8 m; (b) the spacing of the perforation clusters was 9 m; (c) the spacing of the perforation clusters was 10 m.
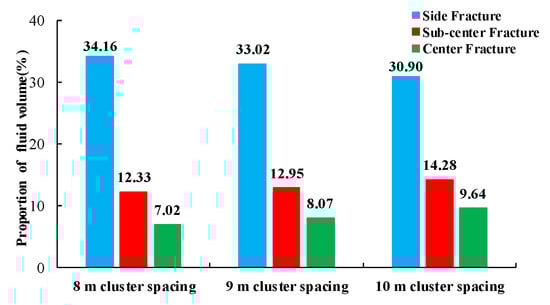
Figure 13.
Proportions of fluid volume entering the fractures after 240 s of fluid injection for three different cluster spacings.
In conclusion, increasing the spacing of the perforation clusters attenuated stress interferences and improved the uniformity of the flow rate distribution and fracture development.
4.3. The Effects of Fracturing Fluid Viscosity (Cases 2, 6, and 7)
Fracturing fluid viscosity is an important operational parameter that has a significant impact on the fracturing pattern. In order to discuss the various effects of the fracturing fluid viscosity on the fracture patterns and fluid flow in each fracture, three different values of fracturing fluid viscosity (1 mPa·s, 40 mPa·s, and 300 mPa·s) were set for discussion.
Figure 14 shows the morphology of the five fractures after 240 s of fluid injection. In Figure 14, brighter-colored locations represent fractures with higher displacement values. From the fracture development morphology, it can be seen that the degree of deflection of the side fractures increased as the viscosity changed from 1 mPa·s to 40 mPa·s. The morphology of the sub-center fractures and the center fracture remained almost unchanged. However, the morphology of each fracture changed significantly as the viscosity changed from 40 mPa·s to 300 mPa·s. The side and sub-center fractures propagated almost completely in the direction of the horizontal stress with the maximum value, and the length of the center fracture decreased significantly.
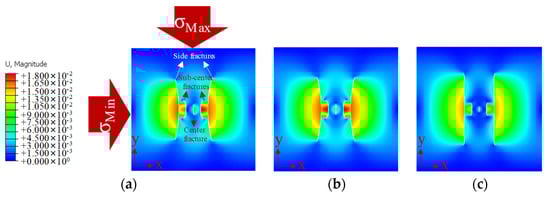
Figure 14.
Displacement values and fracture geometries for three different fracturing fluid viscosities (unit: m). (a) The value of the fracturing fluid viscosity was 1 mPa·s; (b) the value of the fracturing fluid viscosity was 40 mPa·s; (c) the value of the fracturing fluid viscosity was 300 mPa·s.
Figure 15 depicts the length of each fracture after 240 s of fluid injection. The length of each fracture did not change much as the viscosity changed from 1 mPa·s to 40 mPa·s. The deflection angle of the side cracks increased with increasing viscosity. The area of the fracture network also increased. When the viscosity was changed from 40 mPa·s to 300 mPa·s, the length of the side fractures significantly increased from 71.5 m to 80 m. On the contrary, the lengths of the sub-center fractures and the center fracture decreased by 5 m and 2.5 m, respectively. The results showed that the side fractures propagated along the direction of the horizontal stress with the maximum value when the viscosity was very high. The propagation process was easier and required less energy. Meanwhile, the development of the sub-center fractures and center fracture was inhibited, which was influenced by the larger stress-shadow effect. Therefore, this propagation was not conducive to the uniform development of multiple fractures.
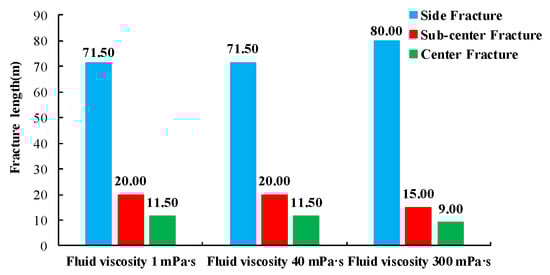
Figure 15.
Fracture lengths of simultaneously developed fractures with three different fracturing fluid viscosities.
Figure 16 shows the fluid flow rate into each fracture during fluid injection. The proportions of fluid flow into each fracture after 240 s of fluid injection are shown in Figure 17. It can be seen that when the viscosity was 1 mPa·s, the fluid flow rate into the sub-center fracture was significantly larger than that into the center fracture. With the increase in viscosity, the fluid flow into the sub-center fracture tended to be the same as that in the center fracture. When the viscosity increased, the fluid volume proportion in the side fracture increased from 32.35% to 39.85%, while the fluid volume proportion in the sub-center and center fractures decreased by 5.87% and 3.26%, respectively (Figure 17).
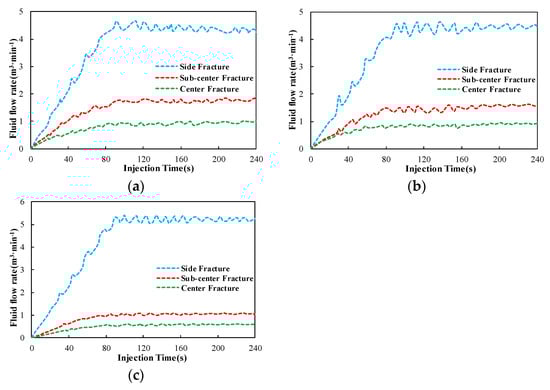
Figure 16.
Fluid flow rates of simultaneously propagating fractures with three different fracturing fluid viscosities. (a) The value of the fracturing fluid viscosity was 1 mPa·s; (b) the value of the fracturing fluid viscosity was 40 mPa·s; (c) the value of the fracturing fluid viscosity was 300 mPa·s.
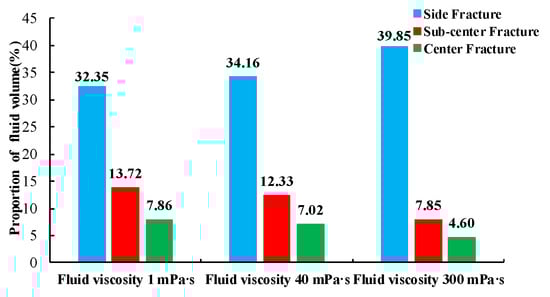
Figure 17.
Proportions of fluid volume entering the fractures after 240 s of fluid injection for three different fracturing fluid viscosities.
In summary, the stress-shadow effect increased with increasing viscosity. However, if the viscosity is increased appropriately, a larger fracturing network can be formed.
4.4. The Effect of Injection Rate (Cases 2, 8, and 9)
The injection rate is another important operating parameter. In order to discuss the various effects of the injection rate on the fracture morphology and fluid flow in each fracture, three different injection rates (12 m3/min, 14 m3/min, and 16 m3/min) were set for discussion.
Figure 18 shows the morphology of the five fractures after 240 s of fluid injection at three injection rates. In Figure 18, brighter-colored locations represent fractures with higher displacement values. When the injection rate was increased, the length of the side fractures increased significantly, while the deflection of the side fractures did not change much. The length and deflection angle of the sub-center fractures and the center fracture hardly changed. It was observed that the development of the major fractures increased with the increase in the injection rate. On the contrary, the other fractures remained largely unchanged. Unfortunately, the unevenness of fracture development increased.
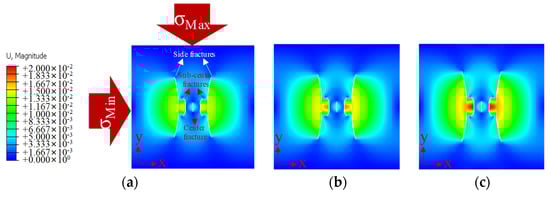
Figure 18.
Displacement values and fracture geometries for three different injection rates (unit: m). (a) The value of the injection rate was 12 m3/min; (b) the value of the injection rate was 14 m3/min; (c) the value of the injection rate was 16 m3/min.
Figure 19 depicts the length of each fracture after 240 s of fluid injection. As the injection rate increased, the length of the side fractures increased from 70 to 80 m, while the length of the other fractures remained almost constant (Figure 19).
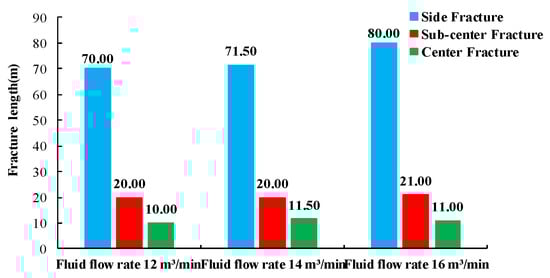
Figure 19.
Fracture lengths of simultaneously developed fractures with three different injection rates.
Figure 20 shows the flow rate in each fracture during fluid injection. By comparing the change curves when using different injection rates, it was found that the volume of fluid entering each fracture tended to increase with the increase in the injection rate. The proportion of fluid volume entering each fracture after 240 s of fluid injection is shown in Figure 21. At different injection rates, the fluid volume proportion in each fracture remained almost constant.
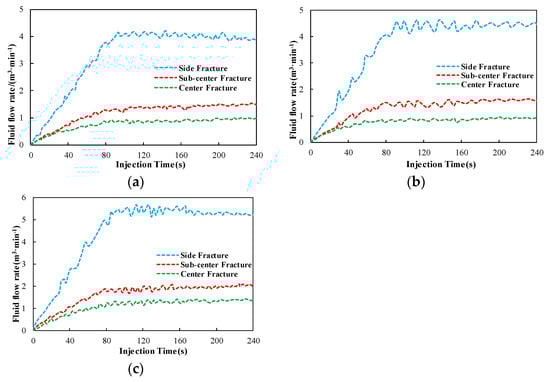
Figure 20.
Fluid flow rates of simultaneously propagating fractures with three different injection rates. (a) The value of the injection rate was 12 m3/min; (b) the value of the injection rate was 14 m3/min; (c) the value of the injection rate was 16 m3/min.
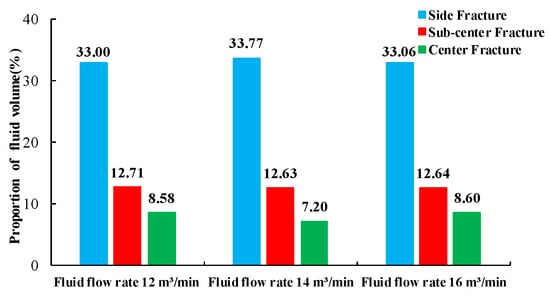
Figure 21.
Proportions of fluid volume entering the fractures after 240 s of fluid injection for three different injection rates.
In conclusion, from the point of view of fracture morphology, the length of the side fractures significantly increased with the increase in the injection rate. In contrast, the change in the length of the internal fractures was negligible. Although the area of the fracture network increased, the degree of inhomogeneous development between fractures increased. In addition, the proportion of fluid volume in each fracture changed little when the injection rate was increased. Therefore, the injection rate had a small effect on the stress-shadow effect, as well as on the distribution of the flow rate between fractures.
5. Discussion and Conclusions
In this study, a two-dimensional hydraulic fracturing propagation model was established based on the XFEM. The effects of geological and operational factors on the simultaneous development of multiple fractures were investigated. The study helps to set reasonable operation parameters for improving the uniformity of multiple fractures and forming a complex fracture network, which will be conducive to improving shale gas recovery. The following conclusions were drawn:
- The influence of the in situ stress difference on the flow rate distribution among multiple fractures is not obvious. However, with the increase in the in situ stress difference, side fractures with larger deflections gradually propagate along the direction of the horizontal stress with the maximum value. In addition, the fracture length significantly increases.
- The cluster spacing can effectively affect the stress interference between multiple fractures. The uniformity of the fracture morphology and flow rate distribution can be significantly improved by increasing the cluster spacing.
- As the viscosity of the fracturing fluid increases, the stress-shadow effect is further enhanced, and more fluid flows into the dominant fracture. When the viscosity increases from 1 mPa·s to 40 mPa·s, the deflection angle of the side fractures increases, as does the fracture network area. When the viscosity reaches 300 mPa·s, the development of internal fractures is greatly inhibited, and the side fractures are no longer deflected.
- A higher injection rate has little effect on the inflow of fluid into the internal fractures and on their morphology. On the other hand, with the same proportion of the fluid volume, the length of the side fractures significantly increases, favoring the formation of a larger fracture network area.
It can be seen from the results that setting a suitable perforation cluster direction, increasing the cluster spacing, and using a medium (e.g., 40 mPa·s) fracturing fluid viscosity according to the in situ stress conditions can help weaken the influence of the stress-shadow effect caused by the simultaneous development of multiple fractures and promote the uniform development of fractures formed by multiple perforation clusters. Increasing the injection rate and setting the appropriate fracturing fluid viscosity will help increase the degree of development of each fracture and form a certain degree of deflection, which will be conducive to increasing the complexity and coverage area of the fracture network.
Of course, the shortcomings of this study must be pointed out. Currently, the formation of complex fracture networks through hydraulic fracturing requires attention to the longitudinal development of fractures. The height of multiple fractures in the 2D hydraulic fracturing model was assumed to be the same as the height of the reservoir. In order to know the true evolution of the height of multiple fractures, in future work, we will develop a three-dimensional hydraulic fracture propagation model; then, the morphologies of multiple fractures can be studied more comprehensively.
Author Contributions
Methodology: E.P.; Software: H.Z. and P.Z.; Data curation: Z.J.; writing—original draft preparation, review, and editing: Y.W., Q.Z. and G.F. All authors have read and agreed to the published version of the manuscript.
Funding
This study was financially supported by the National Natural Science Foundation of China (Nos. 52192622, 52374004, and 52204005) and the Natural Science Foundation of Sichuan Province, China (Grant No. 2022NSFSC0193).
Data Availability Statement
Data is contained within the article.
Conflicts of Interest
Authors Enshun Ping, Yuzhong Wang and Qingjie Zhao were employed by the company CNPC Bohai Drilling Engineering Company Limited. The remaining authors declare that the research was conducted in the absence of any commercial or financial relationships that could be construed as a potential conflict of interest.
References
- Li, L.; Liu, J.; Wang, W.; Zhao, P.; Lu, Y. Variational Reservoir Characteristics of the Wufeng–Longmaxi Formation from Different Sedimentary Region and Its Implications in Southeastern Sichuan Basin, China. ACS Omega 2023, 8, 20684–20696. [Google Scholar] [CrossRef] [PubMed]
- Liu, J.; Yao, Y.; Liu, D.; Pan, Z.; Cai, Y. Comparison of Three Key Marine Shale Reservoirs in the Southeastern Margin of the Sichuan Basin, SW China. Minerals 2017, 7, 179. [Google Scholar] [CrossRef]
- Zhao, P.; Liu, J.; Elsworth, D. Numerical study on a multifracture enhanced geothermal system considering matrix permeability enhancement induced by thermal unloading. Renew. Energ. 2023, 2023, 33–44. [Google Scholar] [CrossRef]
- Liu, J.; Bai, X.; Elsworth, D. Evolution of pore systems in low-maturity oil shales during thermal upgrading-Quantified by dynamic SEM and machine learning. Pet. Sci. 2024, in press. [Google Scholar] [CrossRef]
- Liu, J.; Xie, L.; Elsworth, D.; Gan, Q. CO2/CH4 Competitive Adsorption in Shale: Implications for Enhancement in Gas Production and Reduction in Carbon Emissions. Environ. Sci. Technol. 2019, 53, 9328–9336. [Google Scholar] [CrossRef] [PubMed]
- Desroches, J.; Lecampion, B.; Ramakrishnan, H.; Brown, J.E.; Prioul, R. Benefits of Controlled Hydraulic Fracture Placement: Theory and Field Experiment. In Proceedings of the SPE/CSUR Unconventional Resources Conference, Calgary, AB, Canada, 30 September–2 October 2014. [Google Scholar]
- Zhao, J.; Wang, L.; Liu, S.; Kang, Z.; Yang, D.; Zhao, Y. Numerical simulation and thermo-hydro-mechanical coupling model of in situ mining of low-mature organic-rich shale by convection heating. Adv. Geo-Energy Res. 2022, 6, 502–514. [Google Scholar] [CrossRef]
- Wu, K. Simultaneous Multi-Frac Treatments: Fully Coupled Fluid Flow and Fracture Mechanics for Horizontal Wells. In Proceedings of the SPE Annual Technical Conference and Exhibition, New Orleans, LA, USA, 30 September–2 October 2013. [Google Scholar]
- Wu, K.; Olson, J.E.; Balhoff, M.T.; Yu, W. Numerical Analysis for Promoting Uniform Development of Simultaneous Multiple-Fracture Propagation in Horizontal Wells. SPE Prod. Oper. 2016, 32, 41–50. [Google Scholar]
- Warpinski, N.R.; Teufel, L.W. Influence of Geologic Discontinuities on Hydraulic Fracture Propagation. J. Pet. Technol. 1987, 39, 209–220. [Google Scholar] [CrossRef]
- Zeng, F.; Yang, B.; Guo, J.; Chen, Z.; Xiang, J. Experimental and Modeling Investigation of Fracture Initiationfrom Open-Hole Horizontal Wells in Permeable Formations. Rock Mech. 2019, 52, 1133–1148. [Google Scholar] [CrossRef]
- Ha, S.J.; Choo, J.; Yun, T.S. Liquid CO2 Fracturing: Effect of Fluid Permeation on the Breakdown Pressure and Cracking Behavior. Rock Mech. 2018, 51, 3407–3420. [Google Scholar] [CrossRef]
- Zhang, W.; Shi, X.; Jiang, S.; Cao, Q.; Wang, F.; Wang, Z.; Ge, Y.; Du, Y. Experimental study of hydraulic fracture initiation and propagation in highly saturated methane-hydrate-bearing sands. J. Nat. Gas Sci. Eng. 2020, 79, 103338. [Google Scholar] [CrossRef]
- Liu, X.; Qu, Z.; Guo, T.; Sun, Y.; Wang, Z.; Bakhshi, E. Numerical simulation of non-planar fracture propagation in multi-cluster fracturing with natural fractures based on Lattice methods. Eng. Fract. Mech. 2019, 220, 106625. [Google Scholar] [CrossRef]
- Qu, Z.; Tian, Y.; Li, J.; Guo, T. Numerical simulation study on fracture extension and morphology of multi-cluster staged fracturing for horizontal wells. J. China Univ. Pet. Ed. Nat. Sci. 2017, 41, 102–109. [Google Scholar]
- Fallahzadeh, S.H.; Rasouli, V.; Sarmadivaleh, M. An Investigation of Hydraulic Fracturing Initiation and Near-Wellbore Propagation from Perforated Boreholes in Tight Formations. Rock Mech. 2015, 48, 573–584. [Google Scholar] [CrossRef]
- Wu, K.; Olson, J.E. Mechanisms of Simultaneous Hydraulic Fracture Propagation From Multiple Perforation Clusters in Horizontal Wells. SPE J. 2016, 21, 1000–1008. [Google Scholar] [CrossRef]
- Bunger, A.; Jeffrey, R.G.; Zhang, X. Constraints on simultaneous growth of hydraulic fractures from multiple perforation clusters in horizontal wells. SPE J. 2014, 19, 608–620. [Google Scholar] [CrossRef]
- Wang, W.; Da, Z.; Sheng, G.; Qi, Z.; Su, Y. A review of stimulated reservoir volume characterization for multiple fractured horizontal well in unconventional reservoirs. Adv. Geo-Energy Res. 2017, 1, 54–63. [Google Scholar] [CrossRef]
- Miller, C.; Waters, G.; Rylander, E. Evaluation of Production Log Data from Horizontal Wells Drilled in Organic Shales. In Proceedings of the SPE North American Unconventional Gas Conference and Exhibition, Woodlands, TX, USA, 14–16 June 2011. [Google Scholar]
- Van Ketterij, R.B.; De Pater, C.J. Impact of Perforations on Hydraulic Fracture Tortuosity. SPE Prod. Fac. 1999, 14, 117–130. [Google Scholar] [CrossRef]
- Hui, G.; Chen, Z.; Chen, S.; Gu, F. Hydraulic fracturing-induced seismicity characterization through coupled modeling of stress and fracture-fault systems. Adv. Geo-Energy Res. 2022, 6, 269–270. [Google Scholar] [CrossRef]
- Liu, J.; Xie, L.; He, B.; Gan, Q.; Zhao, P. Influence of anisotropic and heterogeneous permeability coupled with in-situ stress on CO2 sequestration with simultaneous enhanced gas recovery in shale: Quantitative modeling and case study. Int. J. Greenhouse Gas Control 2021, 104, 103208. [Google Scholar] [CrossRef]
- Zhao, P.; Liu, J.; Zhang, Y. Experimental and numerical investigations on buffer performance of geofoam subjected by the impact of falling rocks with respect to different shapes. Geotext. Geomembr. 2023, 51, 108–124. [Google Scholar] [CrossRef]
- Abdelaziz, A.; Ha, J.; Li, M.; Magsipoc, E.; Sun, L.; Grasselli, G. Understanding hydraulic fracture mechanisms: From the laboratory to numerical modelling. Adv. Geo-Energy Res. 2023, 7, 66–68. [Google Scholar] [CrossRef]
- Guo, J.; Lu, Q.; Zhu, H.; Wang, Y.; Ma, L. Perforating cluster space optimization method of horizontal well multi-stage fracturing in extremely thick unconventional gas reservoir. J. Nat. Gas Sci. Eng. 2015, 26, 1648–1662. [Google Scholar] [CrossRef]
- Shin, D.H.; Sharma, M.M. Factors Controlling the Simultaneous Propagation of Multiple Competing Fractures in a Horizontal Well. In Proceedings of the SPE Hydraulic Fracturing Technology Conference, Woodlands, TX, USA, 4–6 February 2014. [Google Scholar]
- Wang, B.; Zhou, F.; Wang, D.; Liang, T. Numerical simulation on near-wellbore temporary plugging and diverting during refracturing using XFEM-Based CZM. J. Nat. Gas Sci. Eng. 2018, 55, 368–381. [Google Scholar] [CrossRef]
- Liu, Y.; Tang, D.; Xu, H.; Zhao, T.; Hou, W. Effect of interlayer mechanical properties on initiation and propagation of hydraulic fracturing in laminated coal reservoirs. J. Nat. Gas Sci. Eng. 2022, 208, 109381. [Google Scholar] [CrossRef]
- Huang, C.; Zhu, H.; Wang, J.; Han, J.; Zhou, G.; Tang, X. A FEM-DFN model for the interaction and propagation of multi-cluster fractures during variable fluid-viscosity injection in layered shale oil reservoir. Pet. Sci. 2022, 19, 2796–2809. [Google Scholar] [CrossRef]
- Zhu, H.; Xu, X.; Zhong, A.; Zhang, Q. Numerical simulation of evenly propagating hydraulic fractures with smaller cluster spacing in the horizontal well YYP1 for deep shale oil in the Shengli Oilfield. Oil Gas Geology. 2022, 43, 229–240. [Google Scholar]
- Guo, J.; Zhao, X.; Zhu, H.; Zhang, X.; Pan, R. Numerical simulation of interaction of hydraulic fracture and natural fracture based on the cohesive zone finite element method. J. Nat. Gas Sci. Eng. 2015, 25, 180–188. [Google Scholar] [CrossRef]
- Wang, Y.; Javadi, A.; Fidelibus, C. A hydro-mechanically-coupled XFEM model for the injection-induced evolution of multiple fractures. Int. J. Numer. Anal. Methods Geomech. 2023, 47, 1539–1558. [Google Scholar] [CrossRef]
- Dahi-Taleghani, A.; Olson, J.E. Numerical modeling of multistranded-hydraulic-fracture propagation: Accounting for the interaction between induced and natural fractures. SPE J. 2011, 16, 575–581. [Google Scholar] [CrossRef]
- Gordeliy, E.; Peirce, A. Implicit level set schemes for modeling hydraulic fractures using the XFEM. Comput. Method Appl. Mech. 2013, 266, 125–143. [Google Scholar] [CrossRef]
- Lecampion, B. An extended finite element method for hydraulic fracture problems. Commun. Numer. Methods Eng. 2009, 25, 121–133. [Google Scholar] [CrossRef]
- Leonhart, D.; Meschke, D. Extended finite element method for hydro-mechanical analysis of crack propagation in porous materials. Proc. Appl. Math. Mech. 2011, 11, 161–162. [Google Scholar] [CrossRef]
- Wang, H. Numerical investigation of fracture spacing and sequencing effects on multiple hydraulic fracture interference and coalescence in brittle and ductile reservoir rocks. Eng. Fract. Mech. 2016, 157, 107–124. [Google Scholar] [CrossRef]
- Ma, X.; Zeng, Q. Influence of multi-perforation fracturing on the regularity of hydraulic fractures propagation. Nat. Gas Geosci. 2022, 33, 312–323. [Google Scholar]
- Gordeliy, E.; Peirce, A. Coupling schemes for modeling hydraulic fracture propagation using the XFEM. Comput. Method Appl. Mech. 2013, 253, 305–322. [Google Scholar] [CrossRef]
- Cruz, F.; Rpehl, D.; Vargas, E.D. An XFEM implementation in Abaqus to model intersections between fractures in porous rocks. Comput. Geotech. 2019, 112, 135–146. [Google Scholar] [CrossRef]
- Yang, Q.; Li, B.; Shao, M.; Zhang, H. Production performance of perforation clusters during multistage fracturing in shale gas reservoirs. ACS Omega. 2021, 6, 26231–26238. [Google Scholar] [CrossRef]
- Belytschko, T.; Black, T. Elastic crack growth in finite elements with minimal remeshing. Int. J. Numer. Meth. Eng. 1999, 45, 601–620. [Google Scholar] [CrossRef]
- Jiang, H.; Chen, M.; Zhang, G.; Jin, Y.; Zhang, Z.; Zhu, G. Impact of oriented perforation on hydraulic fracture initiation and propagation. Chin. J. Rock Mech. Eng. 2009, 7, 1321–1326. [Google Scholar]
Disclaimer/Publisher’s Note: The statements, opinions and data contained in all publications are solely those of the individual author(s) and contributor(s) and not of MDPI and/or the editor(s). MDPI and/or the editor(s) disclaim responsibility for any injury to people or property resulting from any ideas, methods, instructions or products referred to in the content. |
© 2024 by the authors. Licensee MDPI, Basel, Switzerland. This article is an open access article distributed under the terms and conditions of the Creative Commons Attribution (CC BY) license (https://creativecommons.org/licenses/by/4.0/).