Article

Co-Pyrolysis of Woody Biomass and Oil Shale—A Kinetics and Modelling Study

1
Department of Energy Technology, Tallinn University of Technology, 19086 Tallinn, Estonia
2
Department of Manufacturing and Civil Engineering, Faculty of Engineering, Norwegian University of Science and Technology, 2815 Gjøvik, Norway
*
Author to whom correspondence should be addressed.
Energies 2024, 17(5), 1055; https://doi.org/10.3390/en17051055
Submission received: 5 February 2024 / Revised: 19 February 2024 / Accepted: 20 February 2024 / Published: 23 February 2024
(This article belongs to the Special Issue In-Depth Investigations in Bioenergy)

Abstract

:
The co-pyrolysis of biomass and fossil fuels has been the subject of studies on sustainable energy. Co-feeding oil shale with woody biomass can contribute to a transition into carbon neutrality. The present study analysed the thermal decomposition behaviour of oil shale and biomass blends (0:1, 3:7, 1:1, 7:3, 9:1, and 1:0) through thermogravimetric analysis (TGA) at 80–630 °C with a heating rate of 10 °C/min in CO2 and N2 atmospheres. A comparison of theoretical and experimental residual mass yields of oil shale–biomass mixtures indicated no significant interactions between the fuels. The blends contributed to a decrease of up to 34.4 wt% in solid residues compared to individual pyrolysis of oil shale, and the TGA curves were shifted from up to 10 °C to a lower temperature when the biomass ratio increased. The use of a CO2 atmosphere resulted in the production of solid residues, comparable to the one obtained with the N2 atmosphere. CO2 atmosphere can be used in oil shale–biomass co-pyrolysis, without affecting the decomposition process or increasing the yield of residues. A kinetic model method is proposed based on TGA data at 10, 20, and 30 °C/min. The apparent activation energies for a temperature range of 200–520 °C were in the order of 139, 155, 164, 197, 154, and 167 kJ/mol for oil shale–biomass 0:1, 3:7, 1:1, 7:3, 9:1, and 1:0 blends, respectively. From the isoconversional kinetic analysis, a two-stage pyrolysis was observed, which separated biomass and oil shale pyrolysis. A simulation of biomass and oil shale co-pyrolysis was conducted in Aspen Plus® using TGA-derived kinetic data. The model prediction resulted in a close match with the experimental thermogravimetric data with absolute errors from 1.75 to 3.78%, which highlights the relevance of TGA analysis in simulating co-pyrolysis processes.

1. Introduction

The production of clean and sustainable fuels is one of the current worldwide priorities for the mitigation of climate change, the reduction of the human-made environmental impact, and the depletion of natural resources. Conventional energy technologies and fossil fuels have led to an increase in emissions of CO2 and other pollutant gases [1]. Co-feeding renewable, conventional, and alternative fuels is a technologically feasible solution expected to continue into a transition to full implementation of renewable technologies. Co-feeding biomass (BM) (a carbon-neutral fuel) and oil shale (OS) can provide a partial solution to the sustainable energy need in countries where these fuels are abundant. Particularly, employing a thermochemical conversion such as co-pyrolysis of OS and BM is one good example, which can contribute heavily to achieving some of the sustainable development goals [2].
BM, generally a highly volatile and low ash-content fuel, can be thermochemically converted into bio-oil, biogas, and activated carbon, and, as a renewable carbon-neutral resource, it can potentially provide around 14% of the world’s energy demand [3]. Pyrolysis of BM yields a high share of bio-oil (50–75% yield of liquids), permanent gases (20–25%), and solids (10–25%) [2]. On the other hand, OS, a sedimentary rock, composed of a share of kerogen (organic matter) is found in deposits all over the world—in China, Estonia, Jordan, and the United States, among others—exceeding the crude oil reserves. OS can be converted into shale oil (5–20%) and shale gas (5–20%) through thermochemical conversion processes, including pyrolysis [4,5]. The individual conversion of each fuel has been widely studied. BM pyrolysis has vast potential to produce sustainable fuel and energy. However, there have been some challenges in its conversion, particularly with regards to its physical and chemical properties such as low energy density due to high moisture content, and high diversity of available species, which eventually require diverse conversion techniques, followed by the upgrading and refining of the produced fuels due to stability issues [6]. Similarly, pyrolysis of OS leads to a high share of semicoke and ashes (>60%), which commonly results in waste and causes adverse environmental effects through high sulphur and CO2 production [7,8]. As with the upgrading and refining requirement of BM-derived fuels, shale oil also requires additional upgrading or refining prior to utilisation, depending on the purpose. Additionally, different oil shales yield different shale oil. The main difference comes from the concentration of different heteroatoms [9].
During the co-pyrolysis of OS and BM, the two fuels can go through thermal degradation while interacting with different stages of chemical reactions and heat transfer to yield products with enhanced properties, as compared to the individual pyrolysis of each fuel. Co-feeding BM with fossil fuels, including OS, can result in a reduction in the emission of pollutant gases while improving the decomposition of the fuels and the yield and composition of the co-pyrolytic products [10]. The high hydrogen content and H/C ratio of BM allow the fuel to act as a hydrogen donor, enhancing pyrolysis decomposition [11], and reducing the activation energy of the co-pyrolysis blend [12]. BM and OS pyrolysis process typically occurs within the temperature range of 200–500 °C [13]. While the largest part of woody BM pyrolyzes at 200–400 °C for OS, the main pyrolysis occurs in the temperature range of 350–550 °C [14]. Co-pyrolysis of OS and BM has been observed to enhance the decomposition process, reduce the environmental impact, and enhance the yield and properties of pyrolysis products [15,16].
Thermogravimetric analysis is a commonly used method to study the thermochemical behaviour of fuels and feedstock, as well as the co-pyrolysis of two fuels. Typically, individual pyrolysis of OS and BM has been studied in inert atmospheres, such as N2 and Ar. Using alternative atmospheres, such as CO2, H2O, H2 or CH4, can contribute to enhanced pyrolysis by improving product properties, enhancing devolatilization, and char reforming [17] through decreased char production, increasing condensable gas yield and improving bio-oil properties [18]. Particularly, in OS pyrolysis, CO2 atmospheres are shown to decrease activation energy, increase interactions between the kerogen and mineral content, and decrease the yield of semicoke [19]. However, despite its potential benefits, CO2 atmospheres have not been widely considered for OS and BM co-pyrolysis, and there have been only a few studies reported on BM and/or OS co-pyrolysis so far [13,20].
This paper studied the co-pyrolysis behaviour of Estonian woody BM and OS in N2 and CO2 atmospheres. The addition of small ratios of BM to OS pyrolysis was studied to determine the potential benefits of co-feeding both fuels while preserving the operational conditions typically used during individual OS and BM pyrolysis. The co-pyrolysis of OS and BM can potentially enhance the decomposition of OS while contributing to the reduction of environmental effects. In addition, the current study aimed to determine the effect of introducing CO2 atmospheres to the co-pyrolysis process as a path to further improve the pyrolytic behaviour of OS, as well as increase the yields of usable products. The experiments were carried out in TGA equipment at temperatures up to 630 °C. A kinetic study using the Coats–Redfern and Kissinger methods and isoconversional Vyazovkin and Friedman methods were implemented to determine the kinetic parameters of OS:BM pyrolysis and co-pyrolysis. The kinetic parameters, calculated using isoconversional methods with values closest to those found in the literature, were utilised for modelling the conversion of OS and BM and their blends, using Aspen Plus® software version 12.1. The novel aspect of this study includes making use of kinetic data obtained from TGA in the Aspen simulation, allowing for the incorporation of actual kinetic data to predict the co-pyrolytic behaviour of different blends. The obtained experimental and kinetic results plus the model will be used to continue further research on the co-pyrolysis of OS and BM in larger-scale equipment.

2. Materials and Methods

2.1. Materials

The wood of the trunks without bark of four of the most common Estonian BM species was used in co-pyrolysis: Norway spruce (Picea abies), grey alder (Alnus incana), Scots pine (Pinus sylvestris), and silver birch (Betula pendula). The chemical, physical, and thermodynamic properties of the BM species were previously obtained through elemental analysis, according to ISO 16948:2015 [21] and 16994:2016 [22], proximate analysis, based on ISO 18134-2:2017 [23] and 18122:2022 [24], and calorific values, according to ISO 18125:2017 [25,26], respectively. To obtain a representative sample of a mixture of Estonian BM species, each species was ground and sieved into a particle size below 0.125 mm, following ISO 14780:2017 [27]. The sieved samples were mixed in equal parts (25 wt% of each wood species). Estonian OS was characterized in terms of elemental analysis and calorimetry, according to ISO 29541:2010 [28] and ISO 1928:2020 [29], respectively. The ash content was determined following EVS 669:2022 [30]. The OS sample was sieved into a particle size below 0.125 mm. For the co-pyrolysis experiments, 6 ratios of OS-BM were prepared and mixed manually: 1:0, 9:1, 7:3, 1:1, 3:7, and 0:1 (100, 70, 50, 30, and 10 wt% BM) with a deviation of ±1%.

2.2. Experiment Set-Up

TGA co-pyrolysis experiments of BM and OS mixtures were conducted using a Netzsch STA 449F3 thermal analyser (NETZSCH Instruments North America, Burlington, United States). The equipment has a temperature resolution of 0.001 K and a balance resolution of 0.1 μg. The samples are pyrolyzed in aluminium oxide crucibles, using two gases, namely N2 and CO2, as the atmosphere, supplied with a flow rate of 0.05 L/min. The mass of the samples was 5 mg ±0.4 mg. The co-pyrolysis experiments were carried out with an initial purging stage from ambient temperature until 80 °C for 30 min, followed by the experimental segment with a heating rate of 10 °C/min, from 80 to 630 °C, for a total of 55 min, an isothermal segment of 20 min, and, finally, a cooling segment of around 60 min until the temperature of the samples was below 90 °C.
The residual mass curves of OS:BM 9:1, 7:3, 1:1, and 3:7 blends obtained experimentally were compared to the theoretical residual mass of OS:BM blends, calculated from the experimental TGA data for individual pyrolysis of OS and BM, which allowed us to determine the existence of interactions, including the inhibitory and promoting effects of co-processing OS and BM. The theoretical TGA curves of blends were calculated using Equation (1), where m % O S is the mass percentage of OS, m % B M is the mass percentage of BM, and x is the fraction of OS. The OS:BM blend ratios were selected to observe the effect of adding a share of BM in OS retorting in similar retorting conditions used in the industry, considering the calorific values and densities of each fuel.
m % t h e o = m % O S x + m % B M ( 1 x )

2.3. Kinetic Studies

The thermal decomposition of BM and OS can be studied through non-isothermal kinetic methods [31]. For the current research, kinetics methods were used to determine the apparent activation energy in the pyrolytic stage of BM and OS. The kinetic parameters were obtained using the TGA data in CO2 atmospheres, at 10, 20, and 30 °C/min, from 200–520 °C. Based on these data, the conversion degree α was calculated. The conversion degree is the ratio of actual mass loss to total mass loss, which was calculated using the mass loss data as shown in Equation (2):
α = m 0 m t m 0 m
where m 0 is the initial mass of the sample, m is the final mass of the sample, and m t is the actual mass of the sample at the time t. The rate of pyrolysis is a function of the reaction conversion function ( f α ) (Equation (3)) and the temperature-dependent rate constant K T , as described by the Arrhenius equation (Equation (4)).
d α d t = K T f α
K T = A e E R T
At a constant heating rate β for non-isothermal conditions, Equations (3) and (4) can be expressed as Equation (5):
d α d T = 1 β K T f α = A β e E R T f α
A is the pre-exponential factor (min−1), E is the activation energy (kJ/mol), R is the universal gas constant (kJ/mol K), and T is the temperature at time t. The integral form of Equation (5) can be solved through different approximations [32]. For the current study, the Coats–Redfern method [33] was implemented, describing the reaction conversion function ( f α = 1 α n ), where n is the reaction order, as shown in Equation (6).
d α d T = A β e E R T 1 α n
The Coats–Redfern Equation (6) can be written for n = 1 and n ≠ 1, as follows (Equations (7) and (8)):
ln 1 1 α 1 n T 2 1 n = ln A R β E 1 2 R T E E R T ,   n 1
ln l n ( 1 α ) T 2 = ln A R β E 1 2 R T E E R T ,   n = 1
Equations (7) and (8) can be expressed as a linear regression y = mx + b, where the value of the activation energy E was calculated as the slope m of the equation. For Coats–Redfern, the reaction orders used for the calculations were from 0 to 2 at a step increase of 0.1. The reaction orders with the highest correlation coefficient R2 in all heating rates were selected for the calculation of the activation energy E of the pyrolysis of all the OS:BM blends.
In addition to the Coats–Redfern method, isoconversional models including Friedman, widely used for BM kinetics, and Vyazovkin were used to evaluate the kinetics of BM and OS. The Kissinger model was also used as a first estimation of the kinetic parameters. The kinetic parameters for these models were determined using the free open-source thermokinetic software THINKS Version 31.10.21 for isoconversional analysis developed by Muravyev et al. [34]. These models are shown in Equations (9)–(11).
Friedman [35]
ln β α d T = ln f α A E R T
Vyazovkin [36]
i = 1 n j i n I E , T , i β j I E , T , j β i
where   I E , T ( t ) = t t exp E R T t d t
Kissinger [37]
ln β T p 2 = ln A R E E R T p
The Vyazoykin model is based on a minimisation procedure of Equation (10) for each value of α, using the temperature integral on Equation (11). For the Kissinger model, T p is the temperature at the maximum of the reaction exothermic peak. For all four models, the temperature range considered was between 200 and 520 °C as the starting and ending temperatures for pyrolysis and co-pyrolysis.

2.4. Process Modelling

Based on the experimental TGA data and the kinetic analysis from OS and BM, a computational model was made, using Aspen Plus®. The model uses the activation energies, E and pre-exponential factors, A, for OS, and the BM structural components (i.e., hemicellulose, cellulose, and lignin). From TGA calculations, the E and A for the components can be estimated employing Equations (2) and (3), with the additional consideration of the mass of ash m as an inactive part of both materials. Based on this, the kinetic equation used for the model is shown in Equation (14).
d m t d t = K m t m
d m d t = K m ,   considering   ash   as   inactive
K = A × e x p E R T   and   m = m t m

2.4.1. Oil Shale

OS decomposition is studied based on stoichiometry, using the dry ash-free (daf) basis results from the elemental and the proximate analyses. The chemical formula of OS is estimated as shown in Equation (16), calculated with stoichiometry based on the OS composition.
C 4.265 H 5.232 O 2.472 N 0.0134 S 0.117
The proximate analysis (on a daf basis) is used to determine the molar amount of carbon that goes into char while the rest of the elemental components go into volatiles. The moles of C in char are derived from the mass fraction of fixed carbon, assuming a mass basis of 100 g. The stoichiometry of OS pyrolysis was based on the modification of the approach made by Baliban et al. [38], where OS decomposes into C ( s ) , CO, C O 2 , H 2 , C H 4 , N 2 , H 2 S , and N H 3 . Water is assumed to exist only as free water (moisture) in the oil shale, and is therefore not considered among the products in the stoichiometric equation. The formulation of objective function and objectives was conducted as follows:
Sets: The set of all atoms A o i l   s h a l e is
a A o i l   s h a l e = C , H , O , N , S
The set of all gaseous species produced from the pyrolysis step is given as follows:
s S o i l   s h a l e = C ( s ) , C O , C O 2 , H 2 , C H 4 , N 2 , H 2 S , N H 3
Assuming inter-relationships between gas species C O , C O 2 , H 2 , and C H 4 , the following rations as shown in Equations (19)–(21) can be given. The ratios (1), (2), and (3) were estimated from the gas composition reported by Mozaffari et al. [39].
r a t i o ( 1 ) = C O C O 2
r a t i o ( 2 ) = C O 2 / C H 4
r a t i o ( 3 ) = C O H 2
Defining parameters are the following:
  • w a , o i l   s h a l e weight fraction of atom a in OS sample (daf);
  • A W a atomic weight fraction of atom a ;
  • F C a fixed carbon weight fraction in OS sample (daf);
  • E a , S number of a atoms in species s ;
  • x s moles of species s;
  • M o i l   s h a l e weight of OS (on daf basis);
  • M W s molecular weight of species s .
Based on the formulation, the proposed model is a nonlinear optimisation model and takes the following form, as shown in Equation (22).
min M o i l   s h a l e s = 1 s M W s   ×   x s , s u b j e c t   t o :
C   balance :   M o i l   s h a l e w a   o i l   s h a l e A W a F C a A W a = s S o i l   s h a l e E a , s x s ,   a = C
H   and   O   balance :   M o i l   s h a l e w a   o i l   s h a l e A W a = s E a , s x s ,   a A o i l   s h a l e ( a C ) ,   a C
Solving the model in MATLAB results in the stoichiometric equation for the decomposition of the organic fraction of OS and becomes:
C 4.265 H 5.232 O 2.472 N 0.0134 S 0.117                                             1.6744 C ( s ) + 0.3058 C O + 0.987 C O 2 + 0.0046 H 2 + 1.29661 C H 4                                             + 0.0000663 N 2 + 0.013456 N H 3 + 0.117 H 2 S

2.4.2. Biomass

The stoichiometry of BM is calculated based on the structural components: cellulose, hemicellulose, and lignin. The detailed derivation of the stoichiometric pyrolysis coefficients is based on Ranzi et al. and Baliban et al. [38,40]. This derivation considers BM components as cellulose ( C 6 H 10 O 5 ), hemicellulose ( C 5 H 8 O 4 ), and lignin monomers: Lig-C ( C 15 H 14 O 4 ), Lig-H ( C 22 H 28 O 9 ) and Lig-O ( C 20 H 22 O 10 ), and models char as solid carbon, C, and considers all tar components to decompose into hydrocarbons. Based on this derivation, the stoichiometric equations for all components are as shown in Equations (26)–(30).
Hemicellulose :   C 5 H 8 O 4 2.2 C ( s ) + 1.898 H 2 + 0.71 C O + 0.525 C H 4 + 1.284 C O 2 + 0.092 C 2 H 4 + 0.049 C 2 H 6 + 0.722 H 2 O
Cellulose :   C 6 H 10 O 5 0.877 C ( s ) + 0.889 H 2 + 2.163 C O + 1.488 C H 4 + 1.067 C O 2 + 0.175 C 2 H 4 + 0.028 C 2 H 6 + 0.703 H 2 O
Lig - C :   C 15 H 14 O 4 9.675 C ( s ) + 3.685 H 2 + 1.95 C O + 0.234 C H 4 + 0.403 C O 2 + 1.136 C 2 H 2 + 0.234 C 2 H 4 + 1.24 H 2 O
Lig - H :   C 22 H 28 O 9 11 C ( s ) + 5.507 H 2 + 4.9 C O + 1.443 C H 4 + 1.05 C O 2 + 1.804 C 2 H 4 + 2 H 2 O
Lig - O :   C 20 H 22 O 11 11 C ( s ) + 5.721 H 2 + 4.9 C O + 0.729 C H 4 + 1.55 C O 2 + 0.911 C 2 H 4 + 2 H 2 O

3. Results and Discussion

3.1. Fuel Characterisation

The composition of the studied samples of Norway spruce, grey alder, scots pine, silver birch, and OS are provided in Table 1, including elemental analysis, proximate analysis, and calorific values. As shown, the four studied BM samples have the same range of elemental composition, as well as ash content, moisture, heating values, and fixed carbon with the exception of silver birch, whose FC content is slightly lower than the rest (Table 1). On the contrary, the OS sample contains a significantly higher share of ash, with 52.5 wt% compared to 0.3 wt% for BM. Table 1 indicates how the OS’s elemental composition in terms of C, H, and O differs from those of BM, as well as the share of volatiles, which are significantly lower.

3.2. TGA Behaviour

The TGA behaviour of individual pyrolysis of OS and BM and OS:BM blends can be observed in Figure 1. The temperature range from 80 to 520 °C was selected according to the individual pyrolysis temperature of BM (250–500 °C) [2] and OS (350–550 °C) [41]. A temperature of 520 °C was chosen, as for both fuels a temperature greater than 550 °C favour more gas yield than oil [42].
The TGA curve of BM pyrolysis started with a pre-pyrolysis stage from 100 to 250 °C, followed by the most significant mass loss at the temperature range of 250–400 °C, with a smaller loss in mass continuing after 400 °C. As expected, there was no considerable mass loss between 80 and 120 °C. The BM pyrolysis temperature range is explained by its main components, cellulose, hemicellulose, and lignin, which decompose at 350–400 °C, 220–315 °C, and 250–800 °C, respectively [3]. The mass loss curve and temperature range in BM pyrolysis agreed with the decomposition pattern of its three major components: cellulose, hemicellulose, and lignin (40–50%, 15–30%, and 10–25% respectively). As observed, the majority of the mass loss occurred in the decomposition temperature range of cellulose and hemicellulose, and the partial decomposition of lignin [43]. At temperatures above 500–520 °C, the last stage of BM decomposition occurred, which included the decomposition of lignin and residues from incomplete pyrolysis. The final mass losses for BM were 79.5 to 78.8 wt% in N2 and CO2, respectively, which are comparable to mass losses obtained in the TGA of woody BM at different heating rates studied by Garcia-Perez et al. [44], who also observed the minimal changes in the mass loss at temperatures above 450–500 °C.
The individual pyrolysis of OS is shown in Figure 1A,B. The mass loss started at temperatures above 300 °C, having the highest mass loss at a range from 350 to 510 °C, which resulted in a final mass loss from 32.1 to 32.3 wt% in N2 and CO2, respectively. Likewise, with BM, there was no significant amount of moisture in the OS sample. A one-stage mass loss in the range of 350–510 °C can be attributed to the endothermic transformation of OS kerogen into volatile hydrocarbons and semicoke, as also observed by Wang et al. [45]. Decomposition above 600 °C, which was not covered in this study, would be related to the decomposition of inorganic matter, residual organic matter, and carbonates, as explained by Tiwary et al. [46] and Lin et al. [47]. Compared to OS, BM had a significantly higher share of mass loss (79 vs. 32 wt%). This was due to lower ash content in BM samples (0.3% in BM vs. 52.4% in OS) (Table 1).
The co-pyrolytic behaviour of OS and BM blends 9:1, 7:3, 1:1, and 3:7 in N2 and CO2 atmospheres is shown in Figure 1A and Figure 1B, respectively. The experiments for all the samples including pyrolysis of only OS (1:0 OS:BM) and only BM (0:1 OS:BM) were carried out at a temperature range between 80 and 550 °C. For the 9:1 OS:BM blend, the TGA decomposition curve had a profile comparable to the curve of individual pyrolysis of OS. However, the addition of 10 wt% of BM accelerated the decomposition of the blend, reducing the initial pyrolysis temperature to around 260 °C for both gas atmospheres. Additionally, the presence of BM caused a higher mass loss in the range of 250–400 °C, resulting in 11–12 wt% mass loss, compared to 4–5 wt% in individual co-pyrolysis of OS. After 400 °C, the decomposition curve followed the same pattern of individual pyrolysis of OS, but the curve was shifted from 1 to 3 °C to the left, resulting in a decomposition of the blend at a slightly lower temperature. Overall, the 9:1 OS:BM blend resulted in a higher final mass loss (from 35.1–36.2 wt%). The 7:3 OS:BM blend had a more pronounced initial decomposition stage, which also started at a lower temperature, close to 250 °C, and increased the mass loss to 23.5–24 wt% in the range of 250–400 °C. At temperatures above 400 °C, the decomposition curve followed a similar behaviour to individual pyrolysis of OS and 9:1 OS:BM co-pyrolysis, but the curve was shifted around 3–5 °C to the left for both gas atmospheres. The 7:3 OS:BM blend had a final mass loss between 43.8–44.1 wt%. As the share of BM increased to 50 and 70 wt% (OS:BM 1:1 and 3:7), the main decomposition started between 200 and 220 °C, with a mass loss of 44 and 60 wt%, respectively, in the range of 250–400 °C. The share of OS decomposed above 400 °C, starting at 8–10 °C lower than individual OS pyrolysis. The final mass loss was 57.0–57.2 and 66.4–66.7 wt% for OS:BM 1:1 and 3:7, respectively. The residual mass of OS:BM blends are mostly composed of Char and ashes from BM pyrolysis and semicoke (char and organic matter) from OS [48].
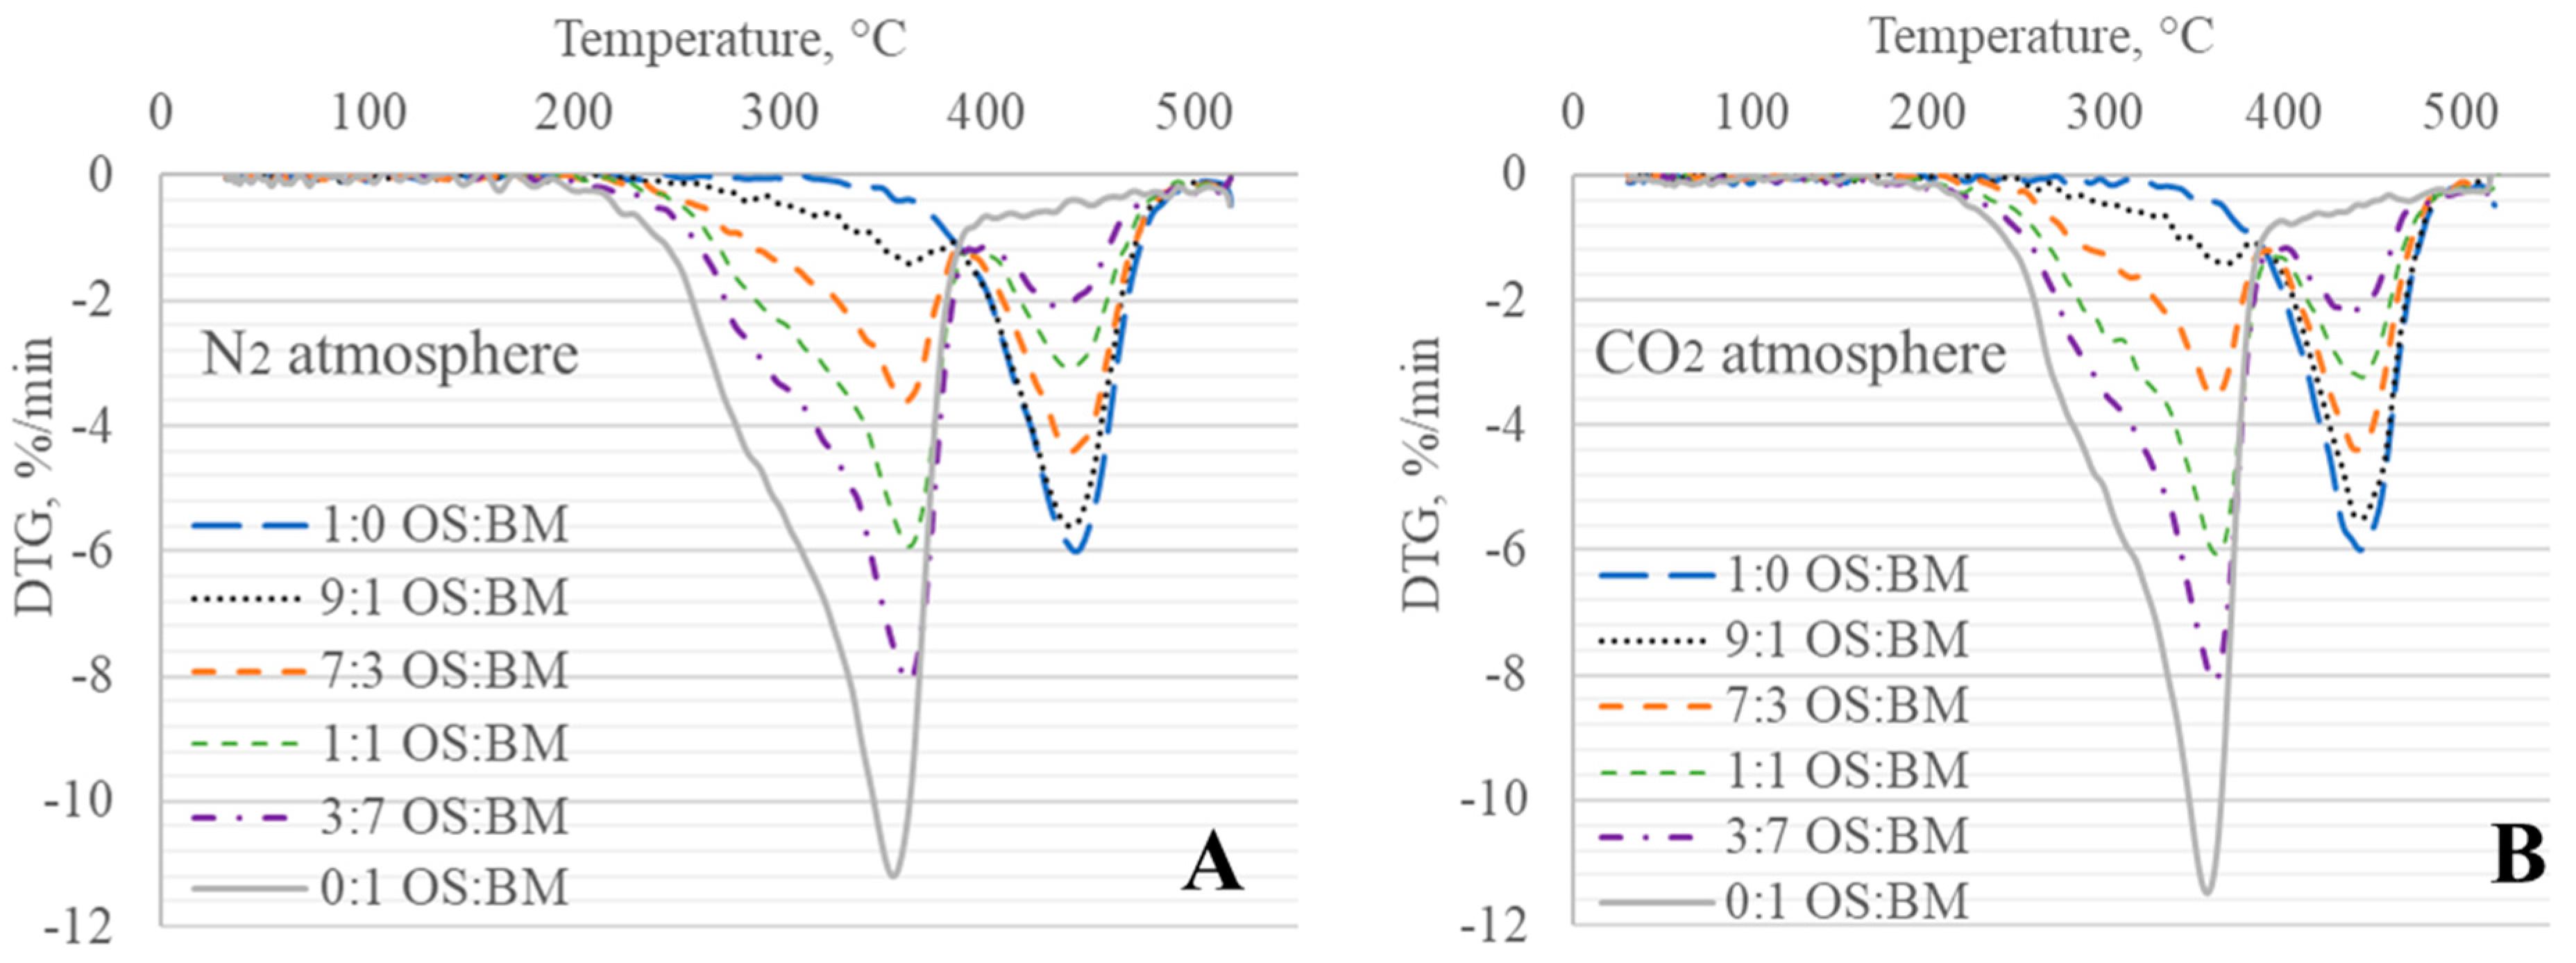
The DTG curves in N2 and CO2 are shown in Figure 2A,B for OS and BM and OS:BM blends. The temperatures where the highest loss of mass occurred varied based on the TGA behaviour of each fuel and the blend ratio. Individual pyrolysis of BM had the highest DTG peak at 355–358 °C, while the same for OS reached 443–446 °C. The OS:BM blends had two temperature peaks as a result of an additive pyrolytic behaviour of both fuels. The higher ratios of BM shifted the TGA curve, and DTG peaks to the left up to 10 °C in OS:BM blends, towards a behaviour more similar to the pyrolysis of BM, including the temperature ranges where the most significant share of OS pyrolysis occurred. Therefore, the DTG peaks of OS:BM blends varied due to their combined thermal decomposition, and the heat transfer interactions between OS and BM. The addition of BM to OS contributed to enhanced pyrolysis. This was maybe due to and higher volatile content of BM (Table 1), which potentially led to the production of a higher yield of liquid (oil) and gaseous products [49]. The addition of BM and the pyrolysis temperature shift can reduce the activation energy [50]. Higher ratios of BM can increase the yield of products [51] and accelerate thermal decomposition [20]. A probable reason for the enhanced OS pyrolysis when adding BM is the catalytic effect of fuel elements, such as ash alkali and alkaline earth metals, which can promote pyrolysis, enhance organic matter decomposition, and promote the production of oil and gas [16,42,51]. Higher hydrogen content of BM (6.6 vs. 2.8 wt% in OS) can also contribute to an increased number of hydrogen-free radicals promoting OS pyrolysis and enhancing liquid and gaseous pyrolytic products [52].
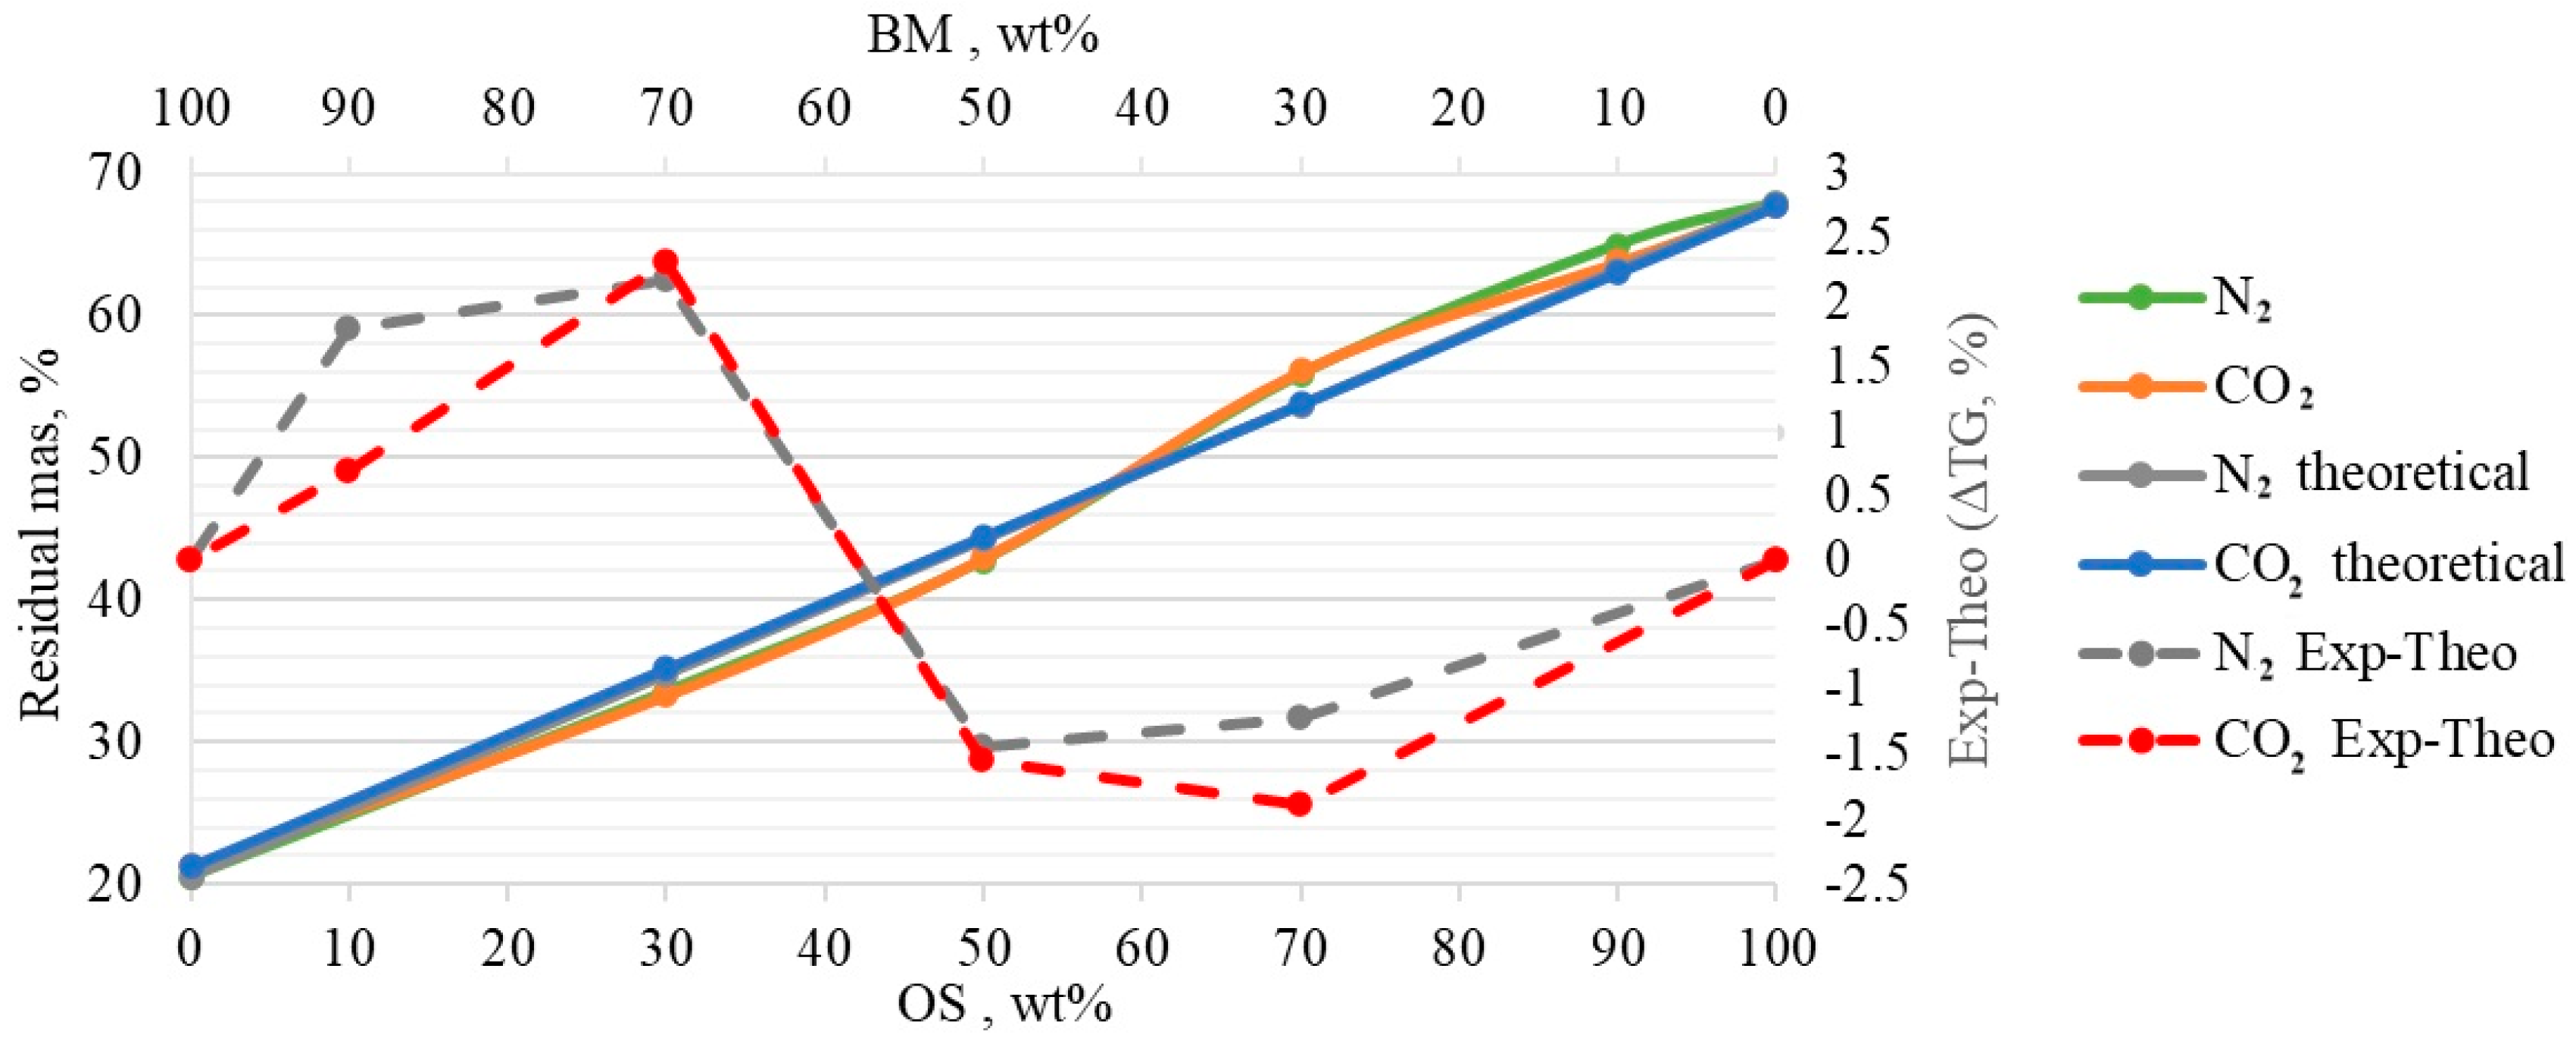
From the co-pyrolytic curves in Figure 1A,B and Figure 2A,B, it can be seen that the TGA decomposition was a result of an additive behaviour of individual pyrolysis of OS and BM, as the final weight loss increased with the addition of BM, as also observed by Kiliç et al. [53]. Figure 3 displays the residual mass vs. OS:BM blends in all N2 and CO2. For both gas atmospheres, the additive behaviour is evidenced by a linear increase in mass loss as the BM ratio increases, with a linear coefficient of determination R2 from 0.994 to 0.996. The TGA behaviour of OS:BM blends follow a two-stage decomposition, the first stage from 200 to 380–400 °C, which is predominantly attributed to BM pyrolysis, and the second stage, from 380–400 to 490–500 °C, which primarily corresponds to OS pyrolysis. The temperature range, where the largest share of mass loss occurred for both pyrolysis blends, was from 200 to 500 °C, as also noted by Chen et al. [20]. An earlier thermal degradation occurred as the BM ratio increased, which was also noted by Dai et al. [51]. This was mainly due to a shift of the mass loss in all decomposition stages towards a lower temperature region, which can lead to improved pyrolysis characteristics of OS, as explained previously by Jiang, et al. [16].
The co-pyrolytic behaviour of OS and BM is also shown in Figure 1A,B for pyrolysis in N2 and CO2 atmospheres. At first glance, it can be visualised that the TGA curves for individual pyrolysis, as well as for OS:BM blends, have almost identical behaviour under both gas atmospheres. There were few differences in pyrolysis in CO2 atmospheres compared to N2. The differences in the final residual mass between CO2 and N2 atmospheres for OS:BM 1:0, 9:1, 7:3, 1:1, 3:7, and 0:1 were 0.2, 1.2, 0.2, 0.2, 0.2, and 0.7 wt%, respectively. The effect of CO2 could in all likelihood be more noticeable at higher temperatures (above 500 °C), as the gas can contribute to gasification reactions, enhancing thermal cracking and increasing the gas yield, while decreasing the solid yield [54,55]. Even though CO2 atmospheres did not have considerable improvement in the pyrolysis of OS and BM from a TGA point of view, using CO2 can be potentially beneficial, as the decomposition behaviour and the mass losses are not inhibited and the outcome is comparable to N2 pyrolysis, while having the advantage of using this pollutant gas to be stored through Carbon Capture, Utilisation and Storage Technologies (CCUS) [56].

3.3. Interactions in Co-Pyrolysis

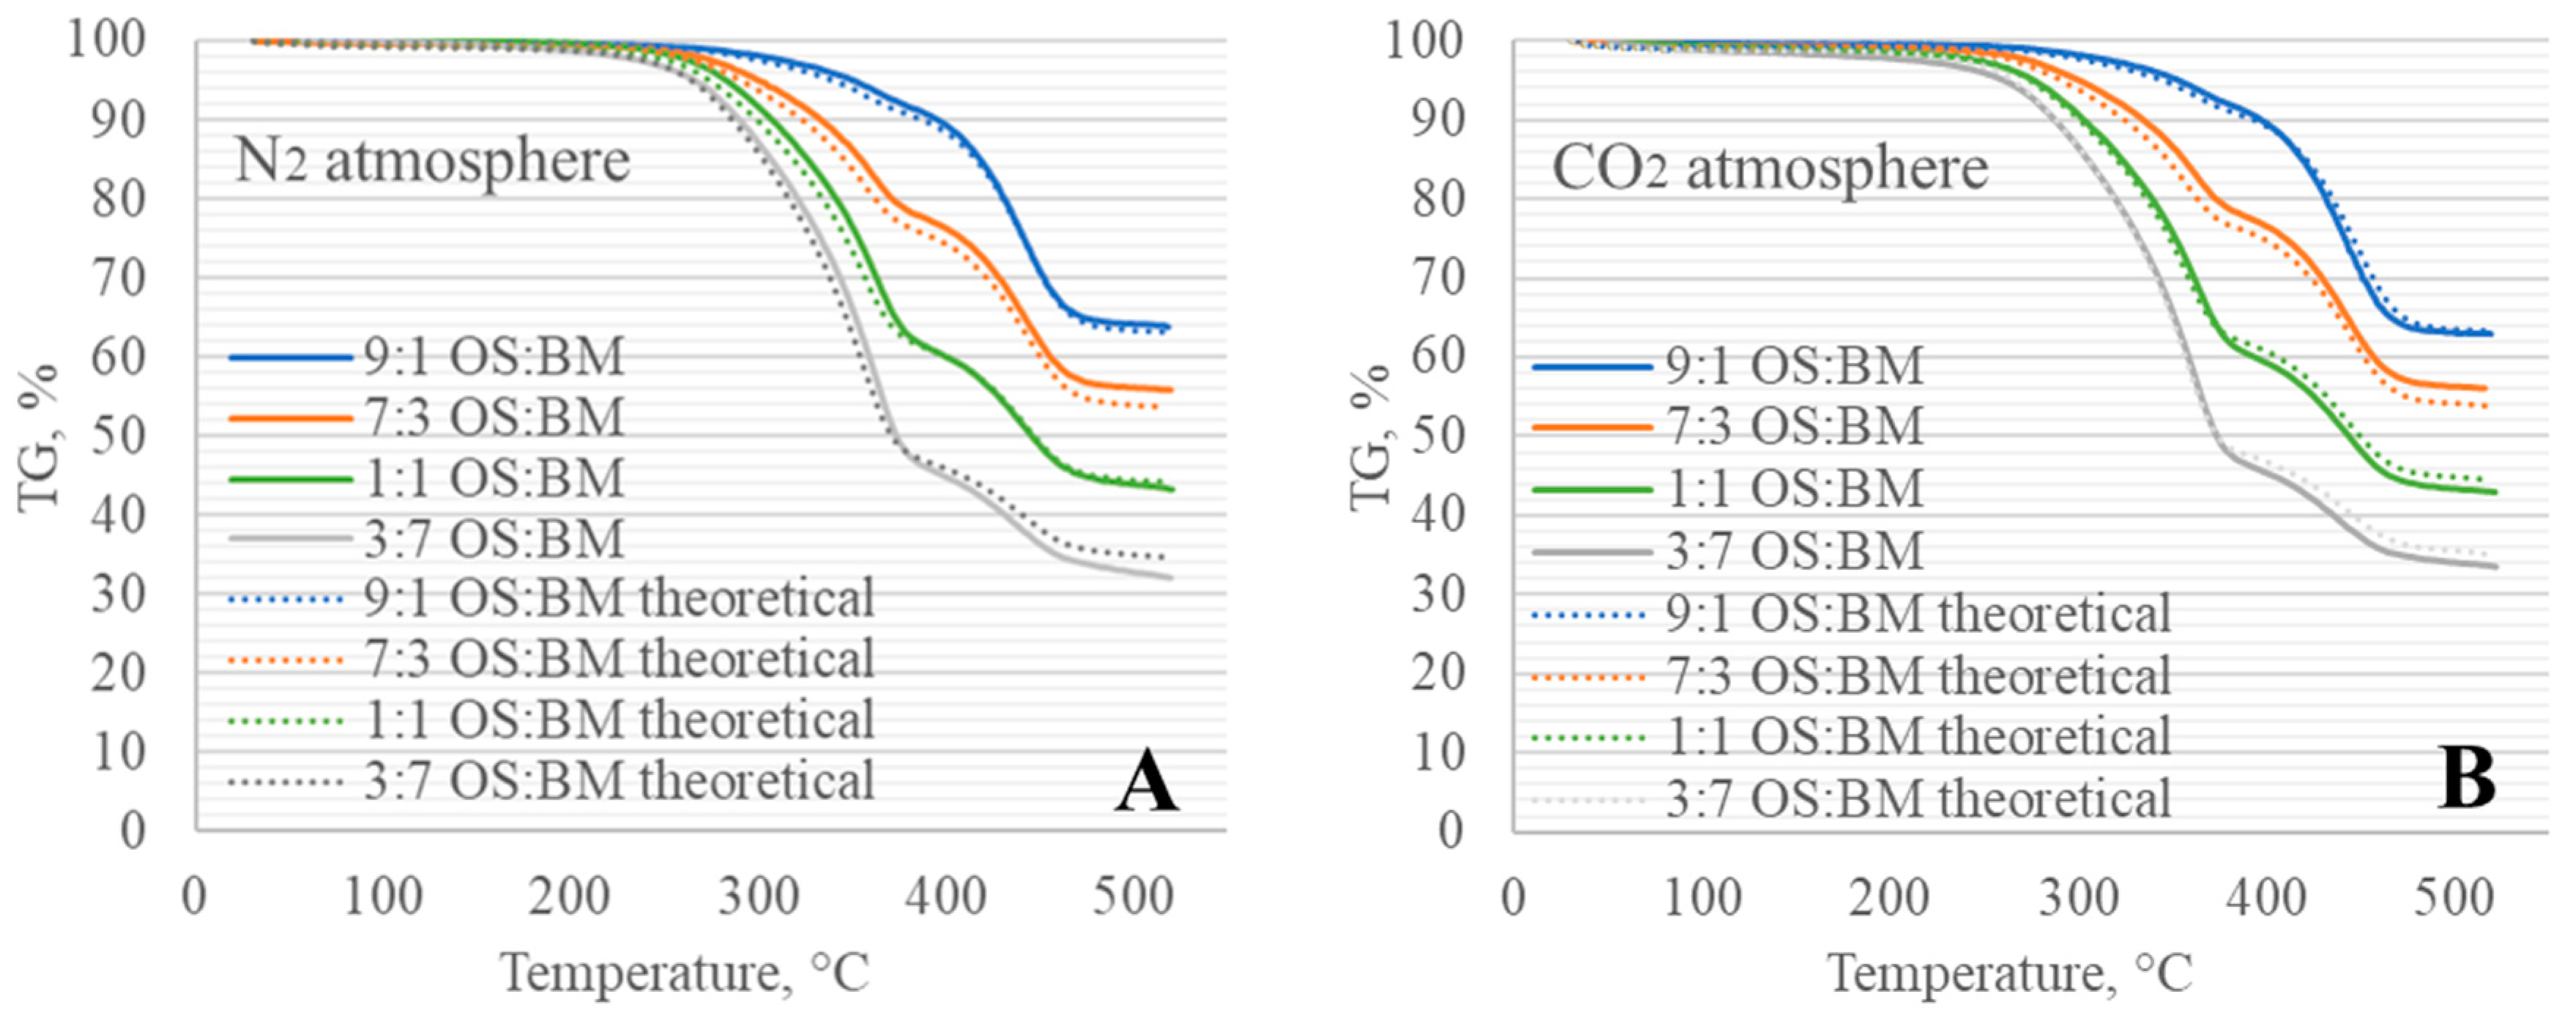
A detailed comparison is shown in Figure 4A,B, displaying the experimental and theoretical TGA (from Equation (1)) curves obtained for co-pyrolysis of OS:BM 9:1, 7:3, 1:1, and 3:7 blend ratios in N2 and CO2 atmospheres.
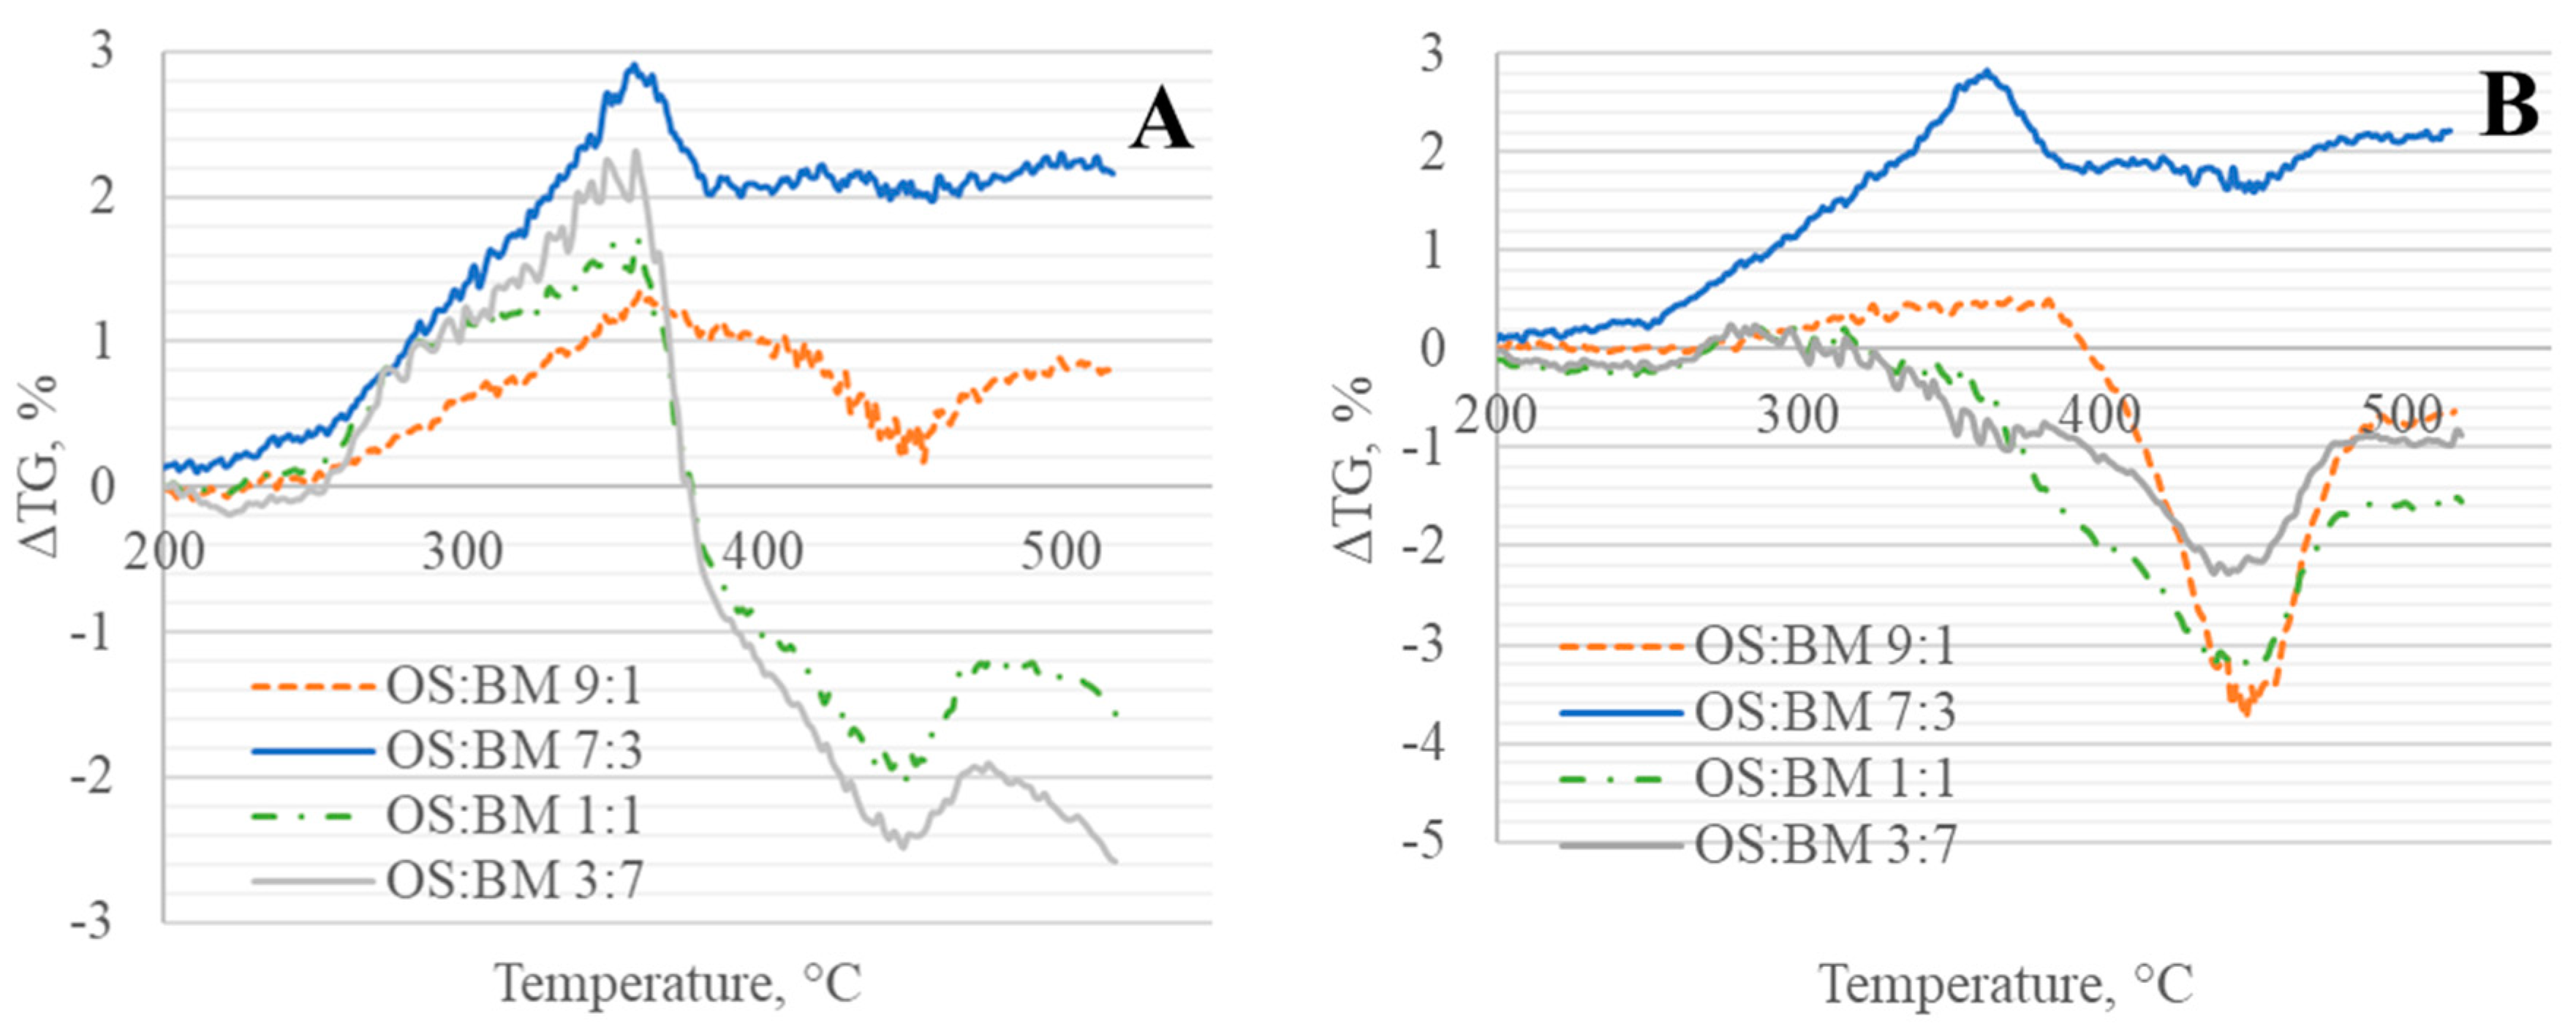
The theoretical and experimental TGA curves of OS:BM co-pyrolysis displayed slight differences in the residual mass for all the OS:BM blends in both gas atmospheres. The TGA curves shown in Figure 4A,B indicate that the experimental curves behaved as an additive process from individual pyrolysis of OS and BM, as also demonstrated in the theoretical curves, which had almost identical behaviour. However, there were some slight differences between the theoretical and experimental curves, which can be observed in Figure 5A,B. In the temperature range from 80 to 250 °C, the TGA experimental and theoretical residual mass differed by less than 0.5 wt% for all blends, with the majority of the experimental residual mass being higher than the theoretical for all blends in both gas atmospheres. The behaviour was different at temperatures from 250 to 370 °C, where most BM decomposition occurred. For N2 pyrolysis, the experimental residual mass was higher than the theoretical residual mass, reaching the maximum difference at 350–360 °C, with up to 1.4, 2.8, 1.8, and 2.4 wt% difference for OS:BM 9:1, 7:3, 1:1, and 3:7, respectively. The blends in the CO2 atmosphere at the same temperature range had higher experimental residual mass for OS:BM 9:1 and 7:3 (up to 1.0 and 2.8 wt% difference, respectively) and lower residual mass with less than 1 wt% difference for OS:BM 1:1 and 3:7. After 370–400 °C, OS:BM 1:1 and 3:7 blends had a final experimental residual mass of 2.2–2.3 and 0.7–1.8 wt% lower than the theoretical residual mass. The 9:1 and 7:3 blends had the opposite behaviour, with a higher experimental residual mass, from 1.2 to 1.9 and 1.4 to 1.5 wt%, higher than the theoretical residual mass. Overall, the residual mass difference between experimental and theoretical decomposition was no greater than 3 wt%, with an uncertainty of ±1 wt%, with the highest differences at temperatures from 350 to 370 °C and >450 °C, and the lowest differences at temperatures below 250 °C.
From the comparison of experimental and theoretical TGA curves, it was observed that at temperatures below 250 °C there were negligible or no interactions between OS and BM. At temperature ranges of 350–370 °C and >450 °C, there were some slight interactions between OS and BM, with a predominantly inhibiting effect on the mass loss for OS:BM 9:1 and 7:3 blends, and a mass loss promoting effect for OS:BM 1:1 and 3:7 blends in both atmospheres, indicating improved pyrolysis as the BM ratio raised. The peaks of interactions were identified to coincide with the highest DTG temperature peaks, where BM and OS were going through the most significant stage of decomposition, indicating the existence of interactions during the main pyrolytic stage for each fuel. Nonetheless, in all cases, the promotion or inhibition effects were not too significant to conclude the presence of a strong synergistic effect during co-pyrolysis. Similar results have been obtained by Kiliç et al. [53] in the co-pyrolysis of OS and E.rigida, and Janik et al. [15] in the co-pyrolysis of OS and Terebinth berries, who noted an additive behaviour from individual pyrolysis of OS and BM. Johannes et al. [57] also noted minimal synergistic effects, only in the initial decomposition stage. On the contrary, other research has found promoting synergistic interactions between OS and different BM, which increased the liquid product yields, decreased the solid yields and the activation energy, and improved the pyrolysis product properties [13,20,51]. It should be noted that, in most research, the synergistic effects were observed in the yields and/or composition of products and mostly in larger-scale equipment.

3.4. Kinetic Studies

The experimental and theoretical mass losses of OS, BM, and OS:BM blends in co-pyrolysis at 10, 20, and 30 °C/min are shown in Table 2, where it can be observed that the theoretical mass loss differs from the experimental mass loss in blends with larger ratios of BM. However, the differences are lower than 2 wt% in most blends and heating rates, except for the OS:BM blend 3:7 at 30 °C/min. The TGA data at heating rates of 10, 20, and 30 °C/min were used to calculate the apparent activation energy using the Coats–Redfern model, as shown in Table 3.
From Table 3, the deviation in the activation energy for all OS:BM blends at different heating rates was below 2.5%, except for 7.8 for OS:BM 1:0. Therefore, the calculation of the activation energy is considered reliable as the deviation is well below 10%. It is also observed that the R2 values are close to 1, especially for 100 wt% BM and for OS:BM blends with higher ratios of BM. As the BM ratio increased, the reaction order n that resulted in the best correlation was also raised. The activation energies obtained with Coats–Redfern agree with some other research, for BM [58,59] and OS [60]. It should be considered that the values of activation energies vary, depending on the temperature range studied. The current study calculated the activation energy for a temperature range where pyrolysis of BM and OS occurred, at 200–520 °C. However, the activation energies calculated using the Coat–Redfern model are considerably lower than those found in most of the results from the literature. Therefore, the Kissinger, Friedman, and Vyazovkin models were applied, and the results obtained through these methods are shown in Table 4.
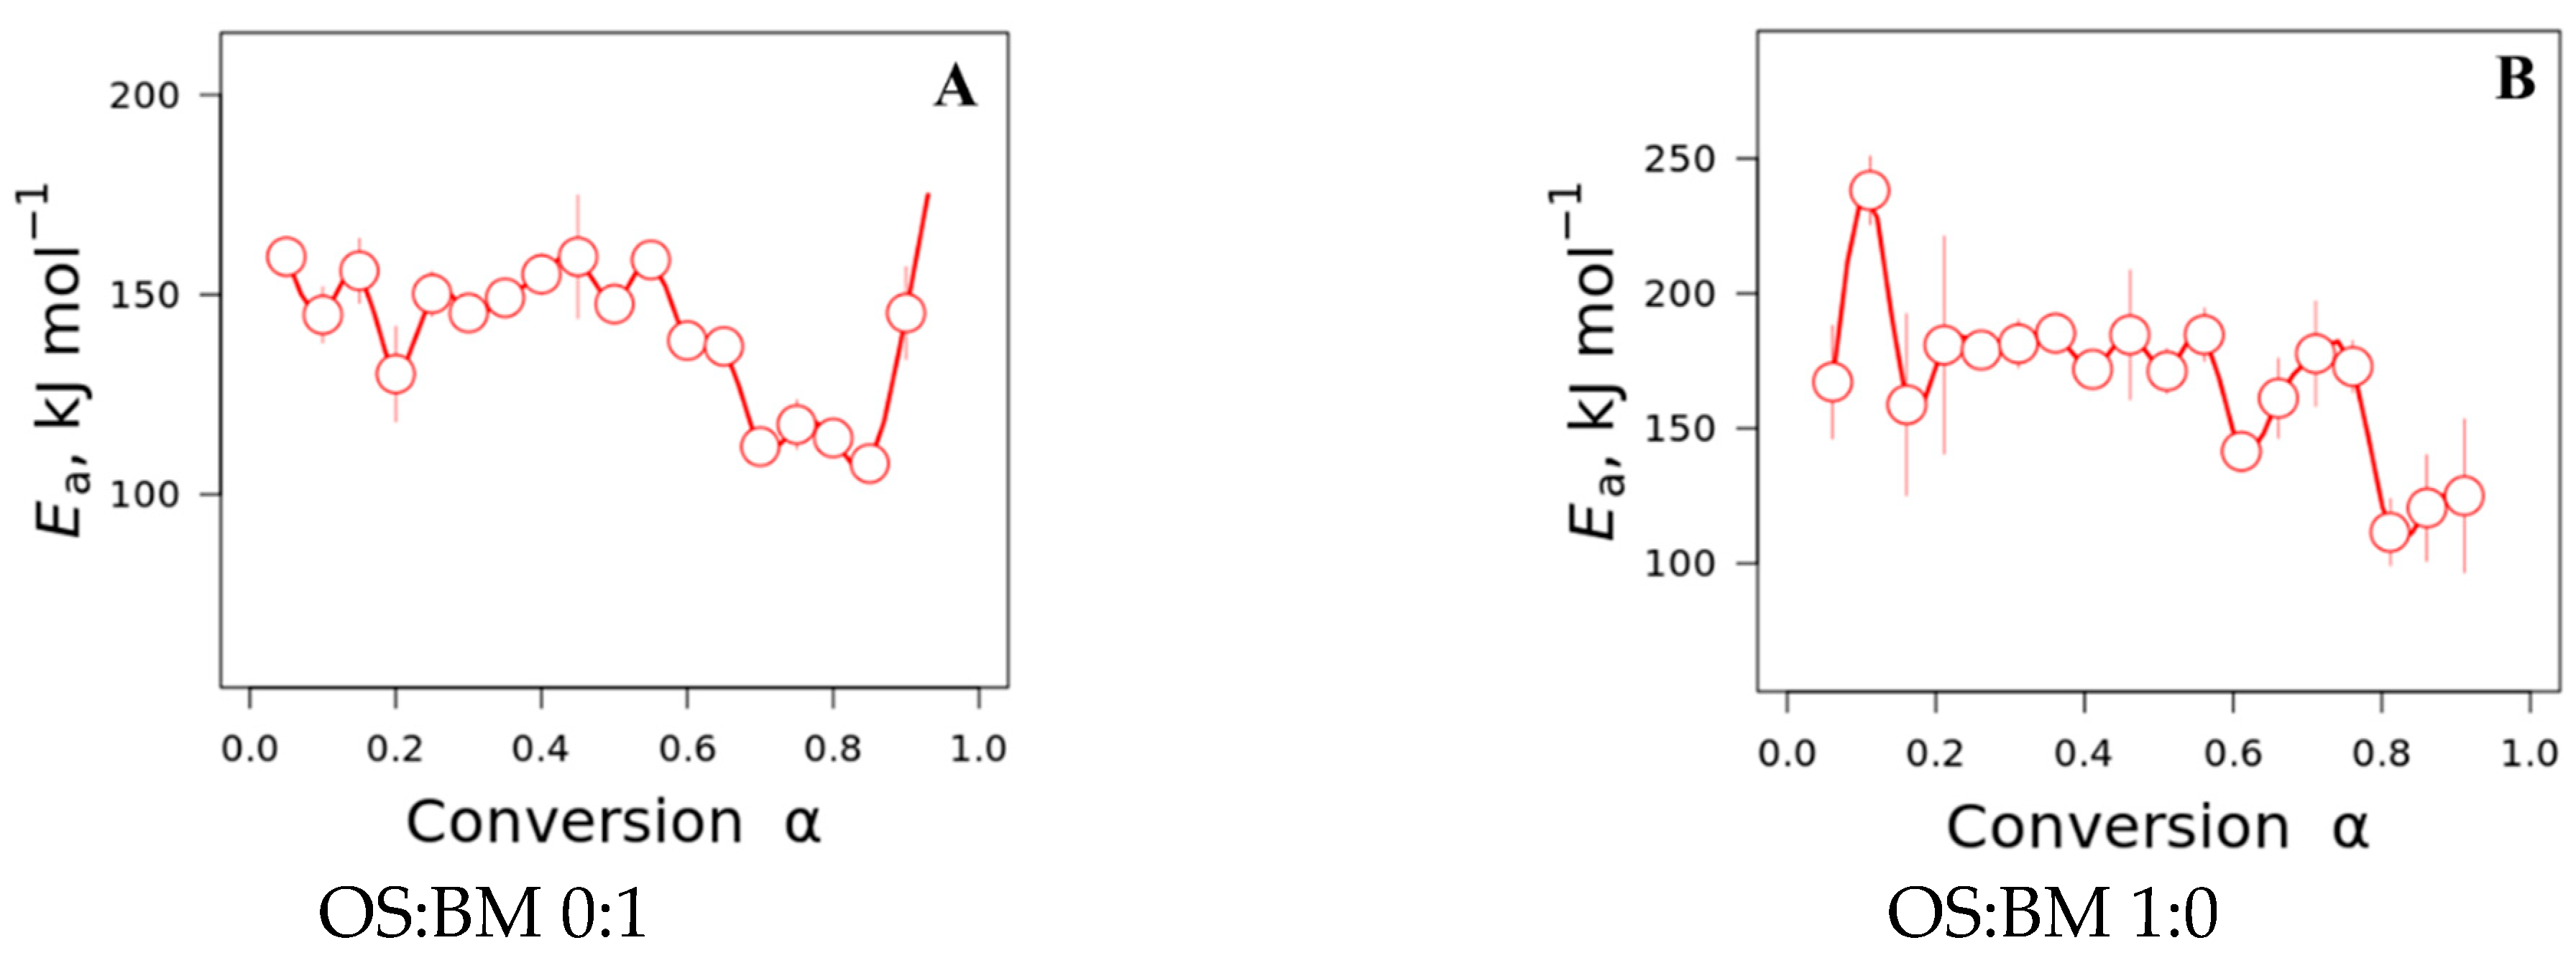
While Coats–Redfern resulted in activation energies of 96.7 kJ/mol for BM and 58.9 kJ/mol for OS, the results from the Kissinger, Friedman, and Vyazovkin models shown in Table 4 are significantly different. Even though the Coats–Redfern model provided a higher R2, Vyazovkin, and Friedman are advanced isoconversional models that determine the kinetic parameters at different stages of conversion, which resulted in a more detailed analysis of the pyrolysis and co-pyrolysis of OS and BM. From Kissinger, Friedman, and Vyazovkin models, the activation energy range was 139.3–147.4 kJ/mol for BM and 160.2–171.5 kJ/mol for OS. The apparent activation energy for OS:BM blends ranged from 145.9 to 197.3 kJ/mol. These values are in accordance with most studies from the literature on OS and BM [20,51,61,62,63]. The apparent activation energy for OS and BM and OS:BM blends at different stages of conversion based on the Friedman model are shown in Figure 6A,B and Figure 7, respectively.
From the apparent activation energies shown in Figure 6A,B, it can be observed that both OS and BM have activation energy in the range of 100–200 kJ/mol at most degrees of conversion, which tend to decrease as the conversion degree increases. However, the most significant result is observed in Figure 7. For all OS:BM blends, there is a clear two-stage decomposition based on the activation energy at different stages of conversion. Lower activation energy at the first stage corresponds mostly to BM pyrolysis, while the second stage of higher activation energy corresponds for the most part to OS pyrolysis. The two-stage decomposition varies based on the ratio of OS:BM. The higher ratio of OS results in a wider second stage of conversion, with a higher activation energy. These results agree with the additive behaviour obtained in the TGA analysis and the analysis of interactions between OS and BM in Section 3.2. A two-stage decomposition with two different sections of apparent activation energies could explain the additive behaviour and low interactions in the residual mass of OS:BM co-pyrolysis. Based on the kinetic results from the Friedman model from Figure 7, the average activation energy for OS and BM was calculated based on the conversion ranges of the two-stage decomposition observed. The results are shown in Table 5.

3.5. Process Modelling

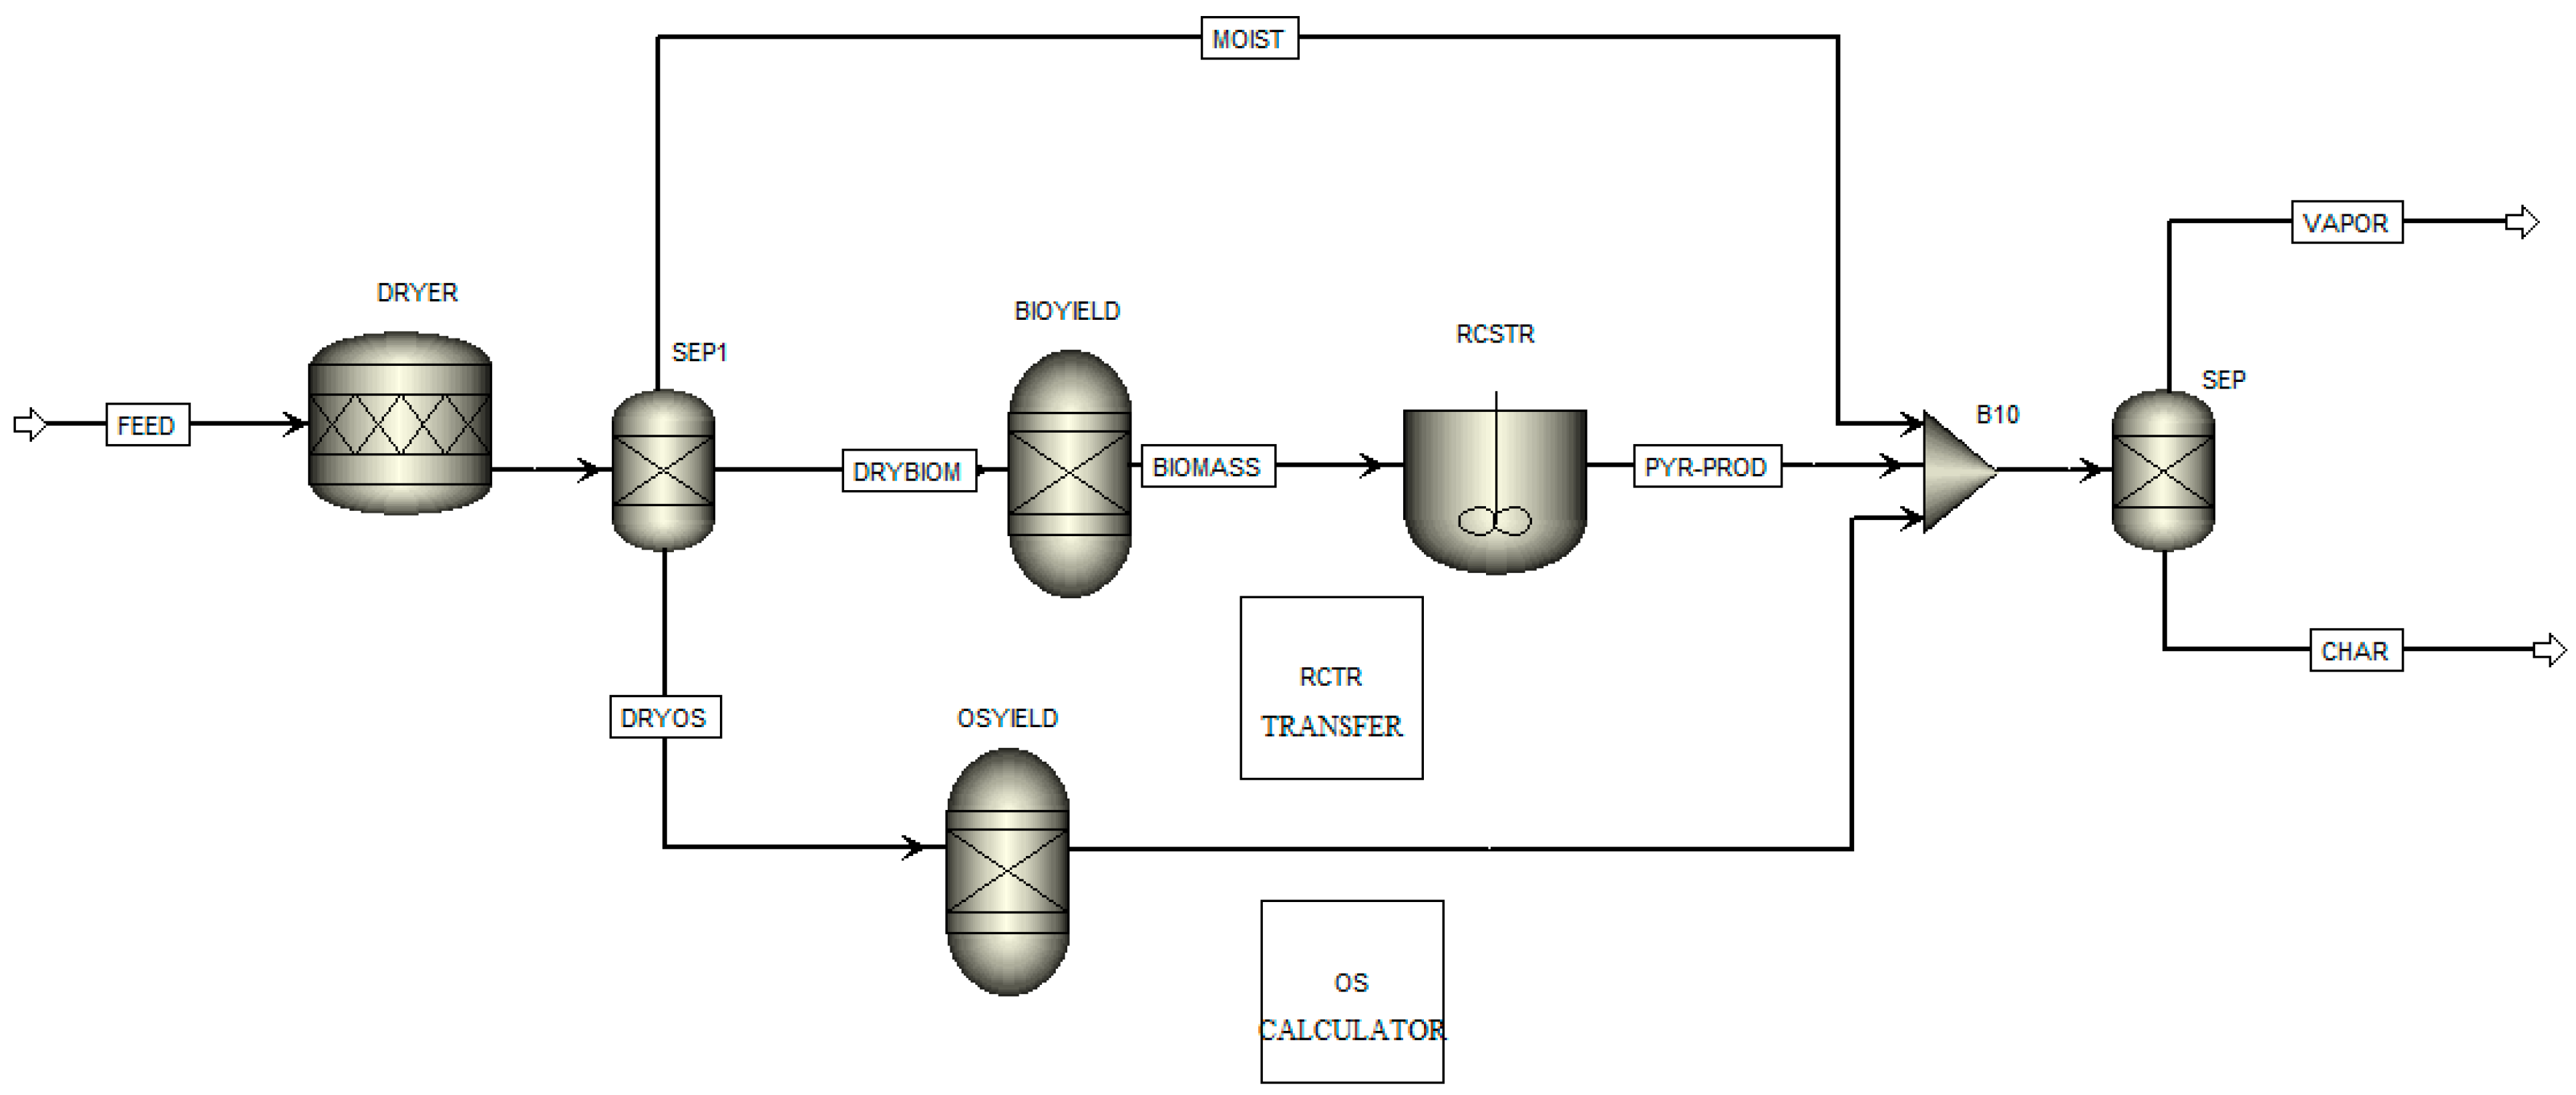
In the Aspen Plus® environment, OS was modelled as a non-conventional component, while the BM components (i.e., cellulose, hemicellulose, and lignin) were entered as conventional components, and their thermophysical properties were estimated using the approach proposed by Gorensek et al. [64]. The kinetic parameters used in the model for BM and OS are shown in Table 6. The biochemical composition of BM, i.e., cellulose, hemicellulose, lignin-C, lignin-H, and lignin-O, was estimated from the elemental analysis of wood using the method proposed by Debiagi et al. [65]. The Peng–Robinson Equation of State with Boston–Mathias (PR-BM) modification was used to estimate the thermodynamic properties of conventional components. Figure 8 displays the Aspen Plus® process schematics used.
With the first-order reaction mechanism, the kinetic parameters estimated by the TGA kinetic models were optimised to fit with the experimental data as shown in Figure 9. There was a close match between the model prediction and the experimental TGA data of the individual pyrolysis of BM and OS, and the co-pyrolysis of BM and OS. The mean absolute errors for BM and OS of 3.78% and 1.81%, respectively, and 2.89, 2.60, 1.75, and 2.53% for OS:BM 9:1, 7:3, 1:1, and 3:7, were obtained by comparing the simulated and experimental TGA data. A sensitivity analysis revealed that the exponential factor, A, and reaction order, n, have a greater influence on the mass loss curve than the activation energy.

4. Conclusions

  • The obtained TGA and DTG curves for OS:BM blends demonstrated an improved pyrolysis process, as the TGA curves were shifted from up to 10 °C to a lower temperature when the BM ratio increased. The addition of BM could enhance the pyrolysis of OS by increasing the mass loss and reducing the decomposition temperature. There was a linear relationship between the mass loss and the ratio of BM.
  • The different two gas atmospheres resulted in an almost identical pyrolytic behaviour for all OS and BM blends. Nonetheless, the use of a CO2 atmosphere resulted in the pyrolysis of OS and BM blends comparable to the N2 atmosphere, showing its potential use in pyrolysis and co-pyrolysis as an alternative gas atmosphere obtained from CCUS technologies.
  • The interactions between BM and OS were mostly negligible, particularly at low temperatures (<250 °C), while some slight interactions were observed at 350–370 °C and >500 °C, resulting in additive co-pyrolytic behaviour of OS:BM blends, which was further confirmed with the two-stage decomposition observed in the apparent activation energies at different stages of conversion.
  • The Aspen Plus® model can be useful in optimising the TGA pyrolysis experiments, and further studies involving a comparison with experimental data from larger-scaled fixed-bed reactors would unlock the opportunity to directly apply TGA kinetic data in the reactor design.
  • Experiments in larger-scale equipment, such as fixed beds or fluidized bed reactors, are proposed as a follow-up path to study the co-pyrolytic behaviour of OS and BM, possible interactions, and the effect of CO2 as a gas atmosphere.

Author Contributions

Conceptualisation, A.L.C., S.S., and A.K.; methodology, A.L.C., R.O., and A.K.; software, R.O., S.S., and A.L.C.; validation, A.L.C., R.O., and A.K.; formal analysis A.L.C., R.O., S.S., and A.K.; writing—original draft preparation, A.L.C.; writing—review and editing, A.L.C., R.O., S.S., O.J., and A.K.; visualisation, A.L.C.; supervision, S.S. and A.K. All authors have read and agreed to the published version of the manuscript.

Funding

This work is supported by the European Regional Development Fund, the Nordic Energy Research (BioELEC project, grant: 120006), and the Estonian Research Council Grant PSG266.

Data Availability Statement

Data are not publicly available due to the extensive nature of the dataset, which makes it impractical for direct public dissemination; the data may be made available on request from the corresponding author.

Conflicts of Interest

The authors declare no conflicts of interest.

References

  1. Rogelj, J.; Den Elzen, M.; Höhne, N.; Fransen, T.; Fekete, H.; Winkler, H.; Schaeffer, R.; Sha, F.; Riahi, K.; Meinshausen, M. Paris Agreement climate proposals need a boost to keep warming well below 2 °C. Nature 2016, 534, 631–639. [Google Scholar] [CrossRef]
  2. Uddin, M.N.; Techato, K.; Taweekun, J.; Rahman, M.M.; Rasul, M.G.; Mahlia, T.M.I.; Ashrafur, S.M. An overview of recent developments in biomass pyrolysis technologies. Energies 2018, 11, 3115. [Google Scholar] [CrossRef]
  3. Akhtar, A.; Krepl, V.; Ivanova, T. A Combined Overview of Combustion, Pyrolysis, and Gasification of Biomass. Energy Fuels 2018, 32, 7294–7318. [Google Scholar] [CrossRef]
  4. Han, X.; Kulaots, I.; Jiang, X.; Suuberg, E.M. Review of oil shale semicoke and its combustion utilization. Fuel 2014, 126, 143–161. [Google Scholar] [CrossRef]
  5. Knaus, E.; Killen, J.; Biglarbigi, K.; Crawford, P. An overview of oil shale resources. ACS Symp. Ser. 2010, 1032, 3–20. [Google Scholar] [CrossRef]
  6. Wang, Q.; Li, X.; Wang, K.; Zhu, Y. Commercialization and Challenges for the Next Generation of Biofuels: Biomass Fast Pyrolysis. In Proceedings of the 2010 Asia-Pacific Power and Energy Engineering Conference, Chengdu, China, 28–31 March 2010; IEEE: Piscataway, NJ, USA, 2010; pp. 1–4. [Google Scholar]
  7. Pihu, T.; Konist, A.; Puura, E.; Liira, M.; Kirsimäe, K. Properties and environmental impact of oil shale ash landfills. Oil Shale 2019, 36, 257–270. [Google Scholar] [CrossRef]
  8. Lees, H.; Järvik, O.; Konist, A.; Siirde, A.; Maaten, B. Comparison of the ecotoxic properties of oil shale industry by-products to those of coal ash. Oil Shale 2022, 39, 1–19. [Google Scholar] [CrossRef]
  9. Baird, Z.S.; Oja, V.; Järvik, O. The composition of kukersite shale oil. Oil Shale 2023, 40, 25–43. [Google Scholar] [CrossRef]
  10. Haykiri-Acma, H.; Yaman, S. Interaction between biomass and different rank coals during co-pyrolysis. Renew. Energy 2010, 35, 288–292. [Google Scholar] [CrossRef]
  11. Quan, C.; Xu, S.; An, Y.; Liu, X. Co-pyrolysis of biomass and coal blend by TG and in a free fall reactor. J. Therm. Anal. Calorim. 2014, 117, 817–823. [Google Scholar] [CrossRef]
  12. Lan, W.; Chen, G.; Zhu, X.; Wang, X.; Xu, B. Progress in techniques of biomass conversion into syngas. J. Energy Inst. 2015, 88, 151–156. [Google Scholar] [CrossRef]
  13. Chen, B.; Han, X.; Tong, J.; Mu, M.; Jiang, X.; Wang, S.; Shen, J.; Ye, X. Studies of fast co-pyrolysis of oil shale and wood in a bubbling fluidized bed. Energy Convers. Manag. 2020, 205, 112356. [Google Scholar] [CrossRef]
  14. Bai, F.; Sun, Y.; Liu, Y.; Li, Q.; Guo, M. Thermal and kinetic characteristics of pyrolysis and combustion of three oil shales. Energy Convers. Manag. 2015, 97, 374–381. [Google Scholar] [CrossRef]
  15. Yanik, J.; Seçim, P.; Karakaya, S.; Tiikma, L.; Luik, H.; Krasulina, J.; Raik, P.; Palu, V. Low-temperature pyrolysis and co-pyrolysis of Göynük oil shale and terebinth berries (Turkey) in an autoclave. Oil Shale 2011, 28, 469–486. [Google Scholar] [CrossRef]
  16. Jiang, H.; Deng, S.; Chen, J.; Zhang, L.; Zhang, M.; Li, J.; Li, S.; Li, J. Preliminary Study on Copyrolysis of Spent Mushroom Substrate as Biomass and Huadian Oil Shale. Energy Fuels 2016, 30, 6342–6349. [Google Scholar] [CrossRef]
  17. Lee, J.; Yang, X.; Cho, S.H.; Kim, J.K.; Lee, S.S.; Tsang, D.C.W.; Ok, Y.S.; Kwon, E.E. Pyrolysis process of agricultural waste using CO2 for waste management, energy recovery, and biochar fabrication. Appl. Energy 2017, 185, 214–222. [Google Scholar] [CrossRef]
  18. Lee, J.; Oh, J.I.; Ok, Y.S.; Kwon, E.E. Study on susceptibility of CO2-assisted pyrolysis of various biomass to CO2. Energy 2017, 137, 510–517. [Google Scholar] [CrossRef]
  19. Tang, L.; Yan, Y.; Meng, Y.; Wang, J.; Jiang, P.; Pang, C.H.; Wu, T. CO2 gasification and pyrolysis reactivity evaluation of oil shale. Energy Procedia 2019, 158, 1694–1699. [Google Scholar] [CrossRef]
  20. Chen, B.; Han, X.; Mu, M.; Jiang, X. Studies of the Co-pyrolysis of Oil Shale and Wheat Straw. Energy Fuels 2017, 31, 6941–6950. [Google Scholar] [CrossRef]
  21. ISO 16948:2015; Solid Biofuels—Determination of Total Content of Carbon, Hydrogen, and Nitrogen. International Organization for Standardization: Geneva, Switzerland, 2015.
  22. ISO 16994:2016; Solid Biofuels—Determination of Total Content of Sulfur and Chlorine. International Organization for Standardization: Geneva, Switzerland, 2016.
  23. ISO 18134-2:2017; Solid Biofuels—Determination of Moisture Content—Oven Dry Method—Part 2: Total Moisture—Simplified Method. International Organization for Standardization: Geneva, Switzerland, 2017.
  24. ISO 18122:2022; Solid Biofuels—Determination of Ash Content. International Organization for Standardization: Geneva, Switzerland, 2022.
  25. ISO 18125:2017; Solid Biofuels—Determination of Calorific Value. International Organization for Standardization: Geneva, Switzerland, 2017.
  26. Sulg, M.; Konist, A.; Järvik, O. Characterization of different wood species as potential feedstocks for gasification. Agron. Res. 2021, 19, 2021. [Google Scholar] [CrossRef]
  27. ISO 14780:2017; Solid Biofuels—Sample Preparation. International Organization for Standardization: Geneva, Switzerland, 2017.
  28. ISO 29541:2010; Solid Mineral Fuels—Determination of Total Carbon, Hydrogen, and Nitrogen Content—Instrumental Method. International Organization for Standardization: Geneva, Switzerland, 2010.
  29. ISO 1928:2020; Coal and Coke—Determination of Gross Calorific Value. International Organization for Standardization: Geneva, Switzerland, 2020.
  30. EVS 669:2022; Oil Shale. Determination of Ash Content. Estonian Centre for Standardisation (EVS): Tallinn, Estonia, 2022.
  31. Li, J.; Dou, B.; Zhang, H.; Zhang, H.; Chen, H.; Xu, Y.; Wu, C. Pyrolysis characteristics and non-isothermal kinetics of waste wood biomass. Energy 2021, 226, 120358. [Google Scholar] [CrossRef]
  32. Wahab, A.; Sattar, H.; Ashraf, A.; Hussain, S.N.; Saleem, M.; Munir, S. Thermochemical, kinetic and ash characteristics behaviour of Thar Lignite, agricultural residues and synthetic polymer waste (EVA). Fuel 2020, 266, 117151. [Google Scholar] [CrossRef]
  33. Ebrahimi-Kahrizsangi, R.; Abbasi, M.H. Evaluation of reliability of Coats-Redfern method for kinetic analysis of non-isothermal TGA. Trans. Nonferrous Met. Soc. China 2008, 18, 217–221. [Google Scholar] [CrossRef]
  34. Muravyev, N.V.; Pivkina, A.N.; Koga, N. Critical appraisal of kinetic calculation methods applied to overlapping multistep reactions. Molecules 2019, 24, 2298. [Google Scholar] [CrossRef]
  35. Friedman, H. Kinetics of Thermal Degradation of Char-Forming Plastics from Thermogravimetry. Appl. Phenolic Plastic. J. Polym. Sci. Part. C Polym. Symp. 2007, 6, 183–195. [Google Scholar] [CrossRef]
  36. Vyazovkin, S. Modification of the Integral Isoconversional Method to Account for Variation in Activation Energy. J. Comput. Chem. 2001, 22, 178–183. [Google Scholar] [CrossRef]
  37. Kissinger, H.E. Reaction Kinetics in Differential Thermal Analysis. Anal. Chem. 1957, 29, 1702–1706. [Google Scholar] [CrossRef]
  38. Baliban, R.C.; Elia, J.A.; Floudas, C.A. Toward novel hybrid biomass, coal, and natural gas processes for satisfying current transportation fuel demands, 1: Process alternatives, gasification modeling, process simulation, and economic analysis. Ind. Eng. Chem. Res. 2010, 49, 7343–7370. [Google Scholar] [CrossRef]
  39. Mozaffari, S.; Järvik, O.; Baird, Z.S. Composition of gas from pyrolysis of Estonian oil shale with various sweep gases. Oil Shale 2021, 38, 215–227. [Google Scholar] [CrossRef]
  40. Ranzi, E.; Cuoci, A.; Faravelli, T.; Frassoldati, A.; Migliavacca, G.; Pierucci, S.; Sommariva, S. Chemical kinetics of biomass pyrolysis. Energy Fuels 2008, 22, 4292–4300. [Google Scholar] [CrossRef]
  41. Han, X.X.; Jiang, X.M.; Cui, Z.G. Studies of the effect of retorting factors on the yield of shale oil for a new comprehensive utilization technology of oil shale. Appl. Energy 2009, 86, 2381–2385. [Google Scholar] [CrossRef]
  42. Hu, Z.; Ma, X.; Li, L. The synergistic effect of co-pyrolysis of oil shale and microalgae to produce syngas. J. Energy Inst. 2016, 89, 447–455. [Google Scholar] [CrossRef]
  43. Wang, S.; Luo, Z. Pyrolysis of Biomass; GREEN—Alternative Energy Resources; Walter de Gruyter GmbH: Berlin, Germany, 2017; p. 268. [Google Scholar] [CrossRef]
  44. Garcia-Perez, M.; Wang, X.S.; Shen, J.; Rhodes, M.J.; Tian, F.; Lee, W.J.; Wu, H.; Li, C.Z. Fast pyrolysis of oil mallee woody biomass: Effect of temperature on the yield and quality of pyrolysis products. Ind. Eng. Chem. Res. 2008, 47, 1846–1854. [Google Scholar] [CrossRef]
  45. Wang, Q.; Sun, B.; Hu, A.; Bai, J.; Li, S. Pyrolysis characteristics of Huadian oil shales. Oil Shale 2007, 24, 147–157. [Google Scholar]
  46. Tiwari, P.; Deo, M. Compositional and kinetic analysis of oil shale pyrolysis using TGA-MS. Fuel 2012, 94, 333–341. [Google Scholar] [CrossRef]
  47. Liu, Q.Q.; Han, X.X.; Li, Q.Y.; Huang, Y.R.; Jiang, X.M. TG-DSC analysis of pyrolysis process of two Chinese oil shales. J. Therm. Anal. Calorim. 2014, 116, 511–517. [Google Scholar] [CrossRef]
  48. Lyons Cerón, A.; Konist, A. Co-Pyrolysis of Woody Biomass and Oil Shale in a Batch Reactor in CO2, CO2-H2O, and Ar Atmospheres. Energies 2023, 16, 3145. [Google Scholar] [CrossRef]
  49. Li, S.; Chen, X.; Liu, A.; Wang, L.; Yu, G. Co-pyrolysis characteristic of biomass and bituminous coal. Bioresour. Technol. 2015, 179, 414–420. [Google Scholar] [CrossRef]
  50. Özsin, G.; Pütün, A.E. TGA/MS/FT-IR study for kinetic evaluation and evolved gas analysis of a biomass/PVC co-pyrolysis process. Energy Convers. Manag. 2019, 182, 143–153. [Google Scholar] [CrossRef]
  51. Dai, M.; Yu, Z.; Fang, S.; Ma, X. Behaviors, product characteristics and kinetics of catalytic co-pyrolysis spirulina and oil shale. Energy Convers. Manag. 2019, 192, 1–10. [Google Scholar] [CrossRef]
  52. Bai, J.; Chen, X.; Shao, J.; Jia, C.; Wang, Q. Study of breakage of main covalent bonds during co-pyrolysis of oil shale and alkaline lignin by TG-FTIR integrated analysis. J. Energy Inst. 2019, 92, 512–522. [Google Scholar] [CrossRef]
  53. Kiliç, M.; Pütün, A.E.; Uzun, B.B.; Pütün, E. Converting of oil shale and biomass into liquid hydrocarbons via pyrolysis. Energy Convers. Manag. 2014, 78, 461–467. [Google Scholar] [CrossRef]
  54. Ye, J.; Xiao, J.; Huo, X.; Gao, Y.; Hao, J.; Song, M. Effect of CO2 atmosphere on biomass pyrolysis and in-line catalytic reforming. Int. J. Energy Res. 2020, 44, 8936–8950. [Google Scholar] [CrossRef]
  55. Farrow, T.S.; Sun, C.; Snape, C.E. Impact of CO2 on biomass pyrolysis, nitrogen partitioning, and char combustion in a drop tube furnace. J. Anal. Appl. Pyrolysis 2015, 113, 323–331. [Google Scholar] [CrossRef]
  56. Cheng, C.-Y.; Kuo, C.-C.; Yang, M.-W.; Zhuang, Z.-Y.; Lin, P.-W.; Chen, Y.-F.; Yang, H.-S.; Chou, C.-T. CO2 Capture from Flue Gas of a Coal-Fired Power Plant Using Three-Bed PSA Process. Energies 2021, 14, 3582. [Google Scholar] [CrossRef]
  57. Johannes, I.; Tiikma, L.; Luik, H. Synergy in co-pyrolysis of oil shale and pine sawdust in autoclaves. J. Anal. Appl. Pyrolysis 2013, 104, 341–352. [Google Scholar] [CrossRef]
  58. Van de Velden, M.; Baeyens, J.; Brems, A.; Janssens, B.; Dewil, R. Fundamentals, kinetics and endothermicity of the biomass pyrolysis reaction. Renew. Energy 2010, 35, 232–242. [Google Scholar] [CrossRef]
  59. Johannes, I.; Kruusement, K.; Veski, R. Evaluation of oil potential and pyrolysis kinetics of renewable fuel and shale samples by Rock-Eval analyzer. J. Anal. Appl. Pyrolysis 2007, 79, 183–190. [Google Scholar] [CrossRef]
  60. Syed, S.; Qudaih, R.; Talab, I.; Janajreh, I. Kinetics of pyrolysis and combustion of oil shale sample from thermogravimetric data. Fuel 2011, 90, 1631–1637. [Google Scholar] [CrossRef]
  61. Baqain, M.; Neshumayev, D.; Konist, A. TG-MS analysis and kinetic study of co-combustion of ca-rich oil shale with biomass in air and oxy-like conditions. Carbon. Capture Sci. Technol. 2024, 10, 100162. [Google Scholar] [CrossRef]
  62. Ochieng, R.; Cerón, A.L.; Konist, A.; Sarker, S. A combined analysis of the drying and decomposition kinetics of wood pyrolysis using non-isothermal thermogravimetric methods. Energy Convers. Manag. X 2023, 20, 100424. [Google Scholar] [CrossRef]
  63. Maaten, B.; Loo, L.; Konist, A.; Nešumajev, D.; Pihu, T.; Külaots, I. Decomposition kinetics of American, Chinese and Estonian oil shales kerogen. Oil Shale 2016, 33, 167–183. [Google Scholar] [CrossRef]
  64. Gorensek, M.B.; Shukre, R.; Chen, C.C. Development of a Thermophysical Properties Model for Flowsheet Simulation of Biomass Pyrolysis Processes. ACS Sustain. Chem. Eng. 2019, 7, 9017–9027. [Google Scholar] [CrossRef]
  65. Debiagi, P.E.A.; Pecchi, C.; Gentile, G.; Frassoldati, A.; Cuoci, A.; Faravelli, T.; Ranzi, E. Extractives Extend the Applicability of Multistep Kinetic Scheme of Biomass Pyrolysis. Energy Fuels 2015, 29, 6544–6555. [Google Scholar] [CrossRef]
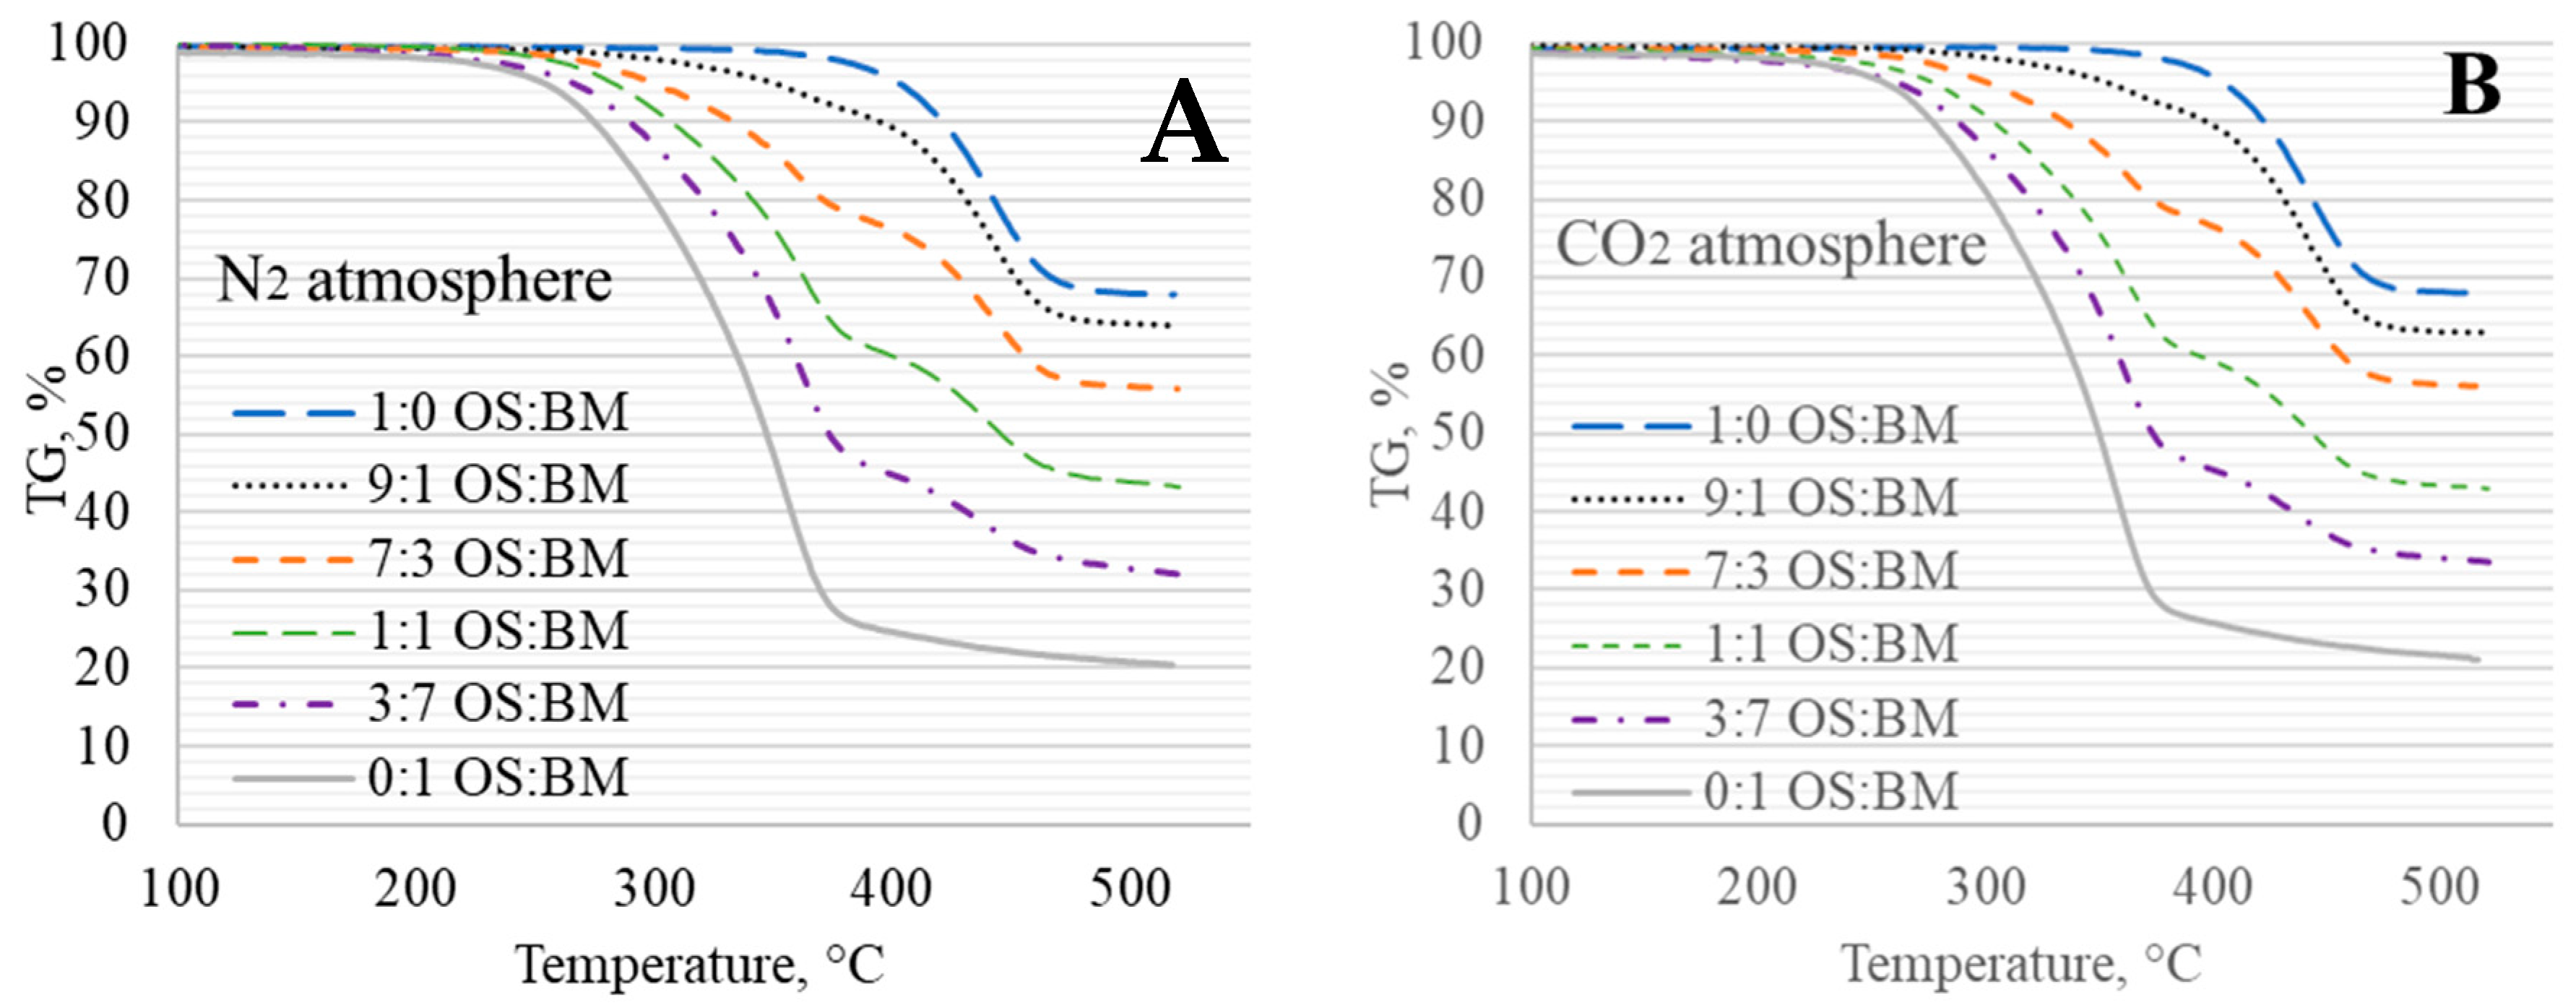
Figure 1. TGA curves of OS:BM co-pyrolysis in (A) N2 atmosphere and (B) CO2 atmosphere.
Energies 17 01055 g001
Figure 2. DTG curve of OS:BM co-pyrolysis in (A) N2 atmosphere and (B) CO2 atmosphere.
Energies 17 01055 g002
Figure 3. Final residual mass of OS:BM blends.
Energies 17 01055 g003
Figure 4. Comparison of theoretical and experimental TGA curves of OS:BM co-pyrolysis in (A) N2 atmosphere and (B) CO2 atmosphere.
Energies 17 01055 g004
Figure 5. Difference between experimental and theoretical (Exp-Theo) TGA curves of OS:BM co-pyrolysis in (A) N2 atmosphere and (B) CO2 atmosphere (right).
Energies 17 01055 g005
Figure 6. Friedman apparent activation energies of (A) OS and (B) BM at different conversion stages.
Energies 17 01055 g006
Figure 7. Friedman apparent activation energies of OS:BM blends at different conversion stages.
Energies 17 01055 g007
Figure 8. Process schematic in Aspen Plus®.
Energies 17 01055 g008
Figure 9. TGA behaviour vs. mass loss curve modelled in Aspen Plus®.
Energies 17 01055 g009
Table 1. Elemental, proximate analysis, and calorific value for BM and OS.
CompositionWoody Biomass [26]Oil Shale
Norway SpruceGrey AlderScots PineSilver Birch
Elemental analysis [wt%]C50.349.950.149.327.2
H6.66.66.66.62.8
N0.10.20.20.1<0.1
Sn.d.n.d.n.d.n.d.2.0
O *42.743.043.144.015.4
Molar ratioH/C1.61.61.61.61.3
O/C0.60.60.60.70.4
Proximate analysis [wt%]Ash content0.30.30.30.352.4
Moisture **6.97.68.57.70.9
Fixed carbon14.214.014.512.81.5
Volatile matter85.585.785.286.946.1
Calorific value [MJ/kg]LHV18.618.518.418.08.7
HHV20.019.919.818.19.7
* Calculated, n.d.—not detected. ** Moisture content for room dry sample.
Table 2. Experimental (exp.) and theoretical (th.) mass losses of BM and OS blends at 10, 20, and 30 °C/min.
Heating Rate, °C/min
102030
Blend OS:BMMass Loss, wt%Mass Loss, wt%Mass Loss, wt%
exp.th.exp.th.exp.th.
0:178.8-79.7-80.9-
3:766.764.865.466.062.366.9
1:157.155.558.756.954.957.1
7:343.946.248.247.846.947.3
9:136.236.939.338.737.737.5
1:032.3-34.1-32.6-
Table 3. Activation energies of co-pyrolysis of BM and OS obtained through the Coats–Redfern method.
OS:BME, kJ/molRSD, %R2n
0:196.731.820.99261.7–1.8
3:785.331.260.99451.6-1.7
1:177.441.470.99011.4–1.5
7:369.900.480.98781.0–1.2
9:166.132.500.98540.3–1.0
1:058.897.800.93880.1
Table 4. Activation energies of co-pyrolysis of BM and OS.
OS:BMCoats–RedfernKissingerFriedmanVyazovkin
E, kJ/molR2E, kJ/molR2E, kJ/molR2A, min−1E, kJ/mol
0:196.70.9926147.40.984139.30.991012.95 × 109140.430.0138
3:785.30.9945179.40.997154.70.975575.95 × 109156.830.2506
1:177.40.9901152.90.997164.30.977865.25 × 1011163.130.1756
7:369.90.9878145.90.947197.30.897047.39 × 1011193.030.9744
9:166.10.9854172.90.988153.60.809342.94 × 108153.421.1926
1:058.90.9388160.20.979167.40.950072.34 × 109171.530.1077
Table 5. Activation energies of co-pyrolysis of BM and OS at different stages of conversion.
Blend OS:BMFeedstockConversion, αFriedman
Ea [kJ/mol]
3:7BM0.05–0.8146.6
OS0.8–0.95192.6
1:1BM0.05–0.7150.1
OS0.7–0.95198.1
7:3BM0.05–0.45200.9
OS0.45–0.95194.1
9:1BM0.05–0.25114.0
OS0.8–0.95170.1
Table 6. Kinetic parameters of BM and OS used in Aspen Plus® model.
Biomass A (s−1)E (kJ/mol)
Hemicellulose2.41 × 108141
Cellulose2.42 × 109147
Lignin3.90 × 108157
Oil shale-2.03 × 109161
Disclaimer/Publisher’s Note: The statements, opinions and data contained in all publications are solely those of the individual author(s) and contributor(s) and not of MDPI and/or the editor(s). MDPI and/or the editor(s) disclaim responsibility for any injury to people or property resulting from any ideas, methods, instructions or products referred to in the content.