Article

Achieving Techno-Economic Feasibility for Hybrid Renewable Energy Systems through the Production of Energy and Alternative Fuels

by
Ekua Afrakoma Armoo
1,2,*,
Mutala Mohammed
2,
Satyanarayana Narra
1,
Essossinam Beguedou
1,
Francis Boateng Agyenim
2 and
Francis Kemausuor
3
1
Department of Waste and Resource Management, University of Rostock, 18059 Rostock, Germany
2
Council for Scientific and Industrial Research—Institute of Industrial Research, Accra P.O. Box LG 576, Ghana
3
Department of Agricultural and Biosystems Engineering, Kwame Nkrumah University of Science and Technology (KNUST), PMB, Kumasi AK-039-5028, Ghana
*
Author to whom correspondence should be addressed.
Energies 2024, 17(3), 735; https://doi.org/10.3390/en17030735
Submission received: 25 December 2023 / Revised: 29 January 2024 / Accepted: 1 February 2024 / Published: 4 February 2024
(This article belongs to the Section B: Energy and Environment)

Abstract

:
In developing countries like Ghana, the conversion of waste into energy is gaining greater interest among policy makers and researchers. The present study investigates the feasibility of producing electricity and/or fuels from a hybrid waste-to-energy pilot plant located in the Ashanti Region of Ghana. The plant integrates three technologies: anaerobic digestion, pyrolysis and solar PV. The plant has the potential to produce both energy and fuels such as green hydrogen, refuse derived fuels, bio-compressed natural gas and compost. Thus, this study compares the financial feasibility of three scenarios—generating electricity and fuels, generating electricity alone and generating fuels alone—by modelling their energy output and financial performance using RETSCREEN expert 6.0.7.55 and Microsoft Excel 2019 softwares. The results indicate that the multiple products of electricity and fuels provide higher investment interest with a Net Present Value in excess of EUR 13 million and a payback period of 12 years compared to the electricity-only model. Also, converting electricity into fuels alone also provides substantial benefits which can be explored. However, the Levelized Cost of Energy, ranging from 0.3 to 0.68 EUR/kWh, is far above the average residential End User tariff. Overall, this study provides an important methodology for assessing the potential products of future projects.

1. Introduction

As Africa pivots towards agenda 2063, the IEA estimates that Africa will lead the next phase of global energy demand due to its increasing population, urbanization and industrialisation. More importantly, Africa has in stock a vast expanse of vital natural resources including solar power and natural gas, as well as minerals such as uranium, chromium, cobalt, copper, manganese and platinum, which are very crucial for the global drive of renewables. Renewables, as well as natural gas, are ear-marked to transition the continent from a biomass-based energy economy to a more sustainable and reliable energy consumption [1]. Renewable energy (RE) has recently become very attractive, with competitive prices and more accessible technologies. In 2022, the weighted average Levelized Cost of Energy (LCOE) for solar PV became 29% lower than the cheapest fossil fuel, compared to it being 710% higher in 2010 [2].
Municipal solid waste (MSW) is an important resource for producing RE, although it has become one of the banes of most developing economies due to poor management [3]. One of the most popular strategies to effectively manage MSW is to convert the waste to energy known as waste to energy (WTE) or Energy from Waste (EfW) strategies [4]. WTE recovers the energy from waste and converts it into value-added bio-products. The energy is considered a form of renewable energy and thus has a positive environmental impact compared to fossil fuels, and also creates a bioeconomy for economic gains [5]. WTE technologies are available depending on the type, quantity and characteristics of the feedstock, the required energy method, economic conditions, environmental standards and specific factors [6]. The most commonly used WTE technologies are thermal, biochemical and chemical technologies, although thermal technologies such as incineration, gasification, pyrolysis and landfill gas recovery are more dominant [7]. Hybrid RE systems (HRES) integrate two or more technologies. These systems combine complimentary benefits from each technology and, in some cases, reduce the risk of dependence on only one source of raw material or resource [8,9]. Some configurations are solar and anaerobic digestion (AD) [10,11,12]; AD and gasification [13]; AD, aerobic composting, gasification and incineration [14]; AD and solar thermal systems [15], pyrolysis and AD [16]; Concentrating Solar Power and AD [17]; and solar PV and hydrogen [18].
The business model for most 100% renewable energy projects depends on the revenues from the sale of electricity [19]. Studies from the Finnish biogas branch indicate that non-energy products such as recycling nutrients (manure), gate fees and transportation fuels are key to ensuring an attractive return on investment from biogas plants [20]. Additional bio-products can be potentially produced from WTE plants with major applications for domestic, industrial and transportation uses [21]. These include bio-Liquified Petroleum Gas (bio-LPG) [22], biomethane [23], bio-compressed natural gas (bio-CNG) [24], Refuse-Derived Fuel (RDF) [25], hydrogen [26], carbon credits [27] and recycling nutrients (compost) [28].
In the EU, alternative fuels such as the RDF derived from waste and biomass contribute, on average, over 40% of the thermal energy used by cement industries. Germany and the Czech Republic substitute over 60% of conventional fuels in cement plants with waste with a potential to increase that to 80% by 2027 [29]. The Netherlands substitutes as high as 83% [30]. In Togo, alternative fuels such as RDF have the potential to significantly reduce the energy consumption of cement plants by 15 EUR/ton and improve their sustainability through reduced emissions [31]. In producing and substituting RDF, the main beneficial component is the fuel savings from production costs and emission reductions [32]. Although the main driver is the direct economic benefits, other important impacts include the reduction in greenhouse gas (GHG) emission, reduction in exploitation of virgin materials and sustainable waste management [29]. Also, for any RDF plant to be economically feasible, the revenue model must include gate fees, product sales (RDF, recyclables and compost) and additional financing support through the Capital Investment (CAPEX) from the municipality. The study further concluded that an appropriate MSW management system will depend on factors such as land availability, a local or foreign market for the recyclables and the energy product, as well as local social, economic and environmental issues [33].
Hydrogen (H2) has also become very relevant within the global energy market. It is not a fuel in itself but an energy carrier. It has the potential to store energy in the form of molecules, which can be stored and transported more easily than other renewable energy sources such as solar and wind. Many countries have developed roadmaps to create a H2 economy [34]. It also has major applications in the energy, transport and chemical manufacturing sectors [35]. H2 is commonly identified by three major colours, based on the life cycle GHG emissions of the input energy. The colour coding specifically refers to the following input energy sources: grey (fossil fuels), blue (fossil fuels with carbon capture) and green (renewable energy). Colours such as brown (coal), yellow (solar-powered electrolysis) and purple (the nuclear-powered electrolysis of thermolysis) have also been used [36]. Biogas is an important renewable source for the production of green H2 [37,38]. Steam methane reformation (SMR) is one of the most common and advanced technologies for the production of H2 [39,40]. In a recent study by Tamilselvan and Selwynraj [41], SMR gave a high yield of 10.15 kg/h using methane with a 99% purity when compared with other methods. In the context of West Africa, H2 production from biogas produced from food waste has been proven to be feasible for both Ghana and Nigeria [42,43].
Digestate is an important byproduct of the AD process [44]. It is also an important fuel for plant growth as it provides energy for various metabolic activities, encouraging plant growth. It creates a circular economy when it is further processed into organic compost products, and it has been incorporated into many WTE plants [45]. Some studies consider compost a recyclable product, which is not its conventional categorization, but, in technical terms, the nutrients being returned to the soil constitute recyclable material [46]. Globally, the renewable energy sector is affected by factors such as interest rate fluctuations, uncompetitive tariff regimes, the high cost of capital, fragile economic growth patterns and inadequate interest and government funding into research and development. The factors affecting its feasibility are context-specific and include the seasonal availability of feedstock, governmental subsidies, the price of products, etc. [47]. An evaluation of five case studies in South Africa revealed that flexibility in terms of multiple revenue sources/products and feedstock types increases the financial feasibility of a biogas project [48]. Subsidies support the feasibility of WTE systems since the revenues to be obtained from RDF and electricity sales do not directly cover both CAPEX and operation costs (OPEX) [6]. Additional products such as carbon credits may be important to achieve this. In a recent study, Njoku et al. [49] modelled a landfill-gas-to-energy project in South Africa and concluded that although the project had the potential to produce 6.6 GWh of electricity to 2952 households, the plant was not economically feasible and feasibility could only be attained through the sale of Certified Emission Reductions (CERs) which could bring in revenues of over USD 15,000,000 as of 2020. Like conventional power plants, the investment cost for WTE power mainly consists of engineering, construction and equipment, as well as infrastructure costs (e.g., the fuel supply system and grid connection) [49].
In Africa, the development of such renewable technologies and systems is rather slow. For instance, RDF has been researched since the 1970s, with countries such as the US, China, Germany and India leading in research outputs. Sub-Saharan Africa, on the other hand, is one of the least researched regions and requires improved efforts [50]. Countries such as Ghana have made significant strides in energy access but with low advancement in RE.

The Local Context—The Energy Sector and Hybrid Renewable Energy Systems

Ghana is the second most electrified country in sub-Saharan Africa (84%), with a total reliable power capacity of 4738.6 MW. However, the generation mix is dominated by fossil fuels (68.8%). Other sources are hydropower (29.1%) and renewable energy sources, including solar, wind and biomass (2.1%) [51]. An overdependence on fossil-fuel-based energy is subject to high insecurities in terms of supply and price fluctuations in the global market, resulting in large system disturbances [52].
Governmental interest in renewables is increasing, with several large-scale renewable energy projects having been launched in recent years. This includes the 50 MWp Bui Solar Power Plant, the Volta River Authority and 13 MW Kaleo solar project [53]. Renewables are also gaining increasing attention among researchers. Notably, a study on the feasibility of a hybrid solar PV and gasification system used the Oti landfill as case study. In this study, three distinct scenarios were considered: (i) a standalone WTE plant, (ii) a standalone solar photovoltaic (PV) plant and (iii) a hybrid combination of the two. Remarkably, all renewable energy plant scenarios demonstrated investment potential. The solar PV plant emerged as the most financially attractive option, with a Net Present Value (NPV) of GHC 324.79 million, a payback period (DPP) of 4 years, an Internal Rate of Return (IRR) of 44%, and a Debt Payback Index (DPI) of 2.7 [54]. In a separate investigation, the techno-economic feasibility of employing hybrid solar–wind–diesel–battery systems for electricity generation in remote areas of southern Ghana was explored [55,56]. The findings underscored the critical role of the government and policymakers in ensuring the affordability of electricity for both households and commercial consumers. A sensitivity analysis revealed that factors such as the cost of fuel significantly impact the LCOE for Wind–DG–Battery systems. In the Ghanaian context, fuel costs are influenced by variables like exchange rates, crude oil prices and inflation. Variables like inflation, discount rates and interest rates can be regulated through precise governmental economic policies. In a cooperative approach, studies have argued that there is the critical need for creating the necessary economic environment that encourages sustained investment in the renewable energy landscape. These studies demonstrate that hybrid renewable energy systems are a promising solution for Ghana’s energy needs. A study was conducted to develop a reliable and cost-competitive autonomous energy supply system with renewable energy resources. As a reference site, a university campus in northern Ghana was chosen. The optimal configuration consisted of 92 PV panels, 9 wind turbines, 32 batteries and 1 diesel generator. The proposed method was applied to a cluster of villages in Bonsaaso, located in the Amansie West District of the Ashanti Region of Ghana [57].
Across Africa, many WTE plants are springing up which have the potential to sustainably manage municipal waste. For instance, the new Reppie WTE plant in Ethiopia processes 1400 tonnes of MSW per day into electricity to cover 30% of the city’s energy needs [58]. Also, Safisana in Ghana has a capacity of 100 kW from hybrid solar–biogas and provides grid-connected electricity and compost [11]. With funding support from the German government, a 400 kW pilot WTE plant is under construction in Ghana, which will treat 50 tonnes/day of mixed MSW through a hybrid solar PV–biogas–pyrolysis plant to produce electricity, compost and other recovered materials [59]. This is the first of its kind in Ghana and is expected to contribute to the country’s renewable energy resources [60]. This is a major step in the development of WTE plants in Ghana because WTE research has mainly been based on theoretical feasibility assessments without the physical pilot plants for case study investigations [12,61]. The establishment of a pilot plant is relevant for the whole of sub-Saharan Africa because it provides a basis for the assessment of the feasibility of WTE plants in general. The hybrid model being implemented in Ghana is also relevant to recent advancements in hybrid WTE and the feasibility of alternative fuels and other products with economic value. With the current economic challenges in the country, feasibility studies provide preliminary information to attract potential investments.
The current study therefore aims to carry out an assessment of the financial feasibility of the new pilot plant in Ghana by comparing three scenarios with various technical combinations of electricity and fuel products. This will form the basis for decision making for the replication of the pilot model in other parts of the country, as well as the continent.
The scenarios were selected based on the following reasons:
  • Hybrid renewable energy plants have conventionally focused on electricity as the main product and, in most cases, the only product. For instance, in a review of 100% RE systems it was revealed that 97% of all RE energy research focused on electricity [19]. Ghana’s National Energy Statistics 2022 reveal that biomass contributes 34%, petroleum 50% and electricity 17% to energy consumption. Thus, fuels remain an important source of energy, especially for residential 39%, transport (38%) and industrial consumption (16%) [62].
  • Ghana, through the Energy Sector Recovery Programme (ESRP), placed a moratorium on the signing of new power purchasing agreements due to overcapacity in its energy system [52]. This is an indication that electricity may not be the only universally desired product from WTE projects. Such plants may sometimes require the energy to be converted to fuels to create value for the market.
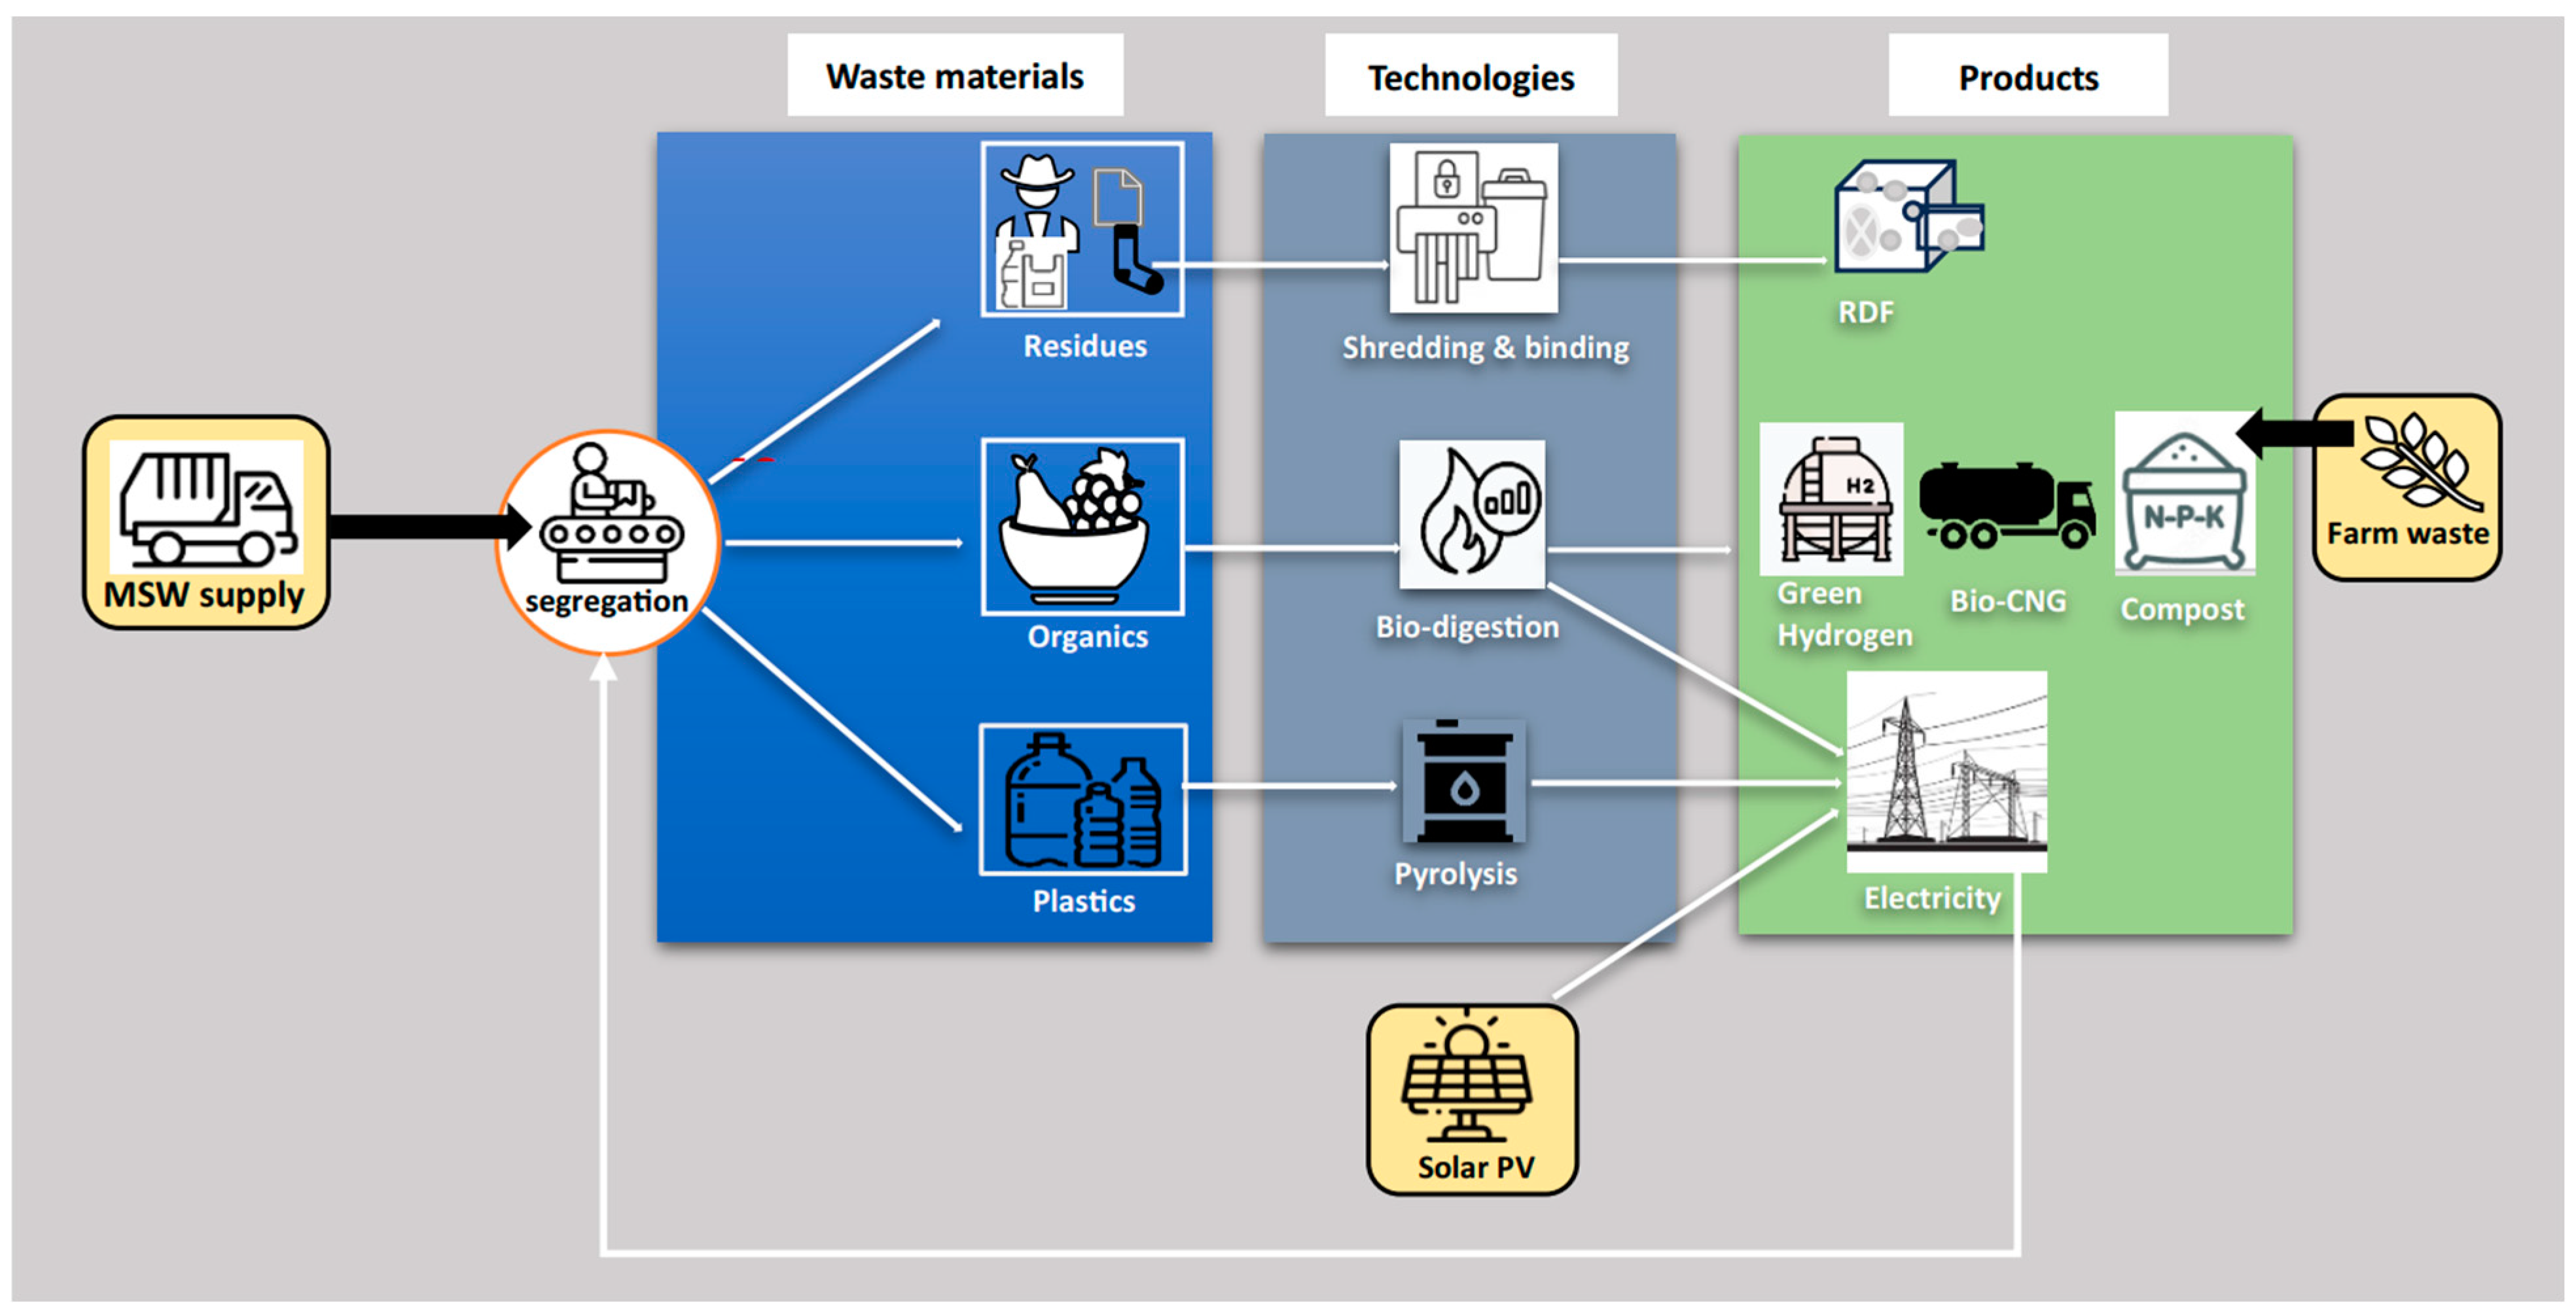
  • Waste segregation in Ghana is estimated to be at only 2%. Thus, previous projects, such as Safisana, have invested additional resources into public education and other social research activities to receive highly segregated organic waste for AD systems. However, this does not provide a holistic solution to the remaining fraction of the waste. Also, the Integrated Recycling and Compost Plant (IRECOP), Kumasi Compost and Recycling Plant (KCARP) and Accra Compost and Recycling Plant (ACARP) dispose of residual waste at landfills after organic waste and plastics have been recovered [63]. The case study plant being considered in this study has the capacity to use all waste fractions that are practically available to produce various products.
The outcome of this study thus becomes very relevant in selecting the best model that creates a balance between environmental gains for sustainable waste management and financial investments and returns.

2. Materials and Methods

This study used a combination of primary data from the plant under construction as well as secondary data from the literature mainly to estimate the expected operational performance conditions of the plant. The main reference point for this study are the following three scenarios and five products: electricity and fuels (bio-CNG, green H2, RDF and compost). RETSCREEN EXPERT software version 6.0.7.55 was used to model the energy (electricity) output from the plant. Once this was established, the financial analysis was carried out entirely in Microsoft Excel 2019 software by creating a financial model. The Excel workbook that has been developed will become an important decision-making tool to support project developers in continuously analysing the feasibility of similar systems across the country or introducing new products into the case study plant. Similarly, authors such as those in [13] have carried out a techno-economic study of a hybrid AD and gasification system in South Africa using MS Excel.

2.1. Study Area

The pilot plant is located at Gyankobaa; a small rural community in the southern parts of the Atwima Nwabiagya Municipality of the Ashanti Region of Ghana. The municipality has 64 settlements covering a land area of 184 sq. km, with a 64.7% rural population. It is specifically located at longitude 6.6 and latitude −1.8. The municipality has an estimated population of 103,698, with an annual growth rate 2.6%. The main economic activities are farming and livestock rearing. The electricity coverage is about 70% with 31,109 people, mainly in 24 communities, without access to electricity. The plant is designed to receive 50 tons of MSW per day from the Atwima Nwabiagya Municipality as well as from adjoining districts within a radius of 30 km from the plant location, such as Amansie West, Atwima Mponua, Atwima Kwanwoma, Asokwa, Kwadaso, Suame and Ahafo Ano South [64].

2.2. Technical Description of the Pilot Plant

The plant site receives 50 tons/day of mixed MSW. Onsite segregation is carried out to produce each product as detailed in the following sections.
MSW in Ghana typically includes waste from household and commercial activities such as market centres, restaurants and offices, but not medical, agricultural or industrial activities [65]. The MSW collection trucks arriving at the plant deliver waste into a bunker, after which the waste is transferred into a semi-automatic segregation system. The segregation carried out is similar to that of other waste management plants in the country, such as IRECOP, ACARP and KCARP. Waste is separated into three pathways: organics, plastics and residuals, as demonstrated in Figure 1. Other components such as scrap metals, e-waste and glass are stored and transferred to recycling facilities. Waste characteristics carried out in the study area indicates 48% organics, 20% plastics and 30% residuals [63]. This is comparable to that recorded by [66], which noted 43.1% organics and 17.8% plastics.

2.3. Description of Scenarios

The scenarios and fuels were selected based on the technical production capacity of the plant and the availability of local, regional or international markets for the products. In terms of electricity, an off-taker agreement/ Power Purchasing Agreement (PPA) could be secured with the public energy agency, the Electricity Company of Ghana, which has been mandated to enter into such agreements with power producers [67]. The fuels, on the other hand, will require bulk direct purchase agreements with potential buyers/off-takers.
Below is a description of the scenarios considered, with the framework represented in Figure 2:
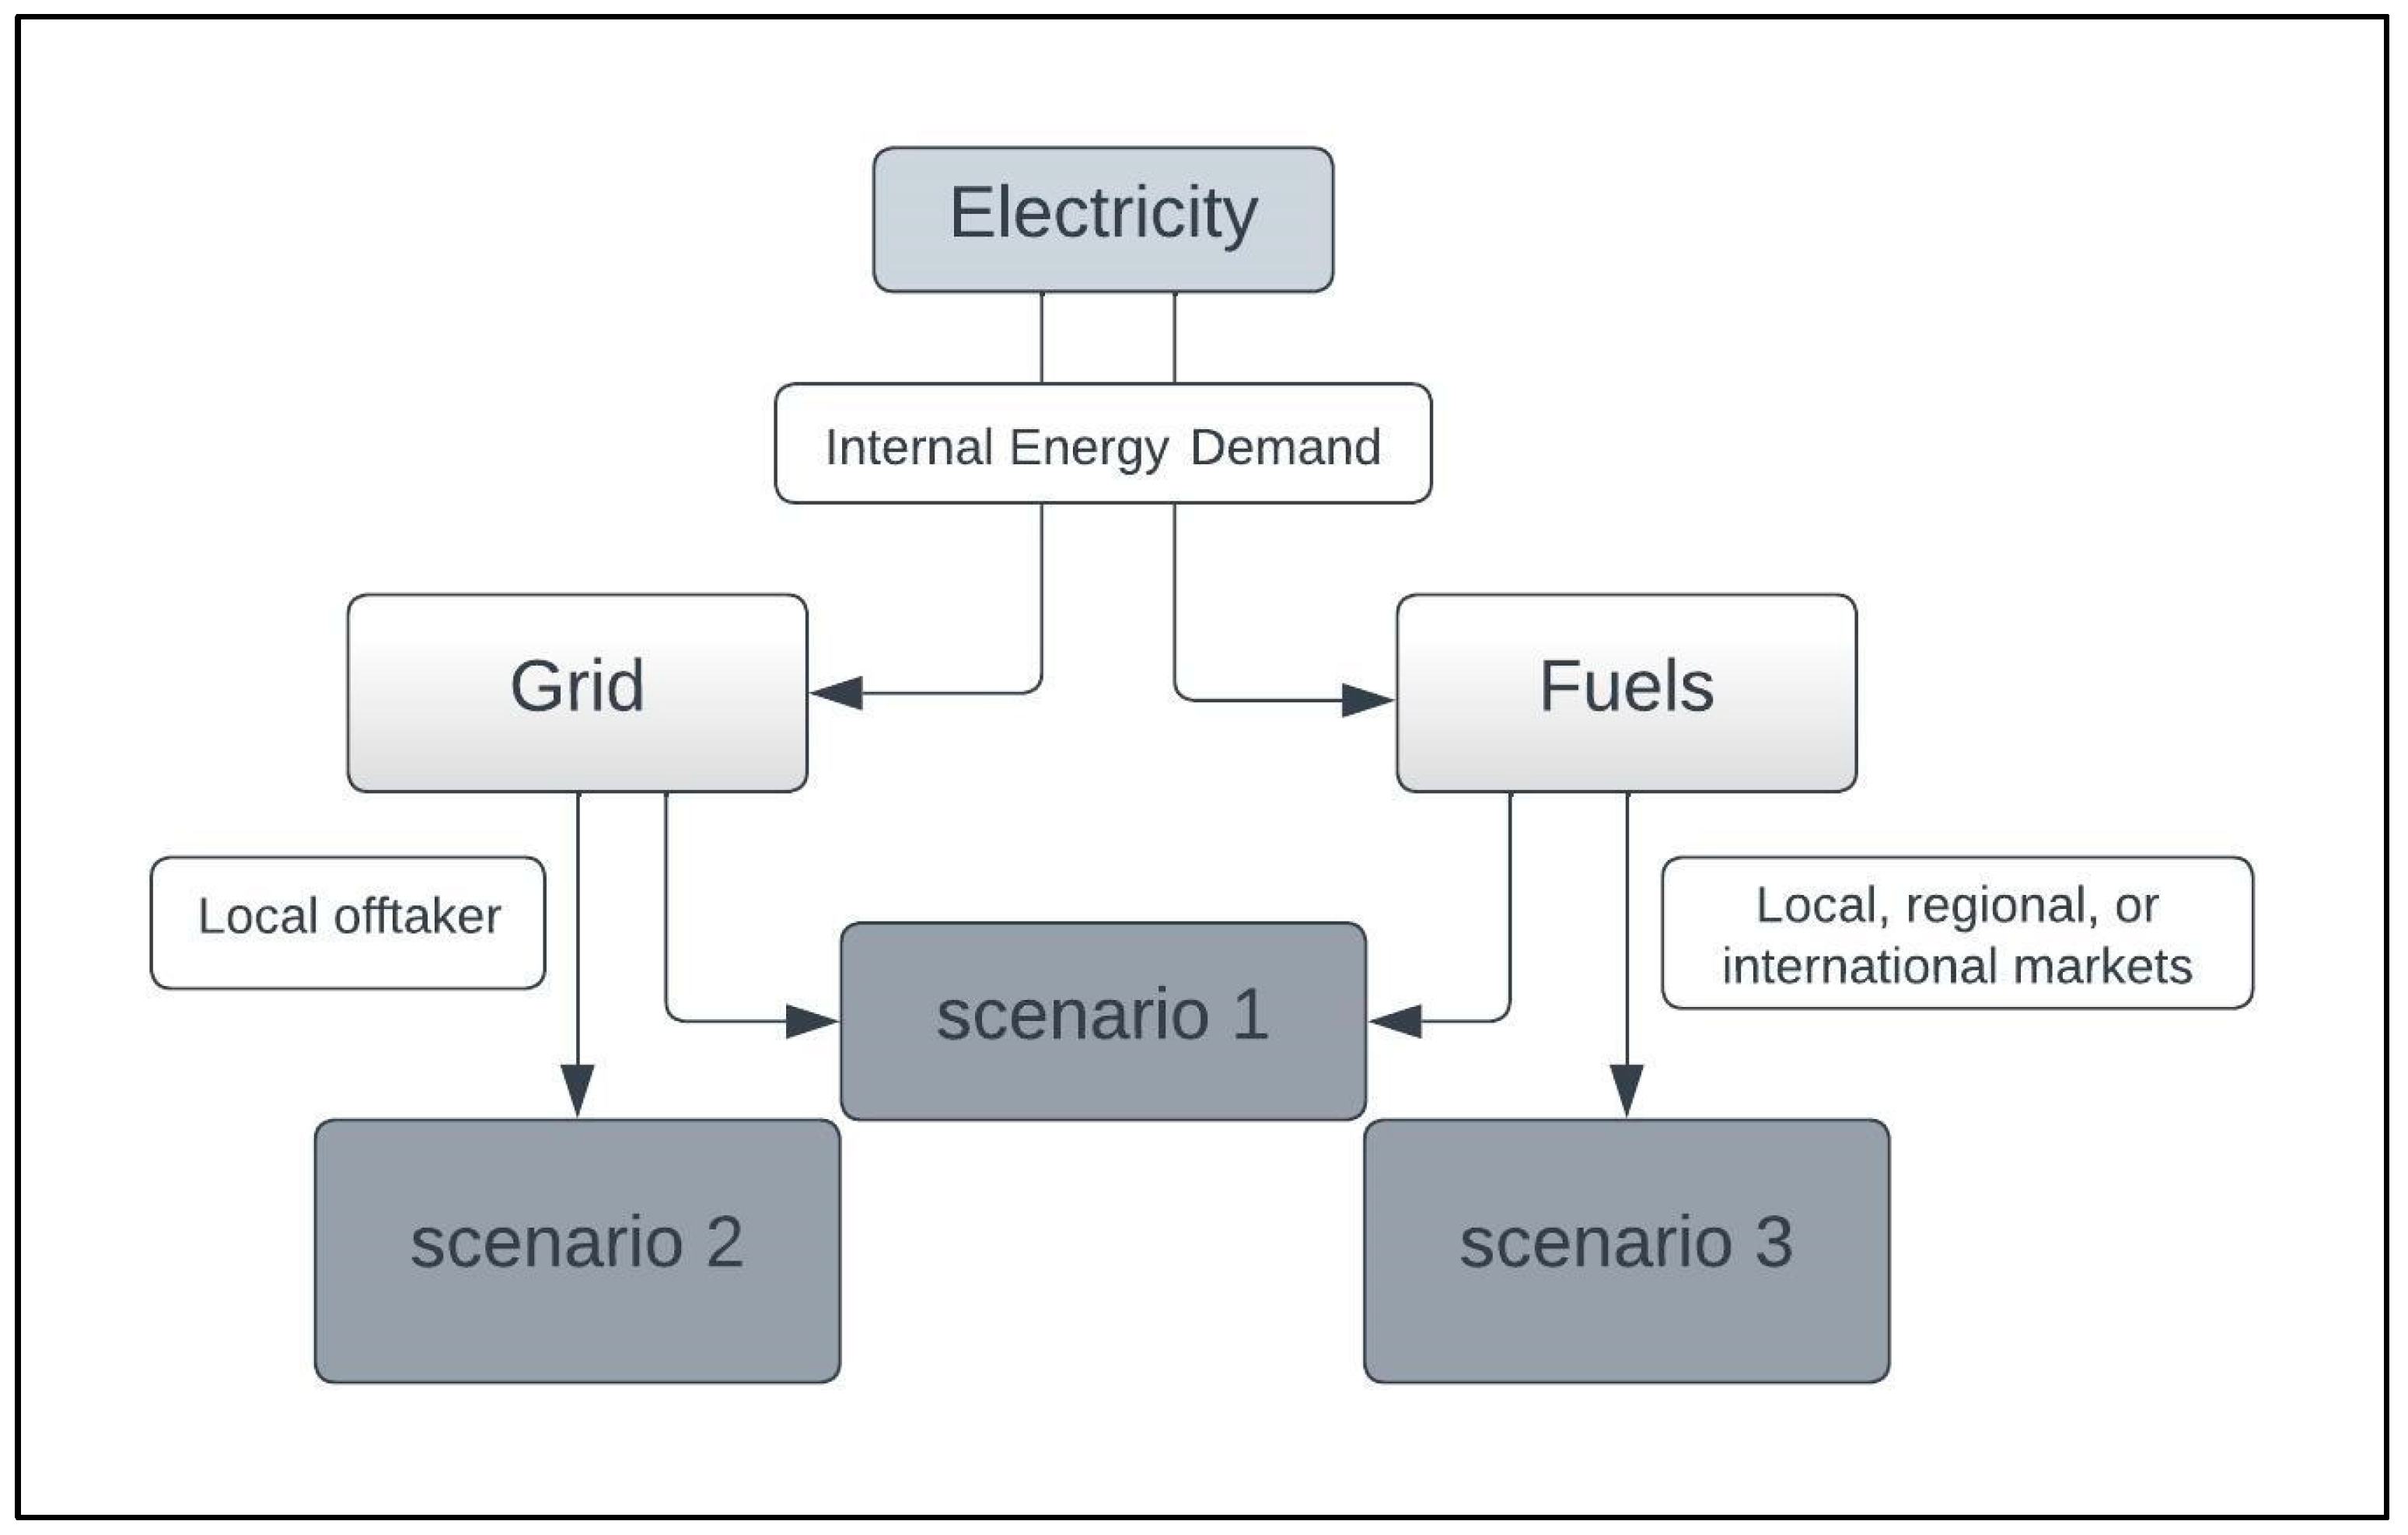
  • Scenario 1 (Electricity and Fuel)—this provides an integrated option for the plant, with both a PPA for electricity exported to the grid and other fuels. This is the base case scenario, because the pilot plant has been constructed to test various options to provide key locally applicable data for academic research activities and technological advancement. In the very uncertain and relatively young market for fuels such as green H2, a secure source of revenue from a PPA provides greater security for an investor while also providing an opportunity for them to invest in cleaner fuels for industrial activities. It also presents a higher investment cost and internal energy demand due to it needing more equipment.
  • Scenario 2 (Electricity only)—this considers electricity as the only product from the plant. It is assumed that a long-term power purchasing agreement (20 years) is secured, in which the off-taker takes on all the energy produced for grid supply. In this scenario, all the methane produced from an AD system is converted to electricity and the digestate is given at no cost to local farmers. No additional activities are required, thus generating the smallest investment and operational cost scenario.
  • Scenario 2 (Fuels only)—this considers producing four types of fuels for local and international markets: bio-CNG, RDF, green H2 and compost. The pilot plant will be committed to meeting the specifications of the buyers as much as financially feasible. Although this provides greater flexibility in terms of a wider spread of markets, including local and international consumers, the risk is higher with greater competition from other suppliers. However, long-term purchase agreements may be secured with buyers to reduce such risks and provide substantial price competitiveness. This model will require more investment in market research and business case development to reduce the risk. The compost product, for instance, will face significant competition from other local waste processing facilities such as KCARP in Kumasi and IRECOP, Jekora Ventures Limited (JVL) and Safisana in Accra [63].

2.4. Computation of Energy Output

Electricity from a plant is produced in all three energy systems, AD, pyrolysis and solar PV, after which a proportion is exported to the grid. The energy exported to grid is calculated as the net from the gross energy produced minus the internal consumption. The internal energy demand for each scenario is calculated as
E g r i d = E T o t E I n t
E I n t = E h r × T
where ETot is the total electricity (energy) produced from the AD, solar PV and pyrolysis systems, Egrid = electricity exported to grid, EInt is the total energy demand, Ehr is the average daily energy consumption, and T is the total operation hours per annum.
RETSCREEN® expert software was used to estimate the total energy output from the system. RETSCREEN software provides a platform for assessing the technical and economic feasibility of renewable energy systems by providing a spreadsheet-based model. It provides a simple decision-making tool for policy makers, planners, project financiers and equipment vendors, thereby reducing project risk [68]. It has been used by several authors to estimate the energy output as well as carry out detailed feasibility analysis, including financial analysis [69,70,71]. Since the electricity is generated by three technologies, EToT was computed within the software by creating three separate tabs within the energy worksheet. Below are the details for each technology.

2.4.1. Solar PV System

In order to simulate the solar PV system, the exact specifications of the system installed on-site were used. The RETSCREEN software requires the climate specific data of the site for a minimum of one year. However, at the time the data were collected, the system was undergoing optimization tests, with the data collected spanning only 3 months. Thus, the inbuilt data from NASA for the specific site was adopted for the study, which calculated the daily solar radiation horizontal (kWh/m2/d). The detailed specifications of the system were then input into the energy worksheet. The solar PV system consists of panels, a battery, an inverter and cables. A Talesun TP6L72M mono-Si module with an efficiency of 20.1% has been roof-mounted at the site because it is more locally accessible and its technical specifications are adequate. One unique design is that the solar panels have been used as roofs for the open shed which houses the segregation and composting equipment. This significantly reduced the construction cost. Based on the solar irradiance data received for the selected location, the modules have been tilted at an angle of 5° for maximum energy output. A Sinexcel PWG2 inverter, with a capacity of 150 kW and a 95.5% efficiency, is attached. The miscellaneous losses from the module are assumed to be 10% due to the area being relatively rural and surrounded by thick forest and farmlands with low atmospheric dust. Irrespective of this, dust is expected to be slightly higher during the dry season months from November to March each year. The module lifespan is expected to be 20 years. In this study, the energy exported to the grid varies under scenarios 1 and 3 due to the internal energy consumption of the different equipment used.

2.4.2. Anaerobic Digestion (AD) System

For energy production from waste, the segregated organic waste is transferred to a 1000 m3 biodigester to produce biogas at a rate of 45 m3/h. The digestor is a continuous stirred reactor. Cow dung is added to the biodigester as it serves as an inoculum to introduce microorganisms for the biodigestion process. Thus, no additional microorganisms have been introduced into the system.
For scenario 3, the biogas is diverted to produce three products, but the quantity required to produce electricity is estimated first, after which the remaining biogas is diverted to produce green H2 and, subsequently, bio-CNG.
Biogas typically contains methane (CH4), carbon dioxide (CO2), hydrogen sulphide (H2S) and other trace elements. It must undergo cleaning to produce pure CH4. Once cleaning is complete, the biomethane may be divided into two portions: green H2 (and bio-CNG) and electricity, based on the scenario.
To produce electricity, purified CH4 is directed to a 100 kW Combined Heat and Power (CHP) engine with an efficiency of 35%. A CHP is very relevant for such systems because it provides additional heat energy, which is redirected to the digester to provide heat for the biodigestion process [72]. Planned and unscheduled repair and maintenance works are expected to occur, at most, 30 days per year.
The electrical energy output from the AD system is calculated as shown in Equation (3) [73]:
E A D = V CH 4 × L C V CH 4 × P × T × E f f
where EAD is the energy generated from the AD system per year (kWh/yr) and VCH4 is the volume of CH4 (m3) based on the volume of biogas allocated. This is calculated as the product of the quantity of biogas and the % CH4 content in biogas. LCV is the Lower Calorific Value of the CH4 (kWh/m3), which is 9.94 kWh/m3 under normal temperature and pressure conditions [74]. P is the power capacity of the CHP engine (kW). T is its operational hours per year (hrs/yr). Eff is the conversion efficiency of the CHP engine (%).

2.4.3. Pyrolysis System

The pyrolysis system typically produces bio-oil, syngas and tar [75]. For this study, segregated mixed plastic waste is transferred to the pyrolysis reactor at a rate of 1 ton per day to the undergo thermal decomposition. The use of a CHP engine in pyrolysis has been adopted by several authors and provides additional heat energy to aid the process [76]. The syngas is directed into a 50 kW CHP engine to produce electricity for the pyrolysis process, thus making the system self-sustaining. The bio-oil is directed into a 100 kW CHP engine to produce electricity for the grid. The energy generation from the pyrolysis system is calculated as
E p y r = P × T × E f f
where Epyr is the energy produced from the pyrolysis system (kWh), T is the total operation hours per year (h), and Eff is the efficiency of the CHP engine, which is 35%.

2.5. Output of Fuels

The fuels are obtained from three main sources—biogas, digestate and residual waste.

2.5.1. Green Hydrogen (H2)

Green H2 is produced from CH4 through steam methane reformation (SMR) under scenarios 1 and 3. SMR is the most commonly used technology for H2 production due to its cost effectiveness and the lower temperature and energy requirements of H2. It involves the conversion of hydrocarbons and steam to H2 and CO2, with the aid of a catalyst such as nickel. The most significant strength of SMR is its high conversion efficiency of 74–85% compared to other methods such as biomass pyrolysis (35–50%) and electrolysis (40–60%), while, on the other hand, it produces high amounts of CO2, which is a GHG with a large climate impact [77]. It has been proven that H2 production through SMR has a direct positive relationship with its reforming efficiencies, which are also dependent on the CH4 content of biogas [42]. H2 production is achieved via a reformer reactor and a shift reactor to fulfil the major reactions outlined in Table 1. Other reactions occur alongside these reactions and have been clearly outlined by [78]. The reactions are aided by a nickel catalyst with dry reforming and shift reactions occurring simultaneously. A boiler is used to produce steam, which is the main source of fuel for the reactor due to the energy contained in the water molecules. This is similar to the process used by [42].
Table 1. Reactions for steam methane reformation using biogas.
Description of Reaction Reaction [39,78,79]Equation (5)
Dry reforming of methane within the reformer reactor C H 4 + C O 2 2 C O + 2 H 2 (5a)
Water–gas shift reaction C O + H 2 O C O 2 + H 2 (5b)
Steam reforming of methane C H 4 + H 2 O C O + 3 H 2 (5c)
The quantity of H2 to be produced can be computed as the final reaction of Equation (5a–c), as represented by Equation (6) below [42]. The reactions also greatly depend on the reformer and boiler efficiencies, which are assumed to be 80% each [80].
Q H 2 = V CH 4 × ρ CH 4 × E f f b o i l e r × E f f r e f o r m e r × 0.5
where QH2 is the total H2 produced (kg); ρ CH4 is the density of the CH4 (kg/m3), which is considered to be 0.717 kg/m3; VCH4 is the volume of purified CH4 at 95% purity; and Eff(boiler) and Eff(reformer) are the efficiencies of the steam boiler and reactor for the dry and steam-reforming reactions. It is assumed that 1 m3 of steam-reformed CH4 is equivalent to (0.5 × ρ CH 4   )kg of H2 gas.
H2 is a free gas that must be stored appropriately before transportation to potential markets/off-takers. At the plant under study, storage will be accomplished through high-pressure compression into cylinders at 350 bar. The final volume of the compressed H2 (m3) is determined by the equation
Q H 2 c o m p r e s s e d = Q H 2 × E f f c o m p r e s s i o n
where E f f c o m p r e s s i o n is the compression efficiency, which is assumed to be 95% [18].

2.5.2. Bio-CNG

Green H2 is converted to compressed CH4 gas, which has similar properties to compressed natural gas (CNG). The Sabatier reaction explains the process as the reaction of H2 and CO2 to produce methane and water under elevated temperature and pressure conditions in the presence of a catalyst. A nickel catalyst is used in this study. The efficiency of the methanation reaction was taken as 70% [81]. The reaction is represented below [81,82]:
C O 2 + 4 H 2 C H 4 + 2 H 2 O

2.5.3. Compost

The focus of this study is to convert digestates into a commercially viable product for the local market. In scenario 2, the digestate, which will otherwise become a waste material, is converted into an important fuel for plant growth through the composting process. In the context of this study, the raw materials for the production of compost are digestate and farm waste from adjacent farms.
On site, a holding tank has been constructed to hold the fresh digestate during its release from the biodigester. It then undergoes mechanical separation to separate its solid and liquid portions. In total, 80% of the liquid digestate (LD) is directed back to the biodigester to provide additional moisture for the process, while the remainder is used for periodic watering of the compost piles in the compost shed. The windrow composting process is used because it requires little equipment, labour or energy, as described by [83]. The solid digestate (SD) is first transferred into the composting shed, where it is uniformly mixed with farm waste (FW) from the nearby farm in a ratio of 1:4 for SD and FW, respectively [84]. FW serves as a bulking agent, which is needed to enhance the physical and chemical properties of SD [28]. The mixture of FW and SD is thoroughly mixed manually and heaped into piles of about 1.5 m tall. It is watered with 0.5 L/kg of LD on the first day and subsequently at a rate of 1 L/kg every 7 days for 60 days. Since this is an aerobic process aided by microorganisms, frequent airing of the piles and daily temperature monitoring is carried out to avoid anaerobic conditions and promote homogeneity. After maturation, the compost is screened and bagged to make it ready for the market.
The quantity of compost produced can be theoretically derived using the equation
Q c o m p = ( Q S D + Q B u l k ) * % l o s s
where QSD is the quantity of SD, QBulk is the bulking agent and %loss is the loss of weight due to the composting process.
Also, a market study was carried out in November 2023 to assess the key characteristics of similar products on the Ghanaian market. Key organic fertiliser suppliers were contacted for similar products. Nine products were selected based on their raw materials (organic fraction of MSW or digestate) and the process used (aerobic decomposition/composting). One bag of each selected product was purchased from the open market. The following data were collected: the price, weight and the location of the manufacturer and raw materials.

2.5.4. Refuse-Derived Fuel (RDF)

RDF is produced from the residual fraction (RF) of the waste obtained after the segregation process, and it contains items such as plastics, leather, paper/cardboards, etc., which have no direct recycling facility in the country. Although the digester and pyrolysis system are available to process the plastics and organics, some plastic particles still find their way into the residual fraction. The RF undergoes shredding and binding to produce bales for their direct supplying to off-takers. Thus, the estimated quantity of RDF to be produced per annum is calculated as
Q R D F = Q R F × C F
where QRDF is the quantity of RDF (tons), QRF is the total percentage of the residual fraction (tons) and CF is the combustible fraction in %.

2.6. Financial Analysis

The following indicators were used to determine the financial feasibility of the three scenarios: Net Present Value (NPV), Internal Rate of Return (IRR), LCOE and simple payback period (PBP). The LCOE is applicable to scenarios 1 and 2, and the IRR and NPV to all scenarios. The results are compared to determine the most feasible option for investment decision making. All currency conversions from Ghana Cedis (GHC) to Euros (EUR) were sourced from the official currency conversion website of the European Commission. In some cases, the results were also compared to previous studies in USD, using the same source for conversion. As of November 2023, when this analysis was carried out, EUR 1.00 was equivalent to GHC 12.60 [85]. The general parameters and assumptions used in the financial analysis are outlined below:

2.6.1. General Assumptions

  • CAPEX—the capital cost of the all infrastructure and equipment, which is spread over a construction period of 3 years. For the purposes of this study, detailed investments such as land and road construction are considered as support from the government. The CAPEX considered here refers to equipment and installation costs.
    C A P E X = C A D , C p v , C p y r , C c o m p , C s e g , C l a b , C i n f r a s
    which represents the sum of the costs of AD, pyrolysis, composting, segregation, laboratories and other infrastructure, such as the bunker and shed. In the context of this study, the laboratory is assumed to be used only for research purposes for the facility and not income generating.
  • Capital Financing—this is determined by the following factors: the debt-to-equity ratio, cost of equity and cost of debt. The cost of debt also depends on the maturity and grace period of the loan and the interest rate. For this study, the interest rate used was 3.05 %/annum, the grace period = 0 and the debt-to-equity ratio was 70:30 [86].
  • OPEX—the pilot plant is currently undergoing operationalization tests and full-scale operation has not yet begun. Thus, although all the development-related costs are taken from the plant, its operational conditions are not yet verified or optimized. The OPEX is divided into the fixed and variable cost [87]. Human labour is needed to operate the segregation system and composting, while the energy systems remain largely independent, except for periodic and unscheduled maintenance that needs to be carried out. The OPEX was calculated as
    1 20 F C + V C
    where FC is the fixed cost, which incorporates costs from labour, interest on debt, insurance, equipment replacement costs and scheduled maintenance. VC is the variable cost, which incorporates internal energy consumption, tax, materials, unscheduled maintenance and miscellaneous costs.
  • Operation hours per annum (t)—the total operational hours per year is taken as 8040 hrs/yr.
  • Lifespan—20 years.
  • Annual inflation provides a good reflection of the rate of escalation of the prices of goods and services within the country. Thus, inflation provides a good basis for projecting the annual escalation of the selling prices of the products under study. It is taken as the average of the last 25 years, since the recent economic situation in the country presents a worse-case scenario with poor performance due to the impact of COVID-19. According to inflation data obtained from the World Bank, the average for the period is computed as 16.12% [88].
  • Cooperate Income tax (CIT)—according to the Ghana Revenue Authority, the CIT for waste management companies is 1% within the first 7 years and 25% from the 8th year onwards [89].
  • Discount rate—10%.
  • Revenues—the revenues were obtained through a calculation of the product of the quantity of products and their market price in Euros (EUR). For electricity, the price used is adopted from the tariff at which the ECG buys power from the Independent Power Producers (IPPs), known as the Bulk Generation Charge (BGC). As of May 2023, the tariff was 0.088 EUR/kWh [90].
  • Annual escalation rate of revenues—this was calculated based on the historic figures obtained for the escalation of tariffs for BGCs based on PURC tariffs since 2006. The average annual rate of increase was calculated as 25%.

2.6.2. Financial Feasibility Parameters

The LCOE calculates the total cost of producing one kilowatt hour (kWh) of electricity over a project’s lifespan and is computed as the ratio of the total lifecycle cost to the total lifecycle energy production. It is important for assessing the cost viability of various projects utilizing different supplies of electricity over a long period, such as in this study. It is calculated using Equation (13) below by creating a model in Microsoft Excel [12].
L C O E = t = 1 n C A P E X 0 + O P E X t ( 1 + r ) t t = 1 n E t ( 1 + r ) t
where C A P E X 0 is the total capital cost of the project disbursed during the construction period, O P E X t is the O&M cost over the project’s lifespan (EUR), E t is the total energy generated over the project’s lifespan (kWh/y), r is the discount rate (%) and t is the project’s lifespan (y).
The NPV is the difference between the current value of cash inflows and outflows. The NPV function within Microsoft Excel was used to automatically calculate the NPV using the CAPEX, discount rate and the net cashflows over the project’s lifespan.
The IRR is also computed in Microsoft Excel using the net cashflows over the project’s lifespan.

3. Results

A financial model was created for each scenario, in Microsoft Excel, on a separate spreadsheet. The pilot plant was established to provide adequate locally applicable data for the advancement of WTE systems across Africa. The following results are important in achieving this objective.

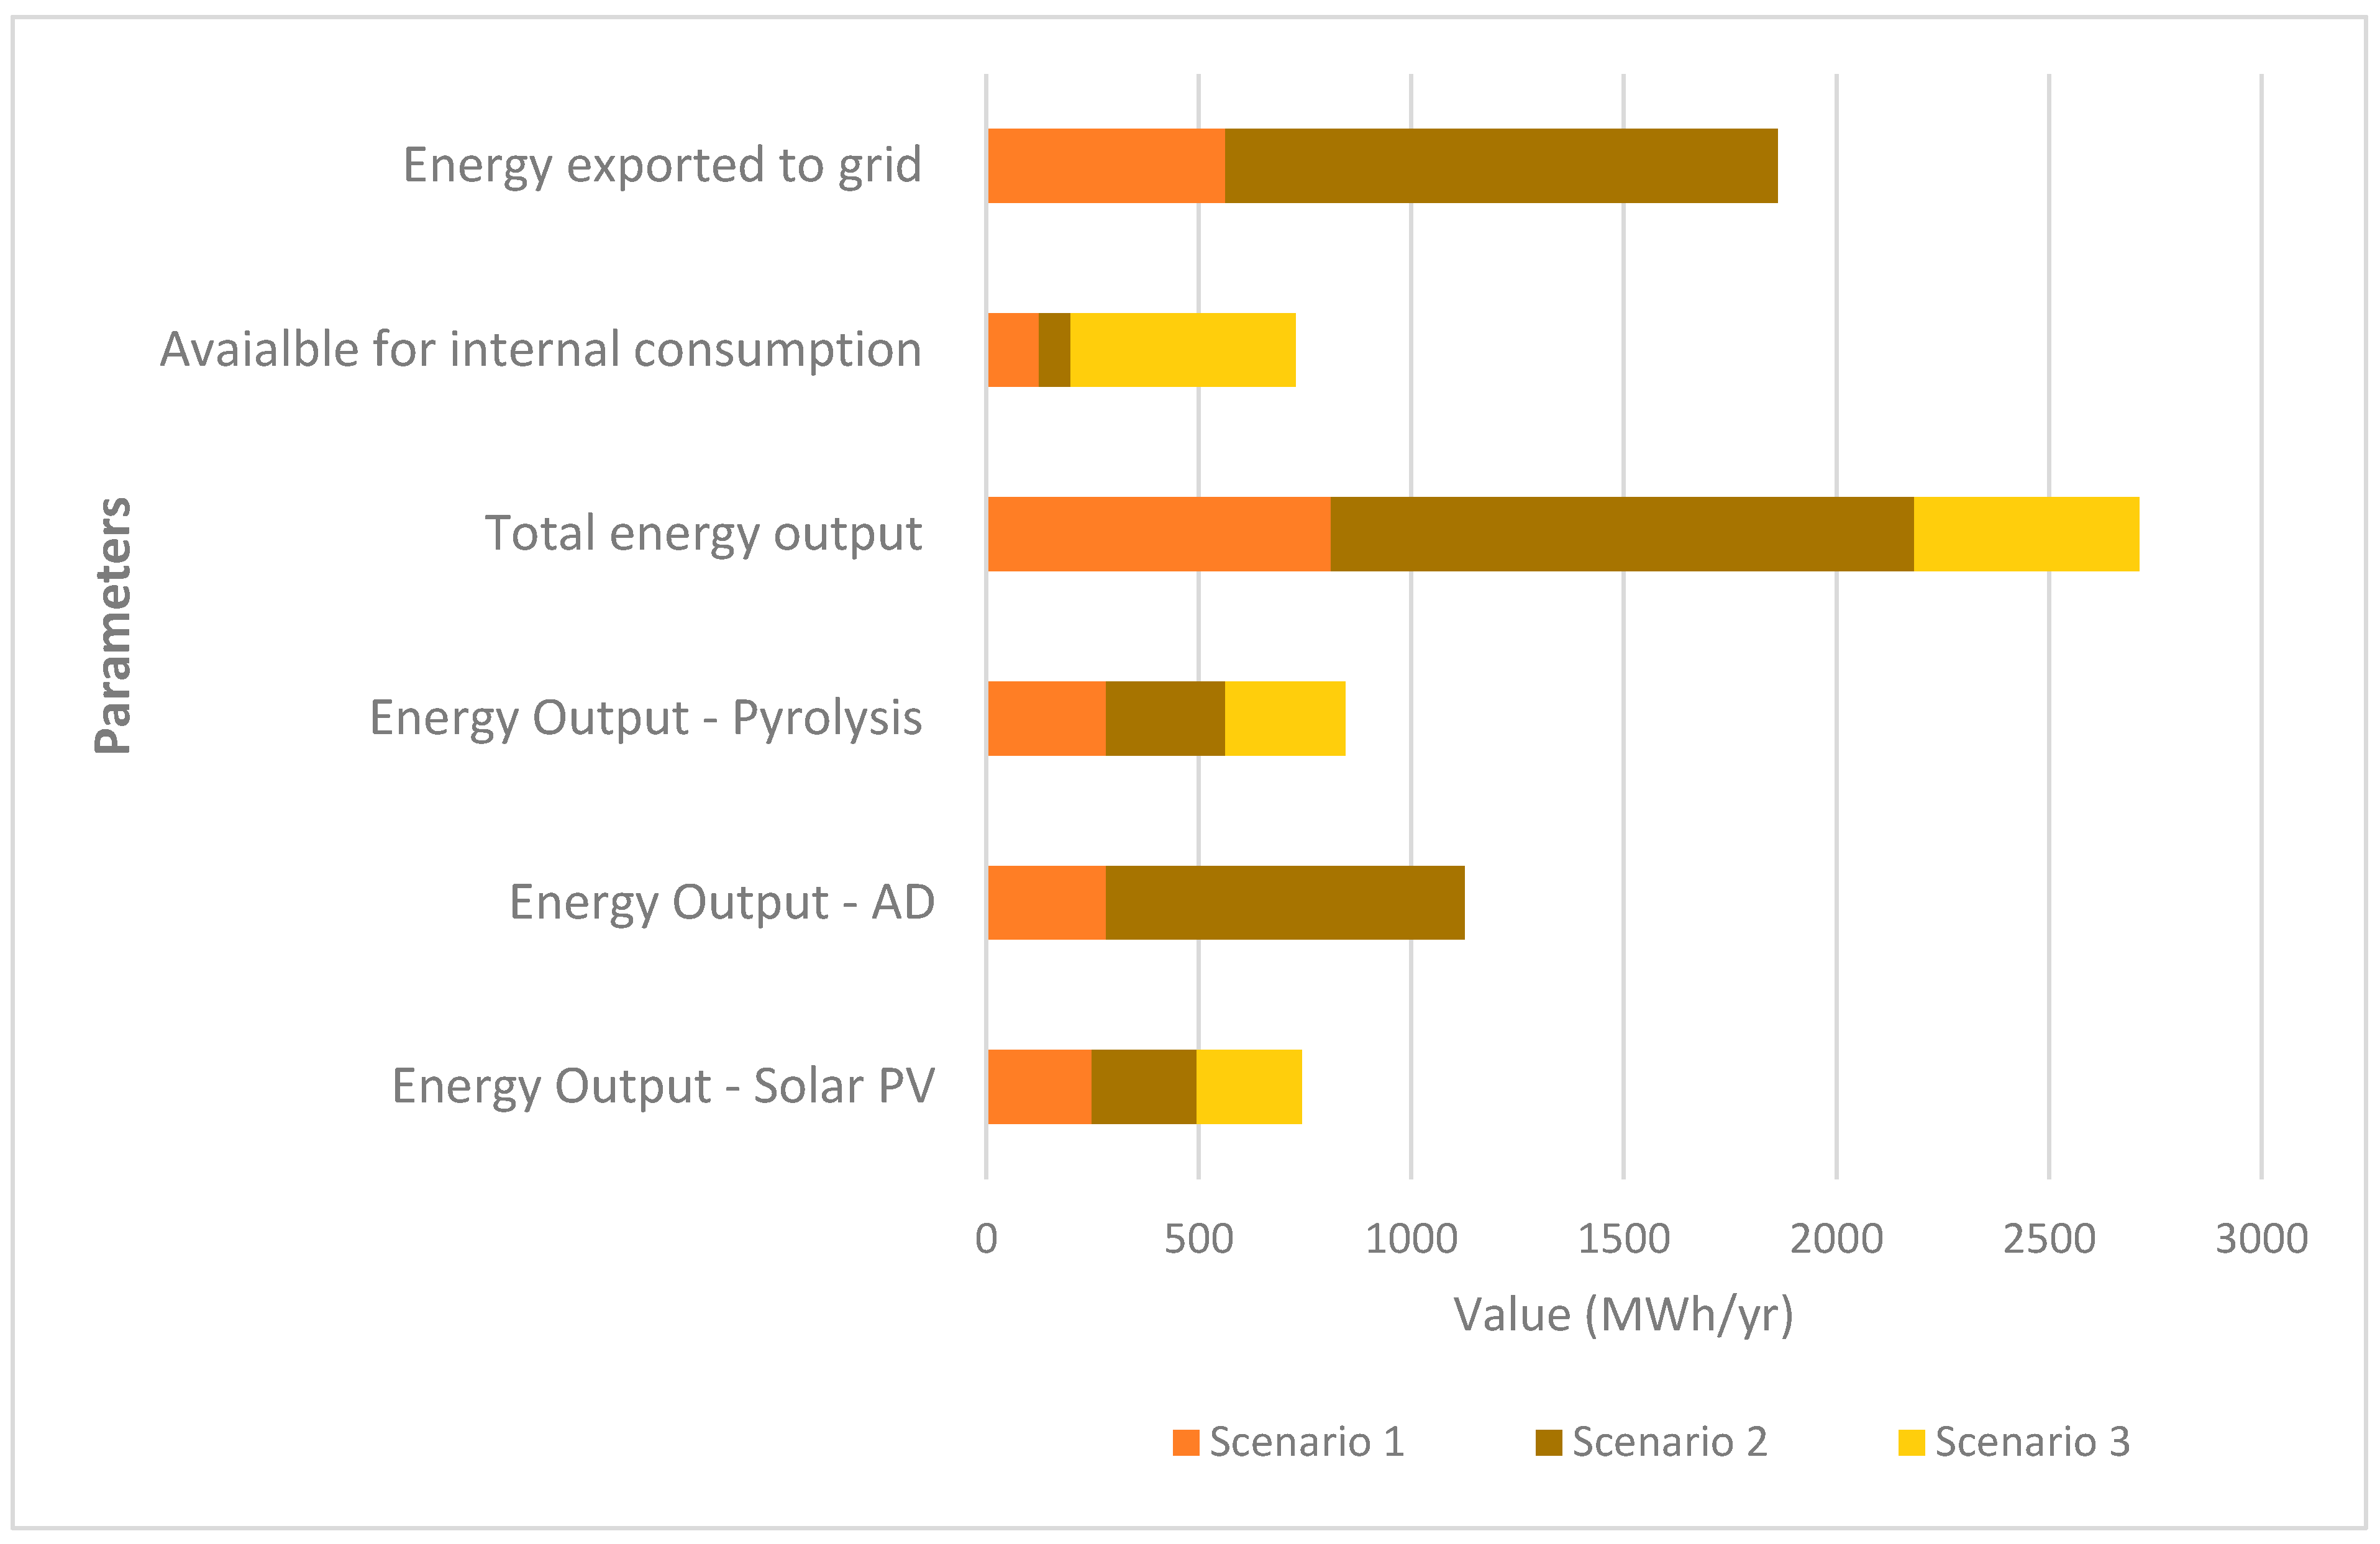
3.1. Technical Results for the Scenarios

The installed capacity of the solar PV and pyrolysis systems remains the same for all scenarios, while the AD capacity changes for each (Table 2). This is because the fuels (green H2 and bio-CNG) that are obtained from biogas in scenarios 1 and 3 account for the differences in the capacity of the AD system. Scenario 2 has the highest capacity and results in the lowest installed cost/kW.
Under Scenario 1, 50% of the output from the solar PV system is directed back to the plant for internal energy consumption. The energy outputs for each system and scenario are presented in Figure 3. For the base case (scenario 1), 810 MWh/yr of electricity is expected to be produced, with 562.72 MWh/yr exported to the grid. The difference represents the 50% of the output from the solar PV system redirected for internal use. Under scenario 2, 100% of the biogas produced is expected to be directed to the CHP engine to produce electrical energy. The AD system alone produces 844 MWh/yr of energy resulting in a total of 1373 MWh/yr from the whole plant which is expected to be exported to grid. From an installed capacity of 600 kW, the average installed cost is 2794 EUR/kW. This represents the lowest installation cost of the scenarios due to the need for a larger-capacity CHP plant with a relatively lower cost/kW, thus reducing the cost/installed capacity ratio. On the other hand, in Scenario 3, only fuels, 100% of the biogas produced is used for fuels (green H2 and subsequently bio-CNG).

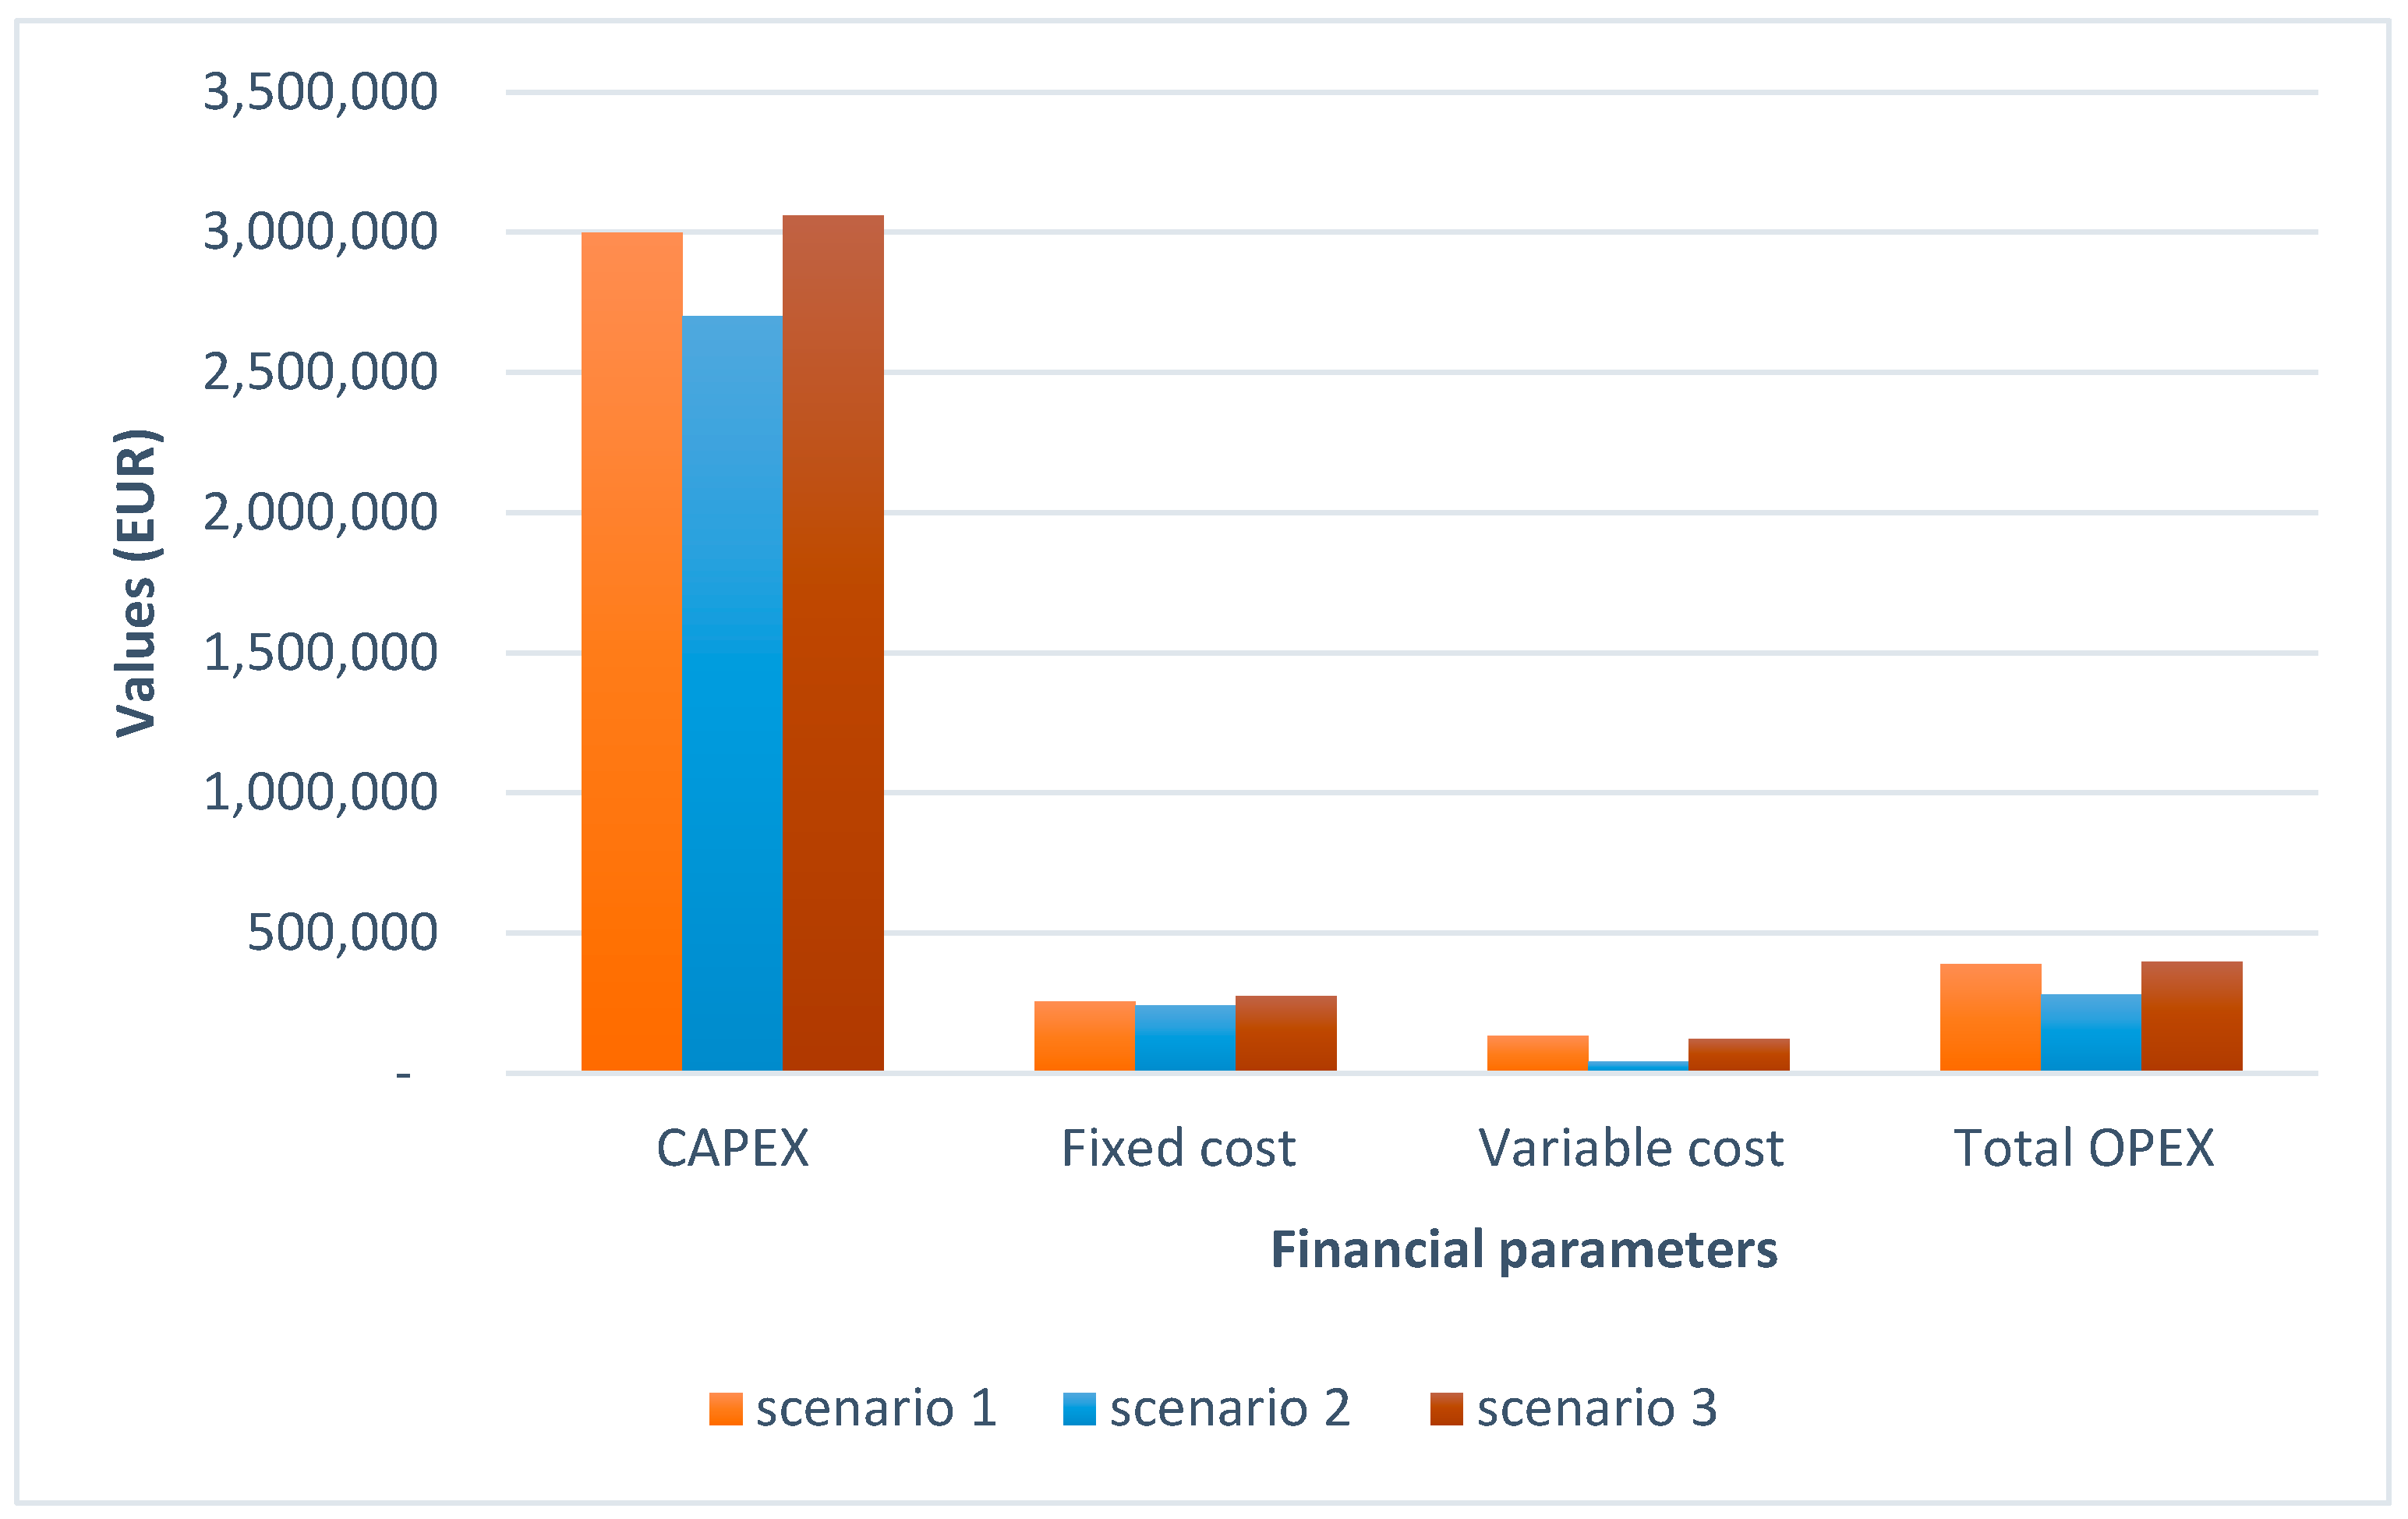
3.2. Financial Analysis

The first step in the development of the financial model is the estimation of the revenues and Operation and Maintenance (O&M) costs for the three scenarios. Revenues depend on the quantities and prices of the products. Although the quantities change per scenario, the prices remain the same for all scenarios.
In order to determine the market value of the compost product that will be developed, a market study was carried out. From Table 3, the proposed price for the compost product is recommended to be set to the same as the average price, 0.19 EUR/kg.
The O&M costs are important in determining the final earnings before tax. In the proposed model, the project manager is expected to make annual debt repayments to the lender. Thus, the fixed cost (which includes debt repayment) is higher than the variable cost. The total O&M costs are 14%, 3.86% and 13% for scenarios 1, 2 and 3, respectively.
The financial analysis of all scenarios has been summarized in Table 4. Scenario 1 is the best performing, with an NPV which is more than four times the investment cost. The PBP is also best performing under scenario 1, while scenario 2 is the worst performing. The LCOE for scenario 3 is very high because it involves only energy for internal consumption, which has the lowest capacity of 300 kW.

4. Discussion

The results of this study clearly indicate that the combination of fuels and energy is a more economically feasible option. The average LCOE of the three scenarios is 0.51 EUR/kWh. Equally high LCOEs have been recorded in some studies. In a study in 2018, the average LCOE for bioenergy and solar PV was 0.054 and 0.075 EUR/kWh [85,91]. A recent review by [92] of 161 case studies across the globe indicates that 0.878 EUR/kW has been recorded in countries like Pakistan, while an LCOE of 0.26 EUR/kWh may be realistic in countries such as Germany, Spain and New Zealand, where household electricity prices are comparatively higher and includes taxes; meanwhile, Ghana lifeline consumers receive subsidized tariffs [93]. However, reported values for HRES in Ghana include 0.264 EUR/kWh [12] and 0.32 EUR/kWh [56], which are similar to scenario 2. On the other hand, ref. [94] recorded 0.64 EUR/kWh, which was over 400% higher than the End User tariffs (EUTs) at the time of that study, but it is similar to what has been recorded in this study for scenarios 1 and 3. Considering that the average residential EUT for electricity in Ghana is 0.27 EUR/kWh, as reported in May 2023, the lowest LCOE is about 20% higher [93]. Also, in the same study, the capacity of the system was 30 kW. This is consistent with the results obtained in this study, where the lower-capacity systems recorded very high LCOE values.
It has been proven that the capacity of renewable energy systems affects their cost [91]. The LCOE in Table 4 clearly indicates that the cost of renewable energy is closely linked to the capacity of the system. This also provides an indication that the LCOE may improve at a higher capacity. Thus, the small capacity of the current plant makes its economic feasibility unrealistic, especially under the current economic conditions of the country where average inflation is 16.12%. In the assessment of the financial feasibility of WTE, solar PV and hybrid plants, it was concluded that the standalone system is the best investment option because of its low operational cost compared to the other options [54]. However, that study considered electricity as the only product. This is similar to what has been recorded in this study, where scenario 2 (electricity only) had the lowest LCOE, which is still far above global prices and also the average EUT.
Considering the LCOE, the cost of internally generated power is too high and it cannot compete, even if it is directly supplying heavy industries, with tariffs ranging from 0.22 to 0.39 EUR/kWh [93]. For special load consumers, the End User tariffs are equivalent to 0.39 EUR/kWh, which is about 40% less than the cost of self-production. Thus, from an economic standpoint, it is more economical to purchase power from the national grid for internal uses when only fuels are being produced (scenario 3), compared to self-production. On the other hand, this is not the most environmentally friendly option because the energy from the national grid contains only 2% renewable energy, excluding that from hydropower [62]. Also, the added benefits associated with the environmentally sound management of waste must be considered since self-production allows more waste to be processed onsite. Overall, 16,750 tonnes of MSW is expected to be treated at the plant per year, which mitigates numerous societal challenges. In order to incentivize potential investors, governmental policy instruments such as subsidies, lower tariffs for renewable energy, tax exemptions, lower lending rates and concessional financing will improve the feasibility of such projects [95].
In order to expand capacity in future projects, the solar PV system will be the more cost-effective option compared to the other systems. The cost/kW of the solar PV system, as recorded in Table 2, is about half that of the AD and pyrolysis systems. According to IRENA, the cost of renewable energy technologies has seen tremendous price reduction in recent years. The installed costs for bioenergy and solar PV in 2022 were 2085 EUR/kW and 845 EUR/kW, compared to 2209 and 3898 EUR/kW in 2010, respectively. This is attributed to soaring global fossil fuel prices as well as recent technological advancements [2,85]. As evidence to this, the technologies in this plant were procured in 2021, demonstrating that technologies have seen a further drop since then, which will become relevant when making projections for future projects. The lowest average installed cost was seen under scenario 2 (2794 EUR/kW), which is due to the higher installed capacity largely from the AD system. In order to direct 100% of the biogas towards the production of electricity, a 300 kW capacity CHP engine is required. On the other hand, scenario 3 considers 100% of the biogas as being directed to fuels, with 300 kW of electricity produced (representing 100% of all energy produced) to drive the internal energy demand for the fuel production. This implies that in both scenarios 1 and 3, energy is converted to fuels, which store the energy for other uses [96]. The electricity produced is specifically redirected to the plant for internal use, for purposes such as segregation, the compression of gases and minor consumption for offices and laboratories and not for grid connection. Thus, the installed capacity is 300 kW, which is sourced from solar PV and pyrolysis, producing 529 MWh/y of energy for fuel production. Overall, the electrical potential of biogas (2.28 kWh/m3) is similar to previous studies by [97], where each cubic meter of biogas had an electrical energy potential of 2.04 kWh. The slight difference may be due to the experimental nature of their work as compared to this study, where actual data were being collected.
Since the project site is located in a largely rural area, with about 70% of the population engaged in agriculture or related activities, compost is likely to be a very viable product. Preliminary tests on the biodigester reveal that digestate is released from the biodigester at an average rate of 6 m3/h. In a 2018 market study of compost prices in northern Ghana, the average cost/kg adjusted to the current 2023 exchange rate was 0.04 EUR/kg, compared to the 0.19 EUR/kg in this study. This is a reflection of the state of the country’s inflation, which is calculated to be 16.12% per annum in this study [98].
Equity investors usually assess project risk and feasibility based on returns of at least twice the value of the debt being offered [86]. For scenarios 1 and 3, the IRR is more than twice the discount rate, showing high feasibility. Scenario 3 also performs relatively well based on its NPV and IRR, although the LCOE for the energy being used at the plant makes it unrealistic to source energy at such a high cost for producing fuels. One option for future projects will be to source energy from the national grid for internal consumption, since its EUT is far lower than the cost of self-producing power.
The financial model developed required detailed considerations of the O&M costs (Figure 4). The O&M costs in this study are relatively higher than those recorded in other studies. The fixed costs and variable costs for scenario 2 were the lowest because solar PV systems have low O&M costs, which are calculated as 4% of the CAPEX, but highest costs were seen for Scenario 3 due to the high energy demand for the production of the fuels. This is higher than the 1% stated by [54], but within range from the study [99]. This is due to the consideration of costs such as insurance, annual debt repayments including interest, and equipment replacement costs in year 10 and 15. Although it is quite high, it provides significant risk reduction for the project developer. The variable costs in scenario 2 are the lowest due to no costs for materials and transportation of goods and a low possibility of unscheduled maintenance works.
This study considered the CAPEX as being financed by an independent investor with a debt-to-equity ratio of 7:3. Overall, this resulted in a good NPV, which makes the investment attractive. From an investment point of view, the current model (scenario 1) is more attractive because it provides a higher NPV over a shorter payback period. It also reduces the risk of the investment by spreading the revenue sources between government PPAs and an open market trade in fuels. On the other hand, in a situation where public policy does not allow such PPAs to be signed, the trade in fuels also provides substantial benefits to the investor, although the repayment period for the debt must be carefully bargained with the lender. From an environmental point of view, scenario 2 does not provide a holistic solution to local waste management challenges because residual items must be sent back to the landfill, where a fee must be paid. An additional EUR 12,000/y is estimated to be paid as the cost to dispose of the RF, which could otherwise bring in additional income. The low revenue and operational cost ratio resulted in low earnings before tax (EBT), mainly as a result of debt repayment. Also, the negative impact of emissions during transportation to and from the landfill cannot be overlooked [100].

5. Conclusions

Hybrid renewable energy systems are gaining more attention among policy makers and governments as a means to solve current energy challenges in a sustainable manner. In Ghana, the management of MSW still continues to plague the country, with less than 2% of the waste being segregated. The government has recently supported the construction of a hybrid WTE plant in the Ashanti Region, which uses three main technologies to produce electricity. However, due to the onsite segregation of the waste received at the plant, an innovative model of producing electricity and fuels from the same site but from multiple technologies is presented. The current study carries out a comparative financial feasibility assessment of various income-generating models for the plant, which are (i) the base case—fuels and electricity, (ii) electricity only and (iii) fuels only. The results indicate that the LCOE is too high compared to the End User tariffs for electricity in the country, for all scenarios. However, the NPV and payback period make scenario 1 more attractive and provide less risk to the investor. The fuels-only scenario also provides substantial benefits in terms of the NPV and IRR but with a 10-year debt payback period, which is not very attractive. The electricity-only scenario is the least attractive because of its low revenue to cost ratio. Overall, the current model must be replicated but at a larger scale to improve the LCOE and make it more financially attractive. It is therefore highly recommended that in conducting financial feasibility studies for similar projects, the scenarios developed in this study be used to identify the best applicable technical model. This is relevant for obtaining long-term financial sustainability from multiple products, especially in situations where PPAs cannot be obtained from utility providers. However, this study did not consider any potential environmental aspects, including benefits and incentives such as carbon credits.

Author Contributions

Conceptualization: E.A.A. and S.N.; methodology: S.N., E.A.A., M.M., E.B. and F.K.; curation of results: S.N., M.M., F.K. and F.B.A.; writing and review: E.A.A., M.M. and E.B.; supervision: S.N., F.K. and M.M.; funding acquisition: S.N. All authors have read and agreed to the published version of the manuscript.

Funding

This work was supported under the project “Waste to Energy: Hybrid Energy from Waste as Sustainable Solution for Ghana”, funded by the German Federal Ministry for Education and Research (BMBF), 03SF0591E, and the Open Access Publication Fund of the University of Rostock.

Data Availability Statement

Data are contained within the article.

Conflicts of Interest

The authors declare no conflicts of interest.

References

  1. IEA. Africa Energy Outlook 2019—Analysis and Key Findings. A Report by the International Energy Agency; IEA: Paris, France, 2019. [Google Scholar]
  2. International Renewable Energy Agency. Renewable Power Generation Costs in 2022; International Renewable Energy Agency: Abu Dhabi, United Arab Emirates, 2023. [Google Scholar]
  3. Ferronato, N.; Torretta, V. Waste Mismanagement in Developing Countries: A Review of Global Issues. Int. J. Environ. Res. Public Health 2019, 16, 1060. [Google Scholar] [CrossRef]
  4. Hoang, N.H.; Fogarassy, C. Sustainability Evaluation of Municipal Solid Waste Management System for Hanoi (Vietnam)-Why to Choose the “waste-to-Energy” Concept. Sustainability 2020, 12, 1085. [Google Scholar] [CrossRef]
  5. Anyaoha, K.E.; Zhang, D.L. Transition from Fossil-Fuel to Renewable-Energy-Based Smallholder Bioeconomy: Techno-Economic Analyses of Two Oil Palm Production Systems. Chem. Eng. J. Adv. 2022, 10, 100270. [Google Scholar] [CrossRef]
  6. Mutz, D.; Hengevoss, D.; Hugi, C.; Gross, T. Waste to Energy Options in Municipal Solid Waste Management: A Guide for Decidion Makers in Developing and Emergin Countries; Hinchliffe, D., Frommann, J., Gunsilius, E., Eds.; Deutsche Gesellschaft für Internationale Zusammenarbeit (GIZ) GmbH: Eschborn, Germany, 2017. [Google Scholar]
  7. Tozlu, A.; Özahi, E.; Abuşoğlu, A. Waste to Energy Technologies for Municipal Solid Waste Management in Gaziantep. Renew. Sustain. Energy Rev. 2016, 54, 809–815. [Google Scholar] [CrossRef]
  8. Manwell, J.F. Hybrid Energy Systems. Encycl. Energy 2004, 3, 215–226. [Google Scholar]
  9. Bajpai, P.; Dash, V. Hybrid Renewable Energy Systems for Power Generation in Stand-Alone Applications: A Review. Renew. Sustain. Energy Rev. 2012, 16, 2926–2939. [Google Scholar] [CrossRef]
  10. Buragohain, S.; Mohanty, K.; Mahanta, P. Hybridization of Solar Photovoltaic and Biogas System: Experimental, Economic and Environmental Analysis. Sustain. Energy Technol. Assess. 2021, 45, 101050. [Google Scholar] [CrossRef]
  11. Agyenim, F.B.; Dzamboe, P.D.; Mohammed, M.; Bawakyillenuo, S.; Okrofu, R.; Decker, E.; Agyemang, V.K.; Nyarko, E.H. Powering Communities Using Hybrid Solar–Biogas in Ghana, a Feasibility Study. Environ. Technol. Innov. 2020, 19, 100837. [Google Scholar] [CrossRef]
  12. Odoi-Yorke, F.; Abaase, S.; Zebilila, M.; Atepor, L. Feasibility Analysis of Solar PV/Biogas Hybrid Energy System for Rural Electrification in Ghana. Cogent Eng. 2022, 9, 2034376. [Google Scholar] [CrossRef]
  13. Mabalane, P.N.; Oboirien, B.O.; Sadiku, E.R.; Masukume, M. A Techno-Economic Analysis of Anaerobic Digestion and Gasification Hybrid System: Energy Recovery from Municipal Solid Waste in South Africa. Waste Biomass Valorization 2021, 12, 1167–1184. [Google Scholar] [CrossRef]
  14. Xiong, J.; Ng, T.S.A.; Wang, S. An Optimization Model for Economic Feasibility Analysis and Design of Decentralized Waste-to-Energy Systems. Energy 2016, 101, 239–251. [Google Scholar] [CrossRef]
  15. El Ibrahimi, M.; Khay, I.; El Maakoul, A.; Bakhouya, M. Techno-Economic and Environmental Assessment of Anaerobic Co-Digestion Plants under Different Energy Scenarios: A Case Study in Morocco. Energy Convers. Manag. 2021, 245, 114553. [Google Scholar] [CrossRef]
  16. Salman, C.A.; Schwede, S.; Thorin, E.; Yan, J. Predictive Modelling and Simulation of Integrated Pyrolysis and Anaerobic Digestion Process. Energy Procedia 2017, 105, 850–857. [Google Scholar] [CrossRef]
  17. Petrollese, M.; Cocco, D. Techno-Economic Assessment of Hybrid CSP-Biogas Power Plants. Renew. Energy 2020, 155, 420–431. [Google Scholar] [CrossRef]
  18. Lagorse, J.; Simões, M.G.; Miraoui, A.; Costerg, P. Energy Cost Analysis of a Solar-Hydrogen Hybrid Energy System for Stand-Alone Applications. Int. J. Hydrogen Energy 2008, 33, 2871–2879. [Google Scholar] [CrossRef]
  19. Hansen, K.; Breyer, C.; Lund, H. Status and Perspectives on 100% Renewable Energy Systems. Energy 2019, 175, 471–480. [Google Scholar] [CrossRef]
  20. Winquist, E.; Rikkonen, P.; Pyysiäinen, J.; Varho, V. Is Biogas an Energy or a Sustainability Product?—Business Opportunities in the Finnish Biogas Branch. J. Clean. Prod. 2019, 233, 1344–1354. [Google Scholar] [CrossRef]
  21. Irmak, S. Biomass as Raw Material for Production of High-Value. In Biomass Volume Estimation and Valorization for Energy; Tumuluru, J.S., Ed.; IntechOpen: Rijeka, Croatia, 2017; pp. 201–225. [Google Scholar]
  22. Chen, K.C.; Leach, M.; Black, M.J.; Tesfamichael, M.; Kemausuor, F.; Littlewood, P.; Marker, T.; Mwabonje, O.; Mulugetta, Y.; Murphy, R.J.; et al. BioLPG for Clean Cooking in Sub-Saharan Africa: Present and Future Feasibility of Technologies, Feedstocks, Enabling Conditions and Financing. Energies 2021, 14, 3916. [Google Scholar] [CrossRef]
  23. Namugenyi, I.; Coenen, L.; Scholderer, J. Realising the Transition to Bioenergy: Integrating Entrepreneurial Business Models into the Biogas Socio-Technical System in Uganda. J. Clean. Prod. 2022, 333, 130135. [Google Scholar] [CrossRef]
  24. Rahmatzafran, A.; Rosslee, D.; Rianawati, E.; Loeksmanto, H.I.; Hilbert, J.; Alemmu, S.; Mohammed, M.; Eremed, B.W.; Salie, Y. Biogas Markets and Frameworks in Argentina, Ethiopia, Ghana, Indonesia, and South Africa; DiBiCoo–Digital Global Biogas Cooperation 2020. pp. 1–222. Available online: https://ec.europa.eu/research/participants/documents/downloadPublic?documentIds=080166e5d1e4e65c&appId=PPGMS (accessed on 24 March 2023).
  25. Lee, R.D. Evaluating Uganda’s Waste Management System for the Production of Refuse-Derived Fuel (RDF) and Its Potential Implementation in the Country’s Growing Cement Industry. Ph.D. Thesis, Technische Universität Wien, Wien, Austria, 2019. [Google Scholar]
  26. García, R.; Gil, M.V.; Rubiera, F.; Chen, D.; Pevida, C. Renewable Hydrogen Production from Biogas by Sorption Enhanced Steam Reforming (SESR): A Parametric Study. Energy 2021, 218, 119491. [Google Scholar] [CrossRef]
  27. Wang, S.; Wen, Y.; Shi, Z.; Nuran Zaini, I.; Göran Jönsson, P.; Yang, W. Novel Carbon-Negative Methane Production via Integrating Anaerobic Digestion and Pyrolysis of Organic Fraction of Municipal Solid Waste. Energy Convers. Manag. 2022, 252, 115042. [Google Scholar] [CrossRef]
  28. Bustamante, M.A.; Restrepo, A.P.; Alburquerque, J.A.; Pérez-Murcia, M.D.; Paredes, C.; Moral, R.; Bernal, M.P. Recycling of Anaerobic Digestates by Composting: Effect of the Bulking Agent Used. J. Clean. Prod. 2013, 47, 61–69. [Google Scholar] [CrossRef]
  29. de Beer, J.; Cihlar, J.; Hensing, I.; Zabeti, M. Status and Prospects of Co-Processing of Waste in EU Cement Plants; Ecofys-Navigant Company: Utrecht, The Netherlands, 2017. [Google Scholar]
  30. WBCSD. Guidelines for the Selection and Use of Fuels and Raw Materials in the Cement Manufacturing Process; World Business Council for Sustainable Development: Geneva, Switzerland, 2005. [Google Scholar]
  31. Beguedou, E.; Narra, S.; Afrakoma Armoo, E.; Agboka, K.; Damgou, M.K. Alternative Fuels Substitution in Cement Industries for Improved Energy Efficiency and Sustainability. Energies 2023, 16, 3533. [Google Scholar] [CrossRef]
  32. Reza, B.; Soltani, A.; Ruparathna, R.; Sadiq, R.; Hewage, K. Environmental and Economic Aspects of Production and Utilization of RDF as Alternative Fuel in Cement Plants: A Case Study of Metro Vancouver Waste Management. Resour. Conserv. Recycl. 2013, 81, 105–114. [Google Scholar] [CrossRef]
  33. Elnaas, A.; Belherazem, A.; Müller, W.; Nassour, A.; Nelles, M. Biodrying for Mechanical Biological Treatment of Mixed Municipal Solid Waste and Potential for RDF Production. In Proceedings of the 6th International Conference on Environmental Technology and Knowledge Transfer, Beijing, China, 19–20 May 2016; p. 155. [Google Scholar]
  34. Wappler, M.; Unguder, D.; Lu, X.; Ohlmeyer, H.; Teschke, H.; Lueke, W. Building the Green Hydrogen Market—Current State and Outlook on Green Hydrogen Demand and Electrolyzer Manufacturing. Int. J. Hydrogen Energy 2022, 47, 33551–33570. [Google Scholar] [CrossRef]
  35. Reith, R.H.; Wijffels, R.H.; Barten, H. Bio-Methane & Bio-Hydrogen: Status and Perspectives of Biological Methane and Hydrogen Production; Reith, J.H., Wijffels, R.H., Barten, H., Eds.; Dutch Biological Hydrogen Foundation: Hague, The Netherlands, 2003; ISBN 9090171657. [Google Scholar]
  36. Dawood, F.; Anda, M.; Shafiullah, G.M. Hydrogen Production for Energy: An Overview. Int. J. Hydrogen Energy 2020, 45, 3847–3869. [Google Scholar] [CrossRef]
  37. Saur, G.; Milbrandt, A. Renewable Hydrogen Potential from Biogas in the United States; National Renewable Energy laboratory (NREL): Golden, CO, USA, 2014; pp. 1–44. [Google Scholar]
  38. Kumar, R.; Kumar, A.; Pal, A. Overview of Hydrogen Production from Biogas Reforming: Technological Advancement. Int. J. Hydrogen Energy 2022, 47, 34831–34855. [Google Scholar] [CrossRef]
  39. Minh, D.P.; Siang, T.J.; Vo, D.V.N.; Phan, T.S.; Ridart, C.; Nzihou, A.; Grouset, D. Hydrogen Production from Biogas Reforming: An Overview of Steam Reforming, Dry Reforming, Dual Reforming, and Tri-Reforming of Methane; Elsevier Ltd.: Amsterdam, The Netherlands, 2018; ISBN 9780128111970. [Google Scholar]
  40. Wee, A.N.C.H.; Erison, A.E.; Edward Anyek, E.H.; Pakpahan, G.R.; Lim, J.R.; Tiong, A.N.T. Techno-Economic Assessment of Hydrogen Production via Steam Reforming of Palm Oil Mill Effluent. Sustain. Energy Technol. Assess. 2022, 53, 102575. [Google Scholar] [CrossRef]
  41. Tamilselvan, R.; Selwynraj, A.I. Model Development for Biogas Generation, Purification and Hydrogen Production via Steam Methane Reforming. Int. J. Hydrogen Energy 2024, 50, 211–225. [Google Scholar] [CrossRef]
  42. Ayodele, T.R.; Alao, M.A.; Ogunjuyigbe, A.S.O.; Munda, J.L. Electricity Generation Prospective of Hydrogen Derived from Biogas Using Food Waste in South-Western Nigeria. Biomass Bioenergy 2019, 127, 105291. [Google Scholar] [CrossRef]
  43. Seglah, P.A.; Wang, Y.; Wang, H.; Wobuibe Neglo, K.A.; Zhou, K.; Sun, N.; Shao, J.; Xie, J.; Bi, Y.; Gao, C. Utilization of Food Waste for Hydrogen-Based Power Generation: Evidence from Four Cities in Ghana. Heliyon 2023, 9, e14373. [Google Scholar] [CrossRef]
  44. Guilayn, F.; Jimenez, J.; Martel, J.L.; Rouez, M.; Crest, M.; Patureau, D. First Fertilizing-Value Typology of Digestates: A Decision-Making Tool for Regulation. Waste Manag. 2019, 86, 67–79. [Google Scholar] [CrossRef]
  45. Valve, H.; Lazarevic, D.; Humalisto, N. When the Circular Economy Diverges: The Co-Evolution of Biogas Business Models and Material Circuits in Finland. Ecol. Econ. 2021, 185, 107025. [Google Scholar] [CrossRef]
  46. El Maguiri, A.; Zegzouti, Y.; Souabi, S.; Idrissi, L.; El Hadek, M.; Rene, E.R.; Pala, A.I.; Hafidi, M. Landfills: Environmental Impacts, Assessment and Management Complimentary Contributor Copy. In Landfills: Environmental Impacts, Assessment and Management; Norma, C., Ed.; Nova Science Publishers, Inc.: New York, NY, USA, 2017; p. 298. ISBN 9781536125597. [Google Scholar]
  47. Van Den Berg, K.; Duong, T.C. Solid and Industrial Hazardous Waste Management Assessment—Options and Action Area to Implement the National Strategy; World Bank: Washington, DC, USA, 2018; p. 107. [Google Scholar]
  48. Gogela, U.; Salie, Y.; Pineo, C.; Basson, L. The Business Case for Biogas from Solid Waste in the Western Cape; GreenCape: Cape Town, South Africa, 2017. [Google Scholar]
  49. Njoku, P.O.; Edokpayi, J.N.; Odiyo, J.O. Modeling Landfill Gas Potential and Potential Energy Recovery from Thohoyandou Landfill Site, South Africa. J. Air Waste Manag. Assoc. 2020, 70, 820–833. [Google Scholar] [CrossRef]
  50. Sarquah, K.; Narra, S.; Beck, G.; Awafo, E.A.; Antwi, E. Bibliometric Analysis; Characteristics and Trends of Refuse Derived Fuel Research. Sustainability 2022, 14, 1994. [Google Scholar] [CrossRef]
  51. Atuahene, S.A.; Sheng, Q.X. Powering Ghana’s Future: Unraveling the Dynamics of Electricity Generation and the Path to Sustainable Energy. Environ. Sci. Eur. 2023, 35, 25. [Google Scholar] [CrossRef]
  52. Ministry of Energy. Energy Sector Recovery Program; Ministry of Energy: Accra, Ghana, 2019. [Google Scholar]
  53. Ministry of Energy. 2022 Energy Outlook for Ghana; Ministry of Energy: Accra, Ghana, 2022. [Google Scholar]
  54. Asante, K.; Gyamfi, S.; Amo-boateng, M. Techno-Economic Analysis of Waste-to-Energy with Solar Hybrid: A Case Study from Kumasi, Ghana. Sol. Compass 2023, 6, 100041. [Google Scholar] [CrossRef]
  55. Adaramola, M.; Agelin-Chaab, M.; Paul, S. Analysis of Hybrid Energy Systems for Application in Southern Ghana. Energy Convers. Manag. 2014, 88, 284–295. [Google Scholar] [CrossRef]
  56. Agyekum, E.B.; Nutakor, C. Feasibility Study and Economic Analysis of Stand-Alone Hybrid Energy System for Southern Ghana. Sustain. Energy Technol. Assess. 2020, 39, 100695. [Google Scholar] [CrossRef]
  57. Addo, E.O.K.; Asumadu, J.; Okyere, P.Y. Optimal Design of Renewable Hybrid Energy System for a Village in Ghana. In Proceedings of the 2014 9th IEEE Conference on Industrial Electronics and Applications, Hangzhou, China, 9–11 June 2014; pp. 1520–1526. [Google Scholar]
  58. UNEP. Ethiopia’s Waste-to-Energy Plant Is a First in Africa. Available online: https://www.unep.org/news-and-stories/story/ethiopias-waste-energy-plant-first-africa (accessed on 10 March 2023).
  59. Tena, N. 400 kW Hybrid Waste to Energy Power Plant a First for Ghana. Available online: https://www.esi-africa.com/industry-sectors/generation/400kw-hybrid-waste-to-energy-power-plant-a-first-for-ghana/#:~:text=The%20400-kilowatt%20production%20facility,organic%20manure%20for%20their%20farms (accessed on 10 March 2023).
  60. Ministry of Finance. Composite Budget for 2022–2025; Program Based Budget Estimates for 2022: Atwima Nwabiagya Municipal Assembly; Ministry of Finance: Accra, Ghana, 2022. [Google Scholar]
  61. Ofori, G.M.-L. Waste to Energy: An Alternative Energy Source for Ghana. Lund University: Lund, Sweden, 2016. [Google Scholar]
  62. Energy Commission. National Energy Statistics; Energy Commission: Accra, Ghana, 2023. [Google Scholar]
  63. Sarquah, K.; Narra, S.; Beck, G.; Bassey, U.; Antwi, E.; Hartmann, M.; Sarfo, N.; Derkyi, A.; Awafo, E.A.; Nelles, M. Characterization of Municipal Solid Waste and Assessment of Its Potential for Refuse-Derived Fuel (RDF) Valorization. Energies 2023, 16, 200. [Google Scholar] [CrossRef]
  64. Ministry of Finance. Composite Budget for 2019–2022—Programme Based Budget Estimates for 2019: Atwima Nwabiagya Municipal Assembly 2019; Ministry of Finance: Accra, Ghana, 2019. [Google Scholar]
  65. Miezah, K.; Obiri-Danso, K.; Kádár, Z.; Fei-Baffoe, B.; Mensah, M.Y. Municipal Solid Waste Characterization and Quantification as a Measure towards Effective Waste Management in Ghana. Waste Manag. 2015, 46, 15–27. [Google Scholar] [CrossRef]
  66. Amoatey, N.K.; Darmey, J.; Tabbicca, K.E. Estimation of the Methane Generation Potential of the Tamale Landfill Site Using LandGEM. Ghana Min. J. 2023, 23, 27–32. [Google Scholar]
  67. Parliament of Ghana, Committee on Mines and Energy. Power Purchasing Agreement and Energy Conversion Agreement between ECG and Jacobsen Jelco Ghana Limited; Parliament of Ghana: Accra, Ghana, 2014. [Google Scholar]
  68. Natural Resources Canada. RETScreen International. Clean Energy Project Analysis: RETScreen Engineering and Cases Textbook, 3rd ed.; Natural Resources Canada: Ottawa, ON, Canada, 2005; ISBN 0662391918. [Google Scholar]
  69. Obeng, M.; Gyamfi, S.; Derkyi, N.S.; Kabo-bah, A.T.; Peprah, F. Technical and Economic Feasibility of a 50 MW Grid-Connected Solar PV at UENR Nsoatre Campus. J. Clean. Prod. 2020, 247, 119159. [Google Scholar] [CrossRef]
  70. Owolabi, A.B.; Nsafon, B.E.K.; Huh, J.S. Validating the Techno-Economic and Environmental Sustainability of Solar PV Technology in Nigeria Using RETScreen Experts to Assess Its Viability. Sustain. Energy Technol. Assess. 2019, 36, 100542. [Google Scholar] [CrossRef]
  71. Ramli, M.S.; Wahid, S.S.A.; Hassan, K.K. A Comparison of Renewable Energy Technologies Using Two Simulation Softwares: HOMER and RETScreen. AIP Conf. Proc. 2017, 1875, 030013. [Google Scholar] [CrossRef]
  72. Behzadi, A.; Arabkoohsar, A.; Peri, V.S. Innovative Hybrid Solar-Waste Designs for Cogeneration of Heat and Power, an Effort for Achieving Maximum Efficiency and Renewable Integration. Appl. Therm. Eng. 2021, 190, 116824. [Google Scholar] [CrossRef]
  73. Dima, F.A.F.J.; Li, Z.; Mang, H.P.; Zhu, L. Feasibility Analysis of Biogas Production by Using GIS and Multicriteria Decision Aid Methods in the Central African Republic. Sustainability 2022, 14, 13418. [Google Scholar] [CrossRef]
  74. Couturier, C.; Berger, S.; Herault, I.; Meiffren, I.; Herault, I. Anaerobic Digestion of Urban Sludge Situation, State of the Art; La Digestion Anaerobie des Boues Urbaines Etat des Lieux, Etat de L’art; Solagro: Toulouse, France, 2001. [Google Scholar]
  75. Bassey, U.; Sarquah, K.; Hartmann, M.; Tom, A.O.; Beck, G.; Antwi, E.; Narra, S.; Nelles, M. Thermal Treatment Options for Single-Use, Multilayered and Composite Waste Plastics in Africa. Energy 2023, 270, 126872. [Google Scholar] [CrossRef]
  76. Esfilar, R.; Bagheri, M.; Golestani, B. Technoeconomic Feasibility Review of Hybrid Waste to Energy System in the Campus: A Case Study for the University of Victoria. Renew. Sustain. Energy Rev. 2021, 146, 111190. [Google Scholar] [CrossRef]
  77. Nikolaidis, P.; Poullikkas, A. A Comparative Overview of Hydrogen Production Processes. Renew. Sustain. Energy Rev. 2017, 67, 597–611. [Google Scholar] [CrossRef]
  78. Alves, H.J.; Bley Junior, C.; Niklevicz, R.R.; Frigo, E.P.; Frigo, M.S.; Coimbra-Araújo, C.H. Overview of Hydrogen Production Technologies from Biogas and the Applications in Fuel Cells. Int. J. Hydrogen Energy 2013, 38, 5215–5225. [Google Scholar] [CrossRef]
  79. Saebea, D.; Authayanun, S.; Patcharavorachot, Y.; Arpornwichanop, A. Thermodynamic Analysis of Hydrogen Production from the Adsorption-Enhanced Steam Reforming of Biogas. Energy Procedia 2014, 61, 2254–2257. [Google Scholar] [CrossRef]
  80. Braga, L.B.; Silveira, J.L.; Da Silva, M.E.; Tuna, C.E.; Machin, E.B.; Pedroso, D.T. Hydrogen Production by Biogas Steam Reforming: A Technical, Economic and Ecological Analysis. Renew. Sustain. Energy Rev. 2013, 28, 166–173. [Google Scholar] [CrossRef]
  81. Chapter 5.3.3—Application of Hydrogen by Use of Chemical Reactions of Hydrogen and Carbon Dioxide. In Science and Engineering of Hydrogen-Based Energy Technologies: Hydrogen Production and Practical Applications in Energy Generation; Miranda, P.E. (Ed.) Elsevier Inc.: Amsterdam, The Netherlands, 2018; pp. 279–289. ISBN 9780128142516. [Google Scholar]
  82. Falcinelli, S.; Capriccioli, A.; Rosi, M.; Martì, C.; Parriani, M.; Laganà, A. Methane Production from H2 + CO2 Reaction: An Open Molecular Science Case for Computational and Experimental Studies. Physchem 2021, 1, 82–94. [Google Scholar] [CrossRef]
  83. Galgani, P. Compost, Biogas and Biochar in Northern Ghana Climate Impact and Economic Feasibility; Leiden University: Leiden, The Netherlands; Delft University of Technology: Delft, The Netherlands, 2012. [Google Scholar]
  84. Zeng, Y.; De Guardia, A.; Dabert, P. Improving Composting as a Post-Treatment of Anaerobic Digestate. Bioresour. Technol. 2016, 201, 293–303. [Google Scholar] [CrossRef] [PubMed]
  85. European Commission. Exchange Rate (InforEuro). Available online: https://commission.europa.eu/funding-tenders/procedures-guidelines-tenders/information-contractors-and-beneficiaries/exchange-rate-inforeuro_en (accessed on 27 January 2024).
  86. Pueyo, A.; Bawakyillenuo, S.; Osiolo, H. Cost and Returns of Renweable Energy in Sub-Saharan Africa: A Comparison of Kenya and Ghana; Institute of Development Studies: Brighton, UK, 2016. [Google Scholar]
  87. Afful-Dadzie, A.; Mallett, A.; Afful-Dadzie, E. The Challenge of Energy Transition in the Global South: The Case of Electricity Generation Planning in Ghana. Renew. Sustain. Energy Rev. 2020, 126, 109830. [Google Scholar] [CrossRef]
  88. The World Bank. Country Data. Available online: https://data.worldbank.org/country/ghana?view=chart (accessed on 4 September 2023).
  89. Ghana Revenue Authority. Corporate Income Tax (CIT). Available online: https://gra.gov.gh/domestic-tax/tax-types/corporate-income-tax/ (accessed on 4 June 2023).
  90. Bank of Ghana. Interbank Exchange Rate: May 2023. Available online: https://www.bog.gov.gh/economic-data/exchange-rate/ (accessed on 4 July 2023).
  91. Jin, S.; Greaves, D. Wave Energy in the UK:Status Review and Future Perspectives. Renew. Sustain. Energy Rev. 2021, 143, 110932. [Google Scholar] [CrossRef]
  92. Weinand, J.M.; Hoffmann, M.; Göpfert, J.; Terlouw, T.; Schönau, J.; Kuckertz, P.; McKenna, R.; Kotzur, L.; Linßen, J.; Stolten, D. Global LCOEs of Decentralized Off-Grid Renewable Energy Systems. Renew. Sustain. Energy Rev. 2023, 183, 113478. [Google Scholar] [CrossRef]
  93. Public Utilities Regulatory Commission (PURC). Publication of Electricity, Natural Gas and Water Tariffs; PURC: Accra, Ghana, 2023; p. 9. [Google Scholar]
  94. Adaramola, M.S.; Quansah, D.A.; Agelin-Chaab, M.; Paul, S.S. Multipurpose Renewable Energy Resources Based Hybrid Energy System for Remote Community in Northern Ghana. Sustain. Energy Technol. Assess. 2017, 22, 161–170. [Google Scholar] [CrossRef]
  95. Ministry of Energy. Ghana Renewable Energy Master Plan; Ministry of Energy: Accra, Ghana, 2019. [Google Scholar]
  96. IEA; IRENA; UNSD; World Bank; WHO. Tracking SDG 7: The Energy Progress Report; World Bank: Washington, DC, USA, 2021. [Google Scholar]
  97. Murphy, J.D.; McKeogh, E.; Kiely, G. Technical/Economic/Environmental Analysis of Biogas Utilisation. Appl. Energy 2004, 77, 407–427. [Google Scholar] [CrossRef]
  98. Daadi, B.E.; Latacz-Lohmann, U. Composting Municipal Solid Waste for Agriculture in Northern Ghana: Rural Farmers’ Willingness to Pay for Compost Quality and Access Attributes. Q Open 2022, 2, qoac012. [Google Scholar] [CrossRef]
  99. Hadidi, L.A.; Omer, M.M. A Financial Feasibility Model of Gasification and Anaerobic Digestion Waste-to-Energy (WTE) Plants in Saudi Arabia. Waste Manag. 2017, 59, 90–101. [Google Scholar] [CrossRef] [PubMed]
  100. Scarlat, N.; Motola, V.; Dallemand, J.F.; Monforti-Ferrario, F.; Mofor, L. Evaluation of Energy Potential of Municipal Solid Waste from African Urban Areas. Renew. Sustain. Energy Rev. 2015, 50, 1269–1286. [Google Scholar] [CrossRef]
Figure 1. Process flow within the plant to produce products.
Energies 17 00735 g001
Figure 2. Representation of the scenarios, indicating their relationship to each other.
Energies 17 00735 g002
Figure 3. Comparison of the technical variations and energy output for each scenario.
Energies 17 00735 g003
Figure 4. The breakdown of capital costs and operational costs for each scenario.
Energies 17 00735 g004
Table 2. The installed capacity and cost/kW of the three energy technologies for each scenario.
TechnologyScenario 1Scenario 2Scenario 3
Installed Capacity (kW)Installed Cost (EUR /kW)Installed Capacity (kW)Installed Cost (EUR /kW)Installed Capacity (kW)Installed Cost (EUR /kW)
Solar PV 200105020010502001050
AD (CHP)1005000300233300
Pyrolysis (CHP) 100500010050001005000
Total capacity 400 600 300
Average Installed cost 3683 2794 3025
Table 3. Results of the market study on common compost products on the market.
Product NameManufacturerWeight/bag (kg)Price/bag (GHC)Price/kg (GHC)EUR/kg
Asaase Gyefo Safisana Ghana Limited30401.330.11
FortifierJekora Ventures Limited 505010.08
Asaase NufusuoFarmers Hope5025050.4
ACARP ACARP50851.70.14
Grow Plenty Green Gro Ghana 25401.60.13
IRECOPIRECOP50651.20.1
Super soil S&M organics 5025050.4
Best fertiliser Best Fertiliser Company Limited 25351.40.11
Green organic fertilisersGML Green Energy Ghana Limited 309030.24
Average values401002.360.19
Table 4. Summary of the financial performance of each scenario.
ParameterUnitScenario 1Scenario 2Scenario 3
NPVEUR13,696,677.021,648,472 9,876,832.04
IRR%241221
LCOEEUR/kWh0.530.340.68
PBPYear81310
Disclaimer/Publisher’s Note: The statements, opinions and data contained in all publications are solely those of the individual author(s) and contributor(s) and not of MDPI and/or the editor(s). MDPI and/or the editor(s) disclaim responsibility for any injury to people or property resulting from any ideas, methods, instructions or products referred to in the content.

