Article

Comparison of Effects of Partial Discharge Echo in Various High-Voltage Insulation Systems

Department of Electrical and Power Engineering, AGH University of Krakow, al. Mickiewicza 30, 30-059 Krakow, Poland
Energies 2024, 17(20), 5114; https://doi.org/10.3390/en17205114
Submission received: 28 August 2024 / Revised: 3 October 2024 / Accepted: 13 October 2024 / Published: 15 October 2024

Abstract

:
In this article, an extension of a conventional partial discharge (PD) approach called partial discharge echo (PDE), which is applied to different classes of electrical insulation systems of power devices, is presented. Currently, high-voltage (HV) electrical insulation is attributed not only to transmission and distribution grids but also to the industrial environment and emerging segments such as transportation electrification, i.e., electric vehicles, more-electric aircraft, and propulsion in maritime vehicles. This novel PDE methodology extends the conventional and established PD-based assessment, which is perceived to be one of the crucial indicators of HV electrical insulation integrity. PD echo may provide additional insight into the surface conditions and charge transport phenomena in a non-invasive way. It offers new diagnostic attributes that expand the evaluation of insulation conditions that are not possible by conventional PD measurements. The effects of partial discharge echo in various segments of insulation systems (such as cross-linked polyethylene [XLPE] power cable sections that contain defects and a twisted-pair helical coil that represents motor-winding insulation) are shown in this paper. The aim is to demonstrate the echo response on representative electrical insulating materials; for example, polyethylene, insulating paper, and Nomex. Comparisons of the PD echo decay times among various insulation systems are depicted, reflecting dielectric surface phenomena. The presented approach offers extended quantitative assessments of the conditions of HV electrical insulation, including its detection, measurement methodology, and interpretation.

1. Introduction

Currently, high-voltage (HV) electrical insulation is attributed to not only transmission and distribution grids but also the industrial environment and emerging segments such as transportation electrification. The trend toward higher voltage levels can be observed in all of the above sectors [1,2,3]; this is driven by the goals of higher efficiency, lower losses, and more compact designs. For example, the endeavor to elevate operating voltage levels is recognized in the rail segment (25 kV); a low kV level is expected in future e-mobility, starting with high-power heavy vehicles; and in the aircraft systems, voltage levels may rise to 10 kV [4,5,6,7,8]. The ubiquitous application of power electronics conversion and excitation also implies elevated requirements on the design and diagnostics of electrical insulation; this issue refers to both DC and AC systems in terms of reliability and long-term endurance. In this context, research on new methods, early warning indicators, and trend evaluators is part of the current topics of diagnostics and monitoring development related to electrical insulation. All of these fields are currently being extensively investigated worldwide. The rapid development in digitalization and instrumentation techniques (including sensors and the prevalent communication technologies) have impacted the enhancements of diagnostic methods, particularly in real-time monitoring applications. Additionally, progress in machine learning (especially deep-learning structures) and the overall acceleration of artificial intelligence offer enormous benefits for autonomic reasoning and classification [9].
In this article, an extension of the conventional partial discharge (PD) approach called partial discharge echo (PDE), which is applied to different classes of electrical insulation systems, is presented. This novel methodology extends the conventional and established PD-based assessment, which is perceived as one of the crucial indicators of HV electrical insulation integrity [10,11,12,13,14,15,16]. Partial discharges may reveal the condition of electrical insulation—both in its hidden internal inclusions as well as on its surface elements. There are a variety of PD detection methods, ranging between electrical, optical, acoustic, and ultrahigh frequency [17]. Usually, certain classes of power objects are characterized by typical defects from an electrical insulation perspective; for example, power cables may have internal discharges in tiny voids, at the core conductor, or in screen-adjacent inclusions and delamination, surface discharges in end terminations and joints, and the treeing that propagates in solid insulation [18,19,20,21,22,23,24]. In turn, these various forms of discharges reveal distinctive patterns that can be detected, for example, by using the PD phase-resolved methodology [16,18,20]. Such patterns contain both phase and magnitude information, creating statistical clusters; these reveal different forms of discharge. An additional influence on PD dynamics is the harmonic content that occurs in power supply voltage, causing discharge modulation and influencing the insulation’s reliability [25]. Another adjacent area is the magnetic fields in all current-carrying devices that impact PD intensity [26]. Gaseous defects in the forms of voids and inclusions can occur, for example, in power cable insulation, joints, high-voltage insulators, gas-insulated switchgears, transformer winding insulation, HV bushings, or the insulation of the windings of high-voltage motors and generators. Power cables are indispensable in grid and network infrastructures, connecting renewable generation sources (both onshore and offshore) to the demanding applications of dynamic cables in deep sea use [9,27,28,29,30,31,32]. Detecting partial discharges in power cables is still one of the most effective diagnostic methods [33,34,35,36]. Regular PD testing and monitoring become part of a preventive maintenance strategy for ensuring ongoing cable health. In addition, accumulated space charges may create superimposed stresses on the electrical insulation in DC cables. The presented methodology may also be suited for evaluating insulating material in terms of its endurance, degradation caused by accelerated electro-thermo-mechanical aging, surface modifications, and other effects. Based on pattern recognition, the state-of-the-art phase-resolved PD analysis provides associations between an obtained image and the form of a defect, often providing further insight, e.g., whether the defect is conductor-adjacent (including the polarity specification), on the surface, in bulk insulation that is embedded or floating, etc. Here, PD echo extends the mapping of such hidden and embedded defects in a non-invasive way, providing further details about a material’s condition, its progress in deterioration, and its surface phenomena.
In the cases of electrical machines, combined electrical, mechanical, and chemical stresses lead to insulation deterioration [11]. Commonly applied power electronics-based switching, especially recently based on SiC and GaN technology, controlled by ultra-fast semi-square PWM (pulse wave-modulated) voltage patterns may significantly accelerate insulation degradation [37,38,39,40]. In this context, multi-level voltage stresses represent further endurance challenges in insulation [16,41,42,43]. Extensive research and development is being conducted on the diagnostics of motor insulation [11,44,45,46,47]. In particular, the expansion of the transportation segment (electric vehicles, more-electric aircraft, propulsion for maritime vehicles) drives innovative solutions in rotating machines. PDs typically occur in motor insulation as surface discharges or discharges in micro-gaseous spaces, localized at the slot wall or between individual winding turns. The continuous long-term impact of PDs results in insulation degradation, fostered heating, and extensive losses that, as a consequence, often lead to the breakdown of electrical insulation. Investigations were performed on specially arranged twisted-pair (TP) helical-coil specimens, which mimic motor insulation winding and are used for evaluation. PD detection is most often conducted by measuring impedance or, in other cases, high-frequency current transformers, or the ultra-high-frequency (UHF) method using special antennas [11,37,40,41]. PD detection and calibration are described by the horizontal wide standard IEC 60270 [48], whereas alternative methods such as electromagnetic that use electric field sensors and wideband antennas or acoustic ones are specified in IEC TS 62478 [49]. Specifically, the PD-based testing of electrical machines is referenced in IEC 60034 [50].
PD echo may provide additional insight into the surface conditions and charge transport phenomena in a non-invasive way. It offers new diagnostic attributes that expand the evaluation of insulation conditions that are unachievable using traditional PD measurement methods. Echo discharges are detected during the voltage-less interval between successive excitation voltage cycles, offering the added benefit of increased immunity to disturbances caused by the excitation signal. The dynamics during that period are attributed to charge transport and neutralization. PD echo will occur when charge accumulation occurs, and it refers both to surface discharges and discharges inside voids and inclusions. Traditional PD measurement methods typically use discharge intensity as an evaluation parameter. In this context, PD echo can be viewed as a complementary component, offering real-time insights into the surface conditions of the discharge source and revealing local deterioration trends.
The effects of partial discharge echo in various classes of insulation systems (such as cable and motor insulation) are presented in this paper. The presented approach offers an extended quantitative assessment of the condition of HV electrical insulation, including the detection, measurement methodology, and interpretation.

2. Mechanism of Partial Discharge Echo

Partial discharge echo is a new observation of PD dynamics that has been detected in a non-continuous sequence, revealing additional discharge-related information that is not available in conventional measurements. The early observations of the partial discharge echo phenomena were reported for the first time in [51]. The mechanism of PDE refers to a chopped excitation sequence. The process of the chopped sequence formation is presented in Figure 1. Various excitation waveforms can be applied depending on the application, such as sinusoidal or PWM ones, including multi-level sequences (No. 1 in Figure 1). Base waveform fB(t) (No. 2) forms with a delay time of td (No. 3) and a core epoch of the chopped pattern (No. 4). The duration of the introduced delay should be a multiple m of base waveform period T in order to safeguard the coherent acquisition. The PD echo attributes are visualized in a snapshot of real acquisition (No. 5). Additional insight into the physical mechanism of PD (especially the surface phenomena) is possible due to the introduced delay time (apart from the PD effects that occur within the main excitation). The main epoch with an assumed duration of tep is exposed to cyclic repetitions during a predefined measurement time tm. As mentioned above, the presented approach may be applied to any base waveform packet fB(t) that has a period of T. It can be replicated n times within a single packet and then repeated k times during the overall cyclic repetition. This active excitation imposes the associated electric stress. Thus, chopped sequence fCW(t) can be denoted accordingly:
f C W t = i = 0 k f B ( t ) ,     t i · t e p , i · t e p + n · T                 0 ,         t i · t e p + n · T , i · t e p + n · T + t d
The fill factor ff characterizes a chopped sequence pattern, i.e., the ratio of excitation time n∙T to the length of the entire epoch n∙T + m∙T (ff = n/(n + m)). Thus, the fill factor equals ff = 1:2 in the basic case when the epoch consists of one period of the base waveform, and the delay time is also equal to the duration of the base period. Such notation has been assumed in the experimental part of this article.
Generally, there are various forms of discharges: external (such as corona or surface discharges) and internal (e.g., in voids, delaminations, or in the form of a treeing). Depending on the conditions, PD usually takes the form of a streamer in tiny inclusions; at longer distances, it turns into a leader. A streamer partial discharge (occurring, for example, in gaseous inclusions) is described as the propagation of self-channeling ionization. In our experimental arrangements, discharges occur in high-electric-field-prone regions. According to [52], the streamer inception threshold field Einc is defined by the critical avalanche criterion according to the following formula:
E i n c = ( E / p ) c r p 1 + A 2 p a n
where E is an electric field, p is the pressure, a is the gaseous inclusion radius, and (E/p)cr, A, and n are the ionization parameters. For atmospheric air, the parameters that characterize the ionization process take the following values: (E/p)cr = 25.2 V·Pa−1·m−1, A = 8.6 m0.5·Pa0.5, and n = 0.5.
This paper compares the effects of partial discharge echo in various high-voltage insulation systems. The aim is to demonstrate echo responses on different materials and on representative electrical insulation specimens. The effect of PD echo is associated with charge accumulation and can be attributed to both discharges inside voids and surface discharges. A partial discharge echo can be detected when a chopped sequence is applied; it consists of a base waveform and a voltage-less part, forming an epoch. The illustration and definition of the main PD echo attributes are presented in Figure 1. The characteristic moment in the chopped sequence is around transition point T0 (denoted by the red dot in Figure 1). At this point, the externally applied voltage excitation vanishes; in this way, there are locally ‘frozen’ electric field components that create a remnant field and act during a voltage-less time. Regarding the PD echo mechanism, there is an interplay within the PD echo part between the remnant electric field and the field from the surface-deposited charges (reflecting the memory effect). This part of the sequence is reminiscent of a quasi-DC condition; therefore, the polarity of the PD echo occurs during phase one. The remnant field faces an opposite orientation to Eq (originated from the deposited charges by the previous PD events) just after transition point T0. The charge deposition-related memory effects were analyzed in [53,54,55]. There were some attempts to evaluate the charge accumulation on air gap insulation via the PEA (pulsed electro-acoustic) method [56,57]. The decaying character of Eq with a time constant of τe reflects the charge transport mechanism and the neutralization processes on the specimen surface. The PD echo event will be triggered at time stamp ti if the internal field in void Ev crosses the inception level threshold of Einc.
E v t i = P D   e c h o = E r E q T 0 e t i τ e > E i n c
Assuming the availability of electrons and a high enough magnitude of Ev, the entire process may be retriggered. Hence, the surface process dynamics of the local field Eq (associated with material surface condition) are revealed by the time constant of the decaying PD echo pulse envelope. The experimental observation results obtained on various insulating system specimens reflect this mechanism. Usually, two modes of charge decay at transition point T0 can be distinguished: a fast one (just around T0) and a longer one (occurring during the time delay). The first one may be even more pronounced at higher frequencies and at semi-square or PWM-like excitation. It seems that an analysis of the effects around the transition point might inspire another direction in partial discharge echo investigations. For assessing and comparing PD echo effects, several attributes were analyzed. The first class refers to a comparison of the PD inception voltage during the excitation base waveform period with the subsequent PD echo inception threshold. The most interesting factor is an envelope-time-constant decay τe that reflects the charge dynamics [58]. Then, the durations of the echo clusters up to the last discharge event within the delay time (measured from transition point T0) are expressed by te dur. The ratio of echo peak magnitude Qe_max to PD charge absolute magnitude Qmax is also compared. Thus, it is a combination of time-magnitude parameters that describe the PD echo evolution.

3. Test Objects Used for PD Echo Experiments

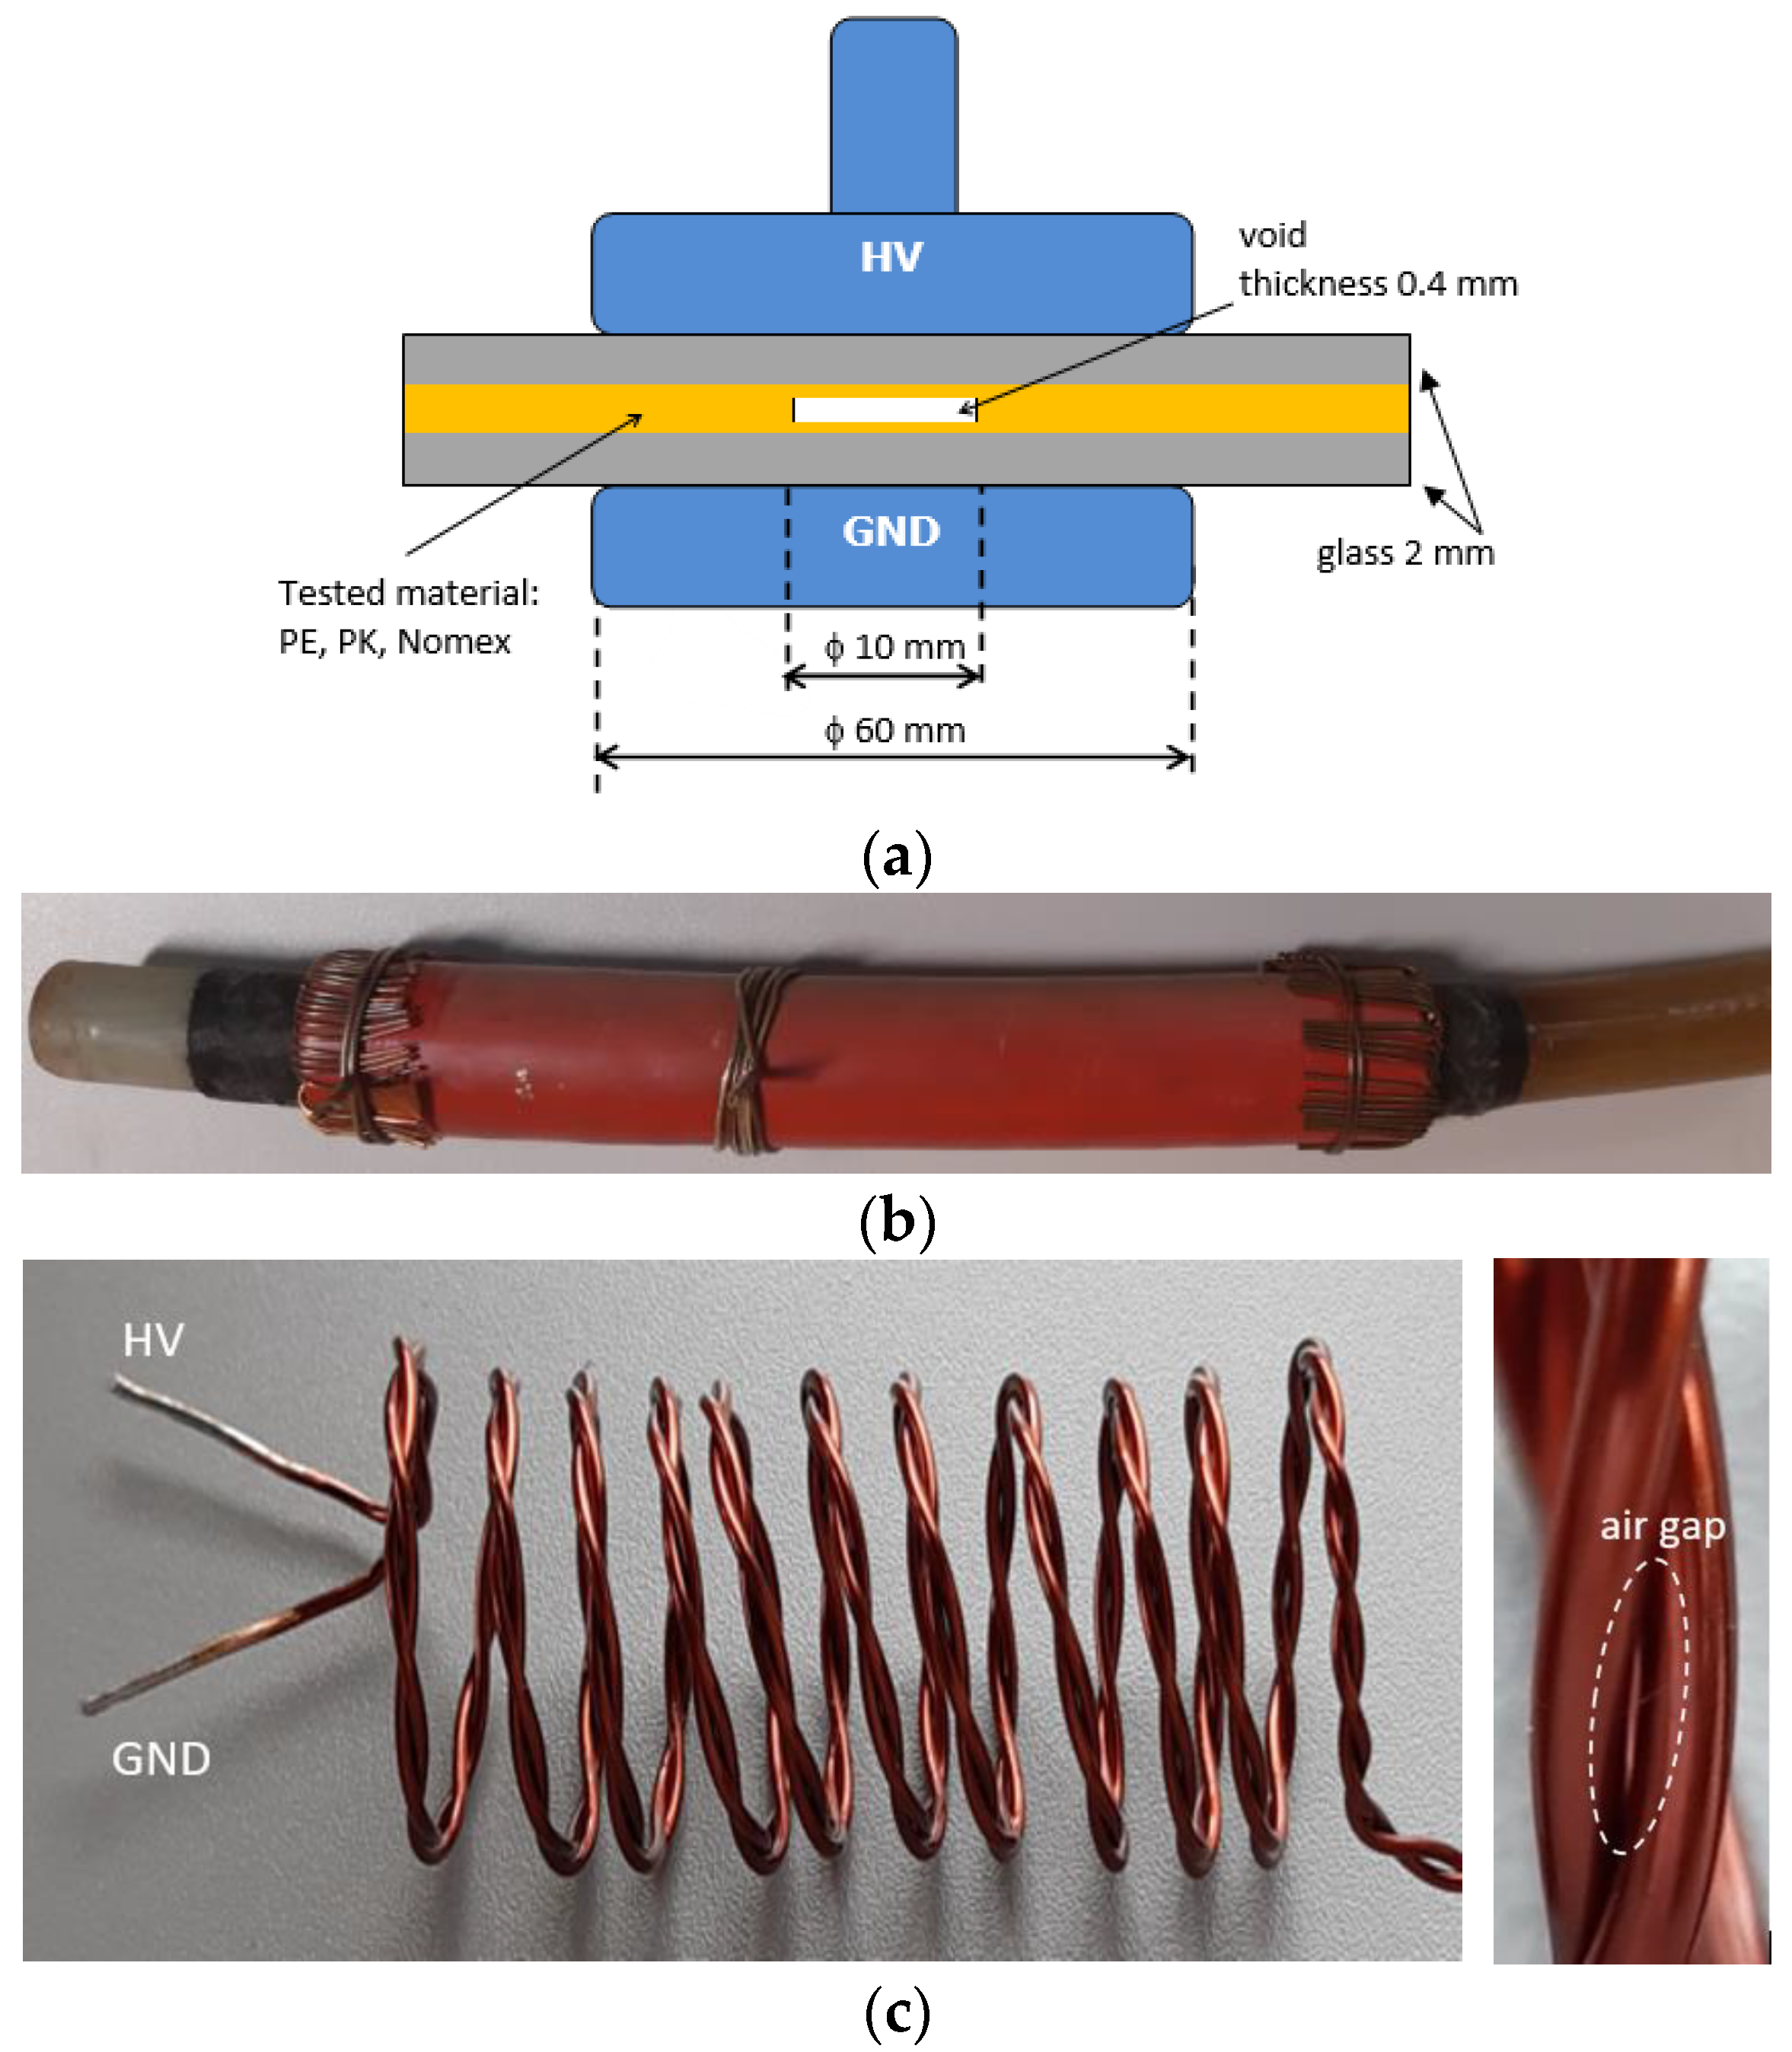
The experiments were carried out on various specimens that represented distinctive classes of high-voltage electrical insulating systems. The selections were deliberate, as these materials manifest distinct surface properties and application areas. The purpose of the experiments was to reveal partial discharge echo signals acquired in different dielectric materials. The first three specimens were tested in an arrangement that took the form of an embedded inclusion. The geometry of the sample was kept identical for the above cases. For comparison, the PD echo was captured in a cross-linked polyethylene (XLPE) power cable section that contained a defect as well as in a twisted-pair helical coil (TPHC) that represented motor-winding insulation. The geometry of the specimen and photos of the test objects are illustrated in Figure 2. The experiments were carried out on void specimens filled with air at atmospheric pressure and contained various insulating materials: polyethylene (PK), insulating paper (PK), and Nomex. The electrode arrangements consisted of plain stainless steel electrodes. The specimen that contained the gaseous inclusion was positioned between HV and GND electrodes with a 60 mm diameter and a curvature radius of 7 mm (Figure 2a). The layers of the tested material (100 × 100 mm) were pressed together and on both sides encased with glass plates (each 2 mm thick). In the middle layer of the tested sample, a punched circular void with a diameter of 10 mm and a thickness of 0.4 mm was positioned. The measurements were performed at room temperature.
Particularly in its cross-linked form, polyethylene (PE) is widely used in high-voltage fields—especially in power cables and accessories (as well as in gas insulated switchgears and transformers). It offers excellent electrical properties, high dielectric strength, good thermal stability, and long-term endurance. Insulating paper (PK) is widely used in high-voltage applications due to its excellent electrical insulation properties, mechanical strength, and thermal stability. In the past, it was used for power cables; nowadays, its main applications are in high-voltage bushings and power transformers. In the latter case, it is used to insulate the windings of power transformers, provide layer insulation, and provide a barrier between different components.
The third specimen was Nomex® Type 418 HV flexible paper, which refers to a family of heat-resistant and flame-resistant aramid fibers (temp. range of up to 370 °C). Nomex 418 is available in layer thicknesses of up to 0.36 mm; it is designed for various high-voltage applications, including transformer ground and layer insulation as well as motor conductors and coil wraps, phase insulation, and slot liners. This calendered blend of aramid and mica offers increased voltage endurance when subjected to discharge attacks. Manufactured with a 50% share of mica lamellas, Nomex 418 is intended for high-voltage equipment. In order to minimize PD risks, the manufacturer recommends that continuous stress (for example, in transformers) does not exceed 3.2 kV/mm. A main feature of aramid paper is the elimination of the main drawbacks of cellulose; these improvements include factors that are important for the operation of transformers and electrical machines, including increased resistance to high temperatures, higher immunity to PDs, and reduced moisture absorption compared to cellulose. In addition, PD echo detection has also been performed on real objects. First, it was a cross-linked polyethylene XLPE power cable section that contained a defect (Figure 2b). Defect identification and localization were the subject of different research activities; hence, it was used as an experimental object in the current study. The cable rated voltage was 12/20 kV; it contained an aluminum core with a cross-section of 120 mm2 and an insulation thickness of 5.5 mm. The maximum operating temperature of the cable was 90 °C for a nominal load. The second object was a twisted-pair helical coil that represented motor-winding insulation. Typically, TP samples are often used for dielectric tests in the turn insulation of electrical machines. TPHC consists of two insulated wires that are twisted together, which imitates the design of real electrical winding. In this way, TP samples enable a direct and supervised setup for measuring insulation integrity and are well-suited for repeatable verification. This type of specimen has been widely accepted as a standard test sample in various industry standards and specifications, e.g., in [50]. It consists of twisted-pair wires that were additionally screwed to form a coil (as depicted in Figure 2c). The main objective of designing TPHC was to elongate the specimen and extend the length of the twisted wires exposed to the electric field (thus, amplifying the effect). The twisted pair of enameled copper magnet wires with a diameter of 1.4 mm and an enamel coating thickness of 90 μm was shaped into a coil. The twist density applied in the experiments was 0.8 twists/cm. TPHC mimicked a typical turn-to-turn motor-winding insulation system. The length along the main axis of the coil was 80 mm, and the diameter was 30 mm. One wire in TPHC was attached to the HV terminal, and the second was connected to the ground (GND). The zoomed-in view shows a contact spot between adjacent wires with an air gap in Figure 2c.

4. Experimental Setup

The PD echo measurements were carried out in an extended phase-resolved mode (PRPD—phase-resolved PD) using the chopped sequence outlined in the previous section. The extension was composed of an additional detection of echo discharges in the introduced delay time as a distinctive difference when compared to conventional PD acquisition. For practical notation, the x-axis of the sinusoidal part is denoted in the phase angle units, whereas the voltage-less delay part is in time units. The sinusoidal base waveform was used with a period duration of T = 20 ms. The delay time was equal to td = 20 ms, which corresponded to a fill factor of ff = 1:2 (n = 1, m = 1, k = 1500). The total measurement time tm during all of the experiments was 60 s. The instrumentation and experimental setup for the PD echo acquisition are shown in Figure 3.
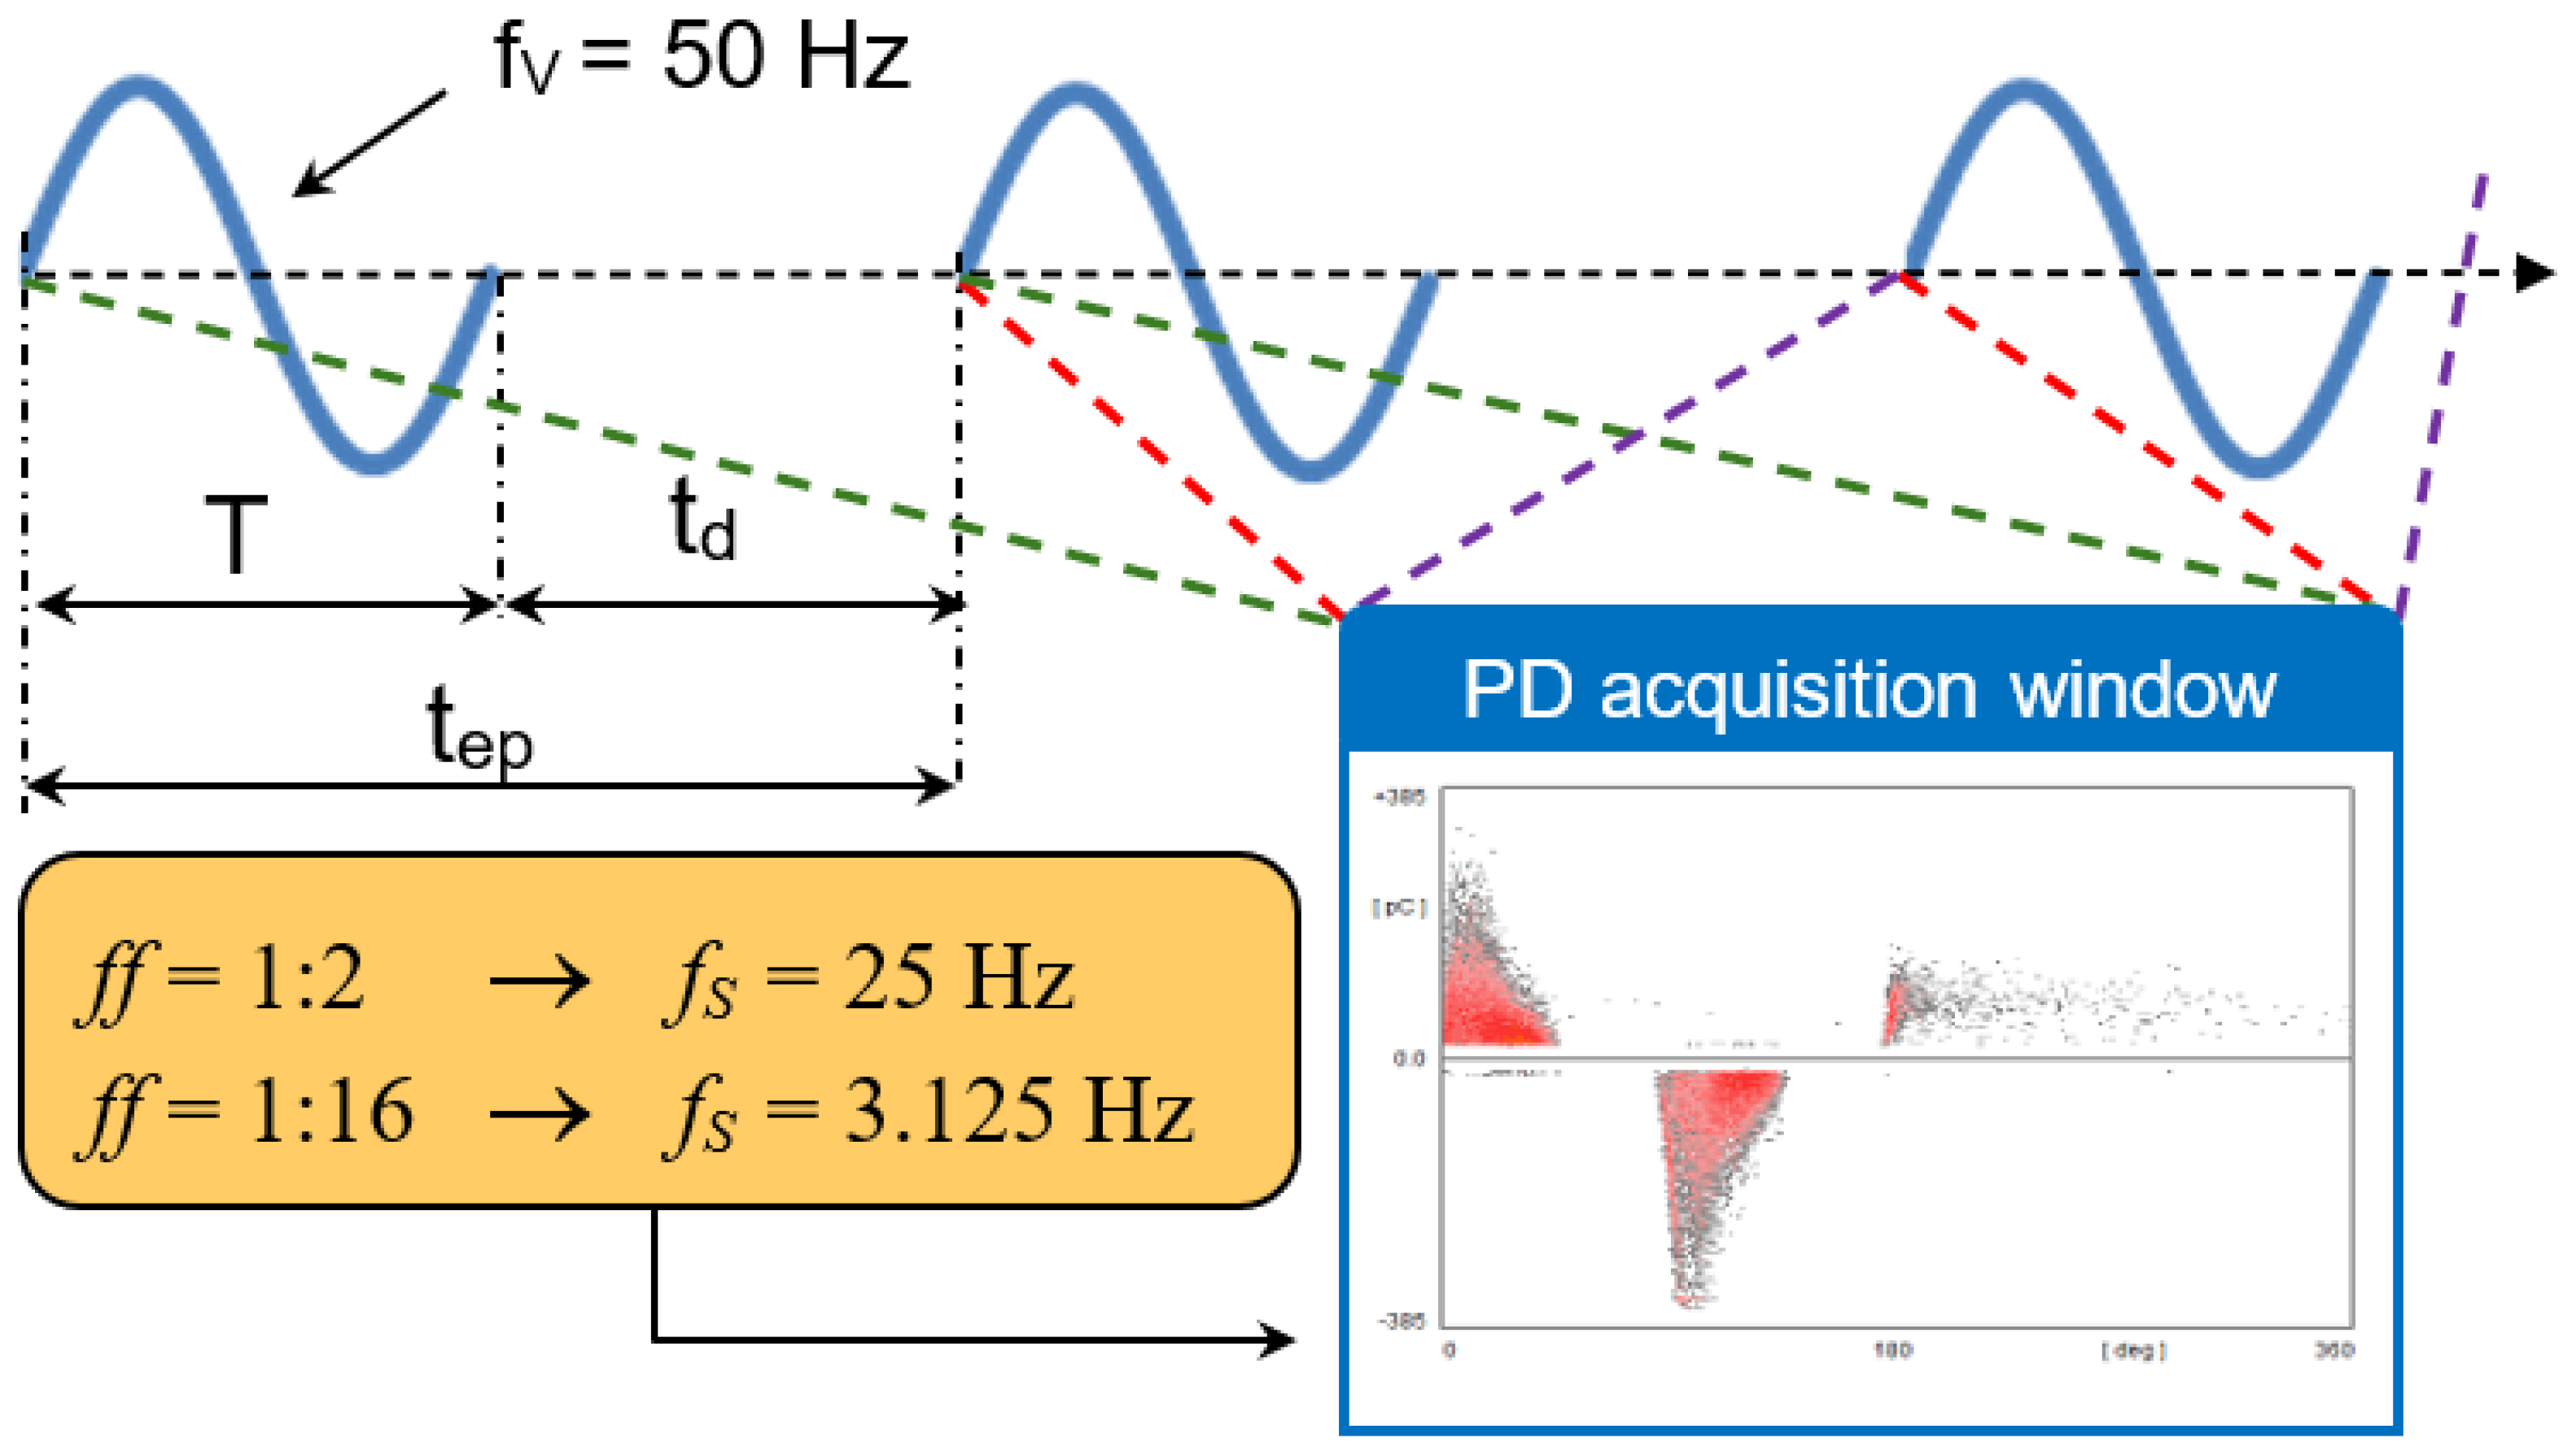
The discharge pulses were acquired by measuring impedance Zm and, additionally, for control purposes, by a wide-band current transformer (CT) that was placed in series with a test object (TO). A coupling capacitor Cc = 1 nF was connected in parallel to the test object to close the high-frequency path and filter out the power line component. After filtering and amplification in an FPA conditioning unit, the PD pulses were fed to either the oscilloscope for control (detection by CT) or to the PD analyzer (ICMSystem from Power Diagnostix, Aachen, Germany), which was connected to the host computer through a GPIB interface (detection by measuring impedance Zm). The PD image was accumulated in a matrix with dimensions of 256 × 256 channels (both scales in phase and magnitude). According to the definition, the x-axis was subdivided into two parts within the chopped sequence, i.e., corresponding to the base waveform and time delay. Both blocks had 128 channels since the filling factor that was applied in all of the measurements was ff = 1:2. The high-voltage power supply was delivered from a Trek 20/20B (Trek Inc., New York, NY, USA) HV amplifier that was controlled by a programable waveform generator. The test objects (TOs) were connected to the HV terminal with a protection impedance of Z = 0.5 MΩ. To control the voltage and phase position, an HV compensated divider (Tek P6015A, Tetronix Inc., Beaverton, OR, USA, 100 MΩ input impedance, division ratio 1:1000) was used; this is indicated by impedances Z1 and Z2 in Figure 3. The coherent synchronization between the high-voltage excitation (fV) and the discharge acquisition (fS) was important for the appropriate PD echo identification. In all the presented measurements, the frequency fV of a base sinusoidal waveform was 50 Hz, and the acquisition synchronization frequency was fs = 25 Hz. For PD observation and phase control with high resolution, a Tek DPO2014 (Tetronix Inc., Beaverton, OR, USA) oscilloscope was used. The relationship between acquisition frequency fS and base waveform frequency fV is presented graphically in Figure 4.
In the case when the PD echo clusters extend over the duration of the defined delay time, the acquisition at a higher fill factor may be executed in order to visualize the time to echo attribute te_dur. Such an example is provided in the results section for the XLPE power cable, where fill factor ff = 1:16 and acquisition frequency fs = 3.125 Hz was applied to capture the whole sequence frame-by-frame without overlap.

5. Experimental Results and Discussion

PD echoes were evaluated in the exemplary insulation systems of different power devices. The comparison was performed in a model setup that contained specimens of various materials such as polyethylene, insulating paper, and Nomex. In these cases, the model specimen contained an embedded void in the insulation. Additionally, the effect of the PD echo was shown in the XLPE power cable specimen that contained an insulating defect as well as in the motor-winding. In the latter case, the electric motor insulation was represented by model specimens in the form of a helical coil. The PD echo results were obtained at a fill factor of ff = 1:2 at different voltage levels. The main focus was on the partial discharge echo, comparing the attributes that reflected the surface conditions in the tested dielectric materials. Among the numerous features of PDE, the echo decay time was specifically investigated. PD echo signals were detected and recorded in the specimens using the chopped sequence described in the initial section. Echo discharges appeared within the subsequent delay periods of time td during all of the epochs. The period of the base waveform lasted for T = 20 ms, and the measurement time was tm = 60 s. In light of the comparative nature of the experiments, all specimens received the same number of active sinusoidal periods (represented by scaling factor s = ff·tm/T). Specifying the time spans of the voltage-less breaks occurring between each sinusoidal period td = 20 ms, the fill factors were 1:2 (s = 1500).

5.1. Experiments on a Void Embedded in Polyethylene (PE)

Polyethylene represents a class of power cable insulation. Figure 5a presents the PD echo measurement results obtained from the PE specimen at a voltage of 16 kV [58]. The PD inception voltage (PDIV) yielded 10.4 and 12.0 kV for the PD echo. The PD pulses depicted in Figure 5a contain the occurrence during the sinusoidal cycle (a typical AC sequence) and exhibited a consistent pattern characteristic of embedded voids, along with a second component that represented the delay time (which could have been associated with the DC) where the PD echo was observed. The characteristic moment in the sequence was transition point T0, where two PD mechanisms could be distinguished. The initial cluster (occurring at T0) illustrated the discharge characteristics associated with the sinusoidal component, while the second pattern, which displayed the PD echo, was created by individual pulses distributed throughout the voltage-less interval. As observed, the echo discharge time surpassed the delay time (i.e., 20 ms).

5.2. Experiments on a Void Embedded in Insulating Paper (PK)

Insulating paper is broadly used in high-voltage power transformers as winding insulation, layer insulation, and barriers between different components. The measurement results of the PDE in the insulating paper (PK) specimen obtained at 16 kV are shown in Figure 5b. The PDIV was at a level of 10.6 kV, whereas the inception level for the PD echo was at 15 kV.

5.3. Experiments on a Void Embedded in Nomex

Nomex is widely used as an insulating medium in power transformers, motors, and generators; in the cases of transformers, it is used mainly as layers, barrier insulation, and core wraps. In electrical machines, it is applied as slot liners and phase insulation. The measurement results of the PDE in the Nomex specimen obtained at 16 kV are shown in Figure 5c. The PDIV was at the threshold of 11.2 kV, whereas the inception level for the PD echo was at 14 kV.

5.4. Experiments on a Test Section of XLPE Power Cable

A PD echo was also acquired on a real power cable section (cable rated voltage of 12/20 kV, aluminum core, cross-section of 120 mm2, insulation thickness of 5.5 mm). This experimental part of the cable was identified in other experiments as containing the insulation defect in the form of an inclusion delamination at the core section; this element was separated for the PD echo experiments. The delamination was about 5 mm long and 1 mm thick. The measurement results of the XLPE power cable section obtained at 18 kV are shown in Figure 5d. The PDIV was 12.6 kV, and the corresponding PD echo inception threshold was 17.2 kV. As can be noticed, the spread of the PD echo pulses extended the assumed delay time (for ff = 1:2, this equaled 20 ms). Hence, the prolonged sequence was used with ff = 1:16 in order to determine the duration of echo cluster te_dur, i.e., with delay time td ranging to 320 ms. From the window shown in Figure 5e, the echo duration lasted up to 160 ms. The measurement time for this sequence was tm = 10 min.

5.5. Experiments on Helical Coil Motor-Winding Insulated Specimens

Additionally, the effect of a partial discharge echo could be observed on the specimen that represented machine insulation. The experiments were performed on a specially arranged sample that was composed of TP wires that were screwed to form a helical coil. The measurement results on this motor-representative winding specimen obtained at 650 V are shown in Figure 5f. The PDIV was at a level of 390 V, and the corresponding PD echo inception voltage was 570 V.
As one can see, the PD pattern was very similar in the case of our specimens that had the same geometry. However, the PD echo delivered additional information about the internal properties inside the defective delamination with a deteriorated inclusion. Comparisons of the parameters and their derived features for the tested samples are summarized in Table 1. The PD inception voltage (PDIV) was almost at the same level for all of the specimens (around 10 kV) because the specimen’s geometry was identical in every experiment. It should be noted that PDIV refers to the active excitation part of the chopped sequence, whereas PD echo inception (PDEchoIV) refers to the appearance of echo discharges within the delay time. There was a noticeable spread of PDEchoIV among the specimens, which reflected the different surface properties and conditions of the investigated materials; these amounted to 12.2, 15.1, and 14.4 kV for PE, PK, and Nomex, respectively. In the case of the XLPE power cable, this was 17.2 kV, and for the motor helical coil winding, it was 570 V. The Trek 152-1 was employed to measure the surface resistance Rsurf. Regarding the PE sample, this exceeded 1014 Ω. For the insulating paper (PK), it yielded 1.3 × 10¹⁴ Ω, and for Nomex, it was 4.1 × 10¹⁴ Ω.
Figure 5. Measurement results of partial discharge echo in various specimens: (a) polyethylene (PE) at 16 kV [58]; (b) insulating paper (PK) at 16 kV; (c) Nomex at 16 kV; (d) XLPE power cable at 18 kV; (e) XLPE power cable for ff = 1:16 and td = 320 ms; (f) helical coil representing motor-winding at 650 V; all measurements except (e) are for ff = 1:2 and td = 20 ms.
Energies 17 05114 g005
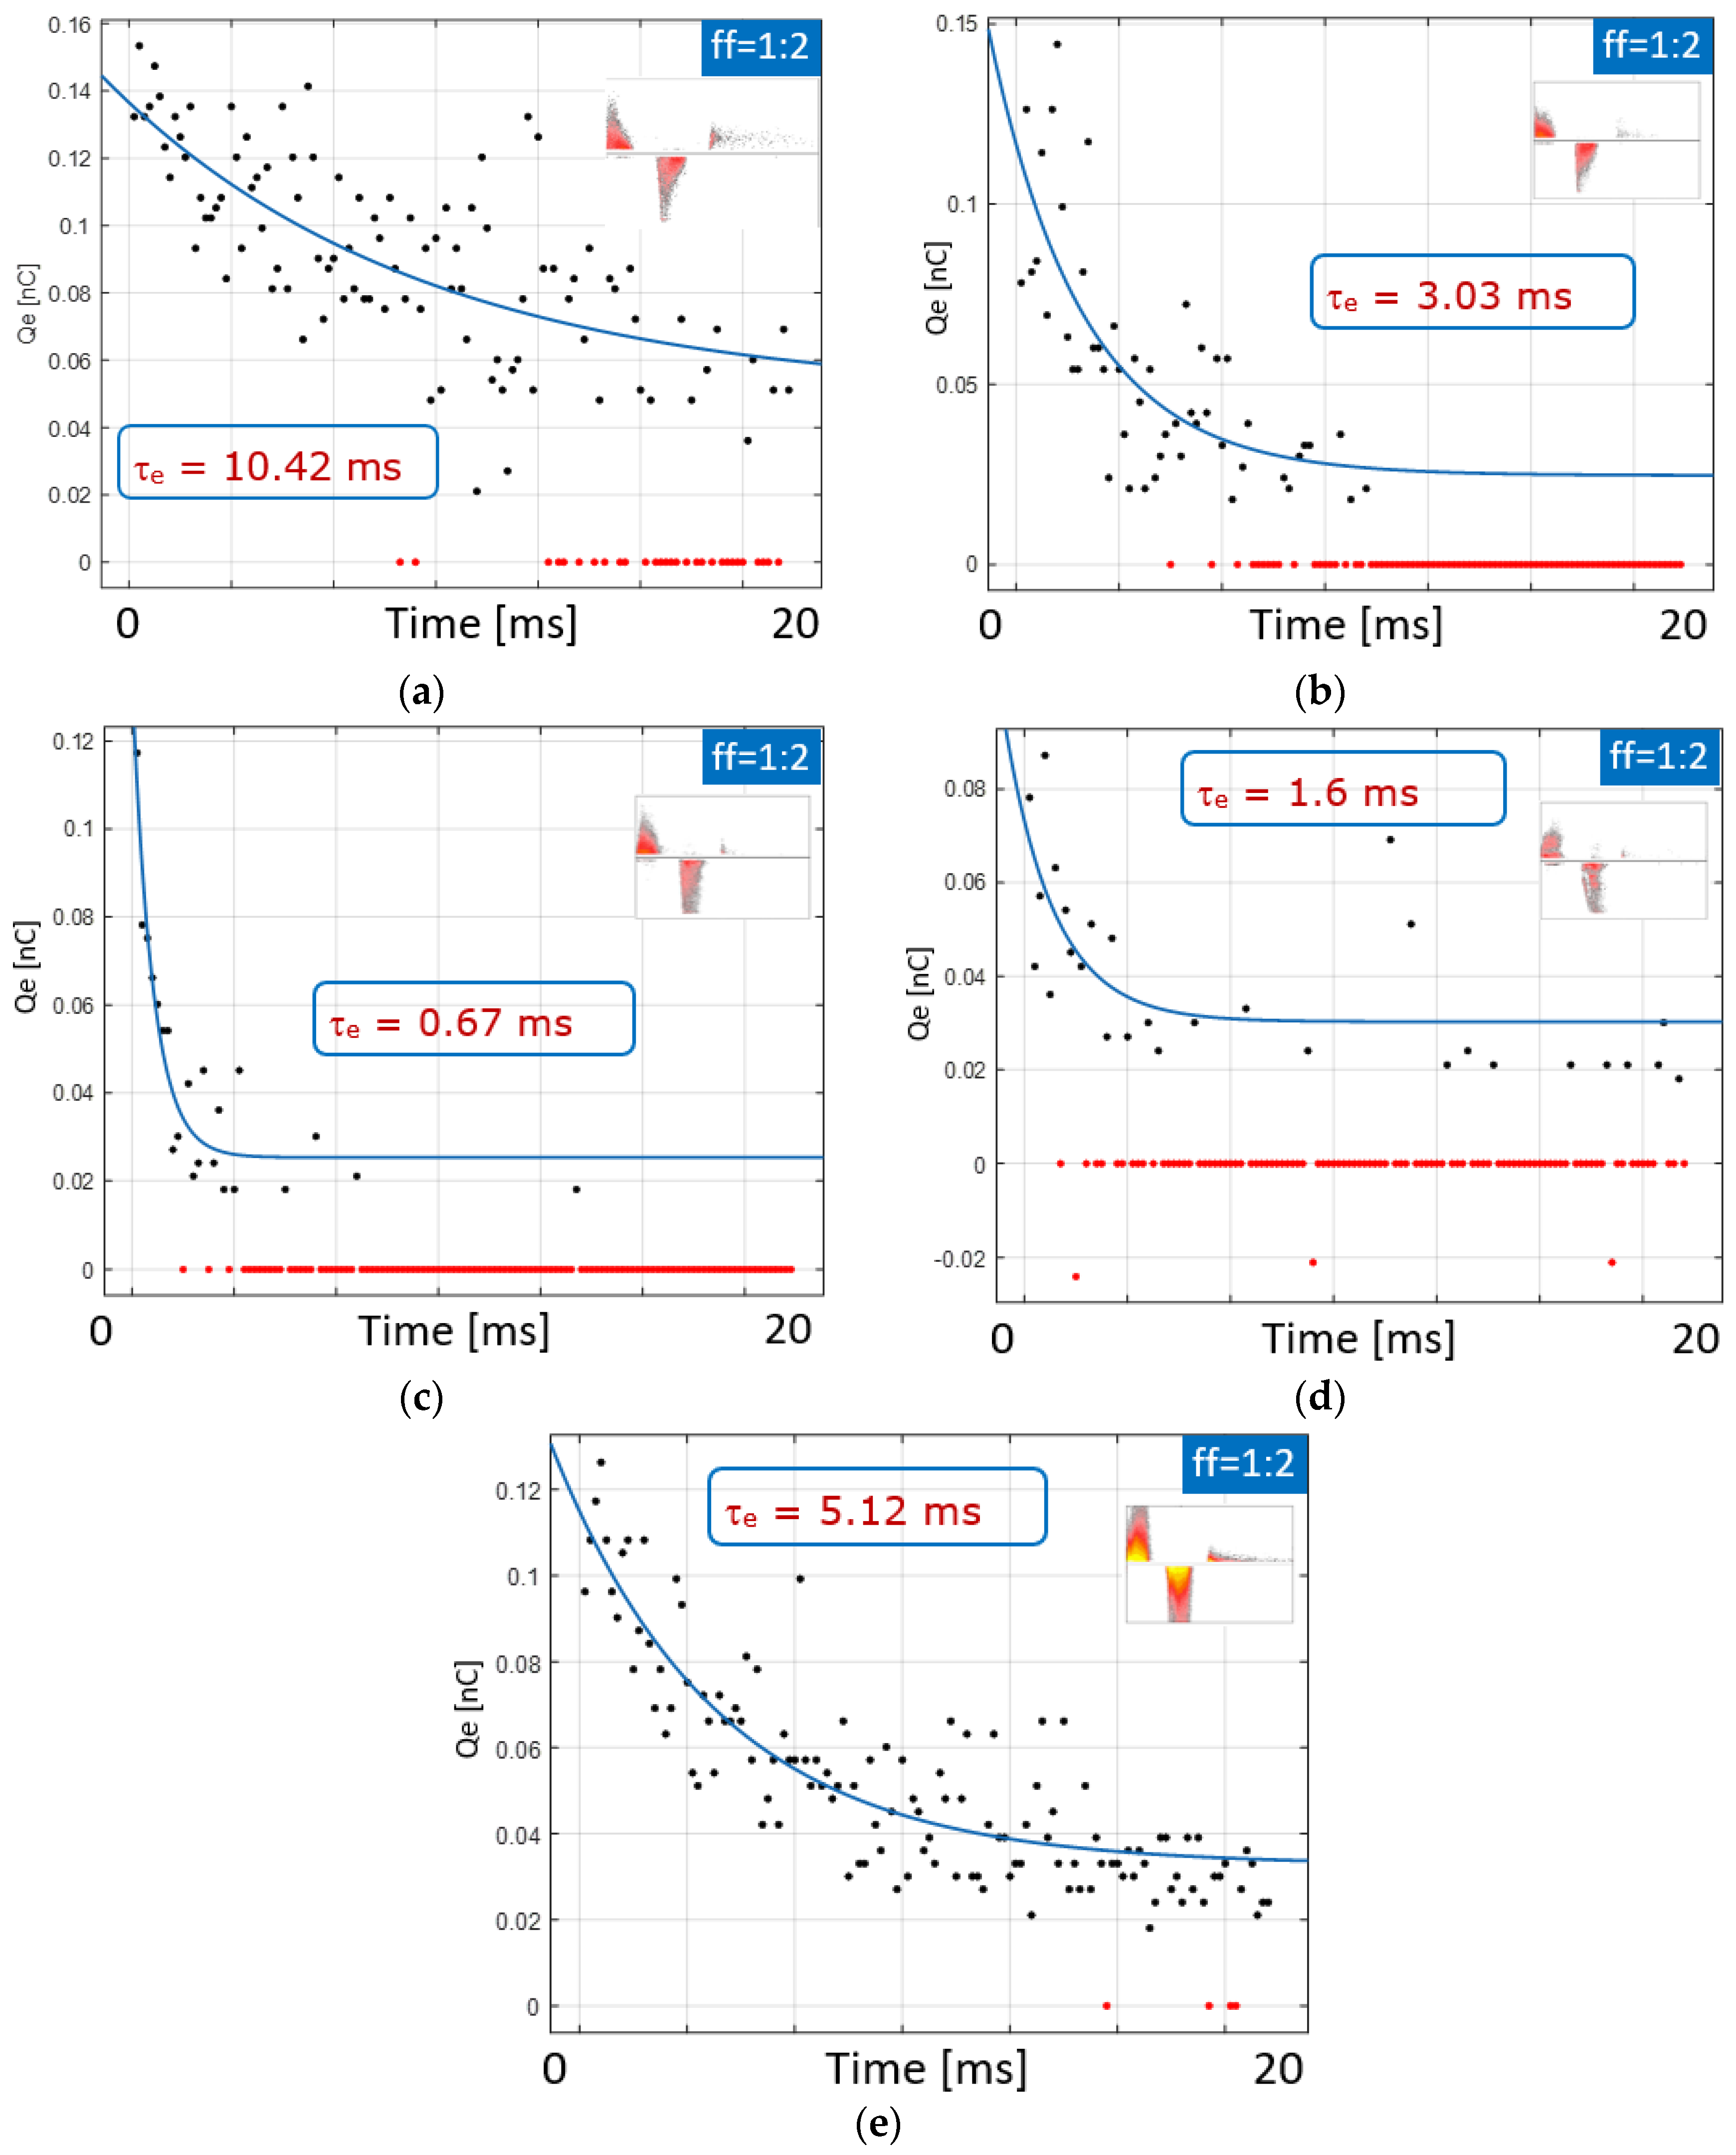
This paper aims to specifically explore a comparison of the PD echo decay times among various insulation systems. In this manner, the decay of the echo’s magnitude over a longer time frame can be linked to dielectric surface phenomena. The influence of void surface conductivity on the PD echo decay was noticeable in the investigated specimens. A dedicated analytical approach was applied to evaluate the decay time constant from the PRPD images shown in Figure 5. In the first step, the set of PD echo pulses was retrieved; then, the magnitude envelope was created. In the following step, the curve fitting procedure was applied using the Matlab (R2022a) Fit toolkit. It was assumed that the decay of the electric field Eq within the void, resulting from the internal surface and bulk processes, could be observed through the echo magnitude profile during the delay time td. Hence, this electric field component decay was attributed to the decline in the PDE magnitude. The internal Eq field was established due to the internally accumulated charges during the subsequent PD events. This mechanism can reflect to some extent the reverse or the previous discharges that took place during the decay phase of the HV impulse excitation. In this way, relationship Qe(t) was derived from PRPD image IPD. The highest charge level in each channel Q e t i that spanned along the whole matrix from j = 1 to N channels within the PD echo td part was extracted according to the following equation:
Q e t i = m a x j = 1 N [ I P D ( t i , j ) ]
In the next step, the partial discharge echo envelope waveform was fitted by the exponential function in the form of the following equation:
Q e t = a   · e t τ e + b
where Qe is the PDE envelope, and a and b are the coefficients of the fitted curve. The fitted waveforms are shown in Figure 6 for all of the investigated specimens. According to the above equation, the partial discharge echo was evaluated for all of the investigated test objects. Among the analyzed PDE attributes were envelope time constant decay τe, the lengths of the echo clusters until the last discharge events, recorded from the transition point T0 and expressed by te_dur, and the ratio of the echo peak magnitude Qe_max to PD charge absolute magnitude Qmax. The above results are summarized in Table 1.
For the PE sample, the envelope time constant τe was found to be 10.42 ms [58], 3.03 ms for PK, and 0.67 ms for Nomex. In the case of the XLPE power cable, this yielded 1.6 ms, and for the motor helical coil, it was 5.12 ms. Assessing the PDE te_dur time spreads, we obtained a much, much longer time than 20 ms for PE, 12 ms for PK, and 14 ms for Nomex. In the case of the XLPE cable and helical coil, the duration of the echo sequence was longer than 20 ms. A prolonged view was obtained for the XLPE cable after applying a fill factor of ff = 1:16, which corresponded to a delay time of td = 320 ms. The longest PD echo spread (in this case, even up to 160 ms) occurred after transition point T0. Considering the magnitude ratio, we obtained 0.47, 0.63, 0.33, 0.28, and 0.23 for the above-mentioned test objects, respectively (Table 1). There was an evident correlation between the surface resistance and the envelope time constant, revealing a longer decay time for higher surface resistance.
One can also notice that a higher surface resistance promoted a higher magnitude ratio. In this way, the distinct values of the surface conditions were captured by the attributes of the PD echo related to the charge neutralization and transport. Therefore, it can be observed that the order-of-magnitude difference in surface resistance was reflected in the echo decay time constant. This indicates a strong relationship between the behavior of the PD echo and the dynamics of surface processes regarding charge transport. The duration of a PD echo can last relatively long. As an example, the measurement in the XLPE cable shown in Figure 5e depicted a duration of above 160 ms. The recording used a chopped sequence with a fill factor of ff = 1:16 and td = 320 ms. For design and performance evaluations of motor-winding insulation, partial discharge measurements are usually performed on twisted-pair arrangements, thus imitating the element of a winding structure (as with TPHC). Lower-power machines usually utilize random windings that are made from round magnet wires. Winding-turn insulation is composed of enamel coatings on individual wires and a resin or gel impregnation between them. Since the turns are randomly distributed within a slot, they can be in close proximity to a number of other turns with distinct potentials. The tripped PD yielded a charge deposition after each event on the enamel TPHC insulation, creating an electrical field component. The long-term PD action resulted in chemical decomposition and a local temperature elevation, leading to the progress of the insulation deterioration and, as a consequence, to breakdown.
A PD echo is a direct consequence of individual partial discharges; hence, it will occur above PDIV. However, the exact relationship with the echo inception level requires further investigation. The partial discharges presented in Figure 5a,c,e within the sinusoidal period revealed a regular pattern that can be observed on the encapsulated void. It should be noted that the discharges in this part were overamplified and partly saturated on purpose, as the goal was to record the PD echoes with the proper dynamics. The PD echo block started at transition point T0, where the strong cumulation of the echo discharges occurred. The second PDE mode refers to the decaying part of the PD echo envelope, spreading out along the delay period of the chopped sequence. As can be noticed from the PD images, the echo discharge occurrences exceeded a delay time duration of 20 ms in some cases (corresponding to a fill factor of ff = 1:2).
The obtained experimental results exhibited a clear distinction among the PD echo patterns that were acquired for the specimens that represented different high-voltage insulation systems. The charge accumulation occurred due to the consecutive PD events; in this way, the deterioration and aging effects might have been revealed, thus providing additional insights into the conditions of the insulation system. The dielectric material surface conductivity impacted the PD mechanism; it especially influenced the charge transport and neutralization processes [16,46,53,55]. A higher conductivity attenuated the surface charge accumulation. The faster decay of the opposing local surface Eq field resulted in an elevation of the instantaneous resultant electric field strength within the gaseous space of the inclusion.
Further work will concentrate on incorporating PDE into diagnostic capabilities. Currently, a chopped excitation can be easily obtained using various power sources. Especially in the cases of waveforms that are not sinusoidal (such as PWM), power electronics modulators create great potential. In this way, PDE-based diagnostics might be incorporated into the control sequence; for example, in the case of a motor supplied by various drives. In terms of signal detection, an advantageous element is PD echo acquisition within the voltage-less part when active excitation is off; thus, the immunity to disturbances should be higher.

6. Conclusions

In conclusion, this article presents an extension of a conventional partial discharge approach called partial discharge echo, which can be applied to different classes of electrical insulation systems of power devices. This novel PD echo methodology may provide additional insights into surface conditions and charge transport phenomena in a non-invasive way. To demonstrate echo responses, measurements were carried out on various representative electrical insulating materials, such as polyethylene, insulating paper, and Nomex, as well as on a power cable section that contained a defect and a twisted-pair helical coil that represented motor-winding insulation. A PD echo may extract information about the condition of insulation—especially depicting its surface effects—whereas conventional PD measurements are focused on discharges that are driven by an external excitation voltage. Several characteristic PD echo-related measures were defined for further assessment and comparison; these attributes were composed of the PD and PD echo inception voltage relationship, the echo envelope time constant decay that reflected the charge dynamics, the lengths of the echo clusters until the final discharge event during the delay time, and the ratio of the echo peak magnitude to the PD charge’s absolute magnitude. As could be experimentally observed, the combination of the time–magnitude parameters that described the evolution of a PD echo reflected material-specific deterioration progress. Two partial discharge echo modes were identified, occurring at around transition point T0: one was fast (just around the spot), and the other one was longer (spanning along the time delay). This paper addressed the latter mode. It seems that further analyses of the effects around the transition point might inspire another direction in partial discharge echo investigations in the future. Future research may also refer to the PDE at different excitation waveforms, not only the sinusoidal one. The semi-square and PWM waveforms will be especially interesting. In that case, the effects occurring around transition point T0 (first mode) may be evaluated. This scenario will be attractive for base waveforms representing higher frequencies, e.g., at PWM excitation. It is believed that analysis of the effect just around transition point T0 might inspire another direction in PD echo analysis.
It was shown that PD echo attributes provided distinctive values for materials that represented orders-of-magnitude-different surface conditions, such as surface resistance. A comparison of the PD echo decay times among various insulation systems was depicted, reflecting the dielectric surface phenomena. Special attention was paid toward extracting this parameter, presenting an adequate methodology, and comparing it with various materials (for example, yielding 10.42 ms for the polyethylene specimen and 0.67 ms for Nomex). The PD inception voltage relationship between conventional PD thresholds and echo ones was also investigated. It was noted that the duration of the PD echo clusters could last much longer than the base period—even up to 160 ms in the case of the XLPE power cable. In this way, PD echo offers new diagnostic attributes that expand the evaluation of insulation conditions that were not possible by conventional PD measurements. The presented approach offers an extended quantitative assessment of the condition of HV electrical insulation, including the detection, measurement methodology, and interpretation of PD echo.

Funding

This research received no external funding.

Data Availability Statement

The original contributions presented in the study are included in the article, further inquiries can be directed to the corresponding author.

Acknowledgments

The author would like to thank Eng. Kazimierz Chudyba for his help with the experimental setup arrangement.

Conflicts of Interest

The author declares no conflicts of interest.

References

  1. Rajashekara, K. Power Conversion Technologies for Automotive and Aircraft Systems. IEEE Electrif. Mag. 2014, 6, 50–60. [Google Scholar] [CrossRef]
  2. Cheng, P.; Kong, H.; Ma, J.; Jia, L. Overview of Resilient Traction Power Supply Systems in Railways with Interconnected Microgrid. CSEE J. Power Energy Syst. 2021, 7, 1122–1132. [Google Scholar]
  3. Xu, L.; Guerrero, J.M.; Lashab, A.; Wei, B.; Bazmohammadi, N.; Vasquez, J.C.; Abusorrah, A. A Review of DC Shipboard Microgrids—Part II: Control Architectures, Stability Analysis, and Protection Schemes. IEEE Trans. Power Electron. 2022, 37, 4105–4120. [Google Scholar] [CrossRef]
  4. Sarlioglu, B.; Morris, C.T. More Electric Aircraft: Review, Challenges, and Opportunities for Commercial Transport Aircraft. IEEE Trans. Transp. Electrif. 2015, 1, 54–64. [Google Scholar] [CrossRef]
  5. Chang, G.; Wu, Y.; Shao, S.; Huang, Z.; Long, T. DC Bus Systems for Electrical Ships. Electrif. Mag. 2020, 9, 28–39. [Google Scholar] [CrossRef]
  6. Haxhiu, A.; Abdelhakim, A.; Kanerva, S.; Bogen, J. Electric Power Integration Schemes of the Hybrid Fuel Cells and Batteries-Fed Marine Vessels—An Overview. IEEE Trans. Transp. Electrif. 2021, 8, 1885–1905. [Google Scholar] [CrossRef]
  7. Moghadam, D.E.; Herold, C.; Zbinden, R. Effects of Resins on Partial Discharge Activity and Lifetime of Insulation Systems Used in eDrive Motors and Automotive Industries. In Proceedings of the 2020 IEEE Electrical Insulation Conference (EIC), Knoxville, TN, USA, 22 June–3 July 2020. [Google Scholar]
  8. Borghei, M.; Ghassemi, M. Classification of Partial Discharge in Electric Aircraft based on Short-Term Behavior of Insulation Systems. In Proceedings of the AIAA/IEEE Electric Aircraft Technologies Symposium (EATS), Virtual Event, 9–11 August 2021. [Google Scholar]
  9. Biswas, B.; Du, B.X.; Florkowski, M.; Hammarström, T.; Judd, M.D.; Kołtunowicz, W.; Kordi, B.; Kuniewski, M.; Ma, G.; Pan, C.; et al. Trends in Diagnostics and Monitoring of High-Voltage Insulation. IEEE Electr. Insul. Mag. 2024, 40, 6–26. [Google Scholar] [CrossRef]
  10. Niemeyer, L. A generalized approach to partial discharge modeling. IEEE Trans. Dielectr. Electr. Insul. 1995, 2, 510–528. [Google Scholar] [CrossRef]
  11. Stone, G.C.; Culbert, I.; Boulter, E.A.; Dhirani, H. Electrical Insulation for Rotating Machines; Wiley-IEEE Press: Hoboken, NJ, USA, 2014. [Google Scholar]
  12. Hammarström, T. Multilevel PWM: A tool to explore insulation PD characteristics. IEEE Trans. Instrum. Meas. 2019, 68, 4075–4084. [Google Scholar] [CrossRef]
  13. CIGRE JWG A2/D1.51; Improvements to PD Measurements for Factory and Site Acceptance Tests of Power Transformers. CIGRE Technical Brochure 861; CIGRE: Paris, France, 2022.
  14. Kołtunowicz, W.; Behrmann, G.; Bolze, M.; Caprara, A.; Coapes, G.; Cook, F.; Hama, H.; Huecker, T.; Johnstone, C.; Neuhold, S.; et al. CIGRE WG D1.66, Requirements for Ultra-High Frequency Partial Discharge Monitoring Systems for Gas Insulated Switchgear; CIGRE General Session; CIGRE: Paris, France, 2022; p. 10883. [Google Scholar]
  15. Li, S.; Li, J. Condition monitoring and diagnosis of power equipment: Review and prospective. High Volt. 2017, 2, 82–91. [Google Scholar] [CrossRef]
  16. Florkowski, M. Partial Discharges in High-Voltage Insulating Systems—Mechanisms, Processing, and Analytics; AGH Press: Kraków, Poland, 2020; ISBN 978-83-66364-75-2. [Google Scholar]
  17. Kaziz, S.; Said, M.H.; Imburgia, A.; Maamer, B.; Flandre, D.; Romano, P.; Tounsi, F. Radiometric Partial Discharge Detection: A Review. Energies 2023, 16, 1978. [Google Scholar] [CrossRef]
  18. Florkowski, M. Classification of Partial Discharge Images Using Deep Convolutional Neural Networks. Energies 2020, 13, 5496. [Google Scholar] [CrossRef]
  19. Kumar, H.; Shafiq, M.; Kauhaniemi, K.; Elmusrati, M. A Review on the Classification of Partial Discharges in Medium-Voltage Cables: Detection, Feature Extraction, Artificial Intelligence-Based Classification, and Optimization Techniques. Energies 2024, 17, 1142. [Google Scholar] [CrossRef]
  20. Lu, S.; Chai, H.; Sahoo, A.; Phung, B.T. Condition Monitoring Based on Partial Discharge Diagnostics Using Machine Learning Methods: A Comprehensive State-of-the-Art Review. IEEE Trans. Diel. Electr. Insul. 2020, 27, 1861–1888. [Google Scholar] [CrossRef]
  21. Sukma, T.R.; Khayam, U.; Suwarno; Sugawara, R.; Yoshikawa, H.; Kozako, M.; Hikita, M.; Eda, O.; Otsuka, M.; Kaneko, H.; et al. Classification of Partial Discharge Sources using Waveform Parameters and Phase-Resolved Partial Discharge Pattern as Input for the Artificial Neural Network. In Proceedings of the Condition Monitoring and Diagnosis (CMD), Perth, WA, Australia, 23–26 September 2018; pp. 1–6. [Google Scholar] [CrossRef]
  22. Illias, H.; Yuan, T.S.; Bakar, A.H.A.; Mokhlis, H.; Chen, G.; Lewin, P.L. Partial discharge patterns in high voltage insulation. In Proceedings of the IEEE International Conference on Power and Energy (PECon), Kota Kinabalu, Malaysia, 2–5 December 2012; pp. 750–755. [Google Scholar] [CrossRef]
  23. Wu, M.; Cao, H.; Cao, J.; Nguyen, H.L.; Gomes, J.B.; Krishnaswamy, S.P. An overview of state-of-the-art partial discharge analysis techniques for condition monitoring. IEEE Electr. Insul. Mag. 2015, 31, 22–35. [Google Scholar] [CrossRef]
  24. Hussain, G.A.; Hassan, W.; Mahmood, F.; Shafiq, M.; Rehman, H.; Kay, J.A. Review on Partial Discharge Diagnostic Techniques for High Voltage Equipment in Power Systems. IEEE Access 2023, 11, 51382–51394. [Google Scholar] [CrossRef]
  25. Florkowski, M. Influence of harmonics on partial discharge measurements and interpretation of phase-resolved patterns. Elsevier Meas. 2022, 196, 111198. [Google Scholar] [CrossRef]
  26. Florkowski, M. Effect of Interplay between Parallel and Perpendicular Magnetic and Electric Fields on Partial Discharges. Energies 2023, 16, 4847. [Google Scholar] [CrossRef]
  27. Diban, B.; Mazzanti, G.; Marzinotto, M.; Battaglia, A. Life Estimation of HVDC Cables Subjected to Fast and Slow Polarity Reversals. Energies 2024, 17, 3182. [Google Scholar] [CrossRef]
  28. Mazzanti, G.; Diban, B. Parametric Analysis of HVDC Extruded Cable Reliability for Different Cable Designs. In Proceedings of the IEEE Conference on Electrical Insulation and Dielectric Phenomena (CEIDP), East Rutherford, NJ, USA, 18–30 October 2020; pp. 475–478. [Google Scholar] [CrossRef]
  29. Florkowski, M.; Kuniewski, M.; Mikrut, P. Effects of mechanical transversal bending of power cable on partial discharges and dielectric-loss evolution. IEEE Trans. Dielectr. Electr. Insul. 2024. [Google Scholar] [CrossRef]
  30. Nielsen, T.V.M.; Jakobsen, S.; Savaghebi, M. Dynamic Rating of Three-Core XLPE Submarine Cables Considering the Impact of Renewable Power Generation. In Proceedings of the 2019 IEEE 13th International Conference on Compatibility, Power Electronics and Power Engineering (CPE-POWERENG), Sonderborg, Denmark, 23–25 April 2019; pp. 1–6. [Google Scholar]
  31. Hestad, Ø.; Runde, M.; Enoksen, H.; Magnusson, N. Modeling of Internal Pressure Dynamics in Mass-Impregnated Nondraining HVDC Cables. IEEE Trans. Dielectr. Electr. Insul. 2022, 29, 1135–1142. [Google Scholar] [CrossRef]
  32. Rizzo, G.; Romano, P.; Imburgia, A.; Ala, G. Partial Discharges in HVDC Cables—The Effect of the Temperature Gradient During Load Transients. IEEE Trans. Dielectr. Electr. Insul. 2021, 28, 767–1774. [Google Scholar] [CrossRef]
  33. Rosle, N.; Muhamad, N.A.; Rohani, M.N.K.H.; Jamil, M.K.M. Partial Discharges Classification Methods in XLPE Cable: A Review. IEEE Access 2021, 9, 133258–133273. [Google Scholar] [CrossRef]
  34. Zhang, X.; Pang, B.; Liu, Y.; Liu, S.; Xu, P.; Li, Y.; Liu, Y.; Qi, L.; Xie, Q. Review on Detection and Analysis of Partial Discharge along Power Cables. Energies 2021, 14, 7692. [Google Scholar] [CrossRef]
  35. Mazzanti, G. The Practical Use of the DMM Model for Life Estimation of HVDC Cables subjected to Qualification Load Cycles. IEEE Trans. Dielectr. Electr. Insul. 2024, 31, 1899–1908. [Google Scholar] [CrossRef]
  36. Mikrut, P.; Zydroń, P. Numerical Modeling of PD Pulses Formation in a Gaseous Void Located in XLPE Insulation of a Loaded HVDC Cable. Energies 2023, 16, 6374. [Google Scholar] [CrossRef]
  37. Lee, K.; Fereydoonian, M.; Nia, M.S.S.; Lee, W. A Comprehensive Review of Partial Discharge Modeling and Measurement in WBG-based AC Machine Drives. In Proceedings of the 2023 IEEE Transportation Electrification Conference & Expo (ITEC), Detroit, MI, USA, 21–23 June 2023; pp. 1–6. [Google Scholar] [CrossRef]
  38. Diab, M.; Zhou, W.; Emersic, C.; Yuan, X.; Cotton, I. Impact of PWM Voltage Waveforms on Magnet Wire Insulation Partial Discharge in SiC-Based Motor Drives. IEEE Access 2021, 9, 156599–156612. [Google Scholar] [CrossRef]
  39. Wang, P.; Li, P.; Akram, S.; Meng, P.; Zhu, G.; Montanari, G.C. Considering the Parameters of Pulse Width Modulation Voltage to Improve the Signal-to-Noise Ratio of Partial Discharge Tests for Inverter-Fed Motors. IEEE Trans. Ind. Electron. 2022, 69, 4545–4554. [Google Scholar] [CrossRef]
  40. Vala, S.S.; Mirza, A.B.; Emon, A.I.; Luo, F. A Review of Partial Discharge in Stator Winding of Rotating Machines Fed by Voltage Source PWM Motor Drives. IEEE Trans. Ind. Appl. 2024, 60, 3790–3807. [Google Scholar] [CrossRef]
  41. Zang, Y.; Niasar, M.G.; Ganeshpure, D.A.; Qian, Y.; Sheng, G.; Jiang, X.; Vaessen, P. Partial Discharge Behavior of Typical Defects in Power Equipment Under Multilevel Staircase Voltage. IEEE Trans. Dielectr. Electr. Insul. 2022, 29, 1563–1573. [Google Scholar] [CrossRef]
  42. Rohner, G.; Gfrörer, T.; Niklaus, P.S.; Huber, J.; Bortis, D.; Schweizer, M.; Kolar, J.W. Hardware-Based Comparative Analysis of Multilevel Inverter Topologies for Integrated Motor Drives Considering Overload Operation. IEEE Open J. Power Electron. 2023, 4, 934–944. [Google Scholar] [CrossRef]
  43. Florkowski, M.; Błaszczyk, P.; Klimczak, P. Partial discharges in twisted-pair magnet wires subject to multilevel PWM pulses. IEEE Trans. Dielectr. Electr. Insul. 2017, 24, 2203–2210. [Google Scholar] [CrossRef]
  44. Lebey, T.; Rumi, A.; Cavallini, A. Challenges for Electrical Insulation Systems in High Voltage Aviation Applications. IEEE Electr. Insul. Mag. 2022, 38, 5–11. [Google Scholar] [CrossRef]
  45. Rumi, A.; Marinelli, J.G.; Barater, D.; Cavallini, A.; Seri, P. The Challenges of Reliable Dielectrics in Modern Aerospace Applications: The Hazard of Corona Resistant Materials. IEEE Trans. Transp. Electrif. 2022, 8, 4646–4653. [Google Scholar] [CrossRef]
  46. Fabiani, D.; Montanari, G.C.; Cavallini, A.; Mazzanti, G. Relation between space charge accumulation and partial discharge activity in enameled wires under PWM-like voltage waveforms. IEEE Trans. Dielectr. Electr. Insul. 2004, 11, 393–405. [Google Scholar] [CrossRef]
  47. Ji, Y.; Giangrande, P.; Zhao, W.; Wang, H.; Madonna, V.; Zhang, H.; Galea, M. Moving Toward Partial Discharge-Free Design of Electrical Machines for More Electric Aircraft Applications. IEEE Trans. Transp. Electrif. 2023, 9, 4668–4679. [Google Scholar] [CrossRef]
  48. IEC 60270; High-Voltage Test Techniques—Partial Discharge Measurements. IEC: Geneva, Switzerland, 2000.
  49. IEC TS 62478; High Voltage Test Techniques—Measurement of Partial Discharges by Electromagnetic and Acoustic Methods. IEC: Geneva, Switzerland, 2016.
  50. IEC 60034-27-1:2017; Rotating Electrical Machines—Part 27-1: Off-Line Partial Discharge Measurements on the Winding Insulation. IEC: Geneva, Switzerland, 2017.
  51. Florkowski, M.; Florkowska, B.; Zydron, P. Partial discharge echo obtained by chopped sequence. IEEE Trans. Dielectr. Electr. Insul. 2016, 23, 1294–1302. [Google Scholar] [CrossRef]
  52. Gutfleisch, F.; Niemeyer, L. Measurement and Simulation of PD in Epoxy Voids. IEEE Trans. Dielectr. Electr. Insul. 1995, 2, 729–743. [Google Scholar] [CrossRef]
  53. Pan, C.; Wu, K.; Chen, G.; Gao, Y.; Florkowski, M.; Lv, Z.; Tang, J. Understanding Partial Discharge Behavior from the Memory Effect Induced by Residual Charges: A Review. IEEE Trans. Dielectr. Electr. Insul. 2020, 27, 1951–1965. [Google Scholar] [CrossRef]
  54. McAllister, I.W. Decay of charge deposited on the wall of gaseous void. IEEE Trans. Electr. Insul. 1992, 27, 1202–1207. [Google Scholar] [CrossRef]
  55. Wu, K.; Okamoto, T.; Suzuoki, Y. Effects of discharge area and surface conductivity on partial discharge behavior in voids under square voltages. IEEE Trans. Dielectr. Electr. Insul. 2007, 14, 461–470. [Google Scholar] [CrossRef]
  56. Florkowski, M.; Kuniewski, M. Correspondence Between Charge Accumulated in Voids by Partial Discharges and Mapping of Surface Charge with PEA Detection. IEEE Trans. Dielectr. Electr. Insul. 2022, 29, 2199–2208. [Google Scholar] [CrossRef]
  57. Endo, K.; Miyake, H.; Tanaka, Y. Partial Discharge Detection by Space Charge Distribution Measurement. In Proceedings of the 30th International Symposium on Discharges and Electrical Insulation in Vacuum (ISDEIV), Okinawa, Japan, 25–30 June 2023; pp. 96–99. [Google Scholar] [CrossRef]
  58. Florkowski, M. Measurement of partial discharge echo and extraction of decay parameters. Measurement 2024, 238, 115338. [Google Scholar] [CrossRef]
Figure 1. Chopped sequence formation based on the superposition of the base waveform and the delay time for PD echo excitation. T—base waveform period; tep—duration of the epoch; td—delay time duration. Definitions of partial discharge echo attributes: τe—echo decay time constant; te_dur—duration of the echo clusters up to the last discharge event within the delay time; Qmax and Qemax—max discharge magnitude within the base waveform and in the echo part, respectively; T0—transition point.
Energies 17 05114 g001
Figure 2. Test objects used in PD echo experiments: (a) embedded void geometry; (b) section of XLPE power cable containing a defect; (c) twisted-pair helical coil (representing motor-winding insulation). The zoomed-in view shows the contact spot between adjacent wires containing an air gap.
Energies 17 05114 g002
Figure 3. Setup and instrumentation for PD echo detection and acquisition based on chopped sequence in various test objects (TO): fV—HV excitation frequency; fS—acquisition synchronization frequency; Cc—coupling capacitor; CT—wide-band current transformer; FPA—filter and preamplifier; Zm—measuring impedance; Z1, Z2—compensated divider; Z—filtering and protection impedance.
Energies 17 05114 g003
Figure 4. Visualization of chopped sequence and PD acquisition window positioning. Relationship between base waveform frequency fV (50 Hz) and corresponding acquisition frequency fS. For a fill factor of ff = 1:2 and ff = 1:16, fs yielded 25 and 3.125 Hz, respectively.
Energies 17 05114 g004
Figure 6. Approximation of PD echo envelope using an exponential function to evaluate the time constant of the echo τe for the following specimens: (a) polyethylene (PE) [58]; (b) insulating paper (PK); (c) Nomex; (d) XLPE power cable; (e) helical coil representing motor-winding (all measurements for ff = 1:2 and td = 20 ms).
Energies 17 05114 g006
Table 1. Partial discharge echo attributes in investigated test objects.
SpecimenRsurf
[Ω]
PDIV
[kV]
PDEchoIV
[kV]
τe
[ms]
te_dur
[ms]
Qe_max/Qmax
[-]
Polyethylene (PE)>101410.412.210.42>>200.47
Insulating paper (PK)1.3·101310.615.13.03120.63
Nomex4.1·101211.214.40.67140.33
XLPE power cable-12.617.21.601600.28
Helical coil-0.3900.5705.12>200.23
Disclaimer/Publisher’s Note: The statements, opinions and data contained in all publications are solely those of the individual author(s) and contributor(s) and not of MDPI and/or the editor(s). MDPI and/or the editor(s) disclaim responsibility for any injury to people or property resulting from any ideas, methods, instructions or products referred to in the content.