1. Introduction
The building sector, a significant contributor to global energy consumption and greenhouse gas emissions [
1], plays a pivotal role in the REPowerEU initiative [
2], which aims to enhance energy efficiency and accelerate the adoption of renewable energy sources across the European Union (EU). The same study points out that space heating accounted for a substantial portion of final energy consumption in European households in 2021, constituting 64.4% of total residential energy usage. In an effort to enhance the energy performance of buildings across the EU, the European Commission has established the Energy Performance of Buildings Directive (EPBD), with a target of achieving a carbon-neutral building stock by the year 2050 [
3]. In addition, the EU has set a target of generating 80% of its electricity from renewable energy sources (RESs) by 2050, with electricity accounting for half of the total final energy demand. However, the intermittent nature of RESs, characterized by fluctuations in power generation, poses a significant challenge, leading to periods of inactivity and sudden energy fluctuations. To tackle these challenges, harnessing the flexibility of the entire energy system, including buildings, is crucial. This involves optimizing energy consumption, enhancing efficiency, and integrating RESs. The use of sustainable construction materials is also gaining traction, with recent studies highlighting innovative materials such as micro-steel-fiber-reinforced recycled aggregate concrete, which enhances the mechanical performance and sustainability of building structures through the inclusion of recycled materials and steel fibers [
4]. Another study emphasizes the potential of fiber-reinforced recycled aggregate concrete to improve toughness and durability under high-strain-rate conditions, promoting its wider adoption in construction [
5]. A key tool in this endeavor is the Smart Readiness Indicator (SRI) [
6], which assesses buildings’ technological readiness for incorporating smart technologies to improve energy efficiency and overall performance.
In light of the ongoing energy crisis, the increasing global energy demands, and the pressing environmental concerns, including climate change, the effective monitoring and management of energy use in buildings have become paramount. The inefficient control and operation of building systems contribute significantly to energy losses. Even in newly constructed buildings, inefficient control of Heating, Ventilation, and Air-Conditioning (HVAC) systems can increase primary energy consumption by 20% or more [
7]. According to Ref. [
8], optimizing the HVAC systems through a Building Automation System (BAS) stands out as one of the most efficient methods for achieving energy savings in a building. This approach proves to be cost-effective, as it utilizes the existing equipment. Particularly, when coupled with advanced control strategies such as MPC, it contributes to the enhanced overall performance of the building.
MPC stands among the various solutions aimed at enhancing the efficiency of building control systems [
9,
10,
11]. The key advantages of MPC include its explicit consideration of building dynamics, the utilization of predictions for future disturbances, accounting for constraints, and addressing conflicting optimization objectives to determine optimal control inputs. Although MPC has long been established in process control, its application in building automation is a developing area of interest. This methodology has been the subject of extensive investigation over the past few years, showcasing promising potential as a technique for implementing control strategies in the built environment [
12,
13]. MPC has the potential to additionally enhance the energy flexibility of buildings [
14]. According to Ref. [
15], the effective utilization of the flexibility potential within buildings requires the deployment of intelligent control systems. In another study, Ref. [
16] employed a co-simulation framework to develop and assess an MPC application in a Spanish residential building, revealing monetary savings ranging from 13% to 28%. Moreover, a concurrent reduction in CO
2 emissions within the range of 19% to 29% was observed. In a separate study, Ref. [
17] implemented an MPC application in a multi-residential building in Naples during the heating season, resulting in a notable reduction in operating costs of up to 56% and an enhancement in thermal comfort. Via a simulation study, Ref. [
18] focused on residential buildings and demonstrated a 10–30% reduction in electricity bills when applying MPC in a dynamic electricity price scenario in comparison to traditional control methods.
Despite the extensive research into MPC in recent years [
12,
13,
19], its remote implementation remains relatively unexplored, especially in residential buildings. In their study, Ref. [
20] showcased the application of a white-box MPC implementation in an office building located in Belgium. The practical deployment and oversight of the MPC operations in real-world scenarios are facilitated by an automated cloud-based communication infrastructure. The application led to energy savings of 53.5% and enhanced thermal comfort by 36.9%. Similarly, ref. [
21] introduced a cloud-based platform designed for the model-based predictive control of an existing HVAC system, employing a commercial food retail building as a practical case study. The existing Building Management System (BMS) underwent retrofitting to enable bi-directional communication with the cloud. The economic optimization yielded an energy saving of 1.7%, whereas the carbon optimization resulted in negligible CO
2 savings, attributed to the building’s limited ability to shift its energy consumption patterns. Via a case study, Ref. [
8] illustrated the application of an MPC method aiming to optimize building demand and energy costs within the framework of time-of-use price policies. A web-based control architecture was developed to facilitate the remote testing of the MPC controller. The test results demonstrated the MPC strategy’s ability to effectively shift peak demand to off-peak hours, leading to significant energy cost savings compared to a baseline scenario for the building. Based on the Internet of Things (IoT), ref. [
22] introduced a method for implementing Model Predictive Control (MPC) in HVAC systems within real-world contexts. The MPC algorithm under consideration optimized indoor thermal comfort and associated energy consumption for a single-zone environment in a closed-loop control manner, facilitated remotely. The proposed IoT-based control architecture was deployed and experimentally evaluated in a campus building at the Polytechnic of Bari (Italy) within a proof-of-concept framework.
In a comprehensive review [
23] addressing ten critical questions about MPC, Killian and Kozek identified office buildings and secondary schools as prime candidates for MPC implementation. These building types were deemed suitable based on various criteria conducive to effective MPC application. The study further underscores smart home automation’s potential for MPC adoption, supported by research showing that residential heat pumps can enhance grid flexibility through Demand Response (DR) strategies, offering cost savings while preserving comfort [
24]. Consequently, it is likely that residential buildings will witness a notable increase in MPC implementations in the coming years. Our bibliometric analysis revealed that the application of MPC methodologies for remote energy optimization has been primarily documented in commercial and office buildings. However, a notable research gap exists in the application of these methodologies within the residential sector.
This study assesses the remote application of an MPC system for energy management in multi-family buildings, specifically utilizing a cloud-based system called Smart Energy Management (SEM). It does not focus on developing the MPC framework. Instead, it evaluates the effectiveness of the SEM’s existing capabilities in optimizing energy usage remotely via cloud infrastructure. The study demonstrates how the SEM reduces energy consumption and costs while maintaining comfort, leveraging its minimal computation using as a case study a multi-family residential building. The research is aimed at illustrating the system’s ability to streamline energy management processes, enhance efficiency, and promote sustainability without the creation of new MPC frameworks. Future directions will explore real-world application tests and refine operational models to better reflect actual conditions, highlighting the importance of cloud-based solutions in advancing sustainable energy management. This explicit clarification underscores that the article’s scope is the practical application of existing MPC technology, not its initial development or theoretical expansion.
This research contributes to the field of energy management and MPC applied to multi-family residential buildings through the following key aspects:
The design of a cloud-based architecture for remote operation, utilizing an open-source distributed event streaming platform to enable efficient data handling and enhance the robustness.
The C++ implementation of the simplified models and the optimization algorithm to reduce the computational burden and facilitate an easy deployment in standard, low-specification servers.
The use of a Single Thermal Zone model for the building to make the control operate only over the heat pump and the tanks instead of the individual hydronics of each dwelling.
The paper is structured as follows:
Section 2 describes the components employed in the testing framework;
Section 3 outlines the implementation of the components for this study, followed by the validation of the tested scenarios in
Section 3.2; the results of the validation tests are presented in
Section 4, while
Section 5 discusses the results and the limitations; finally,
Section 6 presents the conclusions and outlines plans for future work.
2. Overview of the Framework Components
The environment used to test the SEM as a remote MPC for HVAC systems consists of the following three components:
2.1. Virtual Demo Building
2.1.1. Building Description
The present study focuses on a four-story multi-residential building with a total of 20 apartments located in Bern, Switzerland, as shown in
Figure 1 (left). The building underwent renovation in 2019 in accordance with Swiss regulations [
25], which included a low U-Value of 0.131 W/m
2·K. The structure incorporates elevated insulation levels, airtightness, and features a “Winter Garden” (WG) serving as a buffer zone between the exterior environment and the building. This provides the building with high passive behavior, thereby allowing limited room for further optimization. The building’s energy systems and components are as follows:
One air-to-water heat pump (HP) with a 50 kW capacity used alternatively for space heating (SH) and domestic hot water (DHW) purposes.
One thermal storage tank of 4 m3 for the centralized DHW systems and one buffer tank of 4 m3 for SH purposes.
A centralized ventilation system operating according to the CO2 concentration of the exhaust air equipped with a heat recovery system.
A PV system with a peak power of 90 . Approximately 535 of Photovoltaic (PV) modules of Copper Indium Gallium Selenide (CIGS) technology are installed; 280 of them are installed vertically in the four facades and 247 are installed with 10° of inclination on the rooftop.
On the southern-facing building façade, a feature known as the WG, analogous to a glass-enclosed balcony, has been incorporated to harness solar radiation, thereby establishing a buffer zone between the building and the external environment, consequently fostering a greenhouse effect.
Solar shading automatic control based on incident radiation and a time schedule, mostly operating during summer.
The external radiant heating wall (ERHW) is a prefabricated, innovative renovation technology. It consists of panels with an insulation layer and heating loops on their inner face (
Figure 1, right). The panels are applied onto the existing facade and are connected to the HP for the thermal power supply, providing heating to all 20 apartments.
Building comfort requirements
To ensure occupant comfort, it is essential to maintain the indoor temperature (
) of each occupied zone above the setpoint of 21 °C throughout the entire heating season. Comfort is provided by the ERHW and auxiliary radiators for backup heating in case the main system is insufficient. Each of the twenty macro-heating loops receives the same water temperature and count with individual thermostats (on/off controllers), as detailed in
Section 2.1.3.
2.1.2. TRNSYS Model Configuration
A virtual building model in TRNSYS was employed, executed via the PYTRNSYS package [
27], a Python library which provides a comprehensive framework for executing, processing, visualizing, and reporting TRNSYS simulations. This model comprises the following components:
A multi-zone building (Type 56);
A compression heat pump;
A total of eight PV modules for each PV field;
Heating control to manage the HP and the storage tanks;
A plug flow tank for the two tanks for space heating and the DHW;
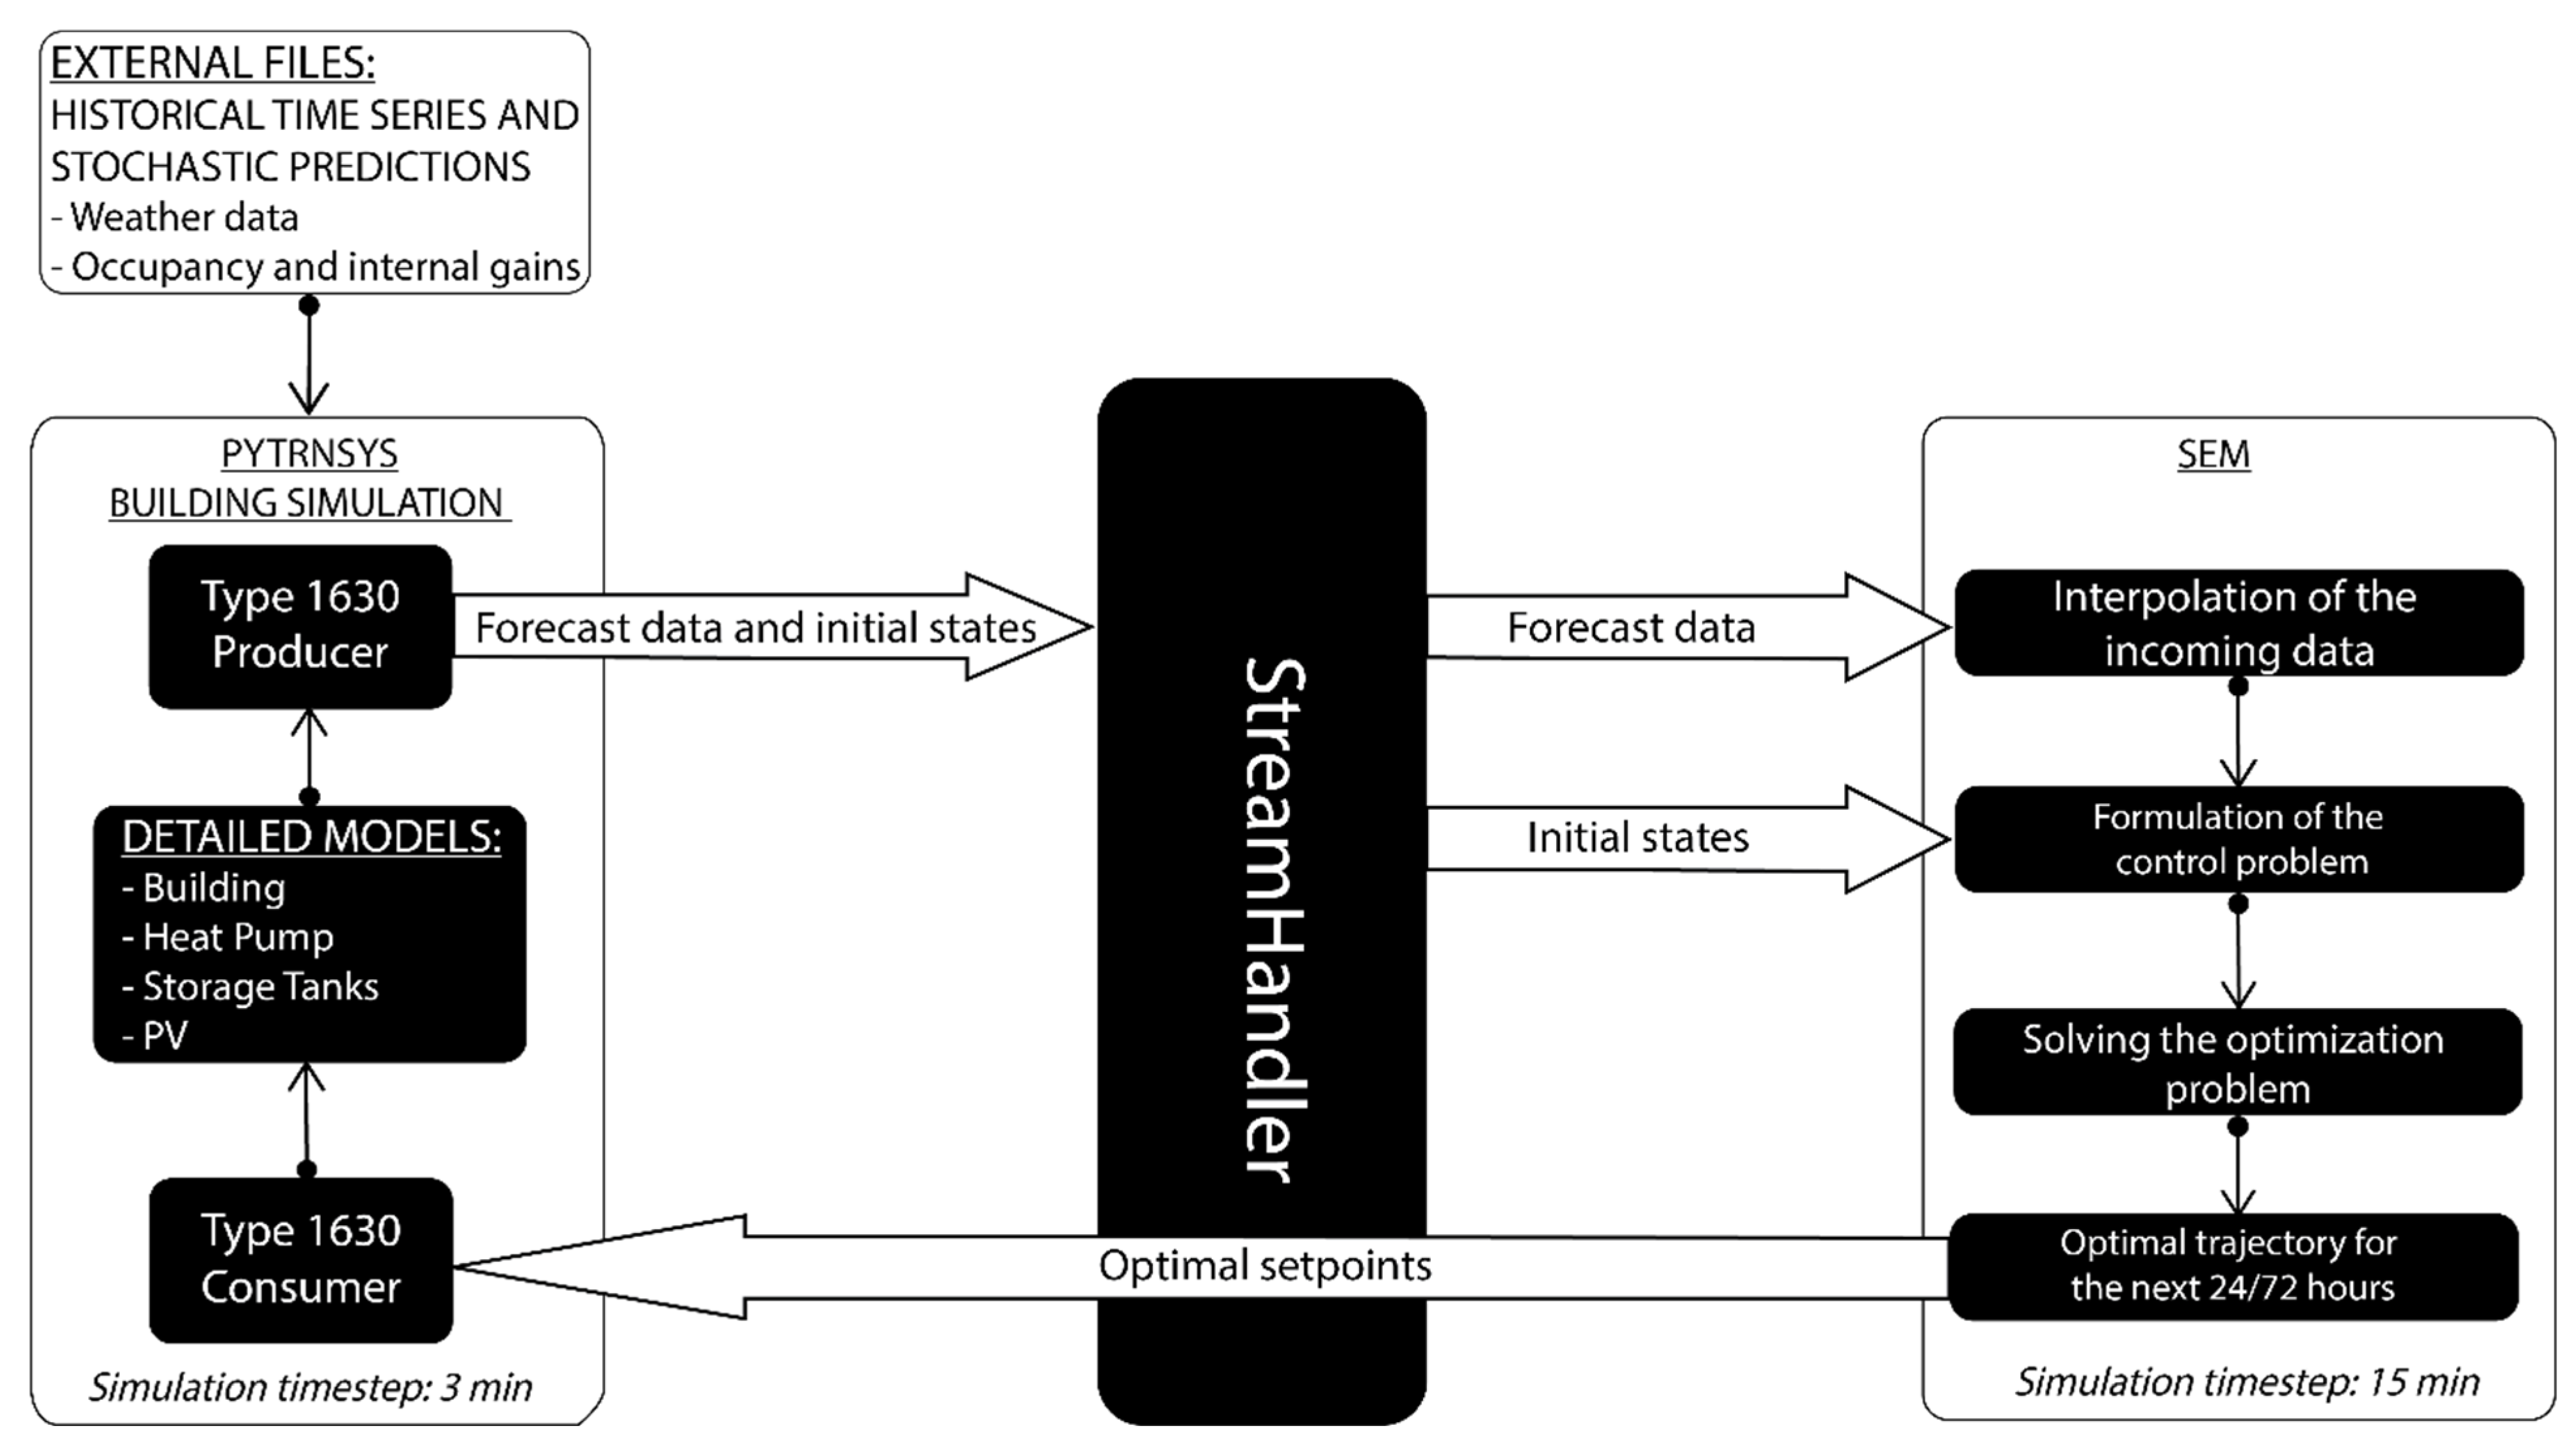
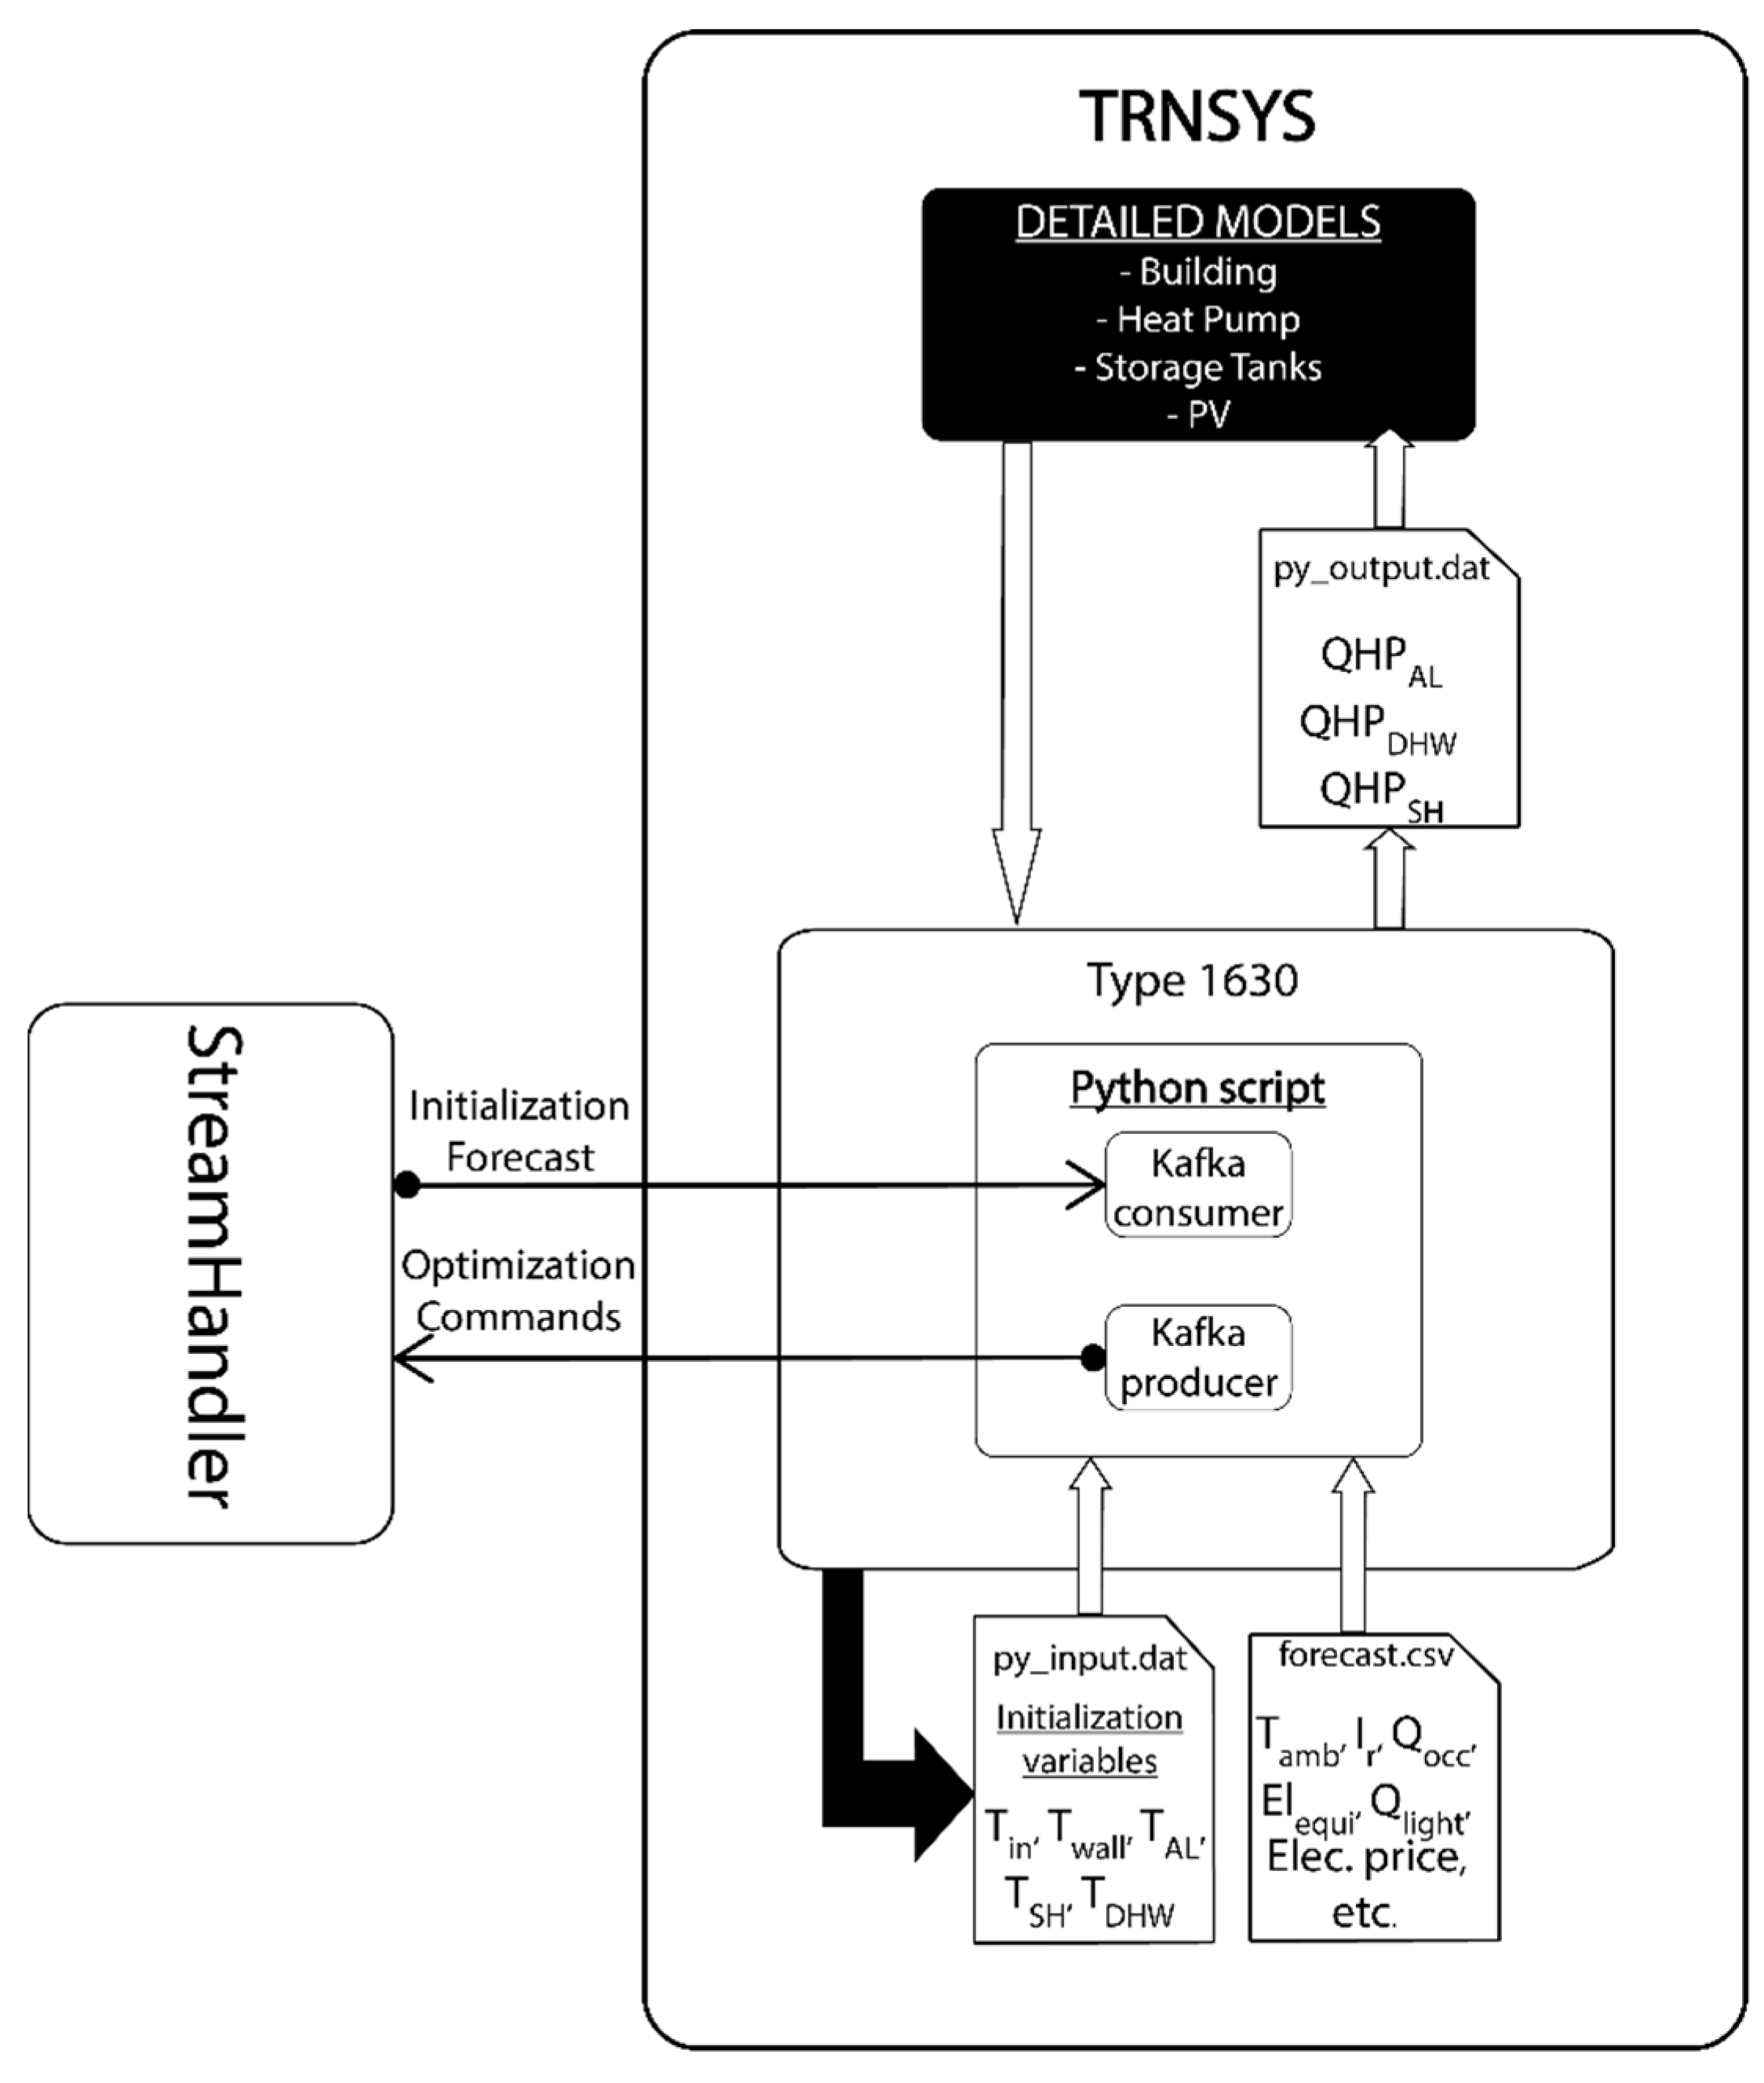
A customized version of Type 163 that invokes the Python script that connects with the StreamHandler and optimization module at every MPC cycle.
A hydraulics solver was used to calculate the temperatures and mass flowrates of the ERWH hydraulic circuits. This type comes exclusively from the PYTRNSYS module and counts with its own GUI in order to provide an easier design and analysis tool.
For more detailed information regarding the TRNSYS model’s input and output parameters, including the thermal capacitance and heat transfer coefficients, as well as the calibration processes used to enhance simulation accuracy, please refer to Ref. [
28].
2.1.3. TRNSYS Default Control
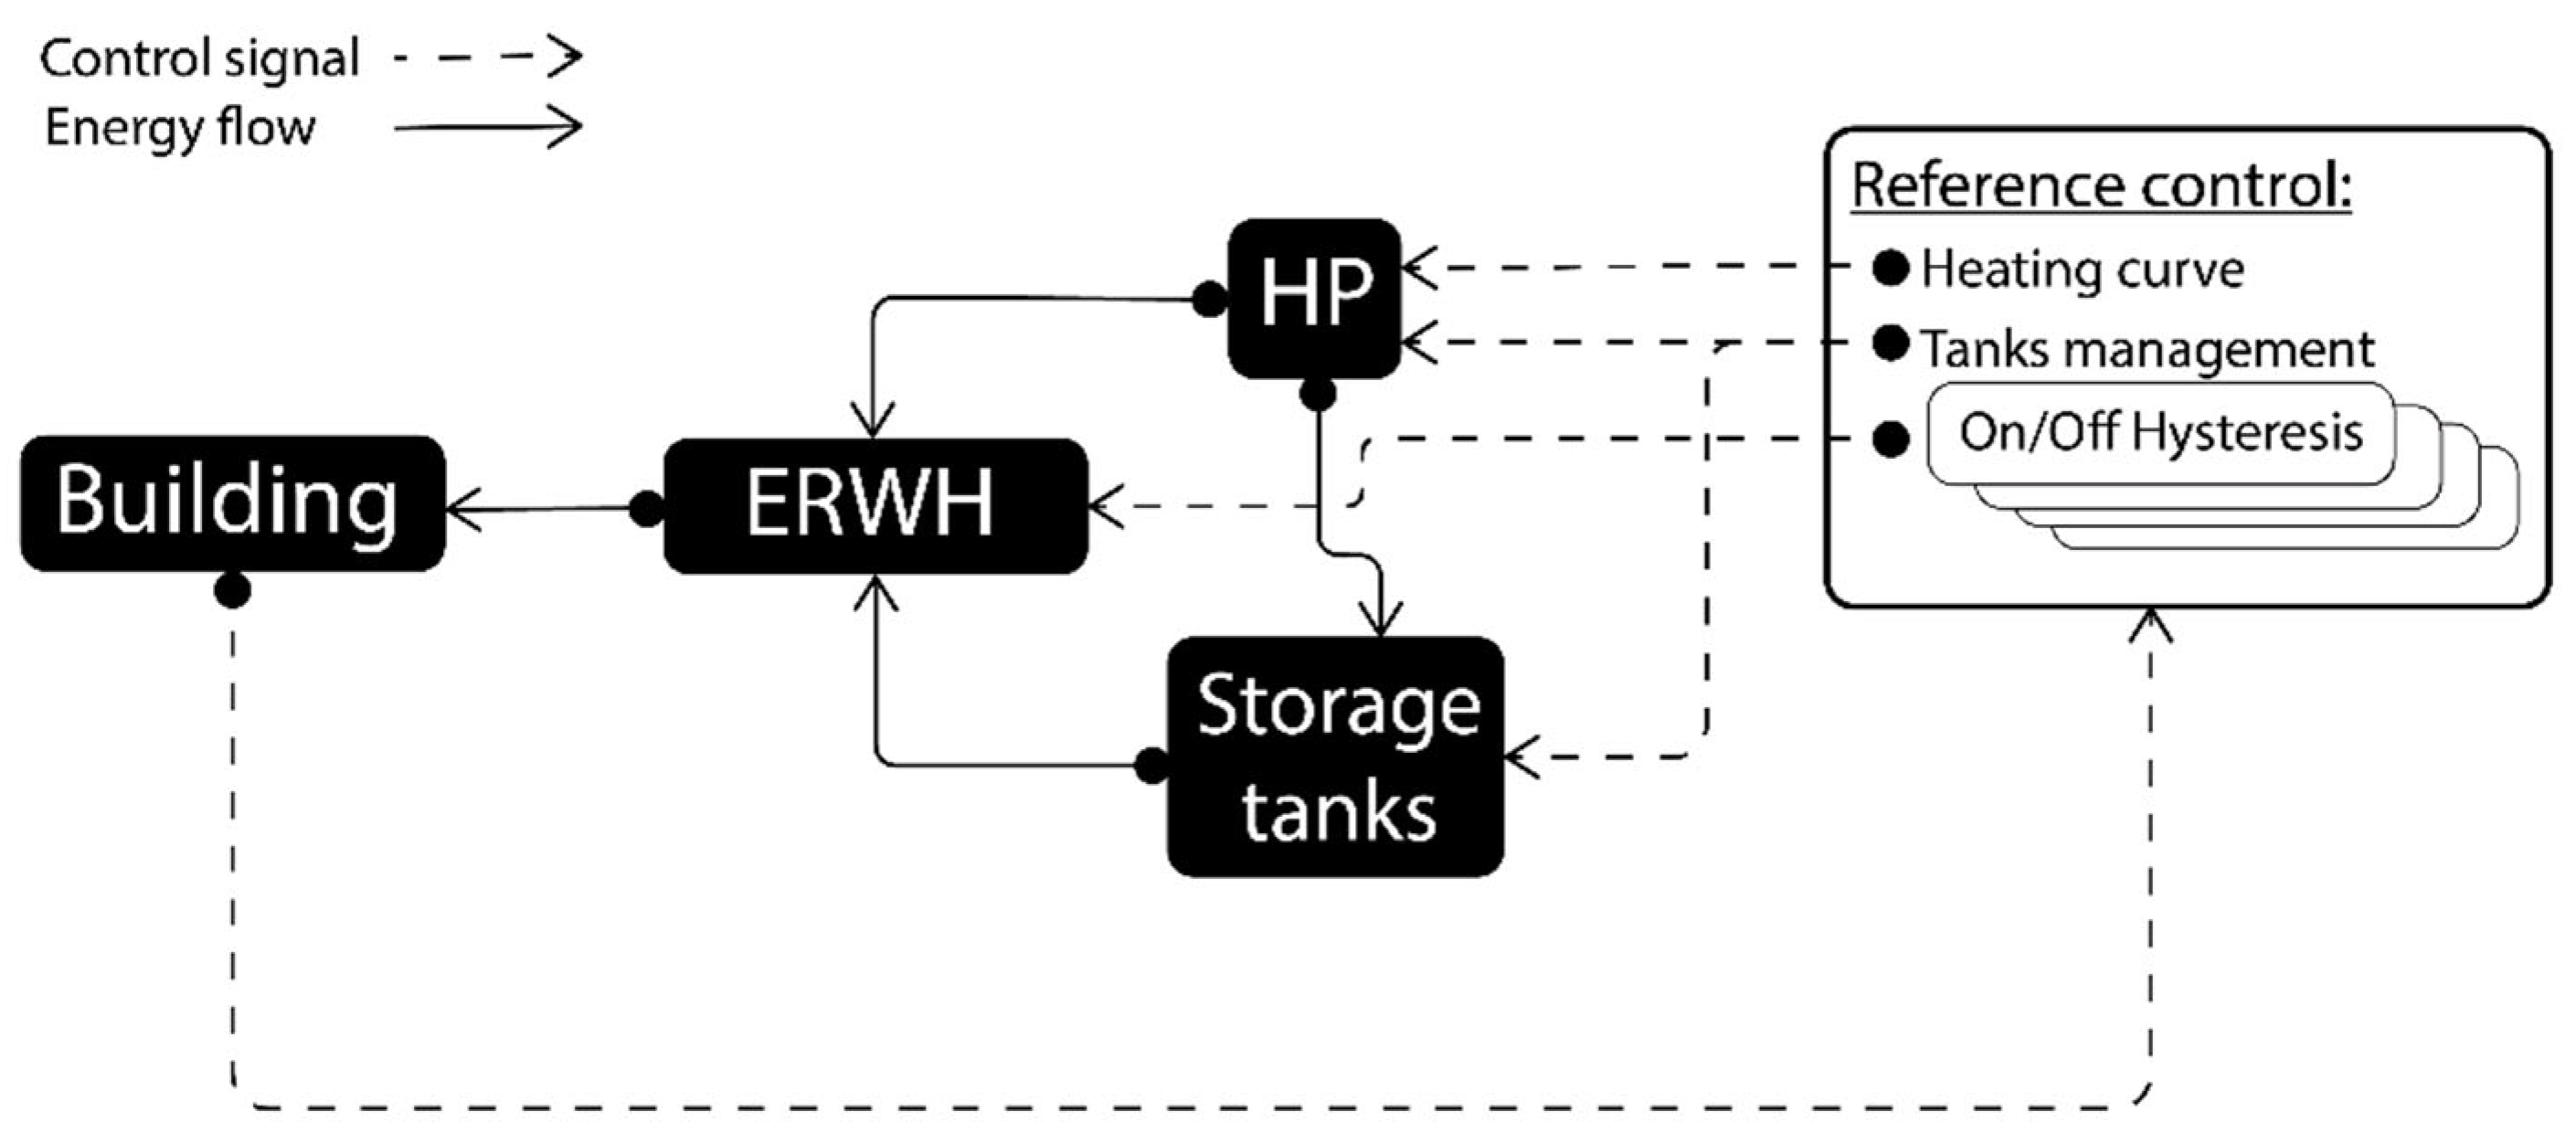
The TRNSYS model counts with a default control, represented in
Figure 2, which is used as a reference point for this study, as discussed in
Section 4.4. Specifically, the HP and storage tanks are managed by a rule-based control system (Type 888). The circuits supplying energy to the ERHW are partitioned according to the zone they serve, regulated by a thermostat (on/off hysteresis controller, Type 2), and they act when the Tin drops below 21 °C, which is the setpoint in the study case. However, other components, such as appliances, lighting, and ventilation, are governed by predefined occupancy schedules and are not actively controlled.
The HP supplies both the DHW and SH systems alternatively. For the DHW system, the storage tank ensures a continuous supply of hot water, regulated by a mixing valve to maintain a maximum temperature limit of 70 °C. Meanwhile, for the SH system, the HP adjusts the supply temperature to a heating curve dynamically in response to outdoor and indoor temperature variations, with a mixing valve regulating the temperature of the water supplied by the HP and SH tank to the ERHW, optimizing comfort and efficiency.
2.2. SEM System
The SEM system consists of an MPC framework designed for the efficient regulation of HVAC systems within buildings. Utilizing gray-box models, the SEM formulates mathematical equations to address the HVAC control, treating them as Mixed Integer Linear Programming (MILP) problems, as specified in Ref. [
28]. Gray-box models are particularly valuable, as they combine the physical laws governing thermal dynamics (from white-box models) with data-driven approaches (from black-box models). This hybrid approach allows for a more accurate representation of building behavior while maintaining computational efficiency. The R3C3 model, employed in this study, is specifically chosen for its ability to predict thermal behavior with a balance between complexity and accuracy. This model features the following three distinct temperature states: indoor air, walls, and the external radiant heating wall (ERHW). By leveraging both physical principles and empirical data, gray-box models effectively capture the dynamic responses of buildings to varying operational conditions. This approach optimizes HVAC operations, ensuring optimal energy utilization and enhancing thermal comfort within building environments.
2.2.1. Optimization Algorithm
The optimization algorithm was formulated as a MILP problem using the OR-Tools engine [
29], chosen for its versatility in handling complex constraints in Energy Management Systems (EMSs). The problem was solved with the SCIP solver (version 8.0.3) [
30]. The algorithm was extensively verified and validated in a previous work [
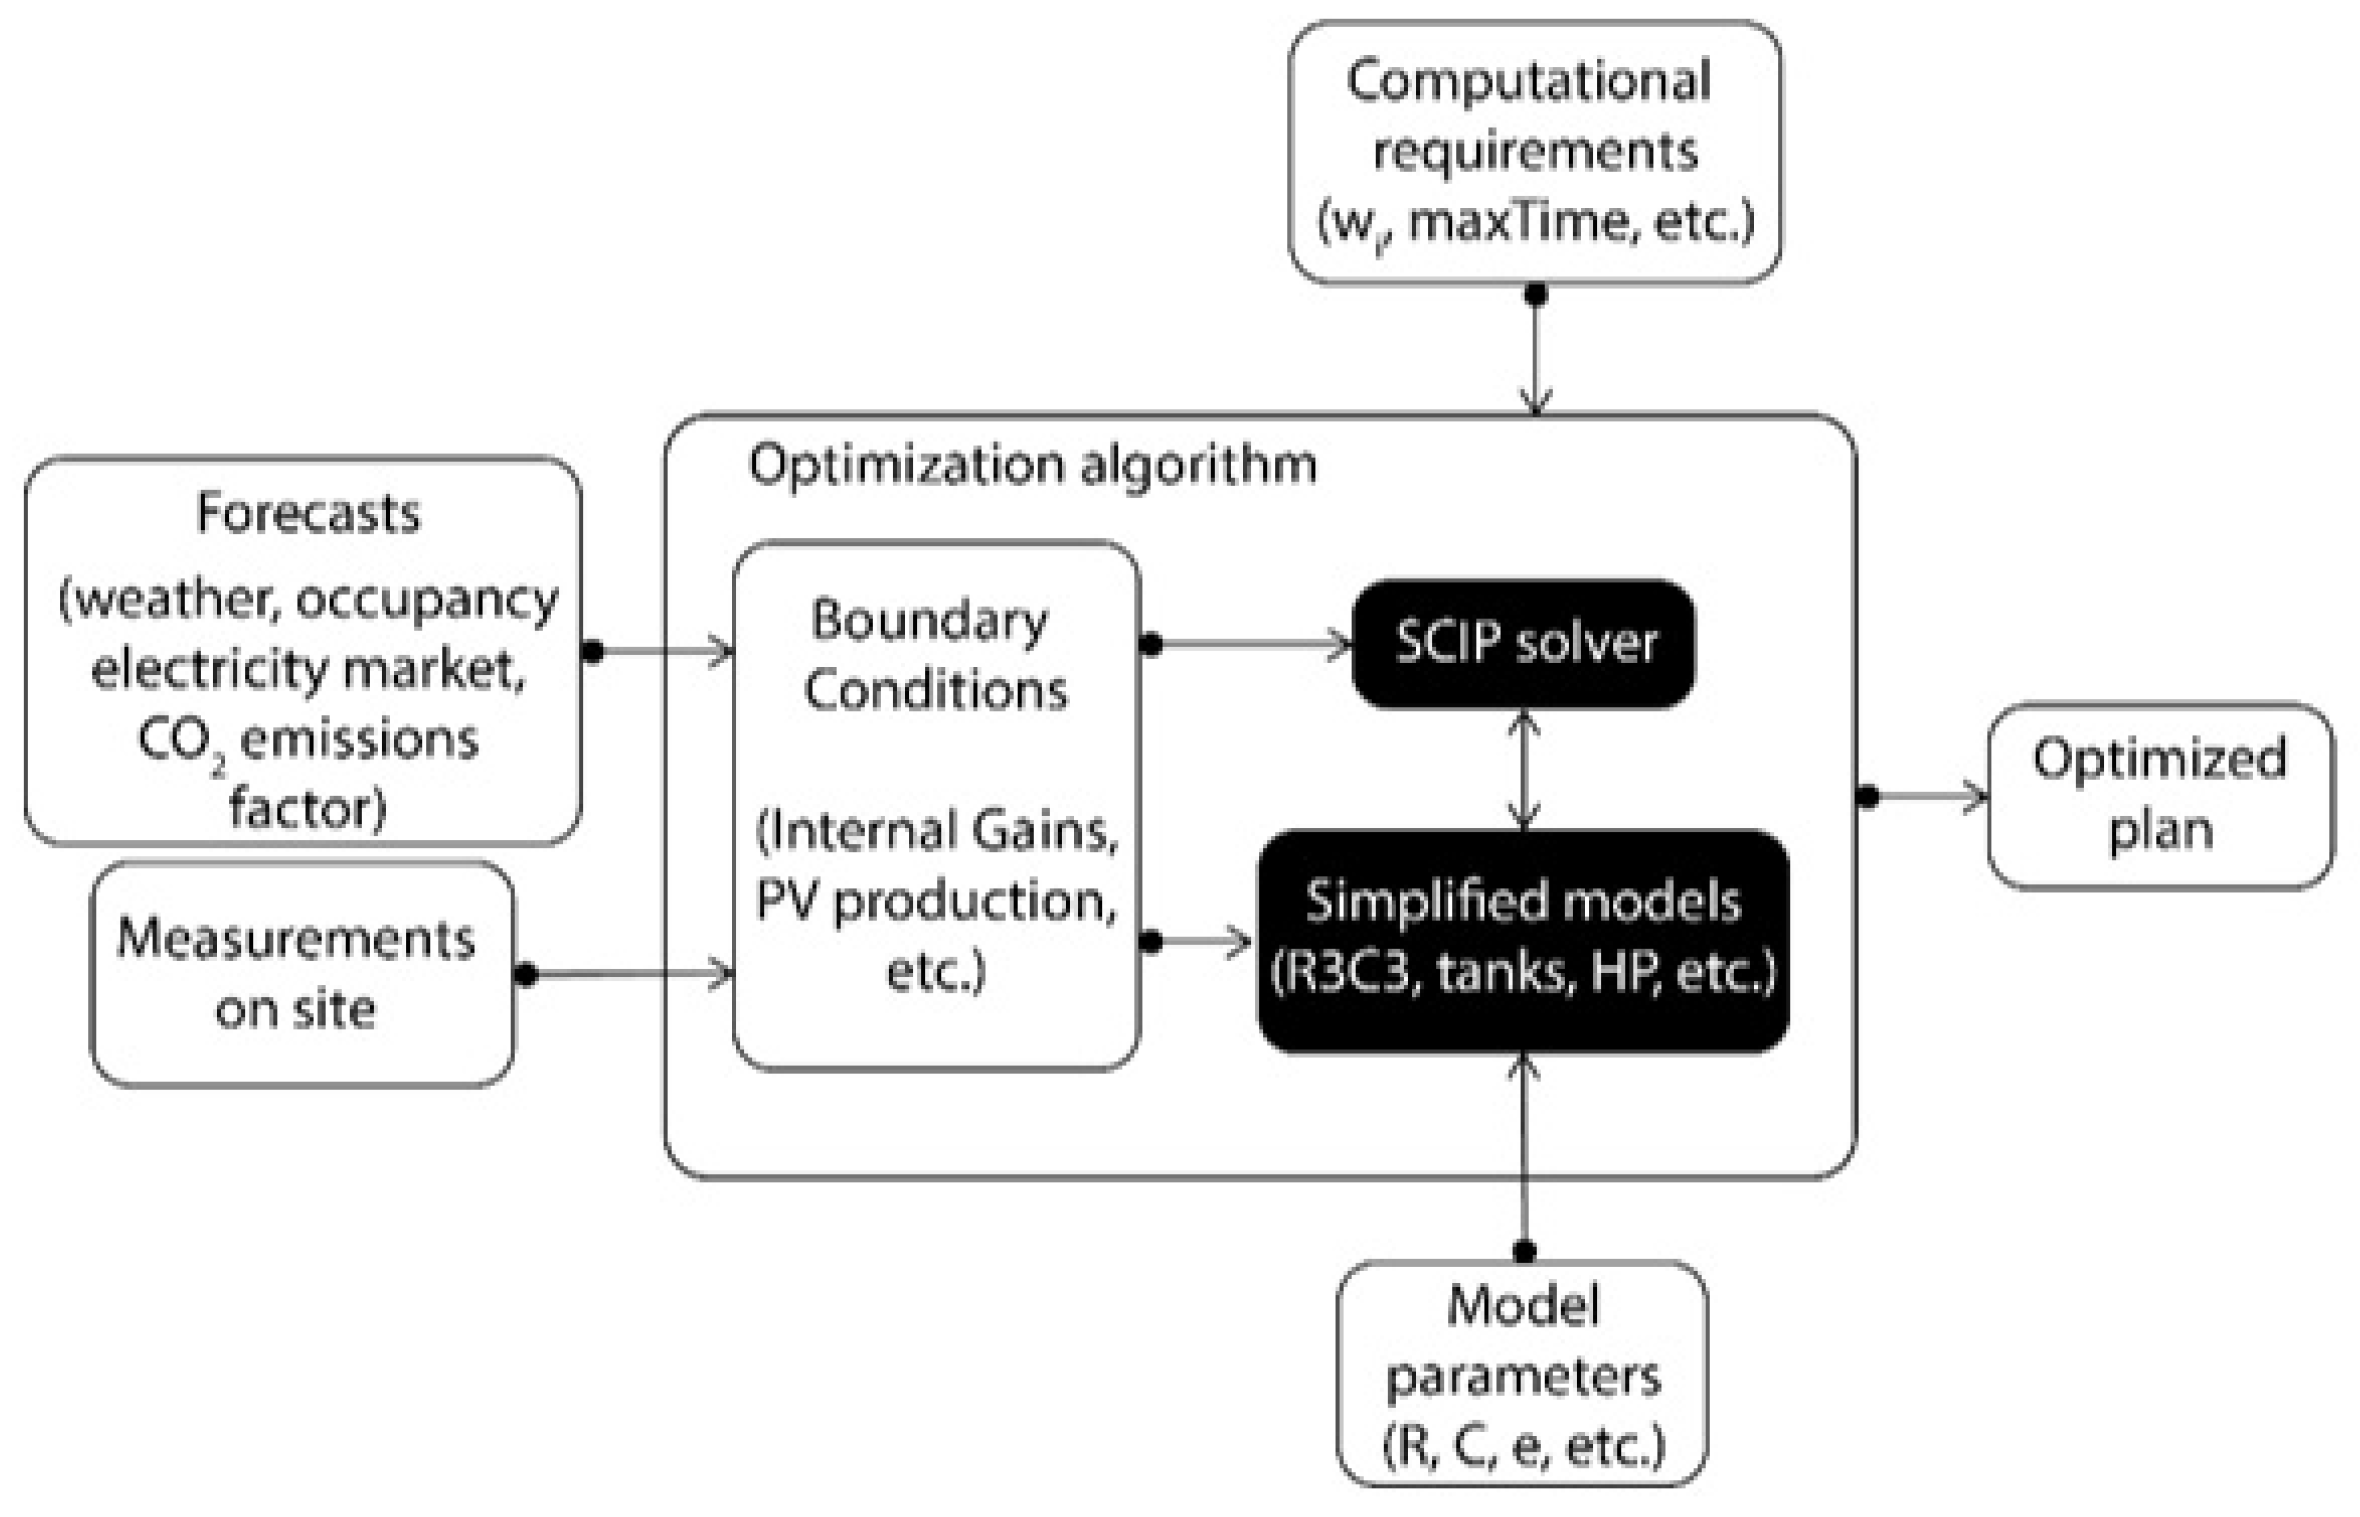
28]. The algorithm’s structure, encompassing its workflow and interconnected components, is depicted in
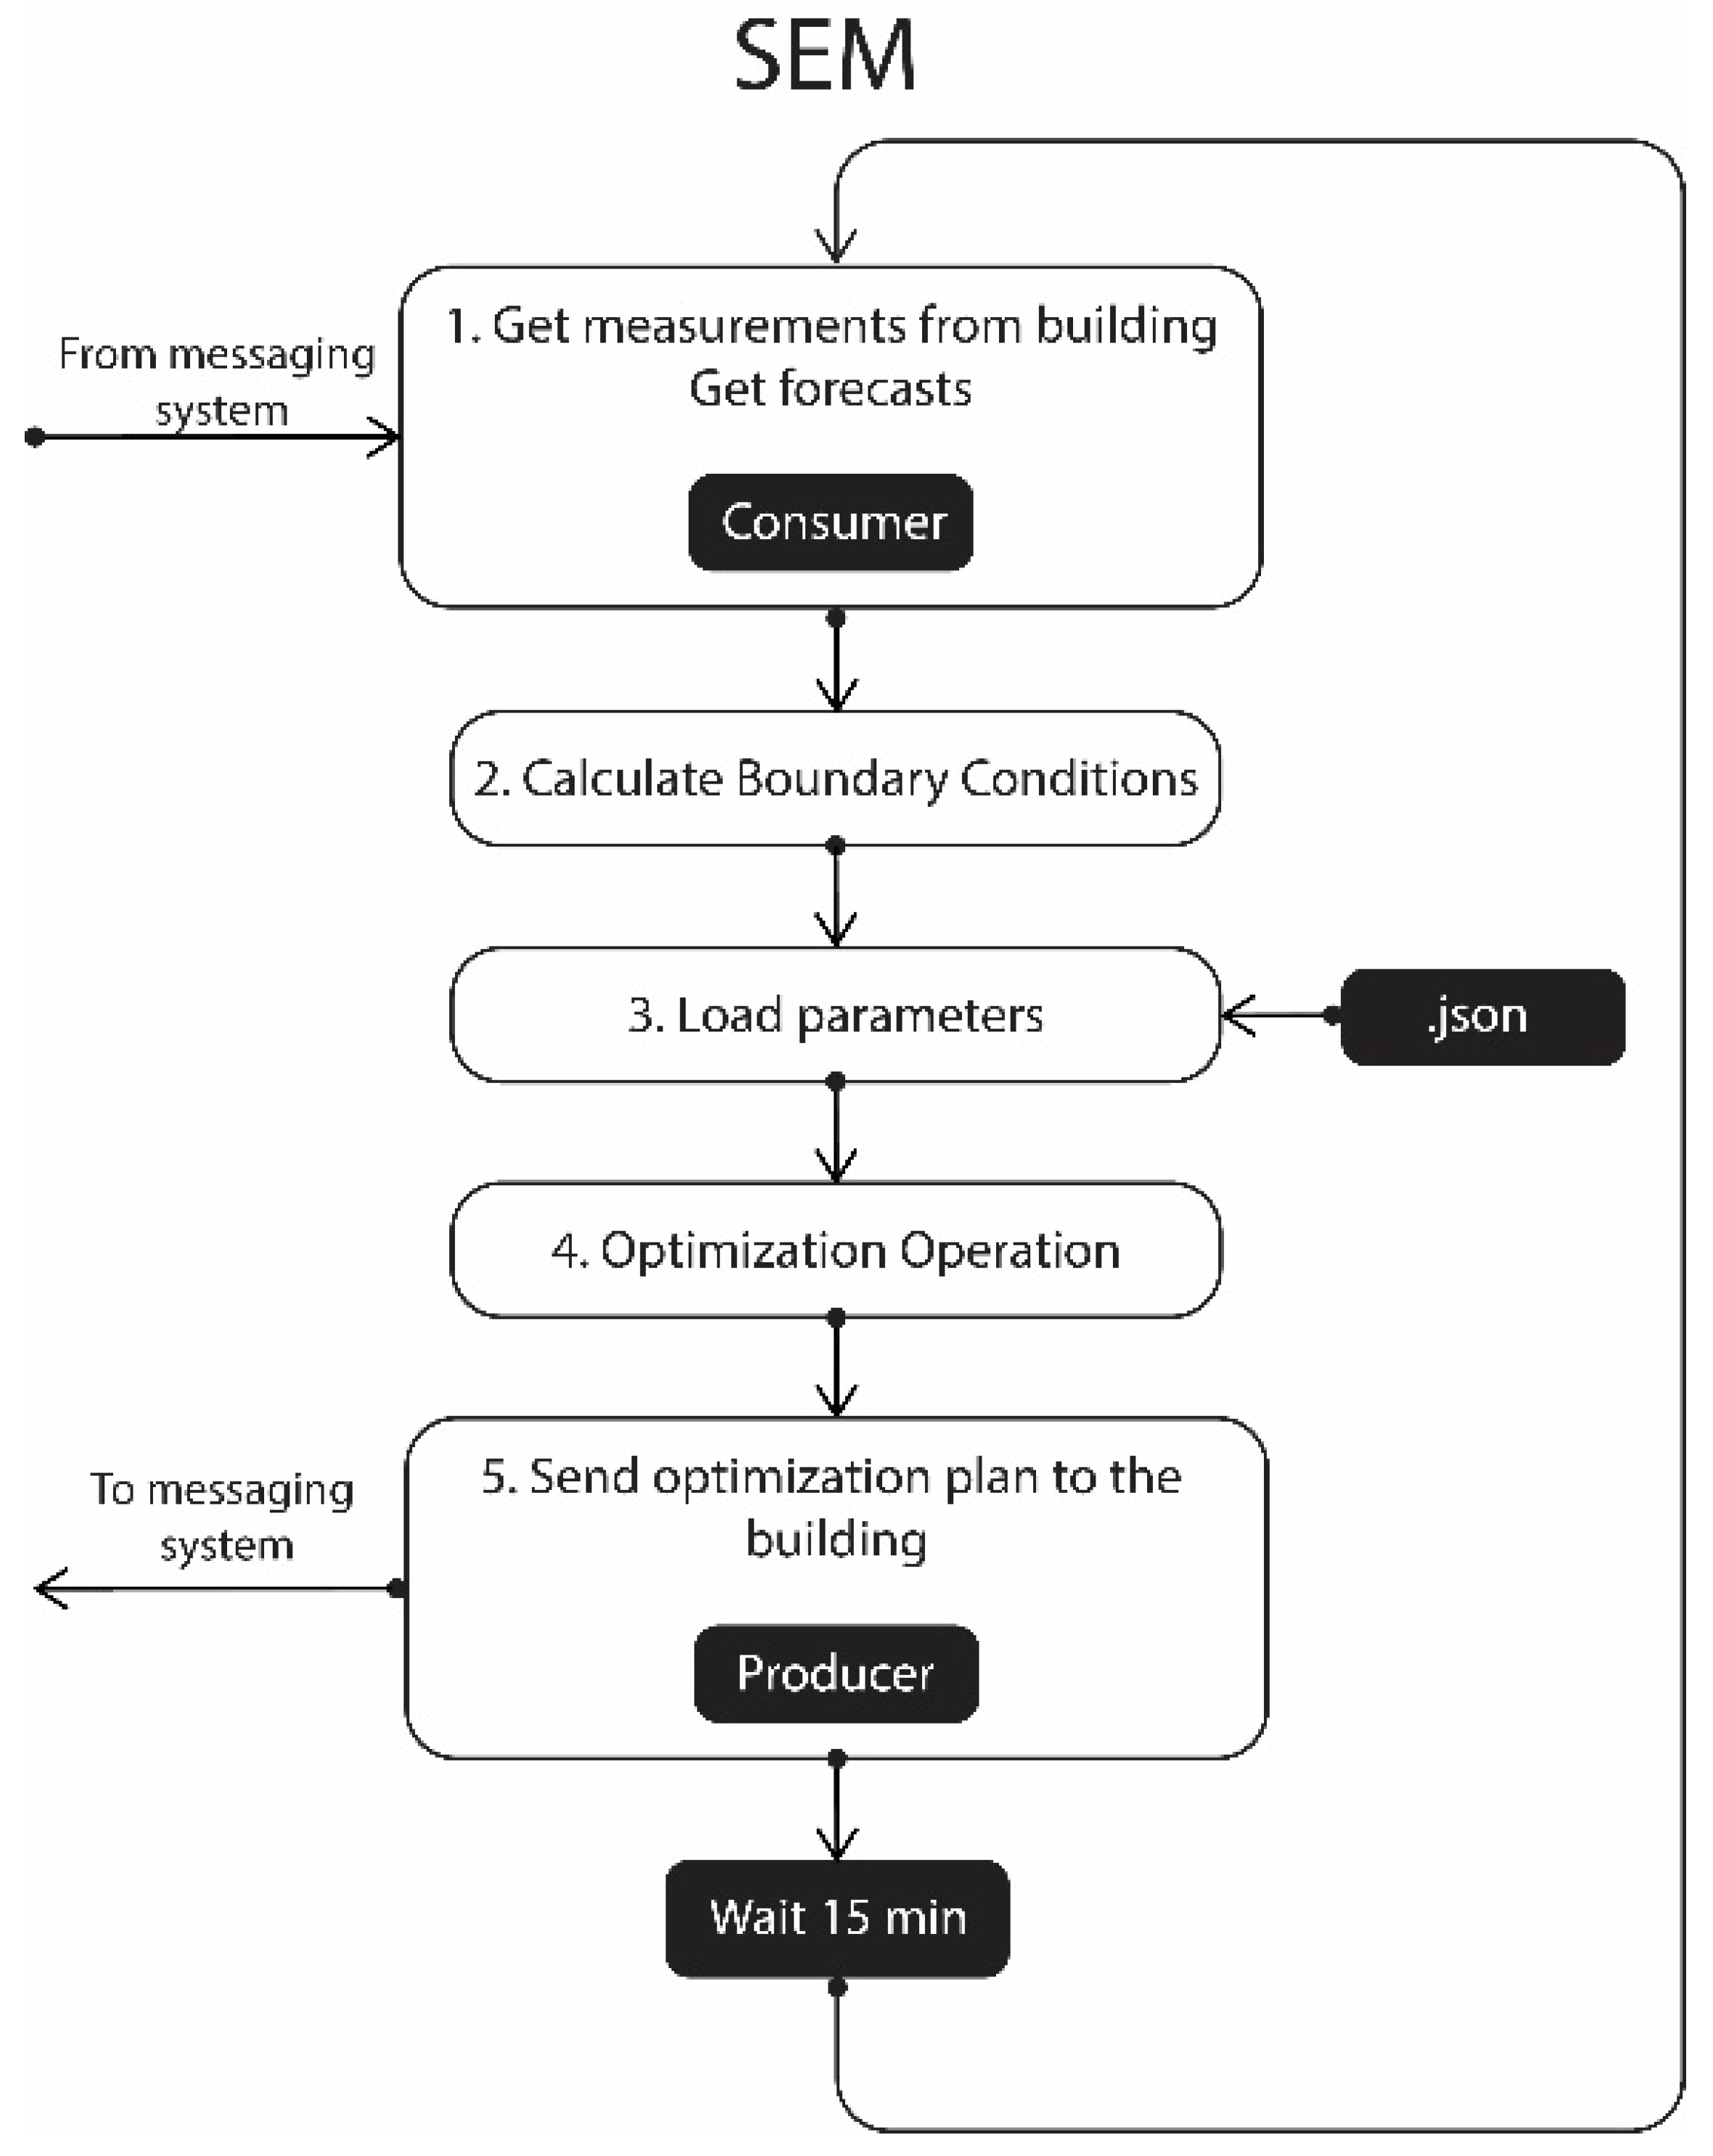
Figure 3. Its core comprises a set of simplified models, expressed as MILP equations, which are addressed by the optimization algorithm in accordance with specified computational constraints. These constraints include the objective function criteria, weight allocation, and computational limitations imposed upon the computing system. In this framework, the MILP is employed primarily because it allows for the integration of both continuous and binary variables, enabling the HP to selectively provide hot water to either the SH or DHW systems, based on real-time demands. The optimization process involves defining specific constraints, such as maintaining a limit on energy imports and exports to the grid, which is critical for efficient energy management. The choice of a prediction horizon of 12 to 72 h facilitates timely responses to anticipated changes in building energy demands, ensuring comfort while optimizing energy usage. As inputs, the system requires forecasts of occupancy patterns, equipment usage, and meteorological data. Additionally, it incorporates real-time sensor measurements to update the initial state of the models. As an output, the system delivers an optimized plan for the building’s energy system operation for the desired time horizon.
The choice of the MILP for the optimization framework is deliberate and methodologically significant. Despite the continuous nature of most control variables within the system, the MILP is utilized primarily because of the specific requirement for binary variables in the operation of the HP. These binary variables are essential for enabling the HP to selectively provide hot water either to the SH or the DHW systems, depending on real-time demands and operational conditions. Additionally, the MILP facilitates the imposition of strict import/export energy constraints, ensuring that the system does not simultaneously import and export energy from and to the grid.
2.2.2. Simplified Models
To ensure computational efficiency, the algorithm employs simplified models for the building and its systems. These models are developed through a careful balance of accuracy and complexity. The R3C3 model is a simplified resistance–capacitance (RC) configuration that allows for a quick estimation of thermal dynamics without the computational burden of more complex simulations. While simplifying, we maintain critical thermal behaviors, albeit with some trade-offs in precision. The parameters defining the model, such as thermal resistance and inertia, are calibrated using data from the TRNSYS white-box model to ensure reliability. Further explanation on how these parameters are identified and validated can provide insights into the robustness of the simplified approach.
Simplified models were developed in Ref. [
28] and are also described in this section.
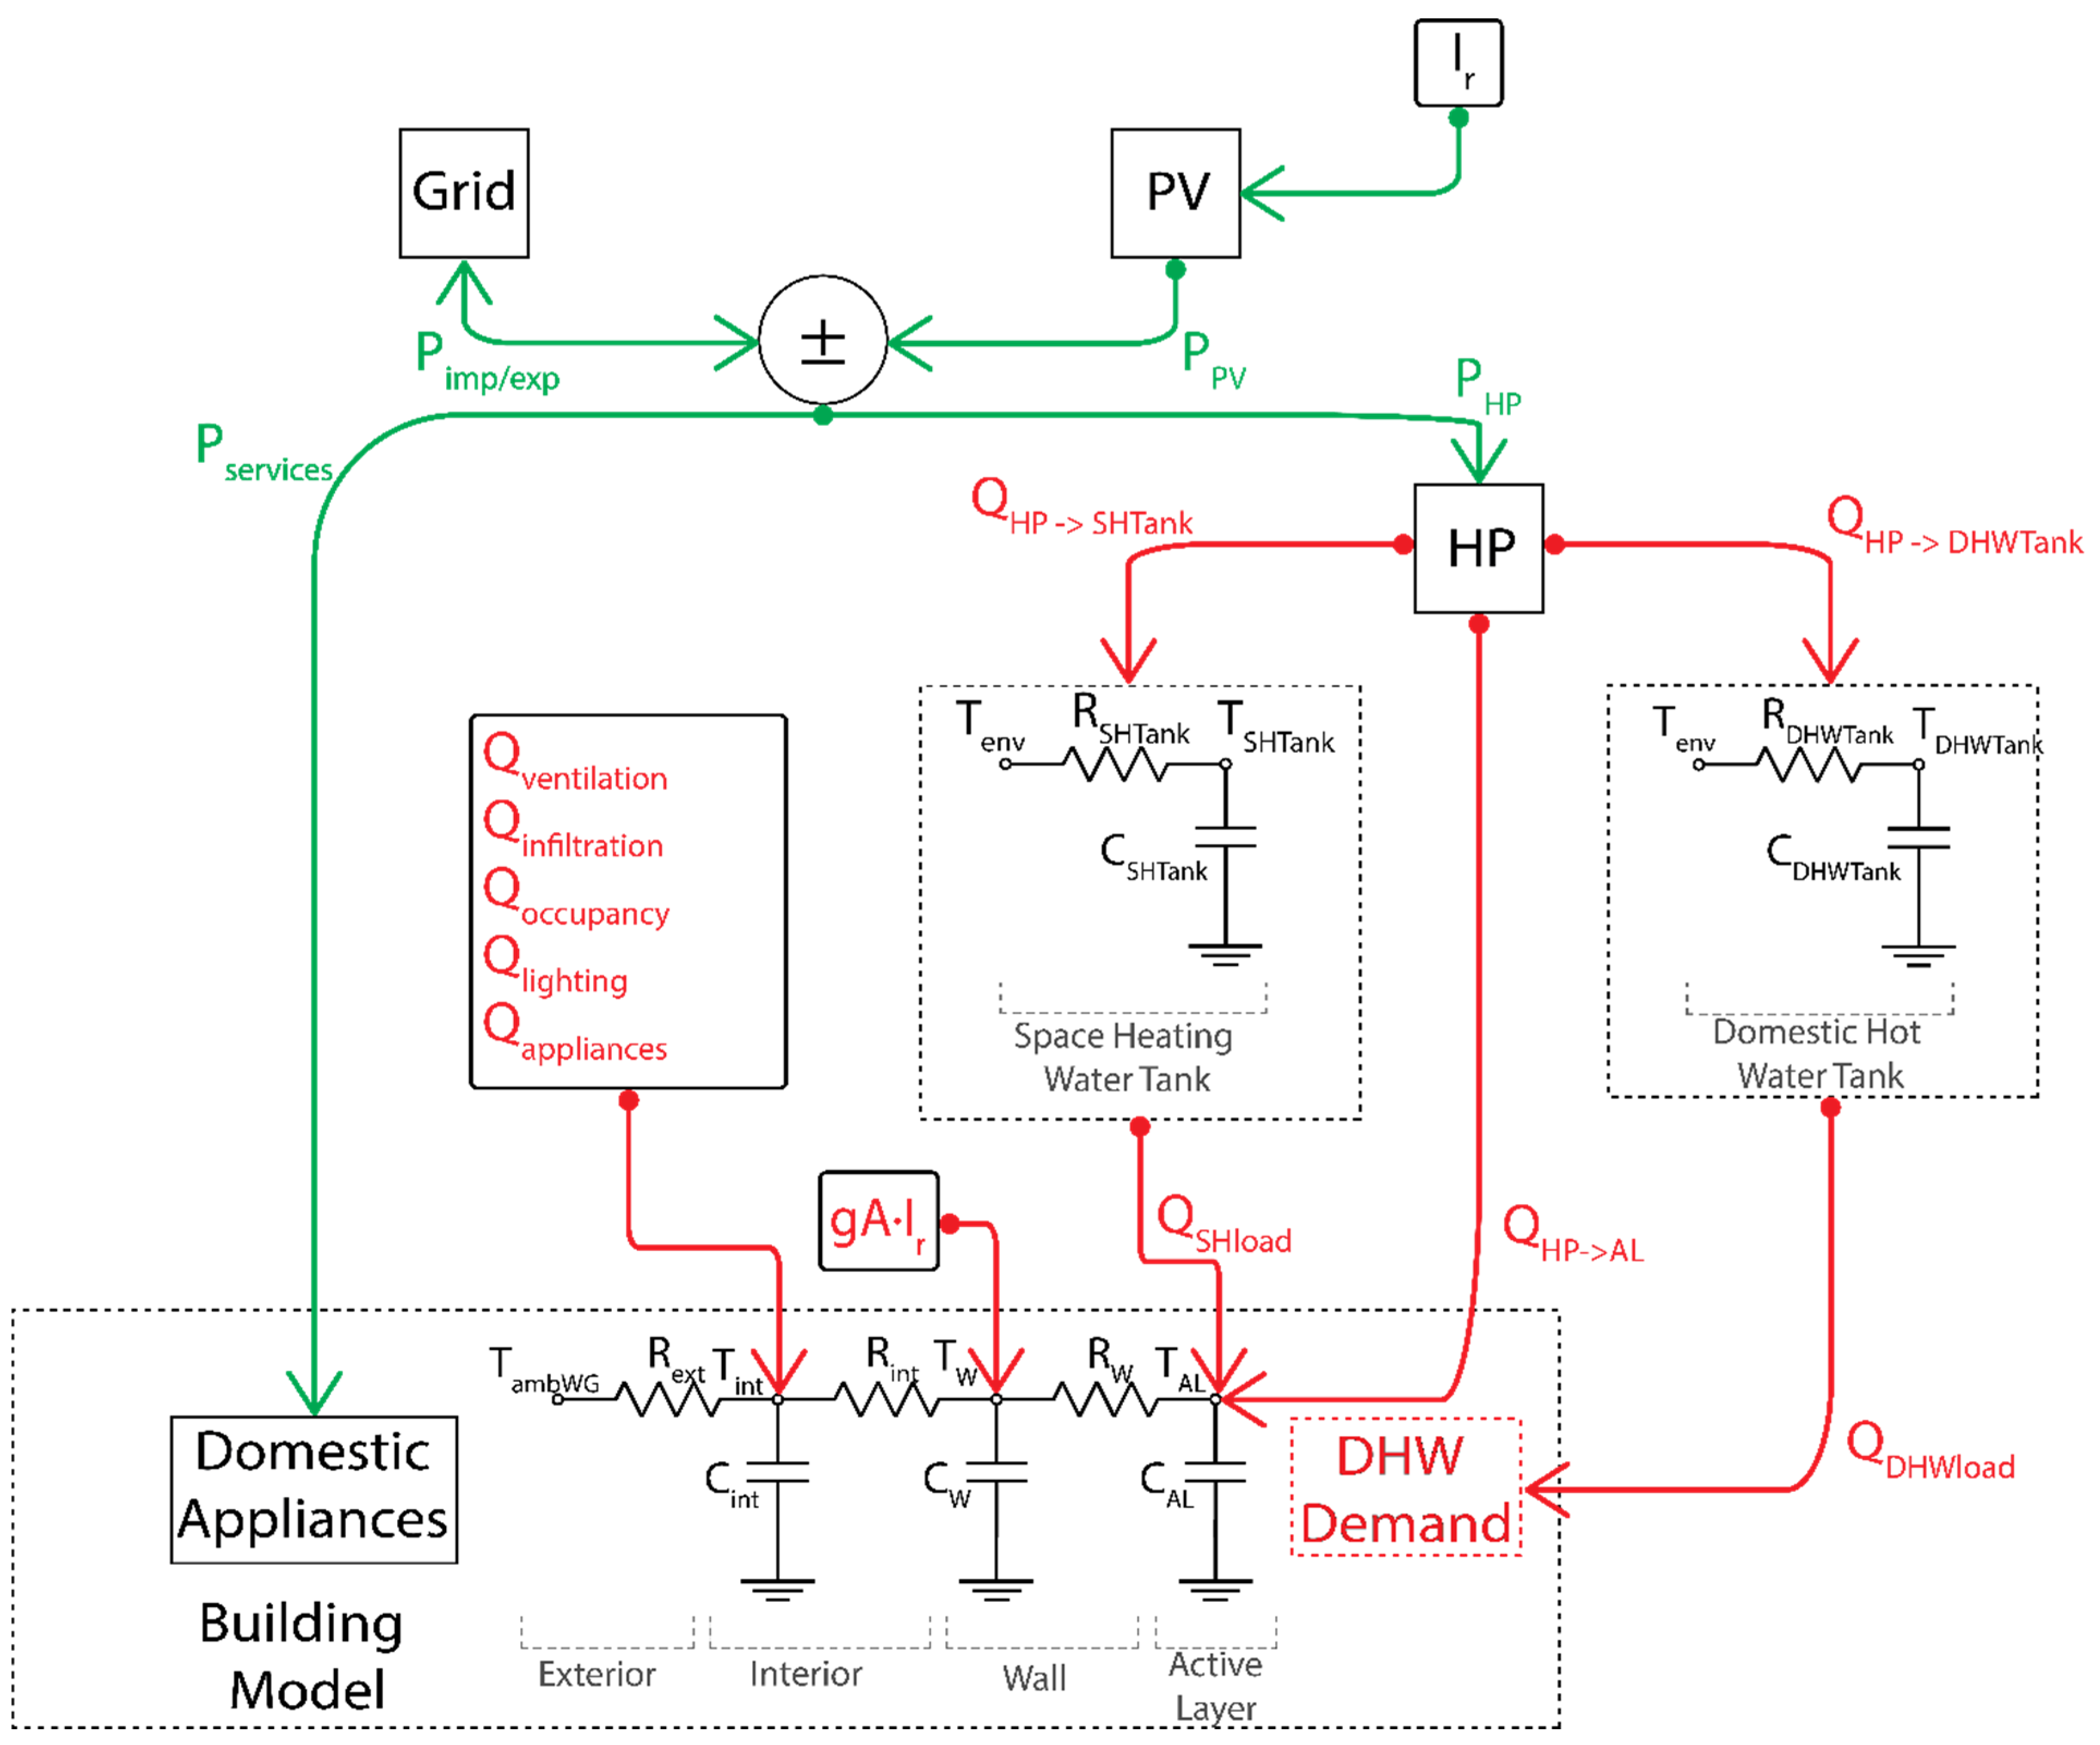
Figure 4 presents a high-level interconnection of these models. The controllable variables are the thermal power supplied by the HP to the tanks and the AL (
,
, and
), as well as the thermal power drawn from the SH tank to heat the building (
).
The following simplified models for the building and its systems were developed:
The building model employed in this investigation adheres to a simplified RC configuration [
31], specifically adopting the R3C3 model, as illustrated in
Figure 4. This model features three distinct temperature states, each corresponding to the following nodes: indoor air (Tin), walls (Tw), and the ERHW (Tal). These temperatures are an area-weighted average of all individual temperatures for each zone (e.g.,
). It is important to mention that, for the R3C3 building model, the outdoor temperature is determined through a weighted averaging process involving
(ambient air temperature) and
(temperature within the WG). The weights are proportional to the surface area of the façade in contact with the WG (
and the surface area exposed to the ambient air (
).
The model was adjusted with simulated data from the TRNSYS white-box model. Several topologies were proposed which could capture better the behavior of the ERHW active layer. For each configuration, the R, C, and gA parameters were identified using a regular Python optimization library to minimize the estimation error over a period of ten winter days. R represents the fabric’s thermal resistance, while C is its thermal inertia. The term gA denotes the solar aperture, the fraction of global solar radiation entering the indoor space, and Ir is the incident global solar radiation. The parameter bounds were determined with an iterative process combining manual and automatic identification. The selected topology is depicted in
Figure 4. It connects the active layer (Tal) only to the thermal mass (Tw), with no outdoor connection. The identified parameters yielded a Normalized Root Mean Square Error (NRMSE) of less than 1.5%, demonstrating a high accuracy.
The simplified HP model is expressed as a linear equation to calculate both the Coefficient of Performance (COP) and the heating capacity (CAP). The coefficients were calculated with a linear regression from the manufacturer’s datasheet. The equation incorporates the supply temperature, which is assumed to be constant, and ambient temperature as independent variables. The MPC optimization algorithm decides the HP’s operation, distributing heat across the system. The distribution installation has a capacity limit estimated at 40 kW.
Each storage tank is modeled as a single-node RC model, capturing the dynamics of the interior tank temperature. This representation is depicted in
Figure 4. The tanks’ thermal properties and RC values for simulating the tanks are determined based on the insulation levels obtained from the manufacturer’s datasheet.
The ventilation system incorporates a Heat Exchanger (HX) to recover waste heat. The simplified model, presented in this paper, is characterized by a simplified heat balance equation. For simplification, a constant interior temperature at 21 °C is assumed, the indoor setpoint, facilitating the computation of the HX exhaust inlet condition.
The electric power output of the PV system is determined by a function that considers the PV cell temperature, ambient temperature, and the total solar horizontal irradiation. The development of this simplified PV model is based on the PVGIS model [
32].
2.2.3. Optimization Criteria
The optimization algorithm optimizes a specific objective over a defined prediction horizon, aiming to generate an optimal plan for the electric and thermal operations within a specified time horizon. The four optimization criteria, developed as functions, are as follows:
CO2 emissions (CO2): Minimize building operation emissions, calculated from the negative balance of electric energy imported from the grid using a per kWh emission coefficient which varies temporally, as in Equation (2):
where
is the negative balance of electricity imported from the grid integrated over time.
Cost (Cost): Minimize electricity costs, calculated from grid-imported and exported energy, and buying and selling prices, which varies temporally, as in Equation (3):
Final energy (FE): Minimize the HP electric consumption (
), based on the sum for the SH and DHW needs, as in Equation (4):
is the positive balance of the electricity exported to the grid and
is the negative balance of the electricity imported from the grid. The calculation boundaries are set to the building site according to the REHVA Technical Guidance for EPBD implementation [
33].
2.3. Remote Implementation via Messaging Systems
StreamHandler is a messaging solution that utilizes a secure and highly available Apache Kafka deployment [
34]. Apache Kafka is an open-source platform that supports real-time data pipelines and streaming applications with a topic-based publish–subscribe model. This model ensures efficient, scalable data handling and is widely used across industries for real-time data processing and event-driven architectures.
Kafka plays a crucial role in the framework by facilitating robust data exchange and synchronization across different simulation nodes. Nodes publish simulation data, events, or control messages to Kafka topics, allowing other nodes to subscribe and respond in real time. This setup promotes asynchronous communication and simplifies interactions among components, also supporting long-term data storage for subsequent analysis.
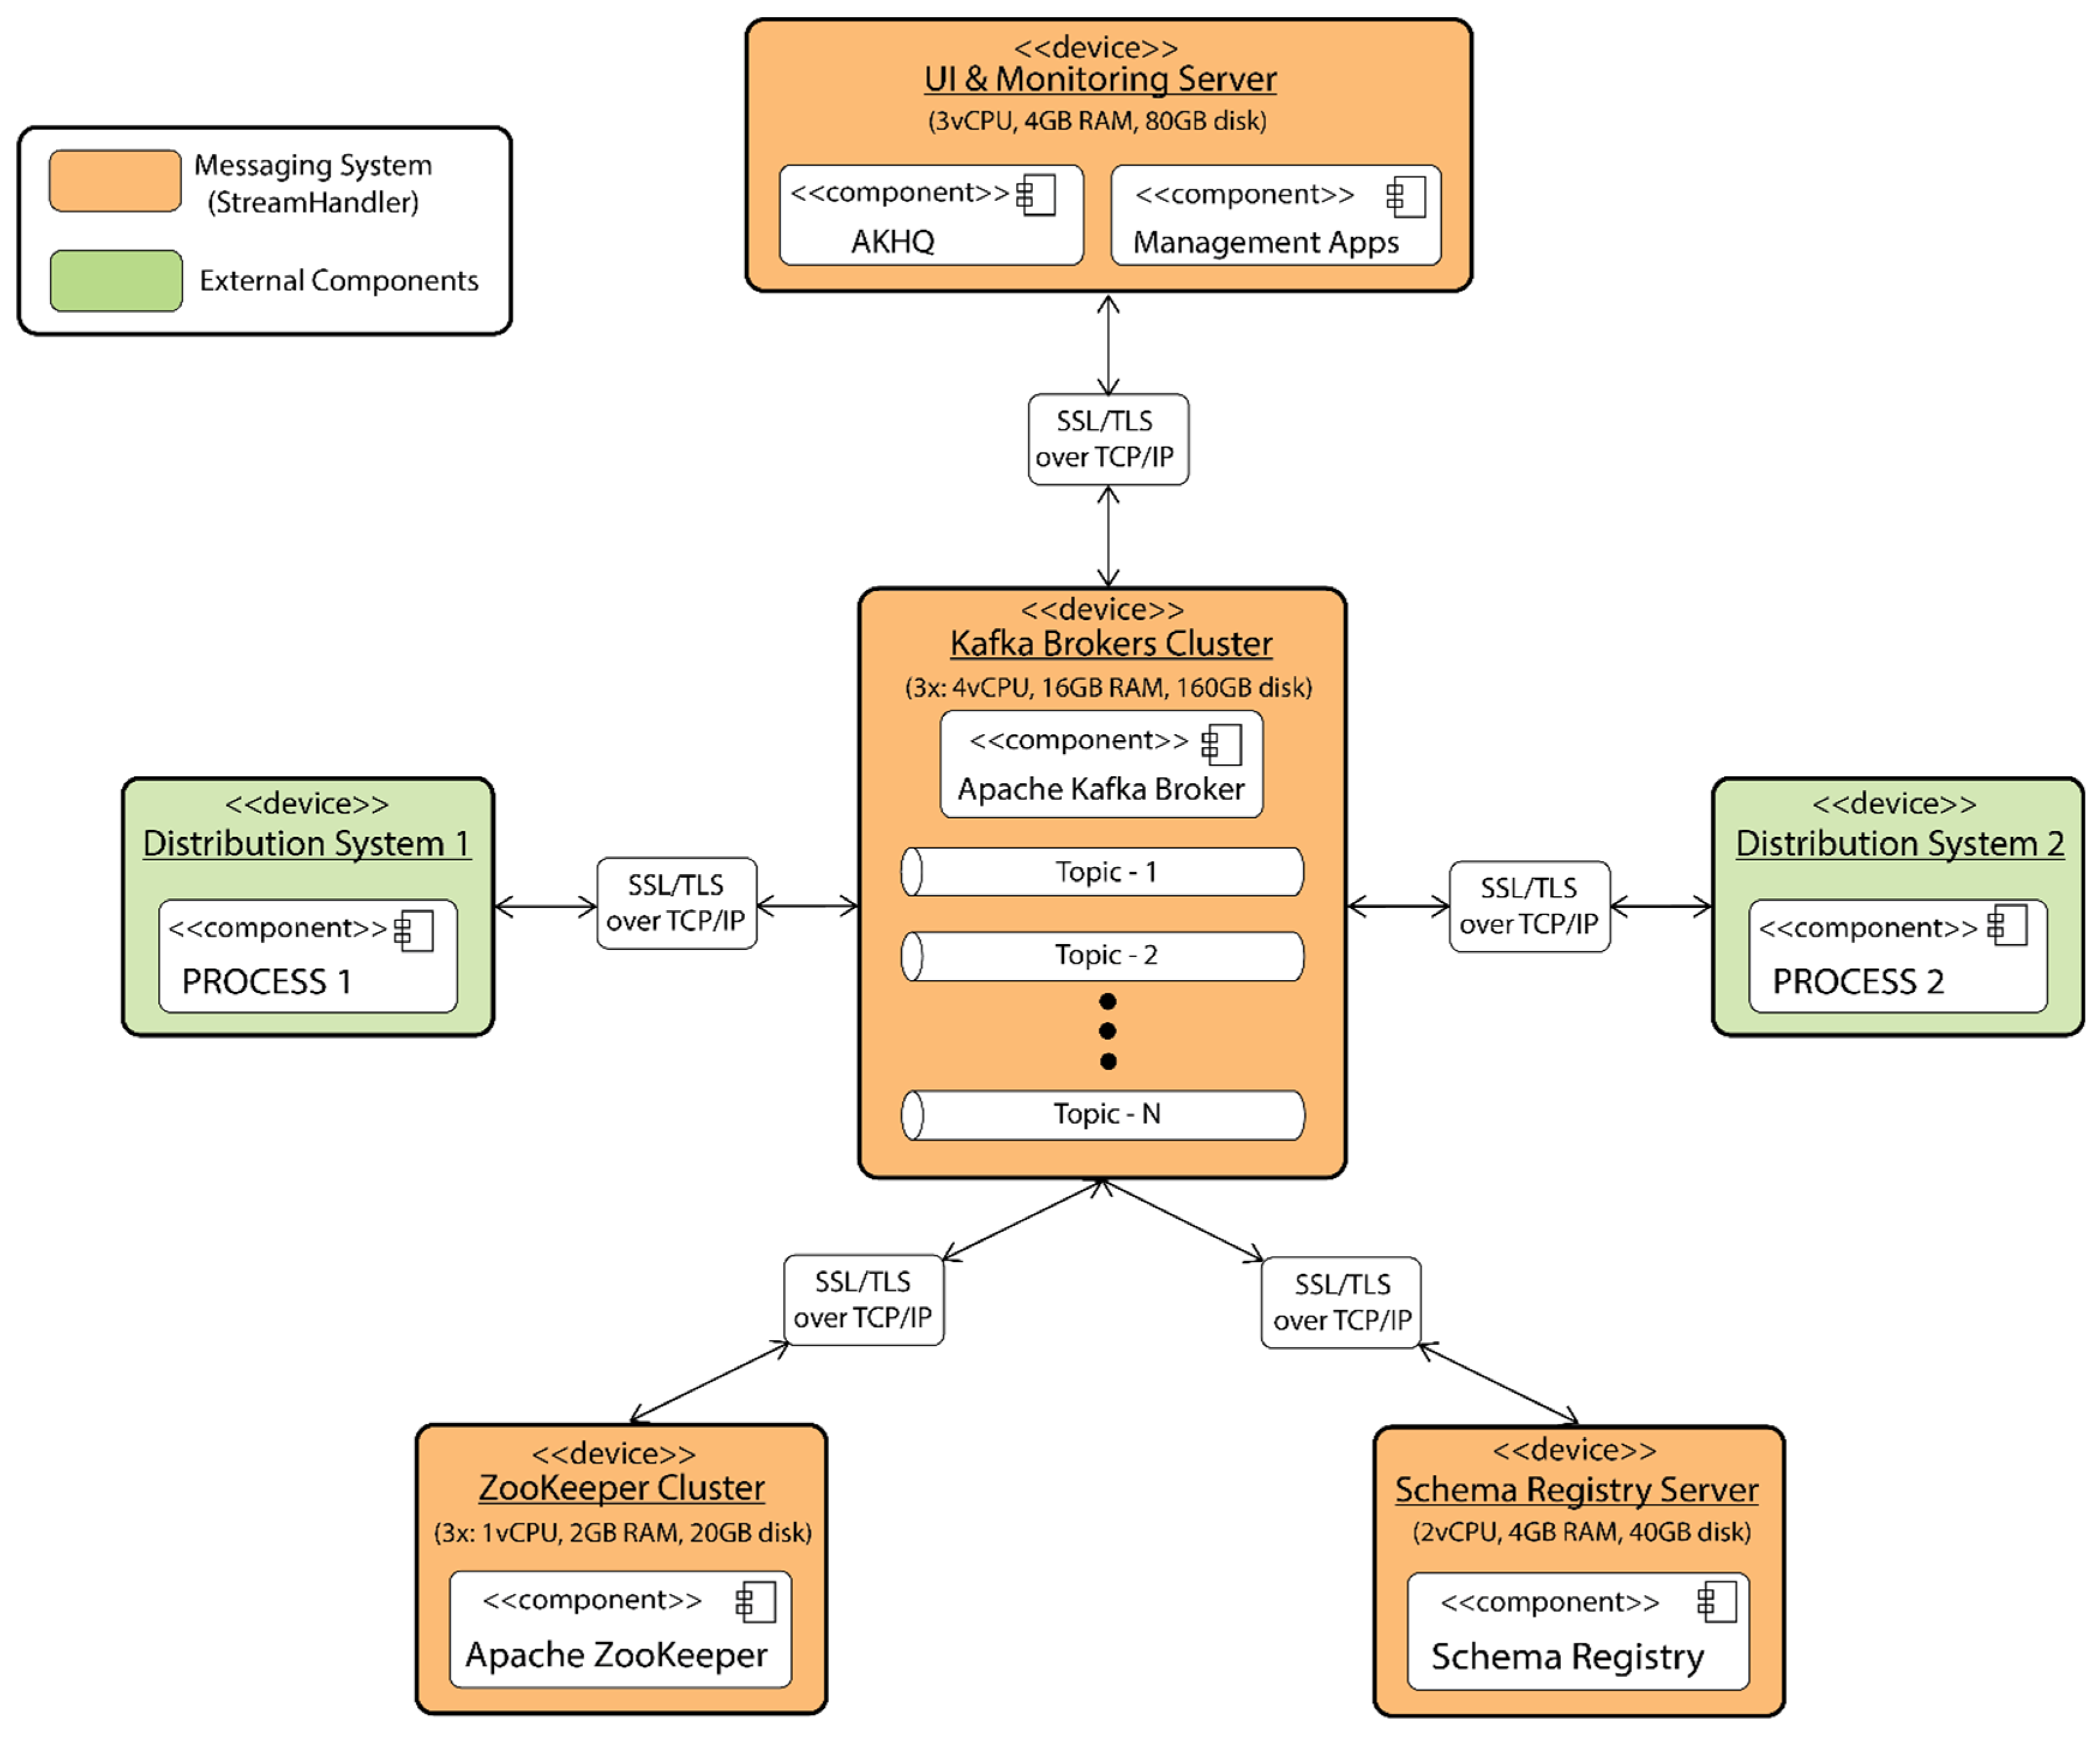
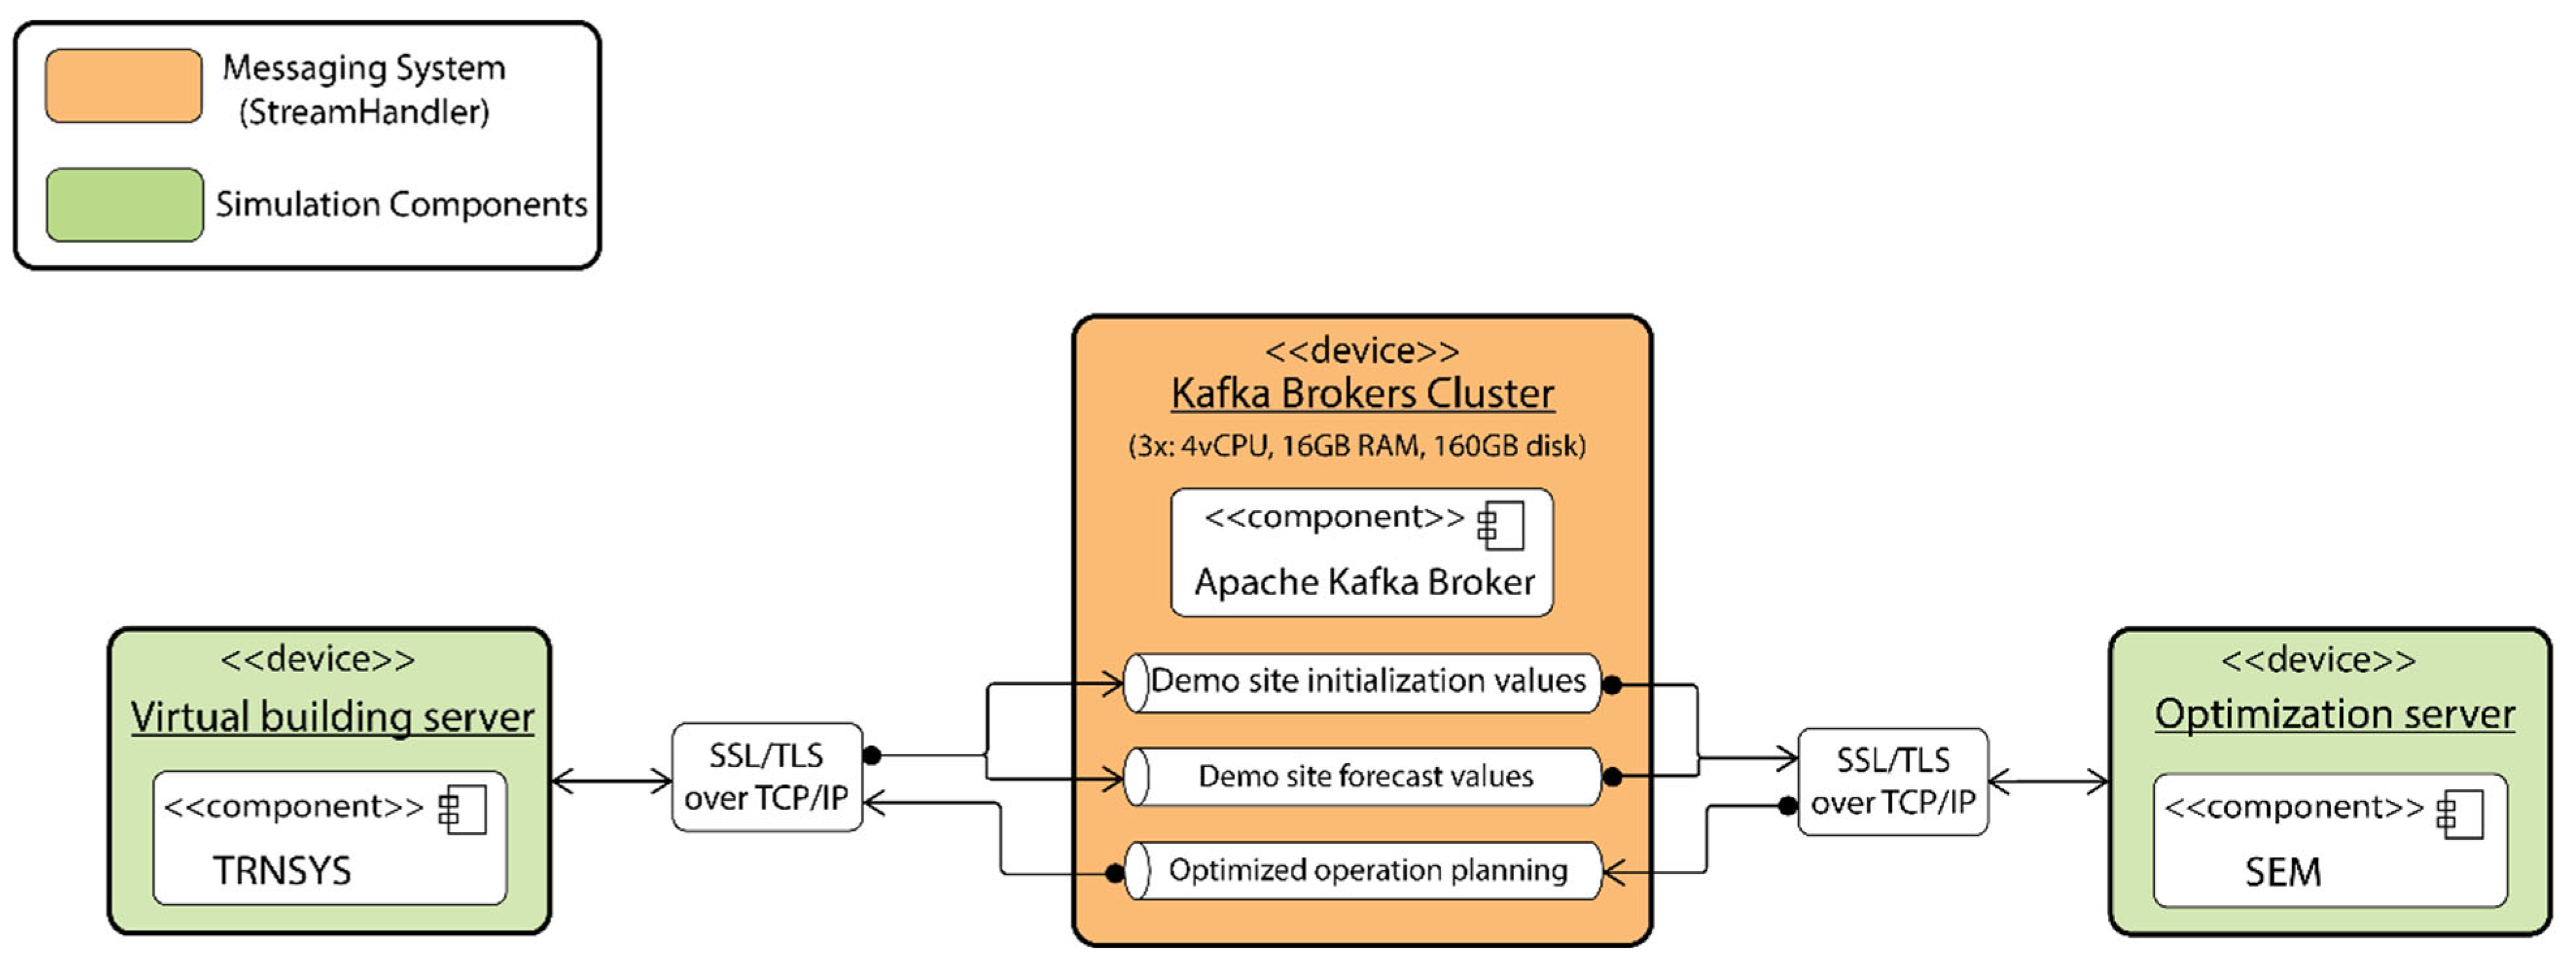
Figure 5 shows a generic deployment diagram of the distributed simulation platform, detailing the interaction between hardware (virtual machines/servers) and software components. These machines are Docker-enabled [
35], which supports container management. The color coding in the diagram highlights the functions of the hosted components.
The main components of StreamHandler (orange-colored devices) and their roles are described in the following.
The system’s core comprises the Kafka Brokers Cluster, serving as the storage layer for the data streams. Messages/records are stored in topics and partitions within this cluster, ensuring distributed, durable, and fault-tolerant storage.
The ZooKeeper Cluster manages the leadership election of Kafka brokers and offers centralized services for configuration, synchronization, and service discovery (naming registry).
The Schema Registry Server serves as a centralized repository for managing, validating, and serializing/deserializing schemas for topic message data over the network.
The User Interface (UI) and Monitoring Server includes the Apache Kafka Cluster Visualization (AKHQ) for managing and viewing the data inside of the Kafka Brokers Cluster, along with other management-related software.
The StreamHandler deployment utilizes replication across Kafka brokers to ensure data integrity and accuracy, even during packet loss or delays. Kafka’s fault-tolerant design partitions each topic and replicates it across multiple brokers, preventing data loss and ensuring redundancy. If a broker fails, the data remain accessible from others, maintaining continuous service. Kafka guarantees exactly-once semantic [
36], which is crucial for reliable synchronization between simulation nodes.
Data Integrity and Accuracy: Kafka’s commit log structure processes data sequentially, enabling recovery during failures or disconnections. This structure, along with offset management, maintains order and completeness, supporting at-least-once and exactly once delivery semantics. In the StreamHandler setup, topic partitions ensure the ordered processing of records, while automatic offset management allows consumers to resume from the last point, thereby ensuring accuracy.
The Schema Registry upholds data integrity by managing schemas across Kafka topics, ensuring records conform to predefined structures. Incompatible data structures trigger flags, reducing errors and enhancing data flow reliability.
Handling of Packet Loss and Delays: Kafka’s replication and partitioning mitigate packet loss and network delays. Built-in retry mechanisms and tunable timeouts provide resilience against temporary interruptions, ensuring high availability and minimizing data loss through acknowledgments at each processing stage.
Security Considerations: Security in the Kafka-based StreamHandler is maintained through encryption, authentication, and access control. Data transmitted between brokers and clients are encrypted using SSL/TLS, with authentication enforced via SSL certificates to restrict access to authorized entities. Role-based access control is managed through Kafka’s access control lists, securing components like ZooKeeper and the Schema Registry against unauthorized interactions.
4. Results
This section presents the results of the tests. Computational results for cases 1 and 7 are first presented to expose the quality and reliability of the remote operation. Following that, a summary of all performance results is presented to demonstrate that the performance of the SEM is not conditioned by remote operation. Finally, the SEM performance is expanded in detail with the following two cases: 2 weeks under winter conditions (case 7) according to the FE criterion, and 72 hours under winter conditions (case 1), comparing the FE criterion with the default control.
4.1. Runtime Performance (Cases 1 and 7)
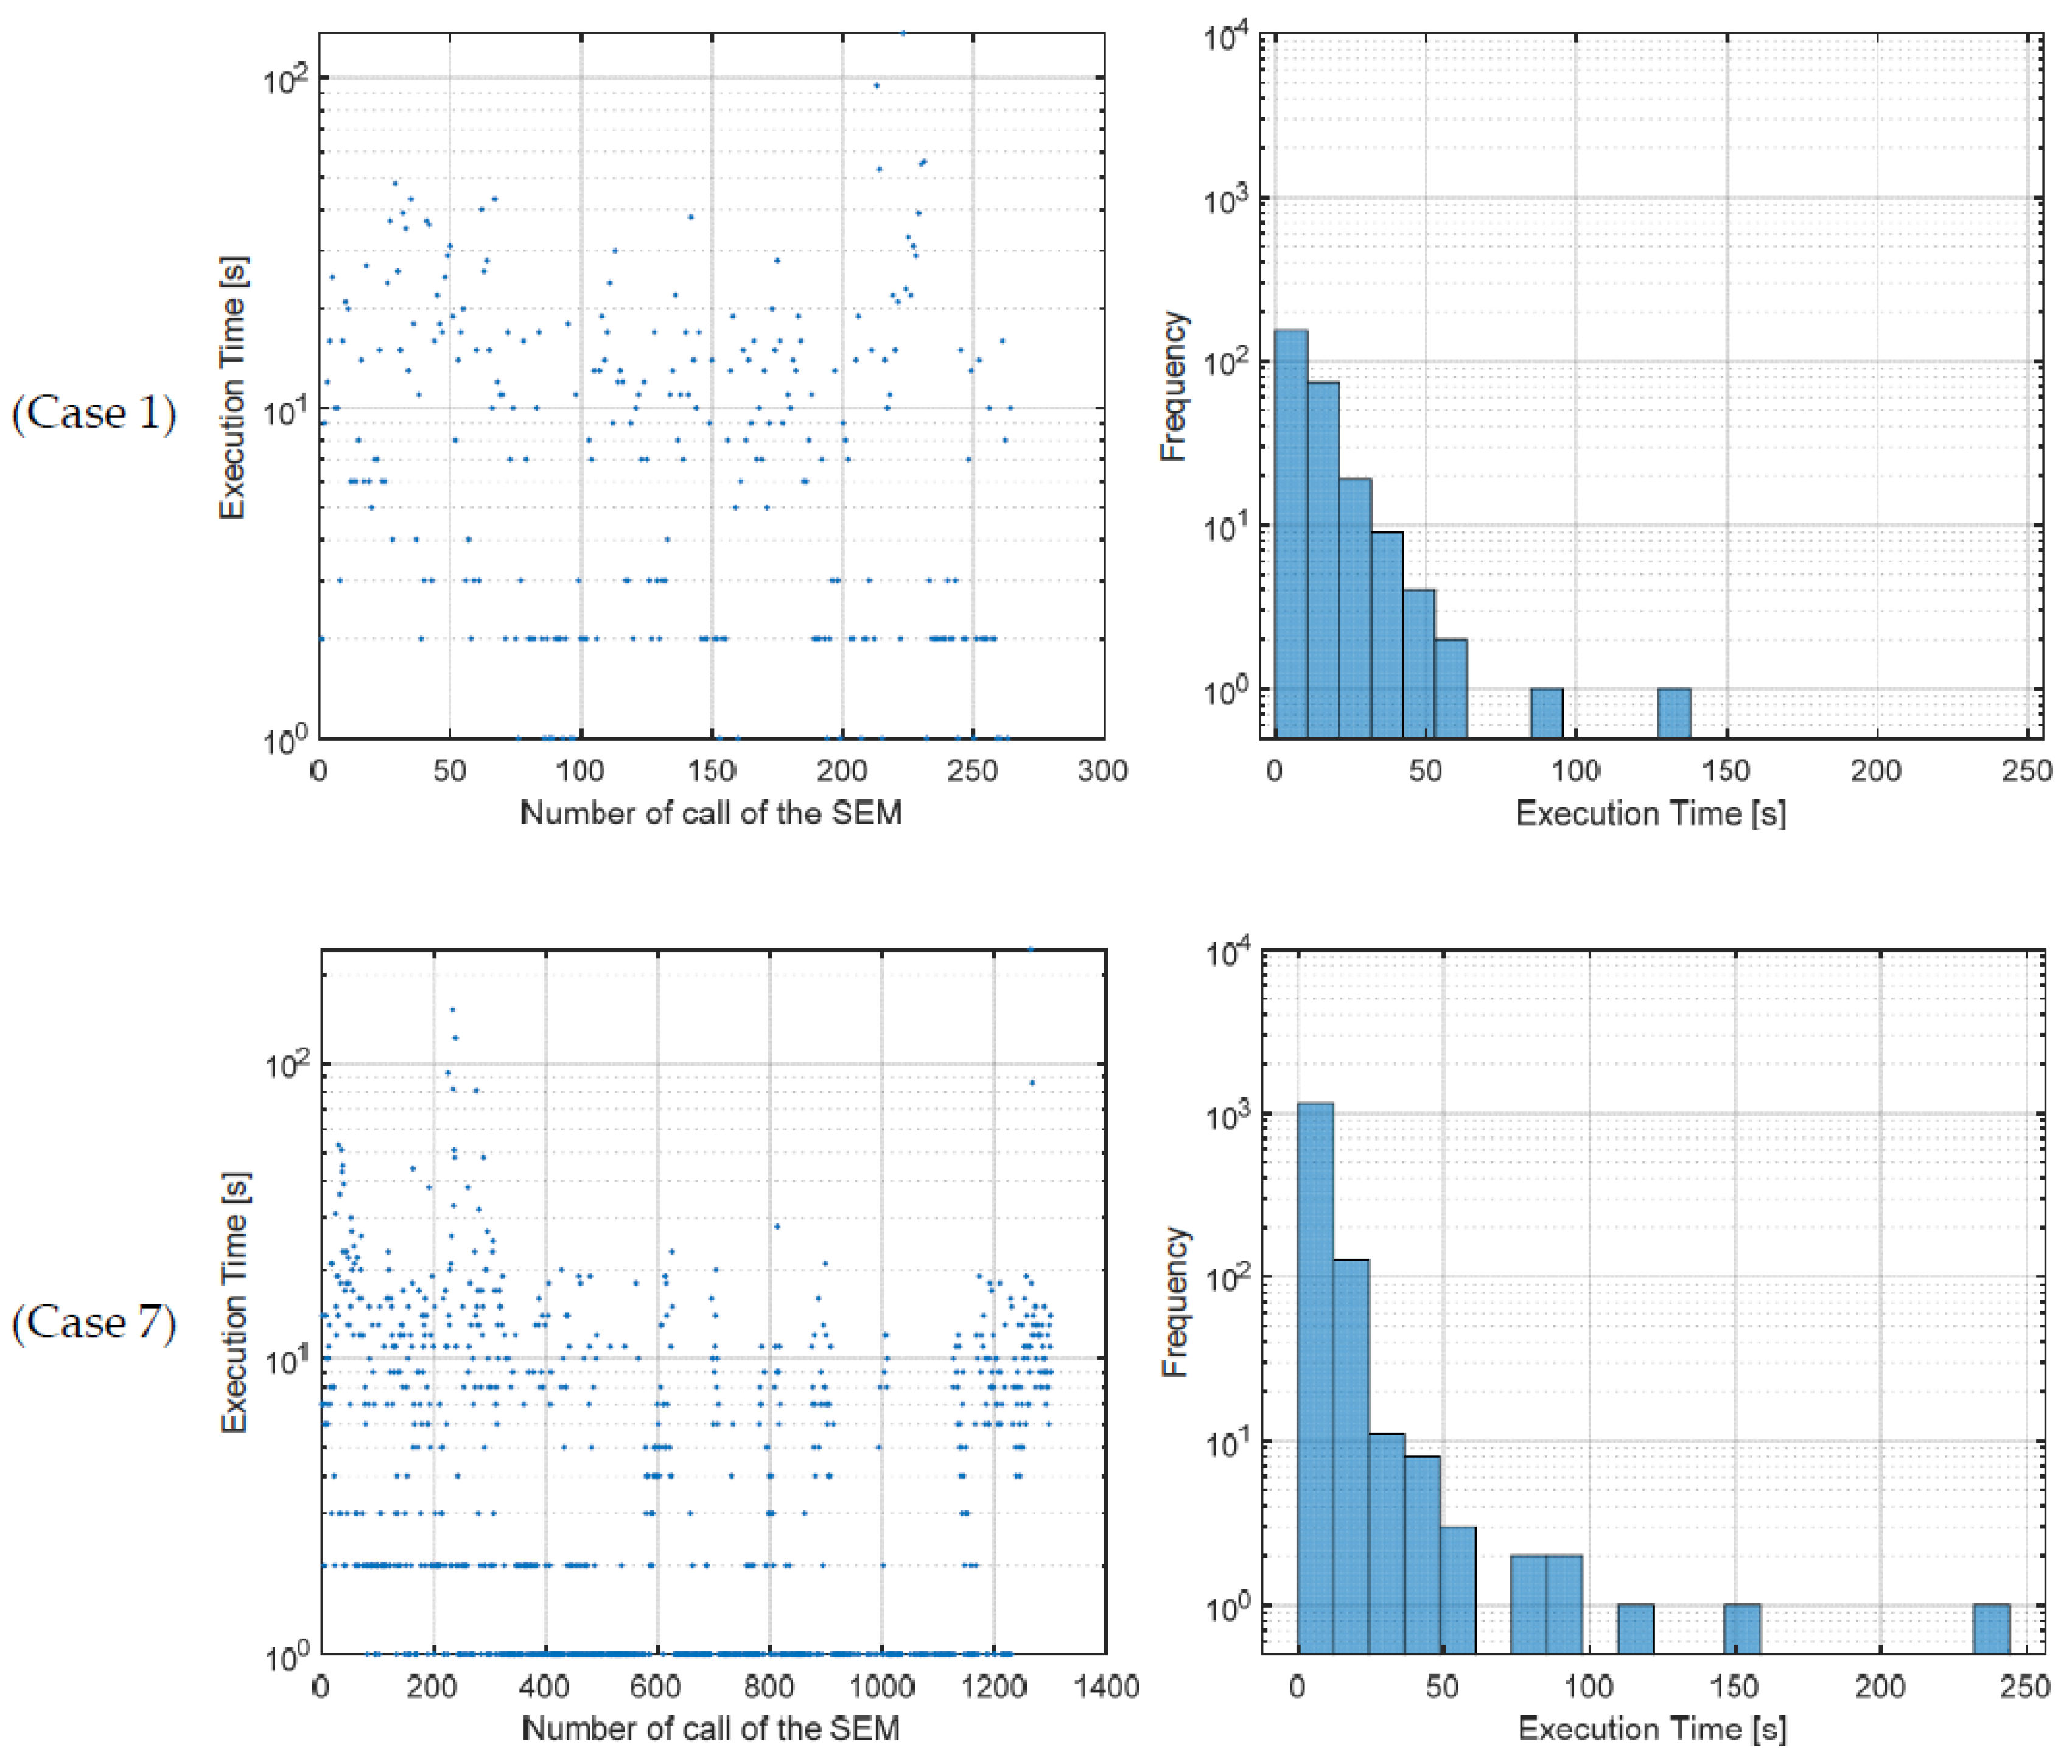
The time required by the SEM to optimize each timestep for cases 1 and 7 is detailed in
Figure 10 and
Table 2, respectively. For case 1, it is notable that most of the optimization procedures were completed, with a mean execution time of 11 s and a median of 8 s. However, some cases required more computationally intensive calculations, with maximum execution times reaching up to 137 s. The analysis of the sequential execution of the tasks indicates a relatively uniform distribution of execution times throughout the operational period, with no discernible peak periods. In case 7, the SEM was invoked and executed a total of 1301 times. On average, the execution time was recorded at 5.37 s, with a standard deviation of 11.75 s. The analysis of the temporal distribution of sequential calls reveals that scenarios requiring a longer computational time tended to occur predominantly at the initial timesteps of the scenario, with the maximum execution time recorded at 244 s. Notably, in both cases, the maximum values remained well below the prescribed 15-min control cycle limit, underscoring the robustness and reliability of the system for sustained long-term operations.
4.2. Performance in All of the Cases
The outcomes of the test scenarios defined in
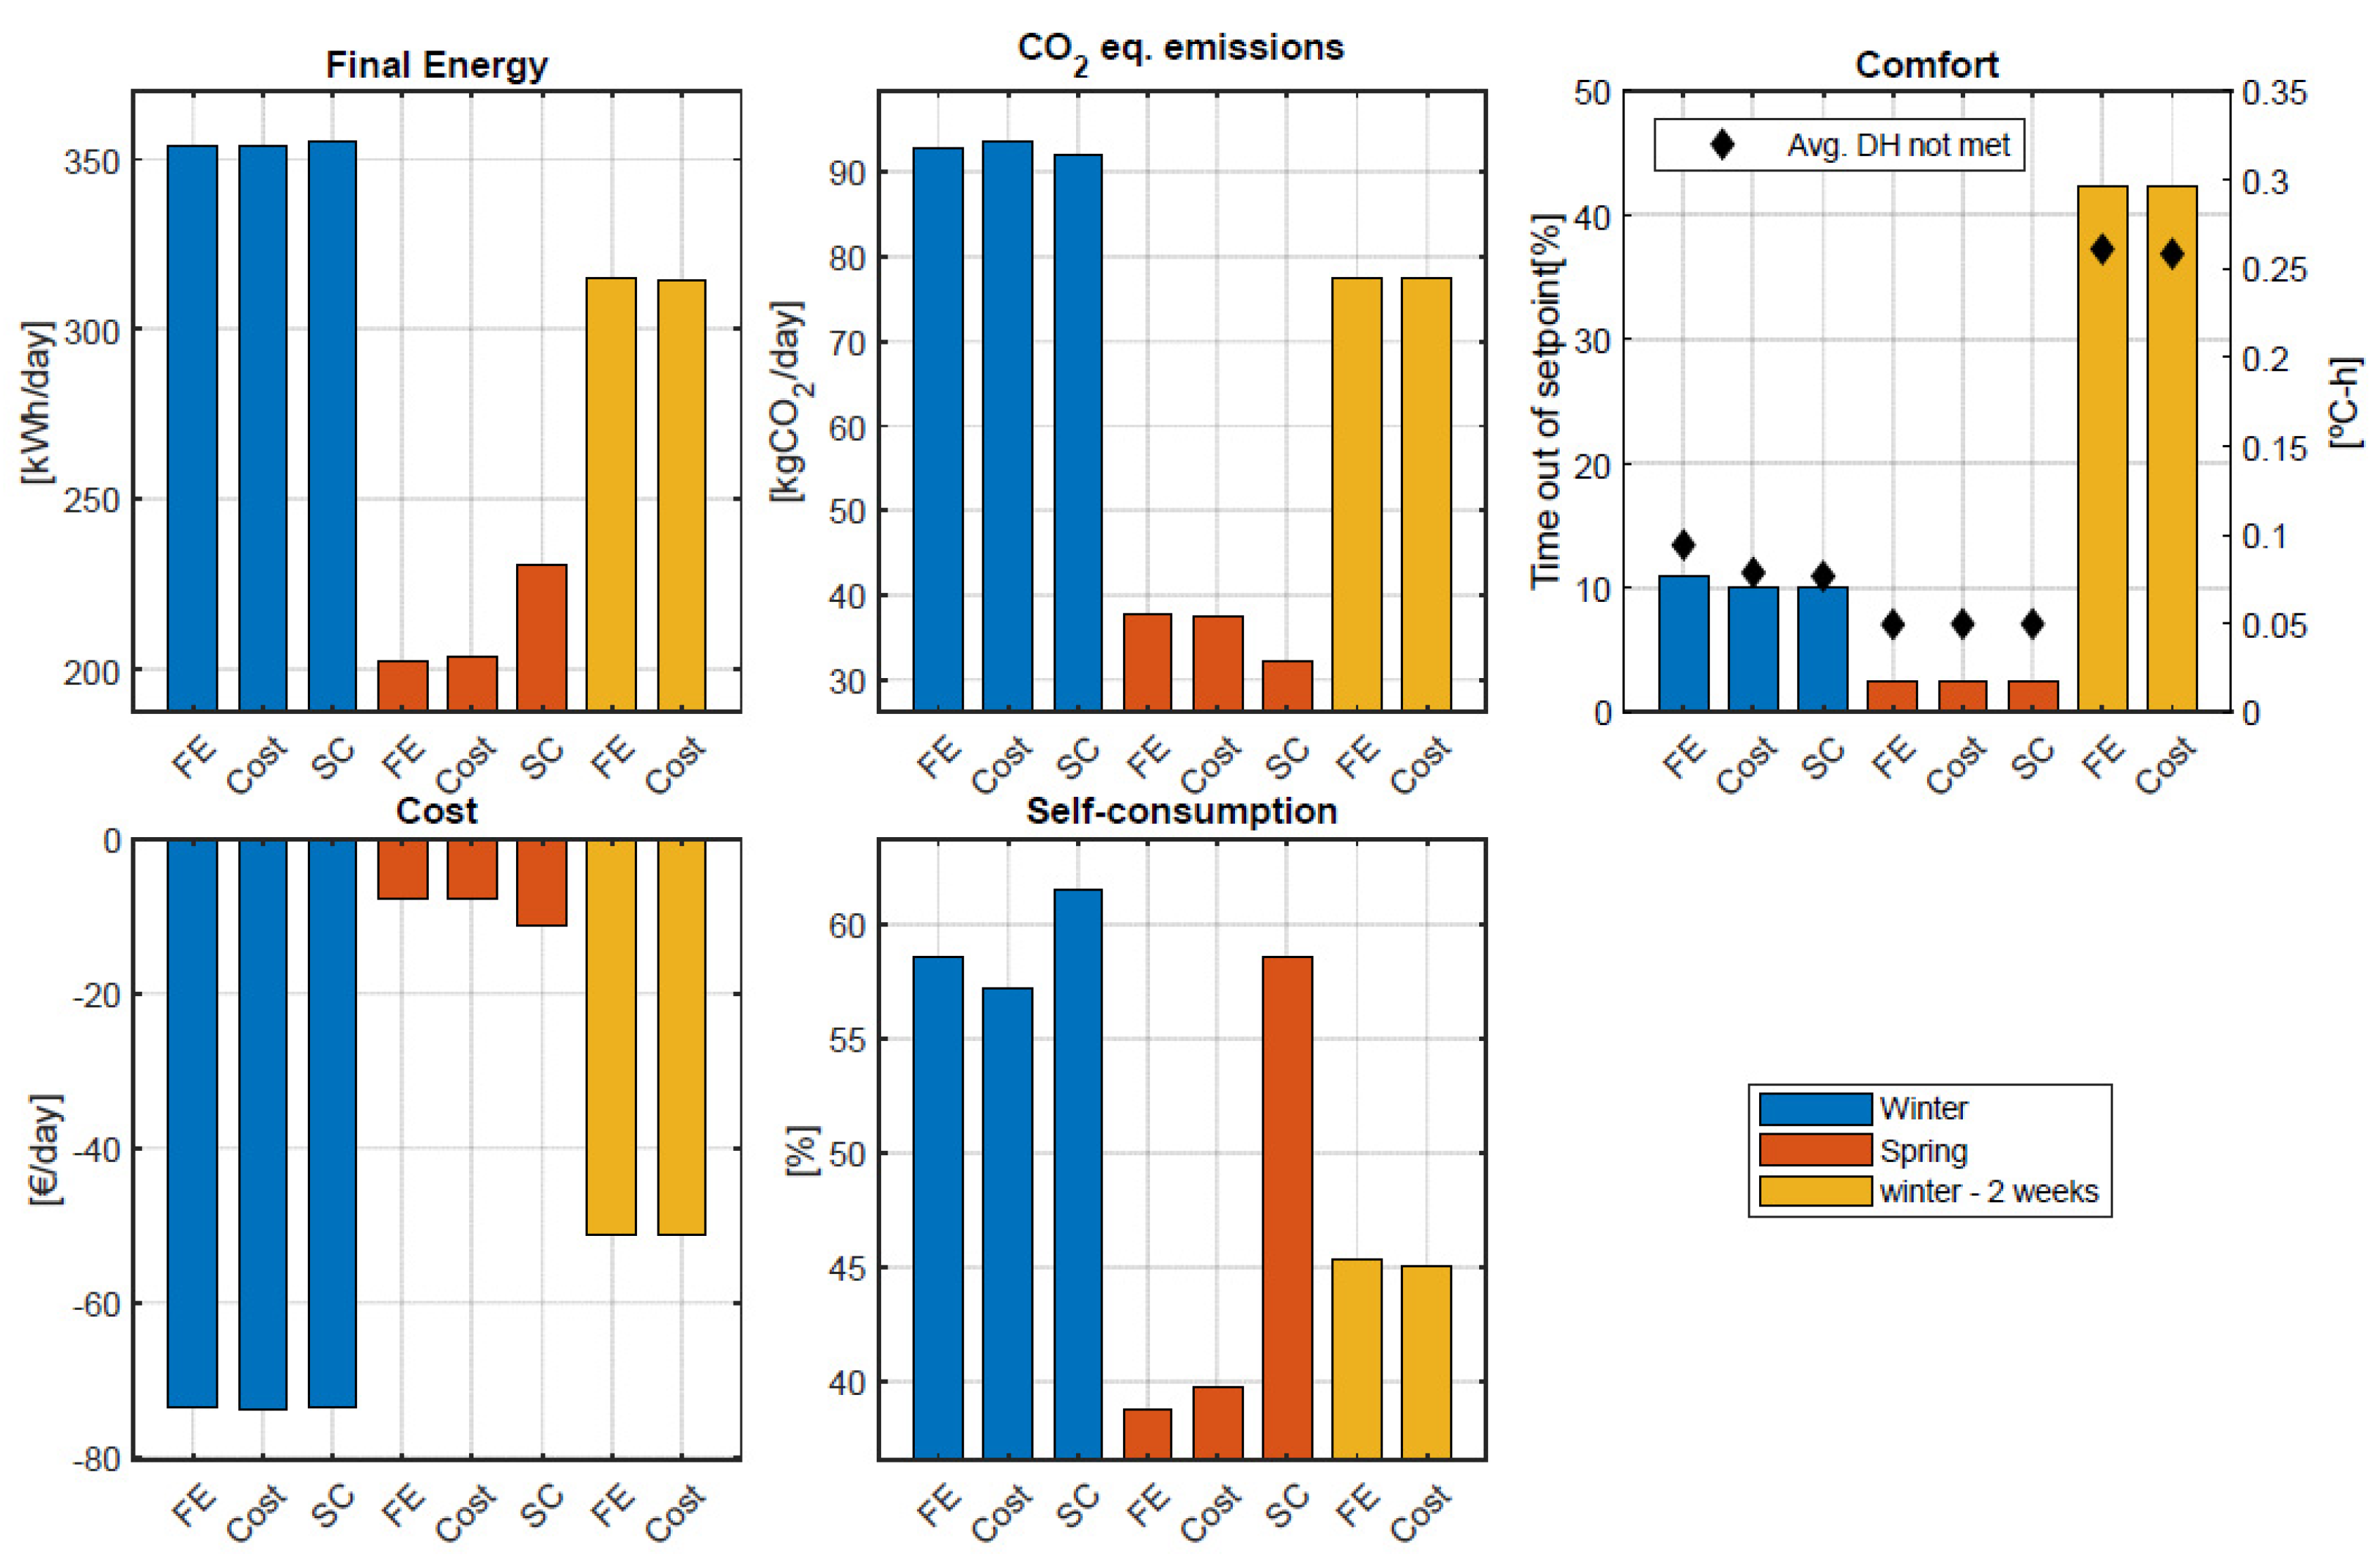
Section 3.2 are elucidated in this section. It can be observed that the SEM can effectively operate remotely, and that it achieves its target to optimize the operation results based on the selected criteria, with compliance to the comfort setpoint measured in terms of the average of degree-hours not met. The results for each day of operation are presented in
Figure 11. The indicators used to quantify the system’s performance are Equations (1)–(4) from the objective functions defined in
Section 2.2.3. The units are as follows: the FE in kWh/day, the Cost in EUR/day, kg of eq. CO
2/day, and the SC in %.
The FE and Cost criteria demonstrate a close alignment in outcomes, which is particularly evident in the Final Energy, CO2 emissions, and Cost indicators. Conversely, the SC criterion exhibits greater variability. This discrepancy arises from the distinct objectives of the FE and Cost criteria, both aimed at minimizing imported energy, thereby producing similar results. This similarity is particularly pronounced under the conditions of uniform electric market costs across all hours of the day. In contrast, the SC criterion aims at minimizing the exported energy, leading to increased energy consumption.
The comparison reveals that the energy demand during the spring season is notably lower than that of the winter season. Moreover, the two-week operational period also exhibits reduced energy needs. This observation stems from the initial phase of increased energy consumption, primarily aimed at charging the thermal masses of the building. Subsequently, the system experiences a decline in energy demand during the latter part of the period, primarily tasked with compensating for thermal losses.
Comfort compliance is measured as the Tin not meeting the setpoint of 21 °C in terms of the time out of comfort and the deviation in degree-hours. As can be expected, the Tin falls below the setpoint more often in winter and in more exigent cases, with little difference between criteria. Comfort deviations can be explained by the accuracy of the simplified models, which may lead the optimizer to underestimate the heating power demand with anticipation. The worst comfort deviation is reached in case 7, with an average deviation of 0.261 degree-hours and a maximum value of 0.851 degree-hours.
In conclusion, when evaluating criteria within the same scenario, the SEM system consistently achieves the desired optimal outcome, although, in some cases, it may lead to similar results, especially for winter periods with high demand and limited degrees of freedom.
4.3. Example of Long-Run Scenario (Case 7)
This section presents results of case 7 with the SEM optimizing a 2-week winter period with the FE criterion. The objective of the test was to demonstrate the effective thermal power control capabilities of the SEM, but also to underscore its stability and robustness during prolonged operational periods.
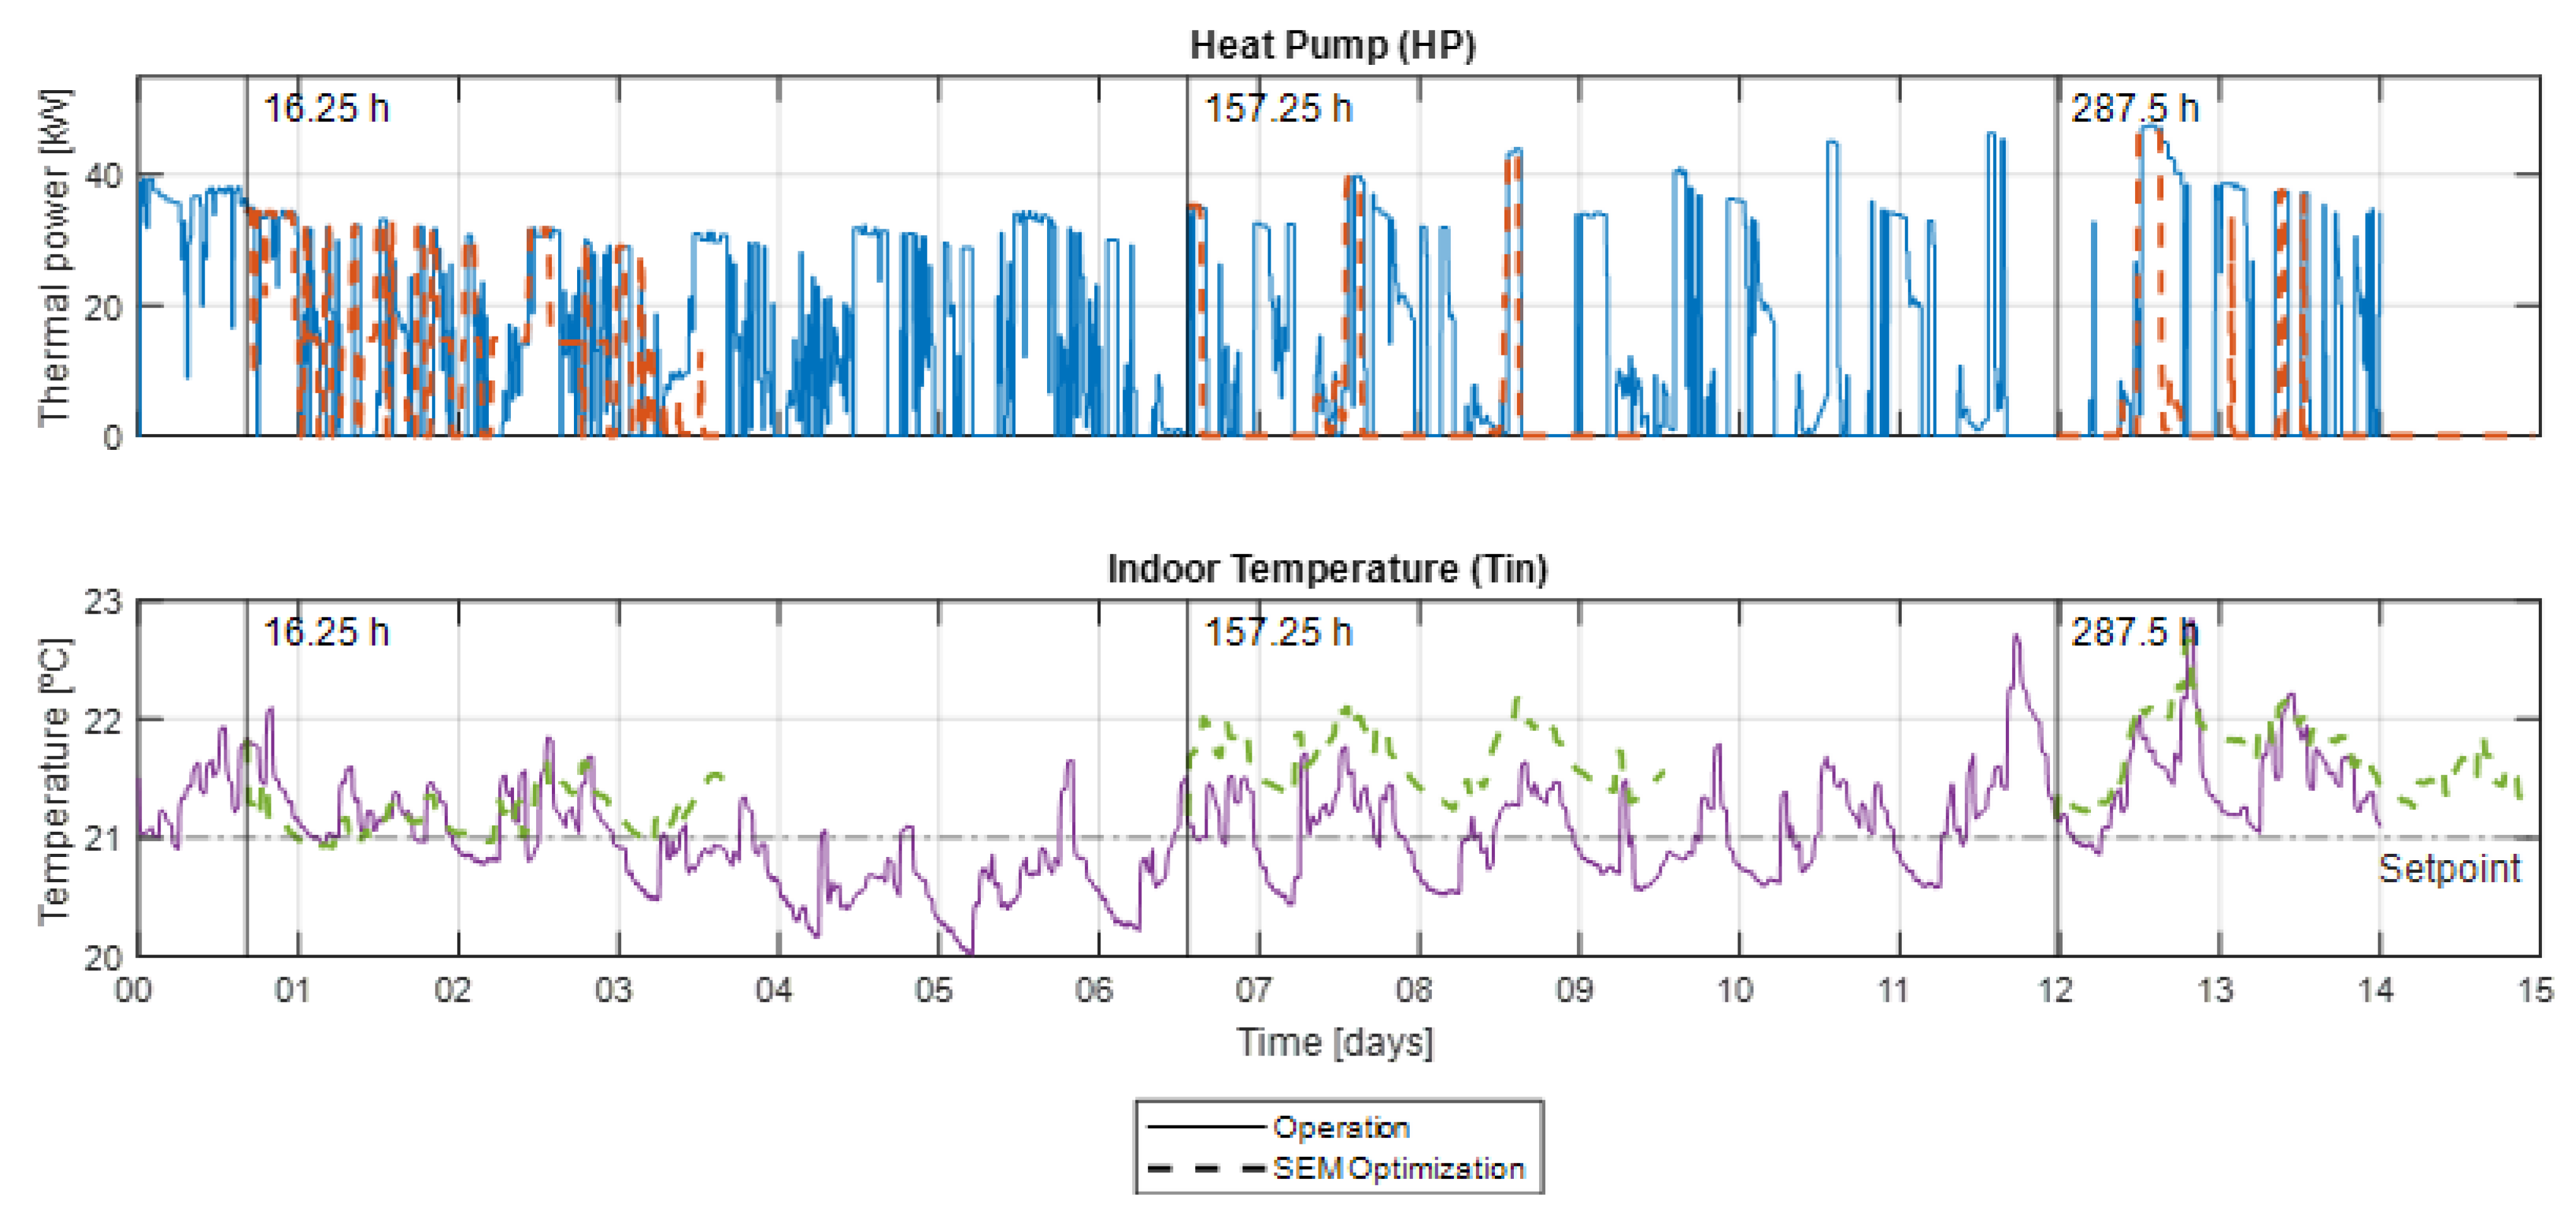
Figure 12 depicts the overlay of the SEM’s optimized planning on the measured operation within the building at three instances—the beginning, middle, and end of the scenario (16.25 h, 157.25 h, and 287.5 h, respectively). Generally, the SEM planning for the HP exhibits a consistent application with effective forecasting capabilities. The predictions reflect the outdoor temperature and solar radiation, while also reflecting internal heat gains attributed to occupancy. Notably, it accurately reproduces the observed mid-day temperature peaks.
Despite the SEM’s estimations maintaining the indoor temperature (Tin) consistently at the setpoint, there are instances where, due to inherent errors in the gray-box model, the Tin may slightly deviate below the setpoint without exceeding 1 °C.
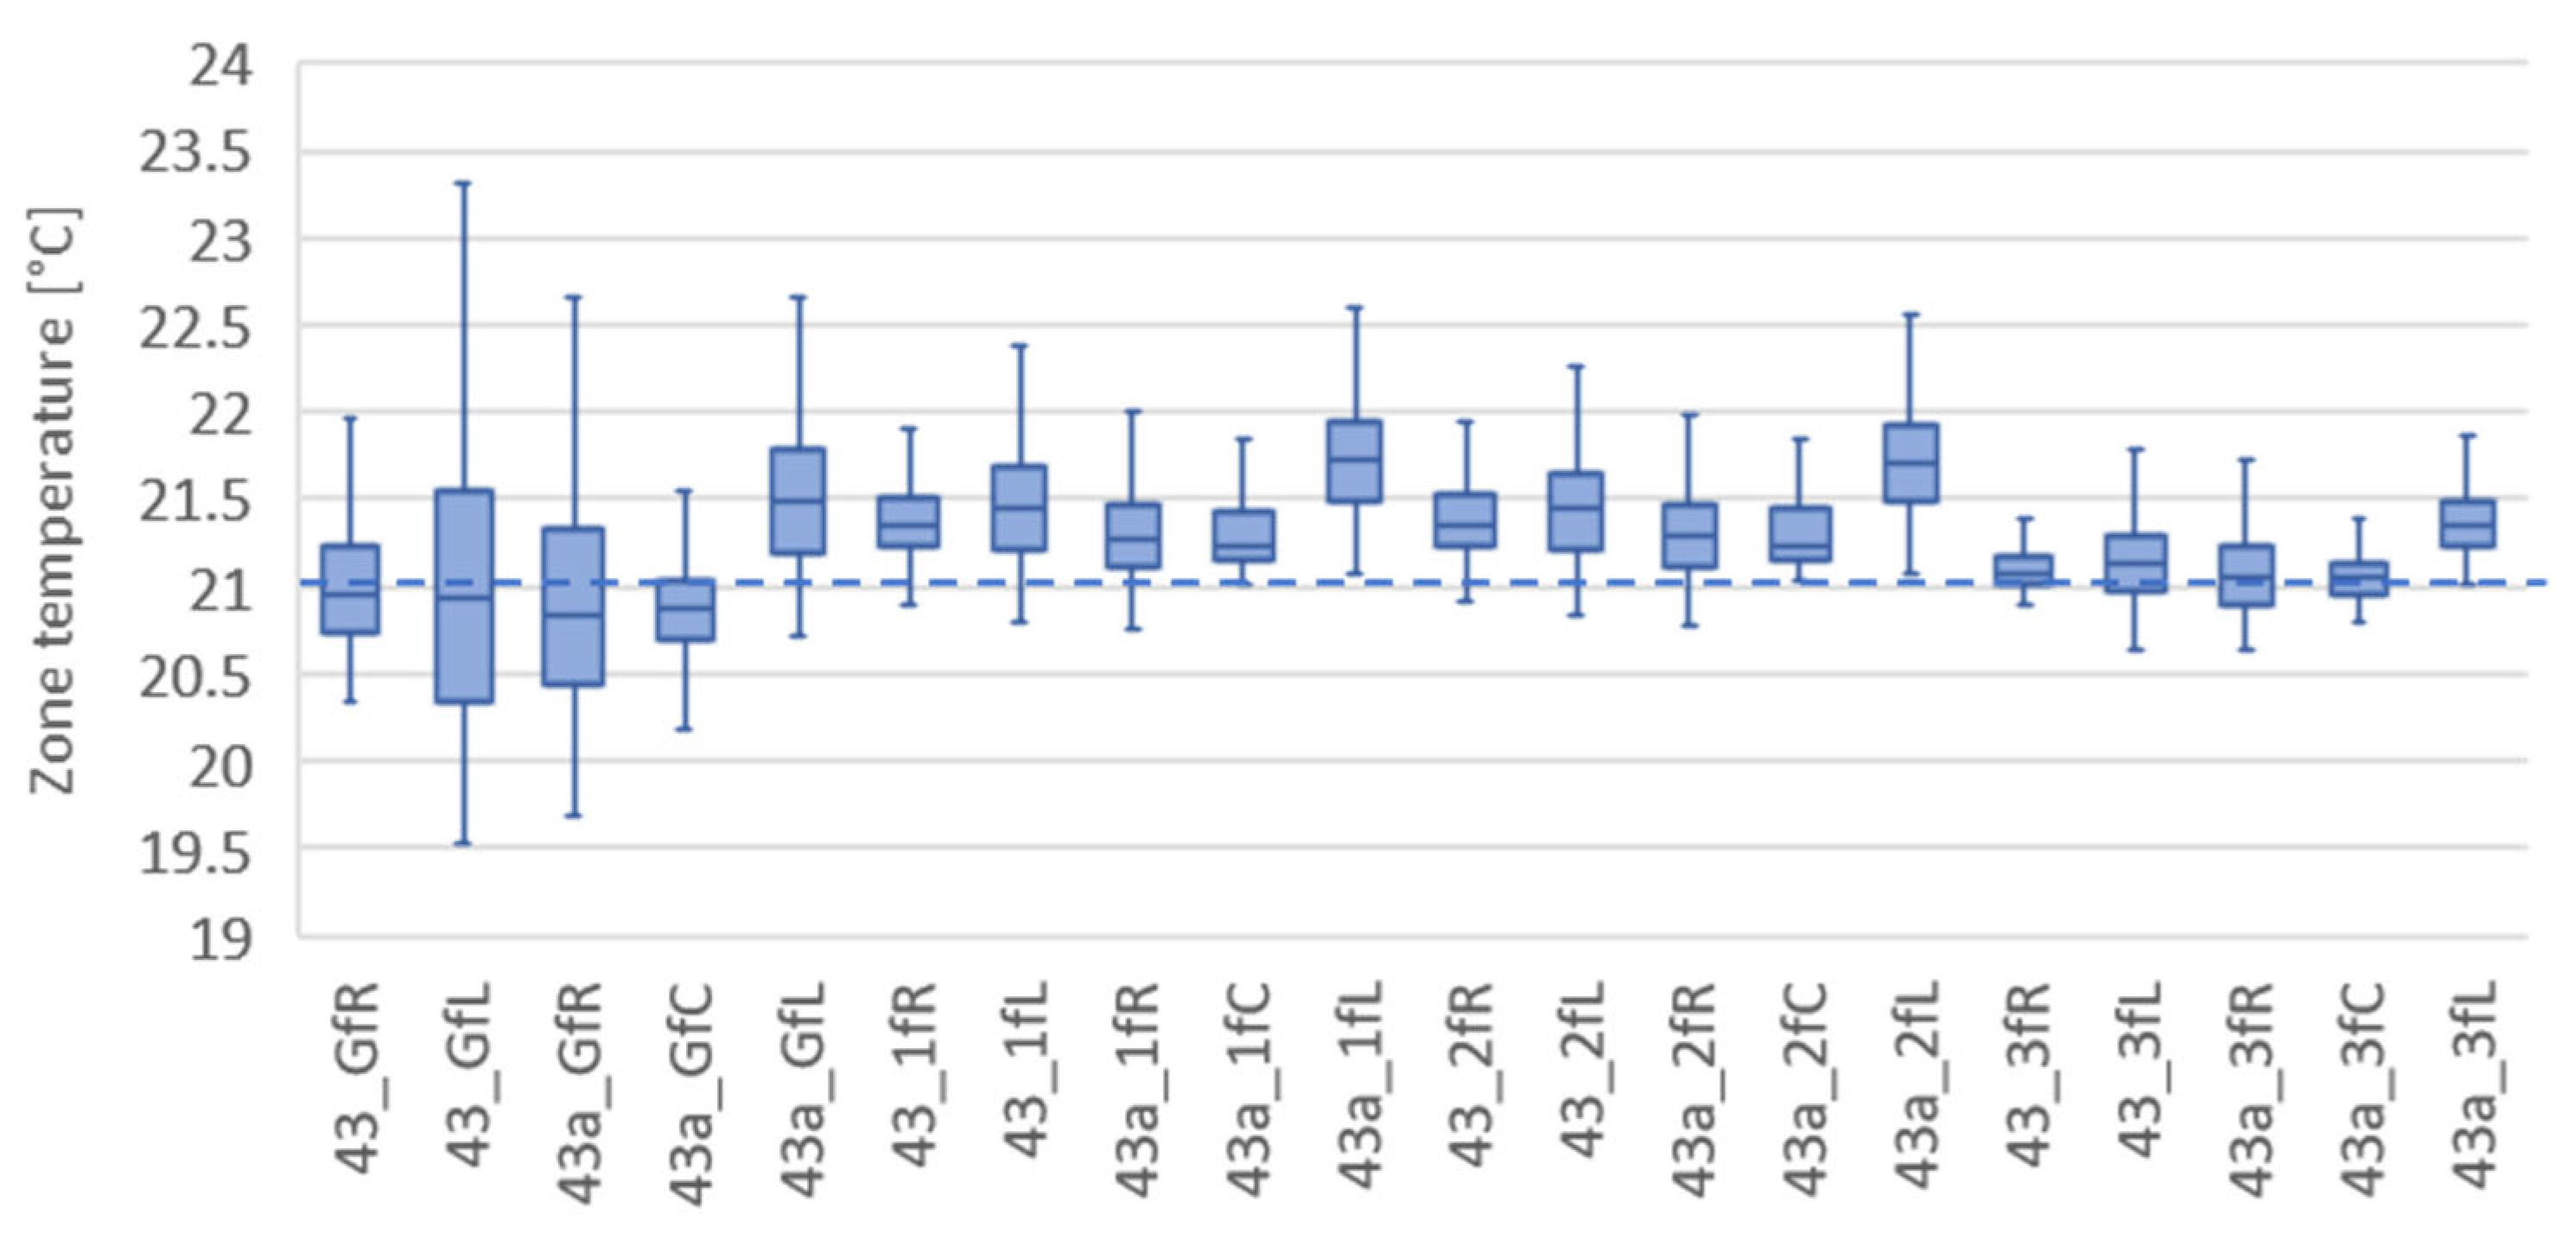
Regarding comfort compliance, since the SEM control is based on monitoring the Tin, the indoor temperature lumped variable, it is worth paying attention to the temperature distribution across the individual zones of the building, which is depicted in
Figure 13. It can be seen that all of the zones comply with being comfortable >75% (three quartiles) of the time, except for four zones on the ground floor, which are near to 50% (median), as well as four zones on floor three. This can be explained by the fact that the ground floor is above the cellar, an unconditioned space, and the third floor is under the roof, leading to increased heat losses. Nevertheless, this deviation is typically only 0.5 of the set temperature.
4.4. Comparison with Default Control (Case 1)
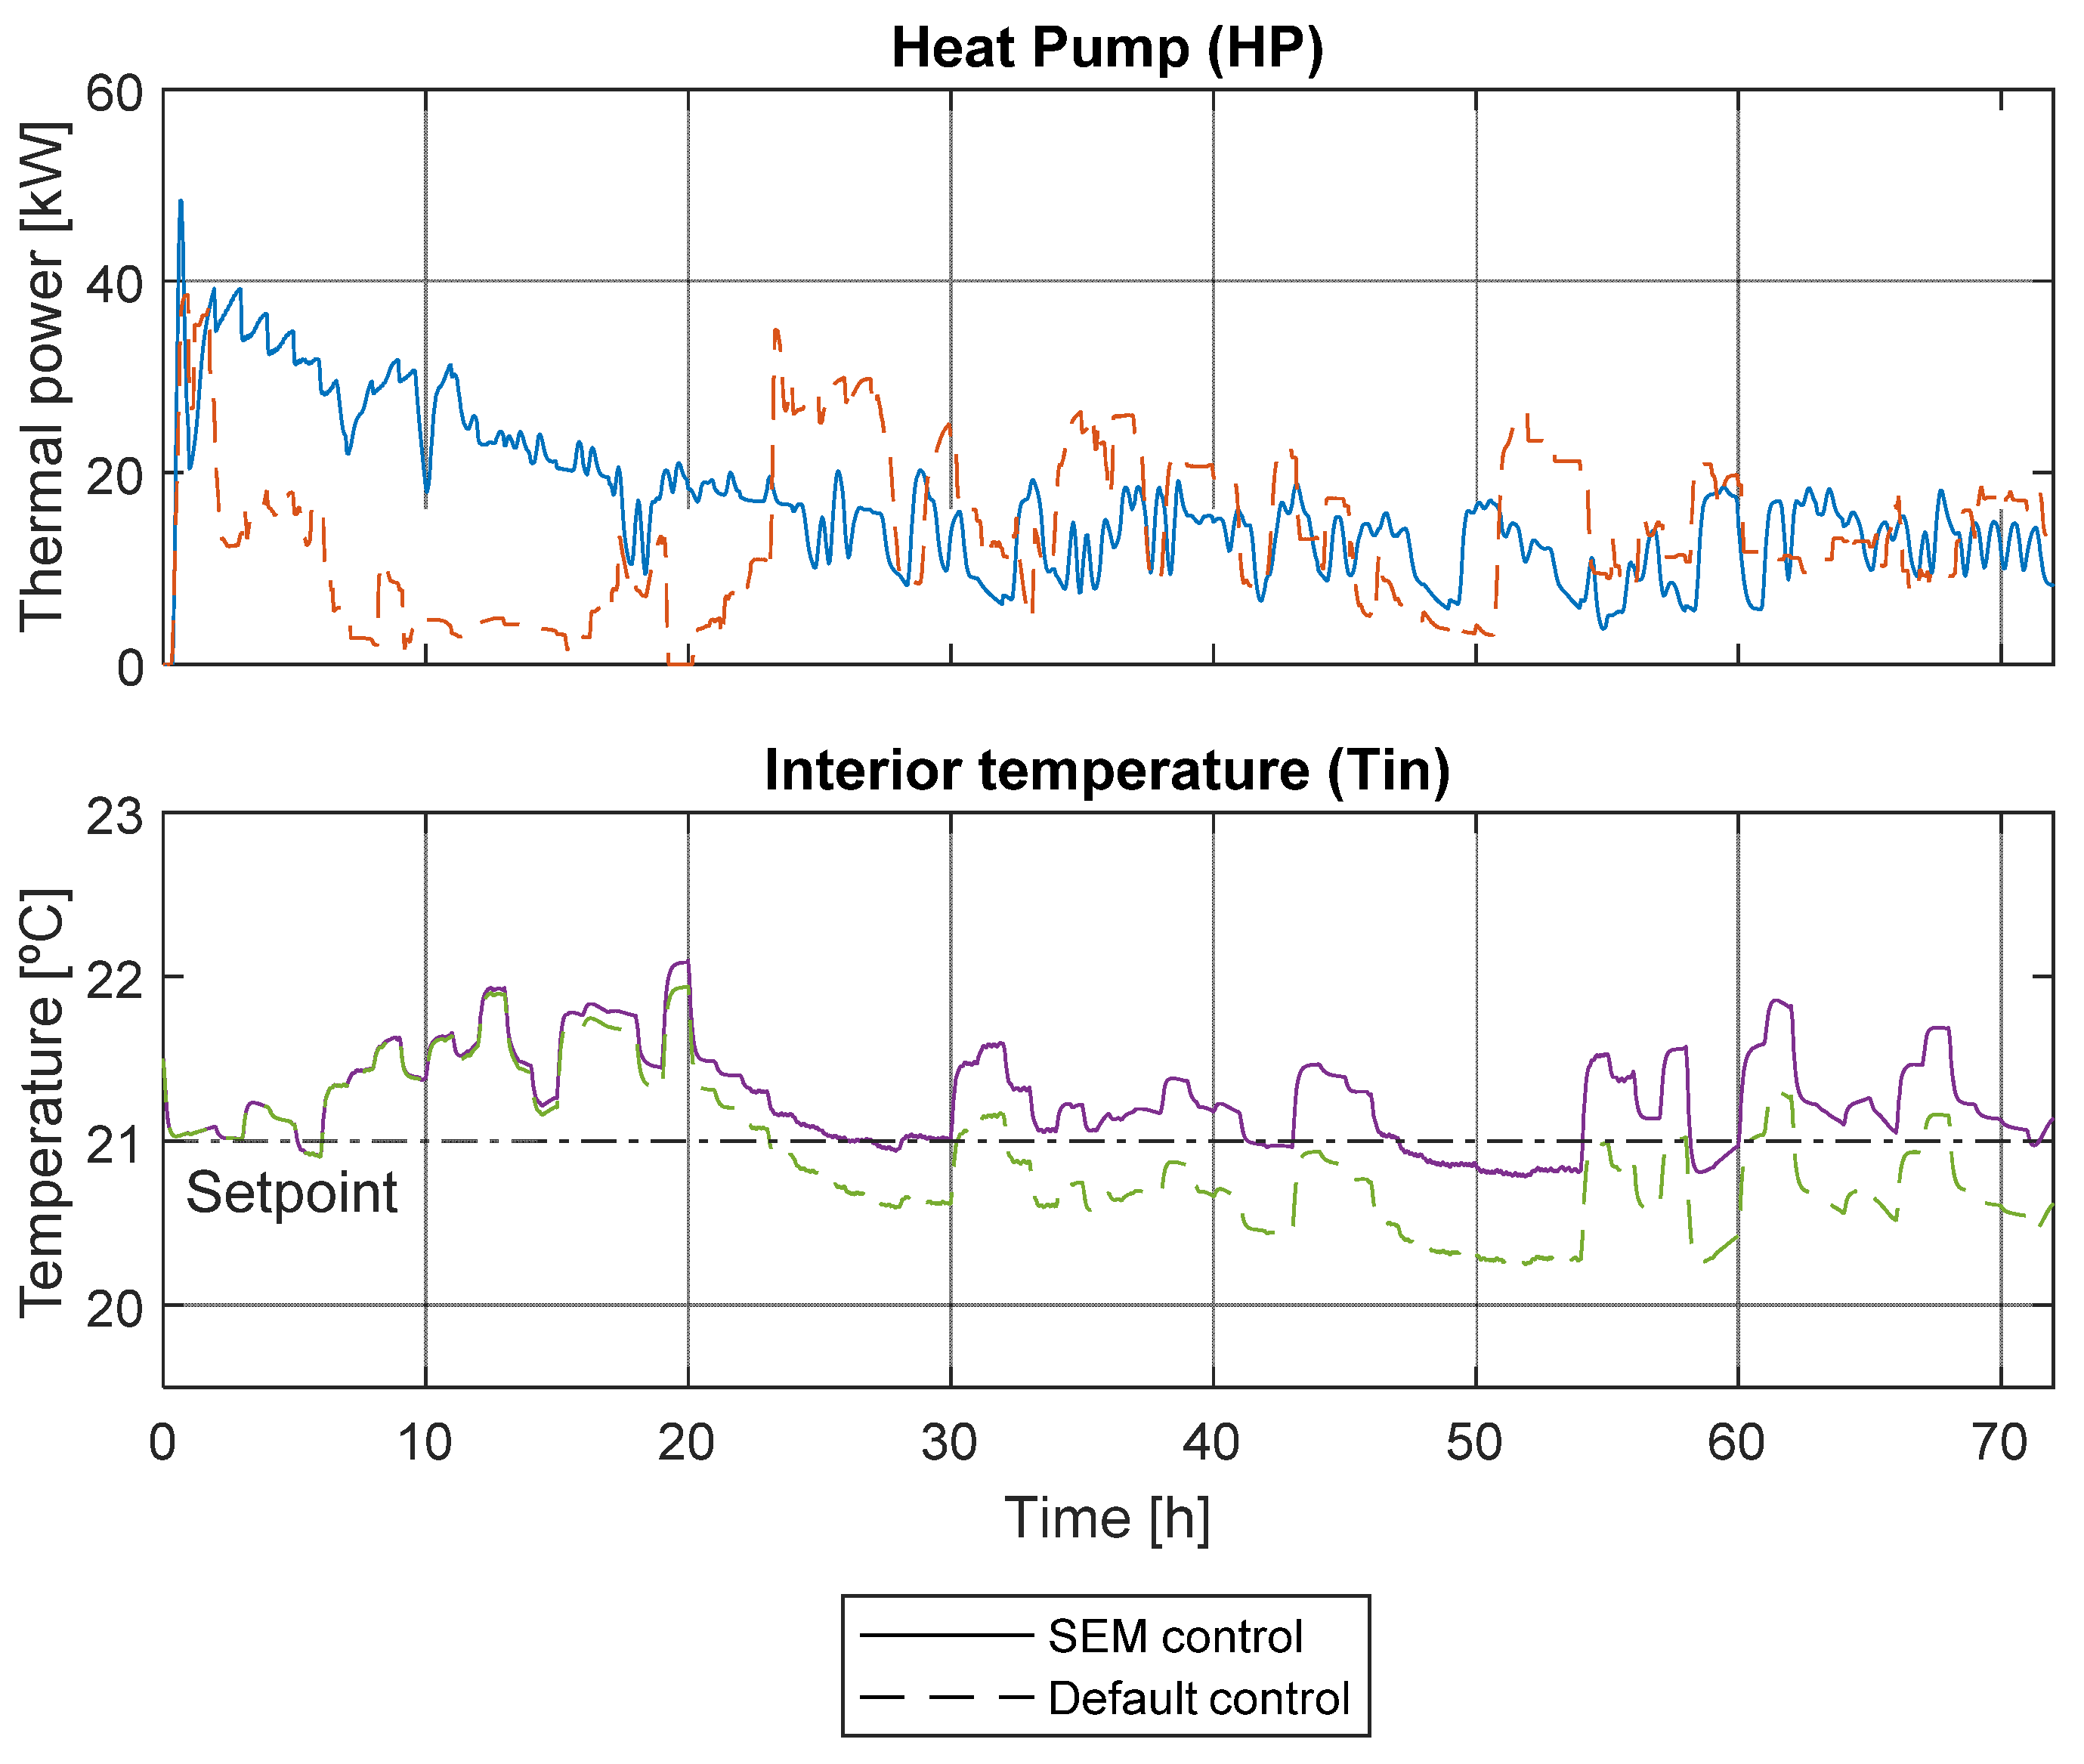
This section presents a comparative analysis between the SEM and its default control counterpart in case 1 (three winter days and the FE criterion). As elucidated in
Section 2.1.3, the default heating installation counts with auxiliary radiators and a radiant wall (ERWH), both connected to the HP. The default control is a thermostat (on/off with hysteresis) in each individual zone, which controls both systems. Due to the high inertia of the radiant wall system, it requires anticipatory operation beyond the capabilities of a standard thermostat, and, for that reason, auxiliary radiators were included so they can respond immediately when required. In contrast, the SEM does not control the radiators, only the radiant wall. The results show the SEM’s proficiency in consistently maintaining the setpoint without activating the auxiliary radiators. There are sporadic temperature deviations due to inherent inaccuracies of the simplified RC models. Conversely, the default control mechanism spends more time under the setpoint (more than one day consecutively), reaching a deviation of 0.75 °C.
Figure 14 visually depicts how the SEM proactively anticipates the heating power to charge the thermal masses during daylight hours, while the default control prompts full power engagement as a reaction to detect deviations from the setpoint. It can be observed that the temperature profile is the same until hour 15 in both cases, despite the thermal power being different. This behavior is explained because of the high thermal inertia of the building: the thermal power injected by the radiant wall is stored in the mass and is not reflected in the air temperature until the demand rises significantly.
5. Discussion
5.1. Adjustment of Synchronization
As observed previously, most of the runtimes for the SEM are lower than 1 s. This rapidity may lead to potential synchronization challenges, particularly if the SEM sends the control command (via the producer) before the building’s communication client is prepared to receive them (via the consumer). In such instances, messages from the SEM could be lost, resulting in the loss of the current timestep and the subsequent one, thereby creating a 30-min gap without control. To mitigate this issue, the SEM incorporates a sleep time before transmitting the optimized plan via the messaging system (StreamHandler) back to the building. The sleep time has been fine-tuned to 1 s, effectively preventing the occurrence of synchronization problems while ensuring minimal impact on the SEM performance.
Additionally, the SEM is configured with a maximum optimization time to address scenarios where the algorithm takes an extended period to converge on the optimal solution. The OR-Tools library allows for the configuration of a maximum time limit, after which the optimization process is terminated and the best solution found up to that point is accepted. For this, the study time limit was set to 5 min. However, as evidenced in the results, the maximum optimization time is consistently well below this limit, with the longest optimization process reaching a maximum of 234 s.
5.2. Adjustment of the Simplified Models
The reliability of the SEM model depends on the accuracy of its simplified models in predicting the behavior of the building. The simplified models adopt a linear hypothesis and introduce some level of error, particularly when assuming constant temperatures such as the Tin for the ventilation system or the supply temperature of the HP to calculate the COP. To address this, additional constraints have been implemented in the simplified models, empirically adjusted based on data from previous simulations of the system. These constraints include limiting the maximum allowed temperature of the active layer (ERWH) to 32.5 °C, capping the impulsion temperature of the HP at a maximum of 35 °C, and setting the maximum storage temperature of the space heating tank to 35 °C as well. While these adjustments enhance the accuracy of the simplified models, the prediction of the Tin still exhibits some deviation, indicating the potential for the further refinement of the RC model.
5.3. Limitations of the Testing Methodology
While the TRNSYS model provides a valuable platform for simulating the SEM system’s performance, it is essential to acknowledge the inherent differences between simulated environments and actual building operations. The use of perfect forecasts [
37] cannot reflect variations in occupant behavior or unpredicted environmental conditions, and system interactions may lead to discrepancies in performance outcomes. The controlled conditions of the TRNSYS model cannot fully replicate the complexities of real-world scenarios, such as fluctuating energy demands due to changes in occupancy or unexpected weather patterns.
5.4. Validation in Real-World Environments
To validate the SEM system’s efficacy in practical applications, we recommend implementing field tests in multi-family buildings. Metrics such as energy consumption, comfort levels, and operational costs should be monitored and compared against the predictions made by the TRNSYS model. By addressing these real-world parameters, we aim to refine our understanding of the SEM system’s performance and ensure its applicability in diverse environments.

