1. Introduction
The transition towards sustainable energy systems is a pressing global issue, and Indonesia, with its unique archipelagic geography, is at the forefront of this challenge. Indonesia has embarked on an ambitious journey, aiming for a complete transition to 100% renewable energy (RE) by 2060 [
1]. The total installed capacity of power generation in Indonesia was 83 GW in 2022 [
2]. This target presents a considerable challenge, especially considering that currently only 13% of the electricity generation comes from RE, mostly from hydro and geothermal [
2], while wind and solar energy have a significant untapped potential. The National Energy Plan recognizes this opportunity, estimating the nation’s potential RE capacity at 443 GW, including 208 GW from solar [
3]. Further reinforcing this potential, recent analyses by Silalahi [
4] and IESR [
5] suggest that Indonesia could exploit up to 7 TW or 9000 TWh annually, indicating that the 100% RE goal is attainable, even with a significant increase in energy consumption per capita.
The integration of RE into electricity systems presents challenges due to the intermittency of variable renewable energy (VRE) sources, such as wind and solar, which affect system operation and economics [
6]. Addressing these challenges requires an increase in the flexibility of the electricity system through optimal RE integration, leveraging the unique potential of each province, and supporting it with energy storage and a robust transmission network connecting provinces and islands. Various studies indicate the need for substantial energy storage to meet high RE targets. For example, California will require 15 GW/62.5 GWh of energy storage to complete a 60% RE target by 2030 [
7,
8], while a 90% RE grid penetration necessitates storage capacity equivalent to the daily average demand [
9]. Achieving a 70% RE share in the UK, with an 80/20 wind/solar mix, would require about 70 TWh of storage [
7]. Our previous research also outlines the energy storage requirements for Java–Bali and Sumatra [
10]. Some studies also have shown that HVDC links can support renewable integration [
11].
Although previous studies have explored RE integration into electricity grids [
12,
13], there remains a gap in high-resolution, multi-node analyses specific to Indonesia, considering provincial energy sources, storage options, and the potential for an interisland super grid. This paper addresses the challenges of achieving a comprehensive energy transition in Indonesia’s geographically diverse context, evaluating the integration of RE sources, required transmission infrastructure, and suitable energy storage technologies. Focusing on wind, solar, and demand variability across provinces, the study also assesses the economic feasibility, operational performance, and potential for a super grid. Using high-resolution PLEXOS modeling and empirical data, it provides a detailed analysis of the technical and economic factors critical to Indonesia’s energy transition. The findings offer key insights for policymakers, industry stakeholders, and the academic community, particularly for archipelagic developing nations like Indonesia.
2. Literature Review
2.1. The Challenge to Integrate RE into the Grid
VRE sources, such as solar and wind, exhibit characteristics that set them apart from conventional energy generation. Solar energy is influenced by daily and seasonal solar irradiance patterns, leading to significant output variability due to clouds, seasonal shifts, and day–night cycles. Similarly, wind energy experiences fluctuations in speed and direction, often over a broad range of timeframes. This variability poses challenges due to the difficulty in accurately forecasting real-time renewable energy generation, impacting both the technical and economic aspects of power balancing. Additionally, wind and solar are not upwardly dispatchable (VRE resources may be intentionally off-loaded to provide scope for increased output dispatch but this is at the cost of lost production), making them relatively unreliable for grid stability compared to conventional power plants like gas turbines.
According to a study by [
6], as shown in
Table 1 the integration of VRE faces several challenges, including power quality, grid stability and reliability, transmission and distribution capacity, supply–demand balancing, and integration with existing grid infrastructure. Building on the literature review and previous studies, the focus has shifted towards optimizing the integration of RE sources, particularly through the effective use of energy storage systems and strategic super grid upgrades. These components are critical for overcoming the challenges posed by the inherent variability, intermittency, and geographic distribution of RE.
2.2. Energy Storage
Energy storage is vital for the integration of RE into large-scale electricity systems. Various technologies are available in the energy storage sector, each with distinct features, such as pumped hydro energy storage, lithium-ion batteries, and emerging technologies such as redox flow batteries.
2.2.1. Pumped Hydro Energy Storage
Currently, a significant portion of energy storage, amounting to 175 GW in 2021, is provided by pumped hydro energy storage (PHES) [
31]. Renowned for its established technology, efficiency, quick response, long lifespan, and cost-effectiveness, PHES accounts for 96% of the current energy storage [
32]. However, the geographical dependency of PHES, along with potential environmental and societal impacts such as land use changes or community relocation, must be considered [
33]. A potential 320 TWh of Class A and B PHES storage volume for Indonesia has been identified [
34], which was made available in our model.
2.2.2. Lithium-Ion Batteries
The advancement of lithium-ion battery (LIB) technology has been accelerated by the rising demand for portable electronics, such as smartphones and laptops, as well as electric vehicles [
35,
36]. These batteries are recognized for their high energy density, scalability, quick recharge times, long operational life [
36], and rapid deployment. Additionally, they are capable of enduring numerous charge and discharge cycles with minimal degradation, making them suitable for long-term use [
37]. Their fast response time allows them to quickly adapt to changes in demand, making them ideal for applications requiring rapid energy delivery, such as frequency regulation and peak shaving [
38].
However, LIBs also have disadvantages. In terms of
$/MWh they are relatively expensive compared to PHES, despite decreasing prices [
37]. Effective thermal management is required to prevent overheating and potential safety hazards, as thermal runaway can lead to fires or explosions [
39]. The production of LIBs depends on the availability of raw materials like lithium, cobalt, and nickel, which can be subject to supply constraints and geopolitical issues [
40]. Furthermore, the extraction and processing of these raw materials, as well as the disposal of used batteries, pose significant environmental challenges [
41].
2.2.3. Redox Flow Batteries
Vanadium redox flow batteries (VRFBs) show potential due to their longer storage times and modularity [
42]. Although they are considered for our simulation, their current cost structure is yet to be competitive with LIBs [
43], but we included them in this model as a candidate for energy storage.
VRFBs offer several significant advantages compared to other energy storage. They provide a long cycle life with minimal degradation since the vanadium electrolyte does not undergo permanent chemical changes. VRFBs also have a high degree of safety due to their non-flammable aqueous electrolyte and ability to operate over a higher temperature range. The scalability of VRFBs allows for the independent sizing of power, by adjusting the cell stack, and energy capacity, by adjusting the electrolyte volume, making them highly flexible for various applications. Additionally, they offer high efficiency and the potential for complete electrolyte recovery and reuse, contributing to their sustainability [
44,
45].
Despite these advantages, VRFBs also have some drawbacks. One of the primary challenges is the relatively low energy density compared to other battery technologies, which can limit their applications in space-constrained environments. The cost of vanadium and the ion-exchange membranes can be high, impacting the overall cost-effectiveness of the system. Additionally, issues related to electrolyte imbalance and crossover through the membrane can affect the long-term performance and efficiency of VRFBs, requiring periodic maintenance and rebalancing [
46].
2.3. Super Grid
Another critical issue for Indonesia is interisland interconnection. While energy storage is pivotal in stabilizing RE sources, connecting the major islands of Indonesia provides the opportunity to take advantage of differing variability of demand and solar and wind among the islands. Previous plans by PLN and the government proposed a link between Java and Sumatra [
47]; however, the latest PLN plan does not include such initiatives [
48].
Nevertheless, the feasibility of interconnecting extensive electricity systems or nations has been explored in various contexts, such as Japan–South Korea [
49], within the ASEAN region [
50], North–East Asia [
51,
52] and between North Africa and Europe [
53,
54]. For Indonesia, the Java–Sumatra connection was assessed by Faizal [
55]. These studies provide insights into the potential development of a super grid.
2.4. Current Literature on National Energy Pathways
There are several reports regarding the pathways for energy transition for several regions and countries:
In Europe, research efforts are focused on achieving ambitious climate goals. For instance, ref. [
56] investigates pathways for the Netherlands to reach net-zero emissions by 2050. Utilizing the OPERA software, key findings include that wind turbines and solar panels could provide approximately 99% of electricity by 2050, with demand response and energy storage being essential components. Additionally, hydrogen emerges as a crucial energy carrier for both transportation and industry. Similarly, ref. [
57] assesses the United Kingdom and European Union’s pathways without fossil fuel energy, highlighting that a complete shift to RE and a decarbonized industrial sector could be feasible before 2050. It was found that most of the industrial sector could be decarbonized using existing technologies, and while hydrogen or other electro-fuels as alternatives could increase costs and energy losses, energy savings and electrification lead to better cost efficiencies.
In Australia, ref. [
58] evaluates the National Electricity Market’s capability to meet its demands entirely through RE sources. The study finds that PV and wind could supply approximately 90% of yearly demand, with energy storage and enhanced interregional connections being essential. PHES is identified as the primary storage method, with the expense associated with matching RE to demand on an hourly scale estimated to be relatively low at USD 19–23/MWh.
For ASEAN countries, ref. [
59] examines net-zero pathways for Cambodia, Laos, and Myanmar, nations that currently face energy poverty and are susceptible to the impact of climate change. The analysis indicates that by harnessing their hydropower resources and increasing the use of other RE, these countries have the potential to achieve 100% RE. The implementation of energy storage solutions is identified as a critical component of this transition. By 2050, the projected need for energy storage capacity is approximately 16.1 GW Additionally, ref. [
60] examines a transition pathway for the Philippines, indicating that achieving 100% RE by 2050 is technically achievable and would incur costs similar to those of the 2015 energy system but with zero emissions. Solar PV and energy storage play crucial roles in this transition.
For Indonesia, numerous studies have examined the country’s transition to RE. One study [
12] outlines Indonesia’s path to achieving a 100% RE system by 2050 using nuclear and solar PV. Another study [
13] evaluates the viability of meeting Indonesia’s net-zero emissions goal by 2060 relying on RE, emphasizing the critical roles of nuclear power and energy storage in achieving this goal cost-effectively. Solar energy is expected to be viable only when the capacity of other renewable sources is maximized. Additionally, ref. [
61] explores an energy decarbonization pathway for Indonesia, focusing primarily on solar PV combined with off-river PHES, and suggests that this approach could deliver 100% renewable electricity at an economically feasible cost, estimated between 77 and 102 USD per megawatt-hour.
2.5. Main Contribution
Although many studies have explored the integration of RE, there remains a significant gap in comprehensive research specific to Indonesia. Specifically, a lack of detailed examination considers the variability of wind, solar, and demand across each province. Moreover, there is a necessity for in-depth analysis concerning the economic viability, operational parameters, and performance of power plants and energy storage systems, coupled with an assessment of the potential for a super grid network. This study aims to fill these gaps by providing an integrated analysis encompassing these crucial factors. Our approach involves harnessing potential energy sources, implementing robust storage mechanisms, and developing an interconnected grid network. This network ensures consistent and reliable energy throughout Indonesia’s diverse and expansive archipelago.
We utilize a comprehensive methodology incorporating PLEXOS, a cutting-edge simulation tool, combined with thoroughly examining empirical data. This approach enables us to offer an integrated analysis covering the technical and economic aspects vital for a successful energy transition within the Indonesian context.
The main contributions of this study are:
An in-depth examination of both operational and investment parameters of power plants, energy storage, and transmission systems, and
An extensive analysis of super grid optimization, integrating this with examining energy storage capacities and the localized patterns of RE. This holistic approach allows for a more informed and effective strategy in harnessing Indonesia’s vast RE potential and addressing its unique geographical challenges.
The insights and recommendations derived from this study are anticipated to serve as invaluable resources for policymakers, industry stakeholders, and the academic community. These studies are crucial in the global conversation on sustainable energy development and climate change mitigation, particularly for developing nations. Specifically, this research addresses the unique requirements of Indonesia’s energy sector and enhances the broader understanding of sustainable energy systems in archipelagic and island nations.
The remainder of the paper is organized as follows:
Section 3 explains the research methodology,
Section 4 presents the research findings and provides a detailed analysis of the results, and
Section 5 provides a summary of the main conclusions of the study and delivers an overview of the research findings.
3. Methodology
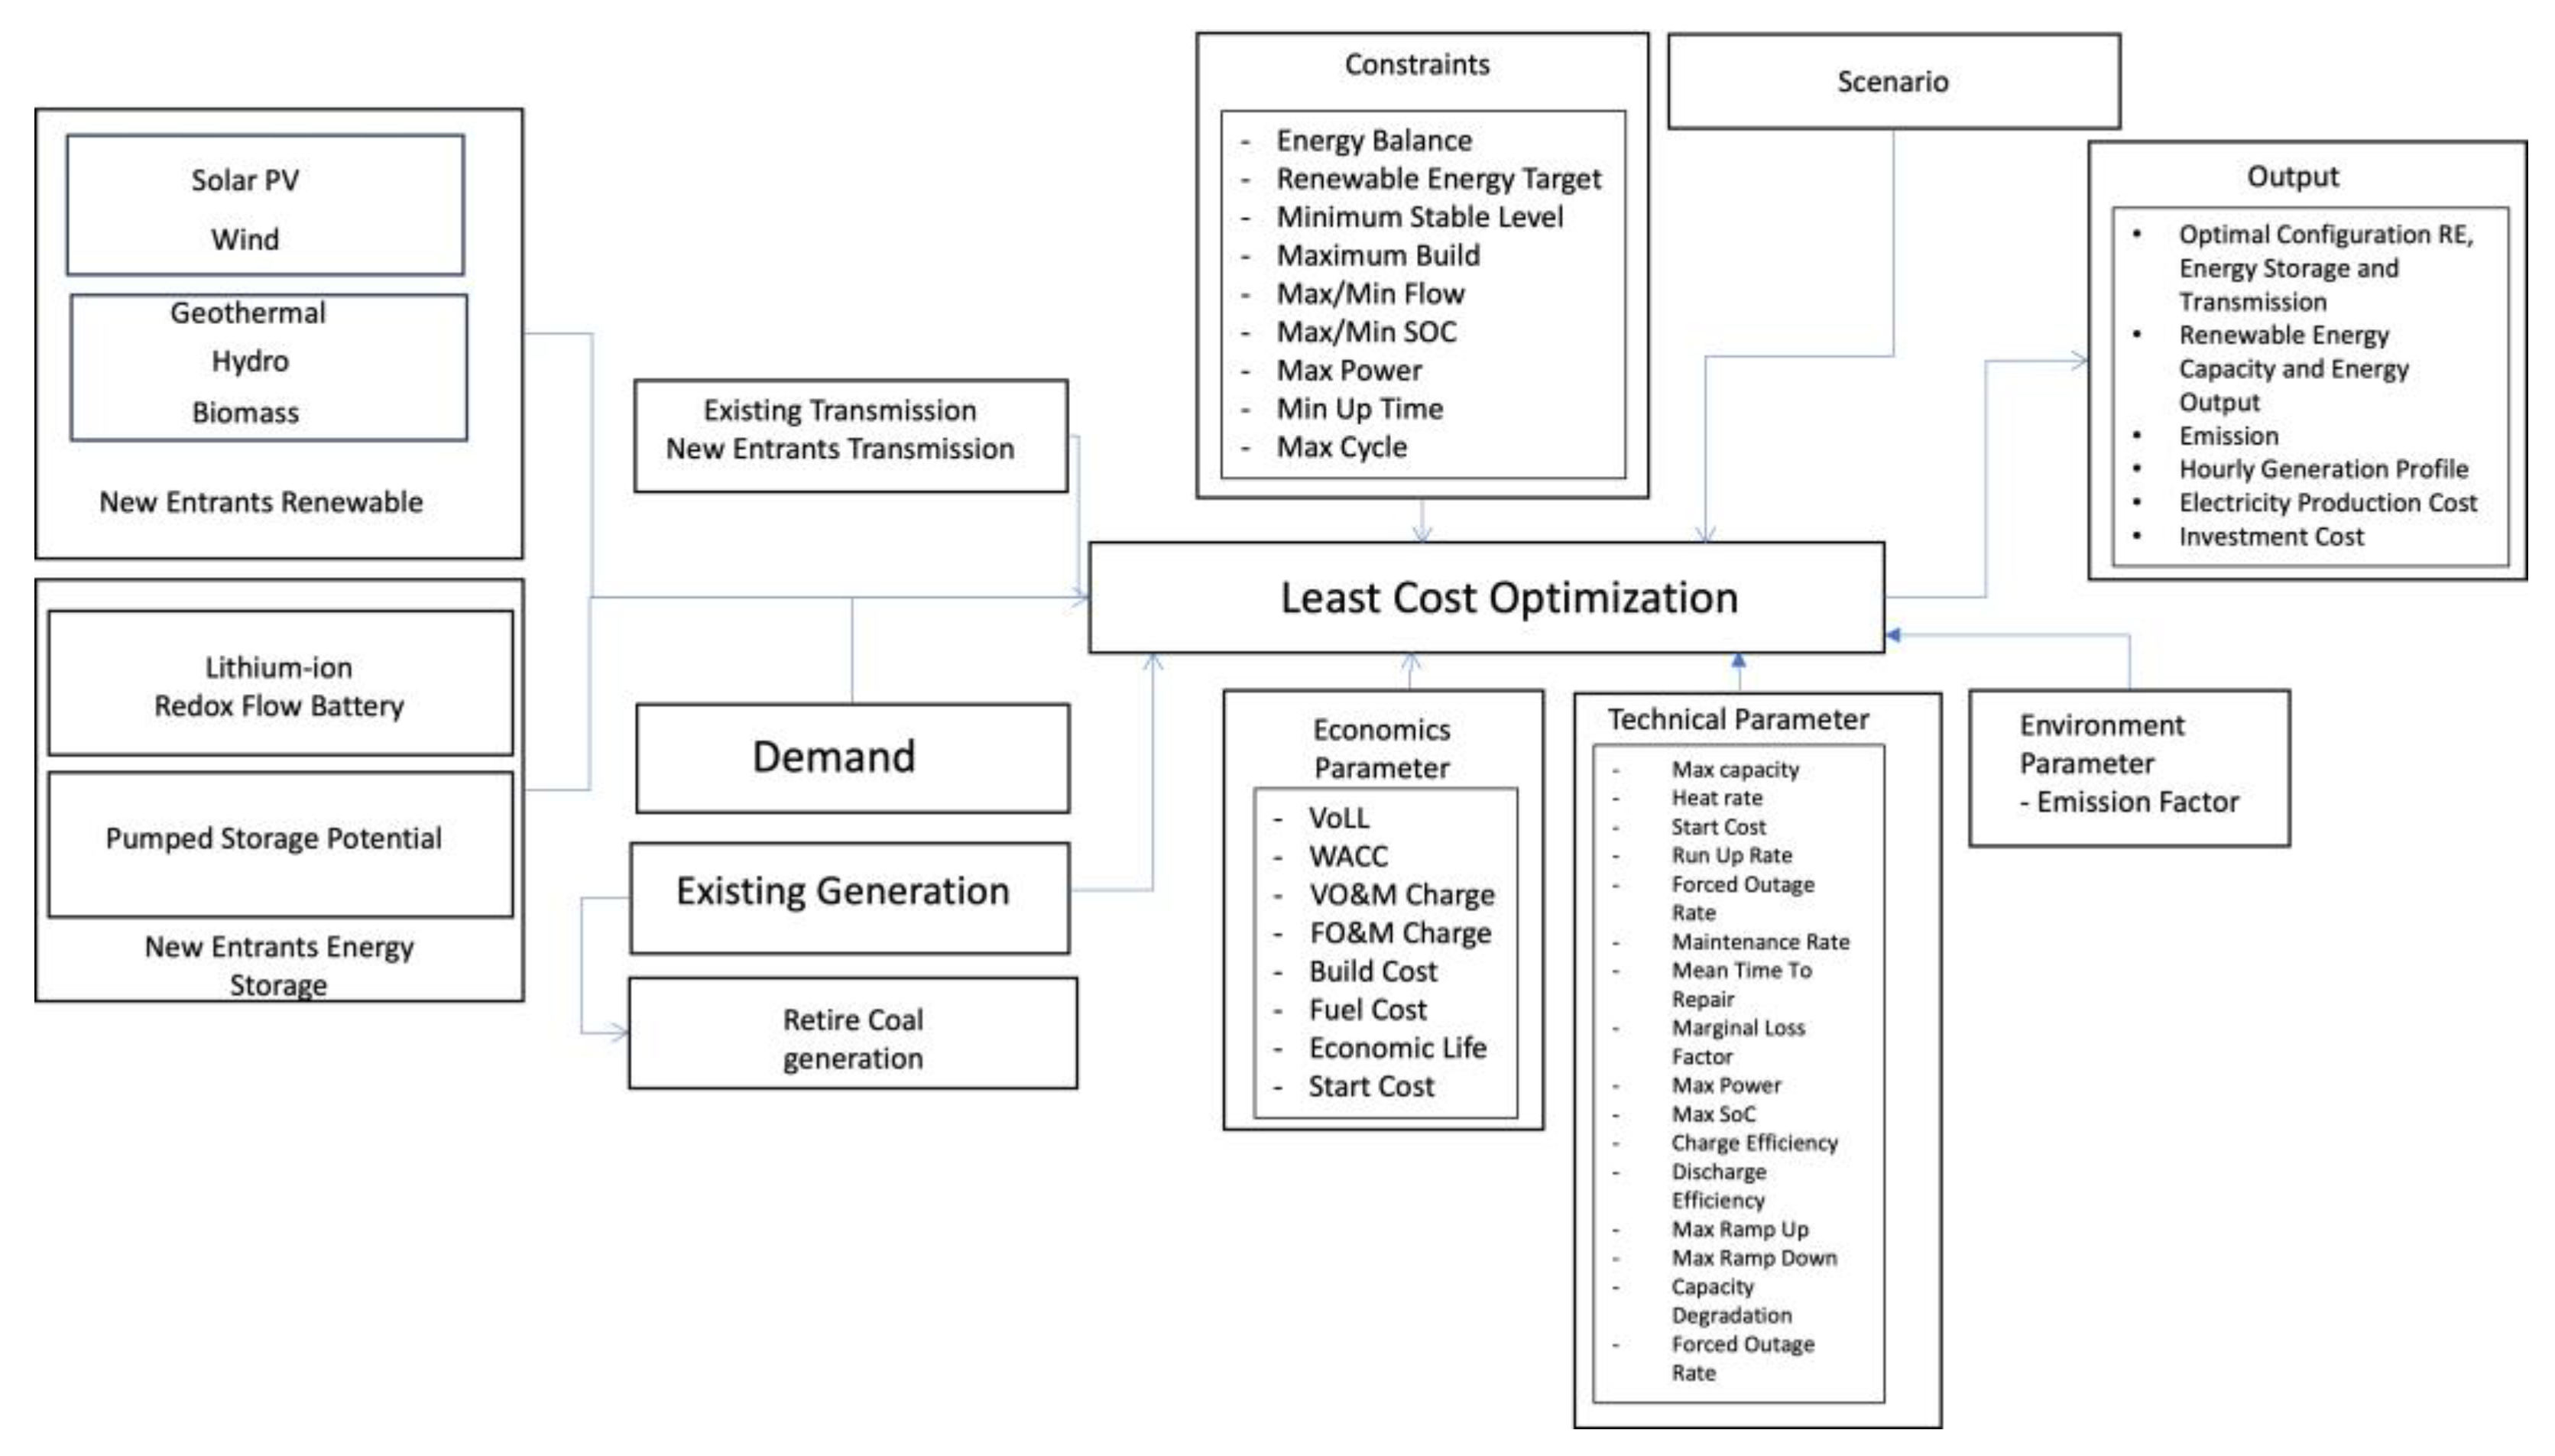
The method developed, as illustrated in
Figure 1, integrates the optimal solution by combining the current power generation fleet and transmission networks with those committed for construction by the government alongside new candidates for power plants, including RE, energy storage systems, and the super grid. This optimal solution considers the demand profile, economic parameters, technical specifications, and constraints and runs multiple scenarios. The model’s output provides the optimal configuration for RE, energy storage, and the super grid, enabling analysis of reliability, production, expansion, and the economics of power plants, energy storage systems, and the super grid.
This study employs the latest version of PLEXOS 10, a broadly used tool for simulating complex energy systems and identifying cost-efficient solutions. PLEXOS is widely used in academia and industry as a leading energy system simulation software [
62,
63,
64,
65,
66]. In this study, we employ PLEXOS to simulate the complex capacity expansion of Indonesia’s electricity system. This approach facilitates a comprehensive evaluation of numerous parameters influencing energy dynamics. Our research focuses on simulating RE, energy storage, and transmission super grids across eight scenarios to achieve 100% RE by 2060.
Building on prior research that concentrated on the Java–Bali and Sumatra regions [
10,
67], this study broadens its analysis to cover all 34 provinces in Indonesia, focusing on power generation, energy storage, and super grid planning. This current study extends the modeling framework to use data from 2021 to 2050 projected on an hourly basis. The database incorporates existing power plants, planned facilities, and potential new candidates, including hydro, wind, solar, biomass, geothermal, and open-cycle gas turbines (OCGT). No new coal power plants are included in this study, aligning with the target of achieving 100% RE by 2060. Solar profiles are generated using a decade of data from Renewable Ninja [
68] for each province, and wind profiles are developed for selected provinces based on potential identified in the National Electricity Planning (NEP/RUKN) [
69].
As shown in
Table 2, to thoroughly assess the potential pathways for achieving a reliable and sustainable electricity system in Indonesia, we developed a series of scenarios that explore different combinations of demand growth, energy storage costs, RE costs, and grid infrastructure enhancements. Each scenario is designed to evaluate the impact of specific variables on the overall energy strategy, allowing us to identify the most cost-effective and feasible approaches to integrate RE and optimize the grid. These scenarios range from a base case reflecting current trends and costs to more ambitious scenarios incorporating advanced energy storage, reduced costs for wind and solar power, and the development of an optimized super grid.
Scenario 1: “Base (B)” in this scenario, the demand increases by 4.9% yearly; large islands remain disconnected from contemporary electricity grids, with no investment in future interconnections. The cost of energy storage and building a new power plant is calculated using the base cost in
Table A1 in
Appendix A.
Scenario 2: “Base with Low-Cost Energy Storage (B-ES)” builds upon the foundational elements of the base scenario. The core objective is to assist the impact of low-cost energy storage.
Scenario 3: “Base with Low-Cost Wind and Solar (B-WS)” retains the framework established in the “base” scenario, with a pivotal modification: the build cost of solar and wind is significantly reduced by 25% compared to the baseline cost. This scenario is designed to methodically evaluate the repercussions of this cost reduction on the overall energy strategy.
Scenario 4: “Optimized Super Grid (SG)” builds upon the foundational elements of the base scenario. The core objective is to strike the most favorable balance between enhancing the transmission grid and investing in energy storage solutions.
Scenario 5: “Optimized Super Grid with Low-Cost Storage (SG-ES)” aligns closely with Scenario 4’s structure, with an additional focus on the low cost of energy storage. In this scenario, the capital expenditure for constructing energy storage systems is reduced by 25% of the baseline costs.
Scenario 6: “Optimized Super Grid with Low-Cost Wind and Solar (SG-WS)” aligns closely with Scenario 4’s structure, with an additional focus on the low cost of RE.
Scenario 7: “Optimized Super Grid with Low-Cost Build Super Grid (S-SG)” mirrors Scenario 4’s setup but introduces a critical variation concerning the cost of the transmission infrastructure.
Scenario 8: “Optimized Super grid with only PHES” includes pumped hydro energy storage only as the energy storage option with battery storage.
Scenario 9: “Optimized Super Grid with Limited Java–Bali Solar and Wind (S-LJB)” addresses the geographical and infrastructural constraints specific to the Java–Bali region. This scenario acknowledges the limited availability of land, which inherently restricts the potential for RE sources, notably solar and wind power. In this context, the scenario presumes that the capacity for harnessing solar and wind energy is confined to just 10% of the base potential in this paper. This significant reduction reflects the challenges posed by spatial limitations and possibly other factors such as environmental considerations or regulatory restrictions.
The formula for the cost function [
67] to minimize is:
where: “
y” is the total horizon of simulation; “
gen” is the generator; “
es” is energy storage; “
sg” is super grid, “
DF” is the discount factor [
DF = 1/(1 +
D)
y where “
D” is annual discount rate; “
BuildCost” is the overnight build cost; “
GenBuild” the number of generator units built in the year “
i” for generator “
gen”; “
ESBuild” is the amount of energy storage built in the year ‘
i’ for energy storage “
es”; “
SGBuild” is the amount of super grid built in the year “
i” for super grid “
sg”; “
FOMCharge” is the fixed operations and maintenance charge of generator “
gen” or energy storage “
es” or super grid “
sg”; “
PMAX” is the maximum generating capacity of each generator “
gen”; “
ESMAX” is the maximum generating capacity of each energy storage “
es”; “
SGMAX” is the maximum super grid capacity of super grid “
sg”; “
Units” is the number of installed generating units of generator “
gen” or energy storage “
es” or super grid “
sg”; “
Lt” is the duration of dispatch period “
t”; “
VoLL” is the value of loss of load; “
USE” is unserved energy; “
SRMC” is short run marginal cost generator = (heat rate × fuel cost) + variable operation and maintenance charge; “
GenLoad” is the dispatch level of generating unit “
g” in period “
t”.
The cost function is subject to the following constraints:
- 2.
Maximum energy dispatch
- 3.
Maximum build
- 4.
RE target
- 5.
Minimum stable level generator
- 6.
Maximum transmission line power flow
- 7.
Depth of discharge for storage
Equation (1) is utilized to assess the optimal solution in this research, and the resulting findings are presented in the subsequent analysis. It reflects the formulation of least-cost analysis applied in PLEXOS.
Following the approach outlined in [
10], this research similarly expands the time horizon to 2021–2050. The study employs the LT-Plan solution in PLEXOS with a sampled chronology, sampling two weeks per year, and a yearly step size. The model uses reserve classes and adheres to the spinning reserve parameters set in [
10] (with a duration of 300 s and a reserve provision of 1000 MW). Additionally, we apply a loss of load probability (LOLP) target of one day per year, or 0.274%, as set by PLN [
48]. The detailed approach follows that described in [
10]. For the expansion, the new units are retired if the end of economic life is reached in the study period.
3.1. Renewable Energy
The primary data on RE potential are sourced from Indonesia’s national electricity planning documents [
69]. For solar energy specifically, data were taken from references [
4,
5] focusing on the least optimistic scenarios, which estimate a solar potential of 3.3 TWp, considered as the upper limit.
Table 3 presents the maximum capacities available for RE development.
The model includes constraints aimed at achieving 100% RE by 2060, guiding the energy production path towards this target and analyzing results for the period 2021–2050. Hourly solar and wind data, derived from Renewable Ninja [
68] using 10 years of historical data from 2011–2020, with solar panels tilted 10 degrees towards the equator, are used. The model includes constraints concerning expansion and operational parameters to ensure that the model’s outputs are both feasible and aligned with national energy policies.
3.2. Economics
The construction cost estimates are derived from a combination of data sources, including the Australian Energy Market Operator (AEMO) [
70] and Indonesian technology data [
70]. These estimates are presented in the corresponding
Table A1. An economic discount rate of 10% per annum is applied, aligning with the standard practice for developing countries. The assumed value for the loss of load is established at USD1000/MWh. All financial figures are denominated in US dollars. For the AEMO data, which are initially provided in Australian dollars, an exchange rate of AUD 1 to USD 0.7 has been utilized.
Table A1 details the construction costs, expressed in USD/kW.
3.3. Energy Storage
The types of energy storage considered in this study include lithium-ion batteries with discharge durations of 2, 4, and 8 h, in addition to PHES and redox flow batteries. The primary data sources for this analysis were obtained from the Australian Energy Market Operator (AEMO) [
70], supplemented with information from the U.S. Department of Energy and technology data specific to the Indonesian power sector [
71]. While there are discrepancies among sources, our methodology closely aligns with AEMO’s approach in modeling the Integrated System Plan (ISP) for Australia [
70]. Given the geographical constraints associated with pumped hydro storage, we have relied on hypothetical data from reference [
34]. For context, the potential identified by the same research group for pumped hydro energy storage (PHES) for Australia is noted in [
58]. Consequently, we have limited the total potential for PHES in Indonesia to a figure marginally less than 1% of the total predicted in [
34], culminating in an estimated potential of 245 GW/1960 GWh for PHES in Indonesia. Energy storage options, including lithium-ion batteries with 2 h (2H), 4 h (4H), and 8 h (8H) discharge capacities, 4 h and 8 h redox flow batteries, and 8 h pumped hydro storage, are distributed across all provinces.
Table A2 presents the operational parameters of these energy storage systems.
3.4. Transmission and Super Grid
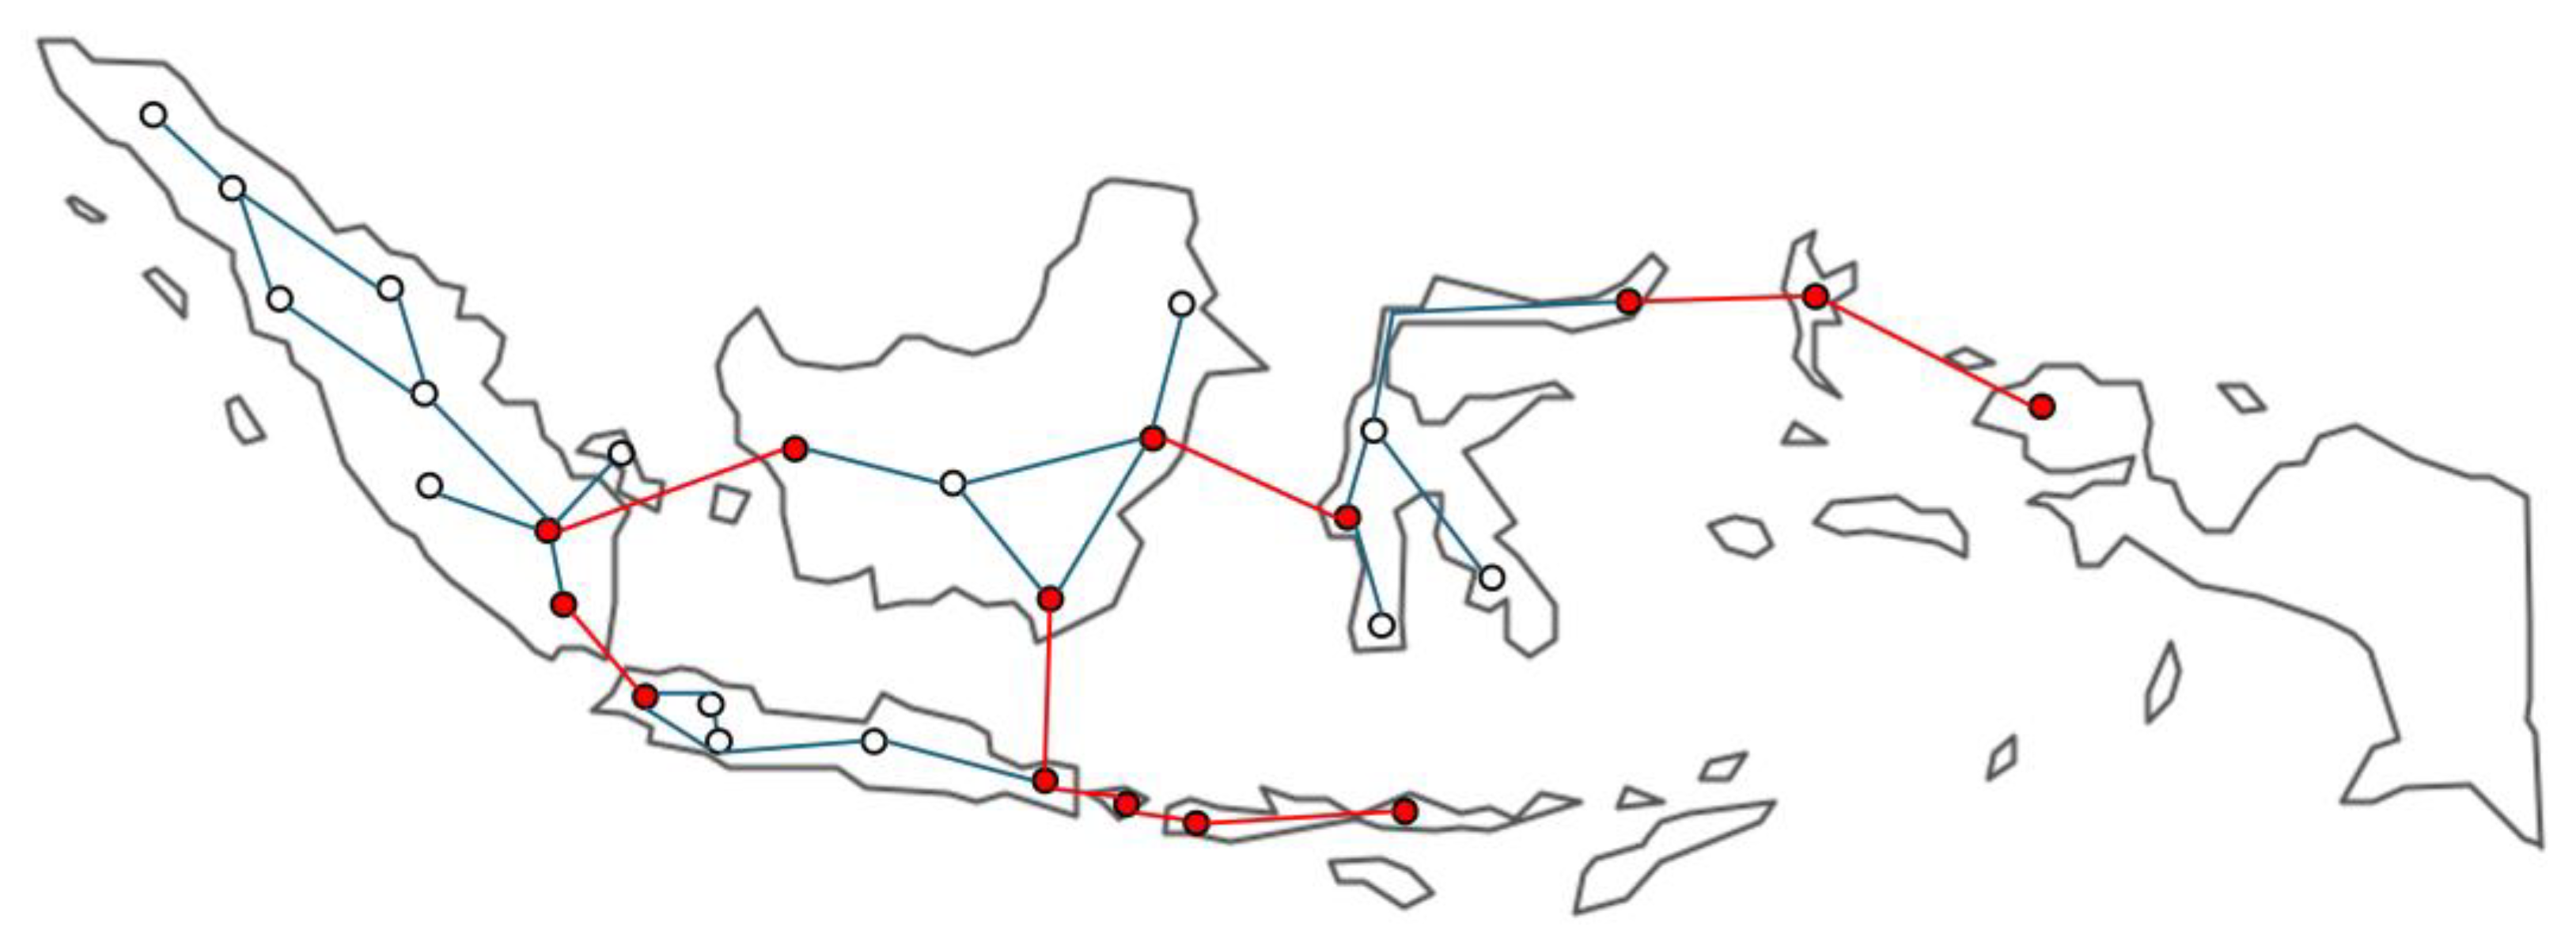
Existing interprovincial transmission lines within the island are documented in the State-owned Company (PLN) Electricity Supply Business Plan (in Indonesian abbreviated as RUPTL) [
48] and supported by our previous research [
10] and shown in
Figure 2 with slightly different connections for Riau-Riau Island and South Sumatra–Bangka Belitung starting with 1000 MW capacity in 2035. In the model, it is anticipated that these capacities will grow by a quarter every five years. At present, the sole interconnection linking major islands is between Java and Bali, with a capacity of 400 MW.
This study proposes the construction of high-voltage direct current (HVDC) interisland transmission lines called a “super grid” by identifying potential locations for expansion. The candidate locations, aimed to connect Sumatra, Java, Bali, Kalimantan, Sulawesi, North Maluku, West Papua, Lombok, and Timor, are shown in
Figure 2. The model linearly expands to assess transmission needs while capping the extent of potential expansion. It aims to optimize transmission expansion based on the principle of least-cost optimization.
The estimated construction cost for the HVDC lines is USD 2800 per km per MW, with fixed operation and maintenance costs of USD 28 per MW per annum over a lifespan of 50 years and the cost of a paired terminal station is USD 0.7 B/pair [
72]. The distance of the transmission line is measured using an approximation from Google Earth and by finding the closest main PLN transmission station that can be connected between two islands.
Table A3 shows the super grid distance and candidates.
3.5. Energy Demand
The hourly load profile model incorporates historical load data from the Java–Bali system for the year 2018 [
73], covering both the Java–Bali and Sumatra regions, while for eastern Indonesia (including Kalimantan and Sulawesi), it utilizes data from South Sulawesi [
74]. The load and energy calculations for each province follow the respective proportions detailed in the RUPTL [
48], coupled with an annual incremental growth prediction for Indonesia of 5%. By the year 2050, the total electricity demand is projected to reach 1156 TWh, translating to 3.5 MWh per capita per year for a forecasted population of 331 million people. This represents a 4.2-fold increase in demand from 2021, with per capita consumption rising by a factor of 3.5.
Figure 3 illustrates the normalized base load profiles of two regions in Indonesia: the Sulawesi region, representing eastern Indonesia (outside Java–Bali and Sumatra), and the Java–Bali system, which represents the Java, Bali, and Sumatra system. The comparison reveals a narrower disparity between day and night load in the Java–Bali system as opposed to eastern Indonesia. This can be attributed to the Java–Bali region’s more developed economy and advanced industrial and business activities, which result in a more constant demand throughout the day. In contrast, eastern Indonesia’s demand is driven more by residential needs, leading to greater fluctuations between daytime and nighttime energy consumption.
3.6. Operation and Generator Planning Parameters
Operation and planning parameters of power plants are defined as in our previous study in the
Appendix A [
67].
4. Results and Discussion
This section presents the findings from the scenarios modeled in this study, outlining potential pathways for Indonesia’s electricity system to achieve 100% RE by 2060. The results are analyzed in terms of installed capacity, energy generation, storage requirements, and the impact of a super grid on cost and system efficiency. The discussion examines how varying assumptions regarding energy storage costs, RE pricing, and grid improvements affect the overall strategy, offering insights into the optimal configurations for Indonesia’s energy transition.
4.1. Power Plant Installed Capacity
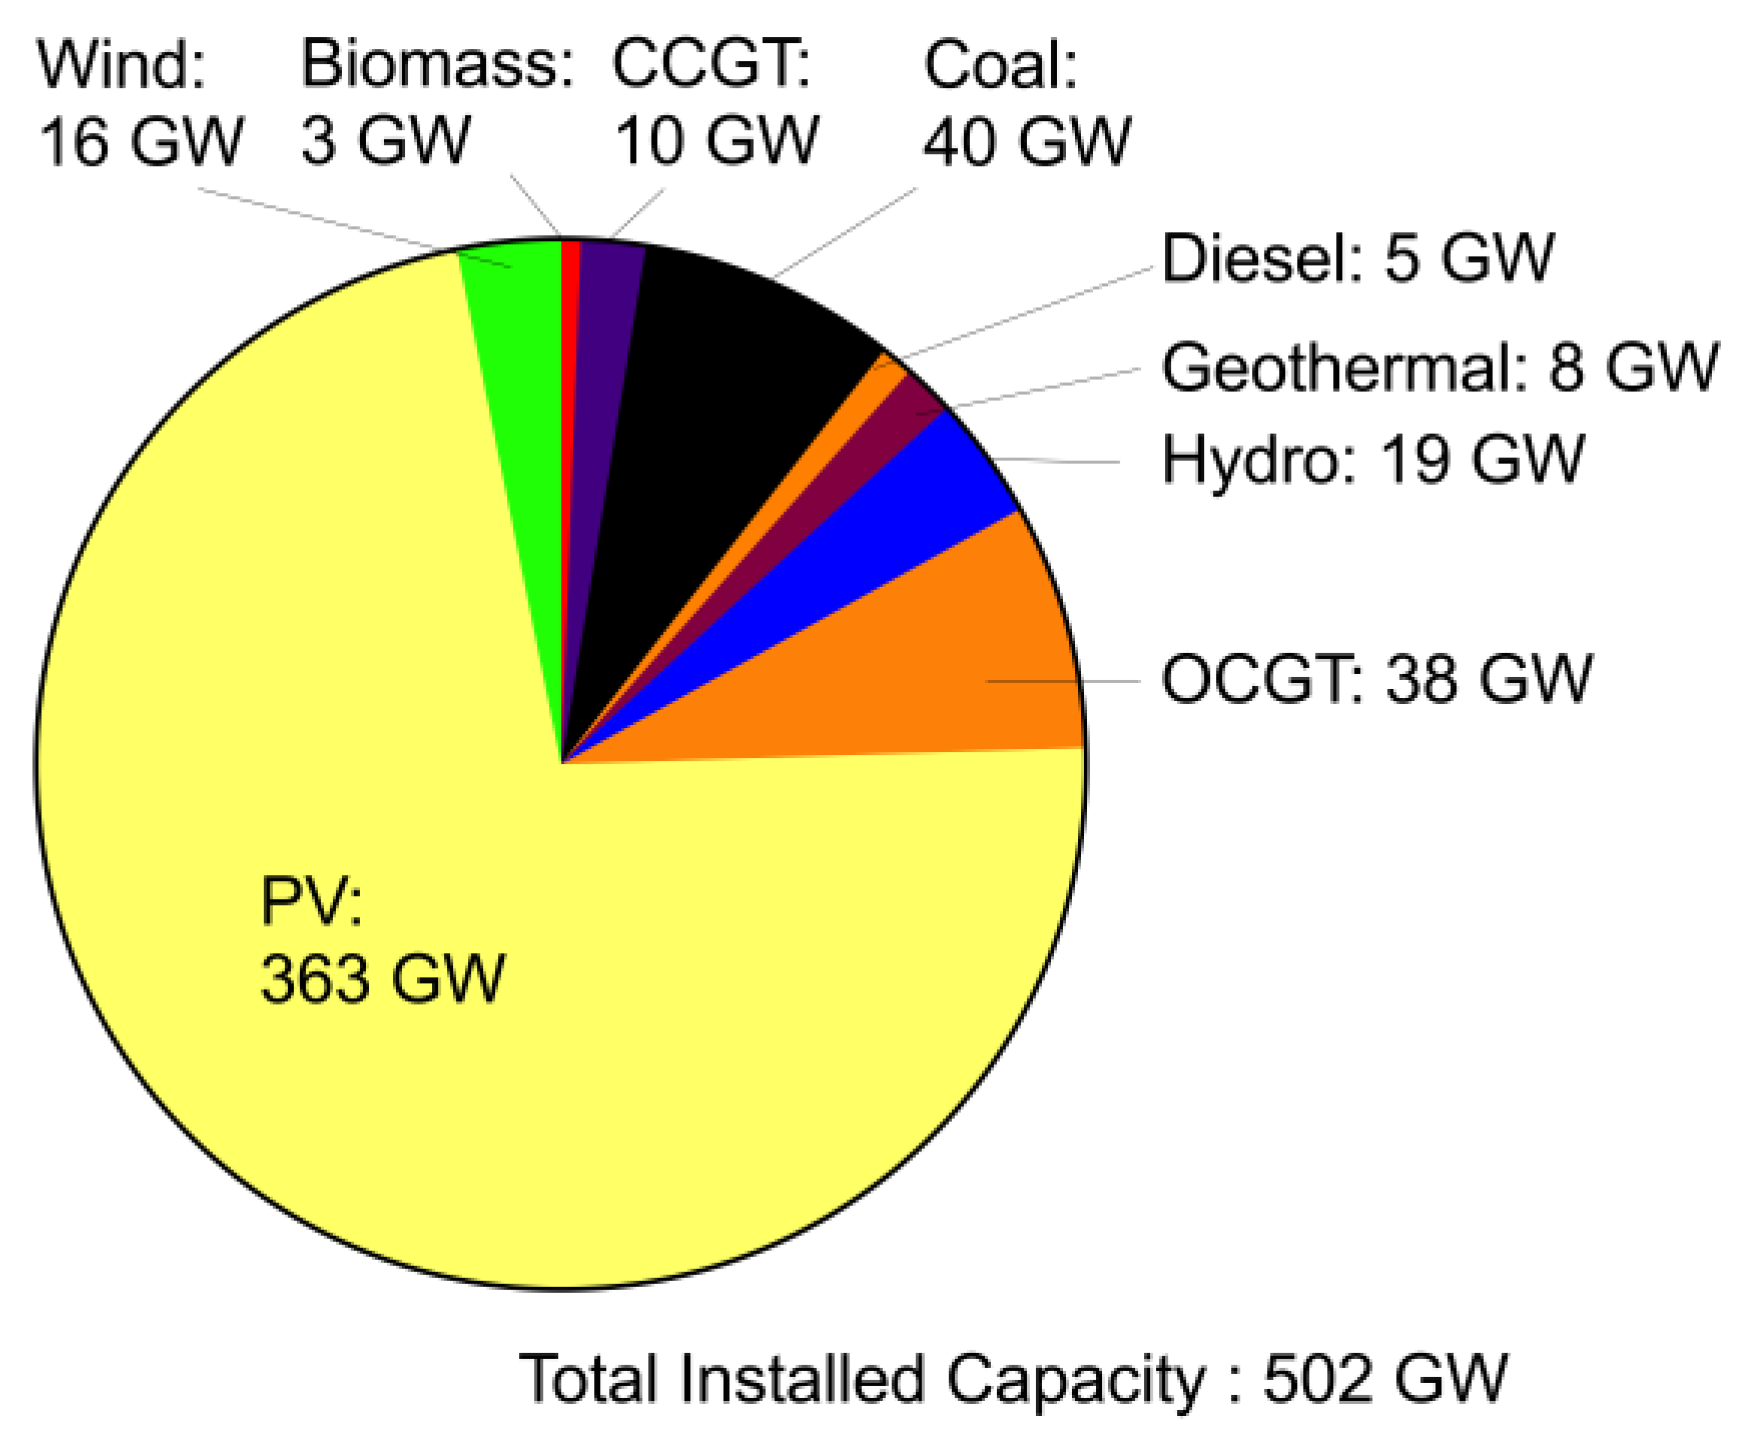
As shown in
Table A4 and illustrated in
Figure 4 and
Figure 5, the base scenario (B) projects a total installed capacity of 502 GW by 2050, a significant increase from 63 GW in 2021. This growth is largely driven by solar PV installations, which are expected to constitute 72.3% (363 GW) of the total capacity, marking a substantial shift from less than 1% in 2021. Wind energy remains limited, contributing only 3.3% (16 GW), while coal maintains an 8% share (40 GW), and OCGT accounts for 7.6% (38 GW).
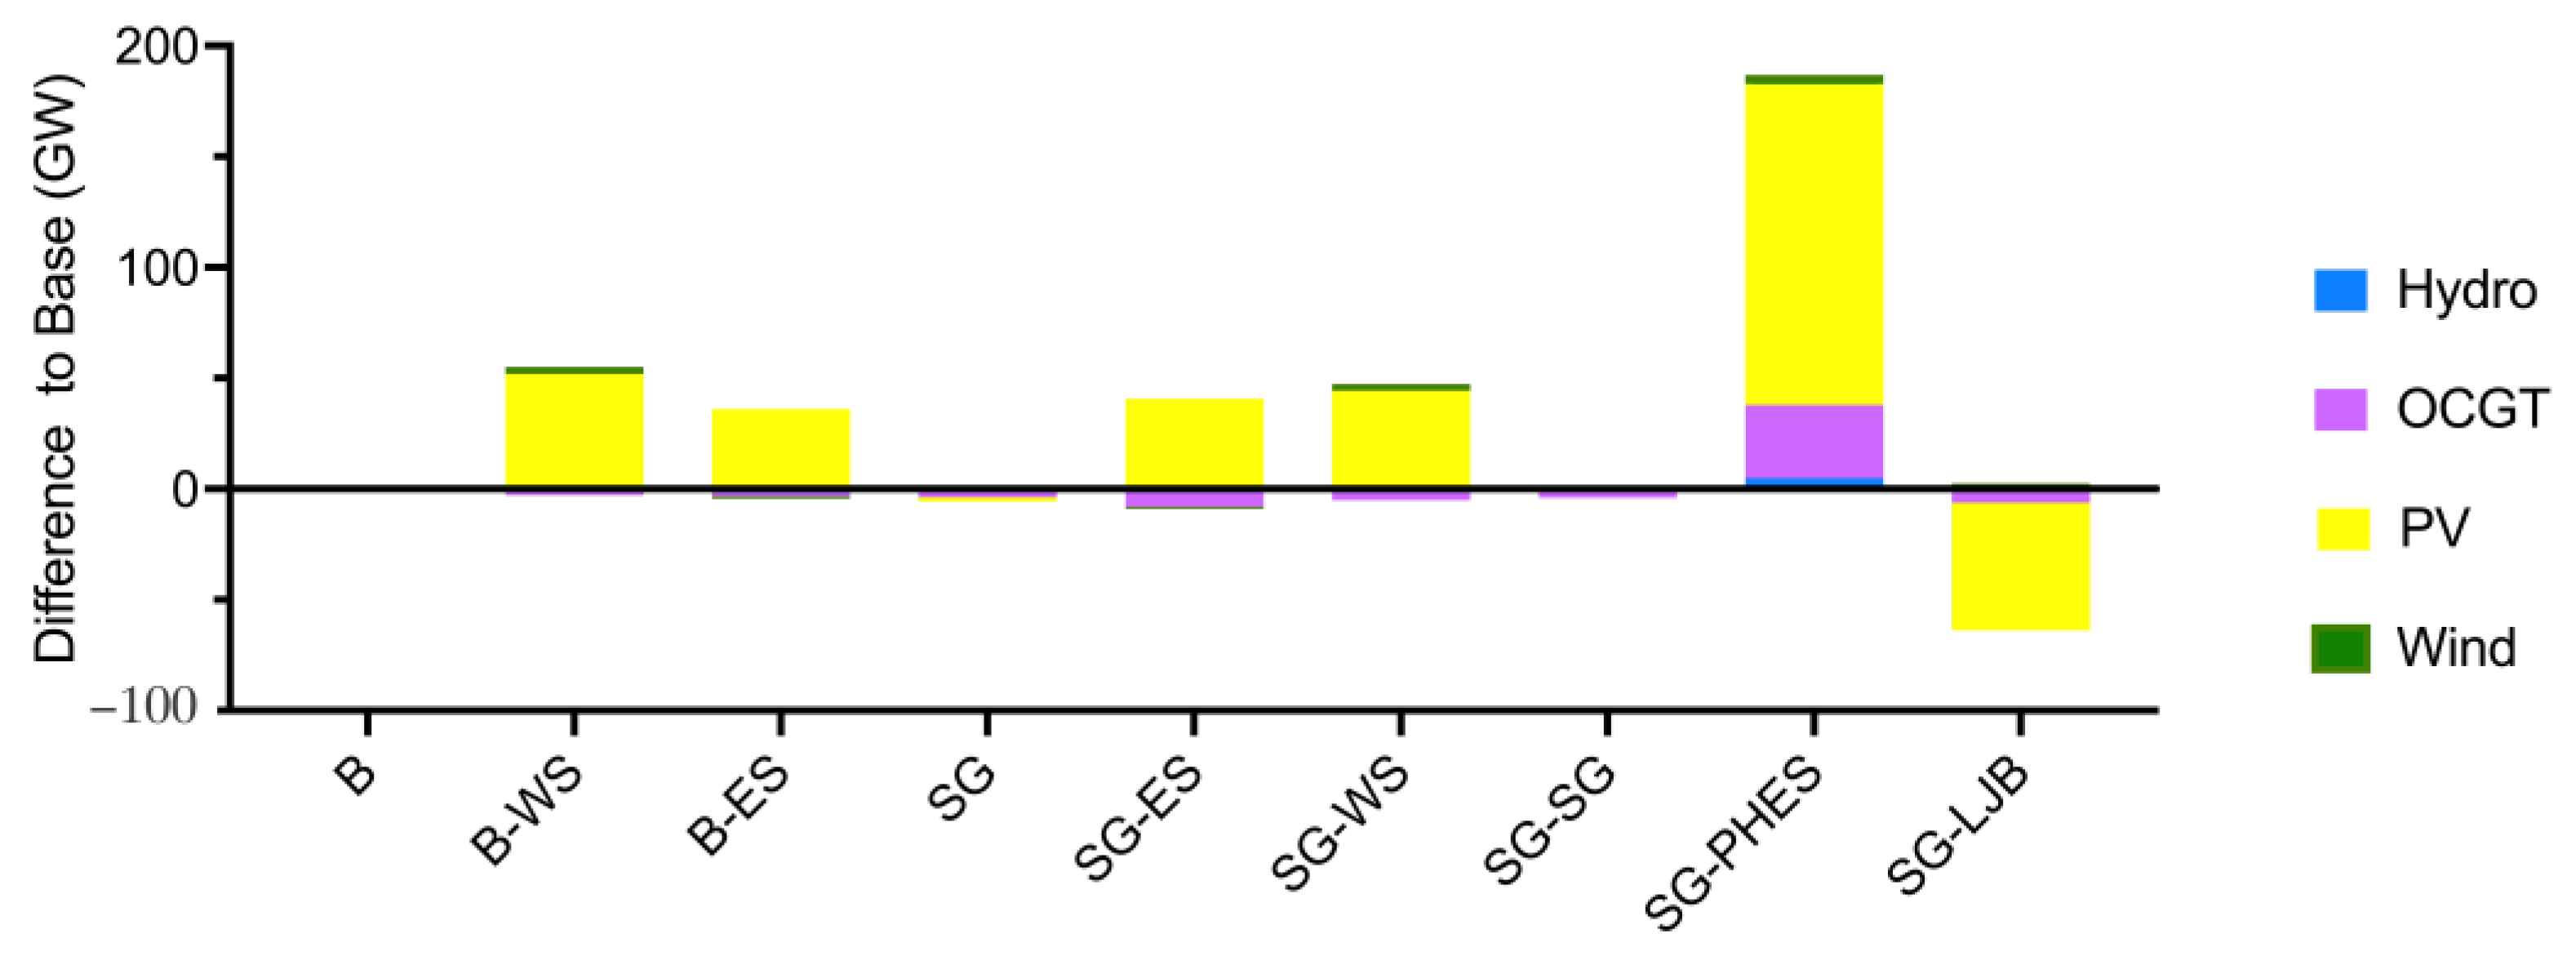
In the B-ES scenario, lower energy storage costs lead to an increased total capacity of 534 GW, mainly due to a 36 GW increase in PV installations. This scenario also shows slight reductions in gas, hydro, and wind capacities by 1–3 GW each. The B-WS scenario, focused on reducing capital costs for wind and solar, reaches a total capacity of 554 GW, with solar capacity increasing by 52 GW and wind by 3 GW, while hydro and OCGT decrease by 1 GW and 3 GW, respectively.
In the SG scenario, PV installations decrease by 5 GW compared to no super grid (base), while wind capacity decreases slightly by 1 GW, accompanied by a 2.4 GW reduction in OCGT, reflecting the benefits of improved interisland connections. The SG-ES scenario mirrors the capacity of B-ES at 534 GW but with less OCGT and a 41 GW increase in PV capacity over the base, indicating the super grid’s effectiveness in integrating RE. The SG-WS scenario follows similar trends but emphasizes wind energy expansion due to reduced costs. The SG-SG scenario, focused on lower transmission costs, shows minimal differences from the SG scenario, suggesting that current transmission solutions are already well optimized and robust against cost uncertainty. The SG-PHES scenario shows more installations in total, while the SG-LJB scenario, with limited solar and wind potential in the Java–Bali region, results in reduced PV capacity compared to the SG scenario.
Overall, these scenarios demonstrate that lower energy storage costs significantly boost PV installations while reducing OCGT, wind, and hydro capacities. Lower wind and solar costs enhance their installations and optimize hydro usage. The super grid configurations generally lead to slight increases in PV capacities and reduced OCGT. Additionally, scenarios with interisland connections tend to have slightly lower total generation installations, around 5 GW less, indicating the benefits of power exchange between islands.
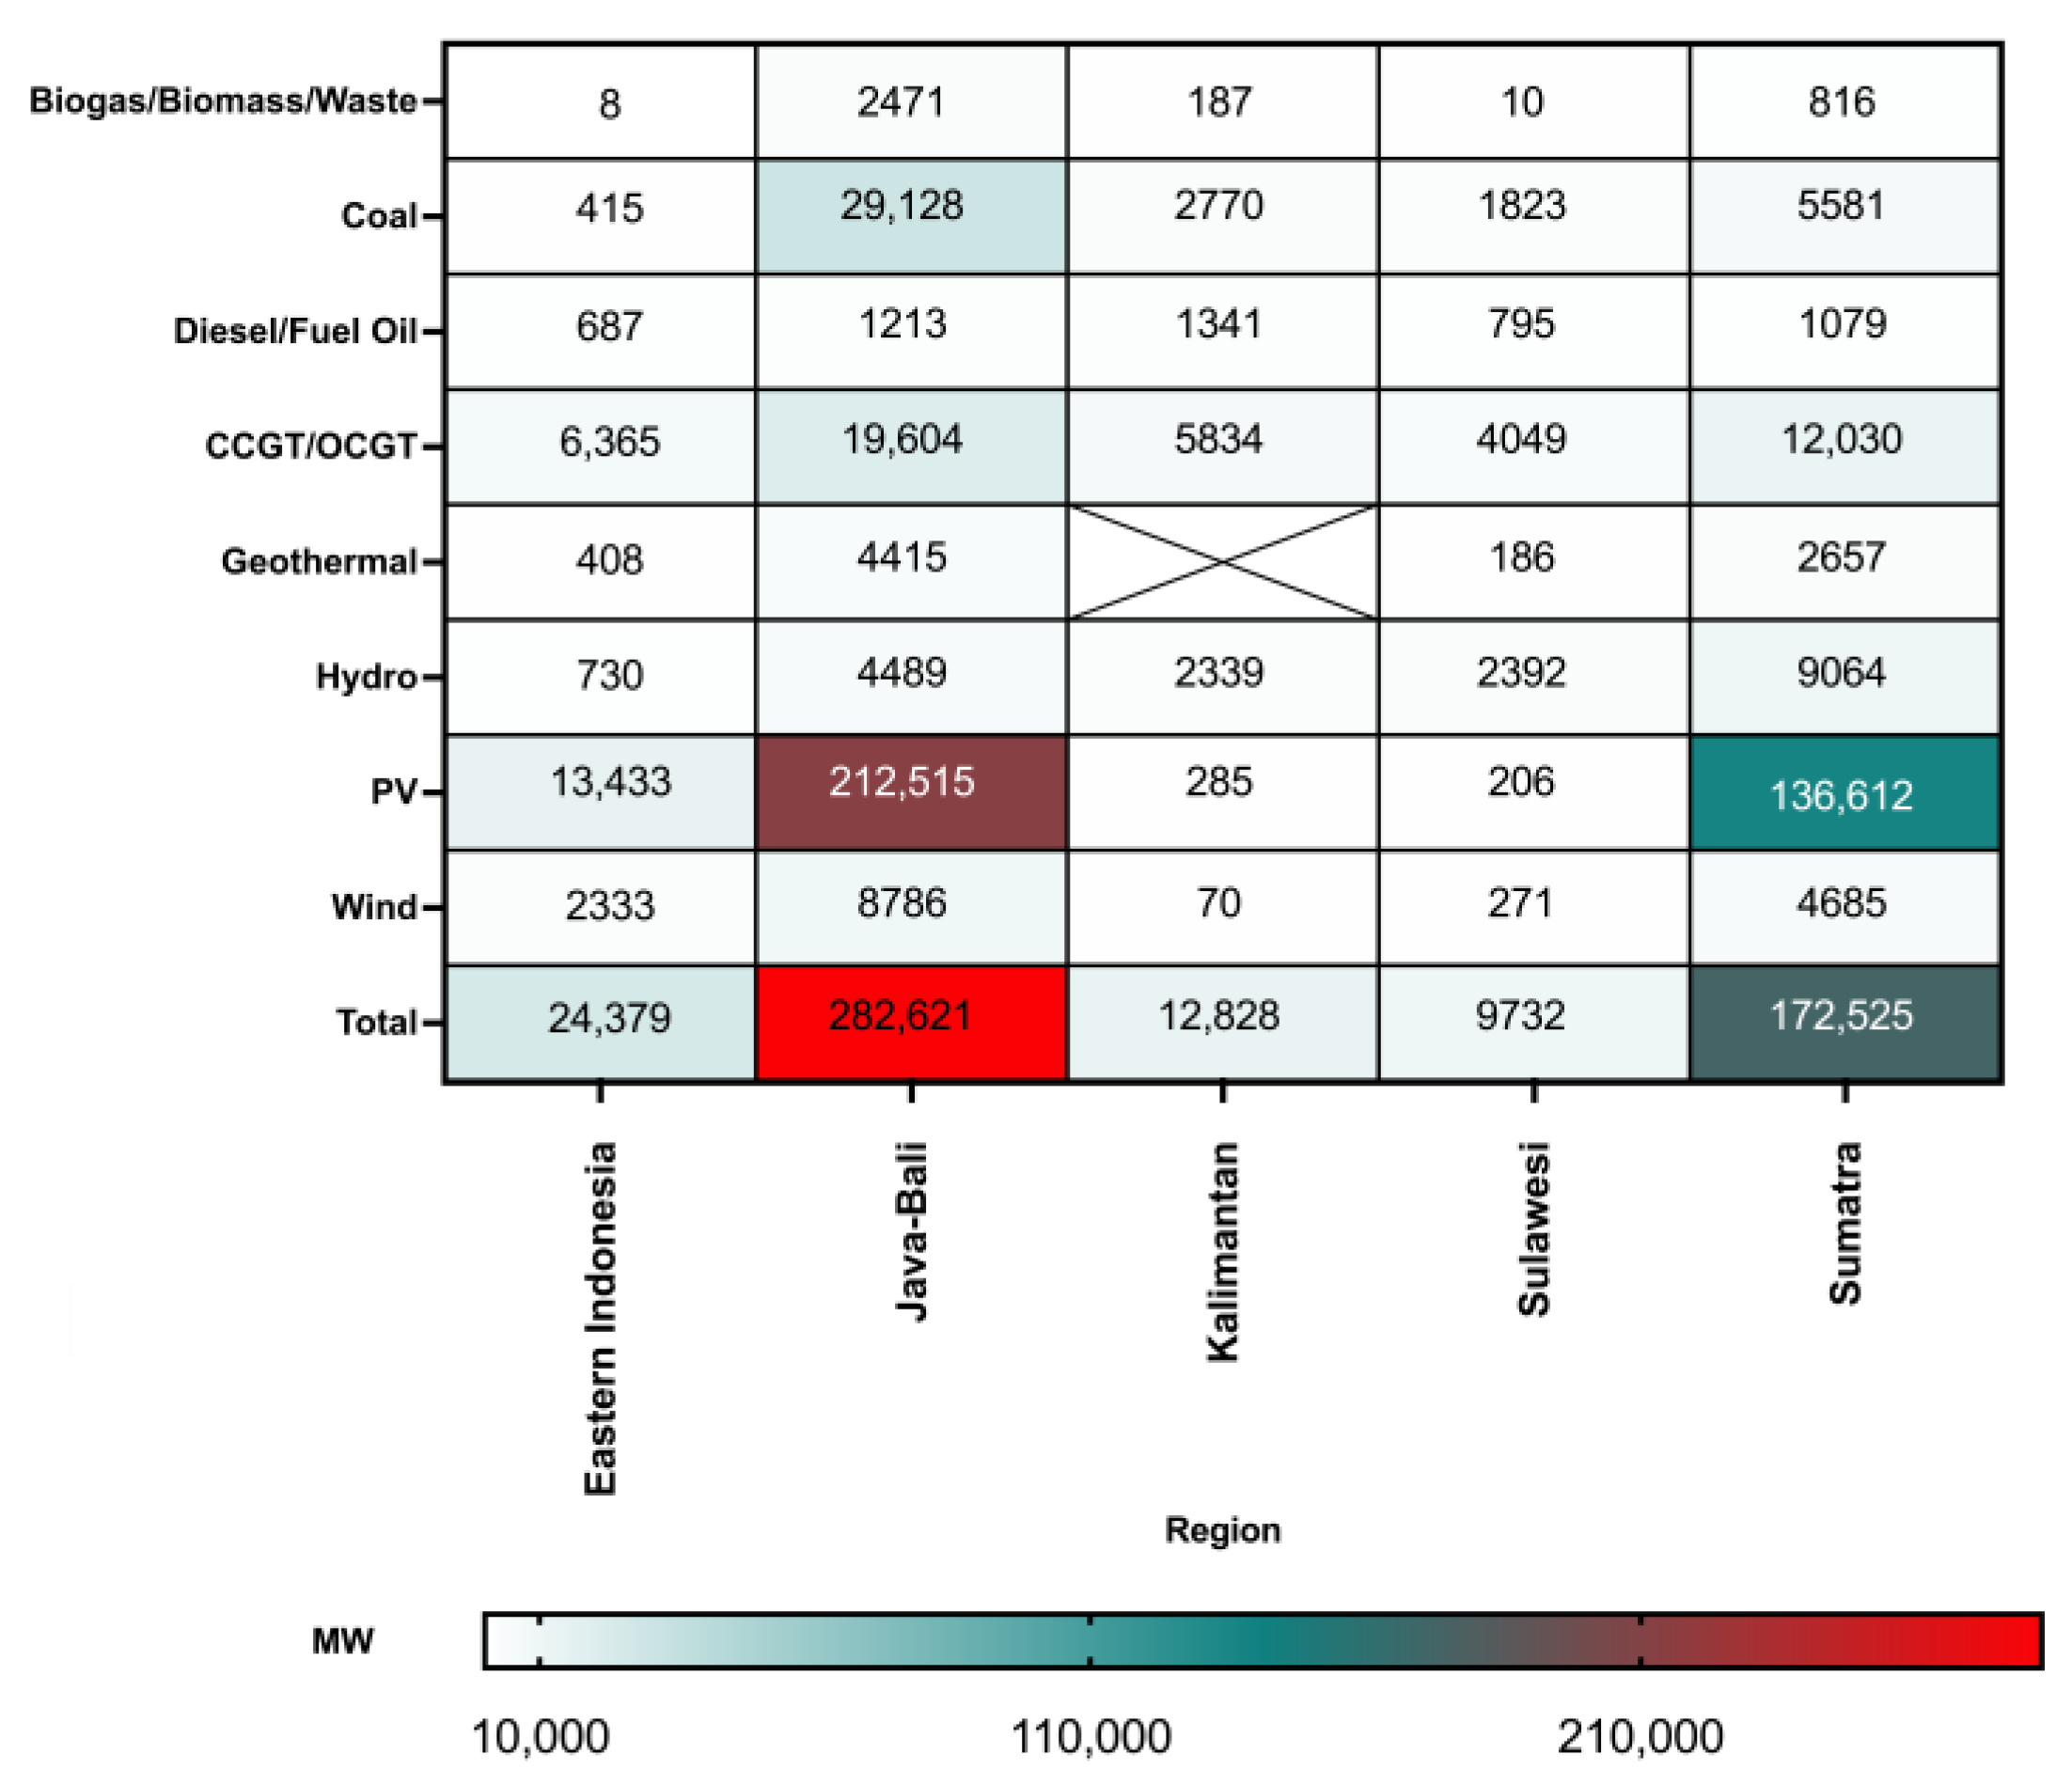
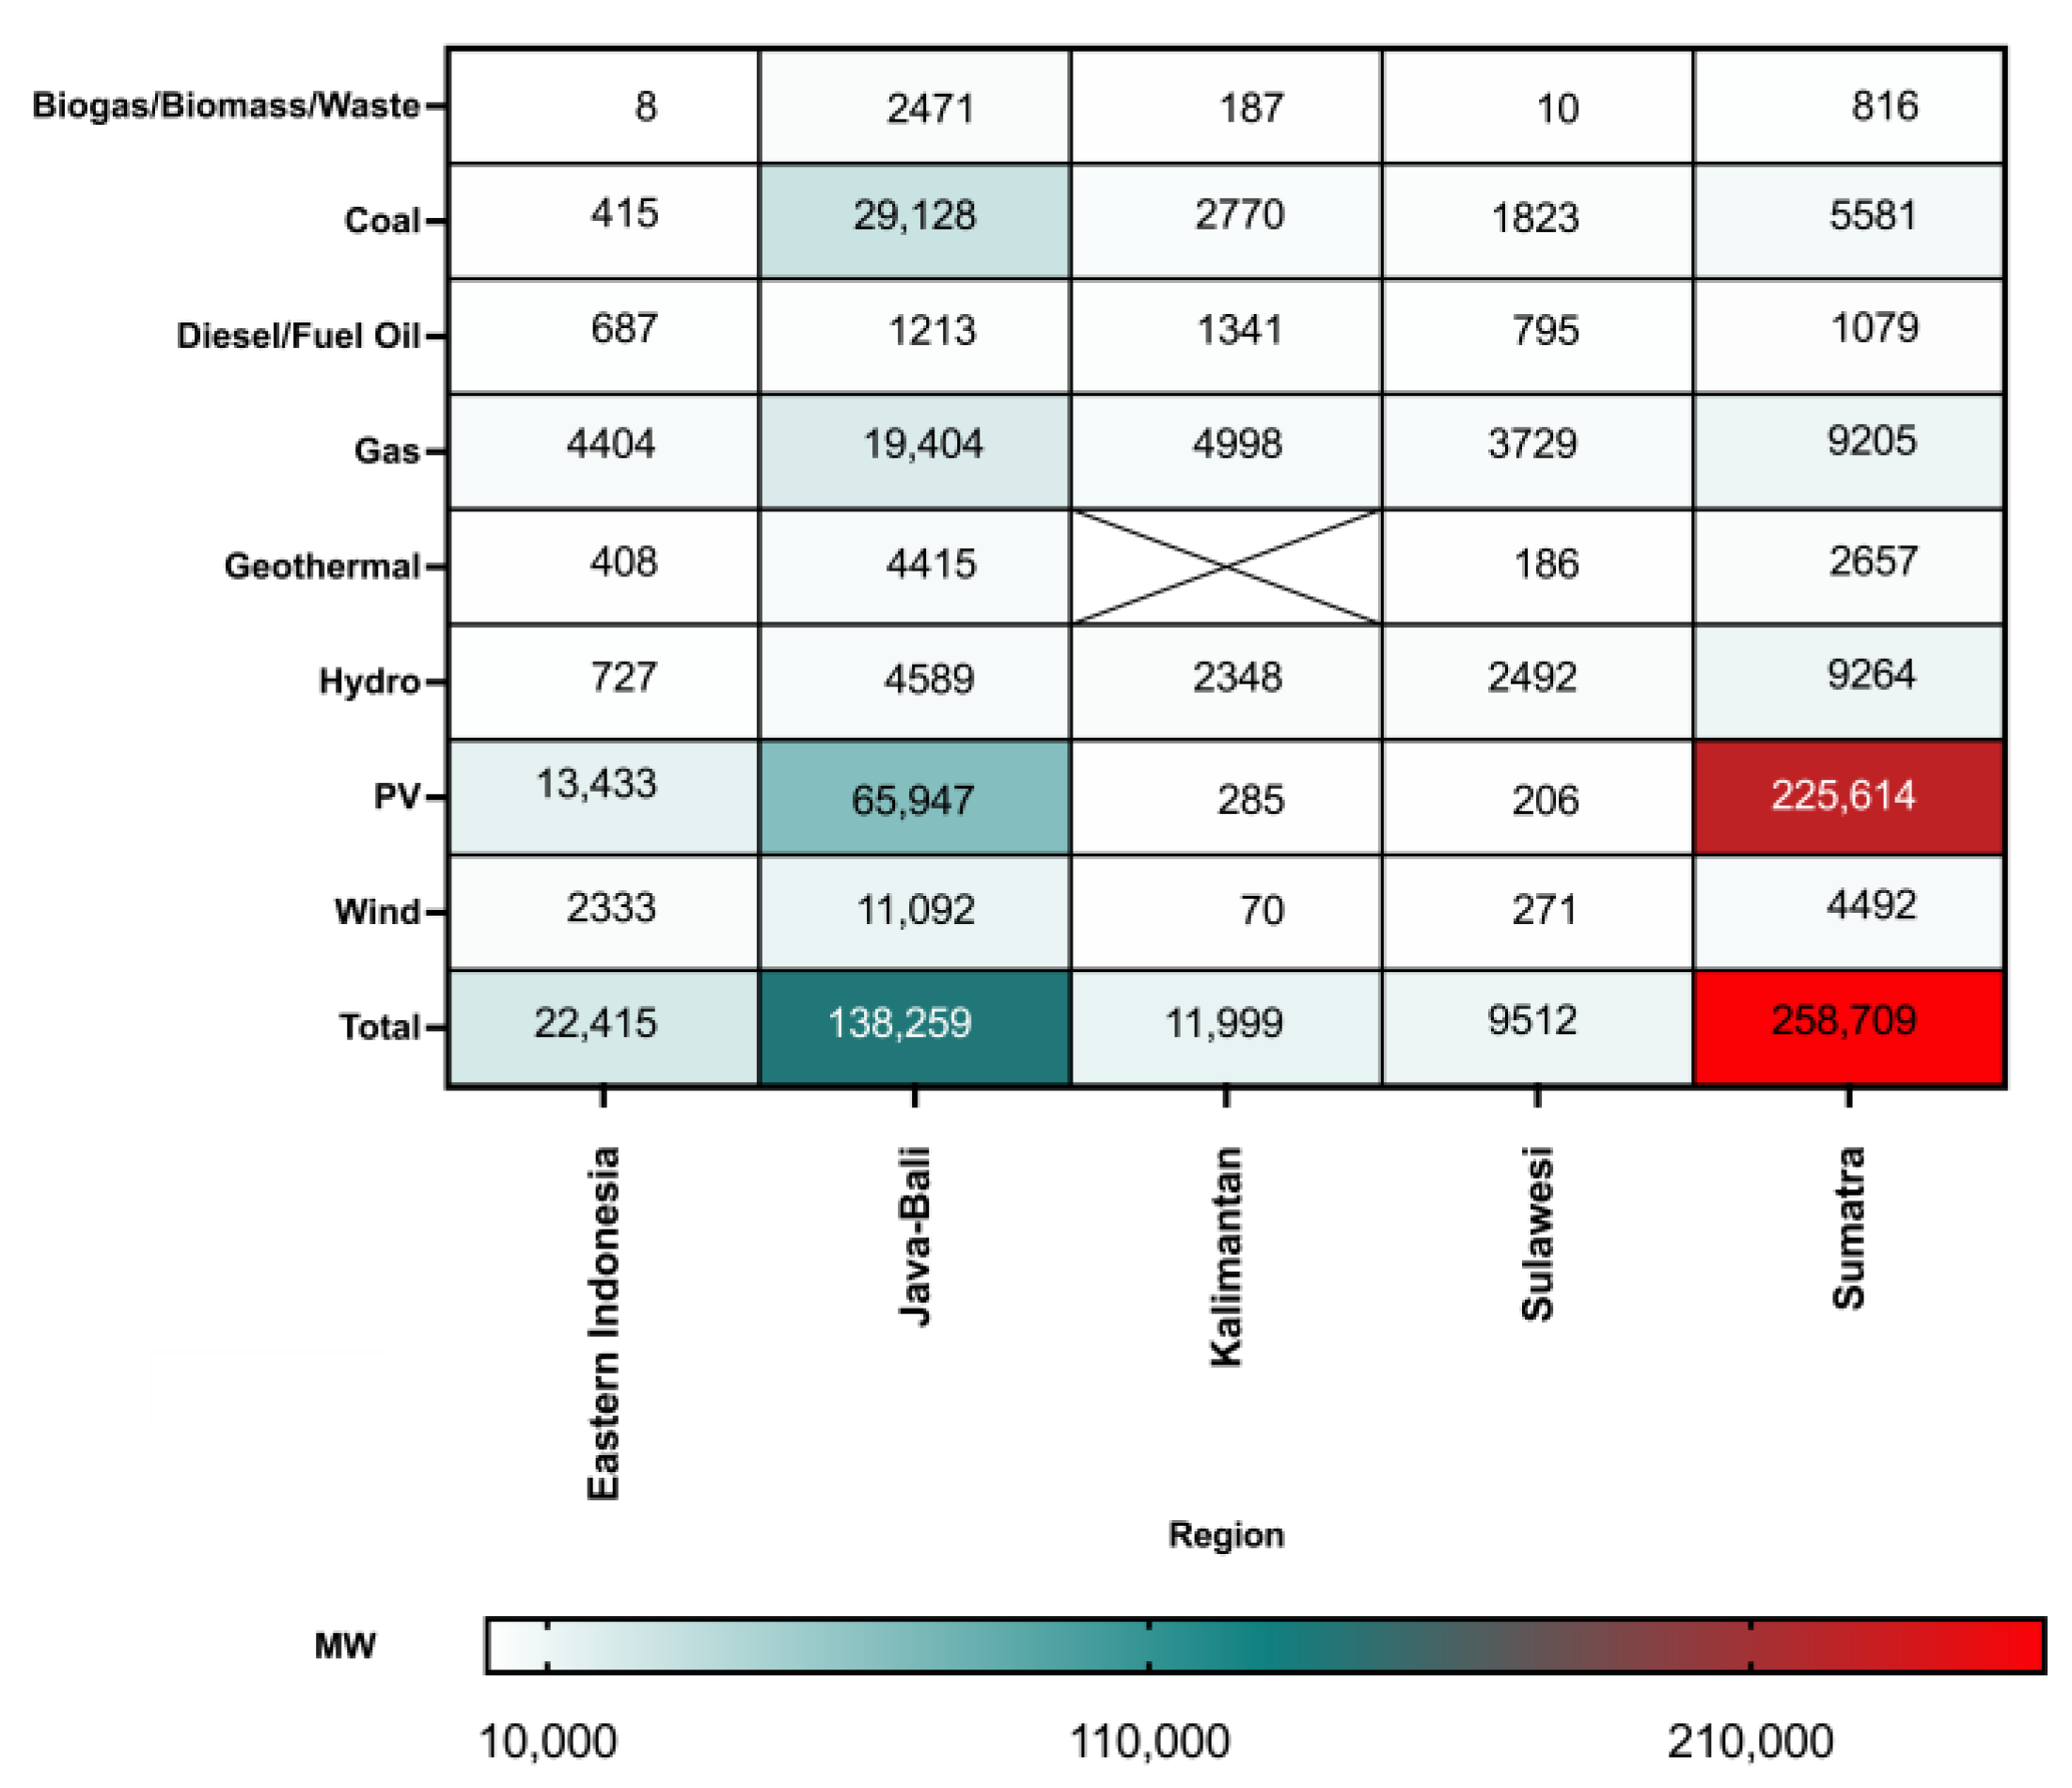
Additional analysis of installed capacity per region for selected scenarios is presented in
Figure 6,
Figure 7,
Figure 8 and
Figure 9. A detailed examination reveals that PV capacity is widely distributed, while coal remains concentrated in the Java–Bali region.
Figure 6 (Scenario B) shows the scenario without the super grid, while
Figure 7 (Scenario SG) demonstrates that with the super grid, PV installations in eastern Indonesia increase significantly while OCGT is reduced.
Figure 8 (SG-PHES) indicates a notable increase in PV installations in Sumatra and additional gas capacity in each region compared to the base scenario.
Figure 9 (SG-LJB) highlights high number of PV installations in Sumatra, serving as a source for the Java–Bali region, which faces limitations.
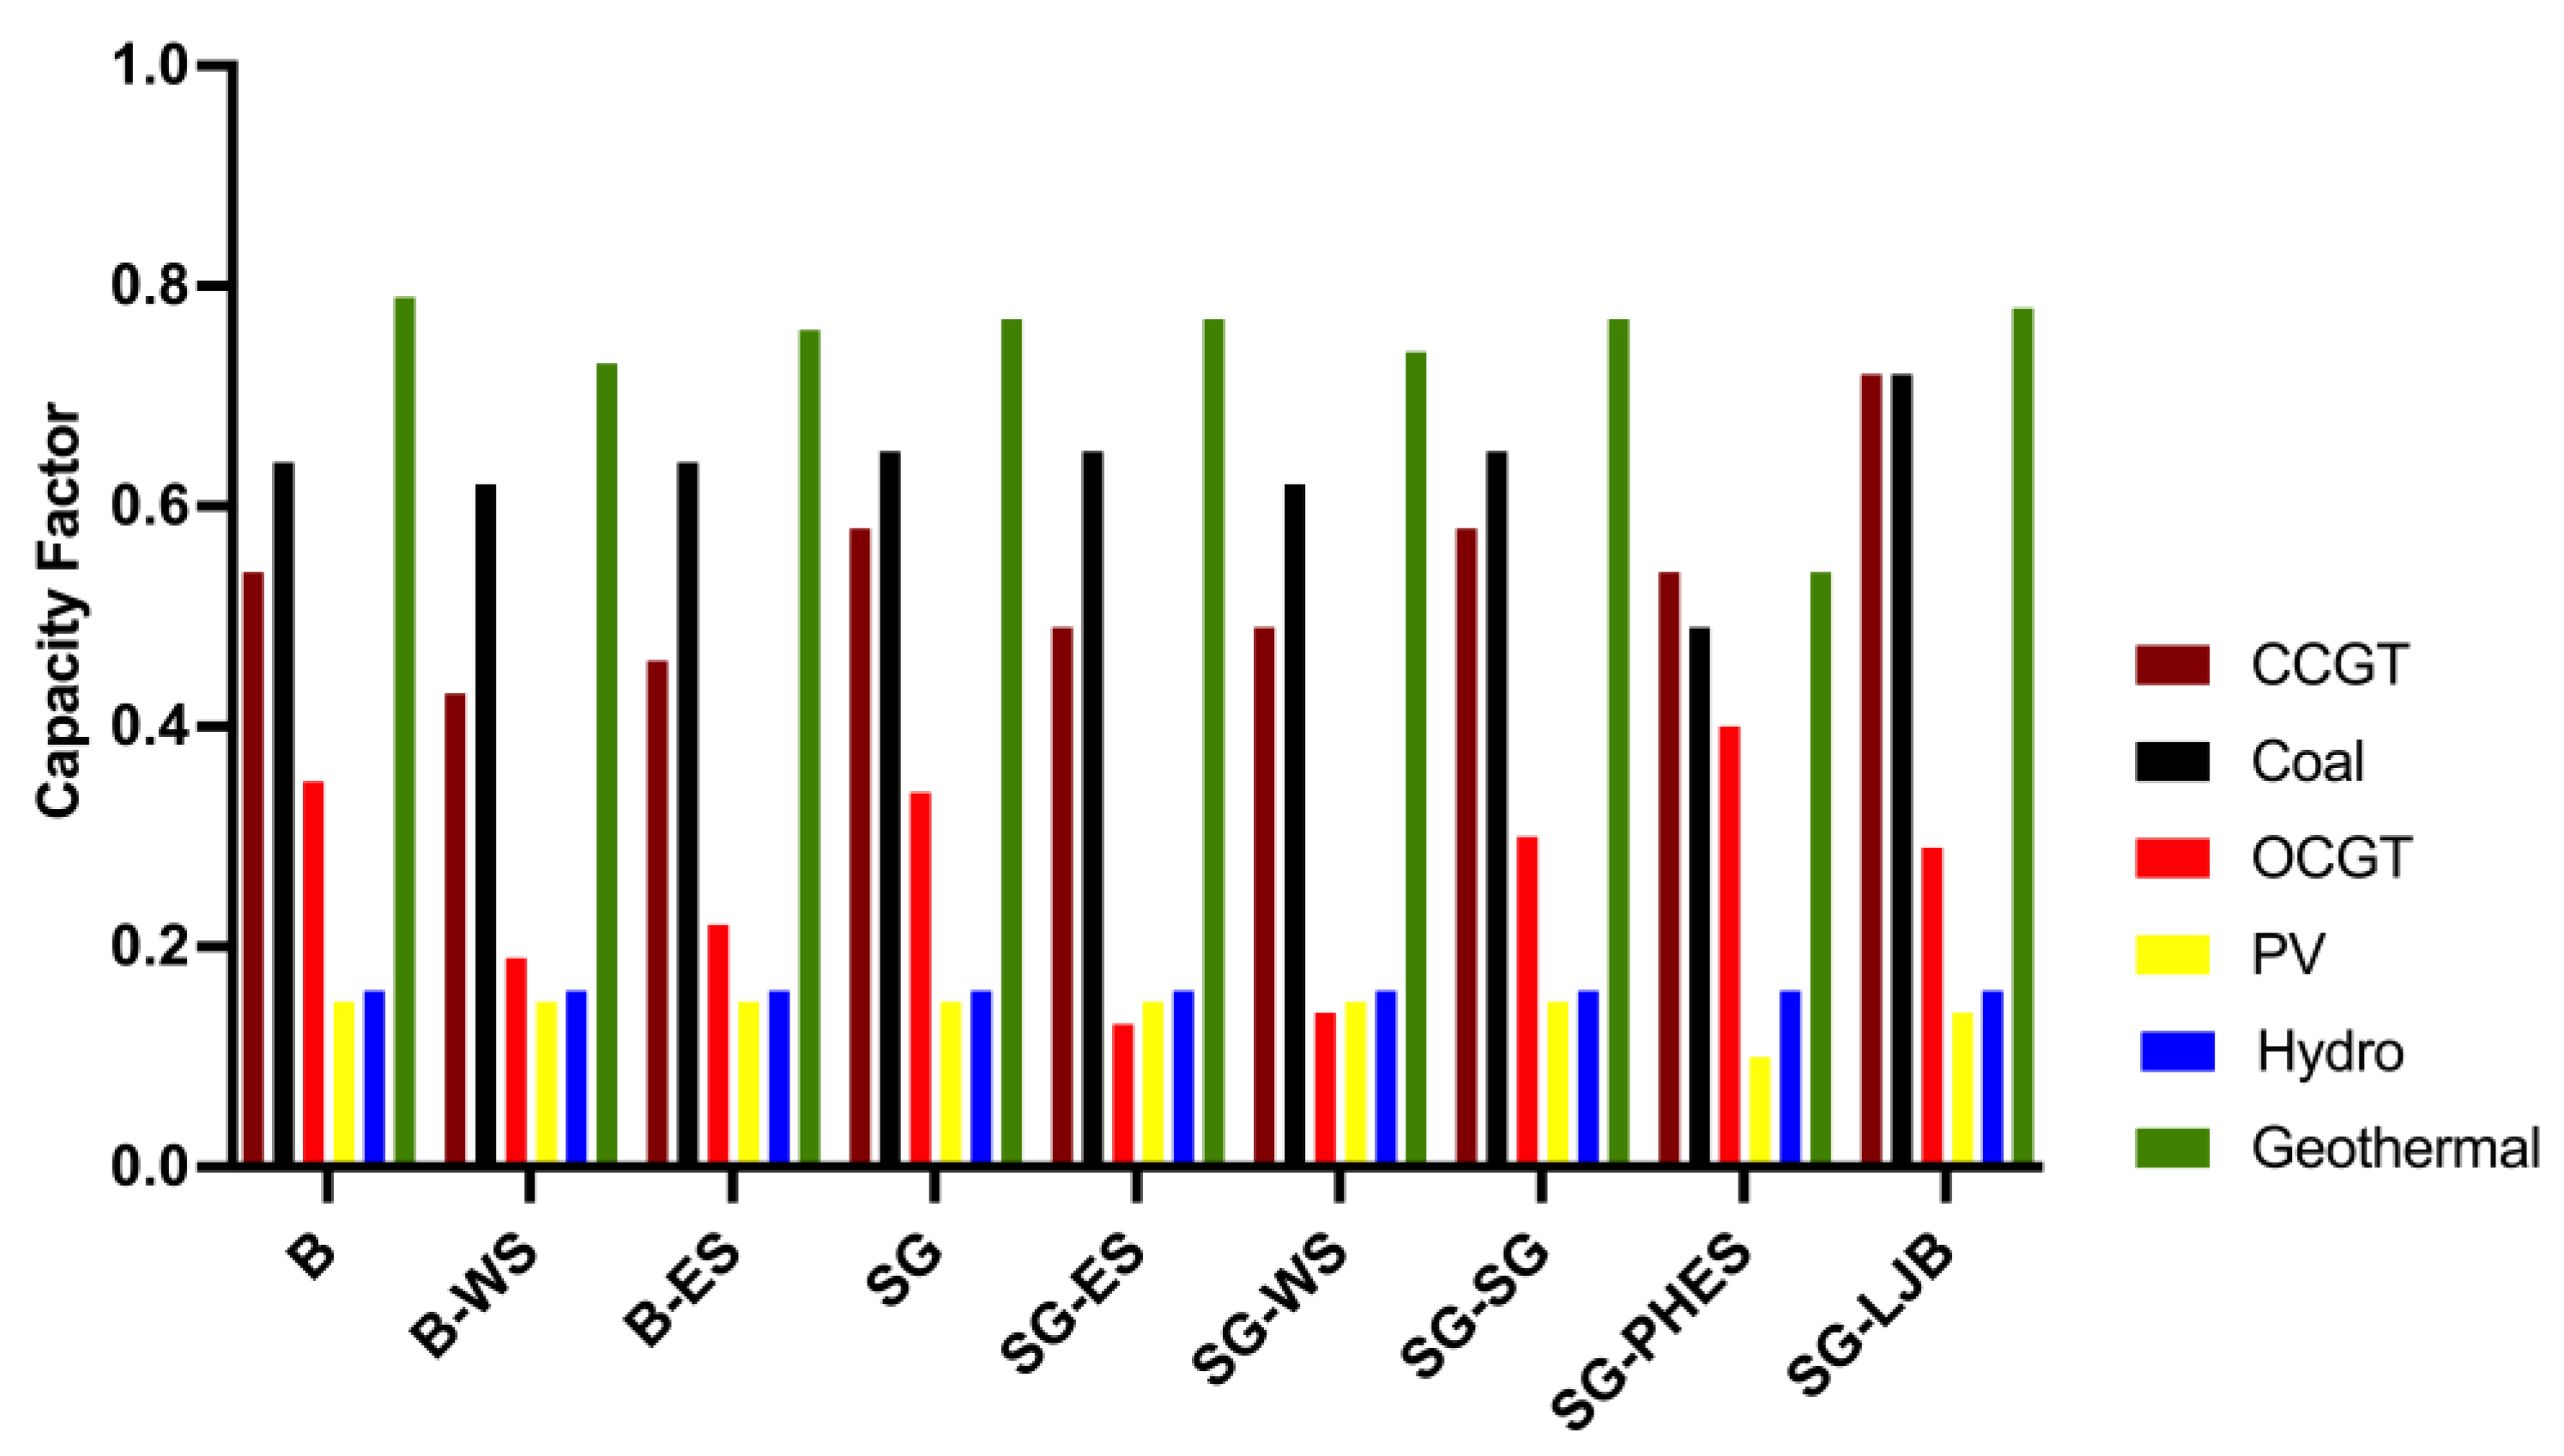
Another significant finding is that the increase in PV capacity surpasses that of other technologies, primarily due to its high potential, low capital costs, and the absence of fuel expenses, all of which contribute to lower generation costs. As demonstrated in
Figure 10 and
Table A5, PV maintains a relatively stable capacity factor across most scenarios, averaging around 15% of the name plate capacity in a year. In contrast, coal and gas exhibit higher capacity factors. However, in the SG scenario, the capacity factor for gas declines compared to the baseline, driven by optimal power exchanges that favor coal, which benefits from lower fuel costs, alongside biogas and biomass sourced from other islands.
4.2. Thermal and Renewable Energy Generation
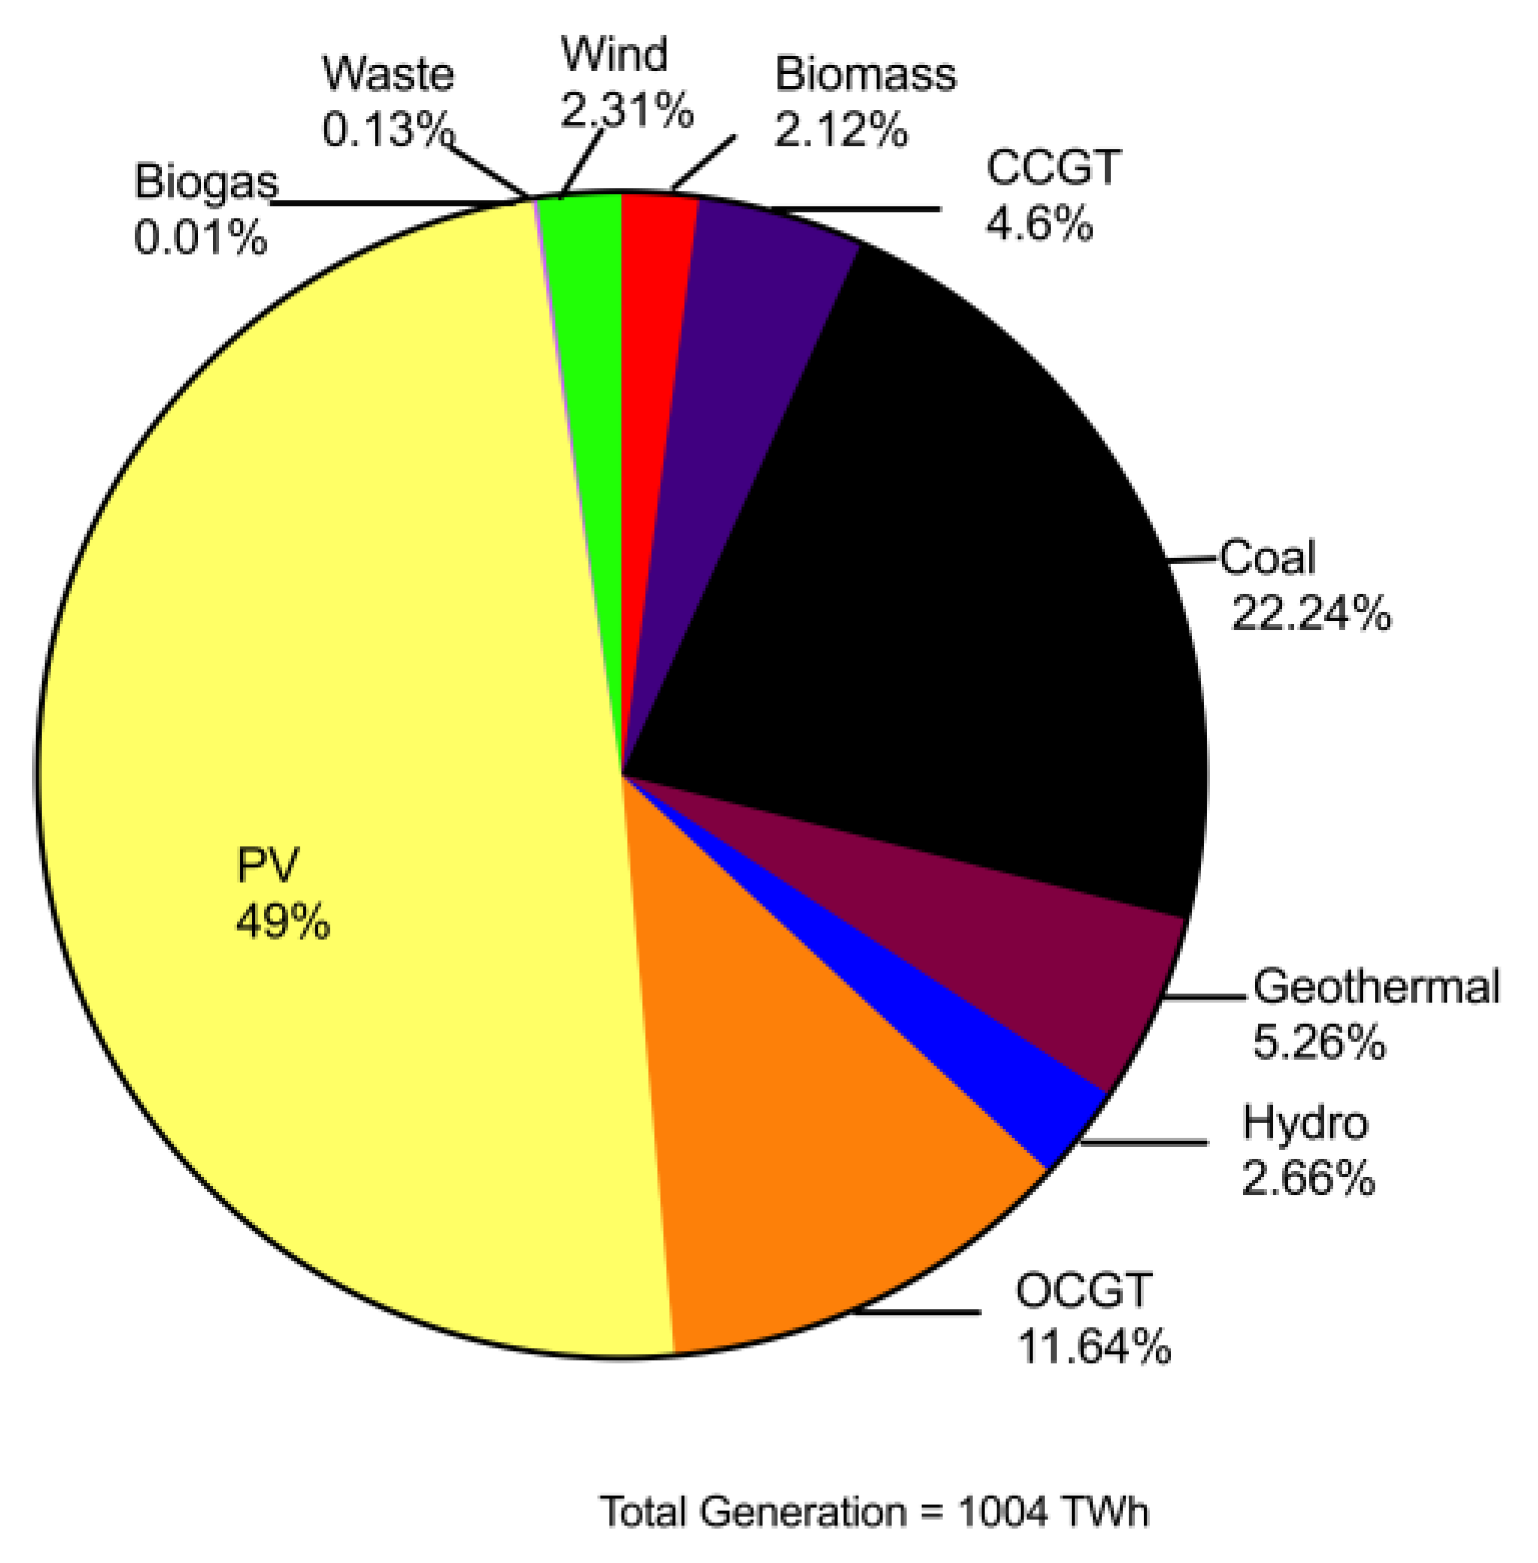
In the base scenario, total generation in 2050 is projected to reach 1004 TWh, with RE contributing 61.5% of the total, as shown in
Figure 11. The generation breakdown is as follows: PV accounts for 49%, coal for 22.2%, OCGT for 11.64%, geothermal for 5.26%, CCGT for 4.61%, hydro for 2.66%, and wind for a small share of 2.3%.
Figure 12 provides a comparison of generation across different scenarios relative to the base (B). It shows that lower costs for RE and energy storage lead to an increase in PV installations and a decrease in gas generation. Comparing the base scenario to the super grid (SG) scenario reveals reduced generation from gas and PV, attributed to the optimal power exchange between islands. In the scenario utilizing only PHES, gas generation is higher while coal, geothermal, and PV generation are lower. Lastly, in scenarios with limited PV resources in Java–Bali, PV generation decreases and coal generation increases.
RE is on track to achieve 100% in 2060. Under the base scenario, RE constitutes 61.5% of the energy mix. The implementation of a super grid increases this proportion to 62%. Furthermore, with reductions in wind and solar energy costs, the RE share in the super grid scenario could rise to 69%. As shown in
Table A6, a notable result is the percentage of generation from energy storage which is around 32% of the total generation.
4.3. Energy Storage
The energy storage options considered include PHES, LIBs, and RFBs. However, due to their high capital costs, PHES and RFBs were not selected in the optimal least-cost solutions in scenarios comparing LIBs, RFBs, and PHES.
As shown in
Table A7, lithium-ion batteries (LIBs) were chosen for energy storage in all scenarios except SG-PHES, which is dedicated solely to PHES. In the base scenario, the total energy storage capacity amounts to 1097 GWh, comprising 6 GW/12 GWh from 2 h batteries, 271 GW/1085 GWh from 4 h batteries, and a very small amount of 0.35 GWh from 8 h batteries. Scenarios with reduced energy storage costs (B-ES) or enhanced wind and solar integration (B-WS) show an increase in total energy storage capacity, particularly in B-ES due to the lower cost of storage solutions. In the SG-PHES scenario, the total installed capacity is 44 GW/353 GWh. Scenarios with limited RE potential in Java–Bali will require higher energy storage compared to base or SG scenarios.
In the super grid (SG) scenario, energy storage capacity increases by 8 GWh compared to the base scenario. As shown in
Figure 13, comparing SG-WS with B-WS highlights that grid connectivity facilitates a more cost-effective increase in energy storage capacity. However, the lower-cost SG-SG scenario shows no significant difference in energy storage capacity compared to SG, while scenarios with limited Java–Bali resources experience a slight reduction in energy storage capacities by 3 GWh.
In the dedicated PHES scenario, the total required energy storage capacity is considerably lower at 44 GW/353 GWh. The distribution of energy storage types in the other scenarios shows that 4 h batteries dominate, comprising 97–98% of the total capacity. In contrast, 2 h batteries account for only 2–3%, and 8 h batteries contribute just 0.04%. This distribution suggests a clear preference for certain energy storage durations based on cost-effectiveness and system requirements.
Table A8,
Table A9,
Table A10 and
Table A11 in
Appendix B illustrate the distribution of energy storage across regions for the selected scenarios: base, SG, SG-LJB, and SG-PHES, covering the period from 2035 to 2050. This information can serve as a reference for planners regarding the timing, size, and location of energy storage installations.
In the base scenario, most energy storage is concentrated in Java–Bali, Sumatra, and Kalimantan, predominantly using 4 h batteries. Initially, 2 h batteries are preferred, but as RE penetration increases, 4 h batteries become more favorable.
In the interconnection scenario (SG), as shown in
Table A9, less energy storage is needed in Sumatra compared to the base scenario due to optimal power exchange between islands. In the SG-LJB scenario, with limited PV installations in Java–Bali, higher storage capacity is required in neighboring islands such as Sumatra, Kalimantan, and Sulawesi. The SG-PHES scenario specifically indicates the locations for building PHES, with distribution spread across all regions.
Energy storage systems serve varying purposes across different regions of Indonesia, particularly when comparing the Java–Bali–Sumatra grid, which has a high penetration of photovoltaic (PV) and wind installations, to other regions. In Java–Bali–Sumatra, energy storage primarily addresses the variability of RE sources, such as PV and wind. In contrast, in other regions, energy storage focuses more on load shifting and maintaining least-cost production strategies. A notable finding in these regions is that the capacity factor for a 2 h battery storage system ranges between 4% and 8%. In contrast, for a 4 h battery storage system, the capacity factor increases to between 9% and 12%.
4.4. Super Grid
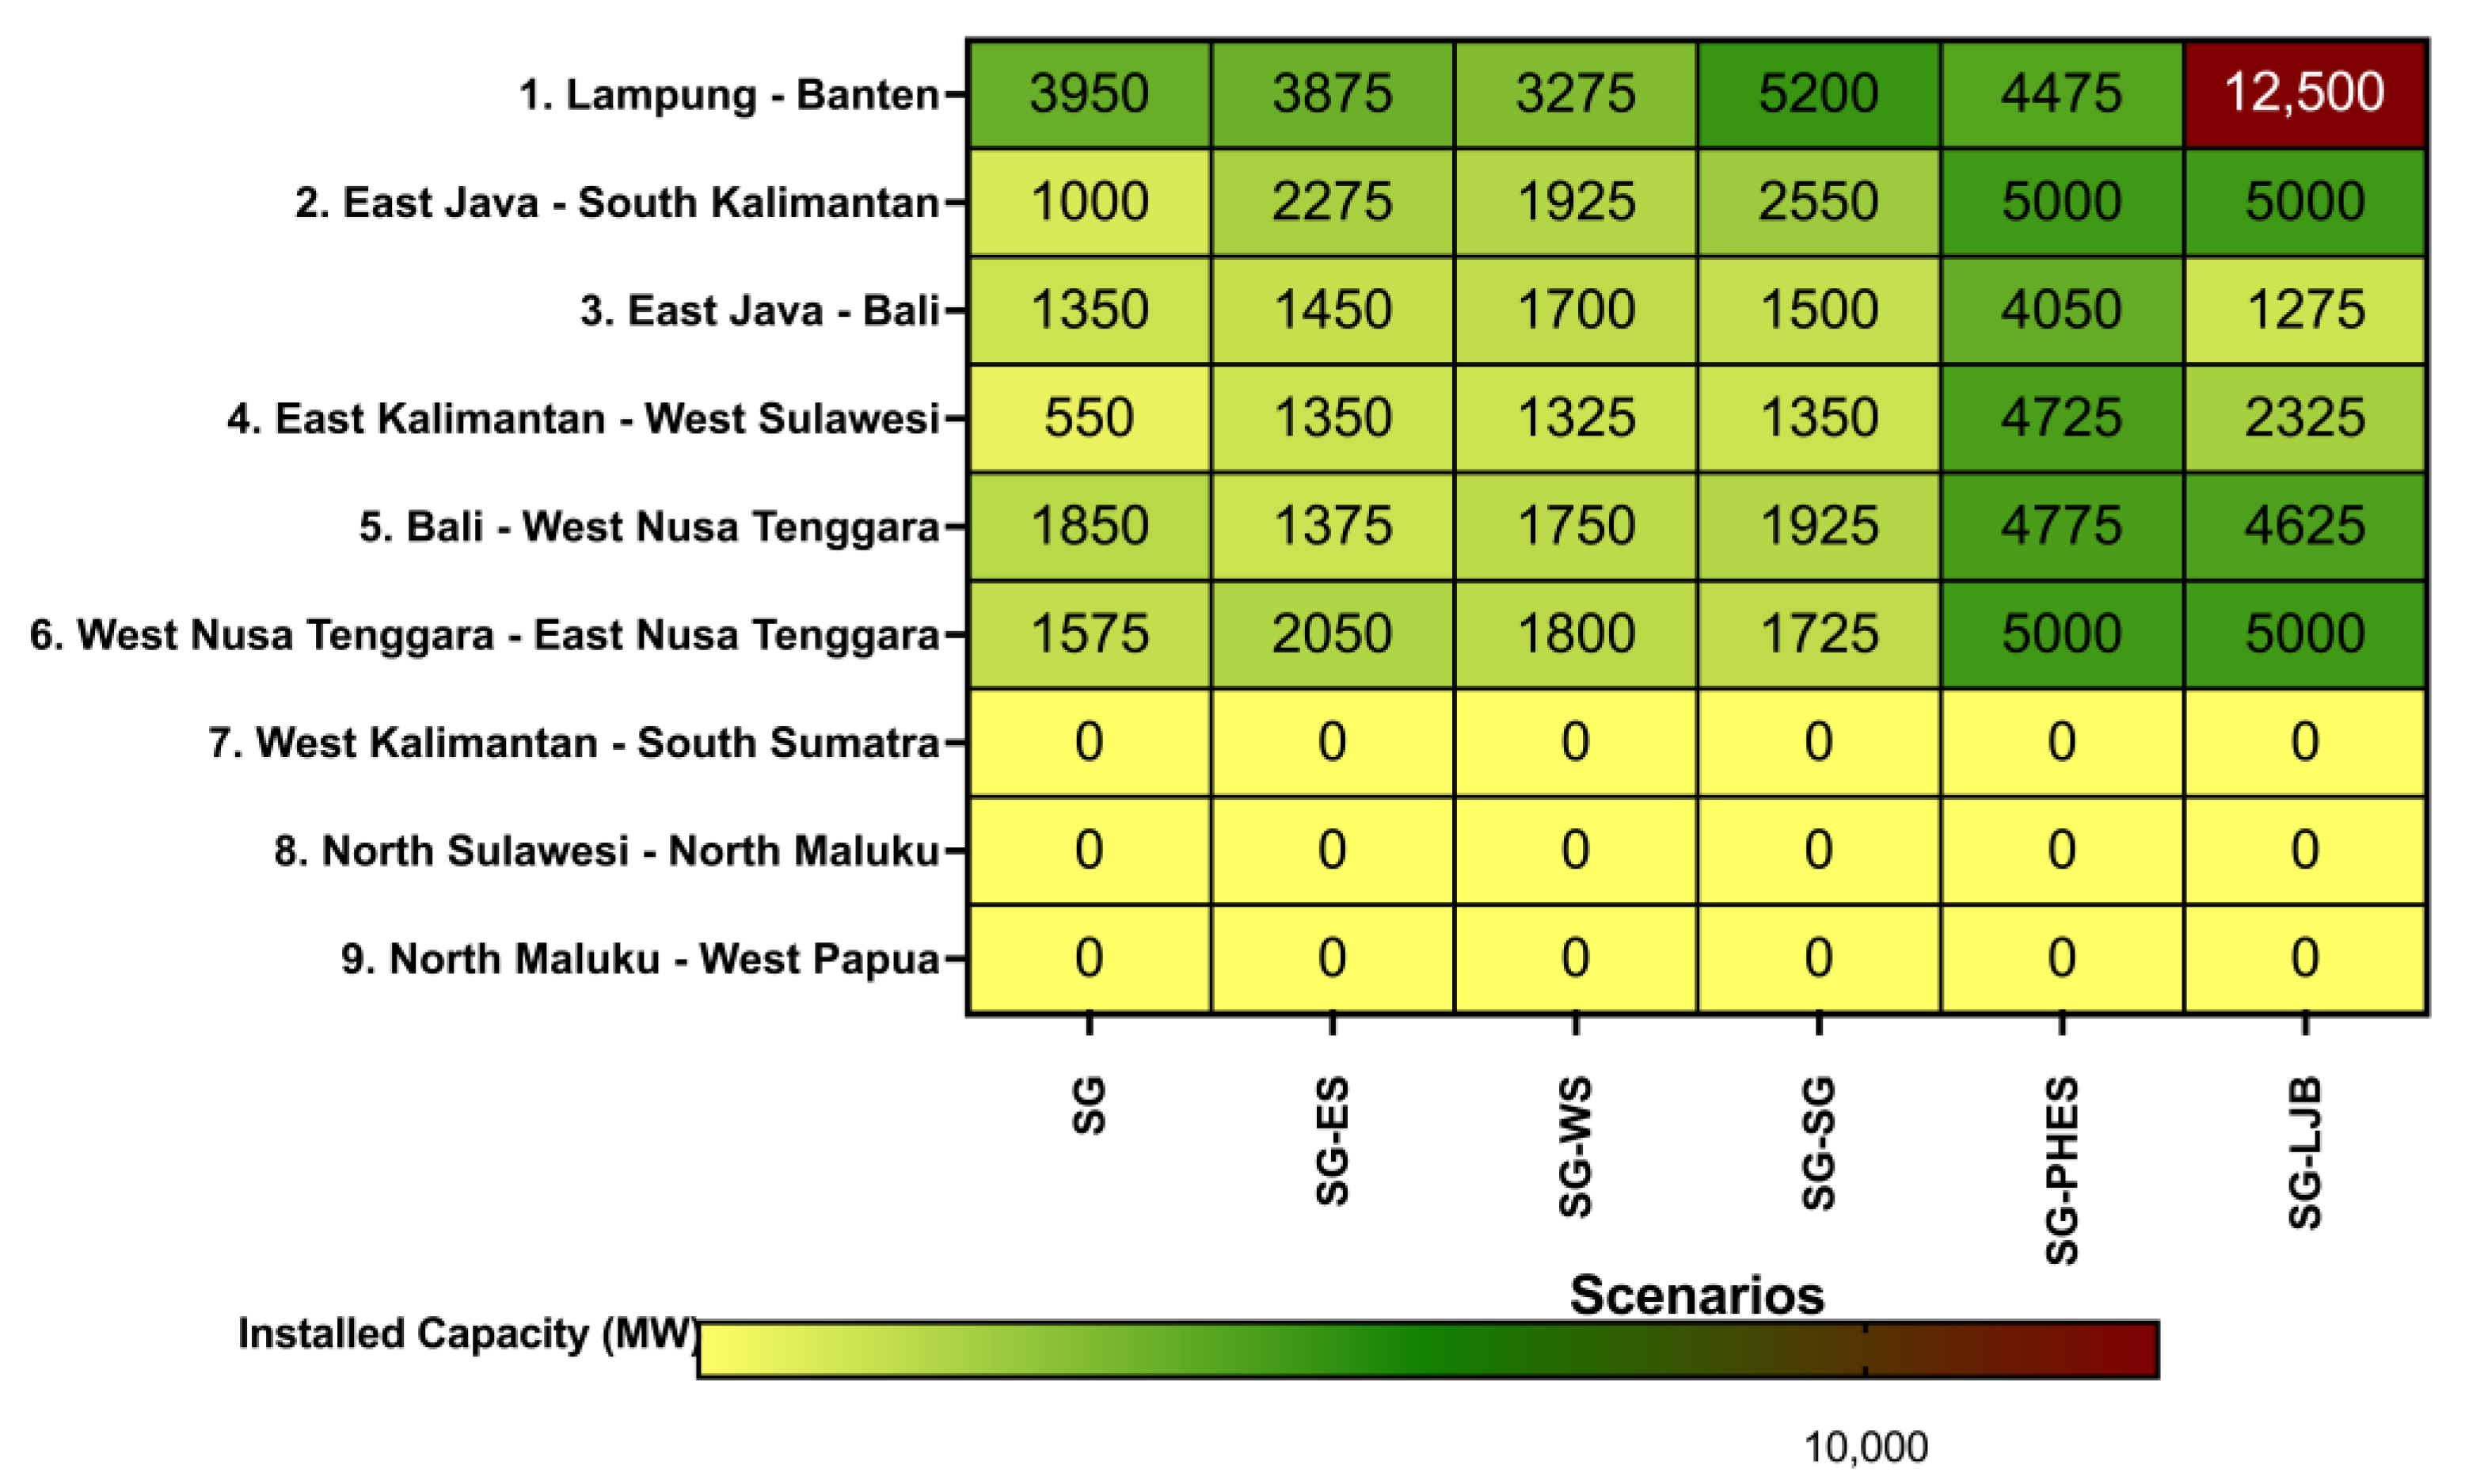
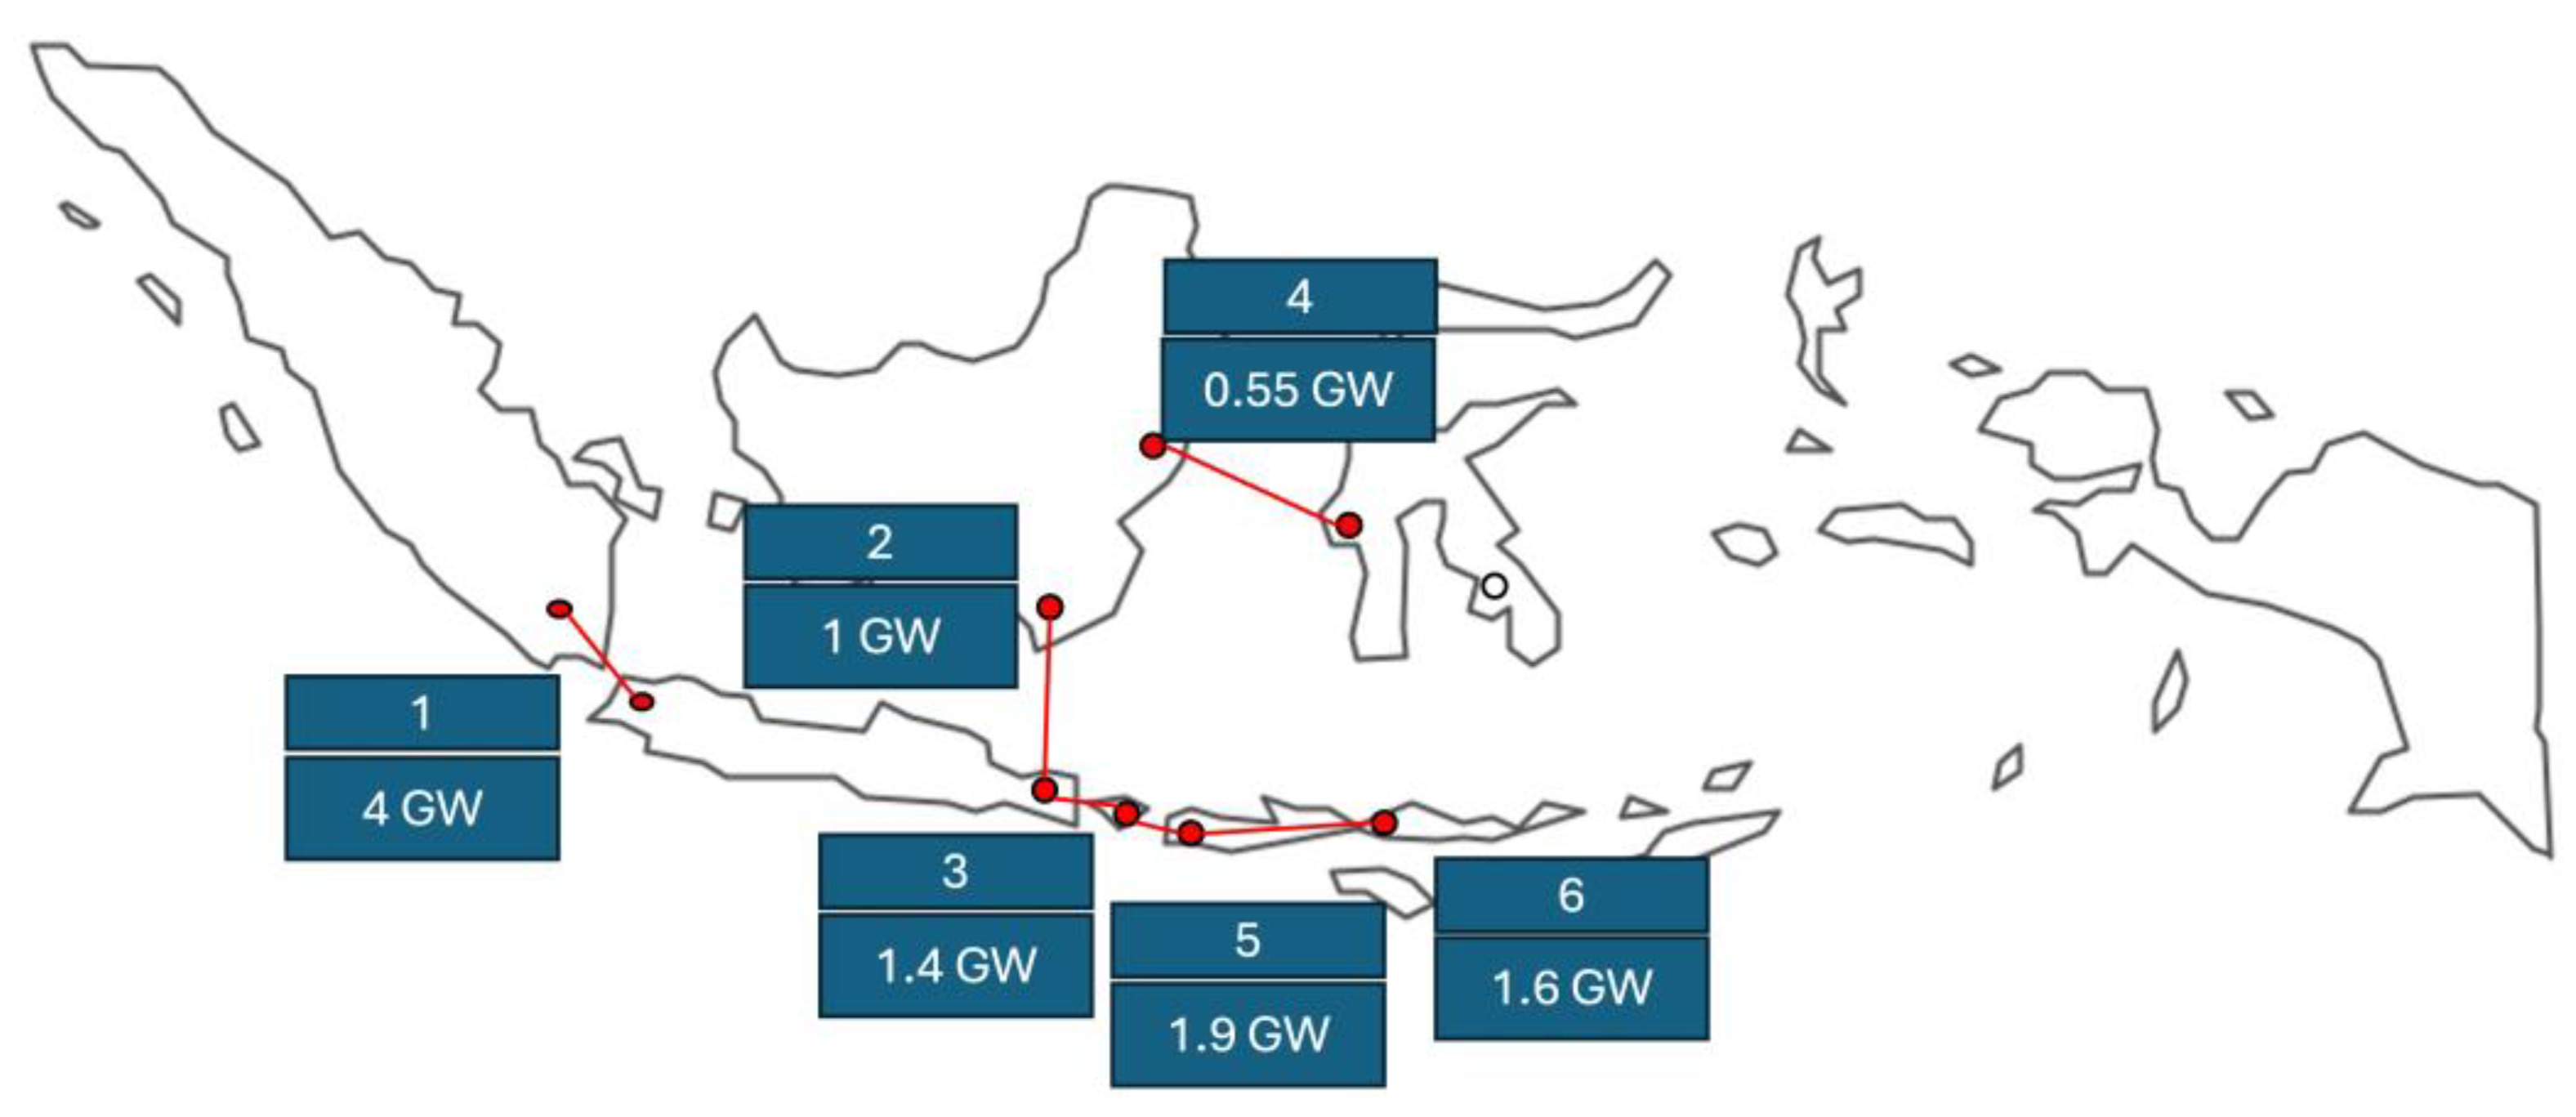
Figure 14 illustrates the super grid connections. Out of 10 potential candidates, 6 are selected. Most lines are located in the western part of Indonesia, connecting Sumatra, Java-Bali, West Nusa Tenggara, East Nusa Tenggara, Kalimantan, and Sulawesi.
The maximum installed capacity varies depending on island demand, RE potential, and the specific scenarios considered. In the super grid base (SG) scenario, Java–Bali are connected to other islands such as Sumatra through Banten (4 GW), new Java–Bali HVDC (1.4 GW), West Nusa Tenggara through Bali (1.9 GW), and Kalimantan through East Java (1 GW). Kalimantan is connected to Java–Bali (1 GW) and Sulawesi (0.55 GW), while West and East Nusa Tenggara are connected through 1.6 GW. There are no super grid connections to other parts of eastern Indonesia, such as Maluku and Papua.
In scenarios with lower energy storage costs (SG-ES) or reduced PV and wind costs (SG-WS), the capacities of the interconnections between Java and other islands increase, while the connection capacity to Sumatra decreases, capturing more potential from other islands.
The SG-PHES scenario highlights the need for extensive interconnection due to the specific locations of pumped hydro storage, making PHES more costly compared to other options. For the limited Java–Bali potential scenario (SG-LJB), there is a significant increase in connections to other islands to support the demand in Java–Bali. The interconnection capacity to Sumatra triples to 12.5 GW compared to the base super grid scenario. The preferred connections for the base super grid scenario are shown in
Figure 15.
Figure 16 illustrates the power flow patterns. In the SG scenario, power generally flows from Java–Bali to other islands due to the sufficient RE and energy storage capacity within Java–Bali, which are located close to the demand centers. Since Java–Bali have the highest concentration of demand, power plants, and energy storage, the power flow predominantly moves outward from Java–Bali. In the SG-PHES scenario, where pumped hydro energy storage (PHES) is utilized, the power flow shifts, with power moving from Sumatra to Java–Bali. In contrast, in the SG-LJB scenario, power is supplied to Java–Bali from Sumatra, West Nusa Tenggara, and Kalimantan.
4.5. Cost
Regarding costs, PLEXOS employs least-cost optimization for investment and production. As shown in
Table A12 and
Figure 17, the present value of total costs from 2021 to 2050 is primarily driven by operational generation costs. When comparing the base (B) scenario to the super grid (SG) scenario, there is a slight reduction in costs due to interconnection. Scenarios with lower costs for energy storage (ES) and RE (RE) also exhibit reduced total costs. However, in the SG-SG scenario, the reduced transmission costs do not significantly lower the overall costs, indicating that the cost structure and energy resource mix are robust and well optimized and not greatly sensitive to the interconnection cost.
Notably, the PHES scenario shows the highest costs due to high generation expenses, and the SG-LJB scenario also exhibits higher costs compared to the standard SG scenario.
Table 4 shows the generation supply cost for each region for selected scenarios, with the overall cost of energy averaging around USD 90/MWh (generation supply cost = present value (total cost)/[present value (generation − battery load)]). When comparing the base scenario (USD 92/MWh) to the super grid (SG) scenario (USD 91/MWh), SG demonstrates a lower total energy cost. A 25% reduction in RE (RE) and energy storage (ES) costs results in an additional reduction of USD 2–3/MWh. However, using only pumped hydro energy storage (PHES) leads to a higher cost of USD 98/MWh. If the available land in Java–Bali for solar PV and wind power is restricted to only 10% due to land constraints, the cost increases to USD 94/MWh.
This analysis indicates that aiming for 100% RE by 2060, with 62% achieved by 2050, has the potential to lower the country’s generation cost from USD 98/MWh in 2022 to USD 91/MWh by 2050.
5. Conclusions
The study investigates the optimal integration of RE sources, energy storage technologies, and the establishment of a super grid in Indonesia to achieve 100% RE by 2060. It employs PLEXOS, widely recognized for its ability to simulate complex energy systems, to assess multiple scenarios. These scenarios explore different combinations of demand growth, energy storage costs, RE costs, and grid infrastructure enhancements. The model includes current power plant infrastructures, potential RE sources, and the feasibility of interisland connections through a super grid.
Key Findings:
The base scenario (B) projects a significant increase in total installed capacity from 63 GW in 2021 to 502 GW by 2050, primarily driven by solar PV installations, which constitute 72.3% of the total capacity.
The introduction of a super grid (SG) slightly reduces the overall system cost and enhances RE integration. PV installations are optimized, with increased capacity in regions like eastern Indonesia, reducing the need for gas-powered generation in other scenarios.
The scenarios reveal that lithium-ion batteries (LIBs) are the preferred energy storage technology due to their lower costs and efficiency. The super grid scenarios show that less energy storage is required in interconnected islands due to optimal power exchange.
The study shows that the present value of total costs from 2021 to 2050 is primarily driven by operational generation costs. The super grid reduces costs slightly, with notable cost reductions in scenarios involving lower RE and energy storage costs.
The average cost of energy across Indonesia is around USD 90/MWh, with the super grid scenario showing a slight reduction in generation costs. Regions like Java–Bali benefit most from interconnections, while scenarios relying solely on pumped hydro energy storage (PHES) show higher costs.
The study concludes that achieving 100% RE by 2060 in Indonesia is feasible with strategic investments in RE, significant amounts of energy storage, and the development of a super grid. The super grid facilitates optimal power exchange between islands, reducing the overall system cost and enhancing the efficiency of RE integration. The results indicate that by 2050, Indonesia can achieve 62% RE generation with the potential to lower the country’s generation cost from USD 98/MWh in 2022 [
61] to USD 91/MWh. These findings provide valuable insights for policymakers and stakeholders in planning and implementing Indonesia’s energy transition.
For future research, it is imperative to conduct a comprehensive analysis of regional grid stability, especially under conditions of high RE penetration, to ensure reliable operation. Investigating advanced energy storage technologies, such as solid-state batteries and hydrogen storage, may offer more efficient and scalable alternatives to lithium-ion batteries. Furthermore, an in-depth economic feasibility study of potential interisland and international grid connections should be undertaken. The development of supportive policy and regulatory frameworks is essential for advancing the energy transition, and these frameworks should be a focus of future studies. Additionally, scenario testing under extreme conditions, including severe weather events or geopolitical instability, will be critical in evaluating the resilience of the proposed energy system.
