
Evaluation of Distributed Photovoltaic Economic Access Capacity in Distribution Networks Considering Proper Photovoltaic Power Curtailment


Abstract
1. Introduction
- (1)
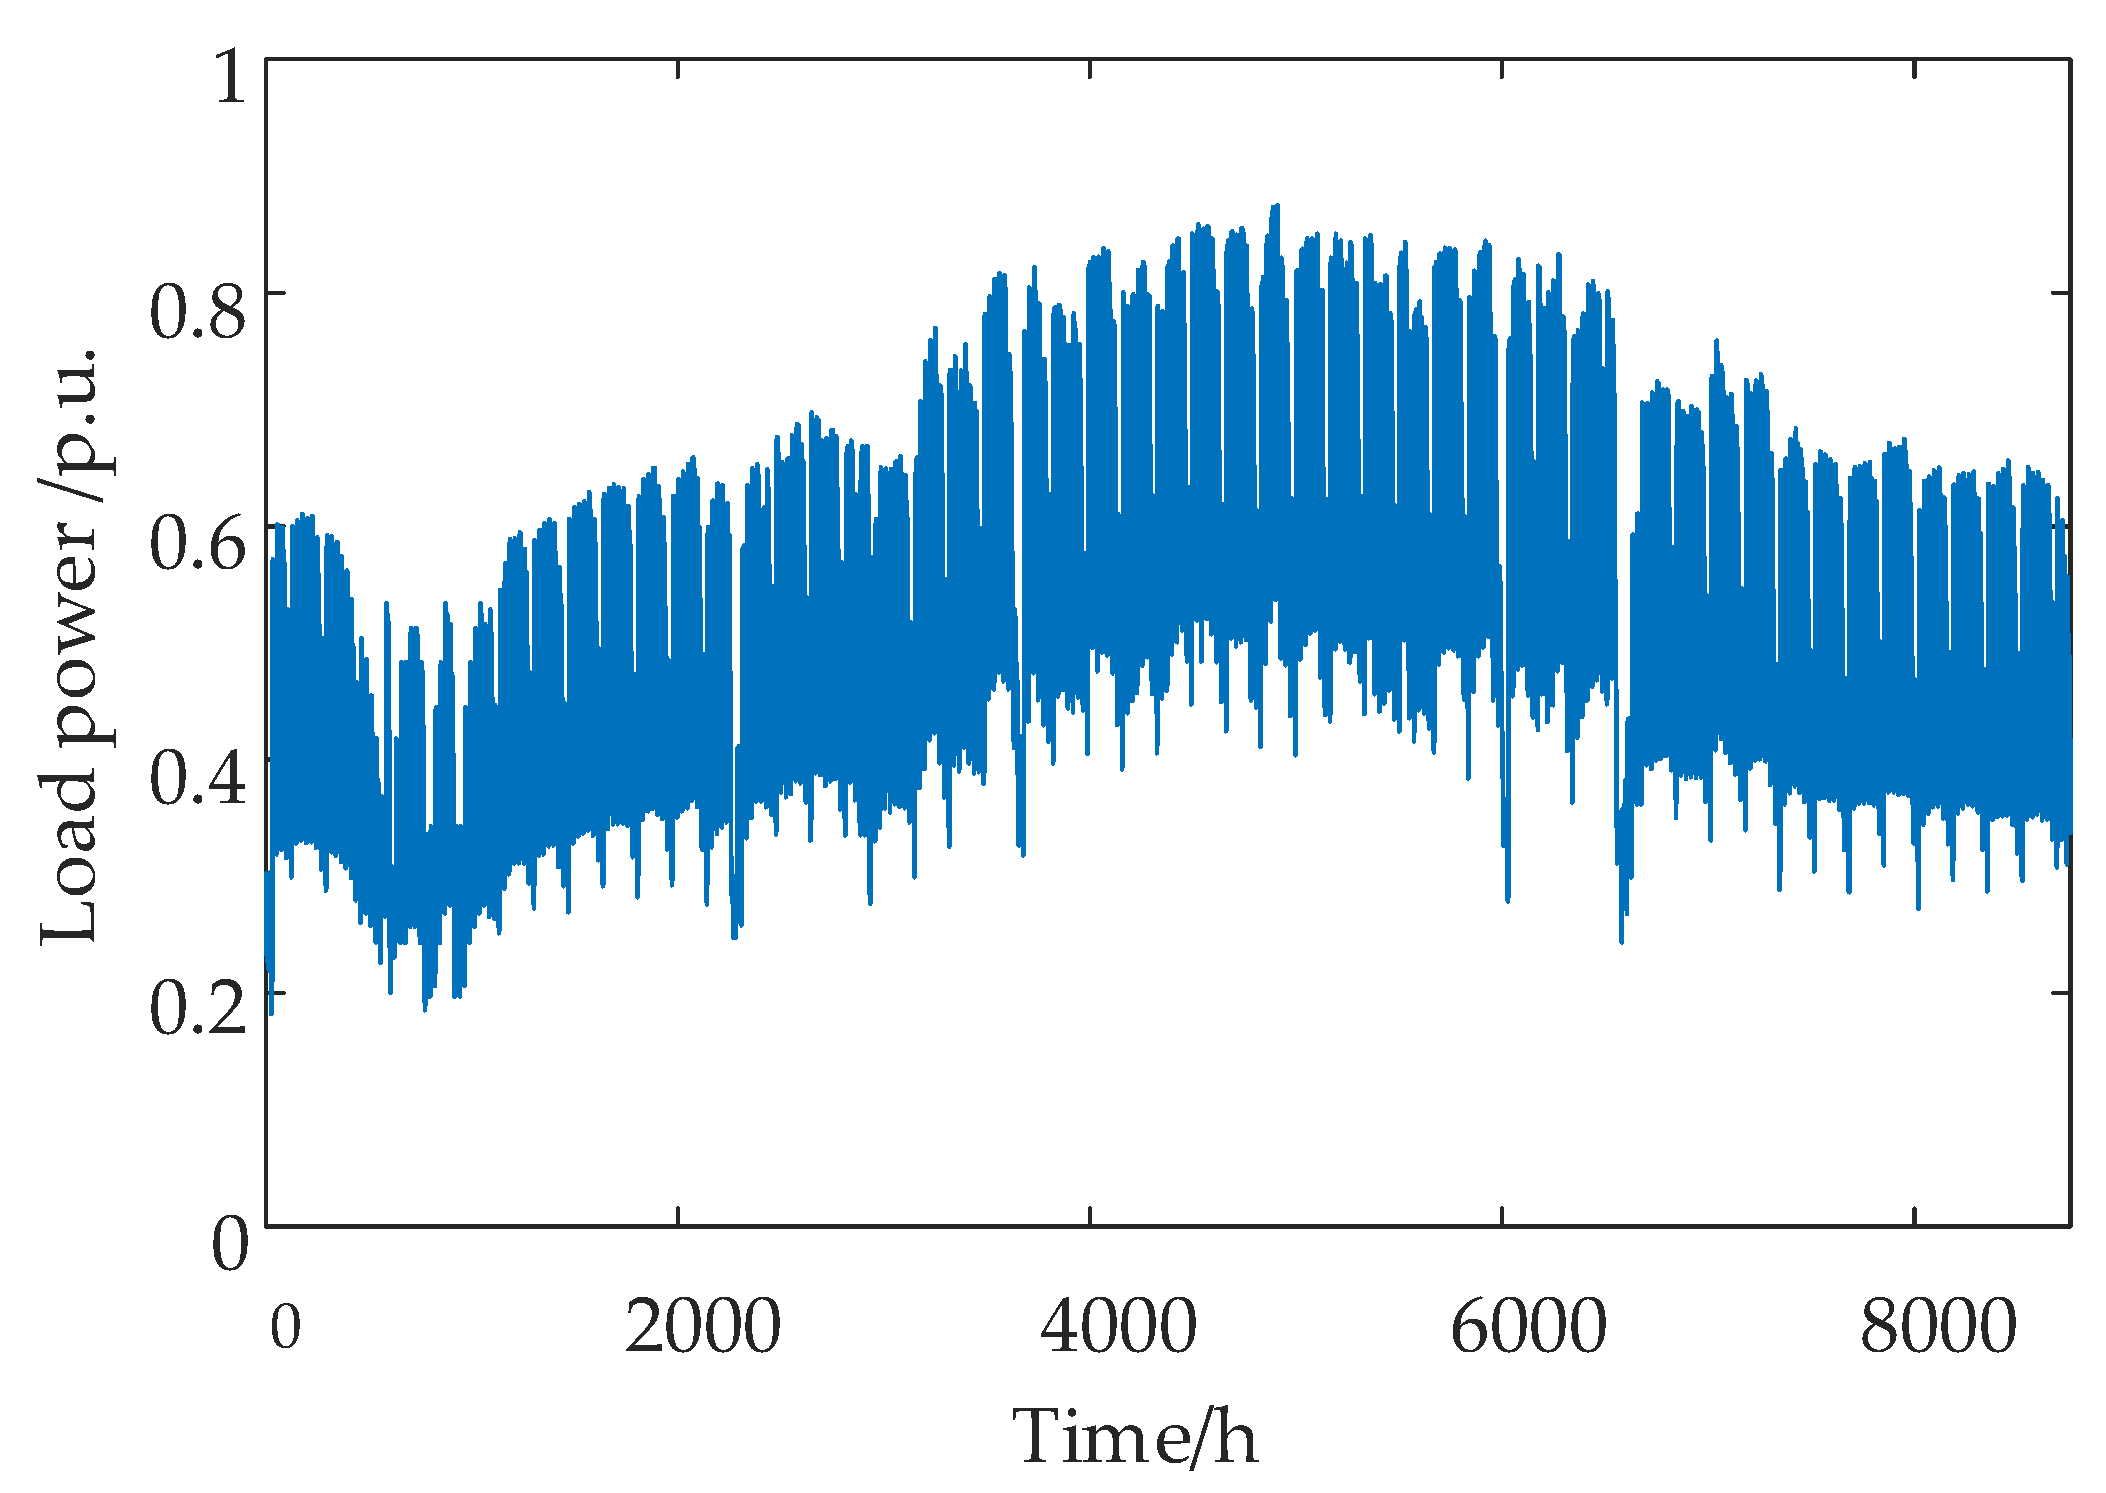
- In this paper, a method for generating typical joint light intensity and load power operation scenarios based on the K-means algorithm is proposed. The typical joint operation scenario set for light intensity and load power and the probability set for these scenarios are obtained by clustering and combining the historical data of annual light intensity and load power to provide comprehensive scenario support for the evaluation.
- (2)
- Based on the perspective of active and reactive power regulation, this paper proposes a DPV access capacity-enhancement method to improve the DPV access capacity and increase economic revenue. From the perspective of regulating active power, this paper proposes a strategy that combines the configuration of energy storage devices with demand responses based on electricity prices. From the perspective of regulating reactive power, this paper proposes a reactive power control method for inverters based on the node voltage.
- (3)
- Innovatively, proper PV power curtailment is considered as one of the factors that deeply influences the evaluation of DPV economic access capacity. This paper comprehensively considers the relationship between PV power curtailment, the maximum DPV access capacity, and economic revenue, and establishes an evaluation model of maximum DPV economic access capacity in the distribution network.
2. Generation of Typical Operation Scenarios for Light Intensity and Load Power
3. Methods for Enhancing DPV Access Capacity in Distribution Networks
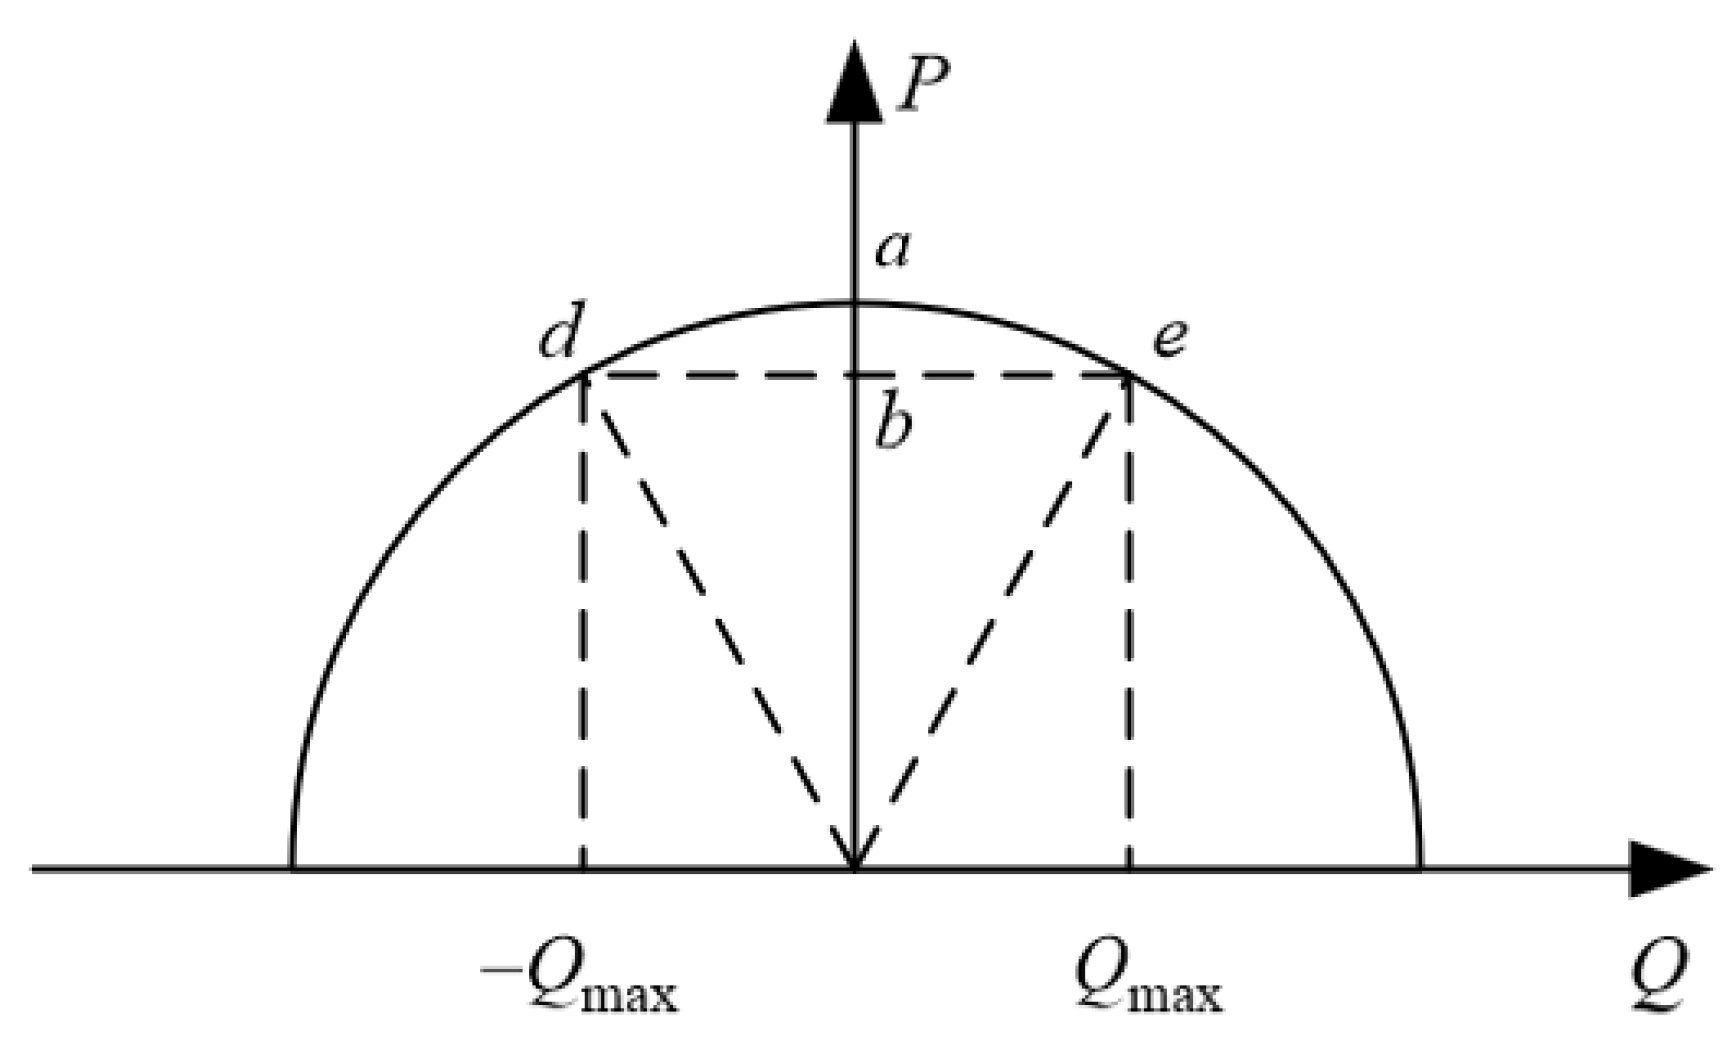
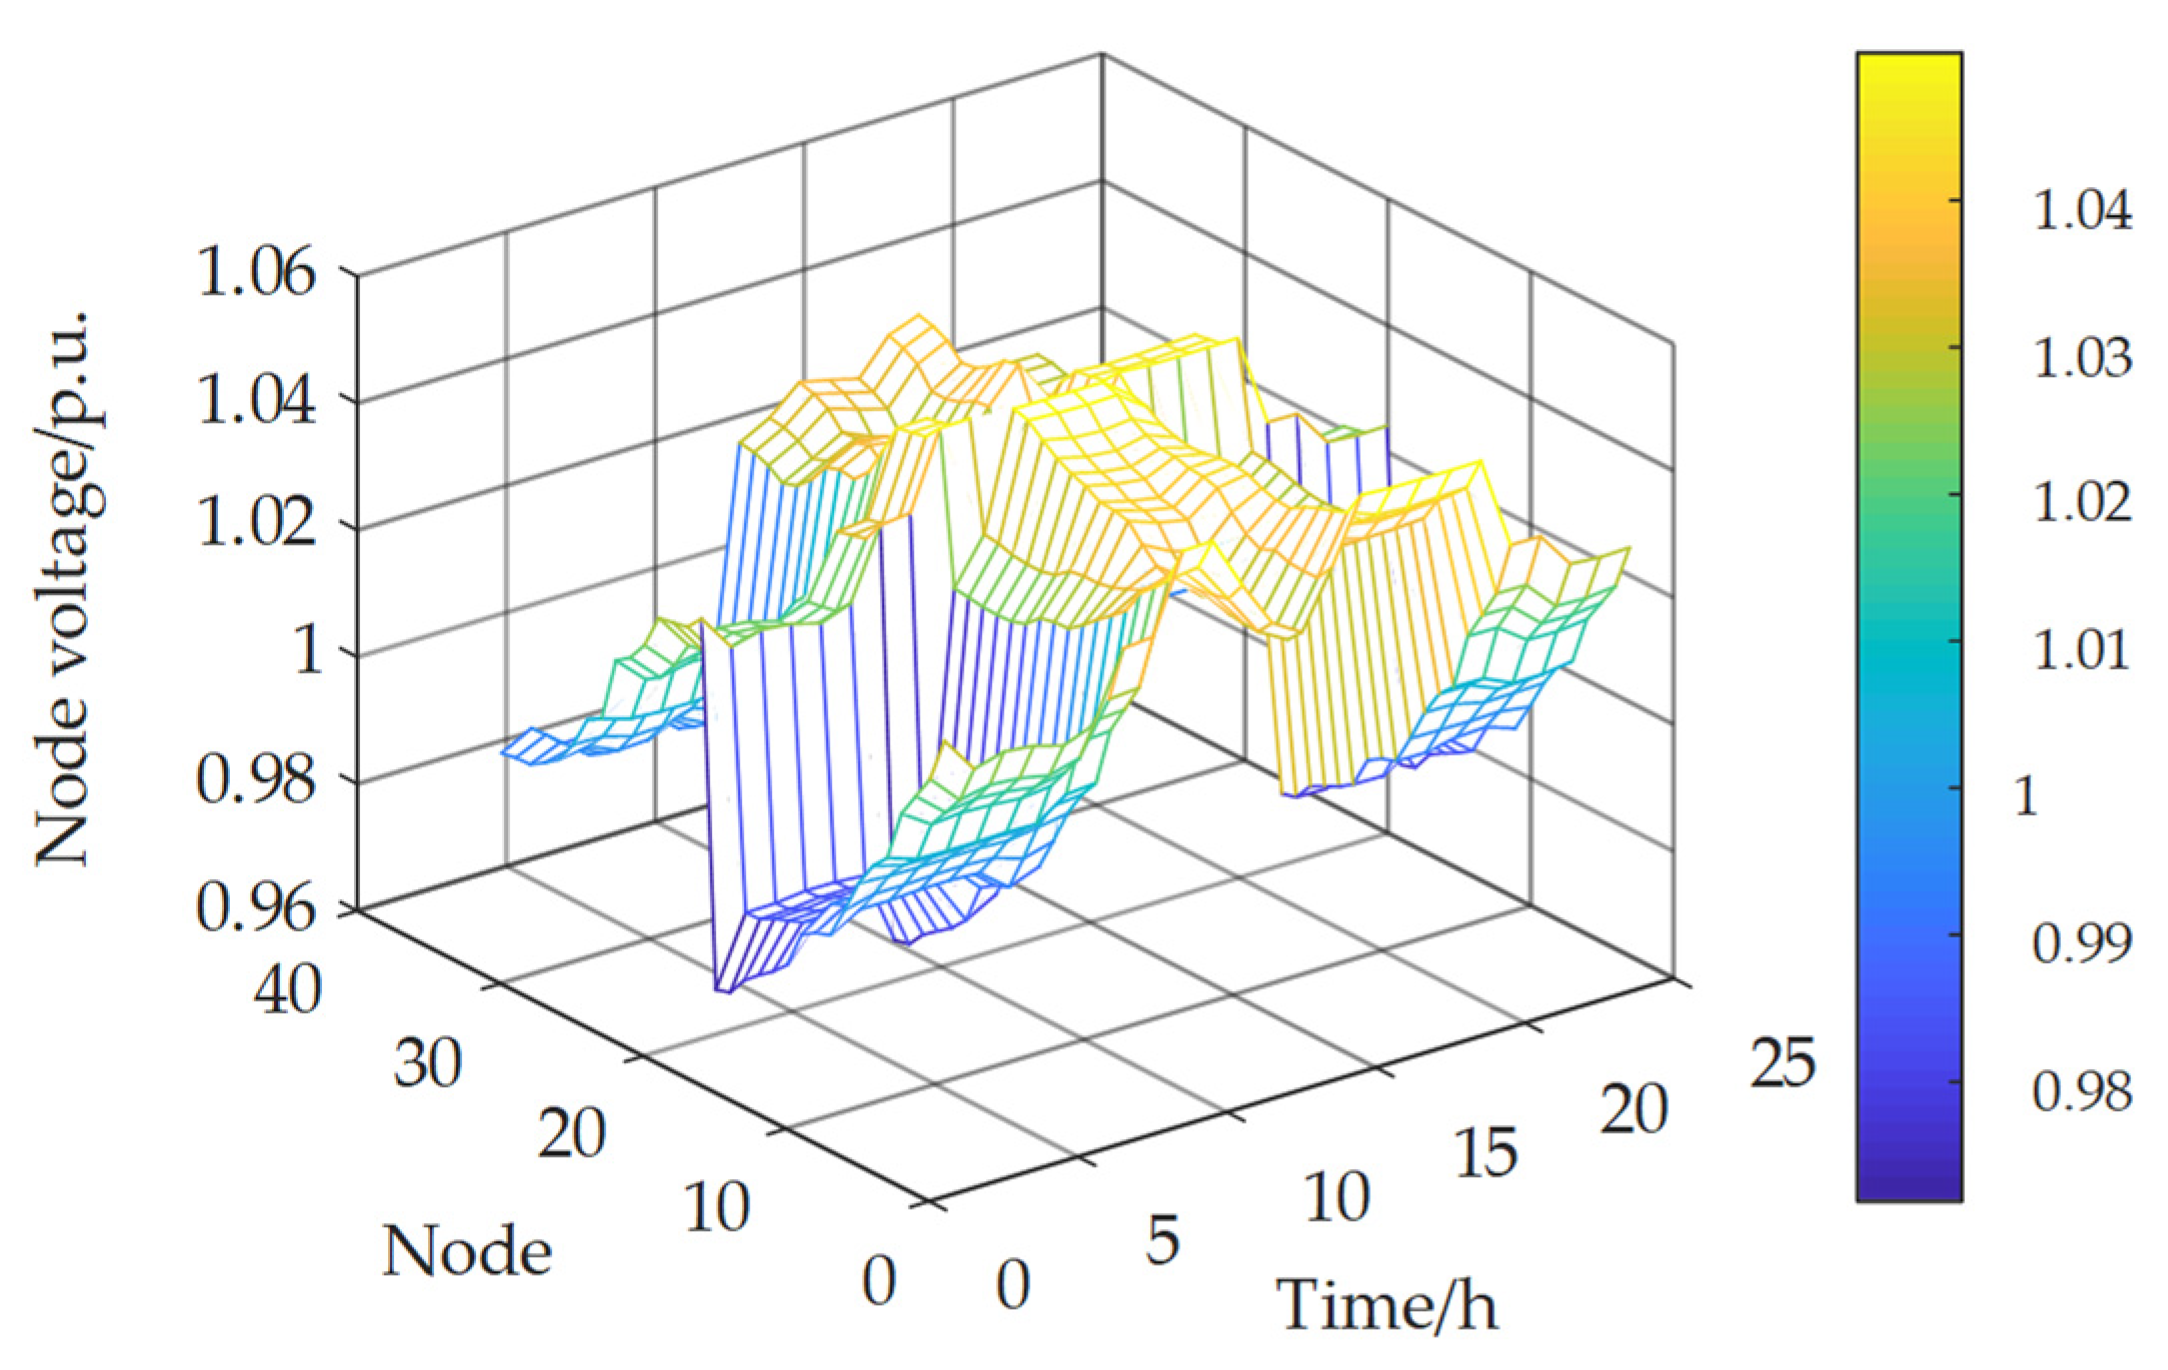
3.1. Method from the Perspective of Reactive Power Regulation
3.2. Method from the Perspective of Active Power Regulation
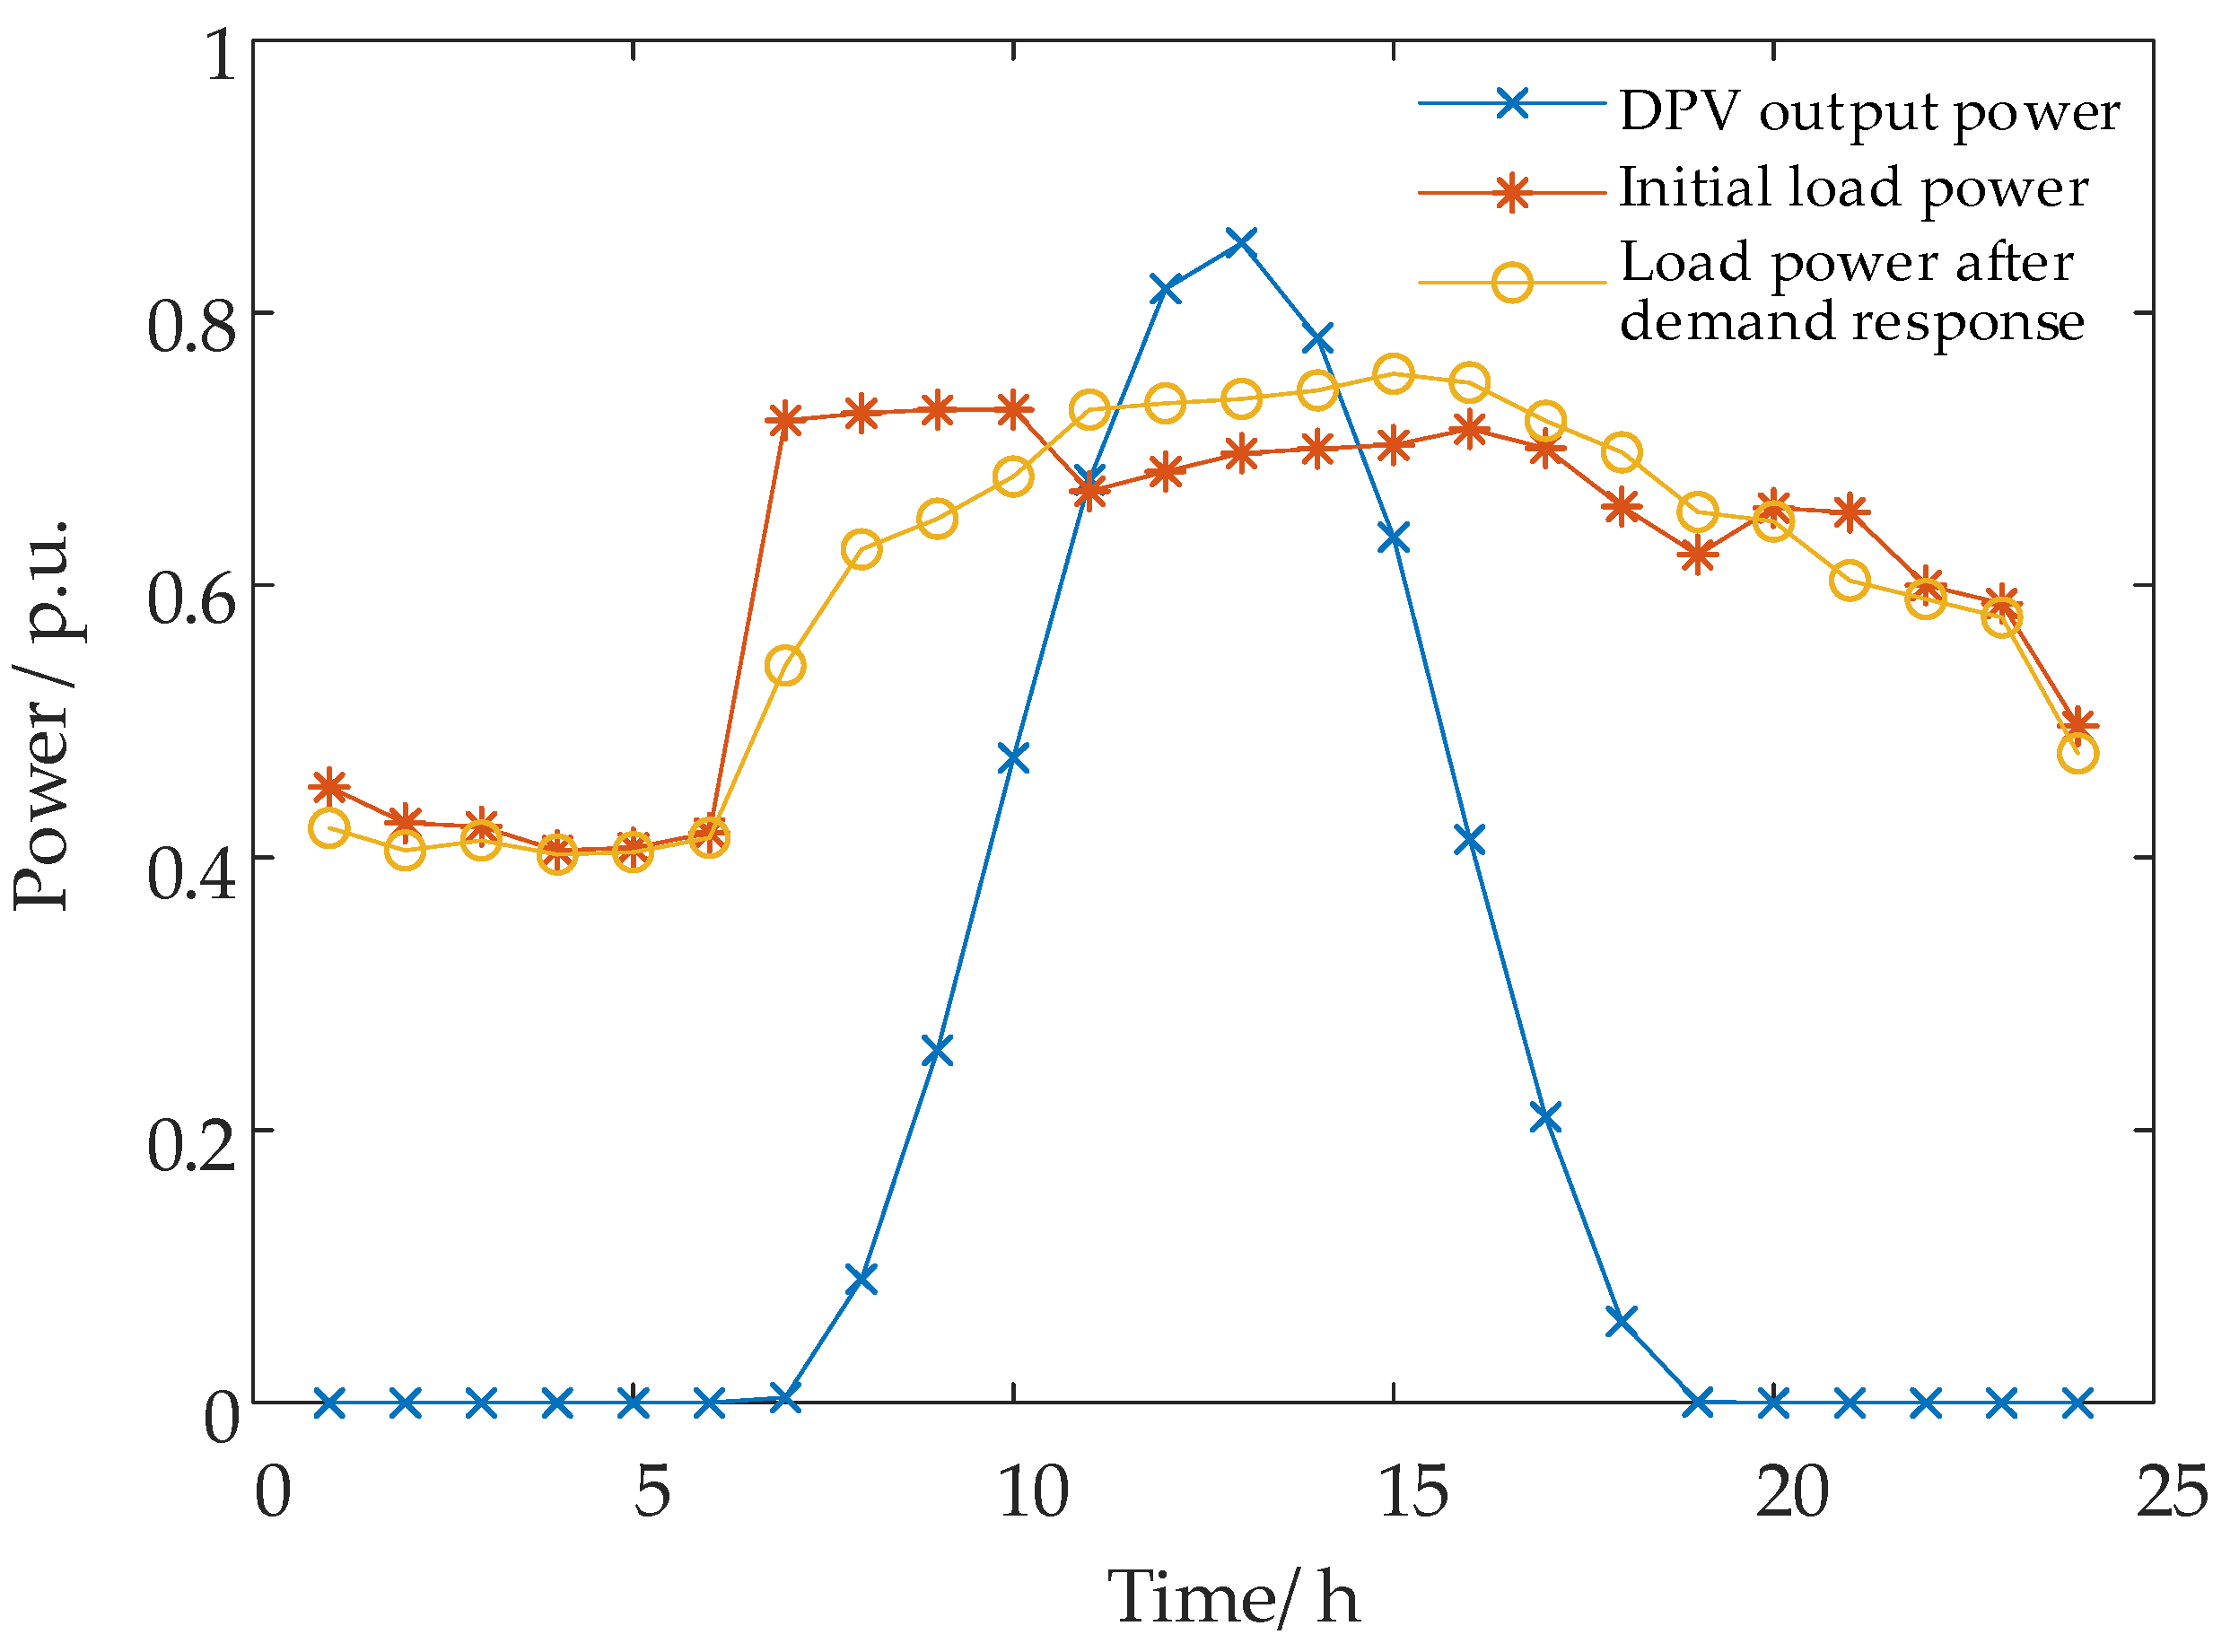
3.2.1. Demand Response Model
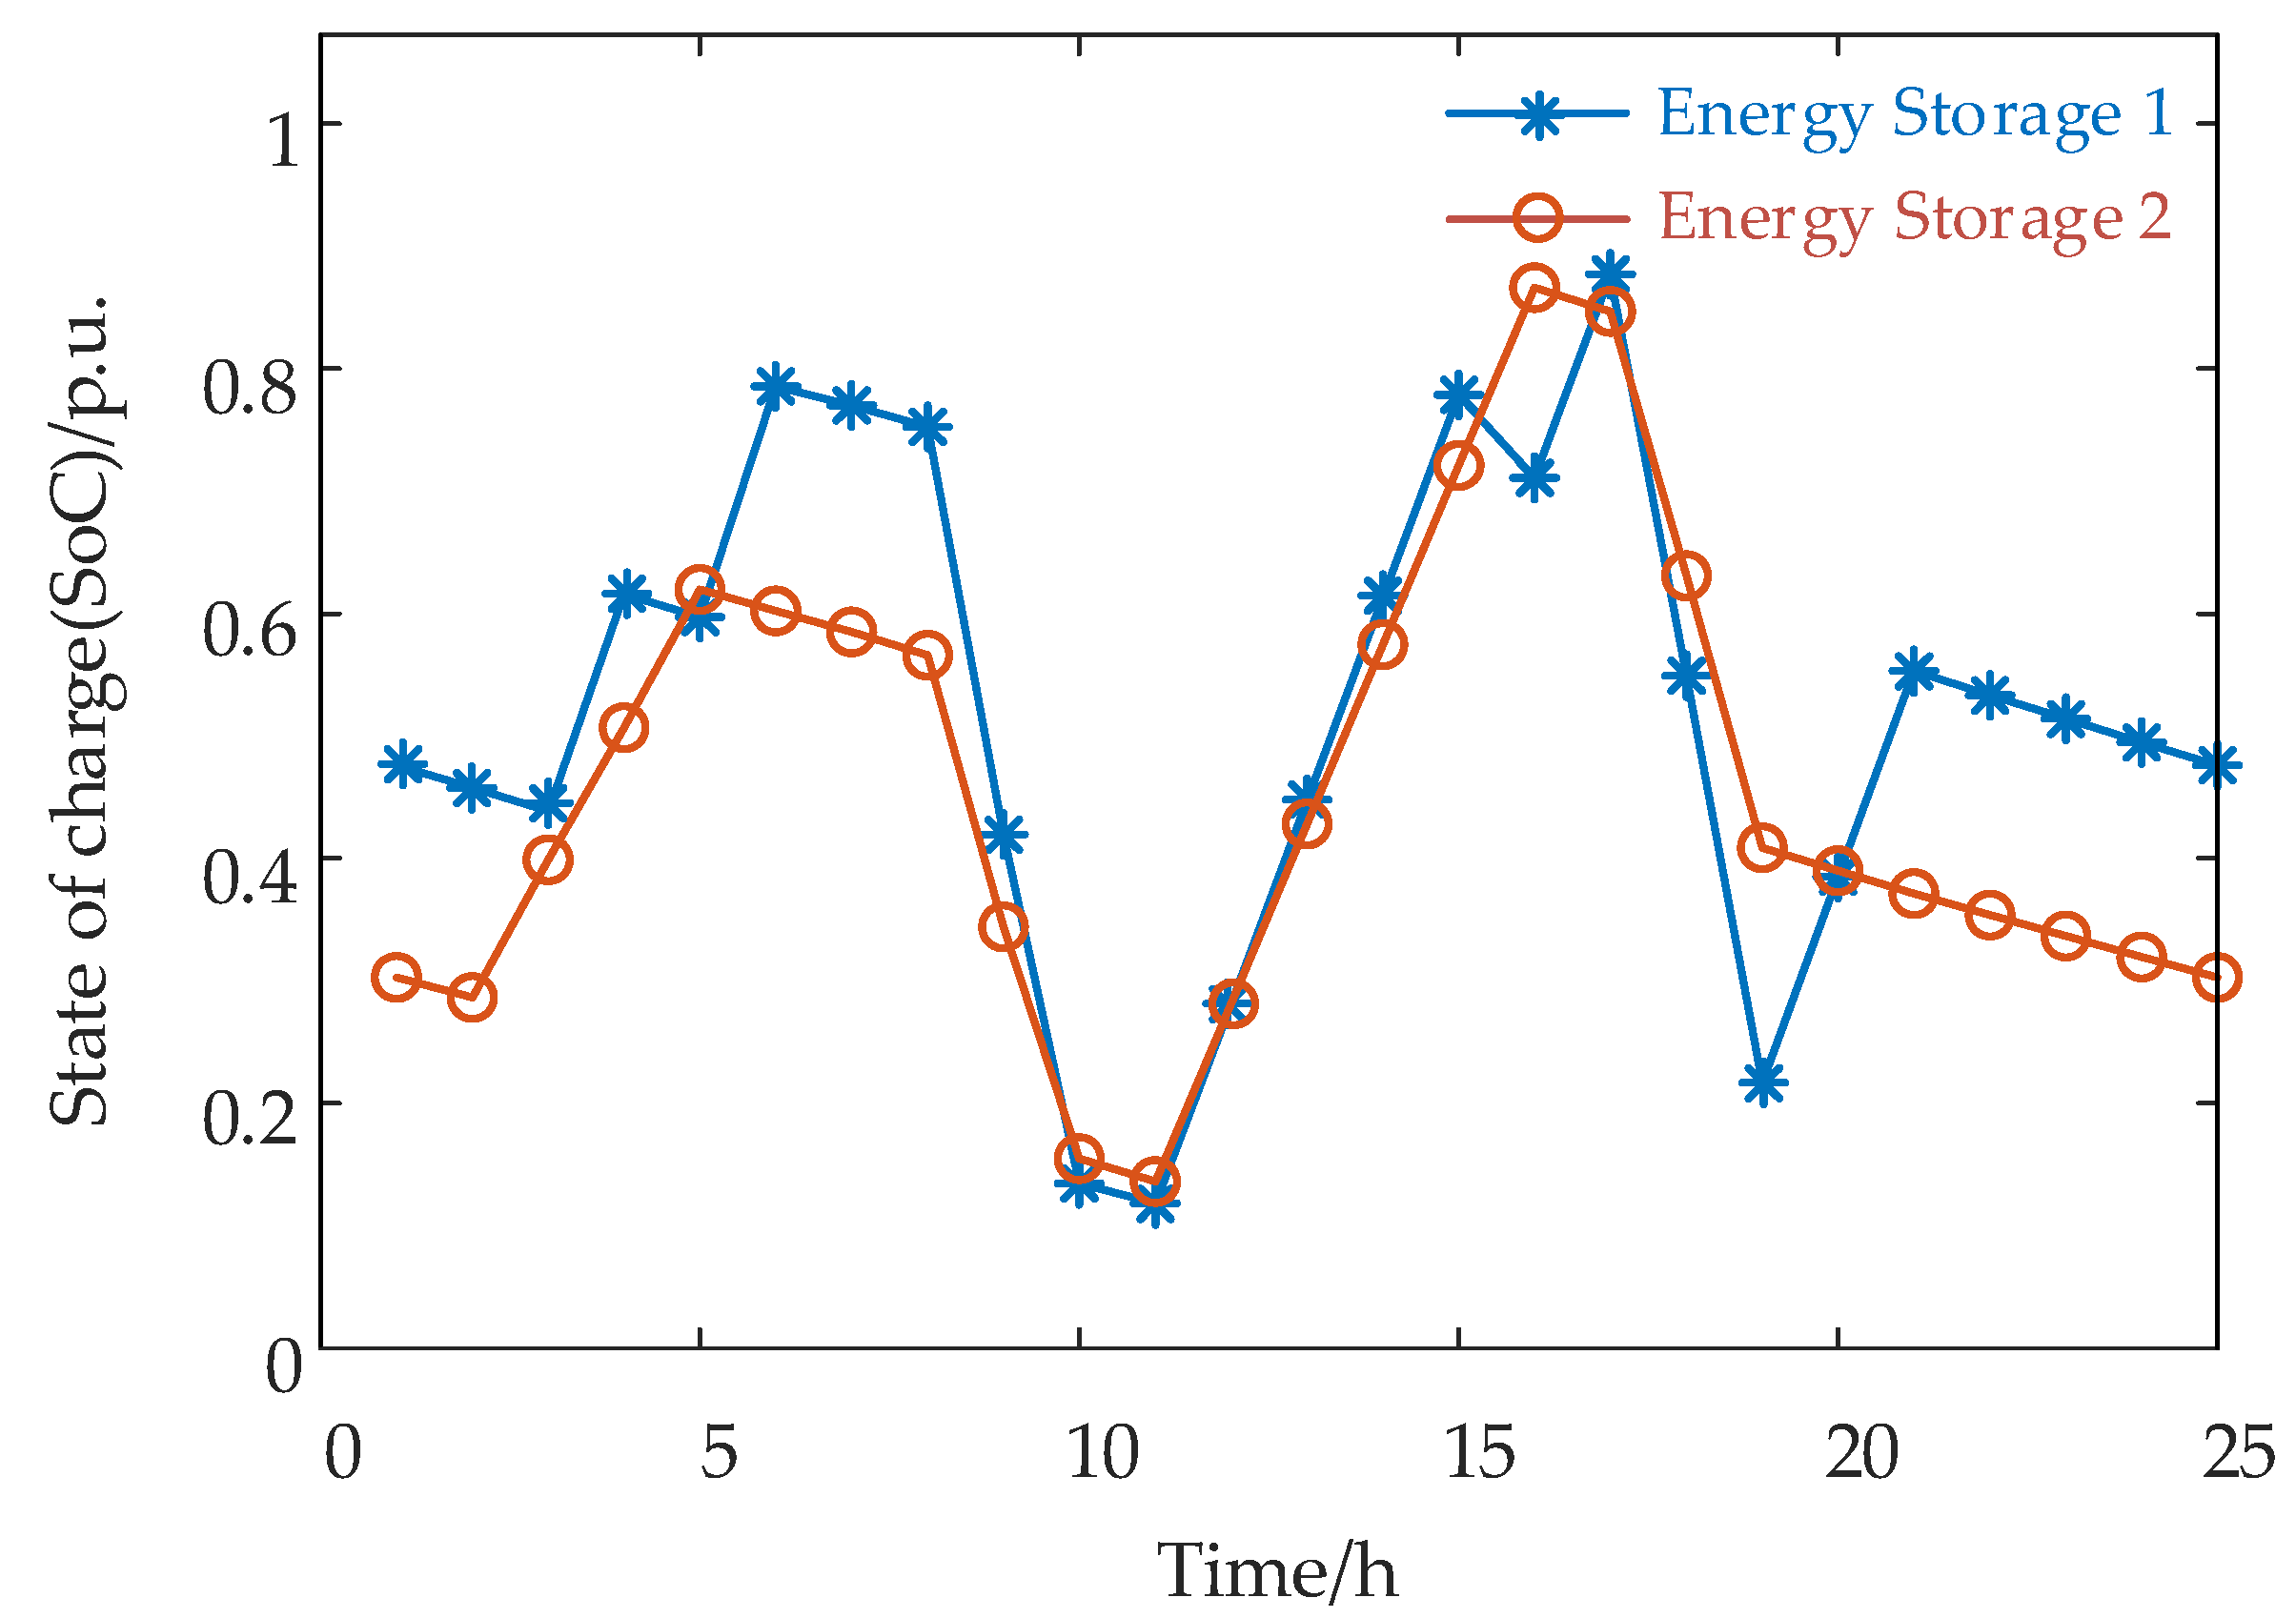
3.2.2. Energy Storage Model
4. Evaluation Model of DPV Economic Access Capacity in Distribution Networks Considering Proper PV Power Curtailment
4.1. Objective Function
4.2. Constraints
- (1)
- DPV construction capacity of node constraints:
- (2)
- DPV output constraints:
- (3)
- Node voltage constraints:
- (4)
- Power flow constraints:
- (5)
- Distribution network flexibility constraints:
4.3. Economic Model
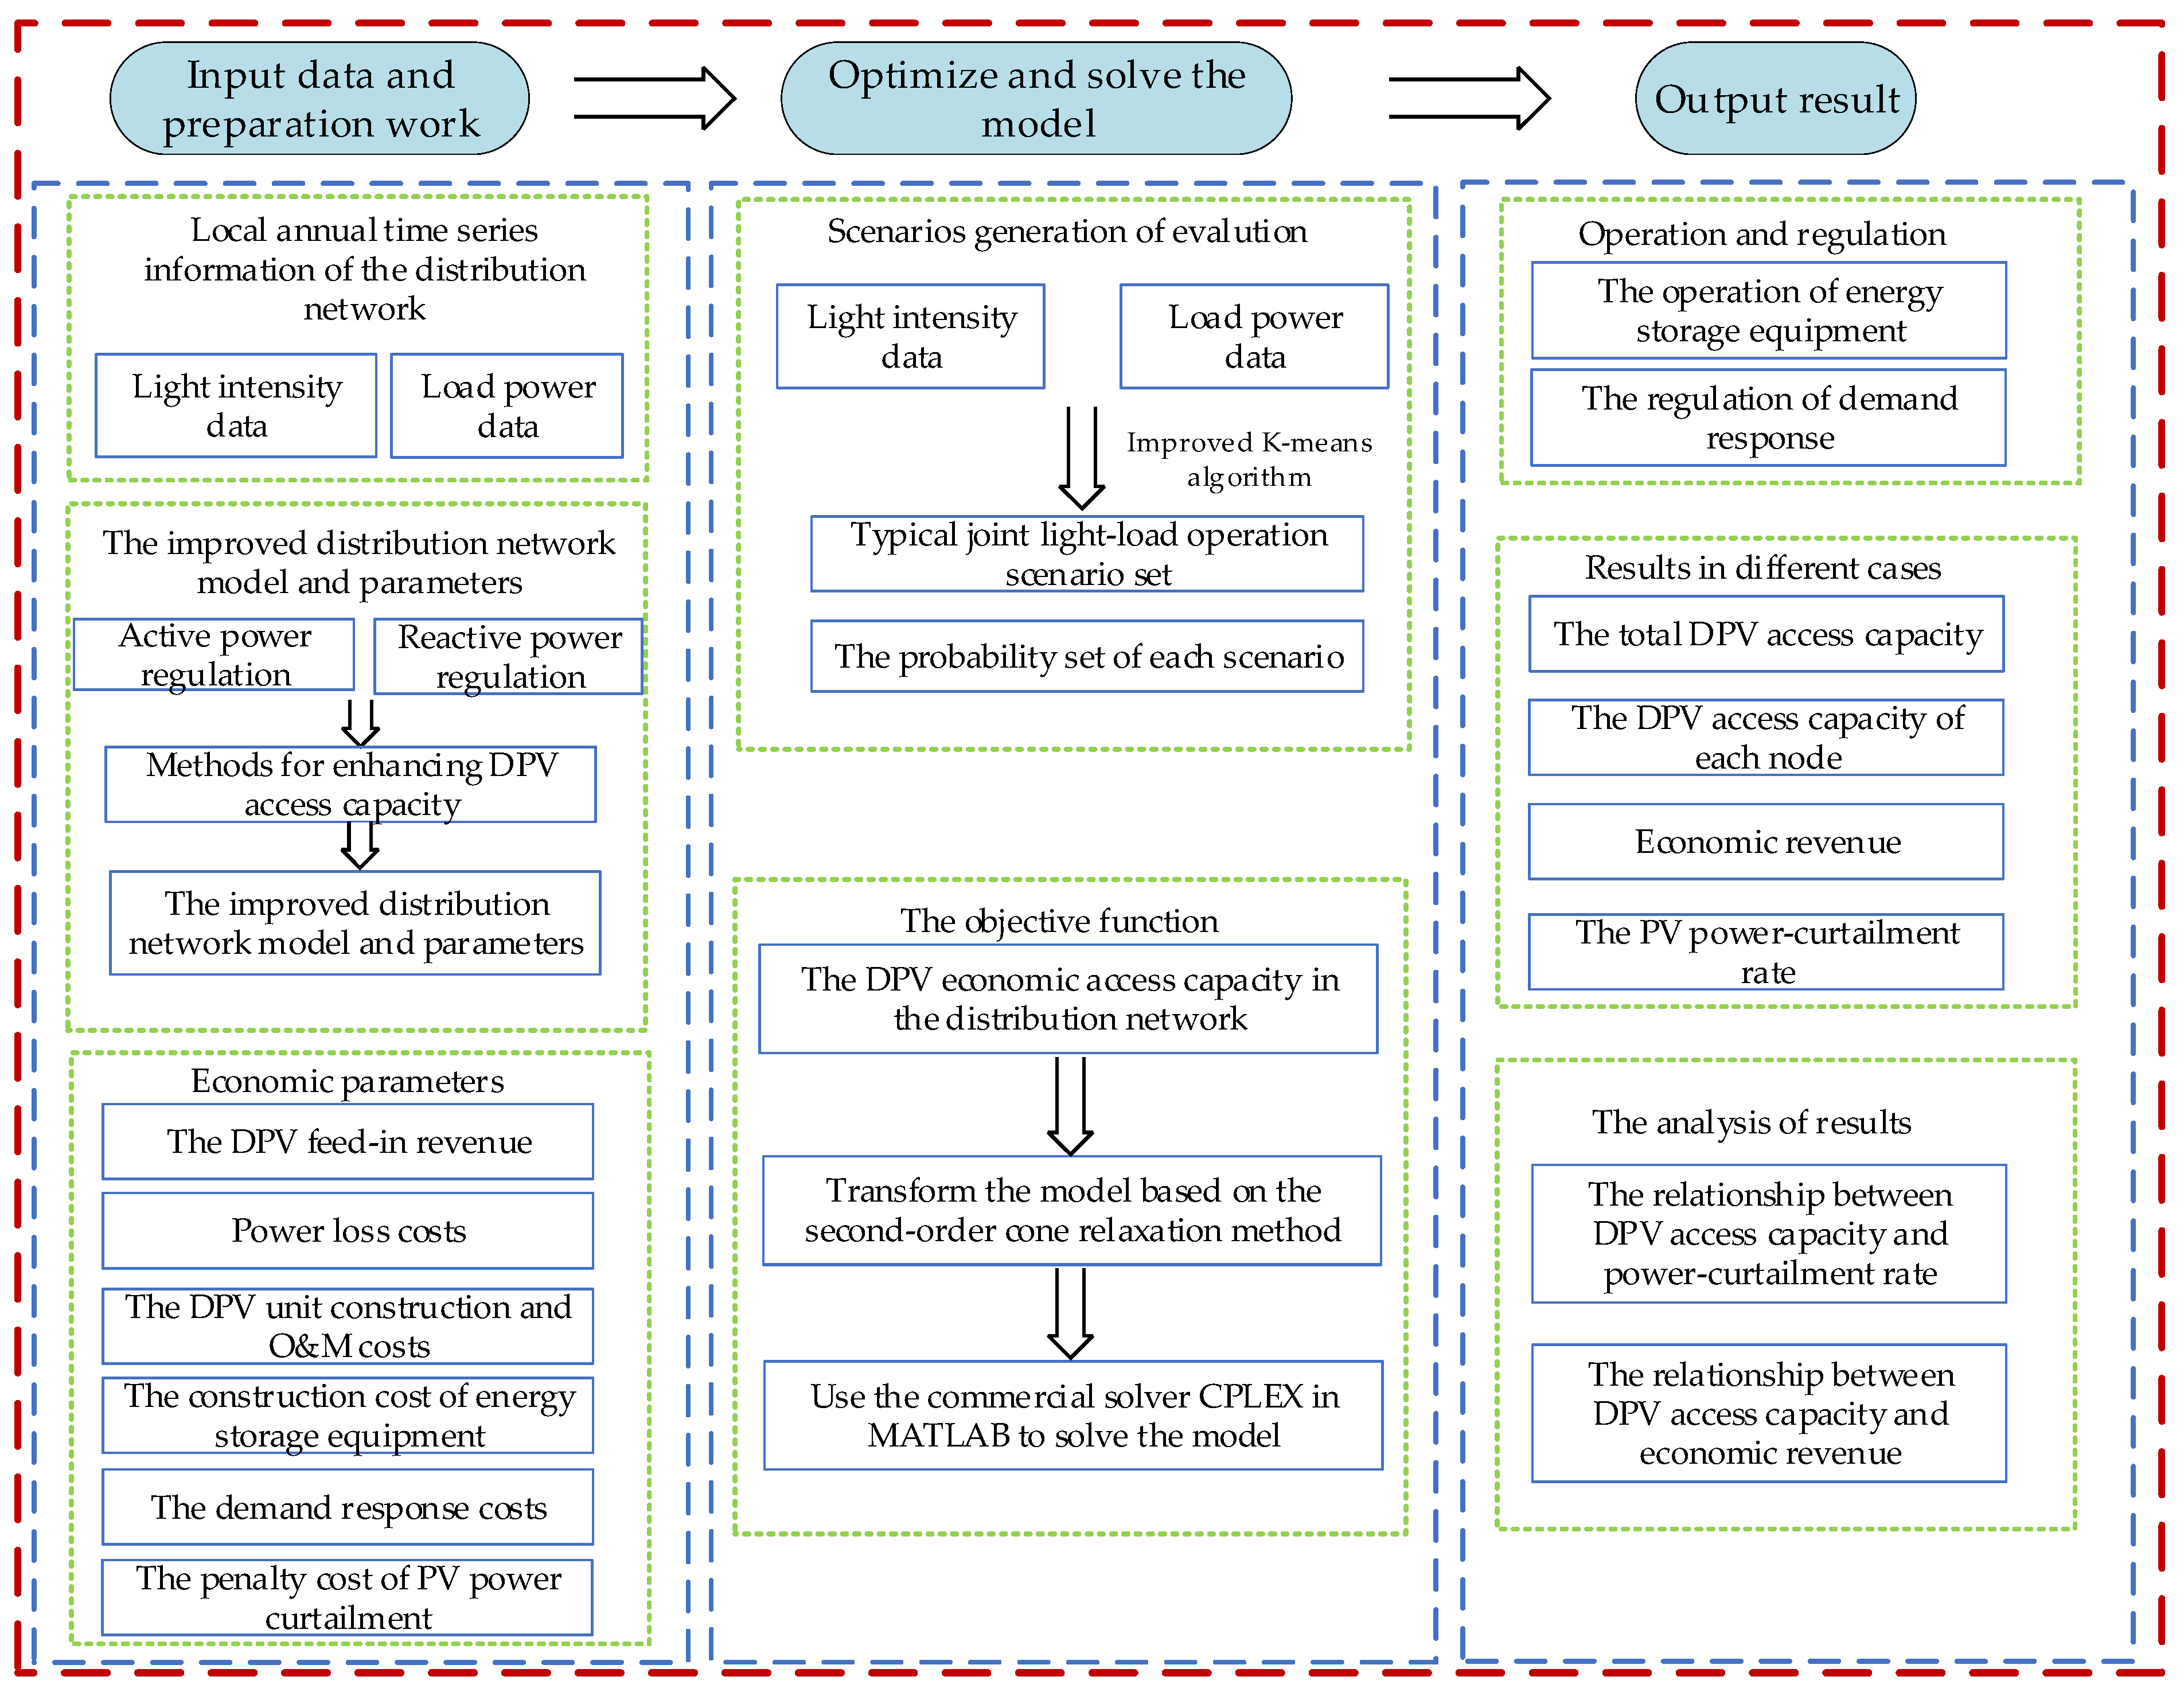
5. Solving Process of the Model
5.1. Model Solving Ideas and Process
5.2. Model Transformation Based on Second-Order Cone Relaxation
6. Example Analysis
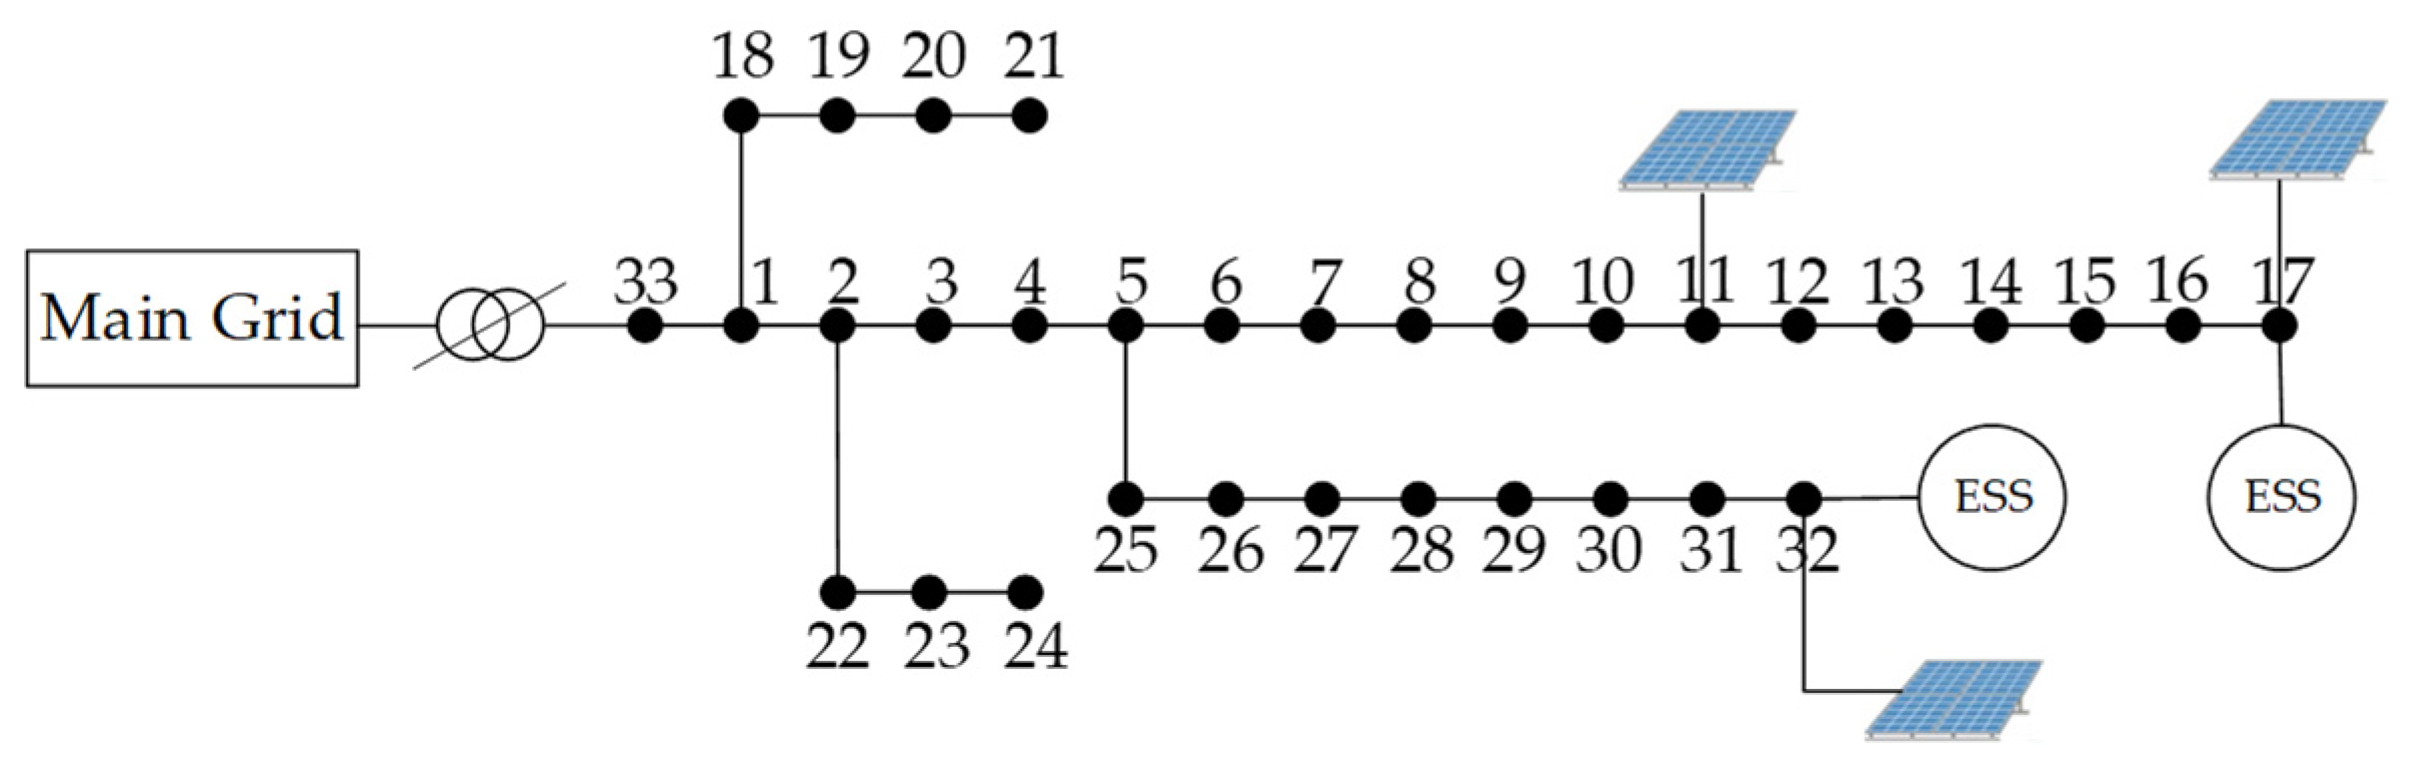
6.1. Introduction to the Algorithmic Environment and Parameters
6.2. Example Results
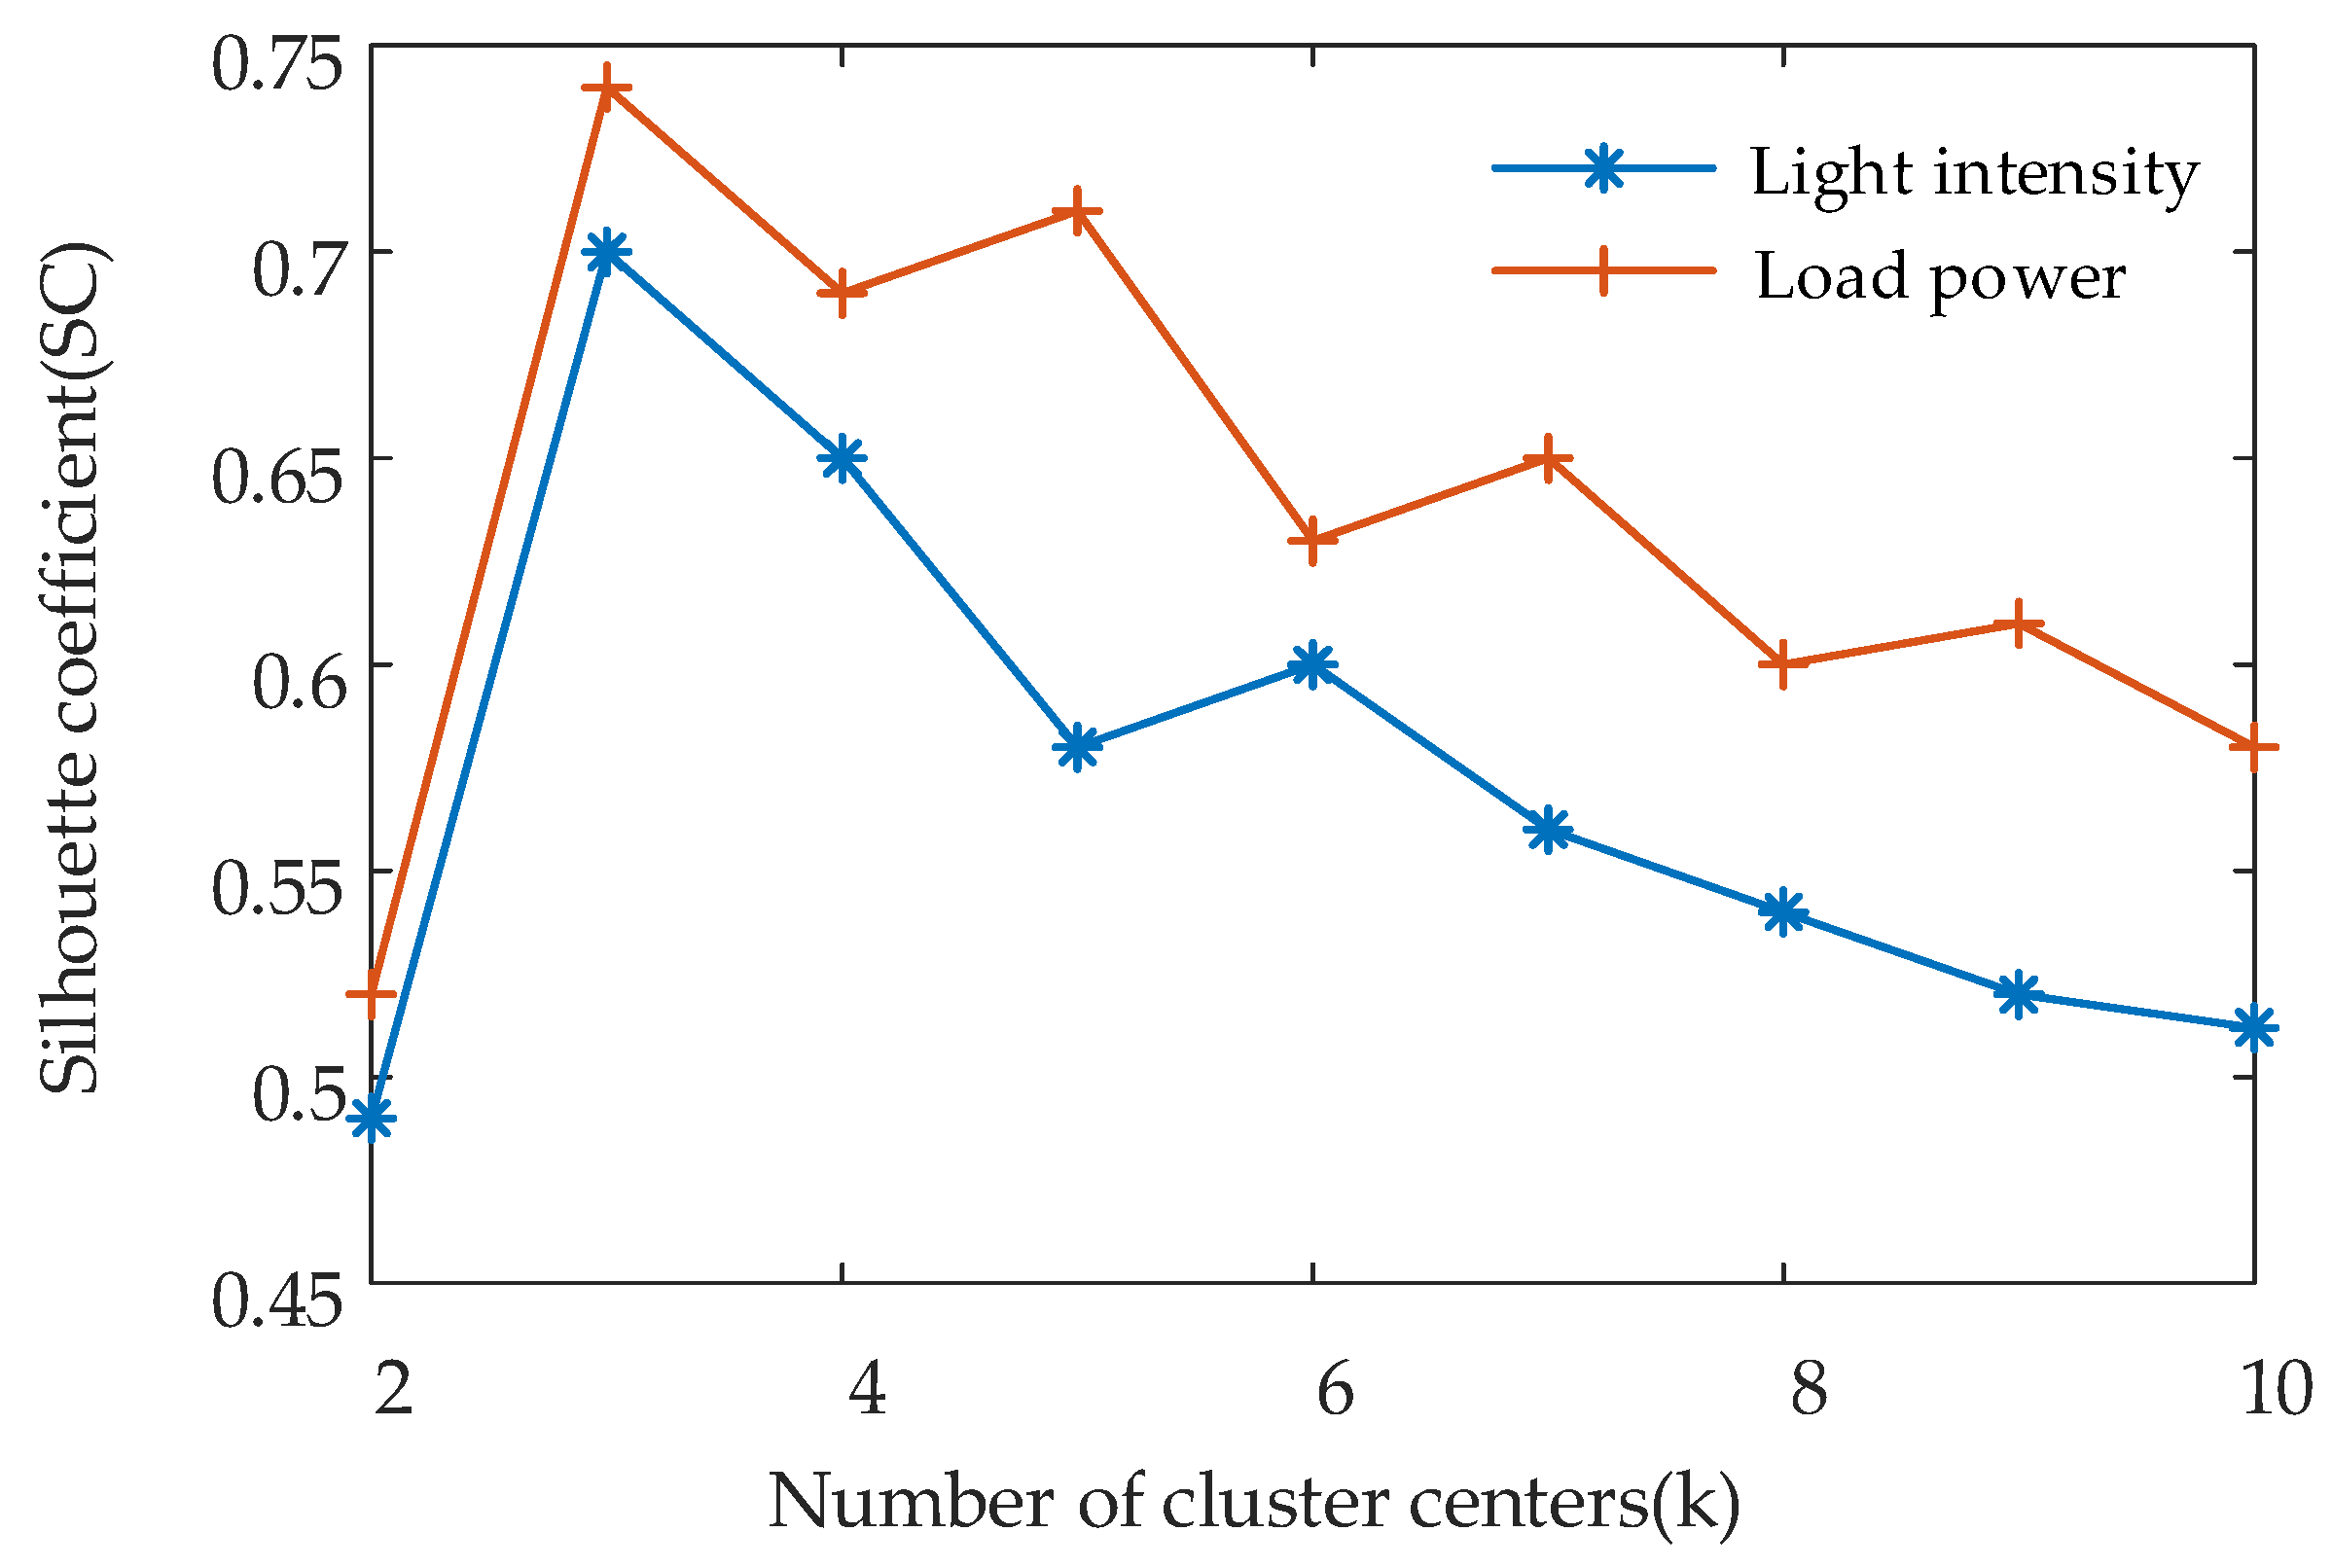
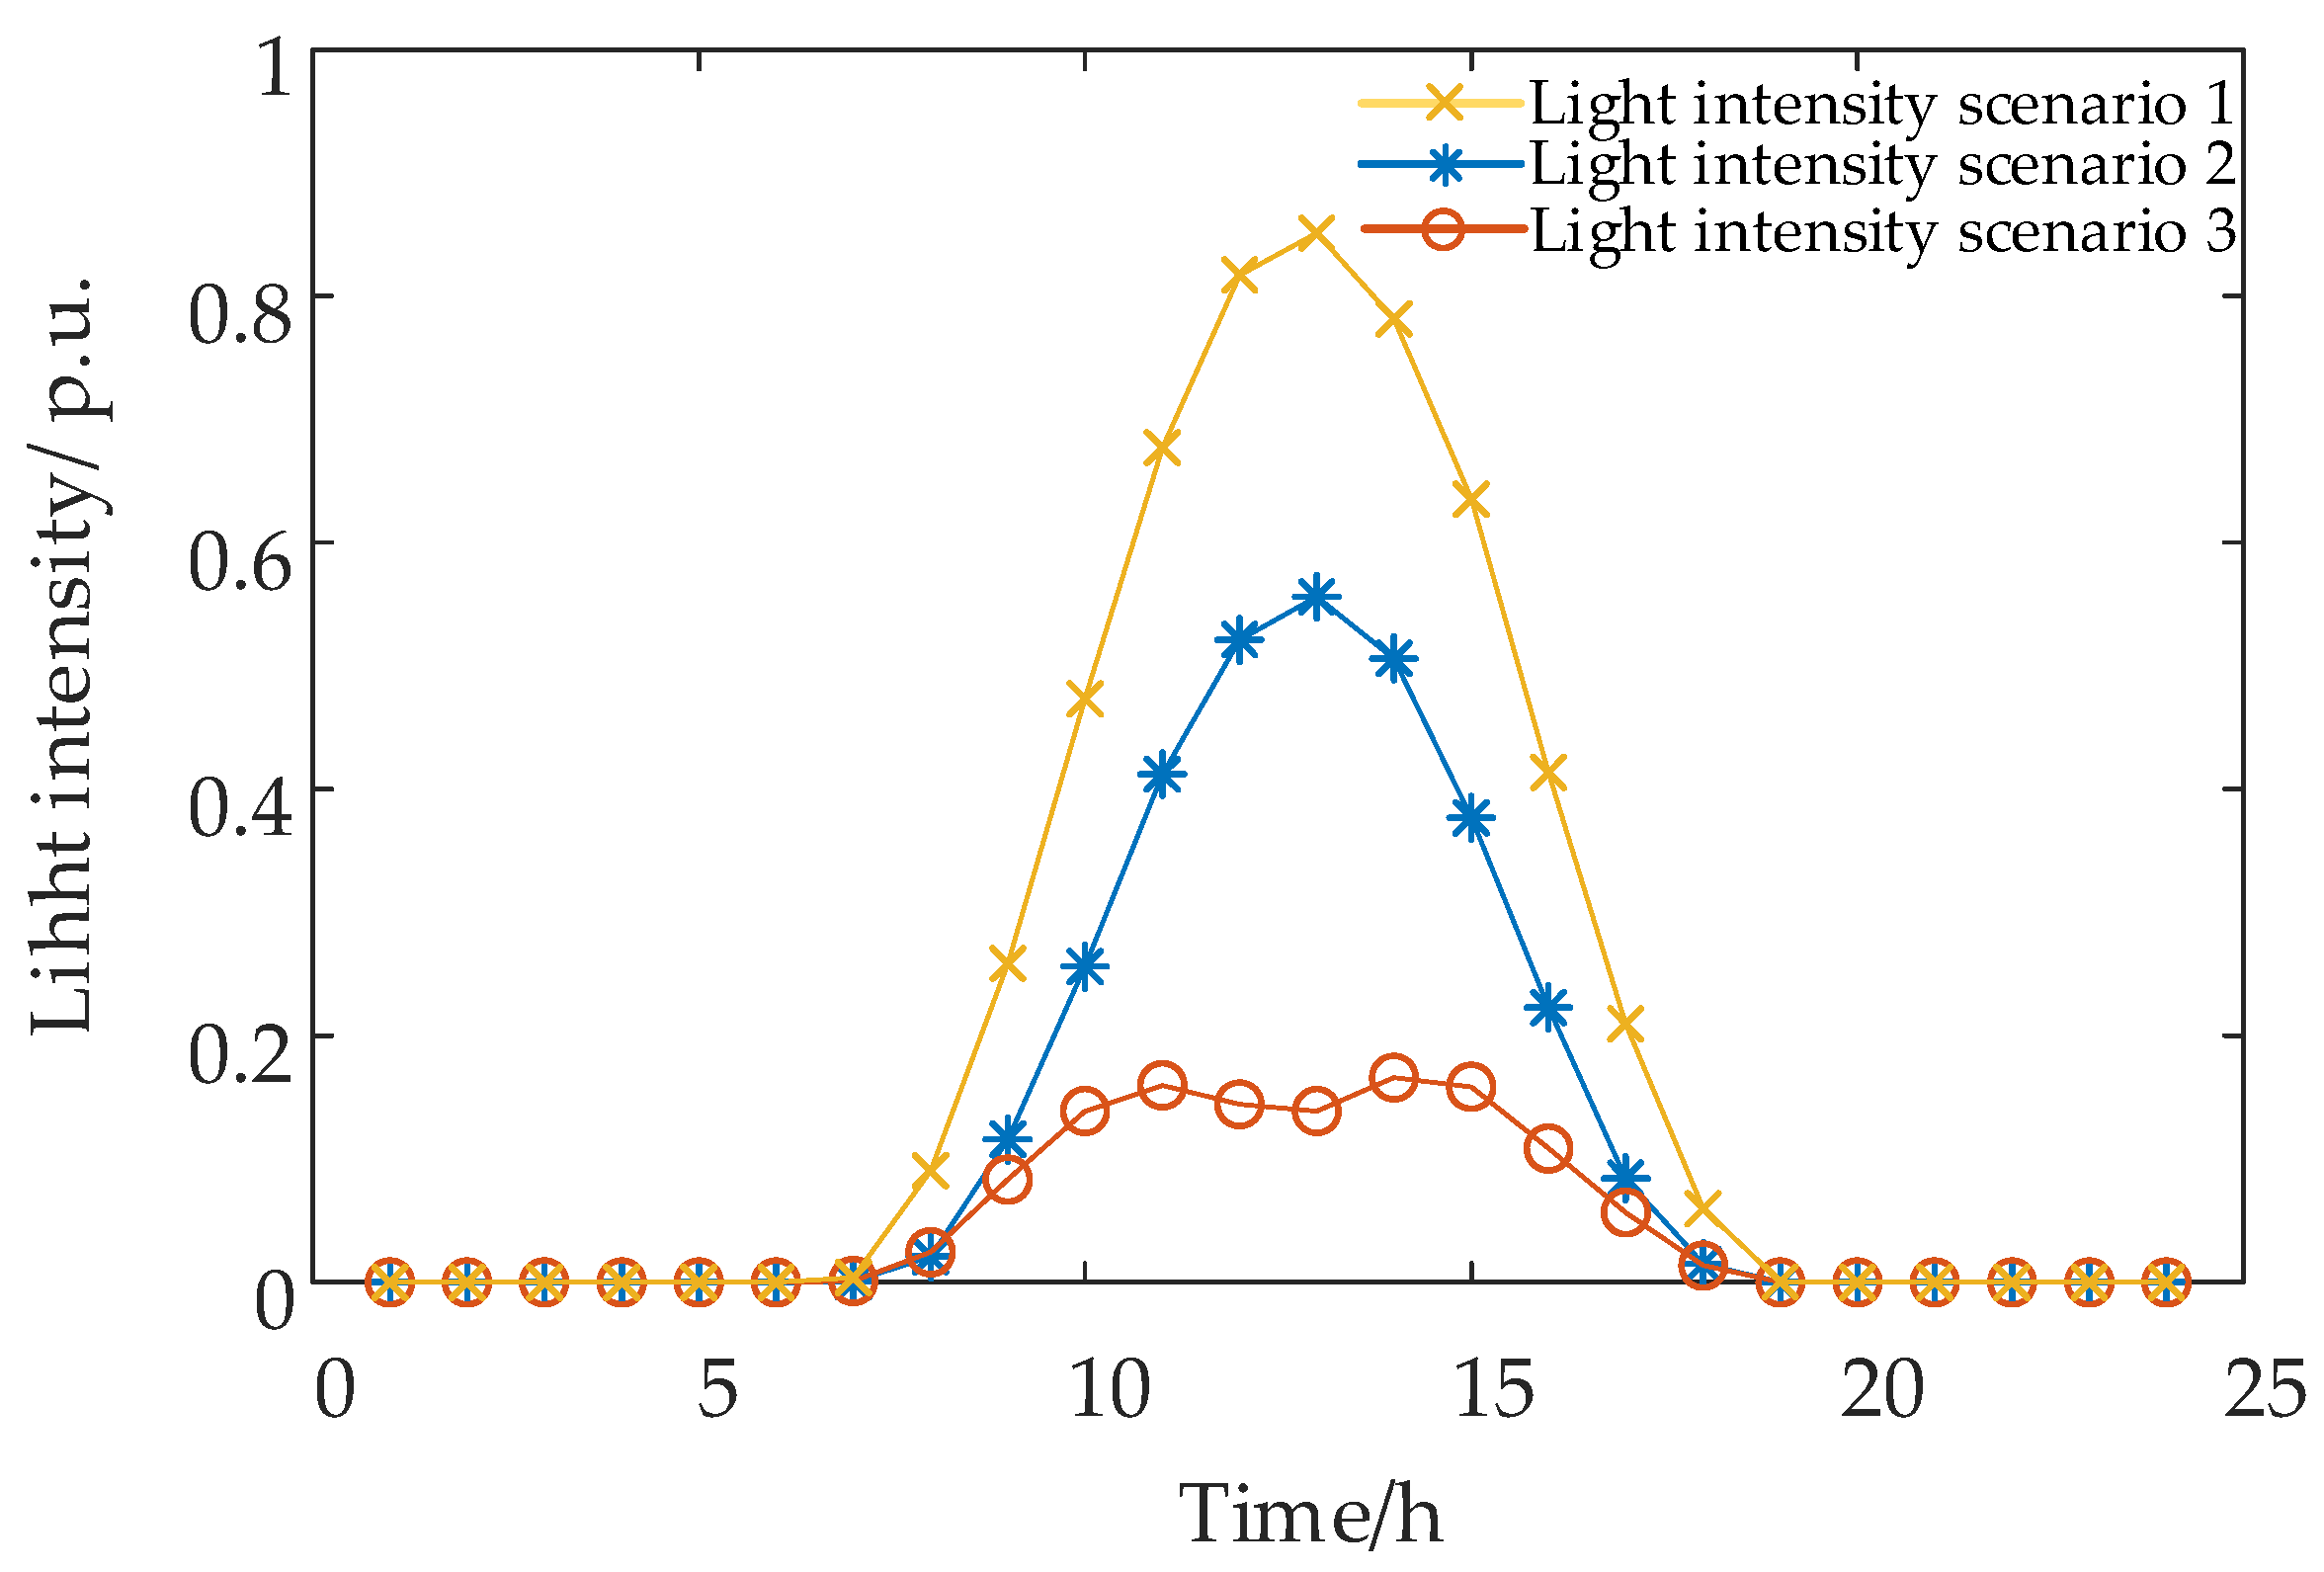
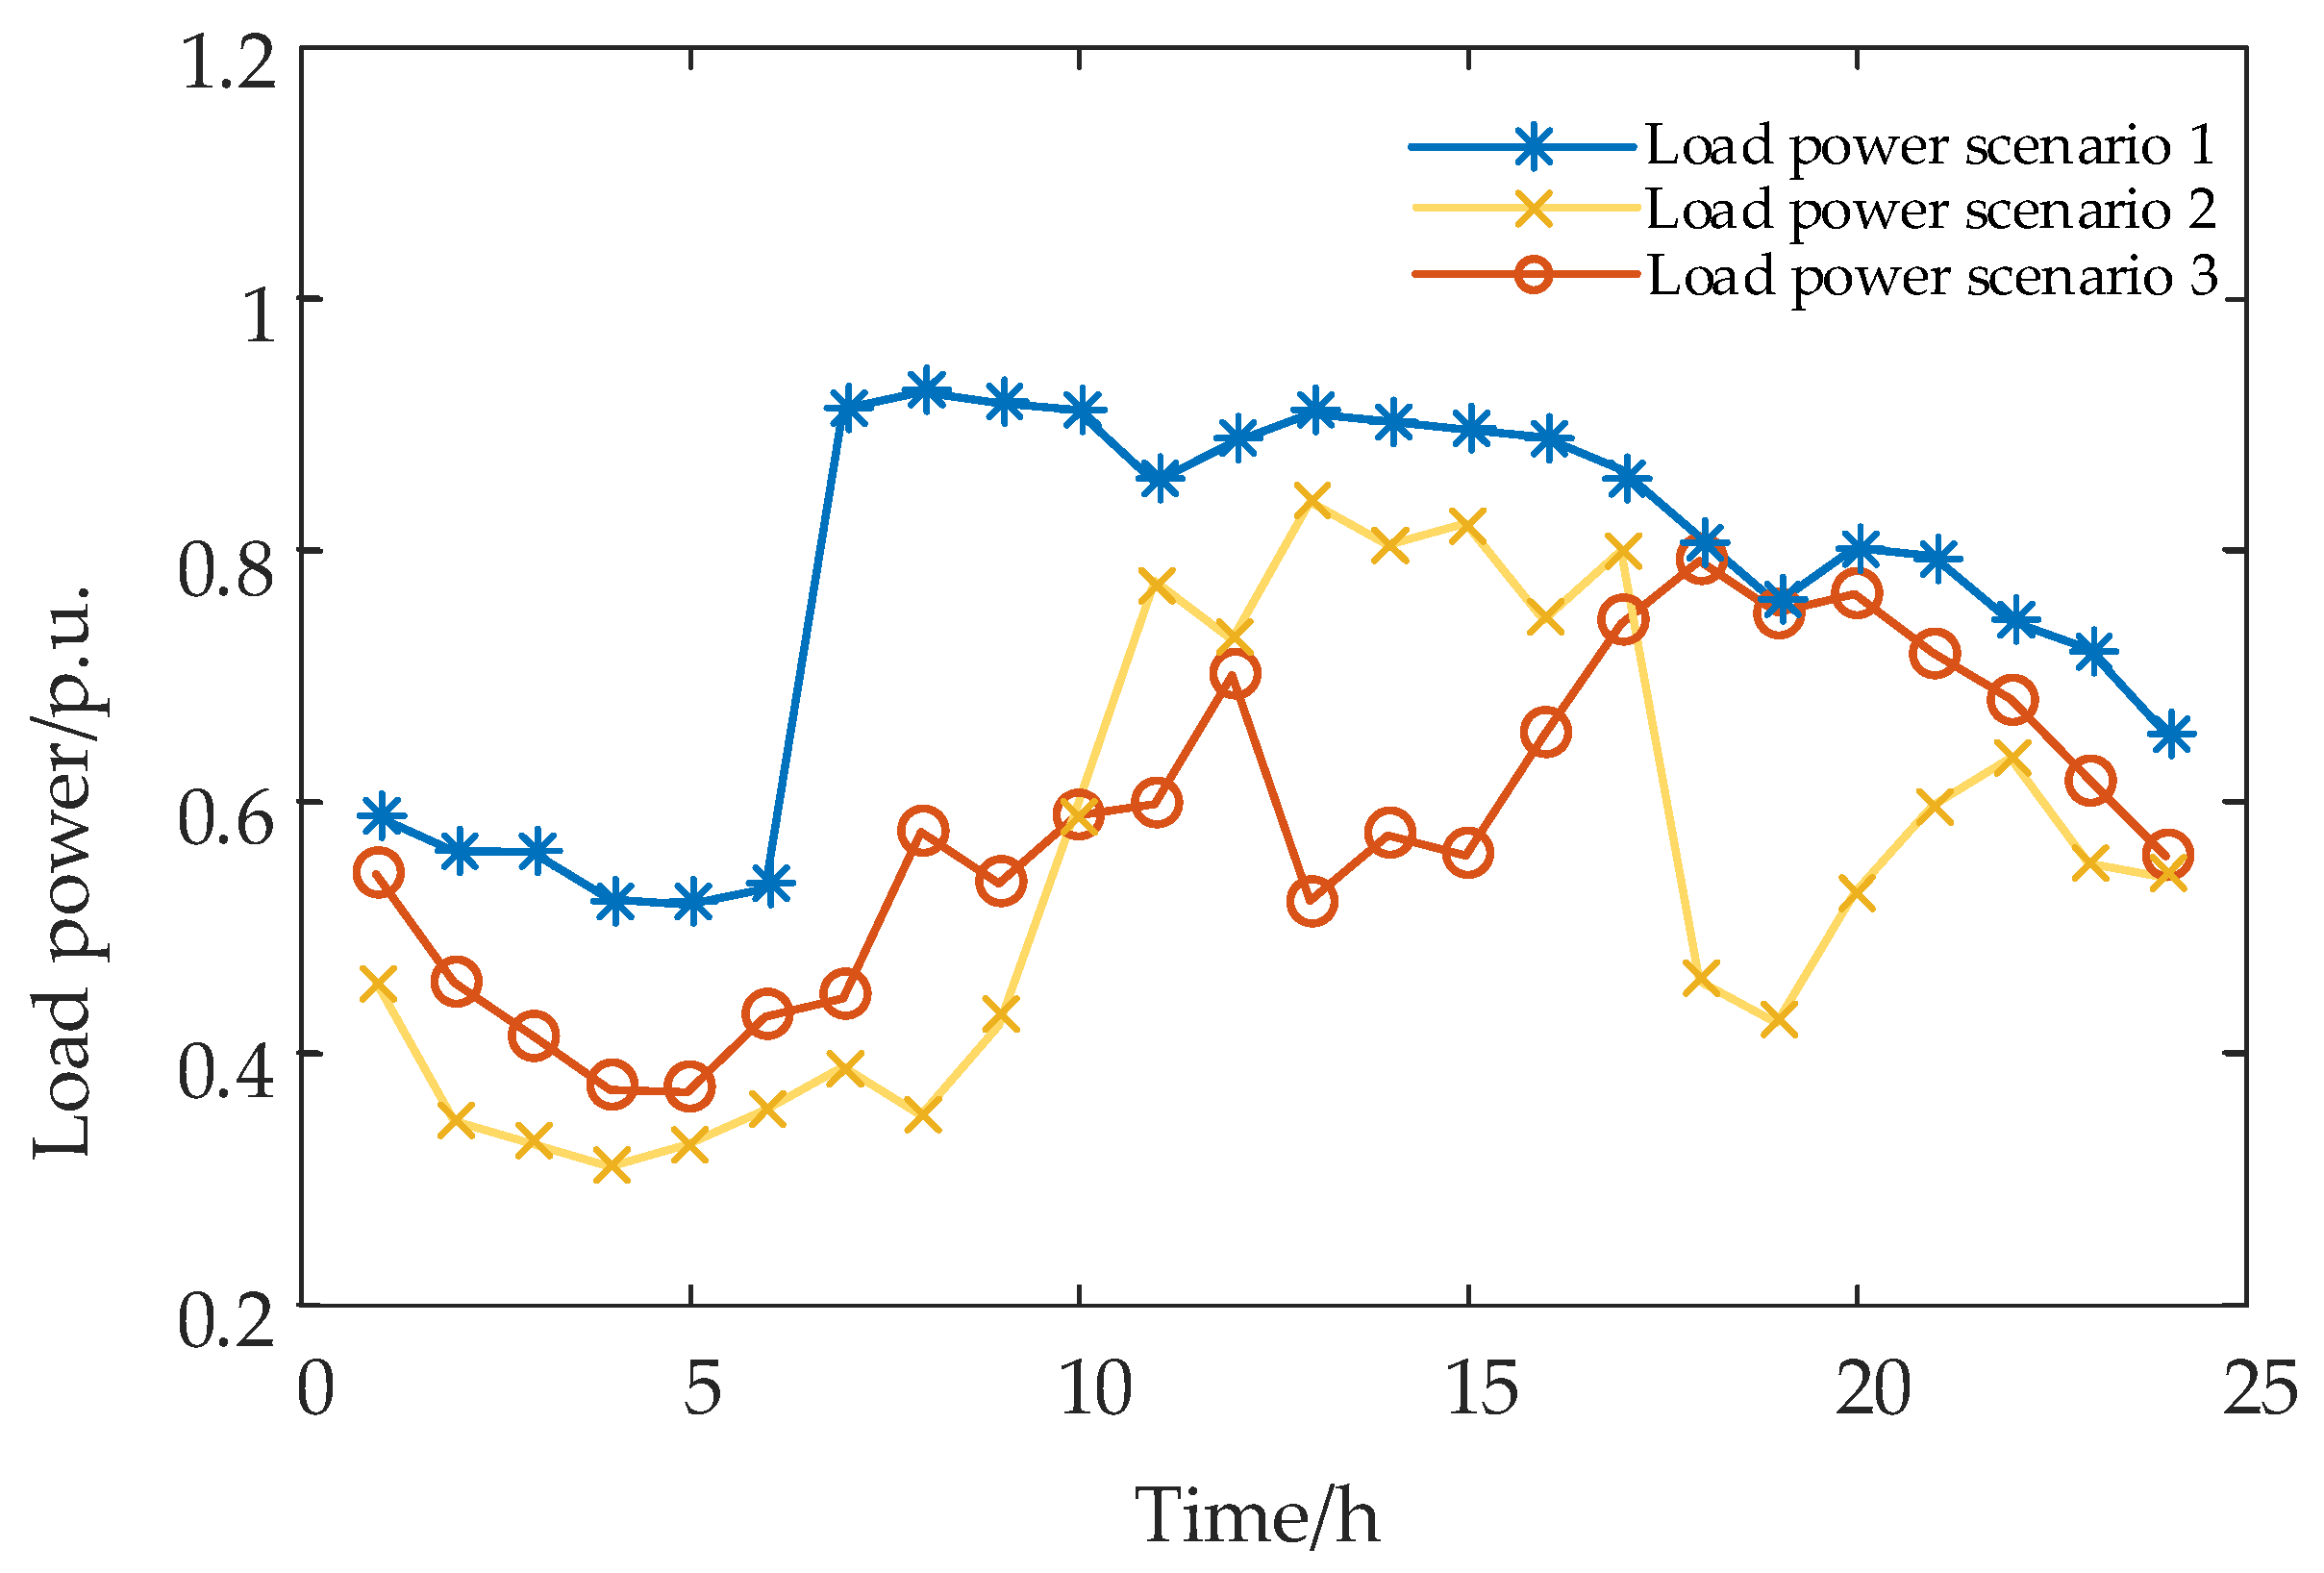
6.2.1. Generation of Typical Joint Operation Scenarios for Light Intensity and Load Power
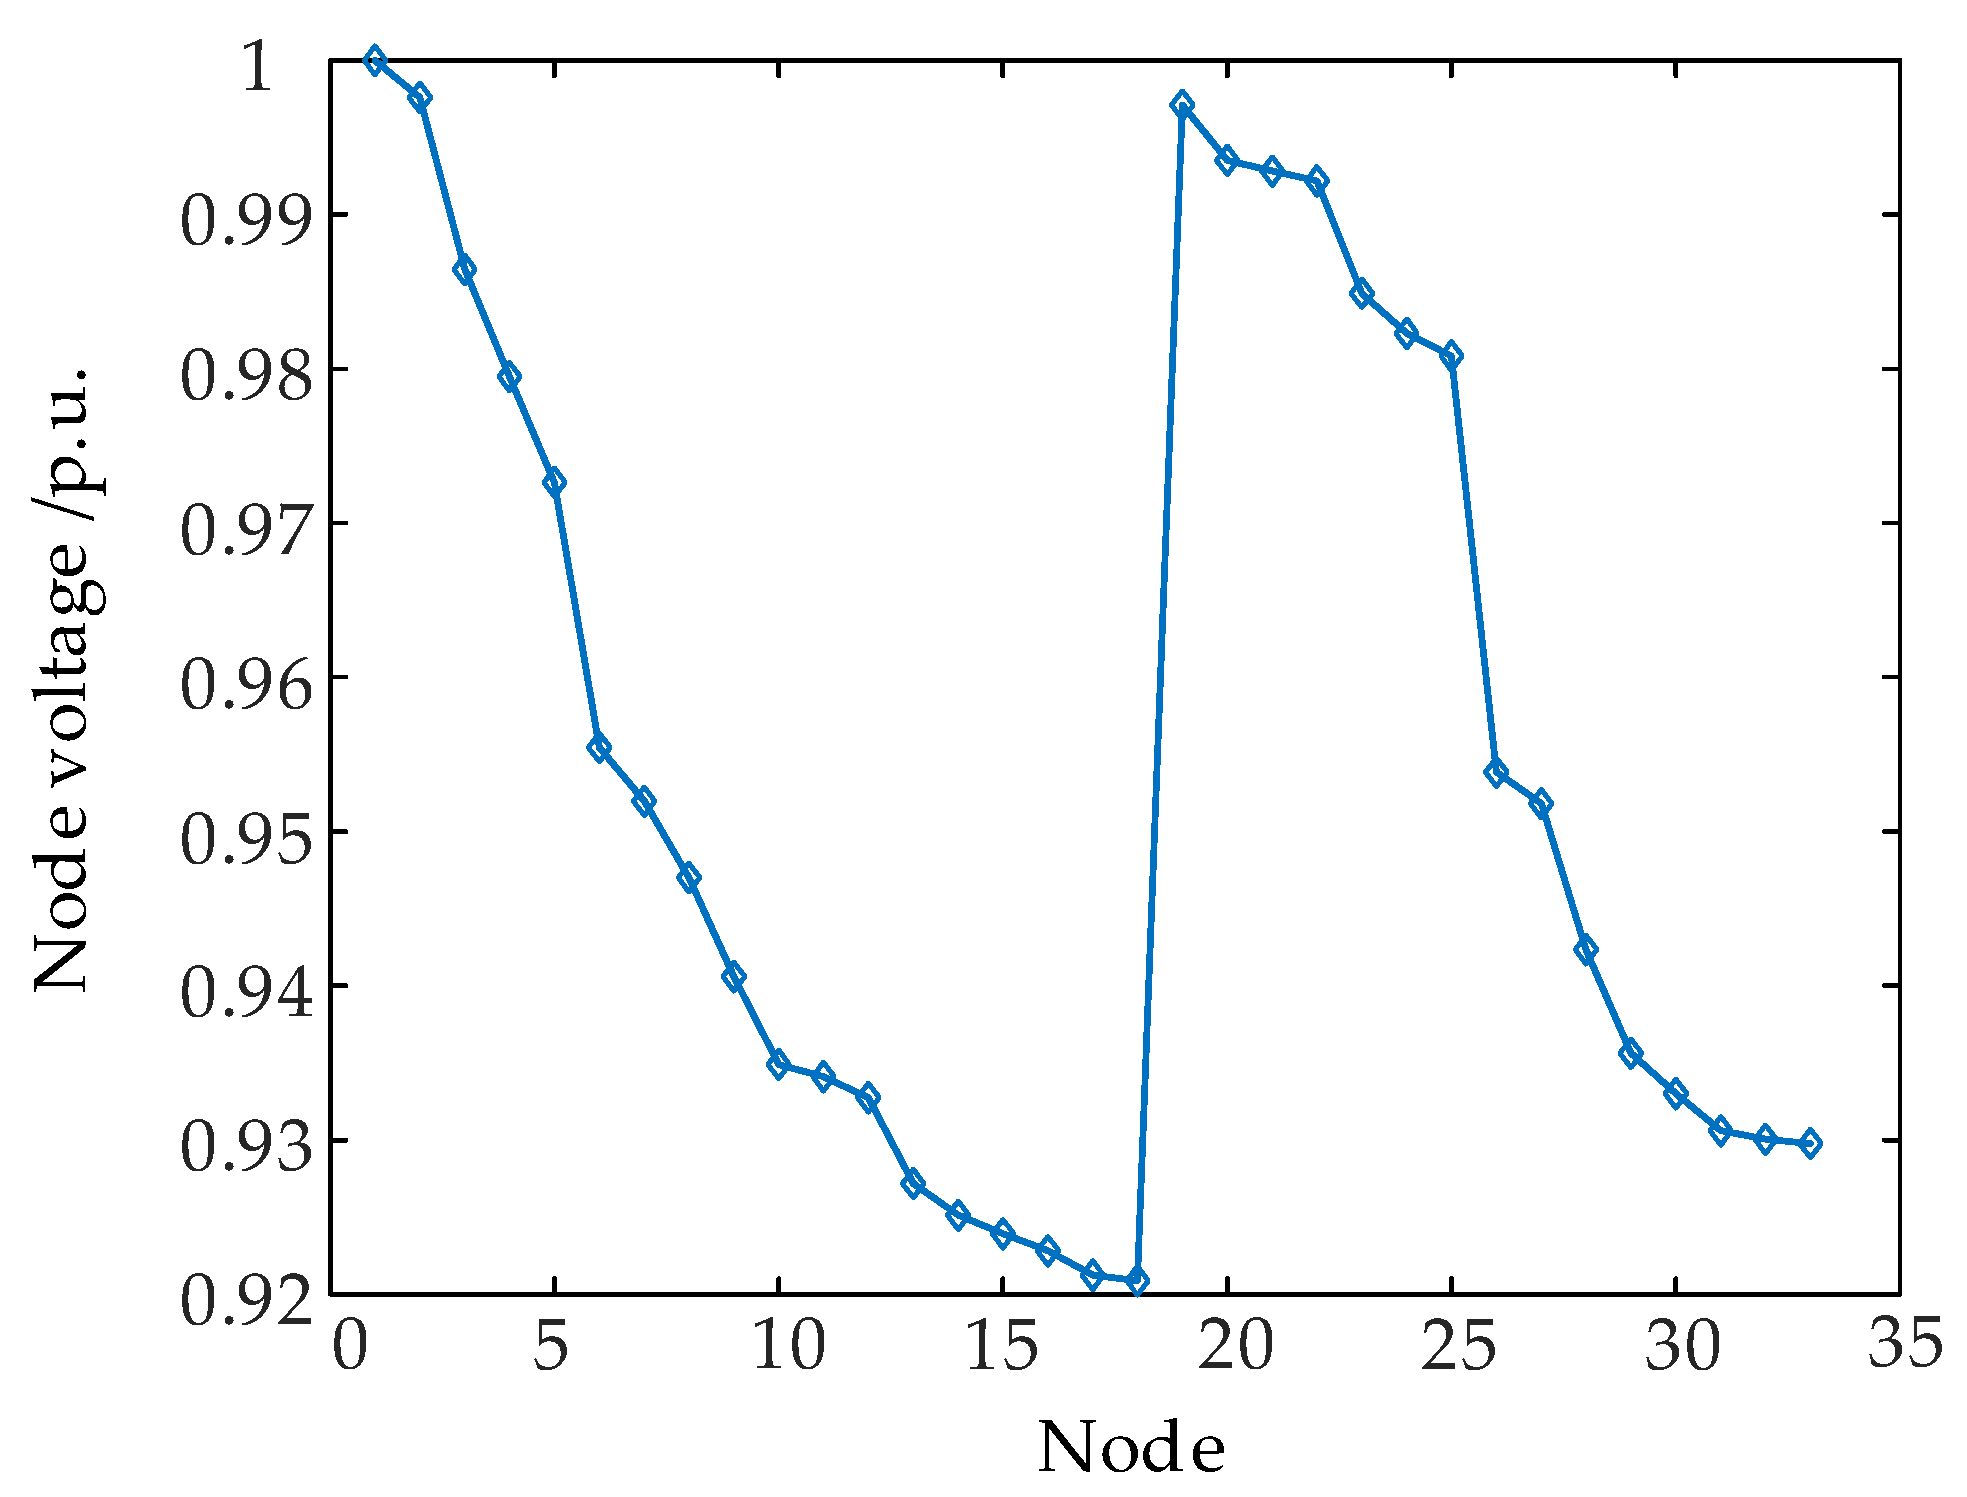
6.2.2. Analysis of the Effectiveness of the Proposed Model
6.2.3. Analysis of Maximum DPV Access Capacity in Extreme Scenarios
6.2.4. Analysis of DPV Economic Access Capacity Considering Proper PV Power Curtailment
- (1)
- Only in the extreme operating scenario with the strongest light intensity and the smallest load power, the maximum access capacity of the DPV unit in the distribution network is determined with the criterion that each constraint is not exceeded. The result is analyzed in Section 6.2.3.
- (2)
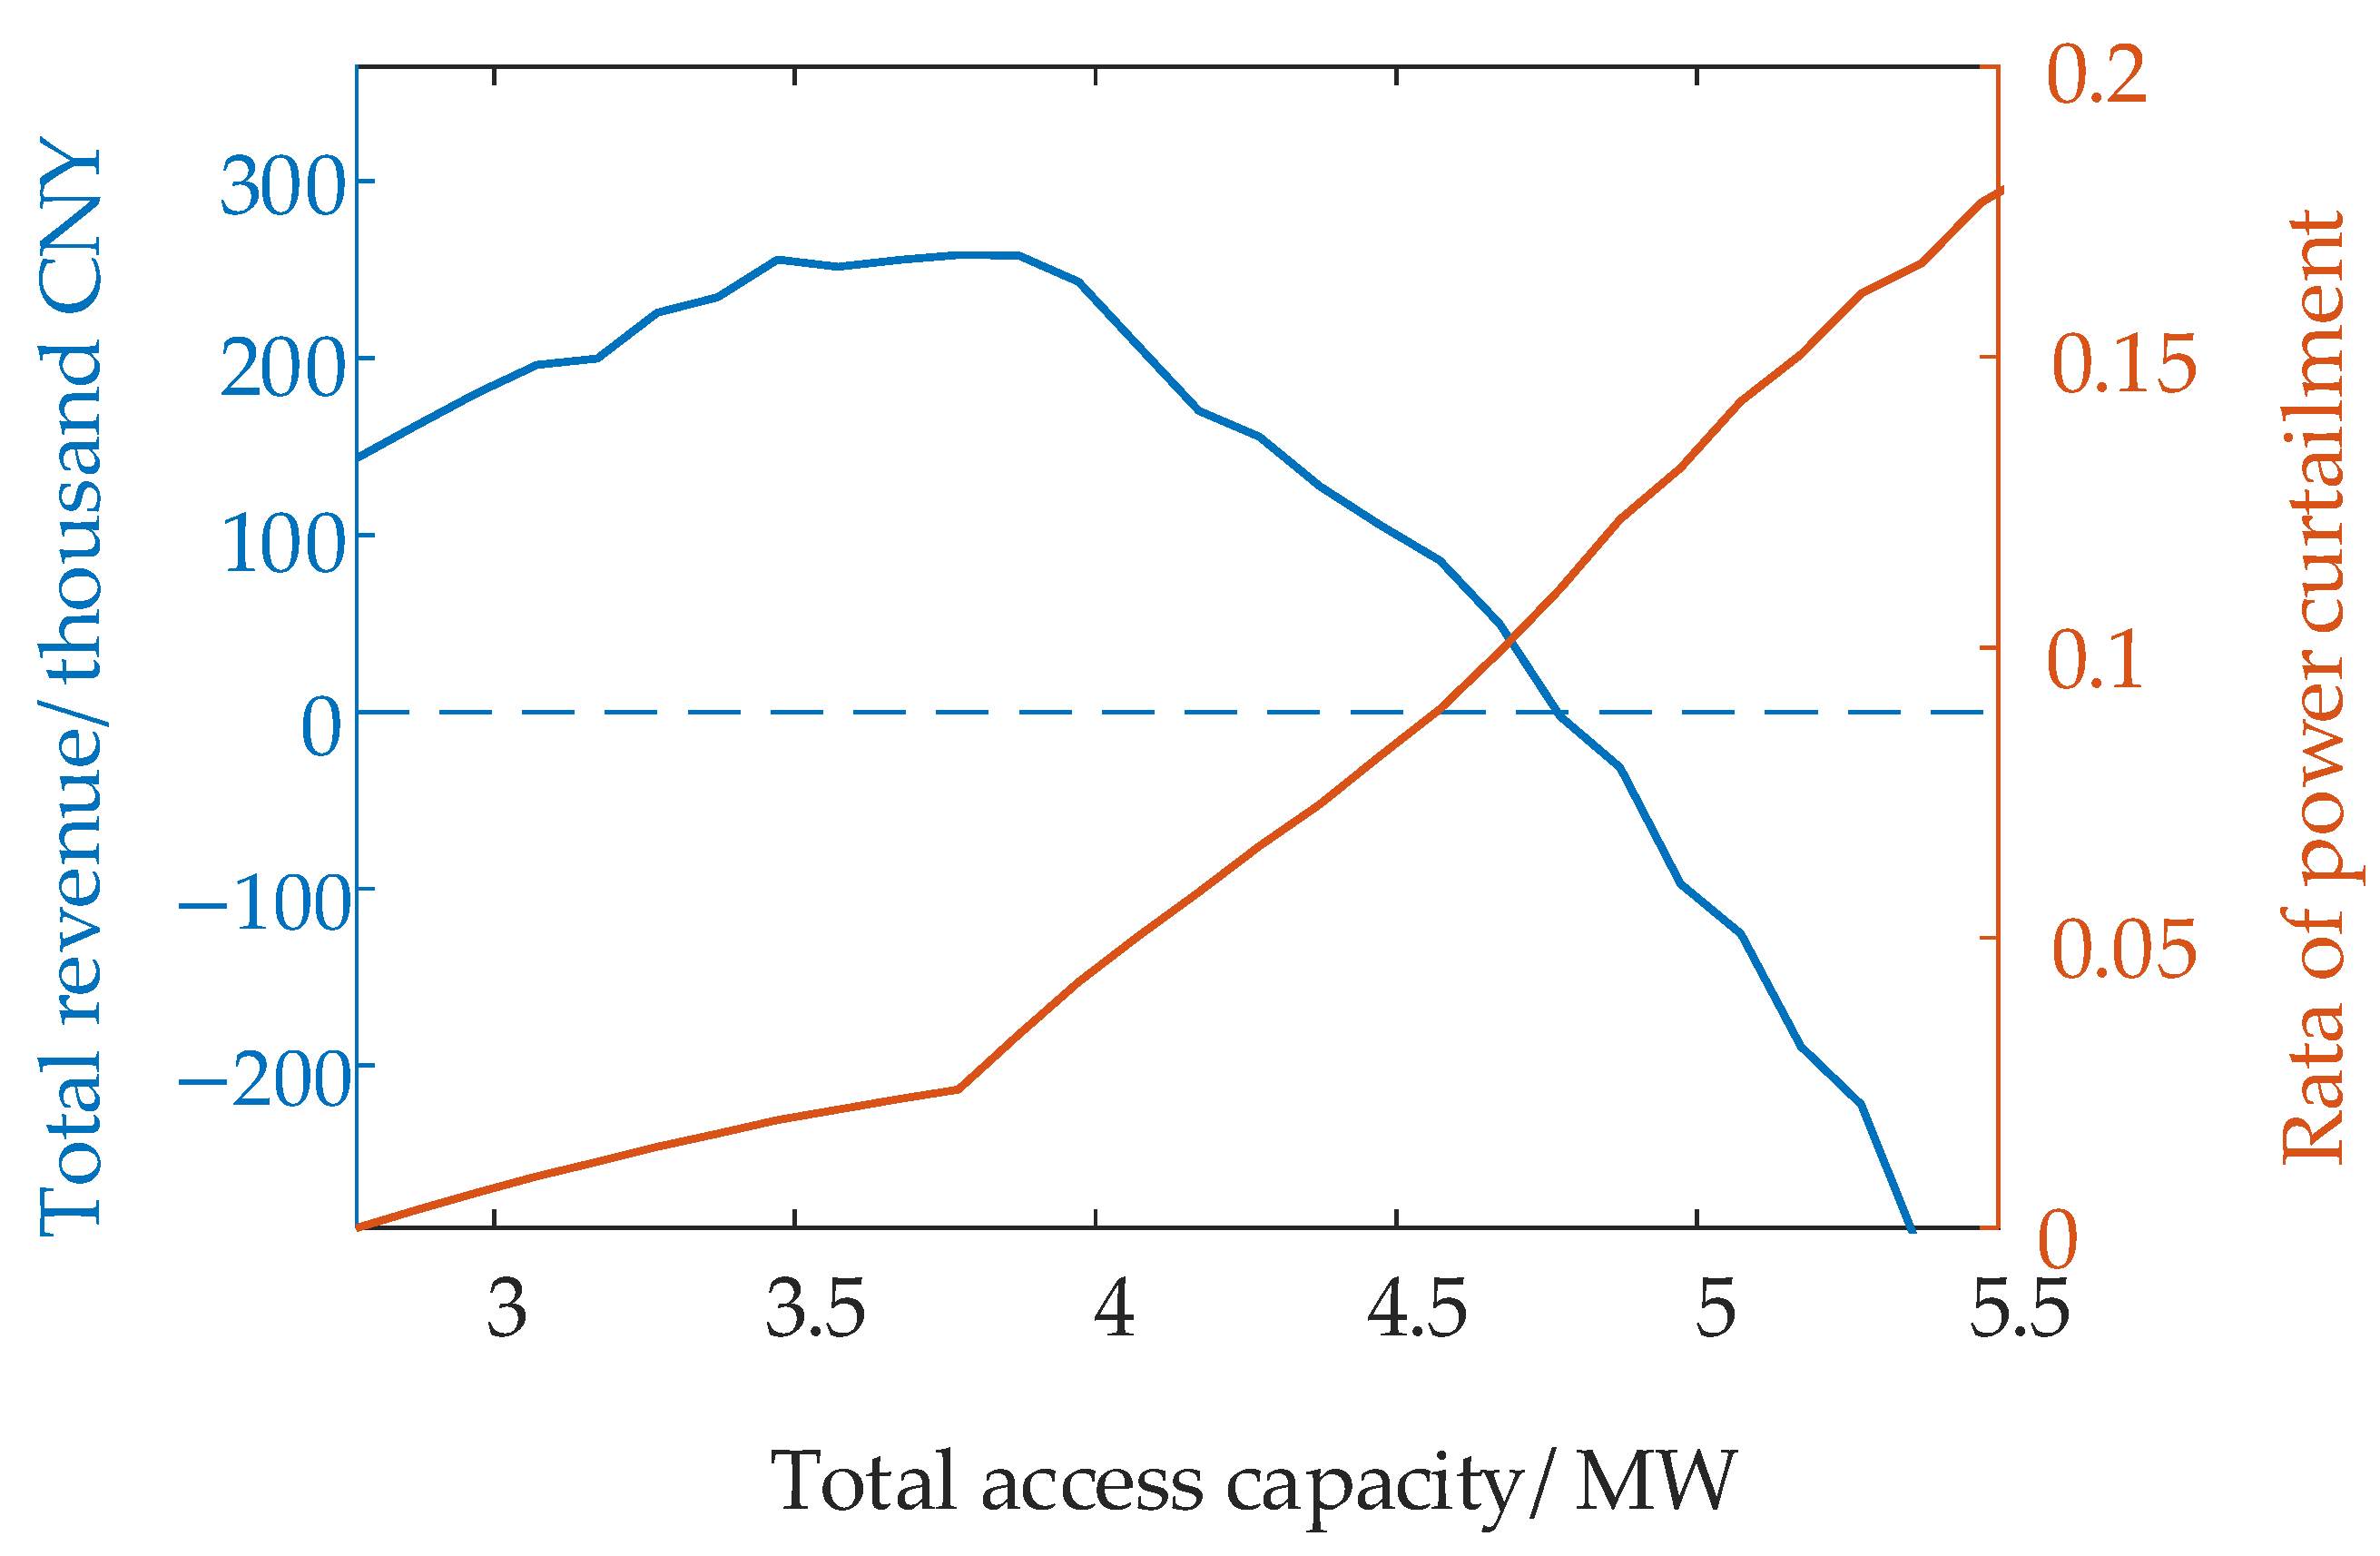
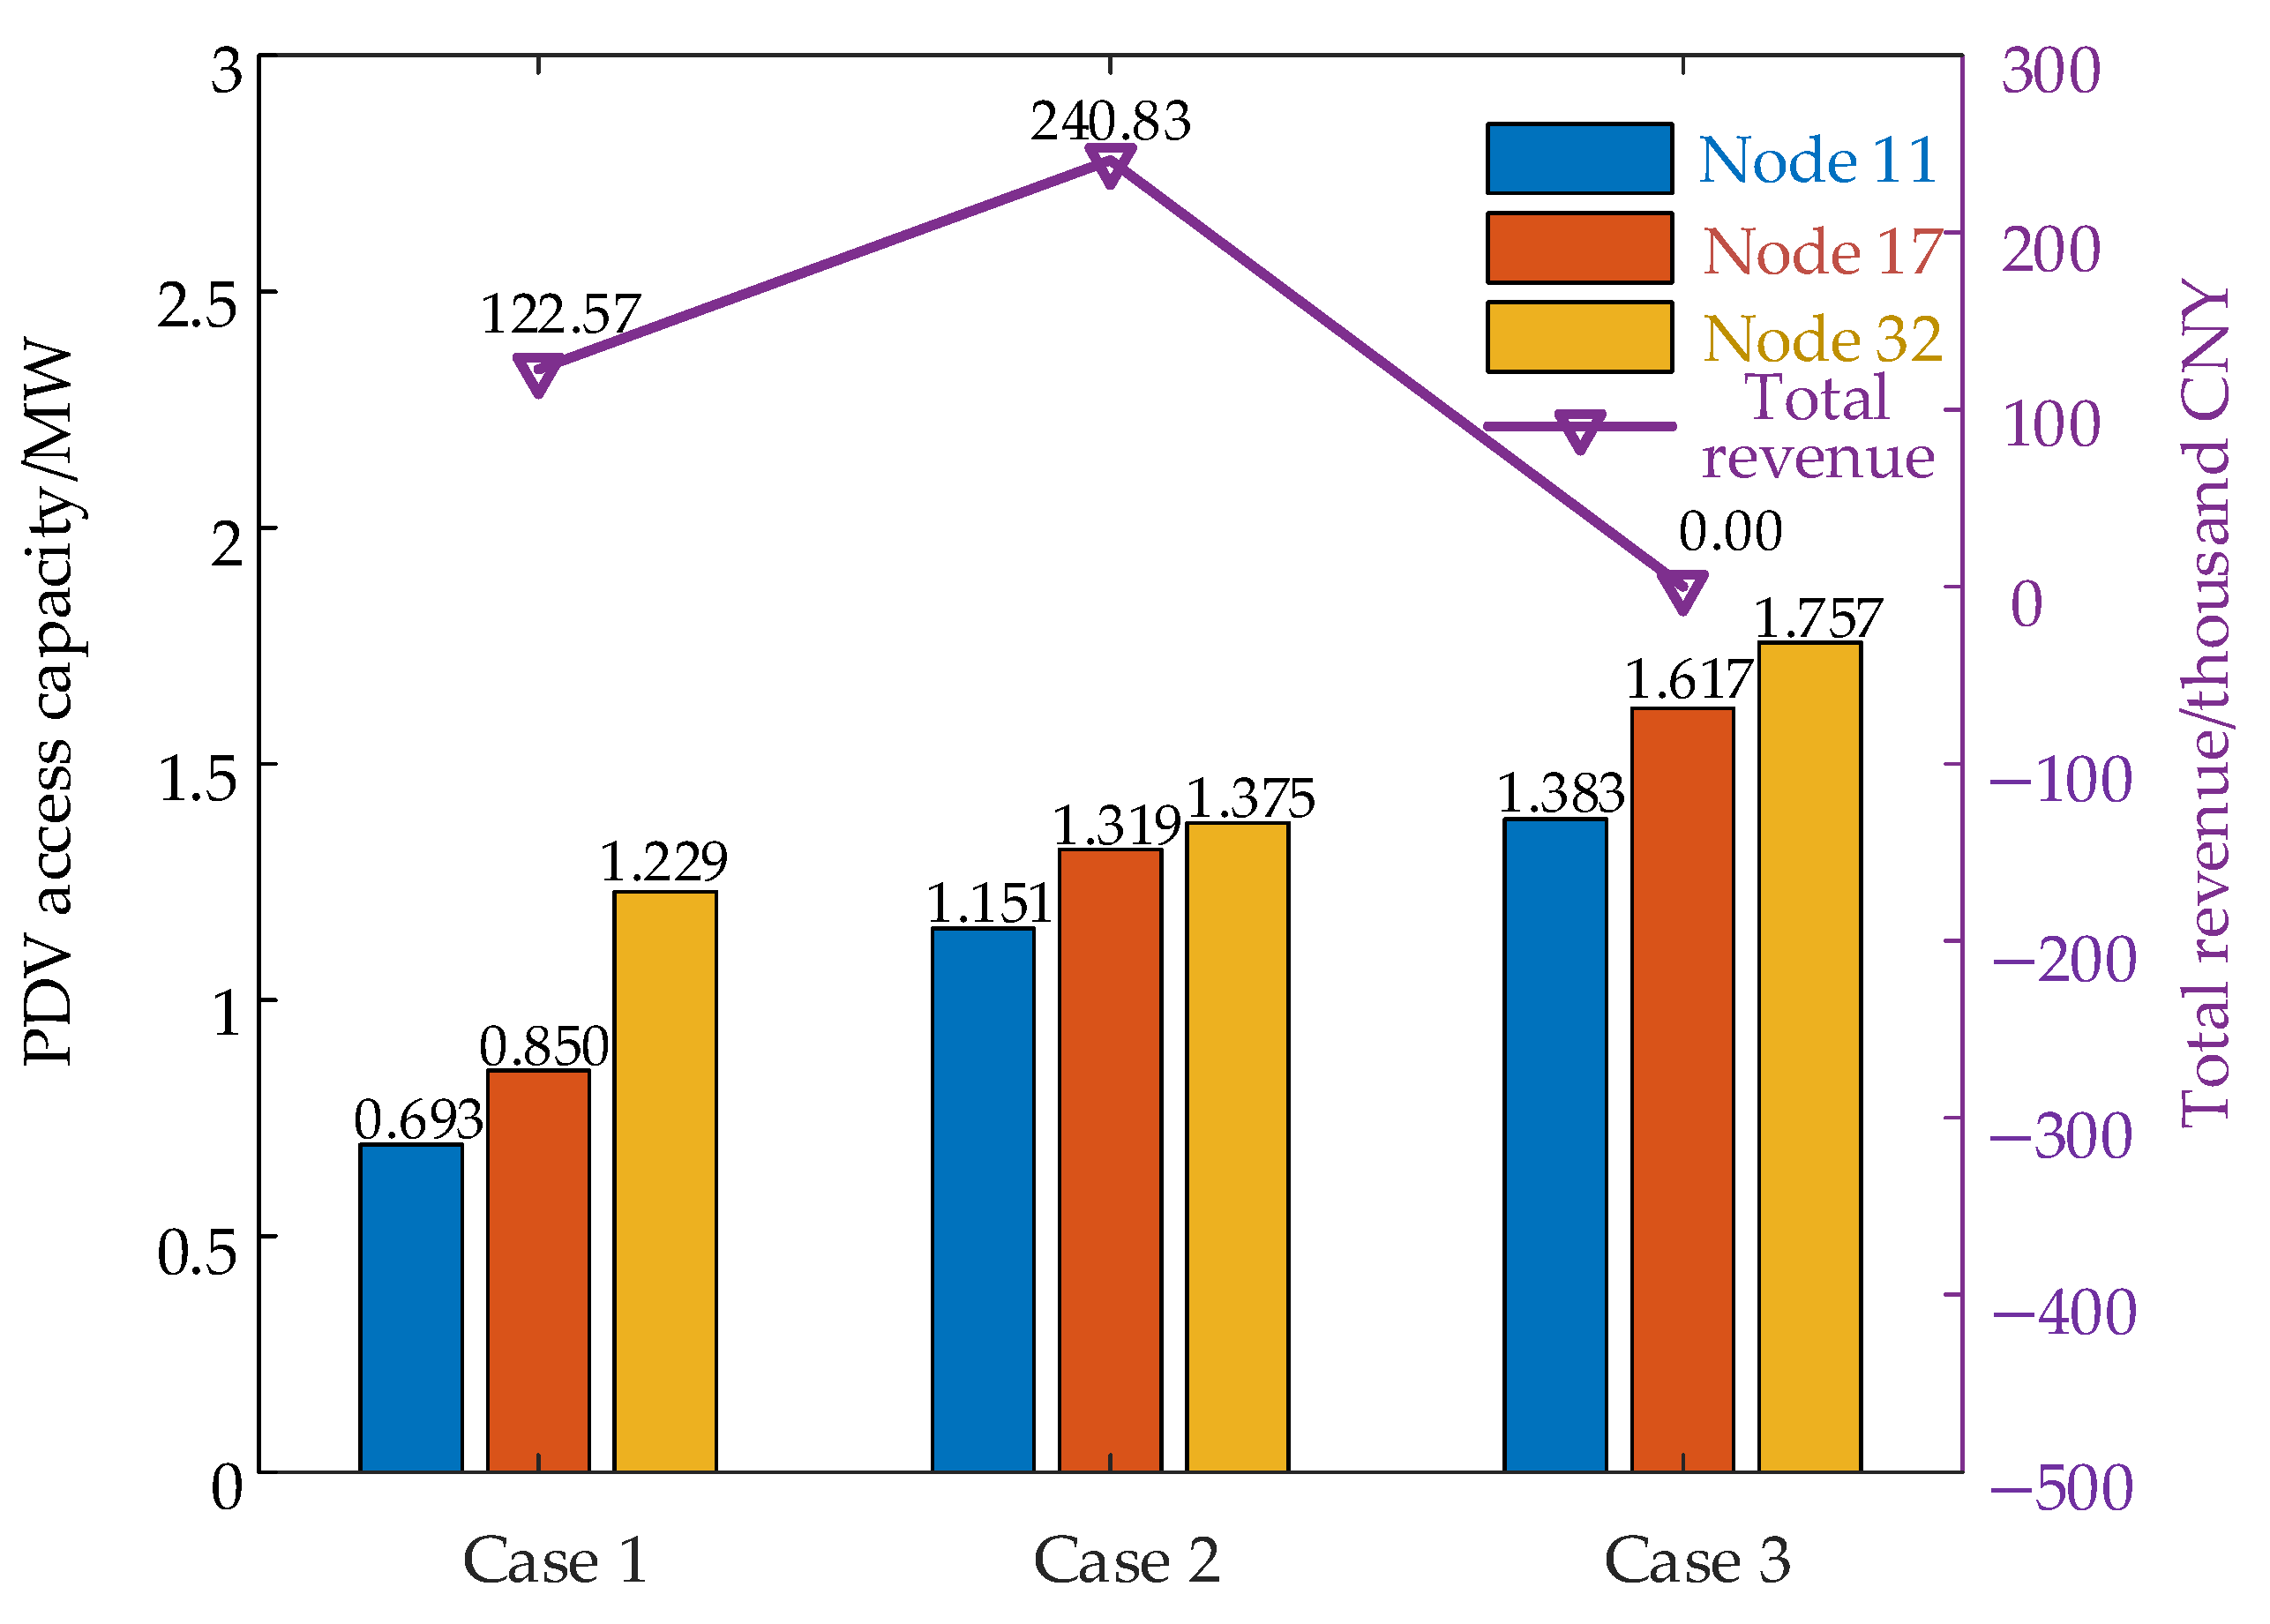
- The DPV access capacity in the distribution network is obtained with the objective of maximizing the total economic revenue while considering proper PV power curtailment.
- (3)
- Considering proper PV power curtailment, the maximum access capacity of the DPV unit in the distribution network is obtained when the total economic revenue is non-negative. This situation focuses on finding the balance between economy and maximum DPV access capacity.
7. Conclusions
- (1)
- The selected operation scenarios are important factors affecting the scientificity and representativeness of the results, when carrying out DPV economic access capacity evaluation in the distribution network. In this paper, a method for generating typical joint light intensity and load power operation scenarios based on an improved K-means algorithm was proposed. The typical joint operation scenario set of light intensity and load power and the probability set of the scenarios were obtained by clustering and combining the historical data of annual light intensity and load power. This method comprehensively considers all the scenarios in a year, and solves the problem that the evaluation result is inaccurate and unrepresentative caused by having a single evaluation scenario.
- (2)
- To improve the DPV access capacity in the distribution network, this paper proposes a method to enhance the DPV access capacity in the distribution network based on active and reactive power regulation. From the perspective of active power regulation, by combining energy storage with demand response, the power consumption time on the load side is changed, so that the DPV output can be fully utilized. From the perspective of reactive power regulation, the inverter control method based on the node voltage of the distribution network can reduce the risk of the node voltage exceeding the limit, thereby improving the DPV access capacity in the distribution network.
- (3)
- This paper establishes a model for evaluating the DPV economic access capacity in the distribution network that considers multi-dimensional constraints and performs proper PV power curtailment. By analyzing the impact of proper PV power curtailment on the DPV economic access capacity and economy revenue, the maximum DPV economic access capacity in the distribution network and the DPV access capacity when the economy is optimal are obtained. Considering proper PV power curtailment, the DPV access capacity in Case 2 is 3.845 MW, which is 38.7% higher than that in Case 1; the economic revenue is CNY 240.83 thousand, which is 96.5% higher than that in Case 1. The maximum DPV access capacity in Case 3 is 4.757 MW, which is 71.6% higher than that in Case 1. It can be seen from the analysis that proper PV power curtailment can significantly improve the DPV economic access capacity in the distribution network.
Author Contributions
Funding
Data Availability Statement
Acknowledgments
Conflicts of Interest
References
- Al-Saffar, M.; Musilek, P. Reinforcement learning-based distributed BESS management for mitigating overvoltage issues in systems with high PV penetration. IEEE Trans. Smart Grid 2020, 11, 2980–2994. [Google Scholar] [CrossRef]
- Gabdullin, Y.; Azzopardi, B. Impacts of Photovoltaics in Low-Voltage Distribution Networks: A Case Study in Malta. Energies 2022, 15, 6731. [Google Scholar] [CrossRef]
- Ismael, S.M.; Abdel Aleem, S.H.E.; Abdelaziz, A.Y.; Zobaa, A.F. State-of-the-art of hosting capacity in modern power systems with distributed generation. Renew. Energy 2019, 130, 1002–1020. [Google Scholar] [CrossRef]
- Lorente, J.L.; Liu, X.; Morrow, J.D. Spatial Aggregation of Small-Scale Photovoltaic Generation Using Voronoi Decomposition. IEEE Trans. Sustain. Energy 2020, 11, 2677–2686. [Google Scholar] [CrossRef]
- Seyf Abad, M.S.; Ma, J.; Zhang, D.; Ahmadyar, S.; Marzooghi, H. Probabilistic evaluation of hosting capacity in radial distribution systems. IEEE Trans. Sustain. Energy 2018, 9, 1935–1947. [Google Scholar] [CrossRef]
- Seyf Abad, M.S.; Ma, J. Photovoltaic hosting capacity sensitivity to active distribution network management. IEEE Trans. Power Syst. 2021, 36, 107–117. [Google Scholar] [CrossRef]
- Koirala, A.; Van Acker, T.; D’hulst, R.; Van Hertem, D. Hosting capacity of photovoltaic systems in low voltage distribution systems: A benchmark of deterministic and stochastic approaches. Renew. Sustain. Energy Rev. 2022, 15, 111899. [Google Scholar] [CrossRef]
- Huang, Y.; Zhao, L.; Qiu, W.; Xu, Y.; Gao, J.; Yan, Y.; Wu, T.; Lin, Z. Evaluation of Acceptance Capacity of Distributed Generation in Distribution Network Considering Carbon Emission. Energies 2022, 15, 4406. [Google Scholar] [CrossRef]
- Torquato, R.; Salles, D.; Pereira, C.O.; Meira, P.C.M.; Freitas, W. A Comprehensive Assessment of PV Hosting Capacity on Low-Voltage Distribution Systems. IEEE Trans. Power Deliv. 2018, 33, 1002–1012. [Google Scholar] [CrossRef]
- Abad, M.S.S.; Ma, J.; Ahmadyar, A.S.; Marzooghi, H. Distributionally Robust Distributed Generation Hosting Capacity Assessment in Distribution Systems. Energies 2018, 11, 2981. [Google Scholar] [CrossRef]
- Hao, W.; Meng, Z.; Zhang, Y.; Xie, B.; Peng, P.; Wei, J. Research on the Evaluation Method of Distribution Network Carrying Capacity for Multiple Distributed Power Sources Connected to a New Power System. Power Syst. Prot. Control 2023, 51, 23–33. [Google Scholar]
- Li, H.; Wang, Y.; Hu, Z.; Luo, F. Evaluation of the Carrying Capacity of Distribution Networks on Multivariate Access Objects under the Dual Carbon Background. Power Syst. Technol. 2022, 46, 3595–3604. [Google Scholar]
- Li, J.; Liu, F.; Li, Z.; Shao, C.; Liu, X. Grid-side flexibility of power systems in integrating large-scale renewable generations: A critical review on concepts, formulations and solution approaches. Renew. Sustain. Energy Rev. 2018, 93, 272–284. [Google Scholar] [CrossRef]
- Ahsan, F.; Dana, N.H.; Sarker, S.K.; Li, L.; Muyeen, S.M.; Ali, F.; Tasneem, Z.; Hasan, M.; Abhi, S.H.; Islam, R.; et al. Data-driven next-generation smart grid towards sustainable energy evolution: Techniques and technology review. Prot. Control Mod. Power Syst. 2023, 8, 696–737. [Google Scholar] [CrossRef]
- Ni, L.; Liu, W.; Wen, F.; Xue, Y.; Dong, Z.; Zheng, Y.; Zhang, R. Optimal operation of electricity, natural gas and heat systems considering integrated demand responses and diversified storage devices. J. Mod. Power Syst. Clean Energy 2018, 6, 423–437. [Google Scholar] [CrossRef]
- Aleksandra Roos, Torjus Folsland Bolkesjø. Value of demand flexibility on spot and reserve electricity markets in future power system with increased shares of variable renewable energy. Energy 2018, 144, 207–217. [Google Scholar] [CrossRef]
- Vijay Babu Pamshetti, S.P. Singh. Coordinated Allocation of BESS and SOP in High PV Penetrated Distribution Network Incorporating DR and CVR Schemes. IEEE Syst. J. 2022, 16, 420–430. [Google Scholar] [CrossRef]
- Zhao, X.; Bai, Z.; Xue, W.; Xu, N.; Li, C.; Zhao, H. Research on bi-level cooperative robust planning of distributed renewable energy in distribution networks considering demand response and uncertainty. Energy Rep. 2021, 7, 1025–1037. [Google Scholar] [CrossRef]
- Cao, M.; Xu, Q.; Cai, J.; Yang, B. Optimal sizing strategy for energy storage system considering correlated forecast uncertainties of dispatchable resources. Int. J. Electr. Power Energy Syst. 2019, 108, 336–346. [Google Scholar] [CrossRef]
- Dong, X.; Shen, J.; Liu, C.; Ma, Z.; He, Y. Simultaneous capacity configuration and scheduling optimization of an integrated electrical vehicle charging station with photovoltaic and battery energy storage system. Energy 2024, 289, 129991. [Google Scholar] [CrossRef]
- Yang, X.; Zhou, Z.; Zhang, Y.; Liu, J.; Wen, J.; Wu, Q.; Cheng, S.-J. Resilience oriented co-deployment of remote-controlled switches and soft open points in distribution networks. IEEE Trans. Power Syst. 2023, 38, 1350–1365. [Google Scholar] [CrossRef]
- Zhang, S.; Fang, Y.; Zhang, H.; Cheng, H.; Wang, X. Maximum Hosting Capacity of Photovoltaic Generation in SOP-Based Power Distribution Network Integrated with Electric Vehicles. IEEE Trans. Ind. Inform. 2022, 18, 8213–8224. [Google Scholar] [CrossRef]
- Bai, L.; Jiang, T.; Li, F.; Chen, H.; Li, X. Distributed energy storage planning in soft open point based active distribution networks incorporating network reconfiguration and DG reactive power capability. Appl. Energy 2018, 210, 1082–1091. [Google Scholar] [CrossRef]
- Mahdavi, M.; Kork Schmitt, K.E.; Jurado, F. Robust Distribution Network Reconfiguration in the Presence of Distributed Generation Under Uncertainty in Demand and Load Variations. IEEE Trans. Power Deliv. 2023, 38, 3480–3495. [Google Scholar] [CrossRef]
- Li, Z.; Wu, L.; Xu, Y. Risk-Averse Coordinated Operation of a Multi-Energy Microgrid Considering Voltage/Var Control and Thermal Flow: An Adaptive Stochastic Approach. IEEE Trans. Smart Grid 2021, 12, 3914–3927. [Google Scholar] [CrossRef]
- Li, Z.; Xu, Y.; Wu, L.; Zheng, X. A Risk-Averse Adaptively Stochastic Optimization Method for Multi-Energy Ship Operation Under Diverse Uncertainties. IEEE Trans. Power Syst. 2020, 36, 2149–2161. [Google Scholar] [CrossRef]
- Yao, Y.; Liu, W.; Jain, R.; Chowdhury, B.; Wang, J.; Cox, R. Quantitative Metrics for Grid Resilience Evaluation and Optimization. IEEE Trans. Power Syst. 2023, 14, 1244–1258. [Google Scholar] [CrossRef]
- Zhang, J.; Lv, Q.; Guo, X.; Zhang, Z.; Zhou, W. Research on the Maximum Intervention Capacity of Photovoltaics in Distribution Networks Considering Reasonable Abandonment of Light. Acta Energ. Sol. Sin. 2023, 44, 418–426. [Google Scholar]
- Zhang, J.; Gao, X.; Wang, T.; Li, Z.; Deng, X. Evaluation of Photovoltaic Acceptance Capacity in Distribution Networks Considering Abandoned Light Constraints. Electr. Power Eng. Technol. 2023, 42, 14–21. [Google Scholar]
- Wu, J.; Du, S.; Su, J.; Xia, Y.; Zhou, X.; Du, X. Study on county scene division method and typical model of county energy internet. Acta Energ. Sol. Sin. 2023, 44, 475–484. [Google Scholar]
- Yan, Y.; Wang, X.; Li, K.; Li, C.; Tian, C.; Shao, Z. Stochastic optimization of district integrated energy systems based on a hybrid probability forecasting model. Energy 2024, 306, 132486. [Google Scholar] [CrossRef]
- Kalantar-Neyestanaki, M.; Cherkaoui, R. Coordinating distributed energy resources and utility-scale battery energy storage system for power flexibility provision under uncertainty. IEEE Trans. Sustain. Energy 2021, 12, 1853–1863. [Google Scholar] [CrossRef]
- Yang, X.; Xu, C.; He, H.; Yao, W.; Wen, J.; Zhang, Y. Flexibility Provisions in Active Distribution Networks with Uncertainties. IEEE Trans. Sustain. Energy 2021, 12, 553–567. [Google Scholar] [CrossRef]


| Load Power | Light Intensity | ||
|---|---|---|---|
| 1 (35.89%) | 2 (33.15%) | 3 (30.96%) | |
| 1 (32.60%) | 0.1170 | 0.1080 | 0.1009 |
| 2 (51.51%) | 0.1849 | 0.1707 | 0.1595 |
| 3 (15.89%) | 0.0570 | 0.0526 | 0.0492 |
| The Optimization Model Proposed in This Paper | The Model without Relaxation | |
|---|---|---|
| DPV access capacity/MW | 2.772 | 2.791 |
| Solution time/s | 5.794 | 18.461 |
| Economic Indicators | Unit Price |
|---|---|
| DPV Feed-in Tariff | 0.39 CNY/kW·h |
| Network Loss Costs | 0.5 CNY/kW·h |
| DPV Unit Construction Costs | 3.79 CNY/W |
| Energy Storage Construction Costs | 1.47 CNY/W·h |
| Penalty Costs for PV Power Curtailment | 0.6 CNY/kW·h |
| Peak–Flat–Valley Tariff | 0.8, 0.5, 0.3 CNY/kW·h |
| Access Capacity/MW | Amount of PV Power Curtailment/MW | On-Grid Energy/MW | Rate of Power Curtailment | Total Revenue/CNY 1000 | |
|---|---|---|---|---|---|
| Case 1 | 2.772 | 0 | 3296.31 | 0 | 122.57 |
| Case 2 | 3.845 | 183.96 | 4460.67 | 0.040 | 240.83 |
| Case 3 | 4.757 | 652.07 | 5054.52 | 0.129 | 0 |
Disclaimer/Publisher’s Note: The statements, opinions and data contained in all publications are solely those of the individual author(s) and contributor(s) and not of MDPI and/or the editor(s). MDPI and/or the editor(s) disclaim responsibility for any injury to people or property resulting from any ideas, methods, instructions or products referred to in the content. |
© 2024 by the authors. Licensee MDPI, Basel, Switzerland. This article is an open access article distributed under the terms and conditions of the Creative Commons Attribution (CC BY) license (https://creativecommons.org/licenses/by/4.0/).
Share and Cite
Hao, W.; Xiao, W.; Yan, Q.; Jia, Q.; Hu, B.; Li, P. Evaluation of Distributed Photovoltaic Economic Access Capacity in Distribution Networks Considering Proper Photovoltaic Power Curtailment. Energies 2024, 17, 4441. https://doi.org/10.3390/en17174441
Hao W, Xiao W, Yan Q, Jia Q, Hu B, Li P. Evaluation of Distributed Photovoltaic Economic Access Capacity in Distribution Networks Considering Proper Photovoltaic Power Curtailment. Energies. 2024; 17(17):4441. https://doi.org/10.3390/en17174441
Chicago/Turabian StyleHao, Wenbo, Weisong Xiao, Qingyu Yan, Qingquan Jia, Benran Hu, and Pan Li. 2024. "Evaluation of Distributed Photovoltaic Economic Access Capacity in Distribution Networks Considering Proper Photovoltaic Power Curtailment" Energies 17, no. 17: 4441. https://doi.org/10.3390/en17174441
APA StyleHao, W., Xiao, W., Yan, Q., Jia, Q., Hu, B., & Li, P. (2024). Evaluation of Distributed Photovoltaic Economic Access Capacity in Distribution Networks Considering Proper Photovoltaic Power Curtailment. Energies, 17(17), 4441. https://doi.org/10.3390/en17174441