Article

Global Horizontal Irradiance in Brazil: A Comparative Study of Reanalysis Datasets with Ground-Based Data

by
Margarete Afonso de Sousa Guilhon Araujo
,
Soraida Aguilar
,
Reinaldo Castro Souza
and
Fernando Luiz Cyrino Oliveira
*
Department of Industrial Engineering, Pontifical Catholic University of Rio de Janeiro (PUC-Rio), Rua Marquês de São Vicente, 225, Gávea, Rio de Janeiro 22453-900, RJ, Brazil
*
Author to whom correspondence should be addressed.
Energies 2024, 17(20), 5063; https://doi.org/10.3390/en17205063
Submission received: 20 September 2024 / Revised: 7 October 2024 / Accepted: 9 October 2024 / Published: 11 October 2024
(This article belongs to the Special Issue Forecasting of Photovoltaic Power Generation and Model Optimization)

Abstract

:
Renewable energy sources are increasing globally, mainly due to efforts to achieve net zero emissions. In Brazil, solar photovoltaic electricity generation has grown substantially in recent years, with the installed capacity rising from 2455 MW in 2018 to 47,033 MW in August 2024. However, the intermittency of solar energy increases the challenges of forecasting solar generation, making it more difficult for decision-makers to plan flexible and efficient distribution systems. In addition, to forecast power generation to support grid expansion, it is essential to have adequate data sources, but measured climate data in Brazil is limited and does not cover the entire country. To address this problem, this study evaluates the global horizontal irradiance (GHI) of four global reanalysis datasets—MERRA-2, ERA5, ERA5-Land, and CFSv2—at 35 locations across Brazil. The GHI time series from reanalysis was compared with ground-based measurements to assess its ability to represent hourly GHI in Brazil. Results indicate that MERRA-2 performed best in 90% of the locations studied, considering the root mean squared error. These findings will help advance solar forecasting by offering an alternative in regions with limited observational time series measurements through the use of reanalysis datasets.

1. Introduction

The global use of renewable energy sources has expanded quickly in recent years, mainly due to efforts to obtain net zero emissions by 2050, the world agreement to reduce greenhouse gas emissions close to zero [1]. Solar, wind, hydro, and biomass are the transition drivers to an energy system with lower carbon emissions [2]. Solar photovoltaic (solar PV) is considered crucial to world energy transition and is leading the growth of renewables worldwide. In 2021, 56% of the new renewable generating capacity in the world came from solar PV. In 2022, solar PV achieved a significant milestone: more than 1 terawatt of solar capacity, breaking its annual installation records for the ninth consecutive year [3]. Despite these achievements and the expectation of new records in the coming years, the energy transition to lower emission levels is still far away [4], so there is a need to accelerate new project deployment to obtain the 2050 targets.
In terms of installed solar PV capacity by country at the end of 2022, China was in first place, followed by the United States and Japan, while Brazil was in eighth position [5]. In 2022, renewable energy sources accounted for 88% of the Brazilian electricity mix, with hydro, wind, and solar energy being the main contributors [6]. Solar PV rose from 2455 MW in 2018 to 47,033 MW in August 2024, an increase of 1816% [7].
Brazil has great potential for photovoltaic power generation, especially in the Northeast, Midwest, and part of the Southeast regions, which receive very high values of solar irradiance (annual average between 5000 and 6200 Wh/m2) [8]. However, solar power generation is intermittent due to climatic factors such as solar irradiance, temperature, cloudiness, and precipitation [8], making accurate forecasting challenging. Therefore, simulations and forecasts of solar power generation are crucial for operational planning, where better use of existing resources is desired, and for electrical system expansion, energy transition, and medium or long-term planning.
With the growing interest in renewable energy, several key issues have emerged as crucial for the energy sector to facilitate the transition to sustainable energy solutions. These include improving energy efficiency in homes to reduce greenhouse gas emissions [9] and understanding the stochastic nature of renewable energy sources for effective planning, which requires advanced methodologies to analyze the interdependence between different renewable sources [10].
Recent studies have presented applications with meteorological variables in forecasting models [11,12], analyzing and comparing the impacts of using solar irradiance and wind speed as the input data [13,14] to demonstrate how close solar irradiance is to PV output. Furthermore, irradiance can be an input variable in simulation and forecasting models to help identify patterns and solve problems with missing values in historical PV outputs [15,16,17,18], as shown in the systematic review of Ahmed et al. (2020) [19] on photovoltaic solar energy forecasting. In other studies, regression models are used to optimize the tilt and azimuth of solar collectors using climate variables [20,21].
Locally climatic variables can be obtained by collecting them at observation points. Although weather stations are distributed throughout Brazilian territory, in many localities, the data is scarce with significant missing values or even a complete absence of time series for extended periods. In this context, climate reanalysis datasets, which combine historical observations with weather models through data assimilation to recreate past weather patterns [22,23], serve as an alternative to replace or supplement the measured data [15,24].
A growing interest in reanalysis datasets has been seen in recent studies applying climate data to the energy sector. Despite being considered to have lower accuracy than satellite data [25,26], these datasets are globally available, easy to access, free of charge, and provide long-term hourly historical records. Many studies focus on applying meteorological data, such as wind speed in wind power generation models [27,28,29] or solar radiation in photovoltaic generation models [15,17,30,31,32].
Other researchers have focused on checking the quality of datasets by comparing them with locally measured data [33,34,35,36,37,38,39,40] to determine whether the database can be used for a specific purpose [26]. In addition, there are studies applying methods to reduce the bias of reanalysis data [38,41] and test the possibility of using reanalysis data to complete missing values in climate time series [15].
Specifically for solar energy, much of the current literature studying reanalysis datasets pays particular attention to data quality by comparing them with satellite-based data or ground measurements. The baseline surface radiation network (BSRN) is often used. BSRN is a solar radiation monitoring network centralized in the World Radiation Monitoring Center (WRMC). It has 76 stations, but only 51 are active and distributed worldwide with resolution of 1 to 3 min [42,43]. Of the stations currently available from the BSRN, only four active stations are located in Brazil.
However, in searching the literature, the authors found few studies analyzing solar irradiance from reanalysis datasets in Brazilian territory [26,33,44,45]. Some have studied reanalysis in a global approach, comparing these products to BSRN stations [26,33].
Therefore, a gap remains given the limited number of studied locations since only the BSRN database has been considered. As discussed in [44], the results presented in one location should not be regarded as true for all places. Thus, to have a broader view of the Brazilian case, the National Institute of Meteorology (INMET), under the Brazilian Ministry of Agriculture responsible, can be used. INMET is responsible for providing national meteorological information, and its data serve as measured observations for comparison with reanalysis datasets. The data is available in a digital Meteorological Database (Banco de Dados Meteorológicos do INMET—BDMEP) and follows the World Meteorological Organization’s technical measurement standards [46]. So far, no studies have been found comparing GHI from reanalysis databases with INMET data. This study offers a valuable starting point for expanding knowledge by exploring a larger territory and providing key inputs for decision-making in solar energy applications.
The primary objective of this study is to assess the suitability of global horizontal irradiance (GHI) data from reanalysis datasets, comparing them with ground-based measurements across multiple locations in Brazil. This expands the analysis beyond the limited locations typically examined in the literature [26,33,44,45]. By analyzing the performance of climate reanalysis datasets, this study aims to provide valuable insights concerning their applicability for developing models that aid the electricity sector, making better decisions about how to distribute electricity and overcome the challenges of operating the interconnected Brazilian electricity system.
Although numerous reanalysis datasets are available, not all of them provide hourly data or have full coverage of the Brazilian territory. The datasets selected for this study were chosen specifically for their global coverage and demonstrated utility in previous studies [24,26,28,29,30,31,32,33,34,35,36,37,38,39,40,41]. These datasets include: (a) the Modern-Era Retrospective Analysis for Research and Applications version 2 (MERRA-2), developed by NASA [22]; (b) the Fifth Generation European Reanalysis (ERA5), developed by the Copernicus Climate Change Service (C3S) at the European Centre for Medium-Range Weather Forecasts (ECMWF) [23]; (c) ERA5-Land, also developed by C3S at ECMWF [47]; and (d) the Climate Forecast System version 2 (CFSv2), developed by the National Center for Environmental Prediction (NCEP) [48].
To achieve the research objective, GHI time series from reanalysis datasets will be compared with hourly ground-based measurements from BDMEP. As a secondary objective, this study examines each reanalysis dataset and its characteristics to expand knowledge about energy in Brazilian applications.
This article is divided into five sections, including this introduction. Section 2 describes the methodology and data used in the research; Section 3 presents the results; Section 4 discusses the results; and finally, in Section 5, the main conclusions are drawn.

2. Materials and Methods

To carry out this study, the authors applied a methodology consisting of three steps: scope definition, data treatment, and evaluation.

2.1. Scope Definition

The first step in the scope definition consisted of choosing which meteorological stations from INMET would be selected based on criteria related to the location of solar power plants in Brazil and the data availability.
The BDMEP database contains millions of historical observations from 2000 onward from all automatic and conventional surface weather stations. The data follow the World Meteorological Organization’s technical measurement standards [46]. INMET has more than 500 stations throughout Brazil to record climate variables like wind speed and direction, global radiation, temperature and precipitation (Figure 1a). The climate variables can be downloaded hourly (UTC), daily, and monthly [46]. INMET has an extensive network with modern automatic stations, and the collected data are freely available from its website.
Regarding the geographical distribution of solar installations in Brazil (centralized grid-connected generation), all of them, represented by the blue triangles in Figure 1c, are in the darker band [49,50]. Since this article studies whether reanalysis data are good proxies when measured data are not available to simulate and predict solar power generation, we focused on the area with the highest solar incidence, with daily GHI totals from 1999 to 2018, ranging from 5.4 to 6.4 kWh/m2 [51], where these solar plants are installed, considering automatic stations in these areas, as shown in Figure 1c (black squares).
The year 2020 was chosen for the study because it had the highest number of stations with complete data—35 stations located in an area with high solar irradiance. This year provided the most comprehensive data coverage compared to other years, with fewer stations: 25 in 2018, 26 in 2019, 11 in 2021, 12 in 2022, and 23 in 2023. Therefore, 2020 offers the most complete and reliable dataset to compare with reanalysis datasets in the region. Details of all stations, their locations, and geographical coordinates are listed in Appendix A, Table A1.
Out of the 546 stations that reported data for 2020 (Figure 1a), 455 were excluded due to missing observations in order to avoid bias. Among the 91 automatic station candidates (Figure 1b), 35 stations (represented by black squares) are located in the region with high solar irradiance (Figure 1c).
After defining the covered area, the next step was choosing the datasets to carry out the study. Since the article aimed to study reanalysis and not satellite-based databases, only reanalysis databases that provide free hourly irradiance data for the defined region were analyzed. The authors selected four global datasets that meet this criterion. Only the last version of each dataset chosen was used. With the geographical coordinates of each station selected, the reanalysis data were obtained with the same granularity as the INMET dataset for 2020.

2.2. Data Description and Treatment

In the following paragraphs, we describe the reanalysis datasets and their particularities. Table 1 presents a summary of the reanalysis datasets considered in this research.

2.2.1. Modern-Era Retrospective Analysis for Research and Applications Version 2 (MERRA-2)

One of the most famous reanalysis datasets is MERRA-2 from NASA’s Global Modeling and Assimilation Office [52]. This dataset is produced using a data assimilation system combined with forecast models to reprocess meteorological observations. The data are presented in a grid for several climatic variables, with a resolution of 0.5° latitude × 0.625° longitude, i.e., approximately 50 km [22]. The data are available in hourly and monthly temporal resolution. The solar radiation variable downloaded for this research was the SWGNT—surface net downward shortwave flux [W/m2, 00:30 to 23:30 UTC] [53].

2.2.2. ERA5

ERA5 is a reanalysis dataset released in 2019. Two datasets are available: a preliminary version from 1950 to 1978 and a final one from 1979 to the present. The data are also available monthly and hourly for pressure and single levels. ERA5 is the fifth version of the ERA release to replace the ERA-Interim reanalysis. The climate and atmospheric data are presented in a latitude × longitude grid of 0.25° × 0.25° (~31 km). [23].
The variable used in this work was surface solar radiation downward—SSRD [J/m2, 00:30 to 23:30 UTC], from the dataset “ERA5 hourly data on single levels from 1979 to present” [54].

2.2.3. ERA5-Land

ERA5-Land is another reanalysis dataset from the ECMWF. This dataset presents a solid perspective of land variables, recalculating them from the ERA5 dataset. As found in ERA5, ERA5-Land has hourly temporal resolution data from 1950 to the present. The spatial resolution of 0.1° × 0.1° (~9 km) is the main difference and makes it attractive for this study. In ERA5-Land, the downward shortwave radiation, the variable object of this study, is derived from ERA5. The data are linearly interpolated from the resolution of 31 km to 9 km [47].
The variable in ERA5-Land is the same as in ERA5, surface solar radiation downward-SSRD [J/m2, 00:30 to 23:30 UTC], from the dataset “ERA5-Land hourly data from 1950 to present” [47,55].

2.2.4. NCEP’s Climate Forecast System Version 2 (CFSv2)

The CFS version 2 is a reanalysis dataset developed by the National Center for Environmental Prediction (NCEP) based in the USA [48]. CFS is the third generation of reanalysis products from the NCEP, and the second version was released in 2011. CFSv2 presents a model that works with land, surface, sea ice, atmosphere, and ocean coupled. This dataset has global coverage, with a grid resolution of 0.25° × 0.25° (~31 km) [56]. The data are provided by the Asia-Pacific Data Research Center of the International Pacific Research Center at the University of Hawaii at Mānoa [57], funded in part by the National Oceanic and Atmospheric Administration (NOAA).
The variable name for the CFSv2 reanalysis dataset is “surface downward shortwave radiation flux”-DSWSFC (W/m2), and it was downloaded from the OPeNDAP Server—GDS [57].
Although the name of each variable in the datasets is different, they all represent global horizontal irradiance, so from here on they are called GHI.

2.2.5. Data Treatment

Each reanalysis dataset has an interface to download the data. For MERRA-2, all the data were downloaded in CSV file format for each geographical coordinate returning the near neighbor [53]. For ERA5 and ERA5-Land, from the Copernicus website [58], the data are available in NetCDF (network common data form) file format, widely used to store atmospheric variables [59], and in GRIB, another file format used to store gridded information. For ERA5 and ERA5-Land, the data were downloaded for the geographical area of the meteorological stations, with several points (geographical coordinates) organized in a grid in netCDF format. The data were converted with the software R [60] to CSV file format using the ncdf4 package [61]. The GHI for each location was obtained from the smallest arc distance between the available grid (ERA5 and ERA5-Land) and the geographical coordinate of each station (haversine function, available in the Pracma package of R) [62]. The CSFv2 reanalysis dataset provides the data in CSV format [57].
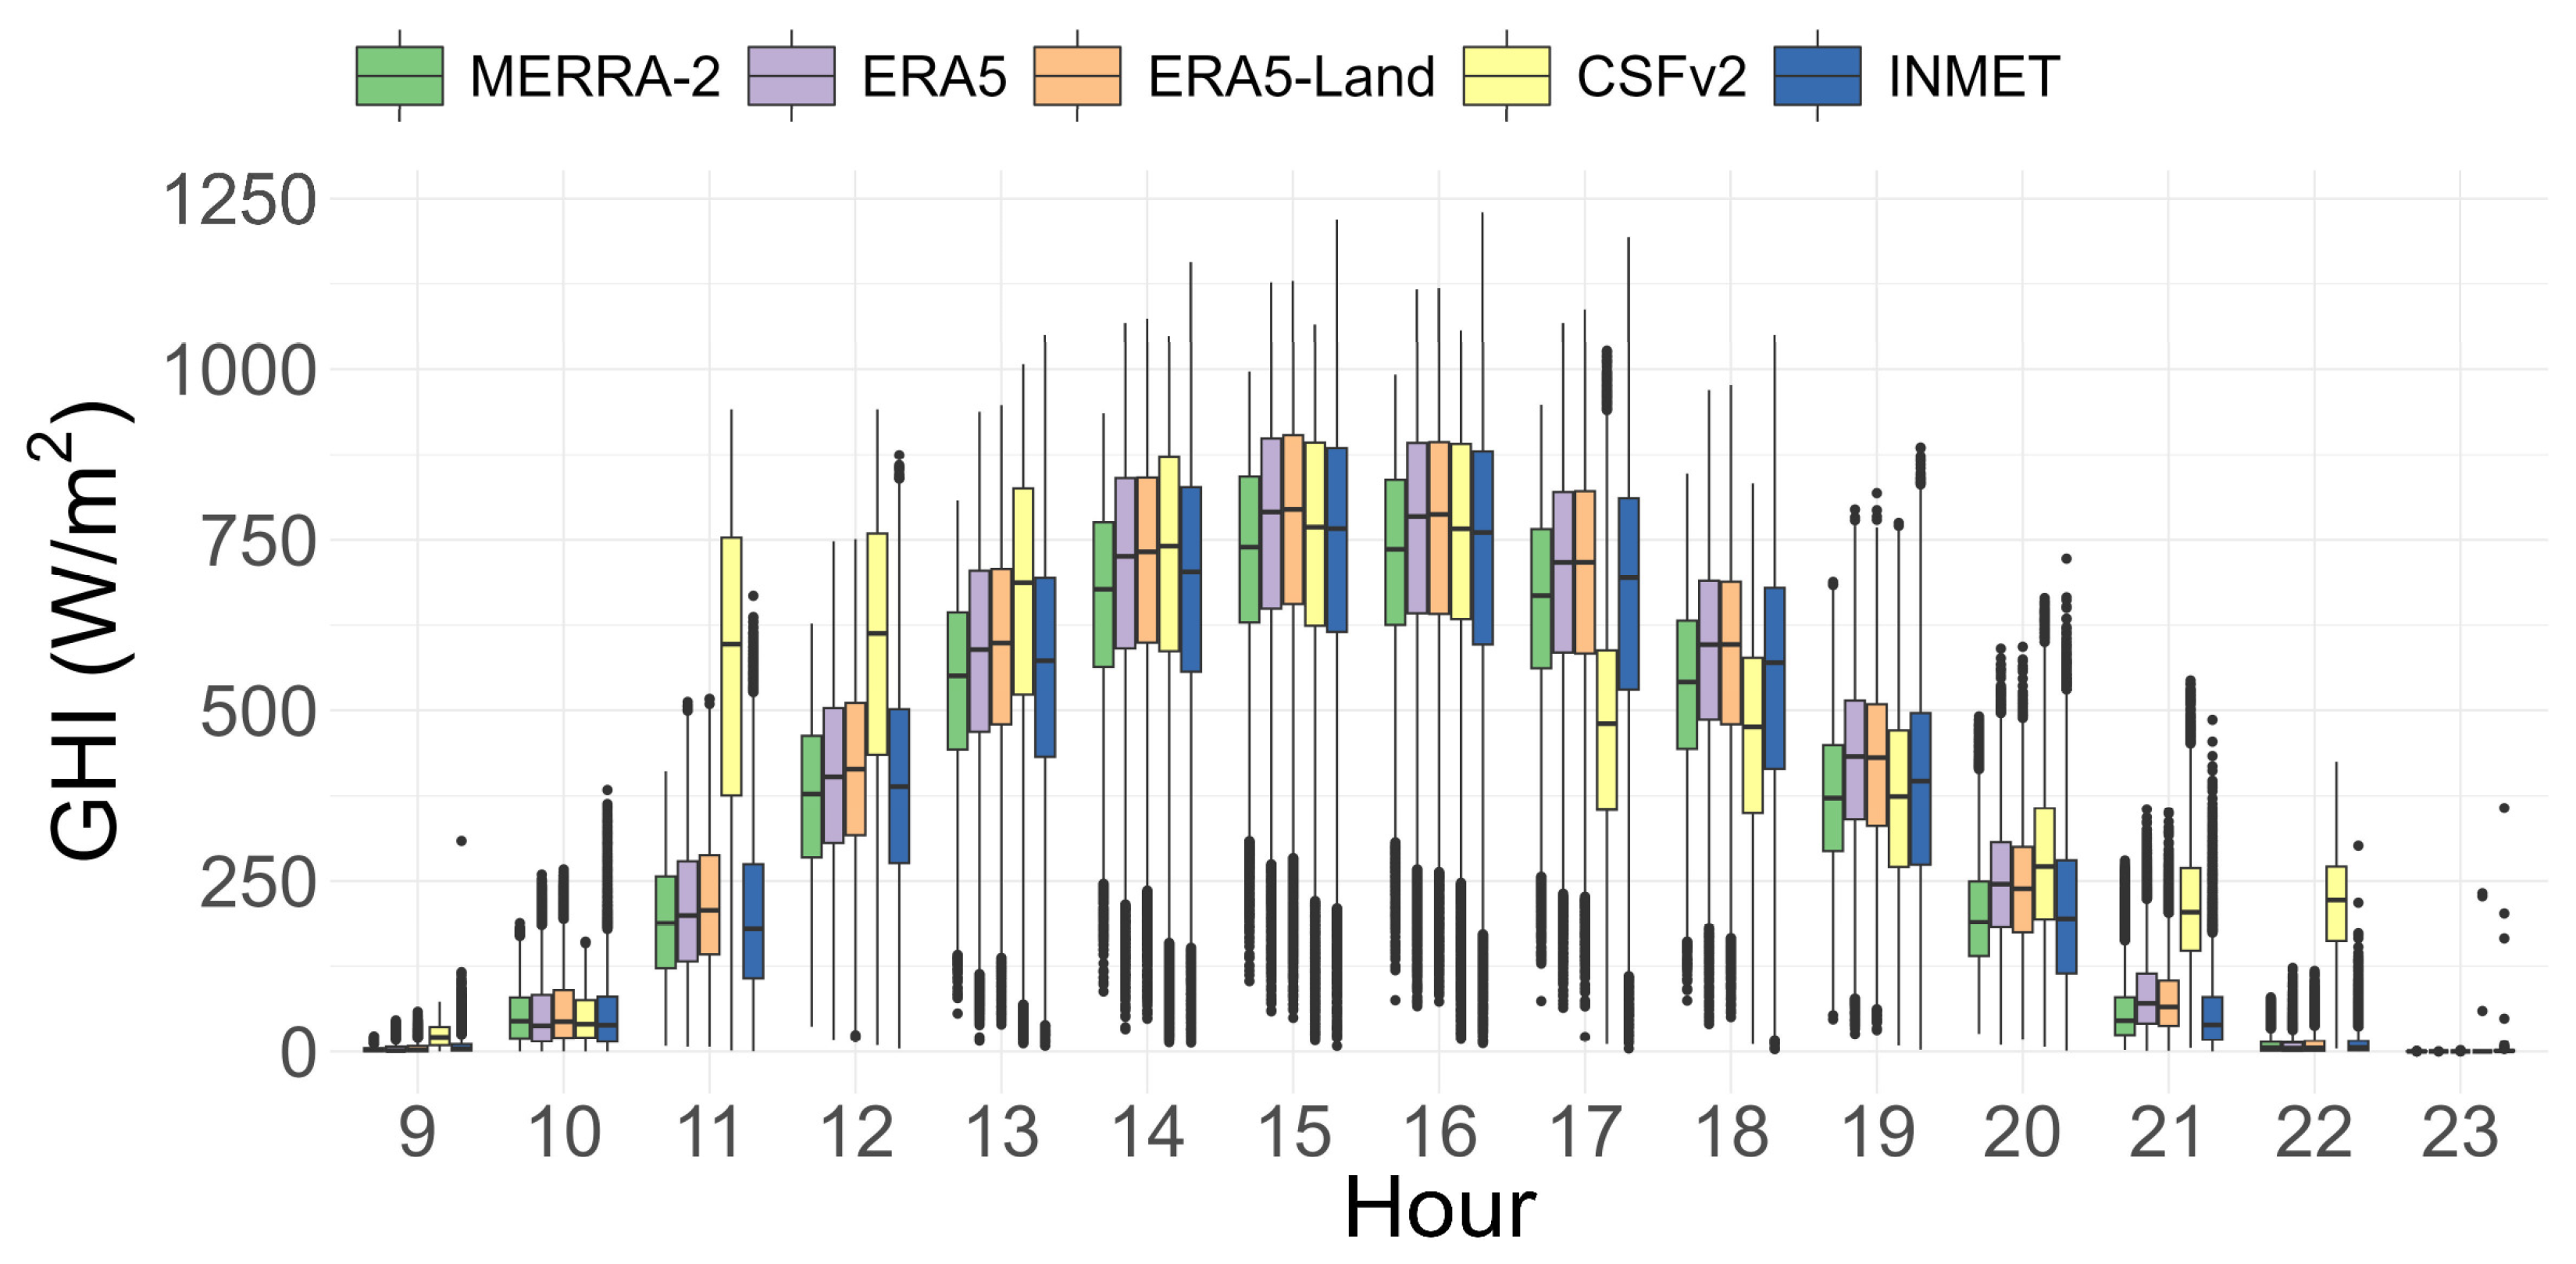
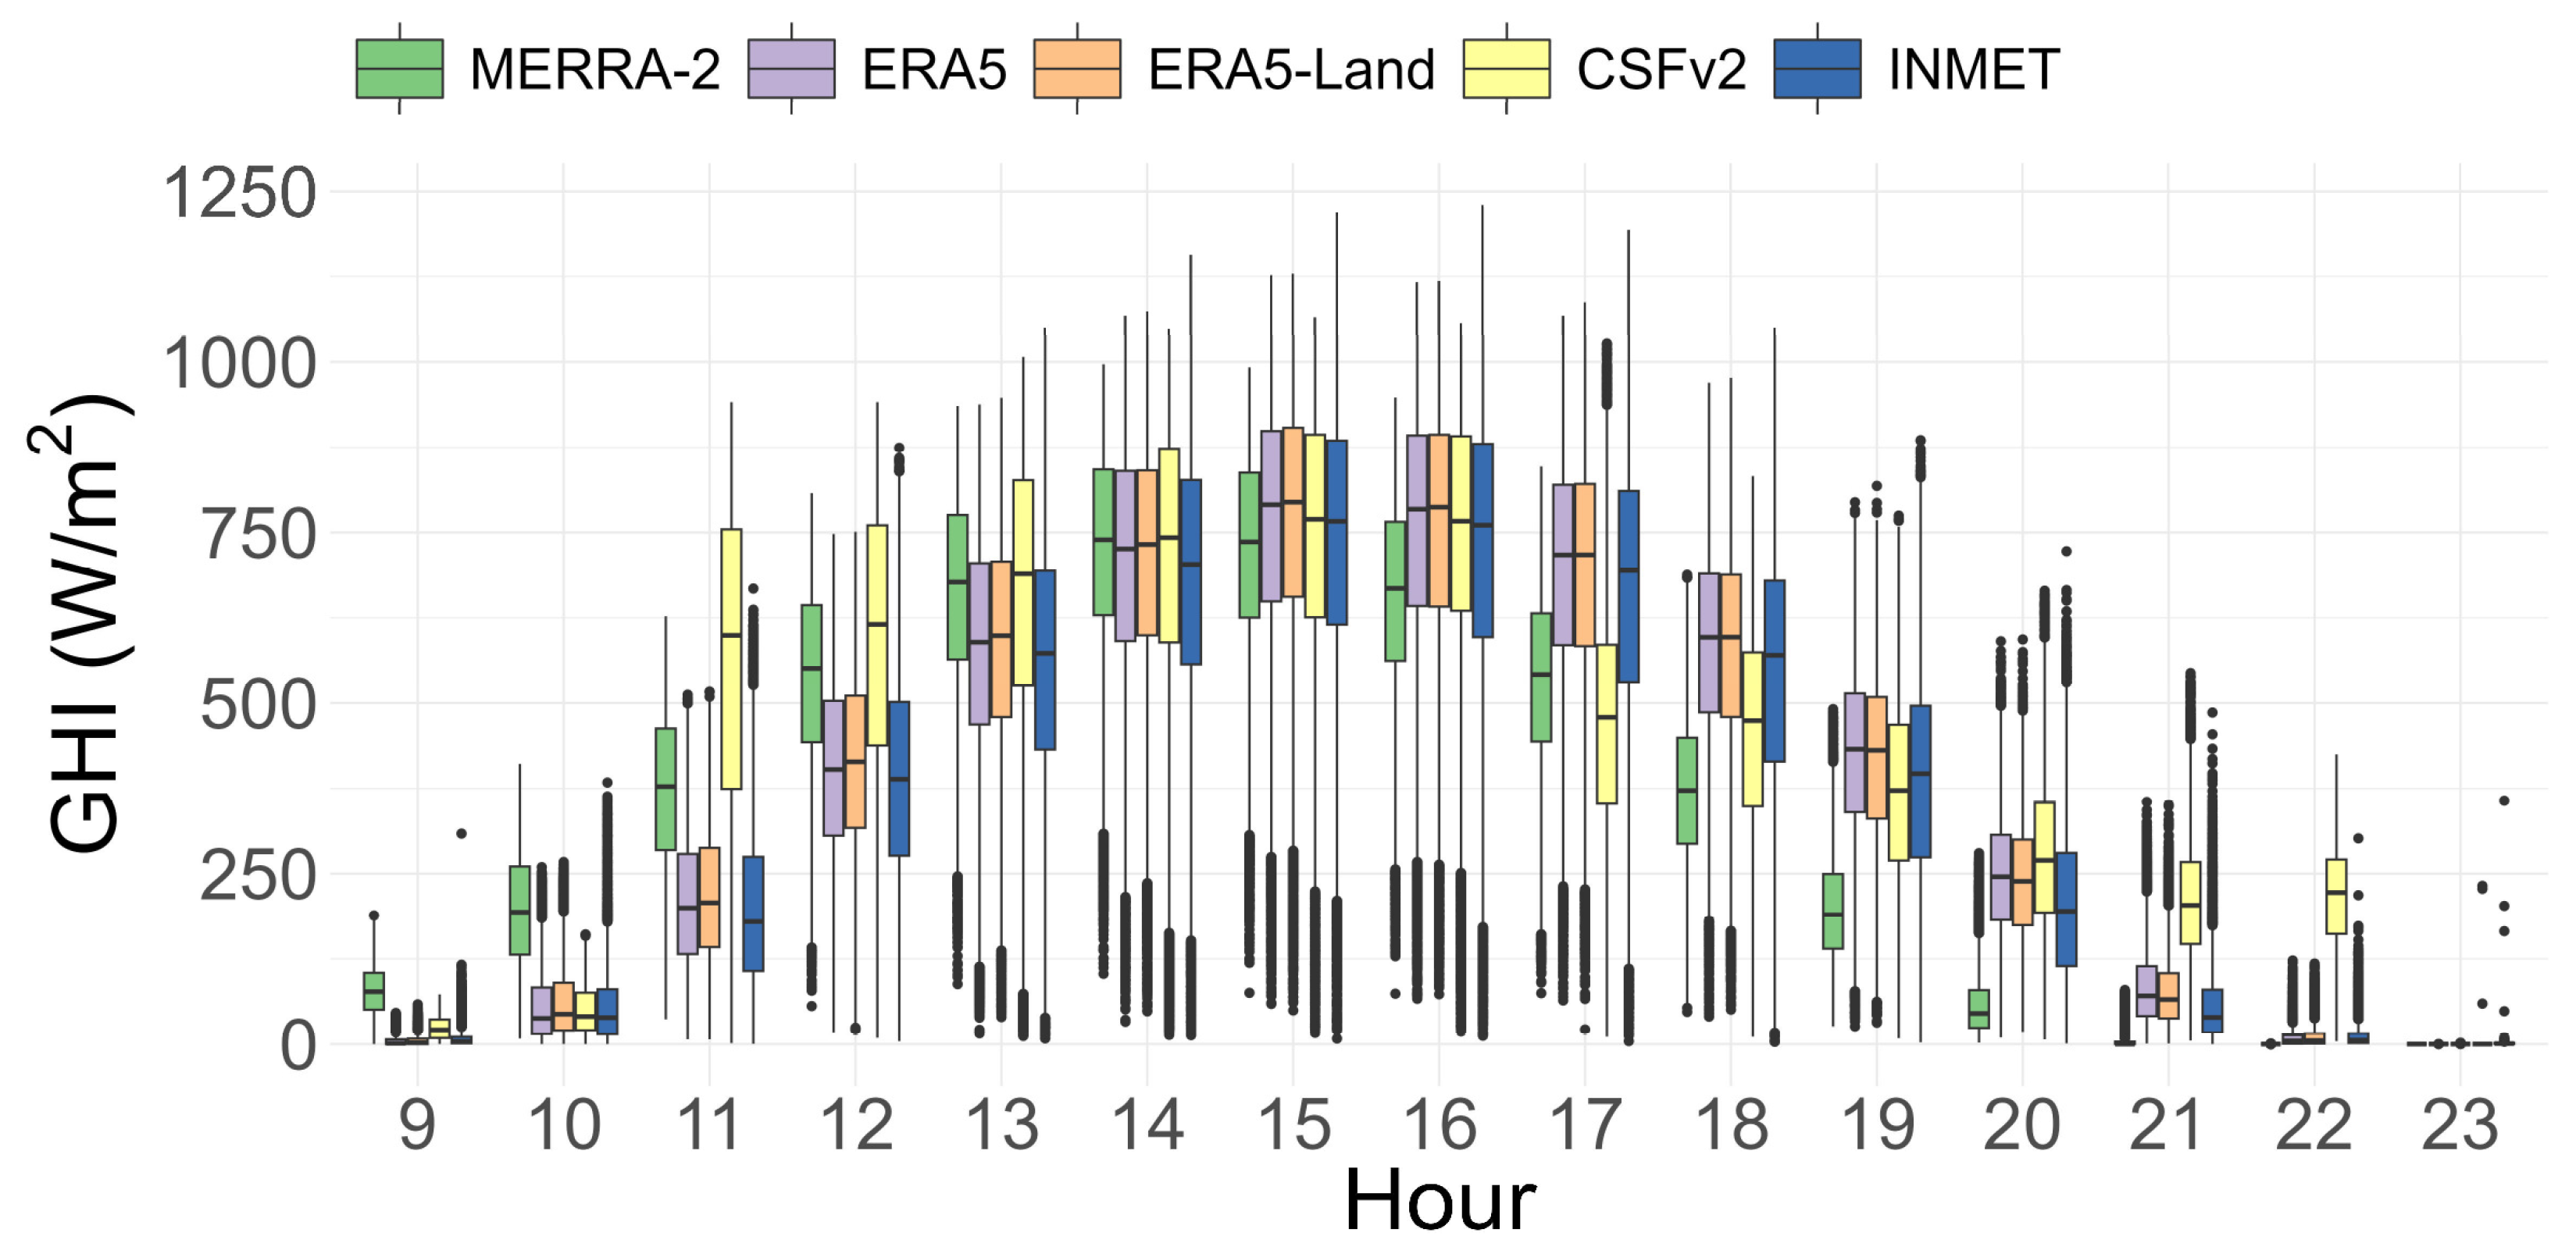
The data from the reanalysis databases needed to be processed due to the way they were available. MERRA-2 provides hourly GHI data in W/m2. For this database, it was not necessary to perform any unit conversion. However, as shown in Figure 2, INMET, ERA5, ERA5-Land, and CSFv2 consider the GHI at the end interval, i.e., 1:00, 2:00, etc. In contrast, MERRA-2 considers GHI centered on the half-hour (00:30, 1:30, etc.), so the adjustment was necessary to align the GHI profiles of all bases (Figure 3).
Furthermore, the GHI from INMET is available in kJ/m2, and by multiplying by 1000, we obtained the Ws/m2. Since the GHI is over 1 h, the value had to be divided by 3600 s to transform to W/m2. The negative values (during nighttime) were replaced by zero. In the case of ERA5, the GHI is presented in J/m2, and W/m2 was obtained by dividing the value by 3600 s. For ERA5-Land, the available GHI is the accumulated value over the day, so, first of all, it was necessary to calculate the hourly value (GHIh—GHIh-1) and then convert it to W/m2. For the CSFv2 dataset, the GHI did not need any conversion since it is already presented in W/m2.
To perform the data analysis, the zero values observed during the period without solar irradiation, i.e., the night period, were not considered.

2.3. Evaluation

Some authors [33,45,63,64] have presented usual statistical indicators to measure the performance of reanalysis datasets compared with ground measurements. The metrics used in this work are mean bias error—MBE (Equation (1)), mean absolute error—MAE (Equation (2)), root mean square error—RMSE (Equation (3)), relative mean bias error—rMBE (Equation (4)), relative mean absolute error—rMAE (Equation (5)), relative root mean square error—rRMSE (Equation (6)), and Pearson correlation coefficient—PCC (Equation (7)).
M B E = 1 n i = 1 n ( G H I r , i G H I m , i )
M A E = 1 n i = 1 n G H I r , i G H I m , i
R M S E = 1 n i = 1 n ( G H I r , i G H I m , i ) 2
r M B E = M B E G H I ¯ m × 100
r M A E = M A E G H I ¯ m × 100
r R M S E = R M S E G H I ¯ m × 100
P C C = i = 1 n ( G H I m , i G H I ¯ m ) ( G H I r , i G H I ¯ r ) [ i = 1 n ( G H I m , i G H I ¯ m ) 2 ] [ i = 1 n ( G H I r , i G H I ¯ r ) 2 ]
where G H I m , i , and G H I ¯ m are the global radiation measured value and the corresponding average; G H I r , i , and G H I ¯ r are the estimated values of the reanalysis dataset and their average, and n is the total number of observations in each time series. The index m indicates the measured value, r indicates the reanalysis or estimated value, and i indicates each observation.

3. Results

Figure 3 depicts the hourly aggregated GHI behavior of all the reanalysis datasets compared to the GHI observed at the INMET meteorological stations after the data treatment. CSFv2 shows values that are far from the average of the other datasets in the first and last hours of the day, as well as greater dispersion. MERRA-2 shows the least dispersion throughout the hours. The average values from ERA5 and ERA5-Land have a very similar pattern and are higher than the hourly average of the measured data, while the MERRA-2 values are lower.
Table 2 presents the descriptive statistics of all databases. Concerning the means and standard deviations, ERA5 and ERA5-Land are close to the observed values, but the median values are different. MERRA-2 has a lower standard deviation, which corroborates what was visualized in the hourly boxplot (Figure 3).
Concerning the calculated metrics, Figure 4 presents the boxplot of the relative metrics average to allow comparison of the results between the datasets. MERRA-2 presents the smallest errors for rMBE, rMAE, and rRMSE. The relative metrics present the value in terms of the measured values average, facilitating reanalysis database comparisons. All the tables and graphs in this section show the relative metrics.
Table 3 summarizes the results of rMBE, rMAE, rRMSE, and PCC. It is possible to see, where rMBE is evaluated considering the mean, that MERRA-2 has the lowest value while ERA5 has the best result considering the median. For the rMAE values, MERRA-2 has the best value for both the mean and the median, which is also observed for rRMSE and PCC.
A negative value of MBE and rMBE means that the reanalysis dataset has been underestimated, and a positive value indicates that it has been overestimated. On the other hand, the MAE and the rMAE consider the modulus of the difference between the observed and the estimated data (reanalysis). Unlike MBE and rMBE, MAE and rMAE do not disguise the error because the negative values do not cancel the positive ones, thus avoiding a false impression of the error being smaller than it is. To complete the error metrics, the RMSE and rRMSE give greater weight to the largest deviations since they consider the square error in the calculation before the mean and the square root are calculated. The RMSE and rRMSE increase considerably when the data variation is high and when there are outliers in the series. For GHI, the values during the day have great amplitude, and if the temporal fit is not done properly, the bias that exists in the reanalysis databases can increase, affecting this metric.
Table 4 shows the five best results (in blue), and Table 5 the five worst (in red). It is worth highlighting that the best values for rMBE are the absolute values because the purpose is to find the smallest difference between the observed and the estimated datasets. Regarding PCC, the best result is the highest value found comparing the four reanalysis datasets for each station analyzed.
In Table 4, the lowest rMBE (−0.09%) was observed at station A306 for the ERA5 reanalysis dataset. For the rMAE, station A402 presents the lowest error (21.01%) for the MERRA-2; station 429 has the lowest rRMSE value (43.48%) for MERRA-2; and station A336 presents the highest PCC (0.9488), also for MERRA-2.
Analyzing the worst results obtained (Table 5), station A705 appeared in the worst place for rMBE (39.32%) for the CSFv2 reanalysis dataset. For the rMAE, the worst result (62.89%) was for station A428, while in the case of rRMSE it had an error of 114.99%. For rMBE, the station A428 returned errors above 34% for all reanalysis databases.
Figure 5 shows the graphical representation of the rMBE from Table 4 and Table 5, giving a better idea of the difference between the best (Figure 5a) and worst (Figure 5b) results observed. By visual examination, station A402 exhibits the smallest errors, while station A428 has the greatest errors for all reanalysis datasets. All the calculated metric values are in Table A2 and Table A3.
MERRA-2 had the lowest MBE and rMBE at 14 stations, followed by ERA5 with the best rMBE at 11 stations, ERA5-Land showed the best rMBE at seven stations, and CSFv2 at only three stations. The results obtained for RMSE and rRMSE are very similar to the results returned for MAE and rMAE. MERRA-2 presented the lowest rRMSE in 33 localities and ERA5-Land in the other 2. For rMAE, MERRA-2 presented the lowest value in 32 localities and ERA5-Land in the other 3.
Pearson’s correlation coefficient helps to identify how close the observed values are to the corresponding reanalysis datasets. For all datasets, the PCC values were strongly positive, over 0.81 (Table A3). MERRA-2 leads with 33 higher values, ranging from 0.8999 to 0.9488, and ERA5-Land is in second place with only two best results, varying from 0.8261 to 0.9427. Although ERA5 and CSFv2 do not have any best value for either station, the coefficients are not that bad. ERA5 ranges from 0.8144 to 0.9268, and CSFv2 from 0.8112 to 0.8975.
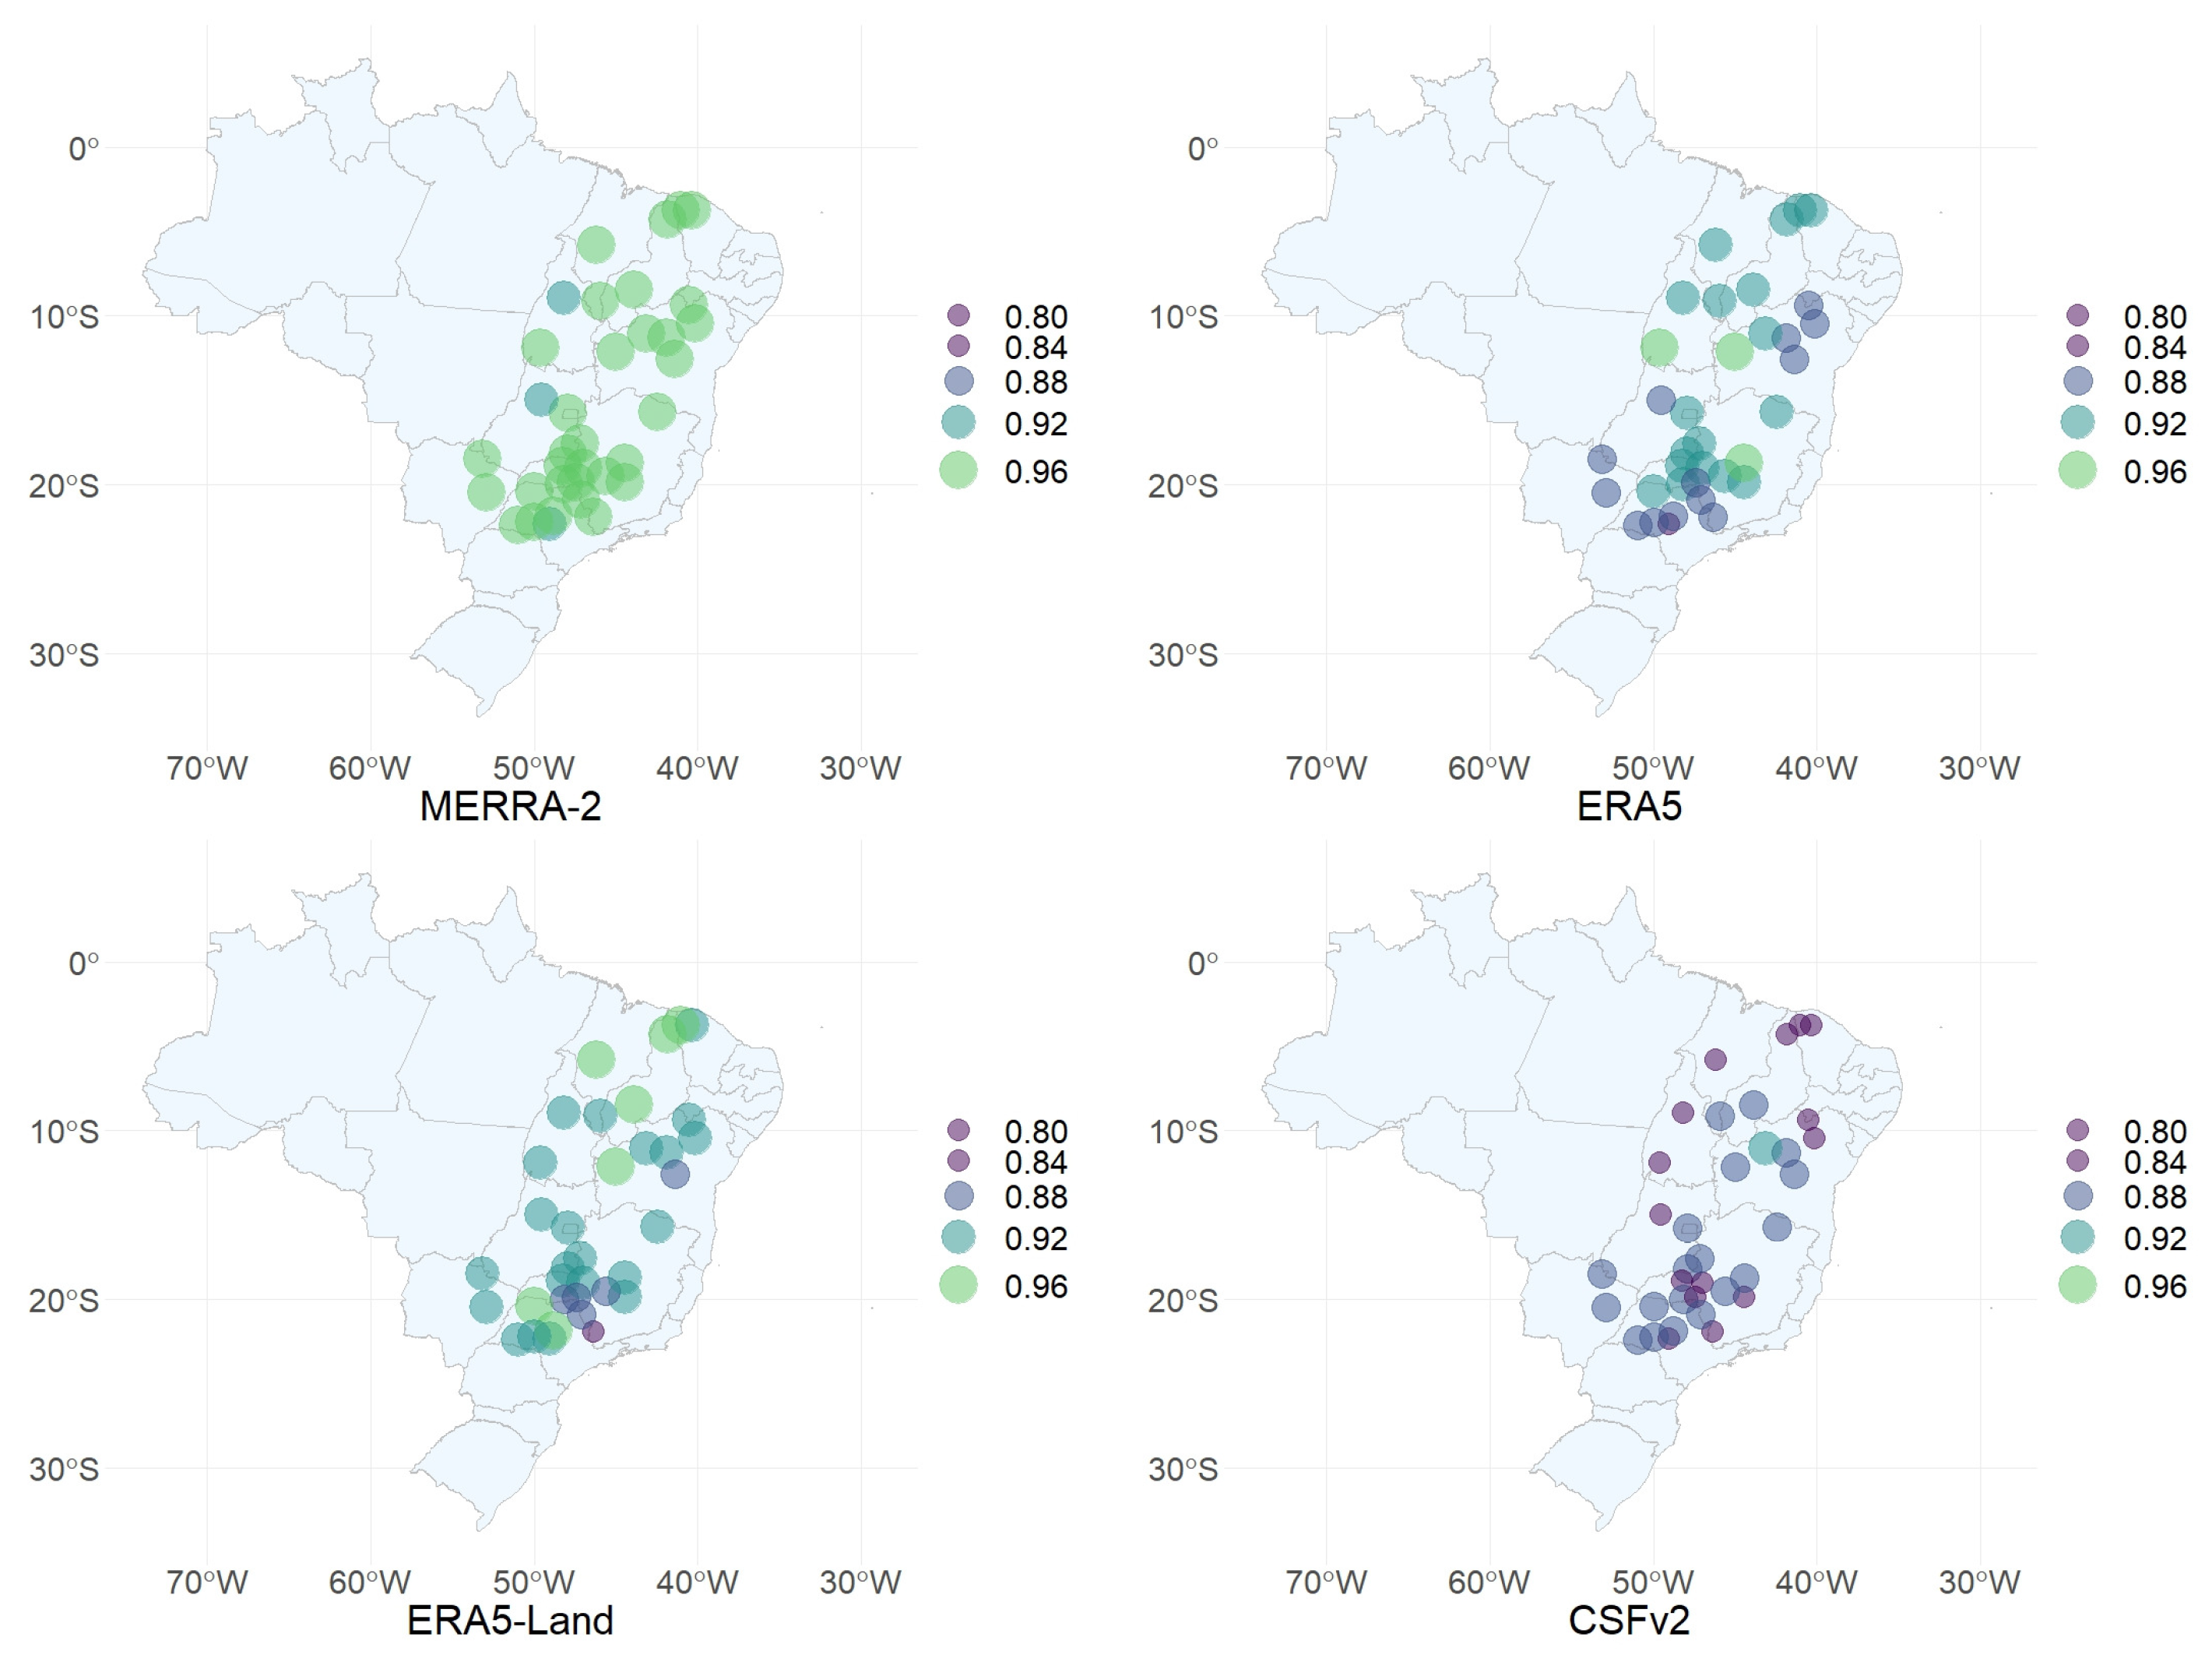
To get an overview of where the best-performing stations are geographically located, Figure 6 shows the PCC. For MERRA-2, the best results are located next to the coast in the Northeast and Southeast regions of Brazil. For the ERA5-Land, ERA5, and CSFv2, the best PCC was obtained in a more central band within the analyzed area.
In summary, for rRMSE the best values are from 43.48% to 78.76% (difference of 35.28 percentage points), showing for some stations that the error between the observed GHI and the reanalysis is rather large. Considering the rMAE, the error variation is smaller compared to rMBE and rRMSE, whose best values go from 21.01% to 41.32% (20.31 percentage points). For rMBE, the range is −6.02% to 34.95% (40.97 percentage points). The error amplitude decreases when the five stations with the worst results are removed.
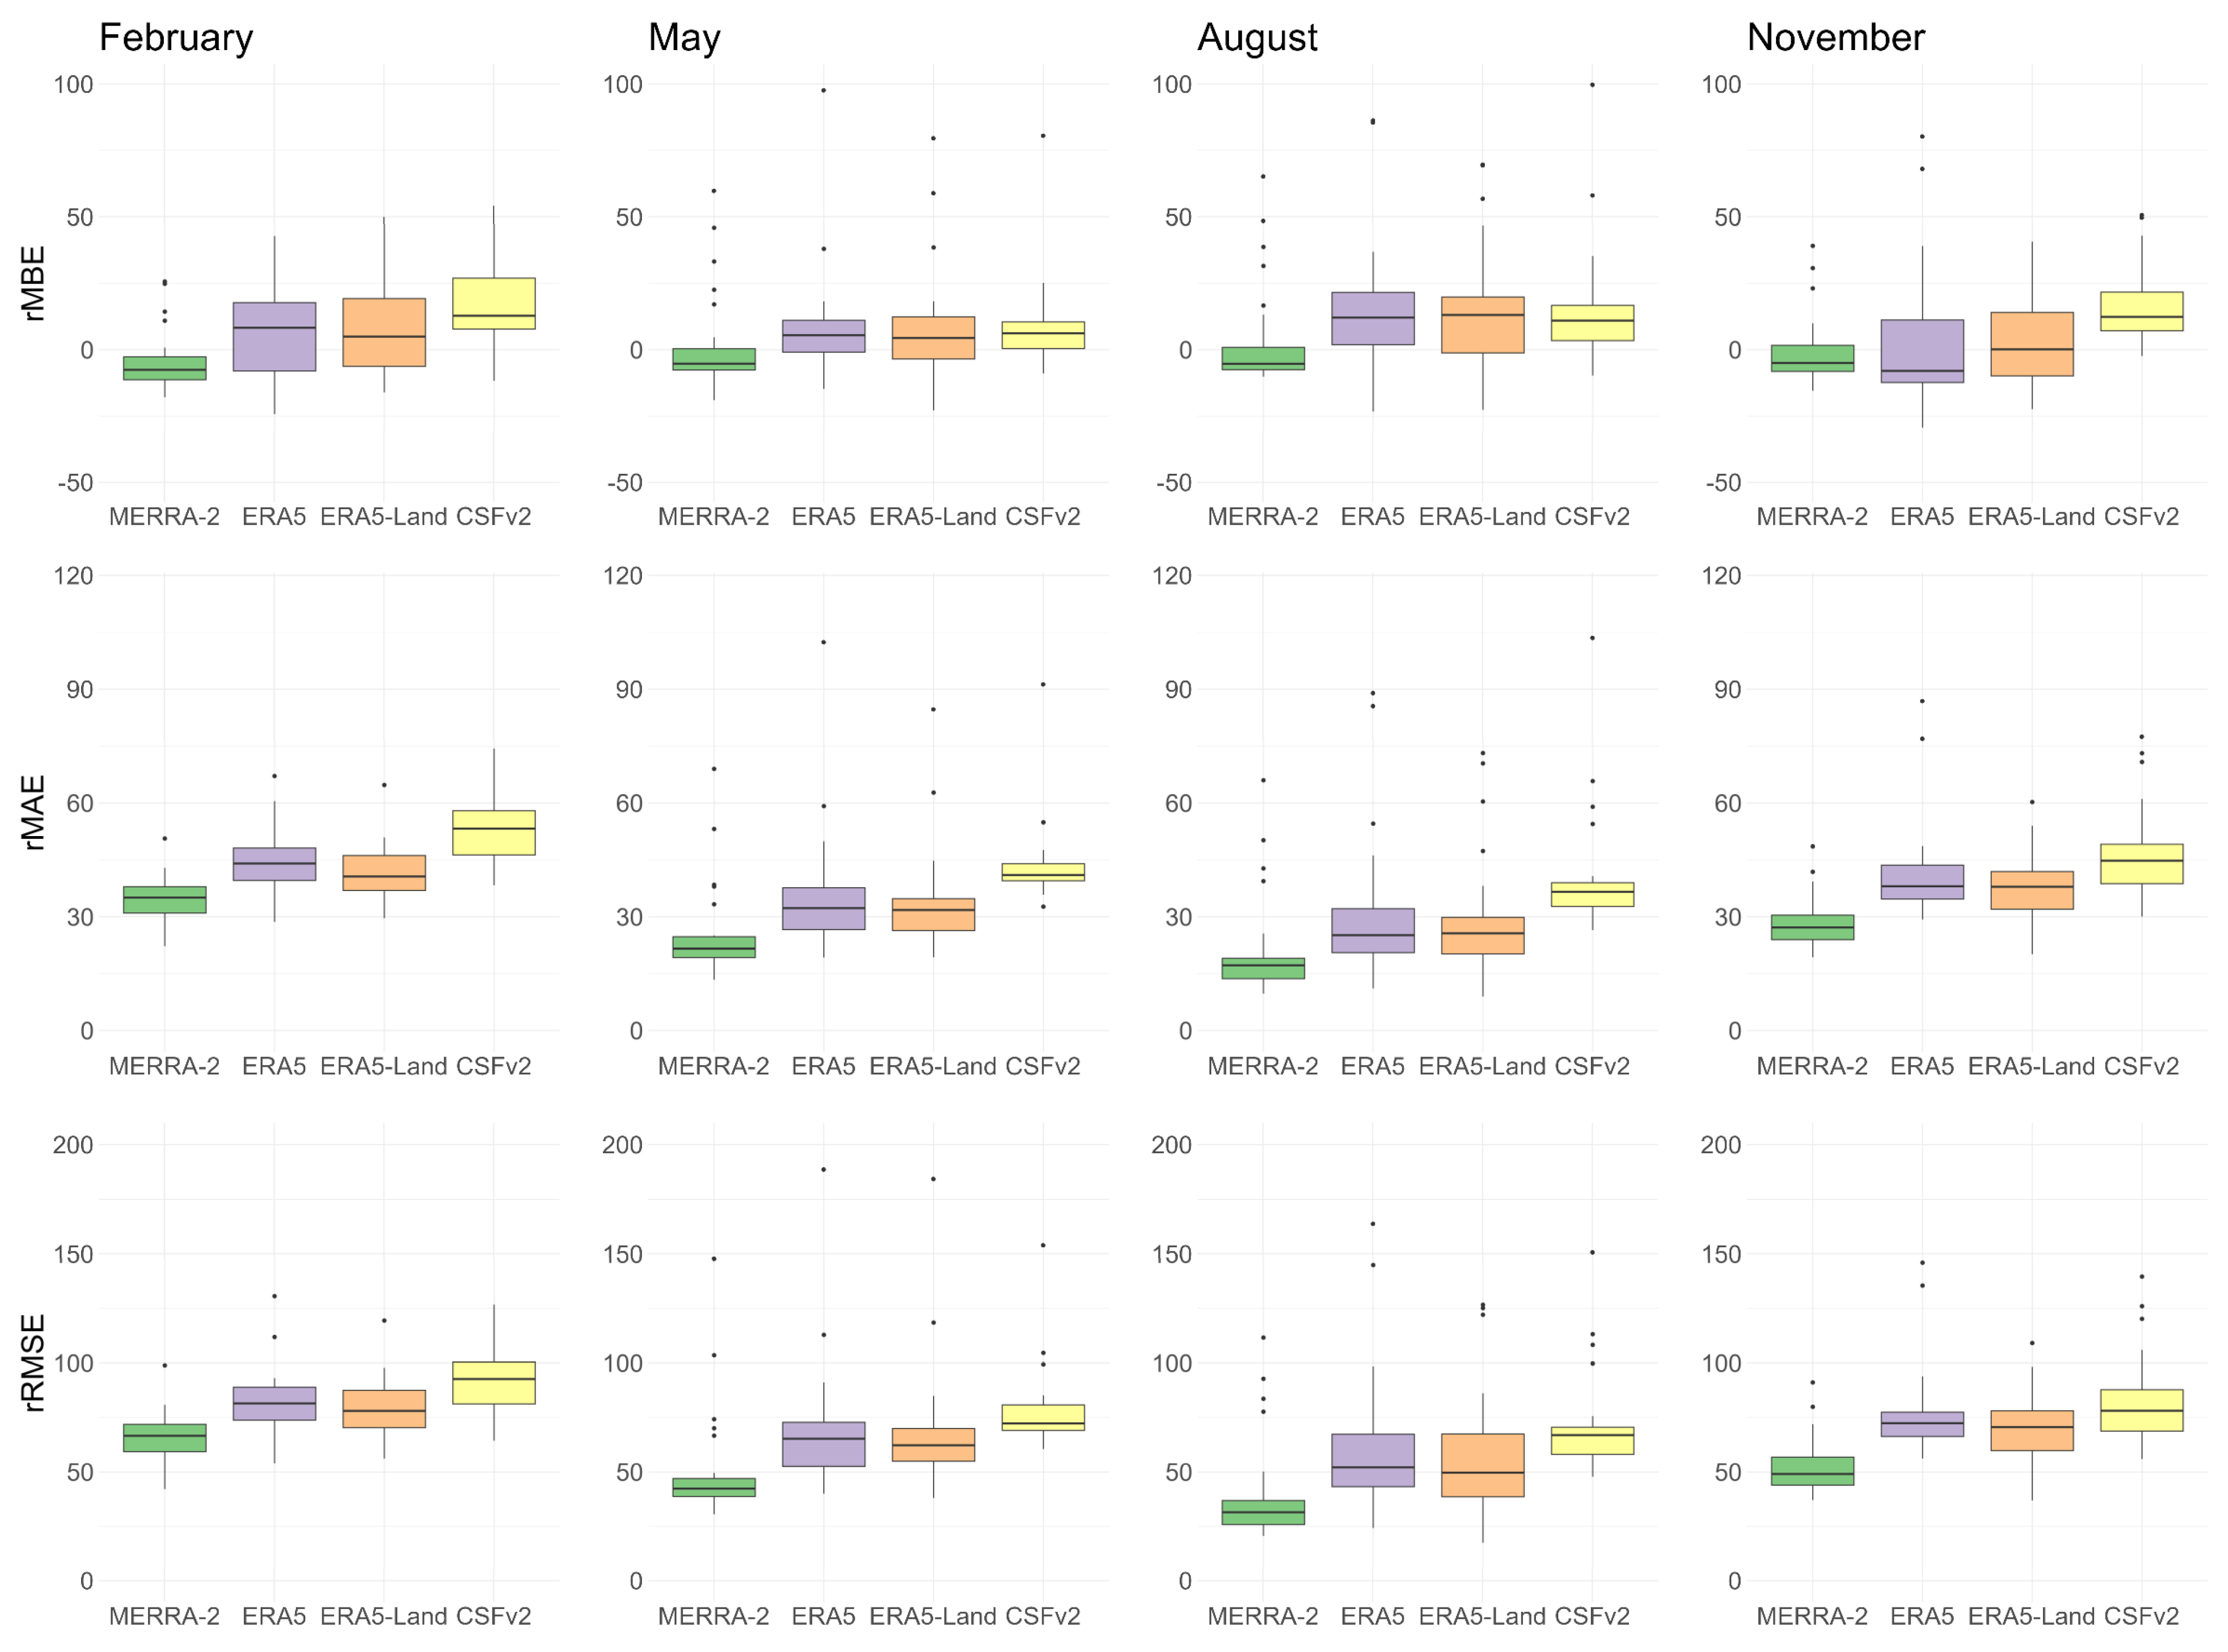
Looking at the monthly error helps to ascertain whether the reanalysis databases reflect GHI behavior for 2020. Since Brazil is located mainly in the Southern Hemisphere, with large areas near the Equator, the seasons are not as well defined as in some countries in the Northern Hemisphere. Figure 7 displays the metrics’ behavior during the seasons. February in summer, May in autumn, August in winter, and November in spring. MERRA-2 shows the smallest error range in all months analyzed. Table A4 shows the mean and the median metrics for all months. ERA5 and ERA5-Land do not represent the GHI well for August, September, and October.
According to the results for the analyzed metrics, MERRA-2 performed better, but ERA5 and ERA5-Land also presented good results. Table A5 and Table A6 show the comparison of each reanalysis with the observed GHI, considering the mean and the standard deviation of the data by month. Table 6 summarizes the average of all stations’ data. The mean variation is no more than 5.25% for MERRA-2, ERA5, and ERA5-Land in the aggregated view. But when we analyzed the values month by month (Table A5 and Table A6), ERA5 and ERA5-Land showed more significant variations in September and October. Note that the values of reanalysis and measured GHI are very close, with percentage errors ranging between −6.04% and 20.10% for the mean and between −9.71% and 9.23% for the standard deviation. This indicates that the reanalysis replicates the GHI measured by INMET not considering CSFv2 (−6.04% and 15.32%), but for the standard deviation, there is no difference.
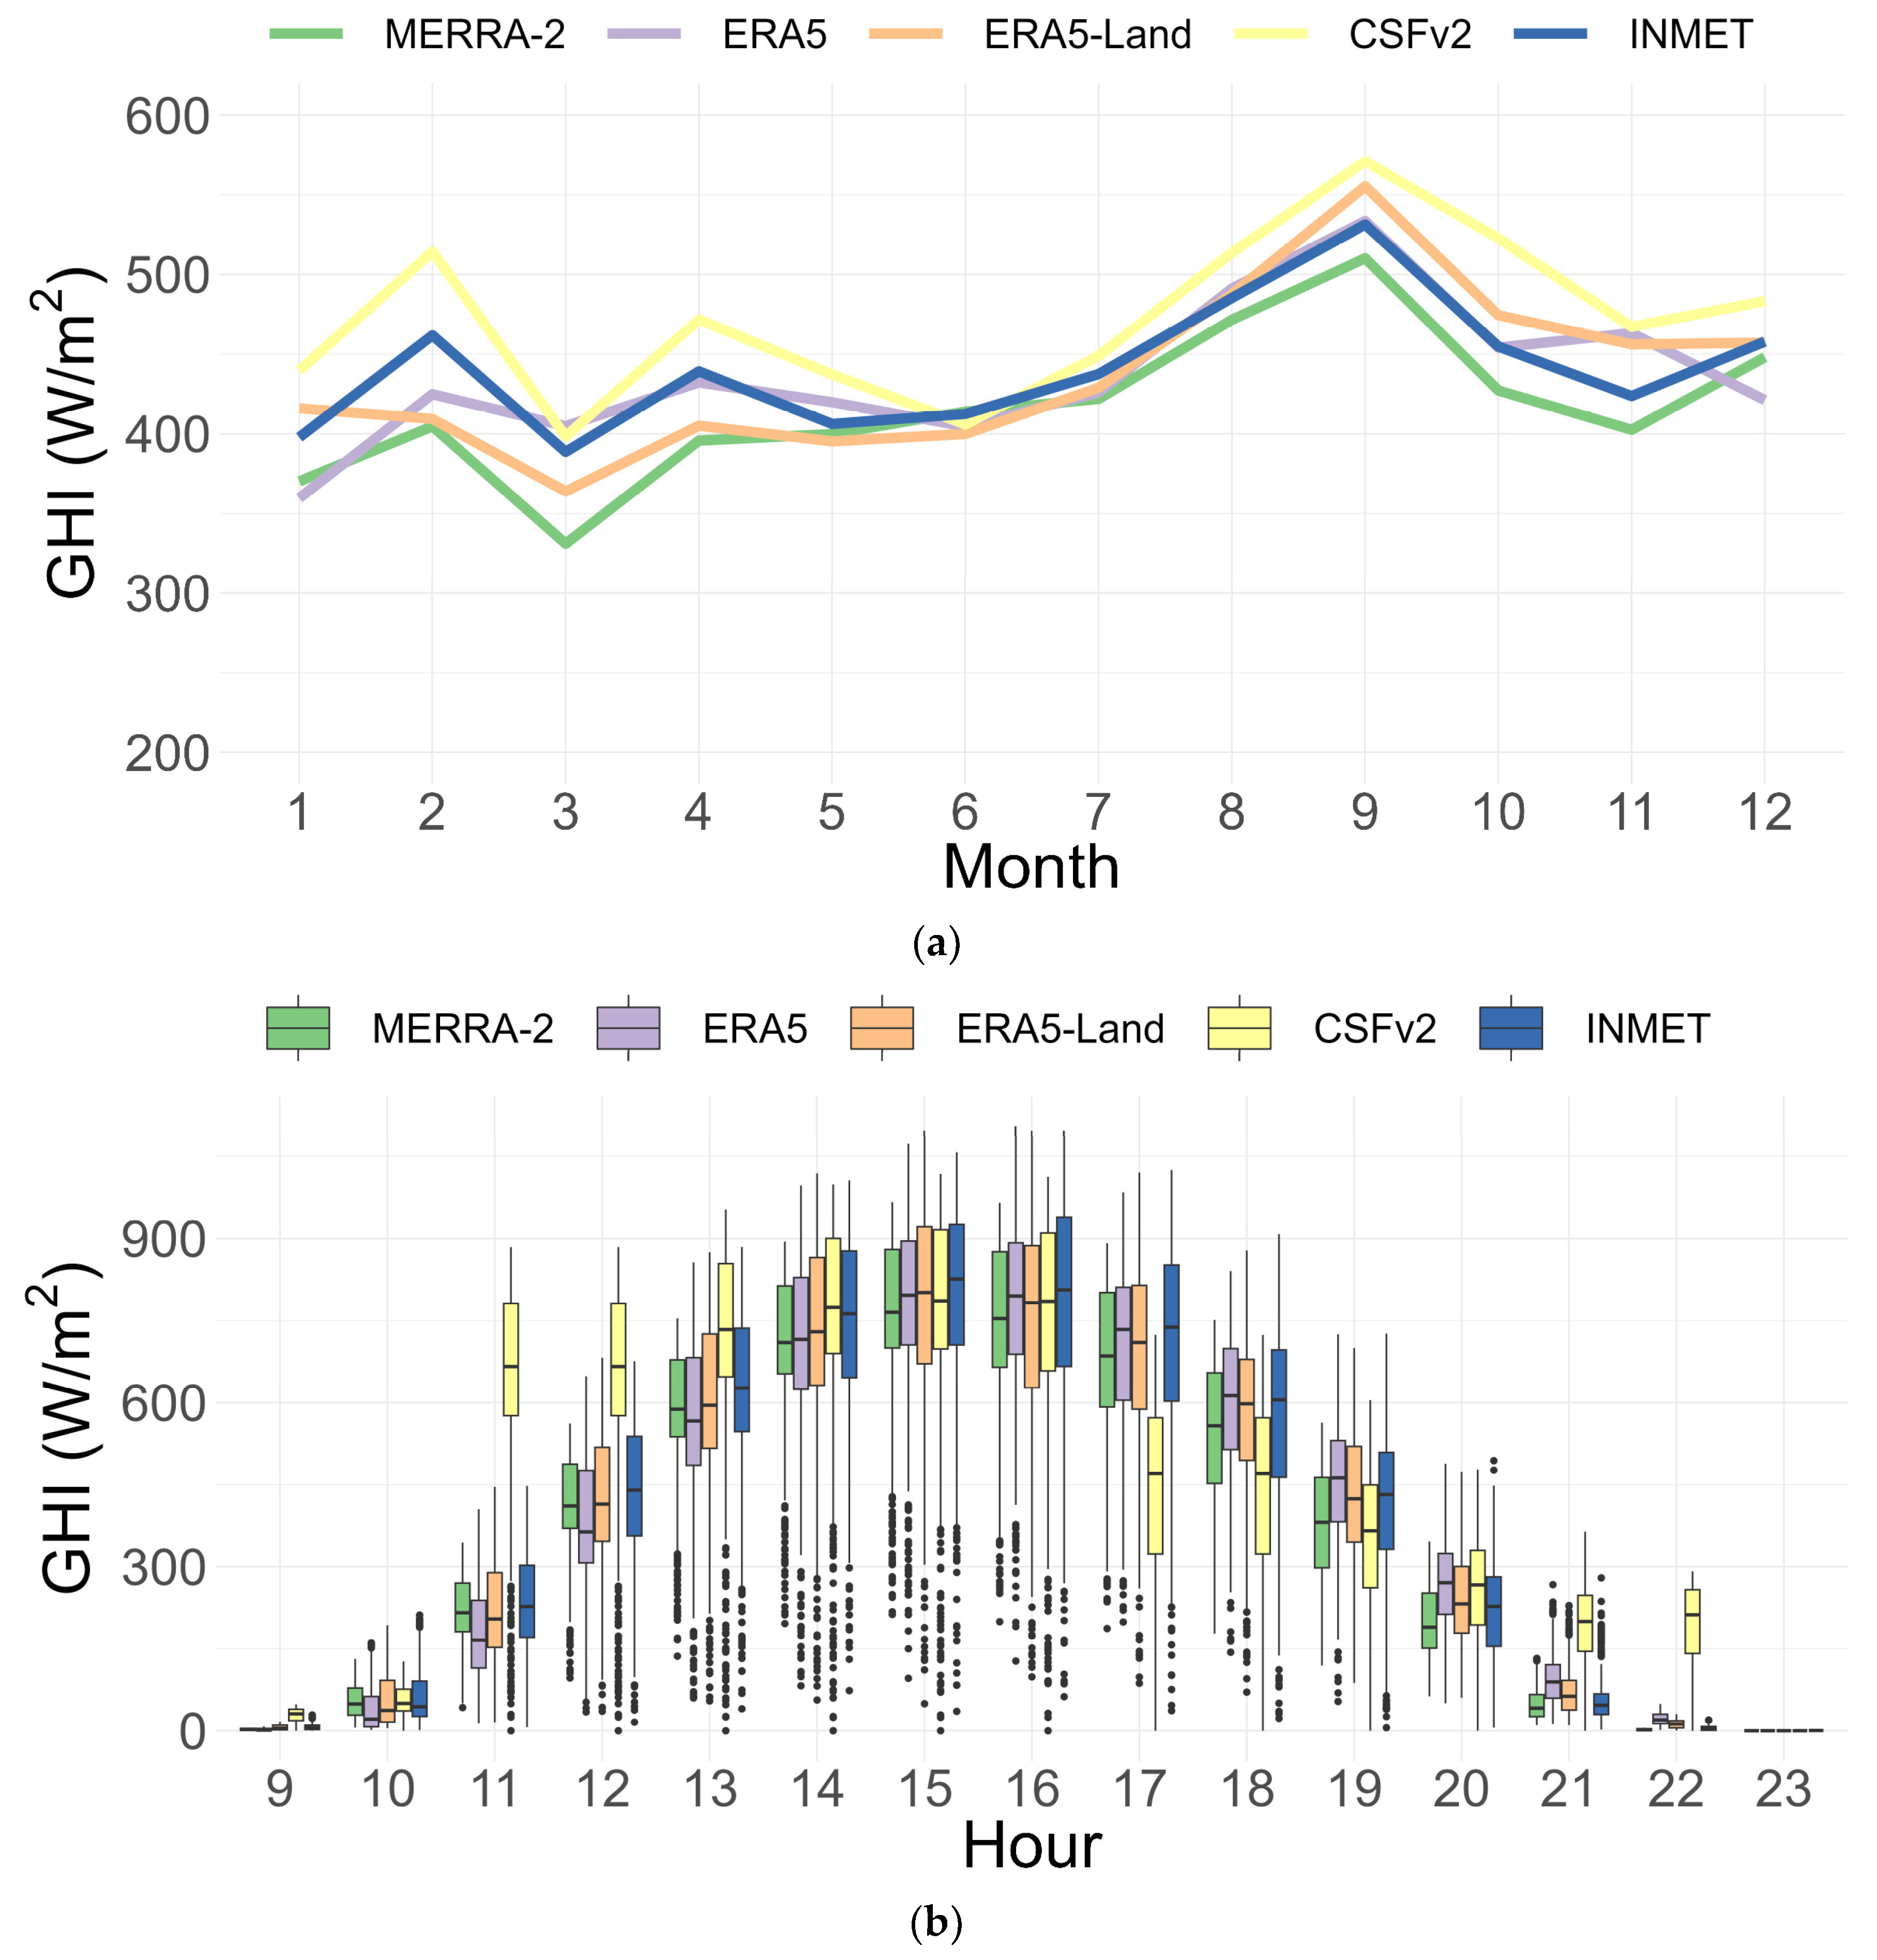
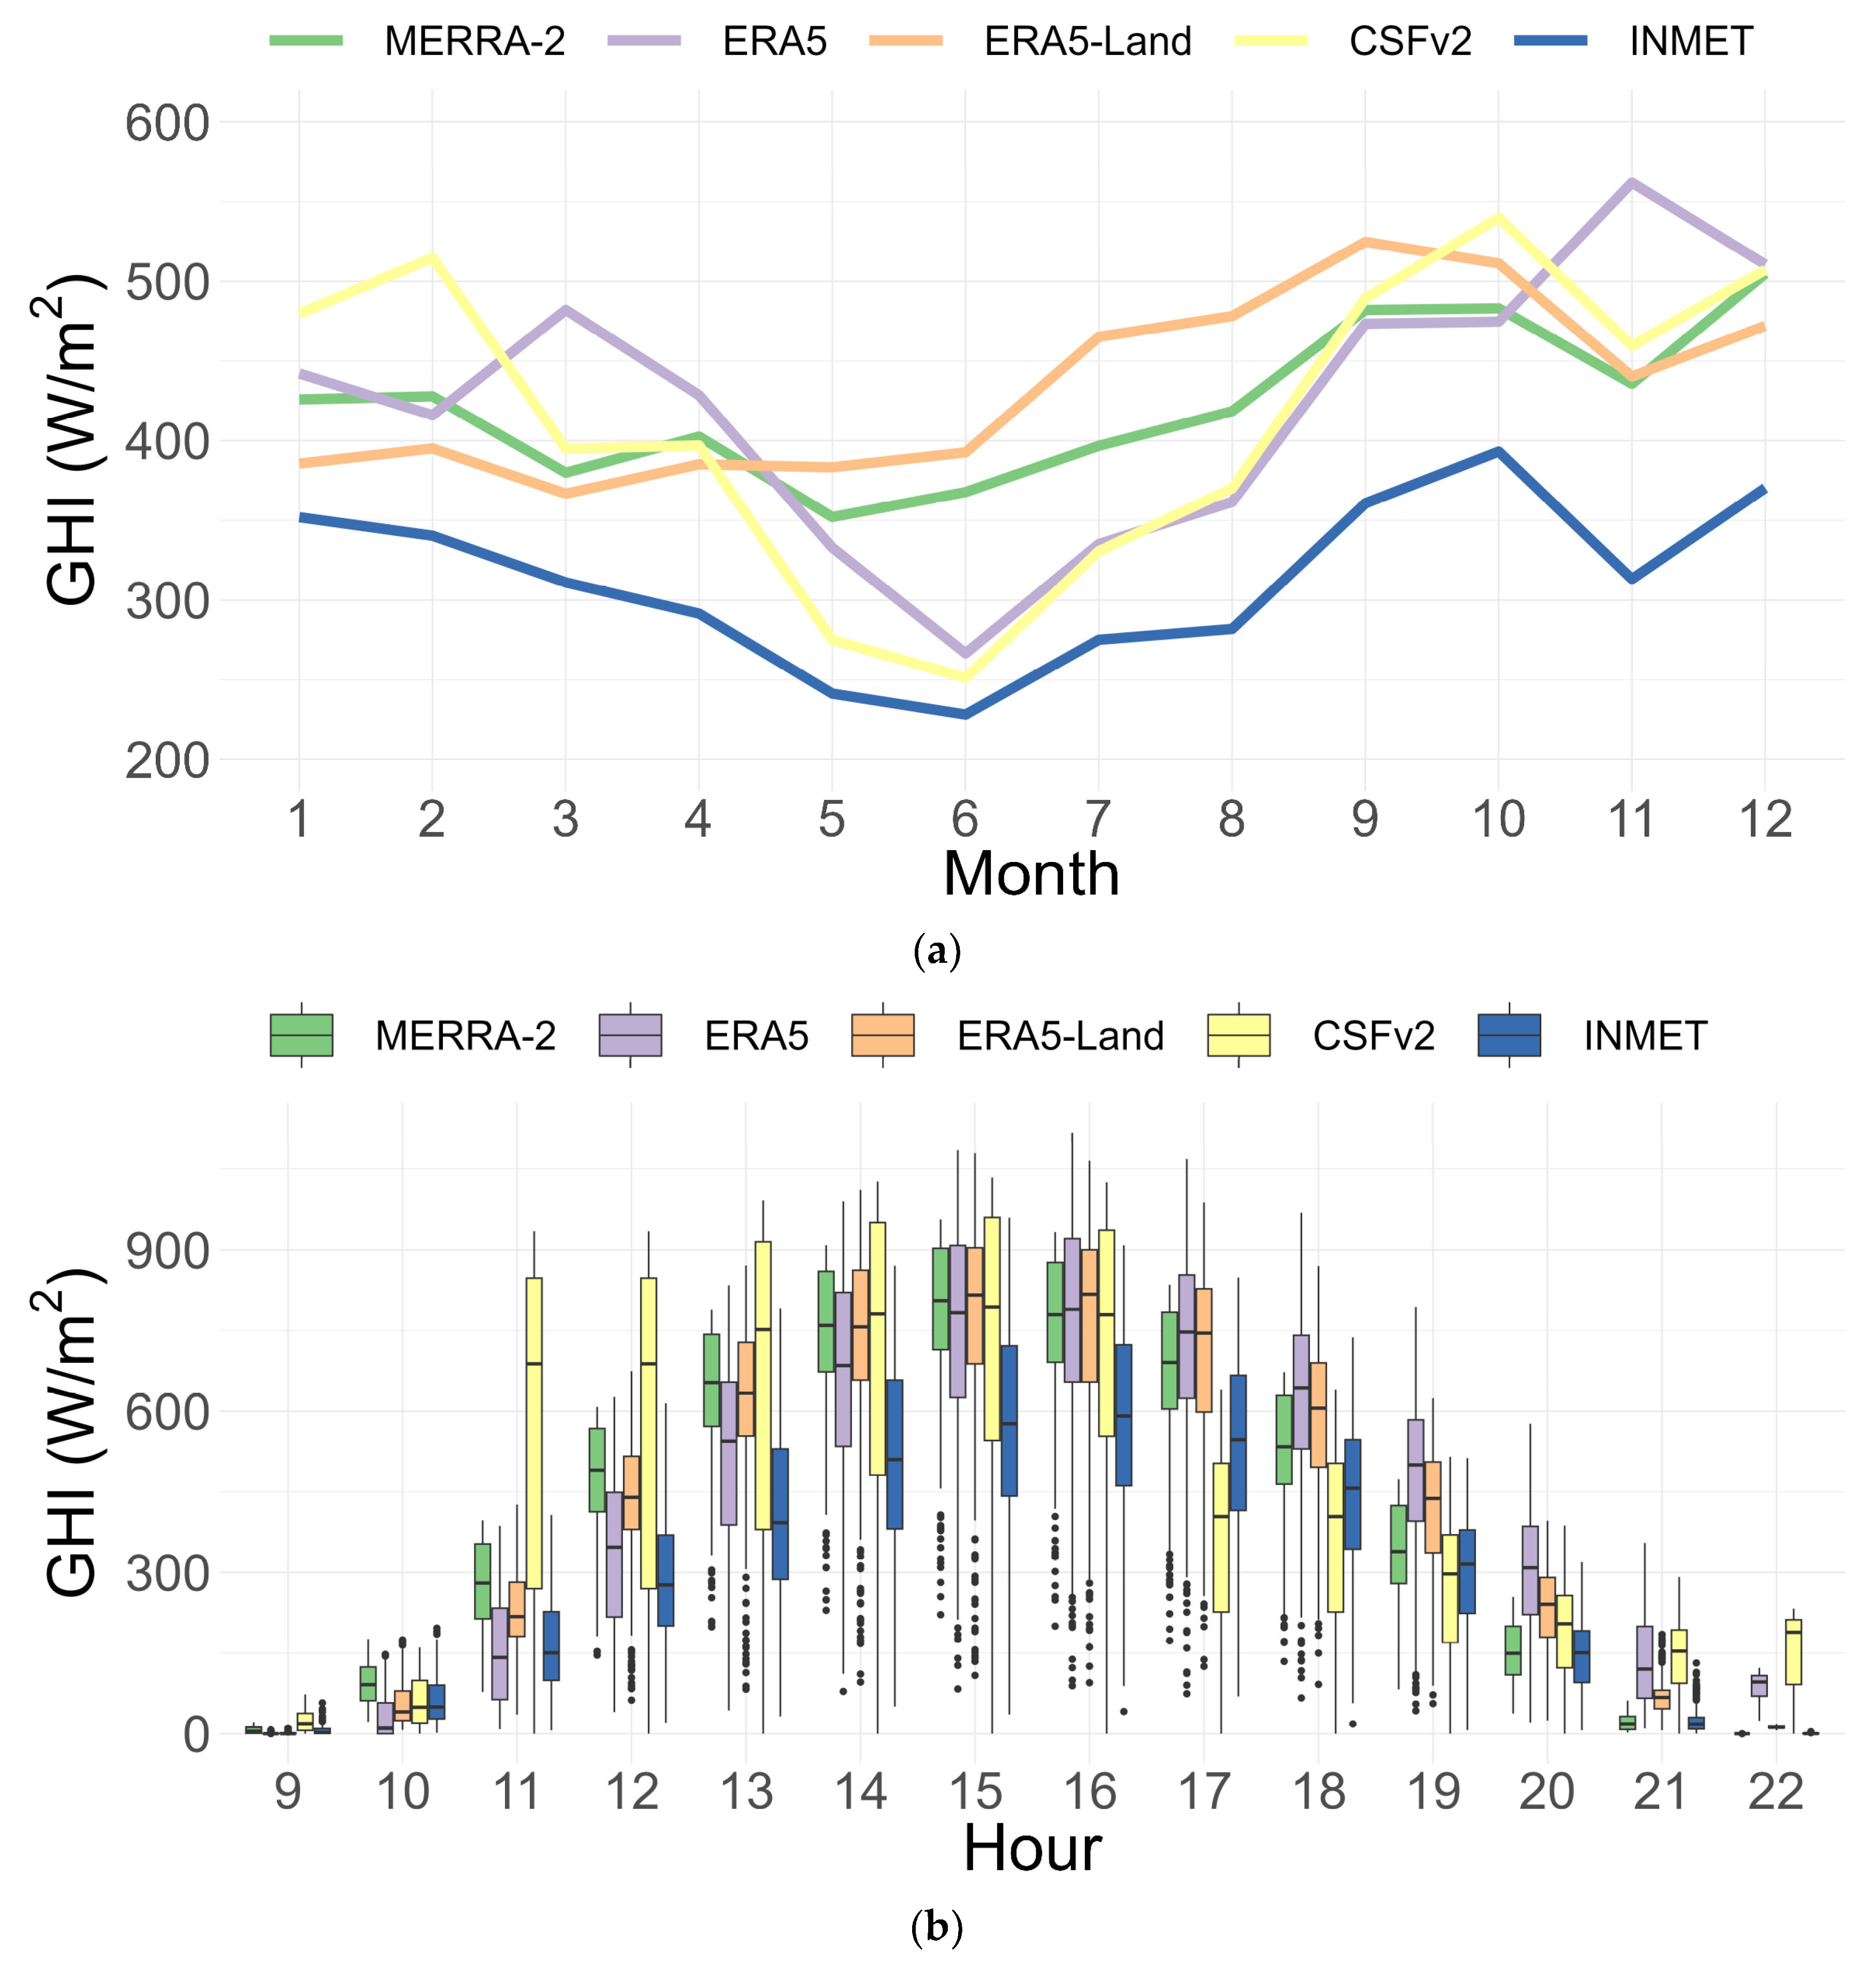
Figure 8a shows a good example of the monthly GHI for station A402, located in the municipality of Barreiras in the state of Bahia. This municipality had only 27 days of precipitation in 2020, concentrated mainly in January and February, and an average temperature of 25 °C [46]. MERRA-2, ERA5, and ERA5-Land all represented well the behavior of the GHI in this locality except for the CSFv2 database, which showed a significant difference in the first and last daylight hours (Figure 8b).
Station A428, which showed higher errors in all metrics, is an example where all reanalysis databases did not represent the locally measured GHI well (Figure 9a,b). This station is also located in Bahia, in the municipality of Senhor do Bonfim. The monthly average temperature was 23 °C in 2020 and there were 146 rainy days in that year. The wettest month was June with 23 rainy days. Neither of the reanalysis datasets was able to represent the locally measured GHI for this station properly.
The difference between these two examples is quite significant: the station with the best result (A402) is in a region with few rainy days, while the station with the worst result (A428) is in a region with many rainy days. This may indicate that the reanalysis bases are not reproducing the GHI properly on days with overcast skies. In addition, it is possible that station A428 could have sensor calibration problems. However, this information cannot be confirmed as there is no information on INMET’s website about poorly calibrated sensors, but it cannot be ignored.

4. Discussion

The primary goal of this study was to compare global horizontal irradiance (GHI) from different hourly reanalysis datasets with ground-based data from a public database. MERRA-2 consistently showed the lowest error and the highest correlation in most locations when compared to the GHI measured at 35 INMET stations across Brazil. These findings suggest that MERRA-2 provides the most reliable representation of GHI for Brazilian applications, although future studies could further validate this by examining more years of data.
Although ERA5-Land has a smaller grid, higher accuracy of the GHI values was not perceived for the studied localities. A limitation of this study was the use of the GHI obtained at the nearest geographic coordinate from the meteorological stations since the closest distance will not always adequately represent the region studied due to climate and geographical characteristics. An alternative approach would be to interpolate the GHI values from the four closest grid coordinates and compare whether this reduces the error found.
It was also observed that ERA5 and ERA5-Land had higher errors during August, September, and October—late winter and early spring in the Southern Hemisphere—when many regions of Brazil experience cloudy weather and frequent rainfall. This indicates that these databases may encounter difficulties in accurately modelling cloud cover and precipitation during these periods, emphasizing the necessity of accounting for seasonal variability in GHI predictions.
Another significant observation is that MERRA-2 underestimated GHI in 28 out of the 35 stations, while ERA5 (23 stations), ERA5-Land (27 stations), and CFSv2 (34 stations) overestimated GHI, which is consistent with the general behavior of reanalysis models in predicting solar irradiance.
According to Yang and Bright (2020) [26], ERA5 outperforms the results found for MERRA-2 in almost all the stations compared to BSRN stations, in contrast to what was found here. Looking specifically at the Petrolina and Brasilia stations located close to the stations studied by [26], for Petrolina (A307), ERA5 outperformed MERRA-2 for the rMBE, but for the rRMSE, this was not observed. In relation to the Brasilia station, again in [26], ERA5 outperformed MERRA-2 in both metrics, contrary to the results found here. It is important to note that our study used the year 2020 while [26] used all available data, and for these locations, there is no data available for 2020 in the BSRN dataset.
Salazar et al. (2020) [44], who only studied the BSRN Petrolina station, found that ERA5 outperformed MERRA-2, differing from our results. However, as mentioned by these authors [44], the results cannot be assumed to be true for other regions of Brazil without conducting additional studies (the same applies here). This is especially because Petrolina (A307) is one of the INMET stations with the worst results for all the databases studied in 2020.
The other difference observed in relation to the work conducted by [26] regards the preprocessing performed on the datasets. There, the authors considered that the data were aligned in relation to the timestamps, which was not the case here, as shown in Figure 2. This mismatch in MERRA-2 led to our decision to align the timestamps of all the time series, which may explain the difference in results since, before the adjustment, MERRA-2 had the worst results; this can be considered a limitation. Further exploration of the differences between the databases and their impact on reducing bias should be the subject of future studies.
Further research should focus on understanding why certain locations, such as A015, A207, A307, A428, and A705, exhibited larger errors. Nonetheless, our results indicate that GHI data from reanalysis databases, particularly MERRA-2, can be a valuable tool for Brazilian regions lacking ground-based measurements. Although our study is limited to the year 2020, the findings demonstrate the potential for these datasets to enhance solar energy forecasting, especially in areas where observational data are sparse or unavailable.

5. Conclusions

There are several reanalysis databases available on a global scale with different grids and temporal granularity. This study prioritized hourly reanalysis databases, but always the latest version available from each organization that produced global reanalysis data. From the results obtained, the CSFv2 dataset was not suitable to be used for applications with GHI in Brazil, since the errors found were very high compared to the other databases. We observed a pattern of high variations in the first and last hours of daylight that did not adequately describe the GHI locally measured. In contrast, MERRA-2 emerges as the most accurate in most cases, with ERA5 and ERA5-Land presenting good results except for June to October.
These findings contribute to the improvement of forecasting in the context of solar energy, offering a viable alternative in regions with limited climate variable measurements. Climate variables from reanalysis are a valuable source of data, not only for solar generation forecasting models but also for the imputation of missing data in incomplete time series.
Based on this, future studies could focus on selecting the reanalysis dataset that minimizes the error for the location under investigation. This approach would involve considering MERRA-2, ERA5, and ERA5-Land, not only as stand-alone options but also as a possible combination to obtain a more accurate representation of global horizontal irradiance (GHI).
When observing the monthly aggregated values, it is possible to notice seasonality, probably associated with the rainy and dry seasons and the cloudiness in each region. For further research, the calculation of monthly deviations and correlating the data with clearness and precipitation indices can contribute to analyzing data quality and allow a reanalysis of dataset choice that best reproduces the uncertainty of GHI according to the regional characteristic.
To extend the study and verify the applicability of the reanalysis databases by applying GHI as an input variable in forecasting models, it would be interesting to test all the datasets to forecast solar generation and compare the results obtained with the counterpart forecasts generated via GHI from ground measurements.

Author Contributions

Conceptualization, M.A.d.S.G.A., S.A., R.C.S. and F.L.C.O.; methodology, M.A.d.S.G.A.; software, M.A.d.S.G.A. and S.A.; validation, M.A.d.S.G.A., S.A., R.C.S. and F.L.C.O.; formal analysis, M.A.d.S.G.A.; investigation, M.A.d.S.G.A.; resources, M.A.d.S.G.A.; data curation, M.A.d.S.G.A.; writing—original draft preparation, M.A.d.S.G.A.; writing—review and editing, M.A.d.S.G.A., S.A., R.C.S. and F.L.C.O.; visualization, M.A.d.S.G.A.; supervision, R.C.S. and F.L.C.O.; project administration, M.A.d.S.G.A.; funding acquisition, M.A.d.S.G.A., S.A., R.C.S. and F.L.C.O. All authors have read and agreed to the published version of the manuscript.

Funding

This work was supported by the Brazilian Coordination for the Improvement of Higher Level Personnel (CAPES) under grant [number 001]; the Brazilian National Council for Scientific and Technological Development (CNPq) under grants [numbers 307084/2022-1 and 402971/2023-0]; and the Carlos Chagas Filho Research Support Foundation of the State of Rio de Janeiro (FAPERJ), under grants [numbers 210.041/2023, 210.618/2019, 211.086/2019 and 201.243/2022].

Data Availability Statement

The original contributions presented in the study are included in the article, further inquiries can be directed to the corresponding author.

Conflicts of Interest

The authors declare no conflicts of interest.

Appendix A

Table A1. Description of each meteorological station considered.
StationNameLocation (State)LatitudeLongitudeAltitudeStart−Up Date
A001BrasiliaDF−15.78944444−47.925833321160.966 May 2000
A015ItapaciGO−14.97972221−49.53999999551.162 February 2007
A020Pedro AfonsoTO−8.968677−48.177259189.7122 January 2007
A034CatalaoGO−18.154779−47.927614900.7230 January 2008
A039Formoso do AraguaiaTO−11.88749999−49.60833333215.226 April 2008
A207GrajauMA−5.81611111−46.16222222232.299 September 2008
A223Alto ParnaibaMA−9.10833333−45.93194443283.692 June 2008
A306SobralCE−3.74805555−40.3458333392.0711 February 2003
A307PetrolinaPE−9.388323−40.523262372.7220 February 2003
A335PiripiriPI−4.276047−41.794568157.8930 August 2007
A336Alvorada do GurgueiaPI−8.44166666−43.86555555261.2616 November 2007
A368TianguaCE−3.73222221−41.0119444475614 March 2018
A402BarreirasBA−12.12472221−45.02694443474.1719 December 2001
A424IreceBA−11.328998−41.864504768.4230 March 2008
A425LencoisBA−12.557854−41.388808438.094 April 2008
A428Senhor do BonfimBA−10.44305555−40.14833333532.0926 March 2008
A429BarraBA−11.08472221−43.13888888407.511 May 2008
A507UberlandiaMG−18.91694443−48.25555555874.7717 December 2002
A520Conceicao das AlagoasMG−19.98586−48.151574572.5417 July 2006
A523PatrocinioMG−18.996684−46.985935978.1121 August 2006
A525SacramentoMG−19.87527777−47.43416666913.1218 August 2006
A530CaldasMG−21.918066−46.3829961077.3427 November 2006
A535FlorestalMG−19.885398−44.416883753.526 June 2008
A536Dores do IndaiaMG−19.481935−45.593932721.0931 May 2007
A538CurveloMG−18.747711−44.453785669.4817 December 2006
A546Guarda-morMG−17.56138888−47.19916666997.0110 July 2007
A551Rio Pardo de MinasMG−15.72305554−42.43583333850.0616 November 2007
A561Sao Sebastiao do ParaisoMG−20.91−47.1141666684516 August 2015
A705BauruSP−22.358052−49.028877636.1729 August 2001
A718RanchariaSP−22.37277777−50.97472221398.7531 August 2006
A729VotuporangaSP−20.40333333−49.96611111510.373 December 2006
A737IbitingaSP−21.85555555−48.79972221496.758 November 2007
A756Agua ClaraMS−20.44444444−52.87583332323.6313 August 2010
A760Costa RicaMS−18.49277777−53.17138888727.343 December 2012
A763MariliaSP−22.235222−49.96511166014 May 2017
Table A2. Metrics calculated for each station. The values were obtained by comparing the reanalysis dataset values with the observed values of INMET stations. The values in blue show the best result among the reanalysis datasets for each station. For the case of MBE and rMBE, the best was the smallest absolute value.
MBE (W/m2)rMBE (%)MAE (W/m2)rMAE (%)
StationMERRA-2ERA5ERA5-LandCSFv2MERRA-2ERA5ERA5-LandCSFv2MERRA-2ERA5ERA5-LandCSFv2MERRA-2ERA5ERA5-LandCSFv2
A001−6.3213.5613.4331.57−2.886.186.1214.3851.1568.7269.0194.9223.3031.3131.4443.24
A01520.0233.6942.4569.6510.6617.9522.6137.1063.4075.8374.86112.0133.7740.3939.8759.66
A020−11.4121.2710.5244.02−5.319.904.9020.4962.5868.4469.81100.4629.1231.8532.4946.76
A034−3.4426.5825.6141.83−1.6412.6512.1919.9153.0572.8973.8194.4625.2534.6935.1344.96
A039−24.84−2.782.8921.35−10.83−1.211.269.3156.0357.8767.9697.4624.4325.2429.6442.50
A207−5.7427.3414.4452.54−2.8013.327.0425.6152.4175.6551.50103.1225.5436.8725.1050.26
A223−3.0710.3220.2331.03−1.394.659.1213.9949.5157.6370.6894.2622.3125.9731.8542.48
A306−15.62−0.202.0830.01−6.80−0.090.9013.0658.0878.1779.51112.9725.2934.0334.6249.18
A30752.4026.6851.5470.5828.9714.7528.4939.0266.5270.5674.12111.5236.7739.0140.9861.65
A335−22.36−2.34−2.679.28−9.45−0.99−1.133.9253.1377.2260.09107.4022.4532.6325.3945.38
A336−23.79−22.75−16.0815.09−9.66−9.24−6.536.1355.9974.6552.6598.5922.7430.3121.3840.03
A368−26.79−15.18−4.8918.43−11.11−6.30−2.037.6556.5980.7363.64109.6123.4833.4926.4045.47
A402−13.13−2.84−1.7621.17−5.66−1.22−0.769.1348.7558.6551.7193.5921.0125.2822.2940.34
A424−13.08−11.64−30.51−8.44−5.42−4.82−12.63−3.4958.1595.0981.6790.0424.0839.3733.8137.28
A42525.8331.6114.0432.6412.7315.586.9216.0961.9890.8279.3692.7830.5544.7639.1145.72
A42859.0960.5564.5261.0034.9535.8138.1636.0769.8688.7484.26106.3441.3252.4849.8362.89
A429−19.04−18.18−26.1211.85−7.58−7.24−10.404.7256.5688.6178.0085.5522.5235.2831.0634.06
A507−13.0813.9917.4633.01−6.026.438.0315.1852.2267.4170.4398.9024.0131.0032.3945.48
A520−4.2724.6223.3838.53−2.0411.7511.1518.3845.4575.9676.6994.4221.6836.2336.5845.04
A523−9.4322.3224.0524.62−4.4910.6211.4411.7253.9569.3075.7198.1325.6732.9836.0346.70
A525−10.4124.3320.1824.50−4.8811.419.4611.4958.0480.9477.5698.5427.2137.9636.3746.21
A530−3.4132.684.6312.74−1.7216.542.346.4553.2485.8184.4590.4826.9543.4342.7445.79
A5354.5530.3533.8635.962.3315.5817.3918.4749.6371.2868.0891.8725.4936.6034.9647.17
A536−16.0713.52−16.4914.85−7.516.32−7.716.9455.4665.9185.0690.8325.9330.8239.7742.47
A538−25.08−0.43−4.0624.02−11.01−0.19−1.7810.5455.1555.5170.3294.8924.2124.3730.8741.66
A546−13.044.7516.3524.86−6.002.197.5211.4453.4766.1067.3095.0824.6130.4230.9743.75
A5518.68−2.9413.689.844.16−1.416.554.7157.2665.4669.7188.3827.4031.3333.3642.29
A561−21.3910.0814.9914.62−9.834.636.896.7253.6371.9674.0391.5624.6533.0734.0242.08
A70528.1061.4661.1868.2216.2035.4335.2639.3259.01102.6277.38102.7434.0159.1544.6059.22
A718−11.02−0.2511.2923.99−5.05−0.115.1710.9948.2679.2472.6087.1522.1136.3033.2639.93
A729−8.0624.7819.4632.61−3.8011.699.1815.3853.8874.9357.0286.1725.4235.3526.9040.65
A737−23.835.605.1714.33−10.422.452.266.2758.0478.7654.6191.4125.3934.4523.8939.99
A756−13.61−2.242.8123.97−6.16−1.011.2710.8547.2985.5470.8990.8221.4138.7232.0941.11
A760−15.48−19.390.9933.67−6.90−8.640.4415.0053.0178.5771.4195.4123.6235.0131.8242.51
A763−20.1810.418.5019.38−9.084.683.828.7254.2090.0760.4390.6224.3940.5327.1940.77
Number of times in the best position14117314117332-3-32-3-
Table A3. Metrics calculated for each station. The values were obtained by comparing the reanalysis dataset values with the observed values of INMET stations. The values in blue show the best result among the reanalysis datasets for each station.
RMSE (W/m2)rRMSE (%)PCC
StationMERRA-2ERA5ERA5-LandCSFv2MERRA-2ERA5ERA5-LandCSFv2MERRA-2ERA5ERA5-LandCSFv2
A001104.21136.24138.93162.2147.4762.0663.2973.890.9400.9030.8990.865
A015123.99147.21144.00181.6066.0478.4176.7096.720.9000.8750.8940.835
A020126.86145.72140.30179.8759.0467.8265.2983.710.9080.8910.8920.837
A034106.12146.28145.38167.4950.5169.6269.1979.720.9330.8920.8910.856
A039115.65123.27142.60176.9650.4453.7662.1977.180.9350.9210.8950.839
A207108.60146.92104.33183.6152.9371.6150.8589.490.9230.8870.9350.830
A223104.23123.26136.96170.2246.9855.5561.7376.720.9400.9200.9070.854
A306112.84147.64151.28198.8749.1264.2865.8686.580.9330.8850.8830.817
A307121.61138.09138.56197.9967.2376.3476.60109.460.9470.8770.9200.830
A335110.64141.66121.19195.8346.7559.8651.2182.740.9400.8980.9260.819
A336110.60149.99113.82176.5644.9160.9046.2171.690.9490.8980.9430.861
A368110.76150.23127.08197.7045.9462.3252.7182.010.9470.8910.9230.828
A402104.60119.14113.14173.7245.0951.3548.7774.880.9440.9270.9340.855
A424110.05167.71156.30158.9445.5669.4464.7165.810.9410.8600.8800.878
A425120.46164.75150.99165.2759.3781.2074.4181.450.9230.8580.8670.857
A428133.18162.16156.17194.4378.7695.9092.36114.990.9320.8790.9010.811
A429109.20155.49145.55153.2143.4861.9157.9561.000.9480.8890.9050.897
A507106.58138.34143.69178.0449.0163.6266.0781.870.9360.8980.8920.834
A52099.21147.90150.26169.1047.3270.5571.6780.660.9390.8840.8800.847
A523107.15140.14150.43179.0750.9966.6971.5985.220.9340.8970.8820.825
A525113.16165.05158.49176.9453.0677.4074.3282.970.9270.8620.8680.829
A530105.34170.82165.17164.5753.3286.4583.5983.290.9280.8420.8260.828
A535104.48141.26136.88170.4853.6572.5470.2987.540.9280.8930.9020.835
A536110.87139.63164.86165.4151.8465.2977.0877.340.9310.8950.8400.849
A538108.75119.33141.63171.2747.7452.3862.1775.180.9440.9260.8950.856
A546108.84129.15134.11171.2550.0859.4361.7178.800.9360.9080.9070.847
A551112.32129.20134.72160.0953.7561.8364.4776.620.9280.9020.8990.859
A561107.23148.75151.31166.3549.2868.3769.5476.450.9390.8790.8790.844
A705123.74192.05156.76177.0971.32110.7090.36102.080.9020.8140.8860.837
A71897.04156.81148.78159.2944.4671.8468.1672.980.9470.8600.8810.863
A729105.79144.70111.76156.6249.9068.2552.7273.880.9340.8920.9340.866
A737113.31158.42111.07162.1149.5669.3048.5870.910.9390.8730.9370.863
A75699.05159.86145.07167.4344.8472.3665.6775.790.9470.8570.8840.847
A760106.41155.79144.89173.1447.4169.4264.5677.140.9380.8620.8850.846
A763104.80170.13133.31162.2547.1576.5559.9873.000.9450.8500.9070.859
Number of times in the best position33-2-33-2-33-2-
Table A4. The blue entries are the best results for each dataset regarding the mean and median of all the metrics of all the stations by month.
rMBE (%)rMAE (%)rRMSE (%)MBE (W/m2)MAE (W/m2)RMSE (W/m2)
MeanMedianMeanMedianMeanMedianMeanMedianMeanMedianMeanMedian
JanuaryMERRA-2−5.65−6.7933.1433.4662.8263.29−13.53−15.5773.8574.44140.04142.44
ERA51.291.3241.4343.0977.0377.760.802.8192.2594.51171.47172.94
ERA5-Land1.943.3637.8237.4271.4369.812.997.5684.4885.72159.54159.59
CSFv220.7222.1750.5649.8187.7586.2245.0545.36112.13111.74194.63194.03
FebruaryMERRA-2−4.99−7.5634.6835.0766.1766.62−11.98−16.1272.6573.80138.70139.15
ERA56.698.2944.0144.0682.5281.4710.7517.9392.4493.09173.16174.14
ERA5-Land6.874.9641.6440.6478.8278.0311.5410.8087.6487.86165.83166.59
CSFv217.7112.8153.0453.2691.8192.6537.0230.35111.37111.24192.78193.22
MarchMERRA-2−4.04−3.6530.0529.7058.2958.43−10.10−8.0563.9864.16124.01126.35
ERA5−4.89−10.0341.4940.6278.4676.24−13.83−22.2689.5889.30169.27165.01
ERA5-Land−4.19−7.8638.1938.5973.4574.63−10.93−16.8982.0382.65157.78161.54
CSFv213.9312.2048.1045.5183.6877.9729.1324.27102.74100.35178.77173.54
AprilMERRA-2−2.35−4.7027.0924.4353.0848.86−7.44−9.8954.0149.67105.7595.06
ERA53.092.6534.3432.6266.5862.533.415.8368.4864.79132.97129.43
ERA5-Land2.151.2833.0533.4765.1765.541.792.6965.6365.53129.66131.63
CSFv212.299.8045.9444.2080.6277.4722.8519.4791.5990.76160.77159.00
MayMERRA-20.47−5.2524.5721.5948.2942.40−2.68−9.3043.6840.1085.5678.87
ERA57.705.4934.8732.2969.1465.2710.309.8061.9660.29123.23123.04
ERA5-Land6.384.4432.8231.7966.2062.277.688.0558.5762.07117.86121.80
CSFv28.646.2143.1541.0176.9772.2914.0511.2378.3575.59139.80135.77
JuneMERRA-22.44−3.3222.9018.9545.4837.830.52−6.2237.8934.5975.0468.77
ERA512.926.1633.5027.8264.0753.5414.819.4654.1650.88104.3897.23
ERA5-Land10.707.4630.6226.3060.8552.8112.3313.6150.5645.96100.2893.60
CSFv29.886.7742.0340.4774.8072.2514.3111.4272.1869.52128.74123.52
JulyMERRA-20.004−7.6320.3417.1038.8430.60−4.49−15.0036.5132.7169.4559.62
ERA511.435.5930.0524.4055.7748.1814.529.8353.8147.49100.5894.66
ERA5-Land10.638.6627.0921.5451.8141.9714.7916.0948.6944.5693.1186.09
CSFv210.716.8441.1237.5872.3367.4616.2812.5976.7273.06135.94130.82
AugustMERRA-22.05−5.2919.9517.2137.8231.540.06−11.7039.9036.9975.6871.02
ERA513.6312.1230.2225.1559.2652.1522.4224.9960.6155.81119.39114.09
ERA5-Land12.7113.1128.6125.6556.9849.7021.1726.4057.5254.09115.05109.71
CSFv214.4510.9839.2836.5970.1366.9326.4623.0881.3377.84146.05142.57
SeptemberMERRA-20.60−2.7417.6816.3133.6231.12−0.79−7.5141.8339.8679.4075.77
ERA514.5415.2925.5724.0449.3947.7732.0837.7160.1957.61116.55119.60
ERA5-Land13.2413.5924.5523.6747.9245.2229.1730.9657.6456.00113.02116.71
CSFv217.1615.7737.6635.0567.2965.8738.7637.2489.7685.48160.88156.55
OctoberMERRA-2−1.89−4.1825.9625.9350.2151.55−4.96−9.7958.3659.29112.61115.60
ERA515.7618.0036.0136.4969.3470.1332.7739.9281.0180.04155.84152.68
ERA5-Land16.7016.0034.9336.5367.9966.9935.0033.4878.1578.34152.35152.97
CSFv217.2416.4347.0147.5983.8585.4237.4335.66105.89104.67188.99188.67
NovemberMERRA-2−1.76−4.9828.1427.1952.5449.10−7.34−11.8867.8467.74126.40127.48
ERA52.63−7.9540.7538.0575.7572.390.11−20.3298.2895.82183.08178.56
ERA5-Land3.210.1736.9037.9269.3570.603.720.4089.0591.40167.62166.61
CSFv216.5312.3846.4944.8081.7778.1037.7428.72111.35111.70196.00193.97
DecemberMERRA-2−1.84−2.7631.5631.0159.0357.88−5.42−7.3073.3876.30137.16141.35
ERA510.075.1039.2836.8072.5269.6719.9312.9791.3888.31168.52166.88
ERA5-Land9.948.6836.9736.7269.4669.4020.4719.1286.1489.64161.73162.82
CSFv215.2015.8654.4353.3195.6494.6733.5238.44126.56127.47222.68225.94
Table A5. The variation between the reanalysis and the locally measured GHI regarding the mean. Values in W/m2.
INMETMERRA-2∆ (%)INMETERA5∆ (%)INMETERA5-Land∆ (%)INMETCSFv2∆ (%)
January224.09210.56−6.04224.09225.860.79224.09227.071.33224.09269.1320.10
February212.67200.68−5.64212.67223.034.87212.67224.215.43212.67249.6917.41
March217.70207.60−4.64217.70205.69−5.52217.70206.77−5.02217.70246.8313.38
April203.56196.12−3.66203.56207.351.86203.56205.350.88203.56226.4111.23
May185.34182.66−1.45185.34194.885.15185.34193.024.14185.34199.397.58
June178.88179.400.29178.88192.097.38178.88191.216.89178.88193.198.00
July195.54191.04−2.30195.54208.856.81195.54210.337.57195.54211.828.32
August215.72215.780.03215.72236.879.80215.72236.899.81215.72242.1812.27
September243.34242.55−0.33243.34274.7312.90243.34272.5211.99243.34282.1015.93
October228.41223.44−2.17228.41261.2014.36228.41263.4115.32228.41265.8416.39
November246.38239.04−2.98246.38248.060.68246.38250.101.51246.38284.1315.32
December236.44231.02−2.29236.44256.588.52236.44256.918.66236.44279.3618.15
Table A6. The variation between the reanalysis and the locally measured GHI regarding the standard deviation. Values in W/m2.
INMETMERRA-2∆ (%)INMETERA5∆ (%)INMETERA5-Land∆ (%)INMETCSFv2∆ (%)
January309.01279.01−9.71309.01298.27−3.48309.01298.86−3.29309.01322.534.37
February298.46269.67−9.64298.46294.48−1.33298.46297.08−0.46298.46304.141.91
March303.45279.76−7.81303.45277.28−8.62303.45278.82−8.12303.45296.86−2.17
April284.77267.32−6.13284.77282.38−0.84284.77279.70−1.78284.77278.96−2.04
May262.77251.30−4.37262.77267.821.92262.77265.340.98262.77253.39−3.57
June250.02244.35−2.27250.02262.625.04250.02261.464.58250.02239.50−4.21
July267.57257.84−3.64267.57281.145.07267.57282.685.65267.57256.77−4.04
August294.15286.85−2.48294.15314.857.04294.15314.706.98294.15292.34−0.62
September323.52315.48−2.48323.52352.659.01323.52351.338.60323.52336.003.86
October313.12296.43−5.33313.12339.998.58313.12342.029.23313.12337.527.79
November328.25309.77−5.63328.25320.93−2.23328.25323.43−1.47328.25350.446.76
December317.49297.22−6.39317.49323.071.76317.49324.612.24317.49343.958.33

References

  1. United Nations. Net Zero Coalition. Available online: https://www.un.org/en/climatechange/net-zero-coalition (accessed on 22 June 2023).
  2. IEA. Renewables 2020; International Energy Agency: Paris, France, 2020; Available online: https://www.iea.org/reports/renewables-2020 (accessed on 19 March 2022).
  3. SolarPower Europe. Global Market Outlook for Solar Power 2022–2026. Available online: https://www.solarpowereurope.org/insights/market-outlooks/global-market-outlook-for-solar-power-2022 (accessed on 9 December 2022).
  4. REN21. RENEWABLES 2022: GLOBAL STATUS REPORT. Available online: https://www.ren21.net/gsr-2022/ (accessed on 11 June 2022).
  5. IRENA. Country Rankings; International Renewable Energy Agency: Masdar City, United Arab Emirates, 2023; Available online: https://www.irena.org/Data/View-data-by-topic/Capacity-and-Generation/Country-Rankings (accessed on 25 March 2023).
  6. Empresa de Pesquisa Energética. Balanço Energético Nacional/Brazilian Energy Balance; Ministério de Minas e Energia: Brasilia, Brazil, 2022. Available online: https://www.epe.gov.br/sites-pt/publicacoes-dados-abertos/publicacoes/PublicacoesArquivos/publicacao-748/topico-687/BEN2023.pdf (accessed on 19 September 2023).
  7. ABSOLAR. Brazilian Association of Photovoltaic Solar Energy-Infographic. Available online: https://www.absolar.org.br/en/market/infographic/ (accessed on 18 September 2024).
  8. Empresa de Pesquisa Energética. Plano Nacional de Energia 2050; Ministério de Minas e Energia: Brasilia, Brazil, 2020. Available online: https://www.epe.gov.br/sites-pt/publicacoes-dados-abertos/publicacoes/PublicacoesArquivos/publicacao-227/topico-563/Relatorio%20Final%20do%20PNE%202050.pdf (accessed on 19 November 2023).
  9. Nassar, Y.F.; Hafez, A.A.; Belhaj, S.; Alsadi, S.Y.; Abdunnabi, M.J.; Belgasim, B.; Sbeta, M.N. A Generic Model for Optimum Tilt Angle of Flat-Plate Solar Harvesters for Middle East and North Africa Region. Appl. Sol. Energy 2022, 58, 800–812. [Google Scholar] [CrossRef]
  10. Iung, A.M.; Cyrino Oliveira, F.L.; Marcato, A.L.M. A Review on Modeling Variable Renewable Energy: Complementarity and Spatial–Temporal Dependence. Energies 2023, 16, 1013. [Google Scholar] [CrossRef]
  11. Das, U.K.; Tey, K.S.; Seyedmahmoudian, M.; Idris, M.Y.I.; Mekhilef, S.; Horan, B.; Stojcevski, A. SVR-Based Model to Forecast PV Power Generation under Different Weather Conditions. Energies 2017, 10, 876. [Google Scholar] [CrossRef]
  12. Chodakowska, E.; Nazarko, J.; Nazarko, Ł.; Rabayah, H.S. Solar Radiation Forecasting: A Systematic Meta-Review of Current Methods and Emerging Trends. Energies 2024, 17, 3156. [Google Scholar] [CrossRef]
  13. Das, U.K.; Tey, K.S.; Seyedmahmoudian, M.; Mekhilef, S.; Idris, M.Y.I.; Van Deventer, W.; Horan, B.; Stojcevski, A. Forecasting of Photovoltaic Power Generation and Model Optimization: A Review. Renew. Sustain. Energy Rev. 2018, 81, 912–928. [Google Scholar] [CrossRef]
  14. Raza, M.Q.; Nadarajah, M.; Ekanayake, C. On Recent Advances in PV Output Power Forecast. Sol. Energy 2016, 136, 125–144. [Google Scholar] [CrossRef]
  15. Pessanha, J.F.M.; Melo, A.C.G.; Caldas, R.P.; Falcao, D.M. A Methodology for Joint Data Cleaning of Solar Photovoltaic Generation and Solar Irradiation. In Proceedings of the 2020 International Conference on Probabilistic Methods Applied to Power Systems (PMAPS), Liege, Belgium, 18–21 August 2020. [Google Scholar] [CrossRef]
  16. Amaro e Silva, R.; Baptista, J.M.; Brito, M.C. Data-Driven Estimation of Expected Photovoltaic Generation. Sol. Energy 2018, 166, 116–122. [Google Scholar] [CrossRef]
  17. Pfenninger, S.; Staffell, I. Long-Term Patterns of European PV Output Using 30 Years of Validated Hourly Reanalysis and Satellite Data. Energy 2016, 114, 1251–1265. [Google Scholar] [CrossRef]
  18. Tsai, W.-C.; Tu, C.-S.; Hong, C.-M.; Lin, W.-M. A Review of State-of-the-Art and Short-Term Forecasting Models for Solar PV Power Generation. Energies 2023, 16, 5436. [Google Scholar] [CrossRef]
  19. Ahmed, R.; Sreeram, V.; Mishra, Y.; Arif, M.D. A Review and Evaluation of the State-of-the-Art in PV Solar Power Forecasting: Techniques and Optimization. Renew. Sustain. Energy Rev. 2020, 124, 109792. [Google Scholar] [CrossRef]
  20. Nassar, Y.F.; Abu-Sharar, T.; Shbeeb, A.; Abed, F.; Ayesh, A.; Al-Sharabati, M.; Khodari, M.; Qader, S. Regression Model for Optimum Solar Collectors’ Tilt Angles in Libya. In Proceedings of the 8th International Engineering Conference on Renewable Energy & Sustainability (ieCRES), Gaza, Palestine, 8–9 May 2023; pp. 1–6. [Google Scholar] [CrossRef]
  21. Abdunnabi, M.; Etiab, N.; Nassar, Y.F.; El-Khozondar, H.J.; Khargotra, R. Energy Savings Strategy for the Residential Sector in Libya and Its Impacts on the Global Environment and the Nation Economy. Adv. Build. Energy Res. 2023, 17, 379–411. [Google Scholar] [CrossRef]
  22. Gelaro, R.; McCarty, W.; Suárez, M.J.; Todling, R.; Molod, A.; Takacs, L.; Randles, C.A.; Darmenov, A.; Bosilovich, M.G.; Reichle, R.; et al. The Modern-Era Retrospective Analysis for Research and Applications, Version 2 (MERRA-2). J. Clim. 2017, 30, 5419–5454. [Google Scholar] [CrossRef] [PubMed]
  23. Hersbach, H.; Bell, B.; Berrisford, P.; Hirahara, S.; Horányi, A.; Muñoz-Sabater, J.; Nicolas, J.; Peubey, C.; Radu, R.; Schepers, D.; et al. The ERA5 Global Reanalysis. Q. J. R. Meteorol. Soc. 2020, 146, 1999–2049. [Google Scholar] [CrossRef]
  24. Jiang, H.; Lu, N.; Yao, L.; Qin, J.; Liu, T. Impact of Climate Changes on the Stability of Solar Energy: Evidence from Observations and Reanalysis. Renew. Energy 2023, 208, 726–736. [Google Scholar] [CrossRef]
  25. Yang, D. A Correct Validation of the National Solar Radiation Data Base (NSRDB). Renew. Sustain. Energy Rev. 2018, 97, 152–155. [Google Scholar] [CrossRef]
  26. Yang, D.; Bright, J.M. Worldwide Validation of 8 Satellite-Derived and Reanalysis Solar Radiation Products: A Preliminary Evaluation and Overall Metrics for Hourly Data over 27 Years. Sol. Energy 2020, 210, 3–19. [Google Scholar] [CrossRef]
  27. Olauson, J.; Bergkvist, M. Modelling the Swedish Wind Power Production Using MERRA Reanalysis Data. Renew. Energy 2015, 76, 717–725. [Google Scholar] [CrossRef]
  28. Cradden, L.C.; McDermott, F.; Zubiate, L.; Sweeney, C.; O’Malley, M. A 34-Year Simulation of Wind Generation Potential for Ireland and the Impact of Large-Scale Atmospheric Pressure Patterns. Renew. Energy 2017, 106, 165–176. [Google Scholar] [CrossRef]
  29. de Aquino Ferreira, S.C.; Maçaira, P.M.; Cyrino Oliveira, F.L. Joint Modeling of Wind Speed and Power via a Nonparametric Approach. Energies 2024, 17, 3573. [Google Scholar] [CrossRef]
  30. Ramirez Camargo, L.; Schmidt, J. Simulation of Multi-Annual Time Series of Solar Photovoltaic Power: Is the ERA5-Land Reanalysis the Next Big Step? Sustain. Energy Technol. Assess. 2020, 42, 100829. [Google Scholar] [CrossRef]
  31. Kenny, D.; Fiedler, S. Which Gridded Irradiance Data Is Best for Modelling Photovoltaic Power Production in Germany? Sol. Energy 2022, 232, 444–458. [Google Scholar] [CrossRef]
  32. Sianturi, Y.; Marjuki; Sartika, K. Evaluation of ERA5 and MERRA2 Reanalyses to Estimate Solar Irradiance Using Ground Observations over Indonesia Region. In AIP Conference Proceedings; AIP Publishing: Melville, NY, USA, 2020; Volume 2223. [Google Scholar] [CrossRef]
  33. Urraca, R.; Huld, T.; Gracia-Amillo, A.; Martinez-de-Pison, F.J.; Kaspar, F.; Sanz-Garcia, A. Evaluation of Global Horizontal Irradiance Estimates from ERA5 and COSMO-REA6 Reanalyses Using Ground and Satellite-Based Data. Sol. Energy 2018, 164, 339–354. [Google Scholar] [CrossRef]
  34. Olauson, J. ERA5: The New Champion of Wind Power Modelling? Renew. Energy 2018, 126, 322–331. [Google Scholar] [CrossRef]
  35. Tahir, Z.U.R.; Azhar, M.; Mumtaz, M.; Asim, M.; Moeenuddin, G.; Sharif, H.; Hassan, S. Evaluation of the Reanalysis Surface Solar Radiation from NCEP, ECMWF, NASA, and JMA Using Surface Observations for Balochistan, Pakistan. J. Renew. Sustain. Energy 2020, 12, 23703. [Google Scholar] [CrossRef]
  36. Tahir, Z.u.R.; Azhar, M.; Blanc, P.; Asim, M.; Imran, S.; Hayat, N.; Shahid, H.; Ali, H. The Evaluation of Reanalysis and Analysis Products of Solar Radiation for Sindh Province, Pakistan. Renew. Energy 2020, 145, 347–362. [Google Scholar] [CrossRef]
  37. Clarke, E.D.; Griffin, S.; McDermott, F.; Correia, J.M.; Sweeney, C. Which Reanalysis Dataset Should We Use for Renewable Energy Analysis in Ireland? Atmosphere 2021, 12, 624. [Google Scholar] [CrossRef]
  38. de Aquino Ferreira, S.C.; Cyrino Oliveira, F.L.; Maçaira, P.M. Validation of the Representativeness of Wind Speed Time Series Obtained from Reanalysis Data for Brazilian Territory. Energy 2022, 258, 124746. [Google Scholar] [CrossRef]
  39. Sawadogo, W.; Bliefernicht, J.; Fersch, B.; Salack, S.; Guug, S.; Diallo, B.; Ogunjobi, K.O.; Nakoulma, G.; Tanu, M.; Meilinger, S.; et al. Hourly Global Horizontal Irradiance over West Africa: A Case Study of One-Year Satellite- and Reanalysis-Derived Estimates vs. in Situ Measurements. Renew. Energy 2023, 216, 119066. [Google Scholar] [CrossRef]
  40. Cao, Q.; Liu, Y.; Sun, X.; Yang, L. Country-Level Evaluation of Solar Radiation Data Sets Using Ground Measurements in China. Energy 2022, 241, 122938. [Google Scholar] [CrossRef]
  41. Frank, C.W.; Wahl, S.; Keller, J.D.; Pospichal, B.; Hense, A.; Crewell, S. Bias Correction of a Novel European Reanalysis Data Set for Solar Energy Applications. Sol. Energy 2018, 164, 12–24. [Google Scholar] [CrossRef]
  42. WRMC-BSRN, World Radiation Monitoring Center: Baseline Surface Radiation Network. Available online: https://bsrn.awi.de/ (accessed on 31 August 2023).
  43. Driemel, A.; Augustine, J.; Behrens, K.; Colle, S.; Cox, C.; Cuevas-Agulló, E.; Denn, F.M.; Duprat, T.; Fukuda, M.; Grobe, H.; et al. Baseline Surface Radiation Network (BSRN): Structure and Data Description (1992–2017). Earth Syst. Sci. Data 2018, 10, 1491–1501. [Google Scholar] [CrossRef]
  44. Salazar, G.; Gueymard, C.; Galdino, J.B.; de Castro Vilela, O.; Fraidenraich, N. Solar Irradiance Time Series Derived from High-Quality Measurements, Satellite-Based Models, and Reanalyses at a Near-Equatorial Site in Brazil. Renew. Sustain. Energy Rev. 2020, 117, 109478. [Google Scholar] [CrossRef]
  45. Peng, X.; She, J.; Zhang, S.; Tan, J.; Li, Y. Evaluation of Multi-Reanalysis Solar Radiation Products Using Global Surface Observations. Atmosphere 2019, 10, 42. [Google Scholar] [CrossRef]
  46. INMET, Instituto Nacional de Meteorologia-INMET. Available online: https://portal.inmet.gov.br/ (accessed on 19 March 2022).
  47. Muñoz-Sabater, J. ERA5-Land Hourly Data from 1950 to Present. Copernicus Climate Change Service (C3S) Climate Data Store (CDS). 2019. Available online: https://cds.climate.copernicus.eu/datasets/reanalysis-era5-land?tab=overview (accessed on 24 June 2022).
  48. Climate Forecast System, The NCEP Climate Forecast System Version 2 (CFSv2). Available online: https://cfs.ncep.noaa.gov/ (accessed on 24 June 2022).
  49. Operador Nacional do Sistema Elétrico-ONS, Geração de Energia. Available online: https://www.ons.org.br/Paginas/resultados-da-operacao/historico-da-operacao/geracao_energia.aspx (accessed on 7 August 2023).
  50. ANEEL, Geração-Empreendimentos, SIGA-Sistema de Informações de Geração da ANEEL. Available online: https://dados.gov.br/dados/conjuntos-dados/siga-sistema-de-informacoes-de-geracao-da-aneel (accessed on 7 August 2023).
  51. Solargis, Solar Resource Maps of Brazil, Global Solar Atlas 2.0. Available online: https://solargis.com/maps-and-gis-data/download/brazil (accessed on 4 January 2023).
  52. Global Modeling and Assimilation Office (GMAO), Modern-Era Retrospective Analysis for Research and Applications. Version 2. Available online: https://gmao.gsfc.nasa.gov/reanalysis/MERRA-2/ (accessed on 19 March 2022).
  53. Global Modeling and Assimilation Office (GMAO), MERRA-2 tavg1_2d_rad_Nx: 2d, 1-Hourly, Time-Averaged, Single-Level, Assimilation, Radiation Diagnostics V5.12.4 (M2T1NXRAD 5.12.4), Goddard Earth Sciences Data and Information Services Center (GES DISC). Available online: https://disc.gsfc.nasa.gov/datasets/M2T1NXRAD_5.12.4/summary (accessed on 24 June 2022).
  54. Hersbach, H.; Bell, B.; Berrisford, P.; Biavati, G.; Horányi, A.; Muñoz Sabater, J.; Nicolas, C.; Peubey, C.; Radu, R.; Rozum, I.; et al. ERA5 Hourly Data on Single Levels from 1940 to Present. Copernicus Climate Change Service (C3S) Climate Data Store (CDS). 2018. Available online: https://cds.climate.copernicus.eu/datasets/reanalysis-era5-single-levels?tab=overvie (accessed on 1 January 2022).
  55. Muñoz-Sabater, J.; Dutra, E.; Agustí-Panareda, A.; Albergel, C.; Arduini, G.; Balsamo, G.; Boussetta, S.; Choulga, M.; Harrigan, S.; Hersbach, H.; et al. ERA5-Land: A State-of-the-Art Global Reanalysis Dataset for Land Applications. Earth Syst. Sci. Data 2021, 13, 4349–4383. [Google Scholar] [CrossRef]
  56. Saha, S.; Moorthi, S.; Wu, X.; Wang, J.; Nadiga, S.; Tripp, P.; Behringer, D.; Hou, Y.T.; Chuang, H.Y.; Iredell, M.; et al. The NCEP Climate Forecast System Version 2. J. Clim. 2014, 27, 2185–2208. [Google Scholar] [CrossRef]
  57. APDRC, Asia-Pacific Data-Research Center. Available online: http://apdrc.soest.hawaii.edu/ (accessed on 14 June 2022).
  58. Copernicus, Climate Data Store, ECMWF. Available online: https://cds.climate.copernicus.eu/#!/home (accessed on 17 June 2022).
  59. Unidata, Network Common Data Form (NetCDF). Available online: https://www.unidata.ucar.edu/software/netcdf/ (accessed on 4 January 2023).
  60. R Core Team. R: A Language and Environment for Statistical Computing; R Foundation for Statistical Computing: Vienna, Austria, 2022; Available online: https://www.r-project.org/ (accessed on 17 September 2023).
  61. Pierce, D. ncdf4: Interface to Unidata netCDF (Version 4 or Earlier) Format Data Files. CRAN. Available online: https://cran.r-project.org/web/packages/ncdf4/index.html (accessed on 17 September 2023).
  62. Borchers, H.W. pracma: Practical Numerical Math Functions. CRAN. Available online: https://cran.r-project.org/web/packages/pracma/index.html (accessed on 11 June 2022).
  63. Yang, L.; Cao, Q.; Yu, Y.; Liu, Y. Comparison of Daily Diffuse Radiation Models in Regions of China without Solar Radiation Measurement. Energy 2020, 191, 116571. [Google Scholar] [CrossRef]
  64. Gueymard, C.A. A Review of Validation Methodologies and Statistical Performance Indicators for Modeled Solar Radiation Data: Towards a Better Bankability of Solar Projects. Renew. Sustain. Energy Rev. 2014, 39, 1024–1034. [Google Scholar] [CrossRef]
Figure 1. Location of BDMEP stations. (a) All the stations from INMET are geographically distributed in the Brazilian territory; (b) the black squares represent the stations without missing values; (c) the black squares are the 35 stations in the darker area (higher irradiance values from 5.4 to 6.4 kWh/m2) in the states of Goiás, Tocantins, Maranhão, Ceará, Pernambuco, Piauí, Bahia, Minas Gerais, São Paulo and Mato Grosso do Sul along with the Federal District, and the blue triangles are the centralized solar farms connected to the grid. Source: (c) Authors, adapted from [49,50,51].
Energies 17 05063 g001
Figure 2. Aggregated dataset comparison—All stations were aggregated to have a general view of the behavior of each dataset. The MERRA-2 dataset (green boxplot) is shifted in time.
Energies 17 05063 g002
Figure 3. Comparison of aggregated datasets after treatment.
Energies 17 05063 g003
Figure 4. Boxplot of relative metrics average.
Energies 17 05063 g004
Figure 5. (a) rMBE graph of the five best (A306, A402, A538, A718, A760) and (b) rMBE graph of the five worst (A015, A207, A307, A428, A705) results.
Energies 17 05063 g005
Figure 6. Spatial distribution of Pearson’s correlation coefficient. The coefficient range is from 0.8112 to 0.9488, colors and bullet size help to identify the higher values.
Energies 17 05063 g006
Figure 7. Boxplots of the rMBE, rMAE, and rRMSE during February, May, August, and November. February and November are examples of hotter months; May and August are cooler months. All values in %.
Energies 17 05063 g007
Figure 8. (a) GHI for station A402 by month. This station presented lower errors for all the datasets. (b) Daily boxplot for station A402, all the reanalysis databases properly reflected the measured GHI except for CSFv2, which had high errors in the early and late daylight hours.
Energies 17 05063 g008
Figure 9. (a) GHI for the station A428 by month. This station presented higher errors for all the datasets. (b) Daily boxplot for station A428; the measured GHI from INMET was very low compared with the estimated reanalysis data.
Energies 17 05063 g009
Table 1. Reanalysis datasets considered in this study.
ReanalysisHorizontal ResolutionTemporal CoverageTemporal ResolutionHorizontal Coverage
MERRA-20.5° × 0.625°~50 km1980 to presentHourlyGlobal
ERA50.25° × 0.25°~31 km1979 to presentHourlyGlobal
ERA5-Land0.1° × 0.1°~9 km1950 to presentHourlyGlobal
CFSv20.25° × 0.25°~31 km2011 to presentHourlyGlobal
Table 2. Descriptive statistics of each dataset.
StatisticINMETMERRA-2ERA5ERA5-LandCSFv2
Mean215.66210.00226.77226.99245.81
Median7.258.3512.0110.9362.11
Standard Deviation300.27282.66303.83304.31306.50
Minimum00000
Maximum1229.79996.51127.141128.891065.37
Table 3. Summary of the results obtained for each dataset. The values represent the mean, median, standard deviation, absolute minimum value, and absolute maximum value of the calculated metric for all stations for each dataset. The values in blue represent the best results among the reanalysis datasets.
MetricReanalysis DatasetMeanMedianStandard DeviationMin (Absolute Value)Max (Absolute Value)
rMBE (%)MERRA-2−1.87−5.3110.641.3934.95
ERA56.524.6810.540.0935.81
ERA5-Land6.666.1211.170.4438.16
CSFv214.3311.4910.253.4939.32
rMAE (%)MERRA-225.9424.654.4721.0141.32
ERA535.4534.697.0524.3759.15
ERA5-Land33.0932.496.3021.3849.83
CSFv245.2743.756.5434.0662.89
rRMSE (%)MERRA-251.8449.568.0343.4878.76
ERA569.2968.3711.8051.35110.70
ERA5-Land65.7965.2911.0746.2192.36
CSFv281.1478.8010.9861.00114.99
PCCMERRA-20.9340.9360.0120.8990.949
ERA50.8840.8890.0240.8140.927
ERA5-Land0.8960.8950.0250.8260.943
CSFv20.8450.8470.0180.8110.897
Table 4. The five best results for rMBE, rMAE, rRMSE, and PCC. The values in blue indicate the best among the datasets. The order presented is from best to worst, remembering that for the error metrics, the best is the smallest error while for PCC, the best is the one with the highest value. For the rMBE, it was considered the absolute value (modulus) to choose the lowest error.
MERRA-2ERA5ERA5-LandCSFv2
rMBE (%)A306−6.8−0.090.913.06
A718−5.05−0.115.1710.99
A538−11.01−0.19−1.7810.54
A760−6.90−8.640.4415.00
A402−5.66−1.22−0.769.13
rMAE (%)A40221.0125.2822.2940.34
A33622.7430.3121.3840.03
A75621.4138.7232.0941.11
A52021.6836.2336.5845.04
A71822.1136.333.2639.93
rRMSE (%)A42943.4861.9157.9561.00
A71844.4671.8468.1672.98
A75644.8472.3665.6775.79
A33644.9160.946.2171.69
A40245.0951.3548.7774.88
PCCA3360.94880.89760.94270.8608
A4290.94810.88890.90490.8975
A3070.94730.87730.91960.8296
A7180.94720.85990.88060.8627
A7560.94710.85670.88430.8472
Table 5. The five worst results were for rMBE, rMAE, rRMSE, and PCC. The values in red indicate the worst among the datasets. The order presented is from worst to best, remembering that for the error metrics, the worst is the highest error, while for PCC, the worst is the one with the smallest value. For the rMBE, it was considered the absolute value (modulus) to choose the highest error.
MERRA−2ERA5ERA5−LandCSFv2
rMBE(%)A70516.235.4335.2639.32
A30728.9714.7528.4939.02
A42834.9535.8138.1636.07
A01510.6617.9522.6137.10
A207−2.8013.327.0425.61
rMAE (%)A42841.3252.4849.8362.89
A30736.7739.0140.9861.65
A01533.7740.3939.8759.66
A70534.0159.1544.6059.22
A20725.5436.8725.1050.26
rRMSE (%)A42878.7695.9092.36114.99
A70571.32110.7090.36102.08
A30767.2376.3476.60109.46
A01566.0478.4176.7096.72
A20752.9371.6150.8589.49
PCCA4280.93160.87900.90090.8112
A7050.90170.81440.88570.8366
A3060.93260.88510.88300.8168
A3350.93990.89800.92560.8192
A5230.93360.89700.88220.8247
Table 6. The variation between the reanalysis and the locally measured GHI regarding the mean and the standard deviation.
MeanStandard Deviation
INMET215.66300.27
MERRA-2210282.66
∆ (%)−2.62−5.86
INMET215.66300.27
ERA5226.77303.83
∆ (%)5.151.19
INMET215.66300.27
ERA5-Land226.99304.31
∆ (%)5.251.35
INMET215.66300.27
CSFv2245.81306.5
∆ (%)13.982.07
Disclaimer/Publisher’s Note: The statements, opinions and data contained in all publications are solely those of the individual author(s) and contributor(s) and not of MDPI and/or the editor(s). MDPI and/or the editor(s) disclaim responsibility for any injury to people or property resulting from any ideas, methods, instructions or products referred to in the content.