Article

Enhancing the Energy Performance of a Gas Turbine: Component of a High-Efficiency Cogeneration Plant

The Department of Power Engineering and Computer Science, Faculty of Engineering, “Vasile Alecsandri” University of Bacau, 600115 Bacau, Romania
*
Author to whom correspondence should be addressed.
Energies 2024, 17(19), 4860; https://doi.org/10.3390/en17194860
Submission received: 31 July 2024 / Revised: 21 September 2024 / Accepted: 25 September 2024 / Published: 27 September 2024

Abstract

:
Cogeneration is widely recognized as one of the most efficient methods of electricity generation, with gas turbine-based systems playing a critical role in ensuring reliability, sustainability, and consistent power output. This paper presents an energy efficiency analysis of a 14 MW high-efficiency cogeneration unit, featuring a modernized gas turbine as its core component. Since gas turbines often operate under varying loads due to fluctuating demand, this study examines their performance at 100%, 75%, and 50% load levels. It is observed that the efficiency of the gas turbine declines as the load decreases, primarily due to losses resulting from deviations from the design flow conditions. A detailed energy balance, Sankey diagram, and a comparative analysis of performance metrics against the manufacturer’s guarantees are provided for each load scenario. The results indicate that net thermal efficiency decreases by 10.7% at 75% load and by 30.6% at 50% load compared to nominal performance at full load. The performance at full load closely aligns with the values guaranteed by the gas turbine supplier. The gross electrical power output is 1.33% higher than the guaranteed value, and the thermodynamic circuit’s efficiency is 0.49% higher under real conditions. This study represents the initial phase of transitioning the turbine to operate on a fuel blend of natural gas and up to 20% hydrogen, with the goal of reducing CO2 emissions. As a novel contribution, this paper provides a systematized method for calculating and monitoring the in-service performance of gas turbines. The mathematical model is implemented using the Mathcad Prime 8.0 software, which proves to be beneficial for both operators and researchers.

1. Introduction

Cogeneration, also referred to as combined heat and power (CHP), is the simultaneous production of electricity and useful heat, making it one of the most efficient methods of power generation. High-efficiency cogeneration not only reduces energy production costs, but also minimizes polluting emissions. In Romania, this is supported through a dedicated scheme designed to cover the difference between the cost of energy produced via high-efficiency cogeneration and its sale price. Qualification for this support depends on the technology employed, reference efficiency values, and the ratio between electricity and heat production [1,2]. In March 2024, the European Commission extended and amended this scheme, allocating a total budget of EUR 752 million for the promotion of high-efficiency cogeneration in Romania [3].
Gas turbines have proven to be a highly efficient solution for cogeneration, offering advantages such as high power output in compact spaces, fast startup times, and integration capabilities with other power generation units. These systems offer critical backup services during periods of peak demand and seasonal fluctuations, helping to stabilize variable renewable energy sources and ensure grid reliability [4]. According to the International Energy Agency, gas turbines are expected to play a key role in enhancing grid flexibility, with their contribution remaining significant through 2040.
Cogeneration using gas turbines has been extensively analyzed in the literature. For example, a study in Italy evaluated various types of cogeneration plants, calculating the percentage of electricity generated through cogeneration and assessing their overall performance [5]. Another paper explored hierarchical control systems for cogeneration, comparing different prime movers such as gas turbines, steam turbines, micro turbines, reciprocating engines, and fuel cells in terms of size, efficiency, and operational characteristics [6]. Additional research has focused on performance improvements through advanced technologies, such as micro flame burners [7] and the operational optimization of micro gas turbines operating under both partial and full load conditions [8].
In addition to technological innovations, research has investigated the dynamic performance characteristics of gas turbines under varying operational cycles [9,10]. For instance, one study tested a gas turbine through 40 continuous cycles, each lasting one hour, evaluating start-up, acceleration, deceleration, and shutdown processes [9]. Another article examined the flame transition characteristics of a gas turbine combustor using a full-size single-burner experimental bench [10]. Moreover, a study [11] analyzed a novel turbine performance enhancement methodology at partial load through fluid injection into turbine vane sections, demonstrating improvements in rotor power across different operating regimes.
Further studies have assessed the impact of ambient conditions on cogeneration plant efficiency, particularly in high-temperature regions, showing that gas turbine efficiency decreases by 0.06% for every degree Celsius increase above 15 °C [12].
Cogeneration with supplementary firing increases power output by 17% and by 5% without it, compared to gas-turbine-only operation. The energy utilization factor improves by 27–37% without supplementary firing and exceeds 37% when it is used. Global thermal efficiency can reach up to 28% at maximum steam mass flow through the vapor turbine during unfired operation. However, efficiency drops to 20.2% with minimum steam mass flow in fired operation. The use of supplementary firing has been shown to increase power output and enhance overall efficiency in cogeneration systems [13].
To improve the efficiency and reliability of a thermal power plant with a gas turbine, it is essential to raise the turbine inlet temperature and ensure proper maintenance of compressor filters [14]. From a reliability perspective, an overview of thermal performance and failure analysis of gas turbine blades is provided in [15], with a focus on preventing failures. The study concludes that the choice of working fluid and fuel is critical for both efficiency and environmental impact, while the selection of suitable materials such as Titanium, Inconel, and Nimonic 80A is emphasized to minimize failure risks. Additionally, in [16], four natural gas combined cycle schemes are designed to boost efficiency and reduce environmental impact. The importance of using advanced materials to enhance efficiency and profitability is emphasized in [17]. In ref. [18], an adaptive risk-averse stochastic programming approach is presented for multi-energy microgrids, accounting for various system uncertainties, voltage-var control schemes, realistic thermal flows, and battery degradation. Meanwhile, ref. [19] introduces a model for multi-energy microgrids (MEMGs) that integrates electricity, gas, and heat systems, utilizing power-to-hydrogen-and-heat (P2HH) devices to improve flexibility and efficiency. The paper demonstrates the effectiveness of this method in reducing multi-energy supply costs and carbon emissions through multiple case studies [20]. Additionally, Reference [20] explores enhancing gas turbine performance by integrating a supercritical CO2 power cycle for waste heat recovery, specifically in large ship propulsion. The study suggests that the supercritical CO2 power cycle holds significant promise for marine applications, particularly in large, liquefied gas carriers.
Recent studies have also explored the future of gas turbine cycles, considering hydrogen and ammonia as fuels, along with advancements in cooling technologies, like double-wall cooling [21,22]. The use of hydrogen mixed with natural gas in the gas turbine is seen as a clean alternative, compared to using natural gas alone. Reference [23] shows that the efficiency of hydrogen-fired gas turbines is influenced by factors like component performance, operating conditions, and ambient conditions. The paper discusses challenges such as NOx emissions and proposes solutions like hydrogen dilution and exhaust gas recirculation to improve performance and reduce emissions. Other studies have tested afterburner installations using hydrogen–methane mixtures, further supporting the viability of hydrogen as a fuel for cogeneration systems [24]. The paper analyses CO2, CO, and NO concentrations for different fuel mixtures. In Reference [4], a review of current gas turbine combustion technologies is presented, focusing on their ability to operate with hydrogen-enriched natural gas in pursuit of decarbonization and electric grid stability. The technologies discussed include aerodynamic flame stabilization, self-ignition, staging, micro-mixing, and exhaust gas recirculation. One of the paper’s key conclusions is the need for further research and development to ensure the reliable and safe operation of these systems when utilizing higher hydrogen content, aiming for at least 80% by volume to achieve significant CO2 emission reductions.
The present paper focuses on the energy efficiency analysis of a 14 MW cogeneration unit, which uses a modernized gas turbine as its primary component. The unit provides thermal energy to the centralized heating system of Bacău, Romania, and supplies electricity to the National Energy System. Bacău is situated in climatic zone III of Romania, where the design outdoor temperature during the heating season is −18 °C. The city’s continental climate leads to cold winters, necessitating thermal energy for heating for nearly 200 days per year. Due to fluctuating demand during these periods, the gas turbine frequently operates at partial loads. The turbine’s efficiency is analyzed at 100%, 75%, and 50% loads, with each analysis including an energy balance and a Sankey diagram. The operating parameters are then compared to the manufacturer’s guaranteed values to ensure that the turbine operates as close to its design specifications as possible.
This paper presents a mathematical algorithm for verifying the performance of a retrofitted turbine, quantifying the energy efficiency of the gas turbine at both rated load and partial loads. This information is particularly useful for operators, as gas turbines in cogeneration plants are often required to operate at varying load levels due to fluctuating energy demand.
Additionally, as a novel contribution, this paper provides a systematized method for calculating and monitoring the in-service performance of gas turbines. The mathematical model is implemented using the Mathcad Prime 8.0 software, which proves to be beneficial for both operators and researchers.
The study also explores the potential of transitioning the turbine to a blend of natural gas and up to 20% hydrogen. This transition aims to reduce CO2 emissions and enhance environmental sustainability. In 2022, a similar turbine was successfully tested in Germany with a hydrogen blend of up to 25%, demonstrating stable performance and low emissions [25]. This paper builds on that foundation, analyzing the performance of the turbine under different hydrogen blending rates and load conditions.
This paper has the following structure. Section 2 describes the proposed cogeneration power plant used in the paper with all conditions for conducting the measurements and energy balance method. In Section 3, the verification of the parameters and performance of the studied gas turbine guaranteed by the supplier and partial load measurement results are given. Section 4 discusses the measurement results of performance verification and parameters of the upgraded gas turbine and the comparative benchmark between the obtained and guaranteed values for 100% load operation.

2. Materials and Methods

The 14 MW cogeneration unit is part of the Thermoenergy Group S.A. installations. Thermoenergy Group S.A. is the sole provider of thermal energy for the centralized system in Bacău, a city in the northeast of Romania. Thermoenergy manages the public service for supplying thermal energy, delivering both heating and hot water to residents connected to the system (SACET). The group operates with a high-efficiency electrical capacity of 24.95 MW [26]. The cogeneration plant of Thermoenergy Group Bacău is qualified Romanian aid scheme to support highly efficient cogeneration. In the paper [27], a set of eco-efficiency indicators for the cogeneration plant of Thermoenergy Group Bacău are calculated. The global efficiency is above the average value for cogeneration plants from Romania, and the annual average for CO2 emissions are under the average value for cogeneration plants from Romania.

2.1. Simplified Scheme of the Cogeneration Group and Technical Characteristics of the Equipment

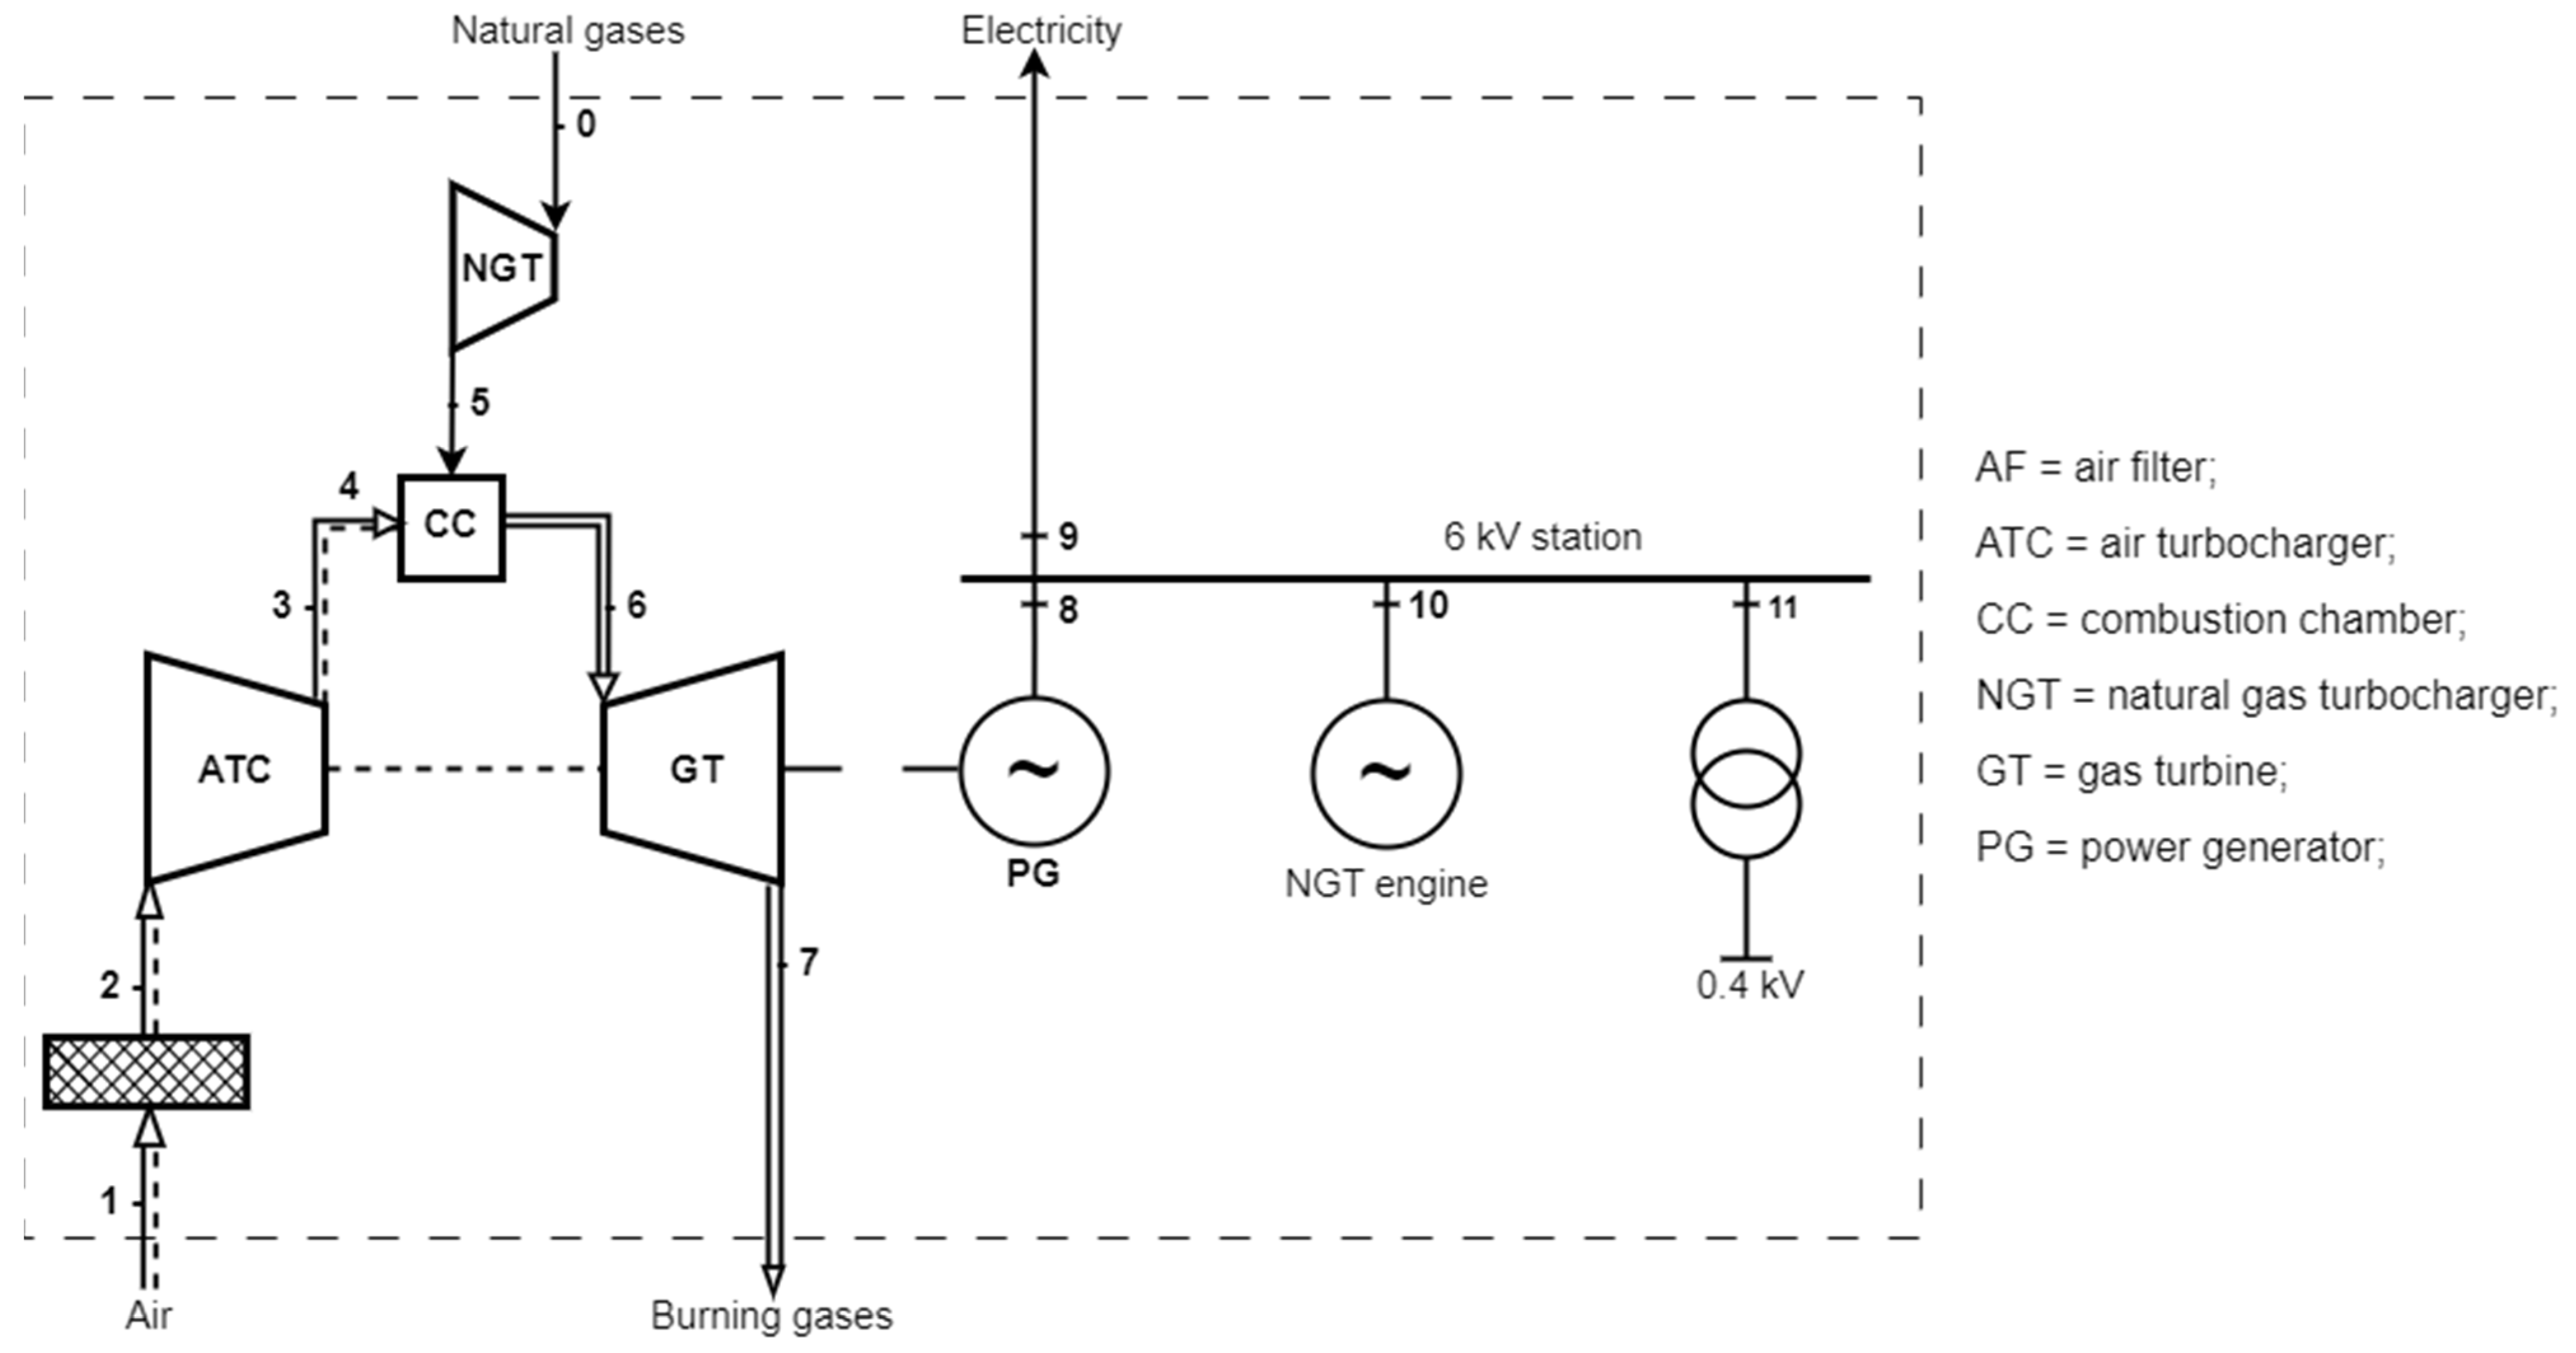
Figure 1 shows the simplified scheme of the installation and the characteristic points of the cycle, while Table 1 presents the main characteristics of the equipment used to produce electricity.
Table 2 presents the technical characteristics of the 6/0.4 kV transformer for its own services in the cogeneration group.

2.2. General Conditions for Carrying Out Measurements

Performance measurements for a gas turbine are essential to ensure the optimal, safe, and economical performance of a gas turbine. The measured data allows for the determination of the energy efficiency of the turbine, provides information to adjust the operating parameters, and allows us to verify that the gas turbine complies with the design specifications.
The necessary measurements to verify the parameters and performance guaranteed by the supplier were carried out after the end of the 72 h test of the group’s operation.
For each load (100%, 75%, and 50%), the turbine operated in a steady state for one hour, then measurements were taken for one hour at an interval of 10 min.
Readings were taken from the devices from the control panel of the gas turbine, from the gas flow meters in the turbine hall, and from the devices equipped with the gas compressor.
The atmospheric air parameters (pressure, temperature, and relative humidity) were read from the devices (thermohygrometer, barometer, and weather station) installed at the air filter suction mouth.
For the measurement of flue gas parameters, the gas analyzer probe was located on the flue gas outlet route from the gas turbine.
For measuring the active electrical power, current, voltage, non-symmetries, and power factor, the network analyzer was installed in the 6 kV cells of the 6 kV Cogeneration Group Substation.
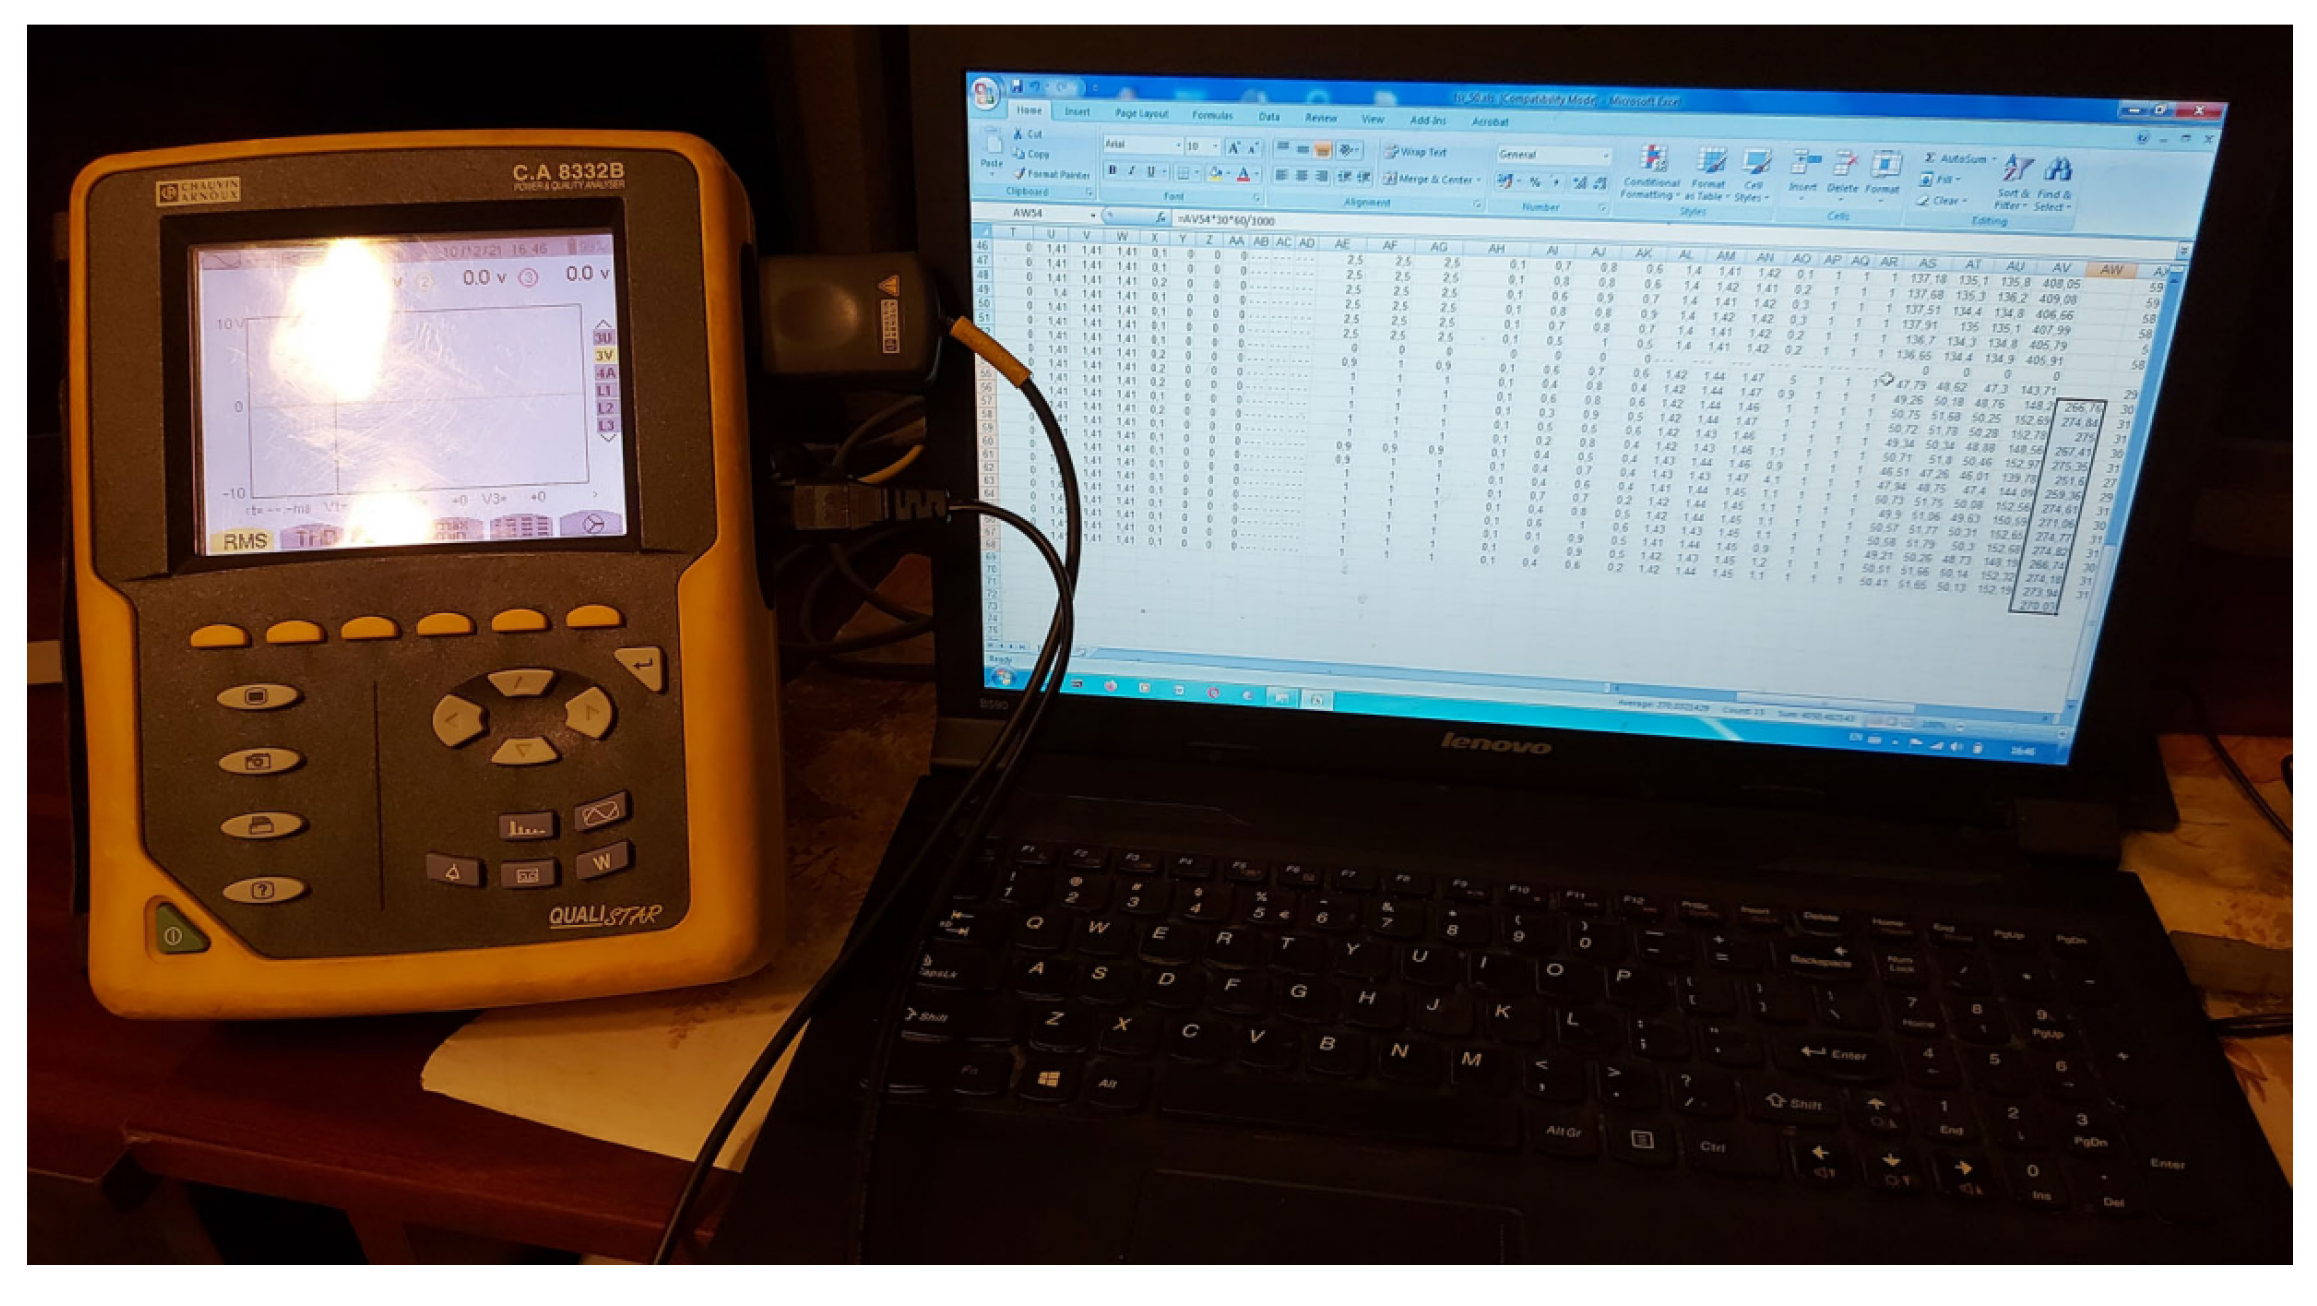
Measurements were carried out using the gas turbine’s measuring devices and additional instruments from the “Vasile Alecsandri” University of Bacău: a three-phase power quality analyser CA8332B, manufacturer Chauvin Arnoux, Asnières-Sur-Seine, France, a digital multimeter UT201 manufacturer UNI-T, China, a flue gas analyzer model MADUR GA-12 Plus with O2, CO, and NO sensors, manufacturer Madur, Laakirchen, Austria, a mechanical barometer-hygrometer TFA S20.3006.42, brand TFA, Reicholzheim, Germany, and a wireless weather station CONRAD TE 857, brand Conrad Electronic SE, Hirschau, Germany. The power quality analyzer, digital multimeter, and weather station are shown in Figure 2.
Representatives from Thermoenergy provided an analysis bulletin detailing the composition of natural gas, along with 10 min interval recordings of the operating parameters for the following equipment and circuits of the gas turbine:
  • Gas turbine unit, air compressor, and electric generator.
  • Natural gas compressor.

2.3. Energy Balance

The outline of the balance sheet, according to Figure 1, includes the air compressor, the combustion chamber, the gas turbine, and the electric generator.
The balance is a heat balance, focusing on the transformation of energy forms within the system. The processes that take place inside the contour include the transformation of energy forms [28,29,30,31,32].
Since the operating regime is stationary, the balance is expressed as a balance of powers.
The equality between the incoming and outgoing powers is expressed by Equation (1) [33]:
Pcc + Psc + Pa = Pn + Pgas + Psp + ∆Pm + ∆Pg + ∆PTSP + ∆P1 + ∆Prc [kW],
where Pcc is the thermal power resulting from the combustion of natural gas, given by (2):
Pcc = Bs,V·Pci [kW],
where Bs,V [Nm3/s] is the natural gas flow and Pci [kJ/Nm3] is the lower calorific value of natural gas taken from the natural gas analysis bulletin.
Psc is the power corresponding to the natural gas enthalpy at the entrance of the compressing station.
Psc = Bs,V·h1 [kW],
where h1 is the enthalpy of natural gas at the entrance to the compressor station and h0 is the enthalpy of natural gas at a temperature of T0 = 15 °C.
h1 = h0·(Ta1/T0) [kJ/Nm3],
Pa is the power corresponding to the enthalpy of the atmospheric air sucked in by the axial turbocharger.
Pa = PiTCA [kW],
where PiTCA is the thermal power of the air sucked in by the TCA,
PiTCA = Bs,V·ha2 [kW],
where ha2 [kJ/Nm3] is the enthalpy of the air aspirated by the axial turbocharger (TCA).
Pn is the electrical power supplied outside the contour (net power).
Pgas is the power corresponding to the enthalpy of the flue gasses discharged from the turbine.
Pgas = PteTGA [kW],
where PteTGA is the thermal power output with the flue gasses from the TGA and hg7 [kJ/Nm3] is the enthalpy of the flue gasses discharged from the turbine.
PteTGA = Bs,V·hg7 [kW],
where Psp is the electrical power of its own services.
Psp = P3 − ΔPTSP [kW],
where P3 is the active power in the primary winding of the 6/0.4 kV transformer of the group’s own services and ΔPTSP is the power losses in the 6/0.4 kV electrical transformer for supplying its own services.
ΔPTSP = (P0·(U3/Un)2 + β2·Psc)·10−3 [kW],
where Un [V] is the nominal voltage at the generator terminals, and U3 [V] is the voltage at the primary winding terminals of the 6/0.4 kV auxiliary services transformer of the group.
Pm is the mechanical losses of the gas turbine, air turbocharger, speed reducer and electric generator group.
ΔPm = (1 − ηm)(P − ΔPg) [kW],
where ∆Pg is the generator electrical losses.
ΔPg = (1 − ηg)P [kW],
where ηm is the mechanical efficiency of the group and ηg -is the generator efficiency.
ηm = 0.992 − 0.05/Pnom,
ηg = 0.904 + 0.074·(0.5·log(P·103))1/3,
where ∆P1 is the losses in the connection cables between the generator and the group station.
ΔP1 = 3R1·I12·10−3 [kW],
where I1 [A] is the current through the connection cables from the 6 kV generator to the 6 kV station of the cogeneration group.
Prc is the heat loss to the environment due to radiation and convection.
ΔPrc = (1-ηCAq [kW],
where ηCA is the thermal efficiency of the compressor and q [kW] is the consumed thermal power according to ISO 2314-2009 [33].
q = Bs,V·ρgn·(Pci + h5ho) [kW],
where ρgn [kg/Nm3] is the natural gas density and h5 [kJ/Nm3] is the natural gas enthalpy at the entrance to the combustion chamber.
For the 6 kV Cogeneration Group Substation, the electricity balance was carried out according to the following relation:
P1 = P2 + P3 + P4 [kW],
where P1 is the active power through cables connecting the generator to the 6 kV Cogeneration Group substation, P2 is the active power supplied by connection cables from the 6 kV Cogeneration Group Substation to the 6 kV General Services CET Substation, measured in the 6 kV Cogeneration Group Substation (net power), P3 is the active power in the primary winding of the 6/0.4 kV transformer of the group’s own services, and P4 is the active power of the gas compressor engine.
The powers in the electrical balance of the station are average values measured with the three-phase network analyzer.

3. Results

3.1. Verification of the Parameters and Performance Guaranteed by the Supplier

The gas turbine’s performance parameters include:
  • Gross electrical power at generator terminals, P, [MW].
  • Net electrical power (supplied from its own 6 kV substation), Pn, [MW].
  • Gross and net (corrected) electrical efficiency of the turbine, determined if the heat recovered from the flue gasses exhausted from the turbines is not taken into account, ηt,st, ηtn,st [%].
  • Specific heat consumption, ce, [kJ/kWhe].
The values of pressures, temperatures, and other parameters represent the arithmetic average of the readings at 10 min of the measuring devices.
Tables with thermophysical and thermodynamic properties from references [34,35] were used for density, specific heat, and enthalpy calculations as functions of temperature.
Combustion calculations were performed based on the elemental analysis of natural gas provided by Thermoenergy Group.
The enthalpy of flue gasses as a function of temperature was determined based on the combustion calculation and the dry flue gas analyses performed with the gas analyzer.
Measurements and calculations were made for the state of the air and natural gas at the entrance to the installation, corresponding to atmospheric conditions during the test period.
The standard conditions are as follows:
  • Atmospheric air pressure: 1013 mbar.
  • Atmospheric air temperature: 15 °C.
  • Atmospheric relative humidity: 60%.
Climatic conditions of Bacău are:
  • Atmospheric air pressure: 992 mbar.
  • Atmospheric air temperature: 9 °C.
  • Atmospheric relative humidity: 60%.
The correction of performance for standard conditions is specified as follows:
  • Standard conditions are conventional and mandatory for all gas turbine manufacturers; the declared performances are valid under these conditions.
  • Variable atmospheric conditions and the location of the group significantly influence electrical power, represented by correction tables provided by the manufacturer.
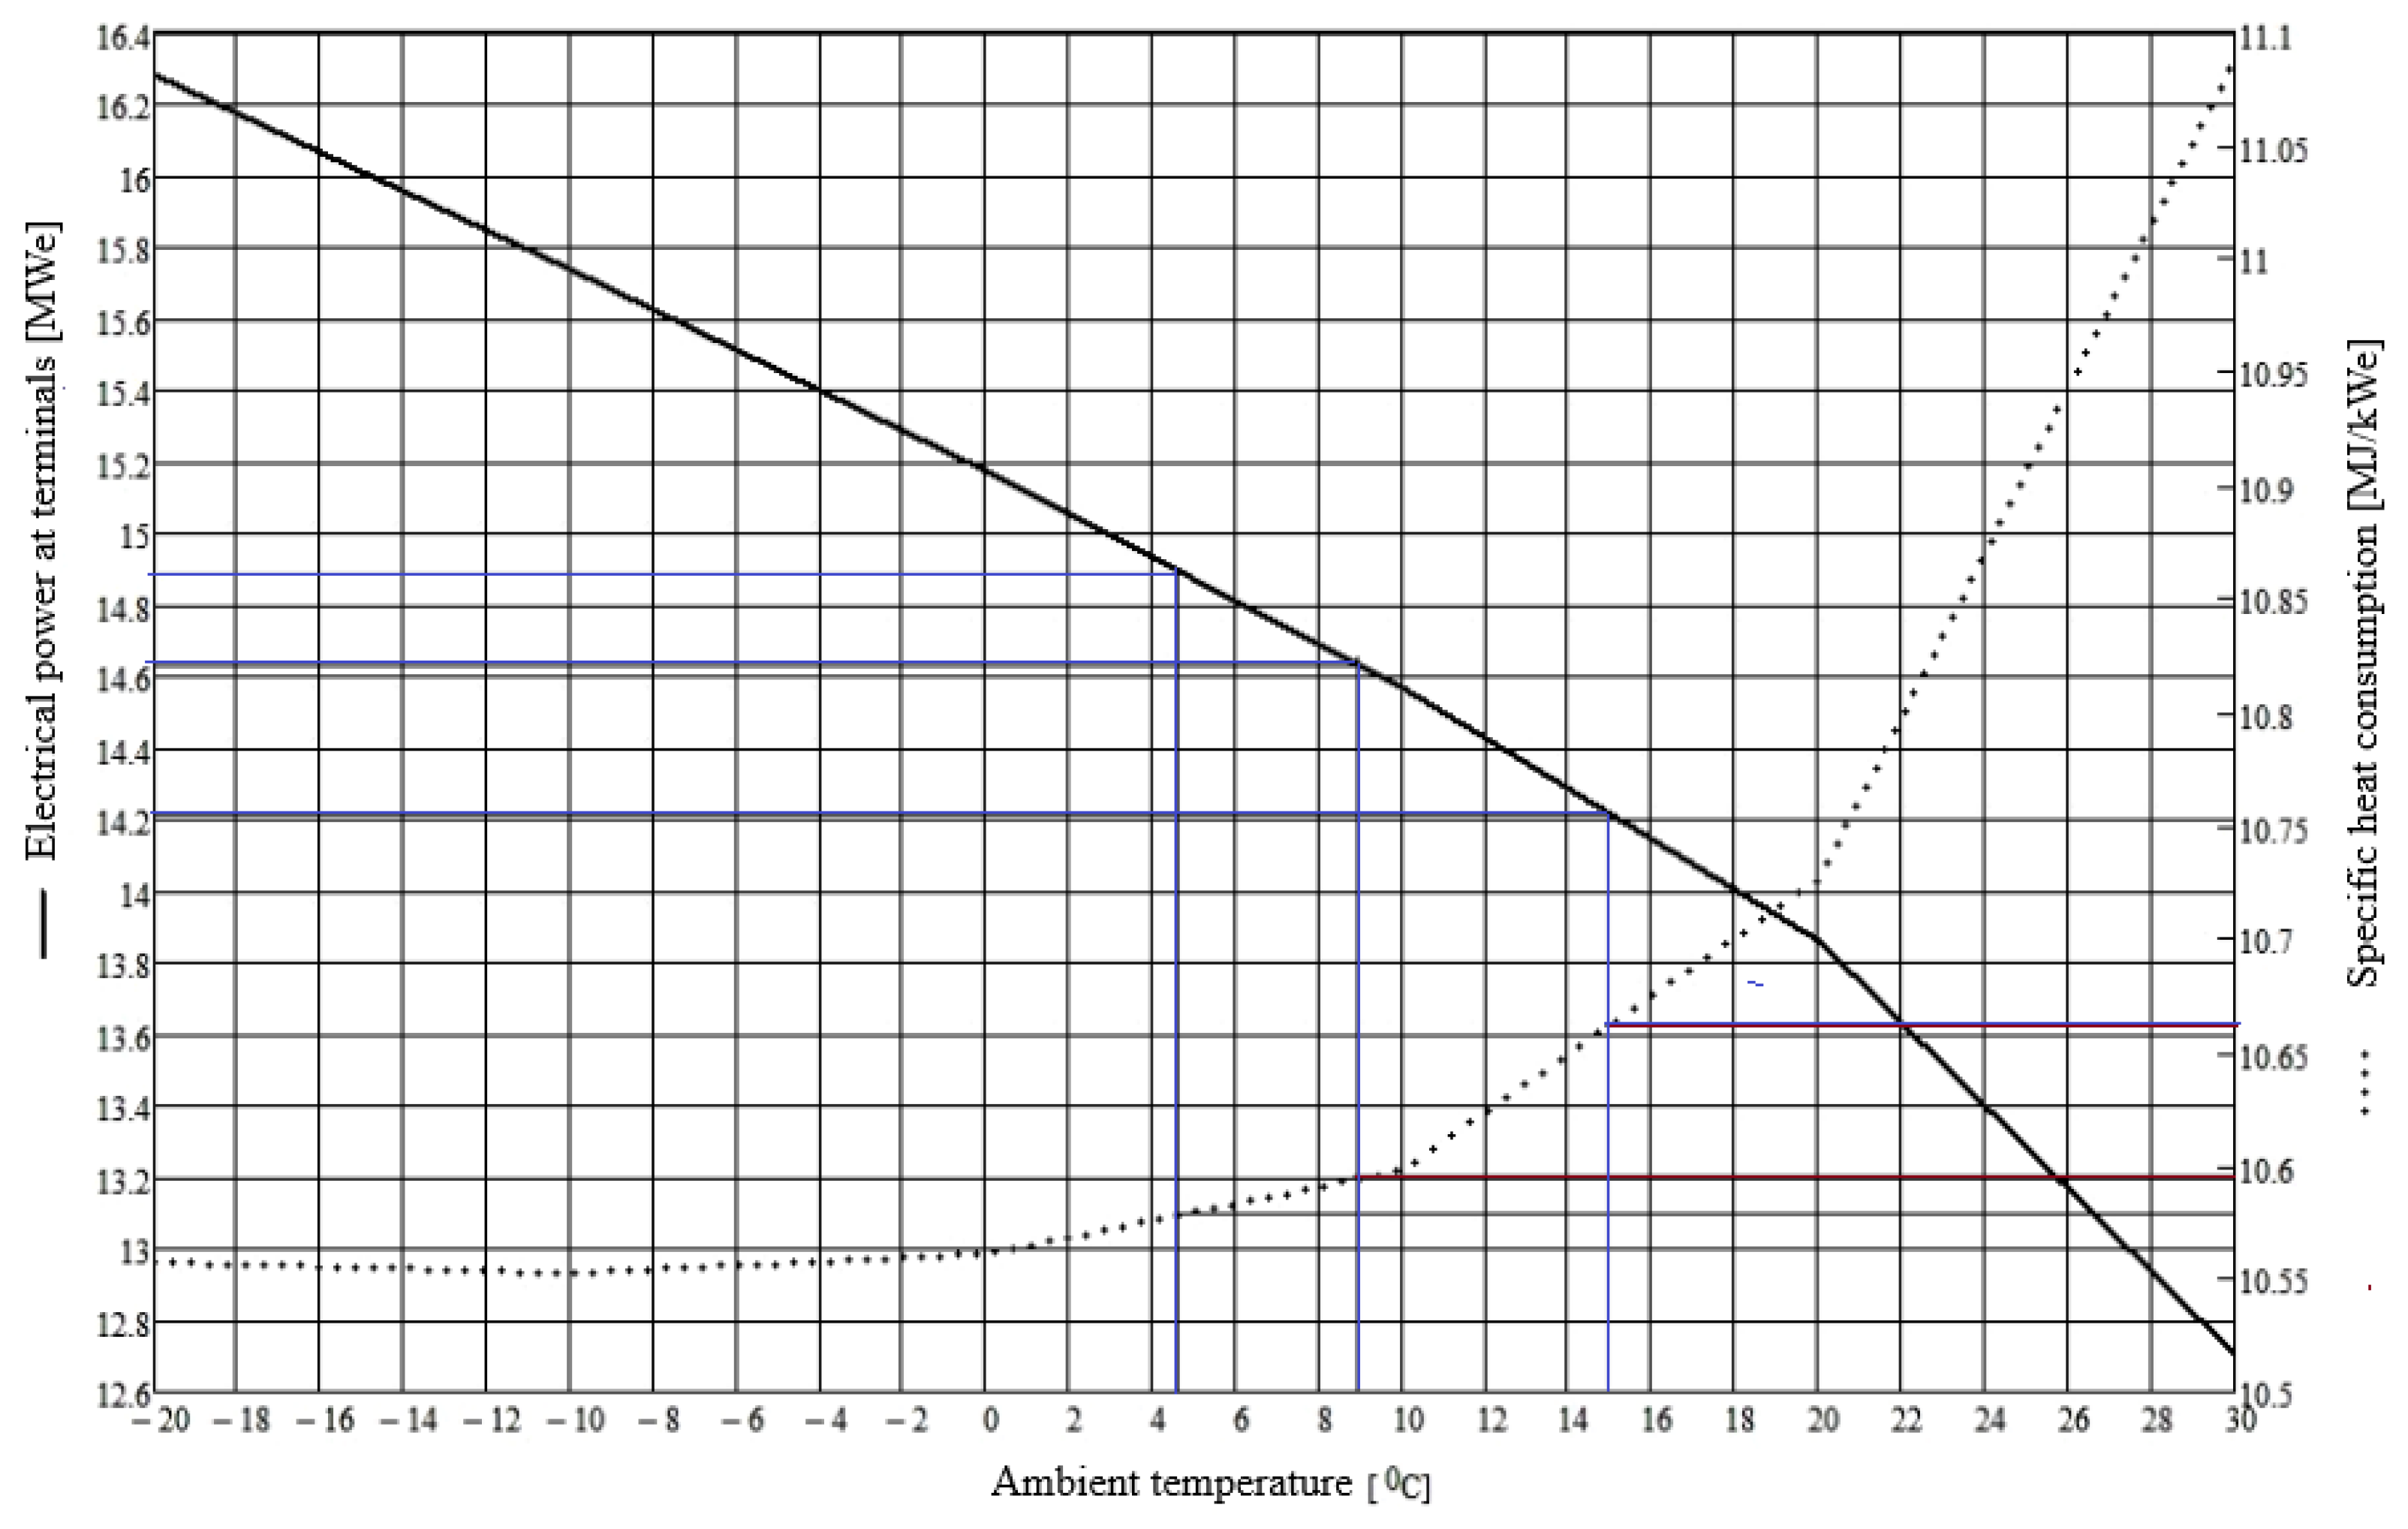
The correction curve in Figure 3, showing power at the generator terminals and specific heat consumption as a function of ambient temperature, was used to determine the values guaranteed by the manufacturer.
According to Figure 3, it results in the following:
  • At an ambient temperature of 15 °C (standard conditions), the gross electrical power corrected for standard conditions is Pn,st = 14.22 MWe with a specific heat consumption of ce,st = 10.658 MJ/kWe.
  • At an ambient temperature of 9 °C (Bacău), the gross electrical power corrected for climatic conditions is Pn,Bc = 14.612 MWe with a specific heat consumption of ce,Bc = 10.573 MJ/kWe.
  • At the actual ambient temperature of 5 °C, the gross electrical power corrected for real conditions is Pg,st = 14.89 MWe with a specific heat consumption of ce = 10.528 MJ/kWe.
Table 3 compares the parameters and performance of the gas turbine with the values guaranteed by the supplier for 100% load.
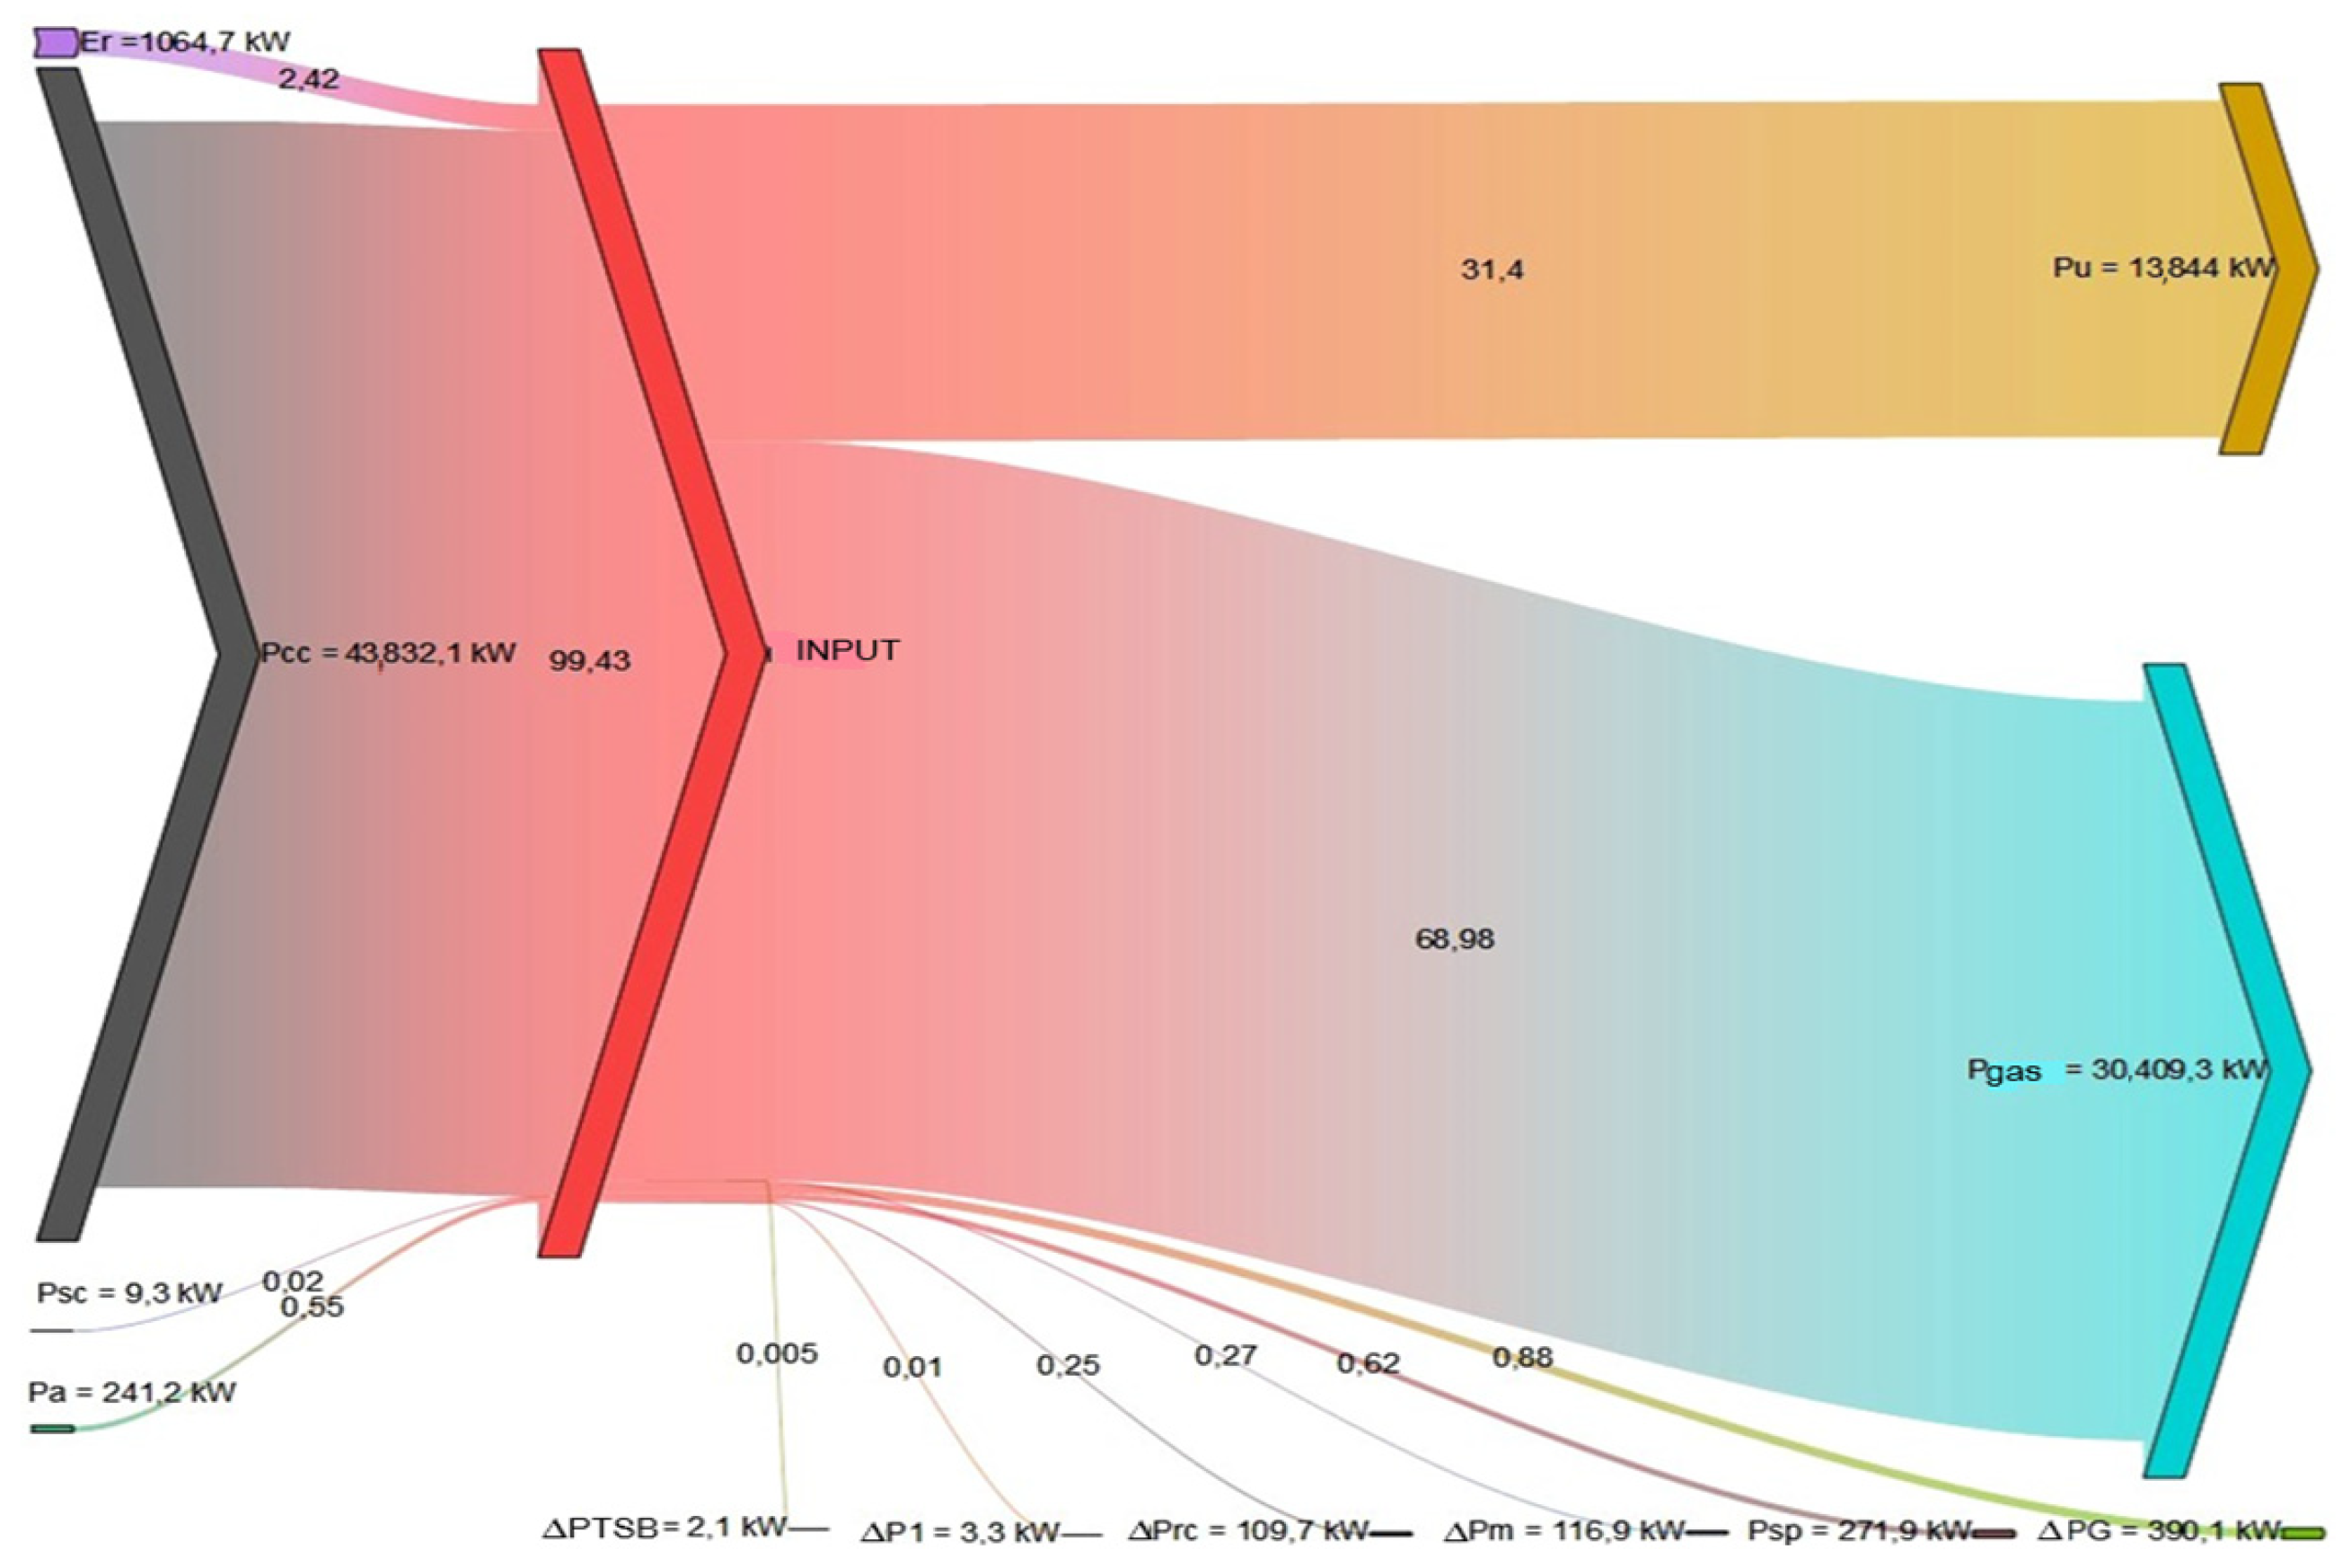
The method for obtaining the values of the balance sheet components is presented in Table 4. The reference temperature for thermal quantities is 0 °C. The reception energy balance for the 100% load is shown in Table 5, and the Sankey diagram is presented in Figure 4.
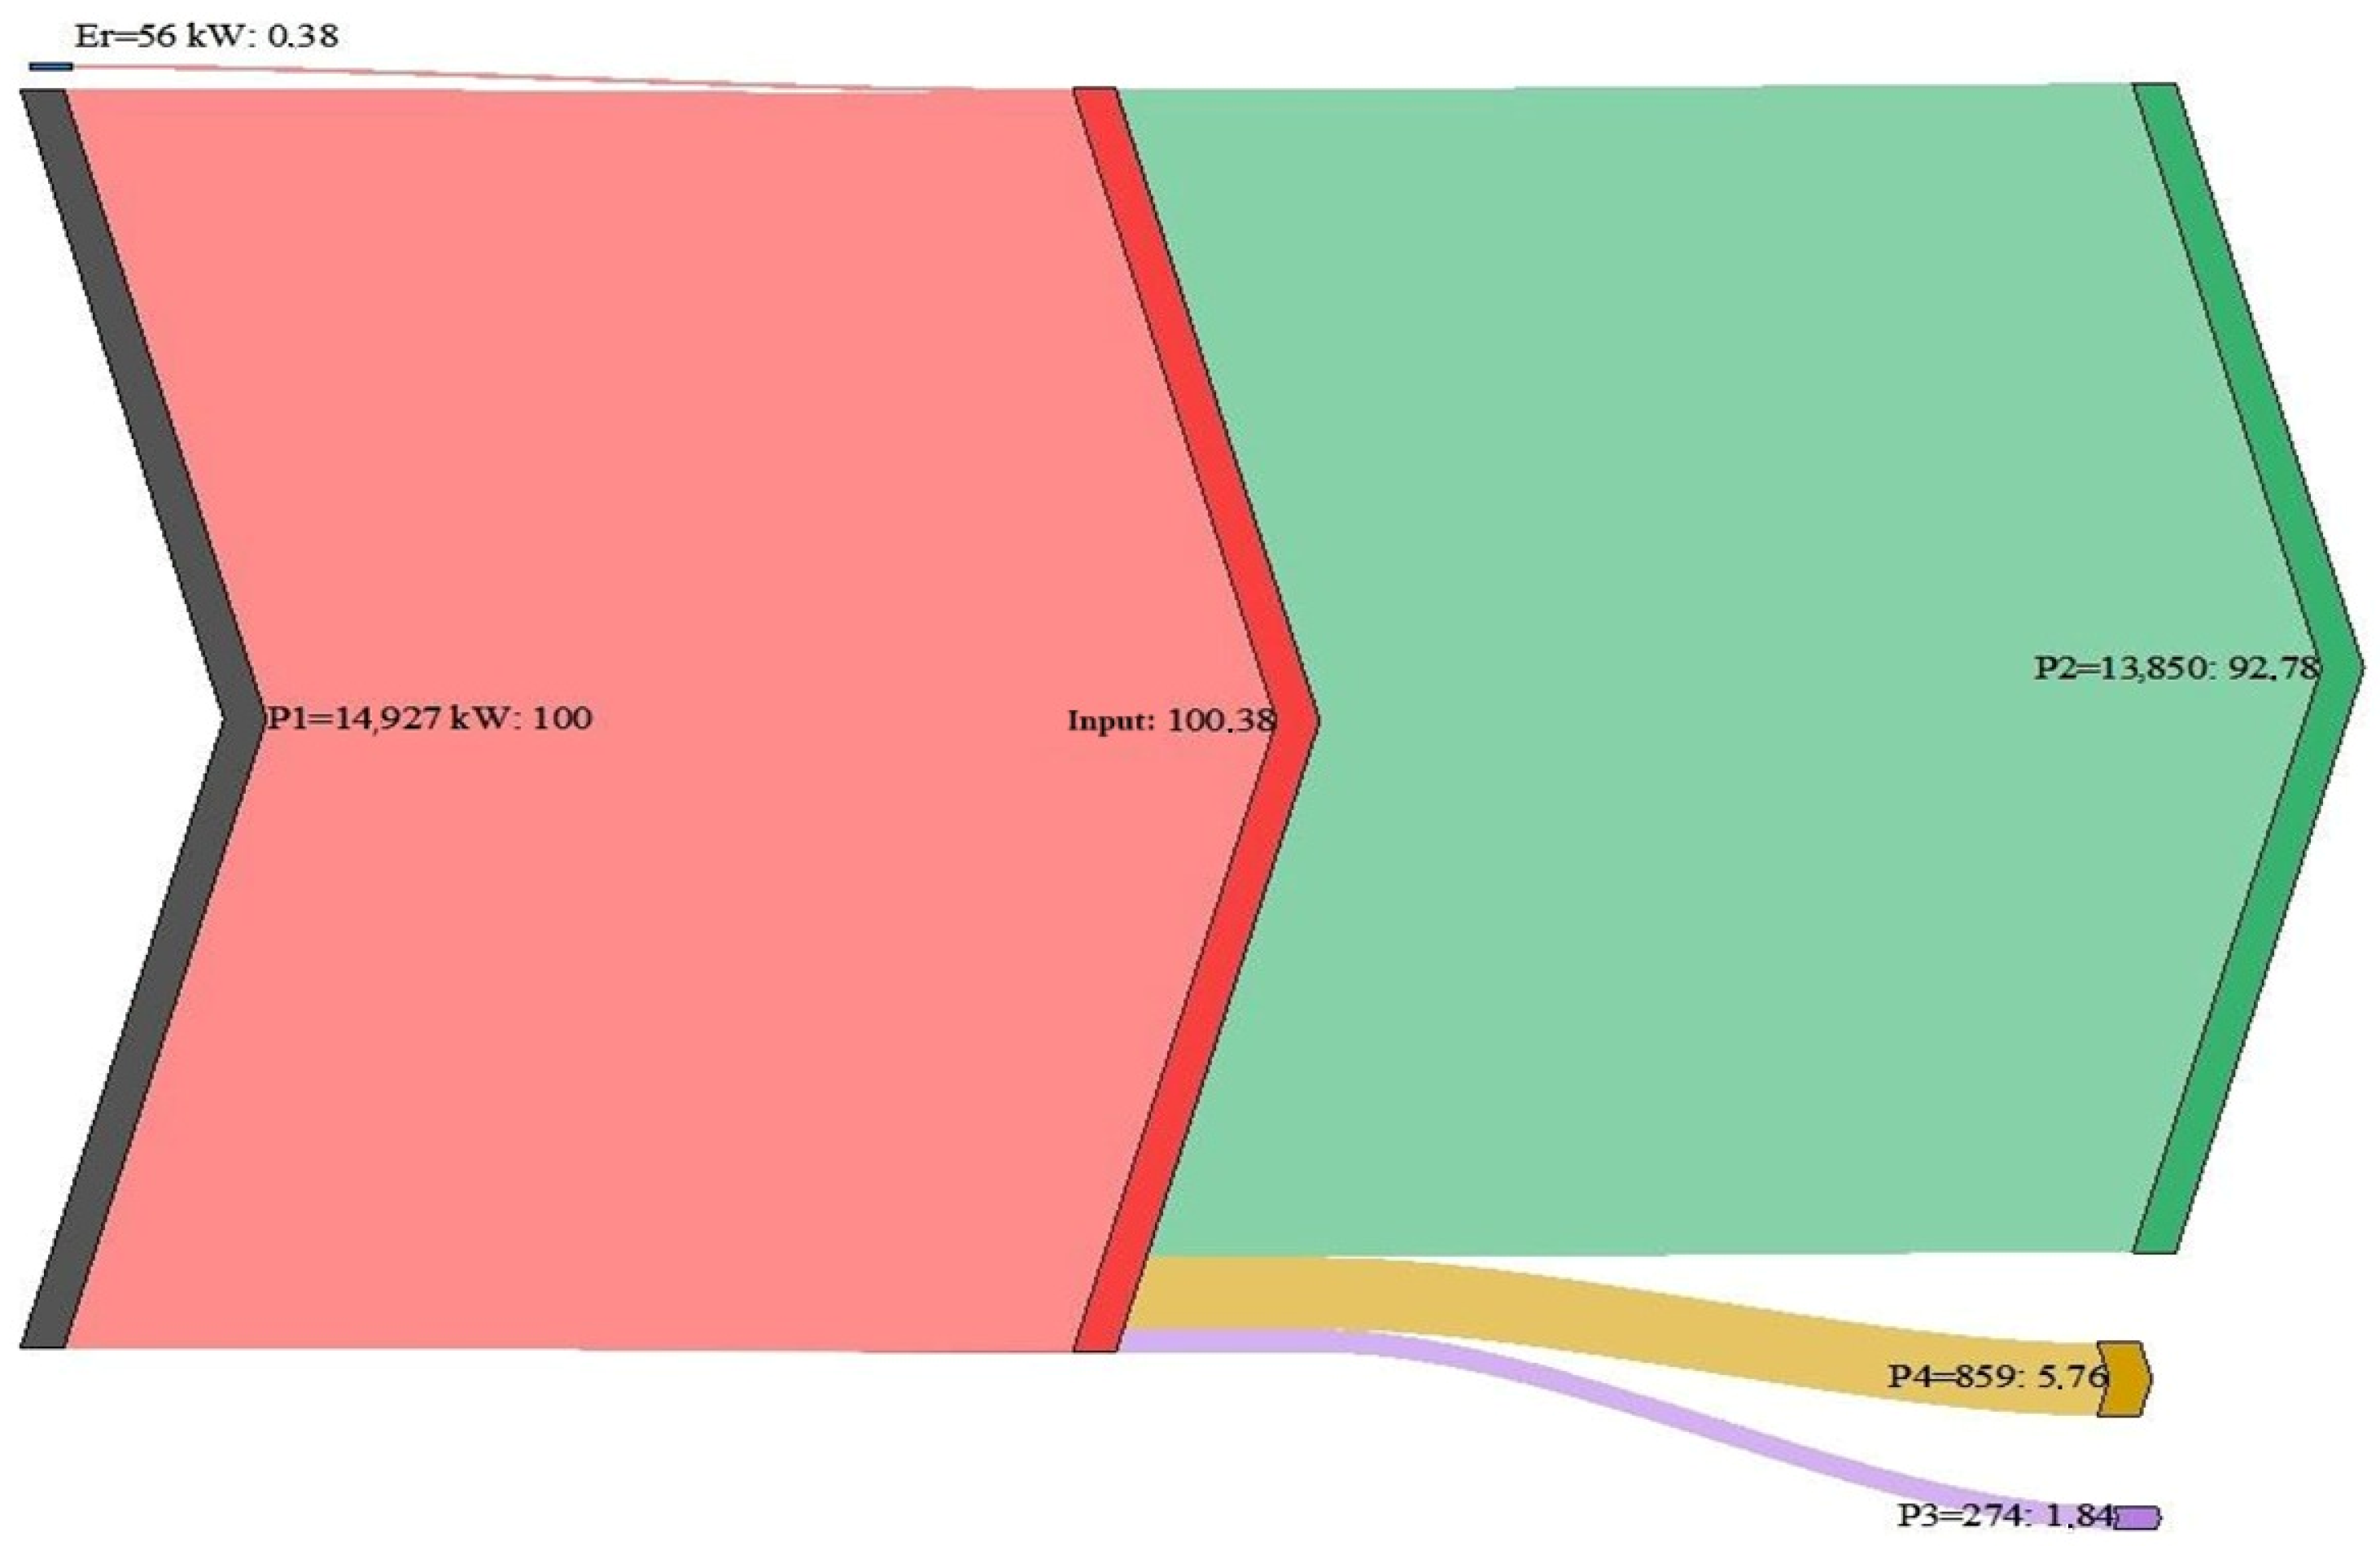
The electrical balance of the 6 kV Cogeneration Group Substation for 100% load is shown in Table 6 and the Sankey diagram in Figure 5.

3.2. Partial Load Measurement Results

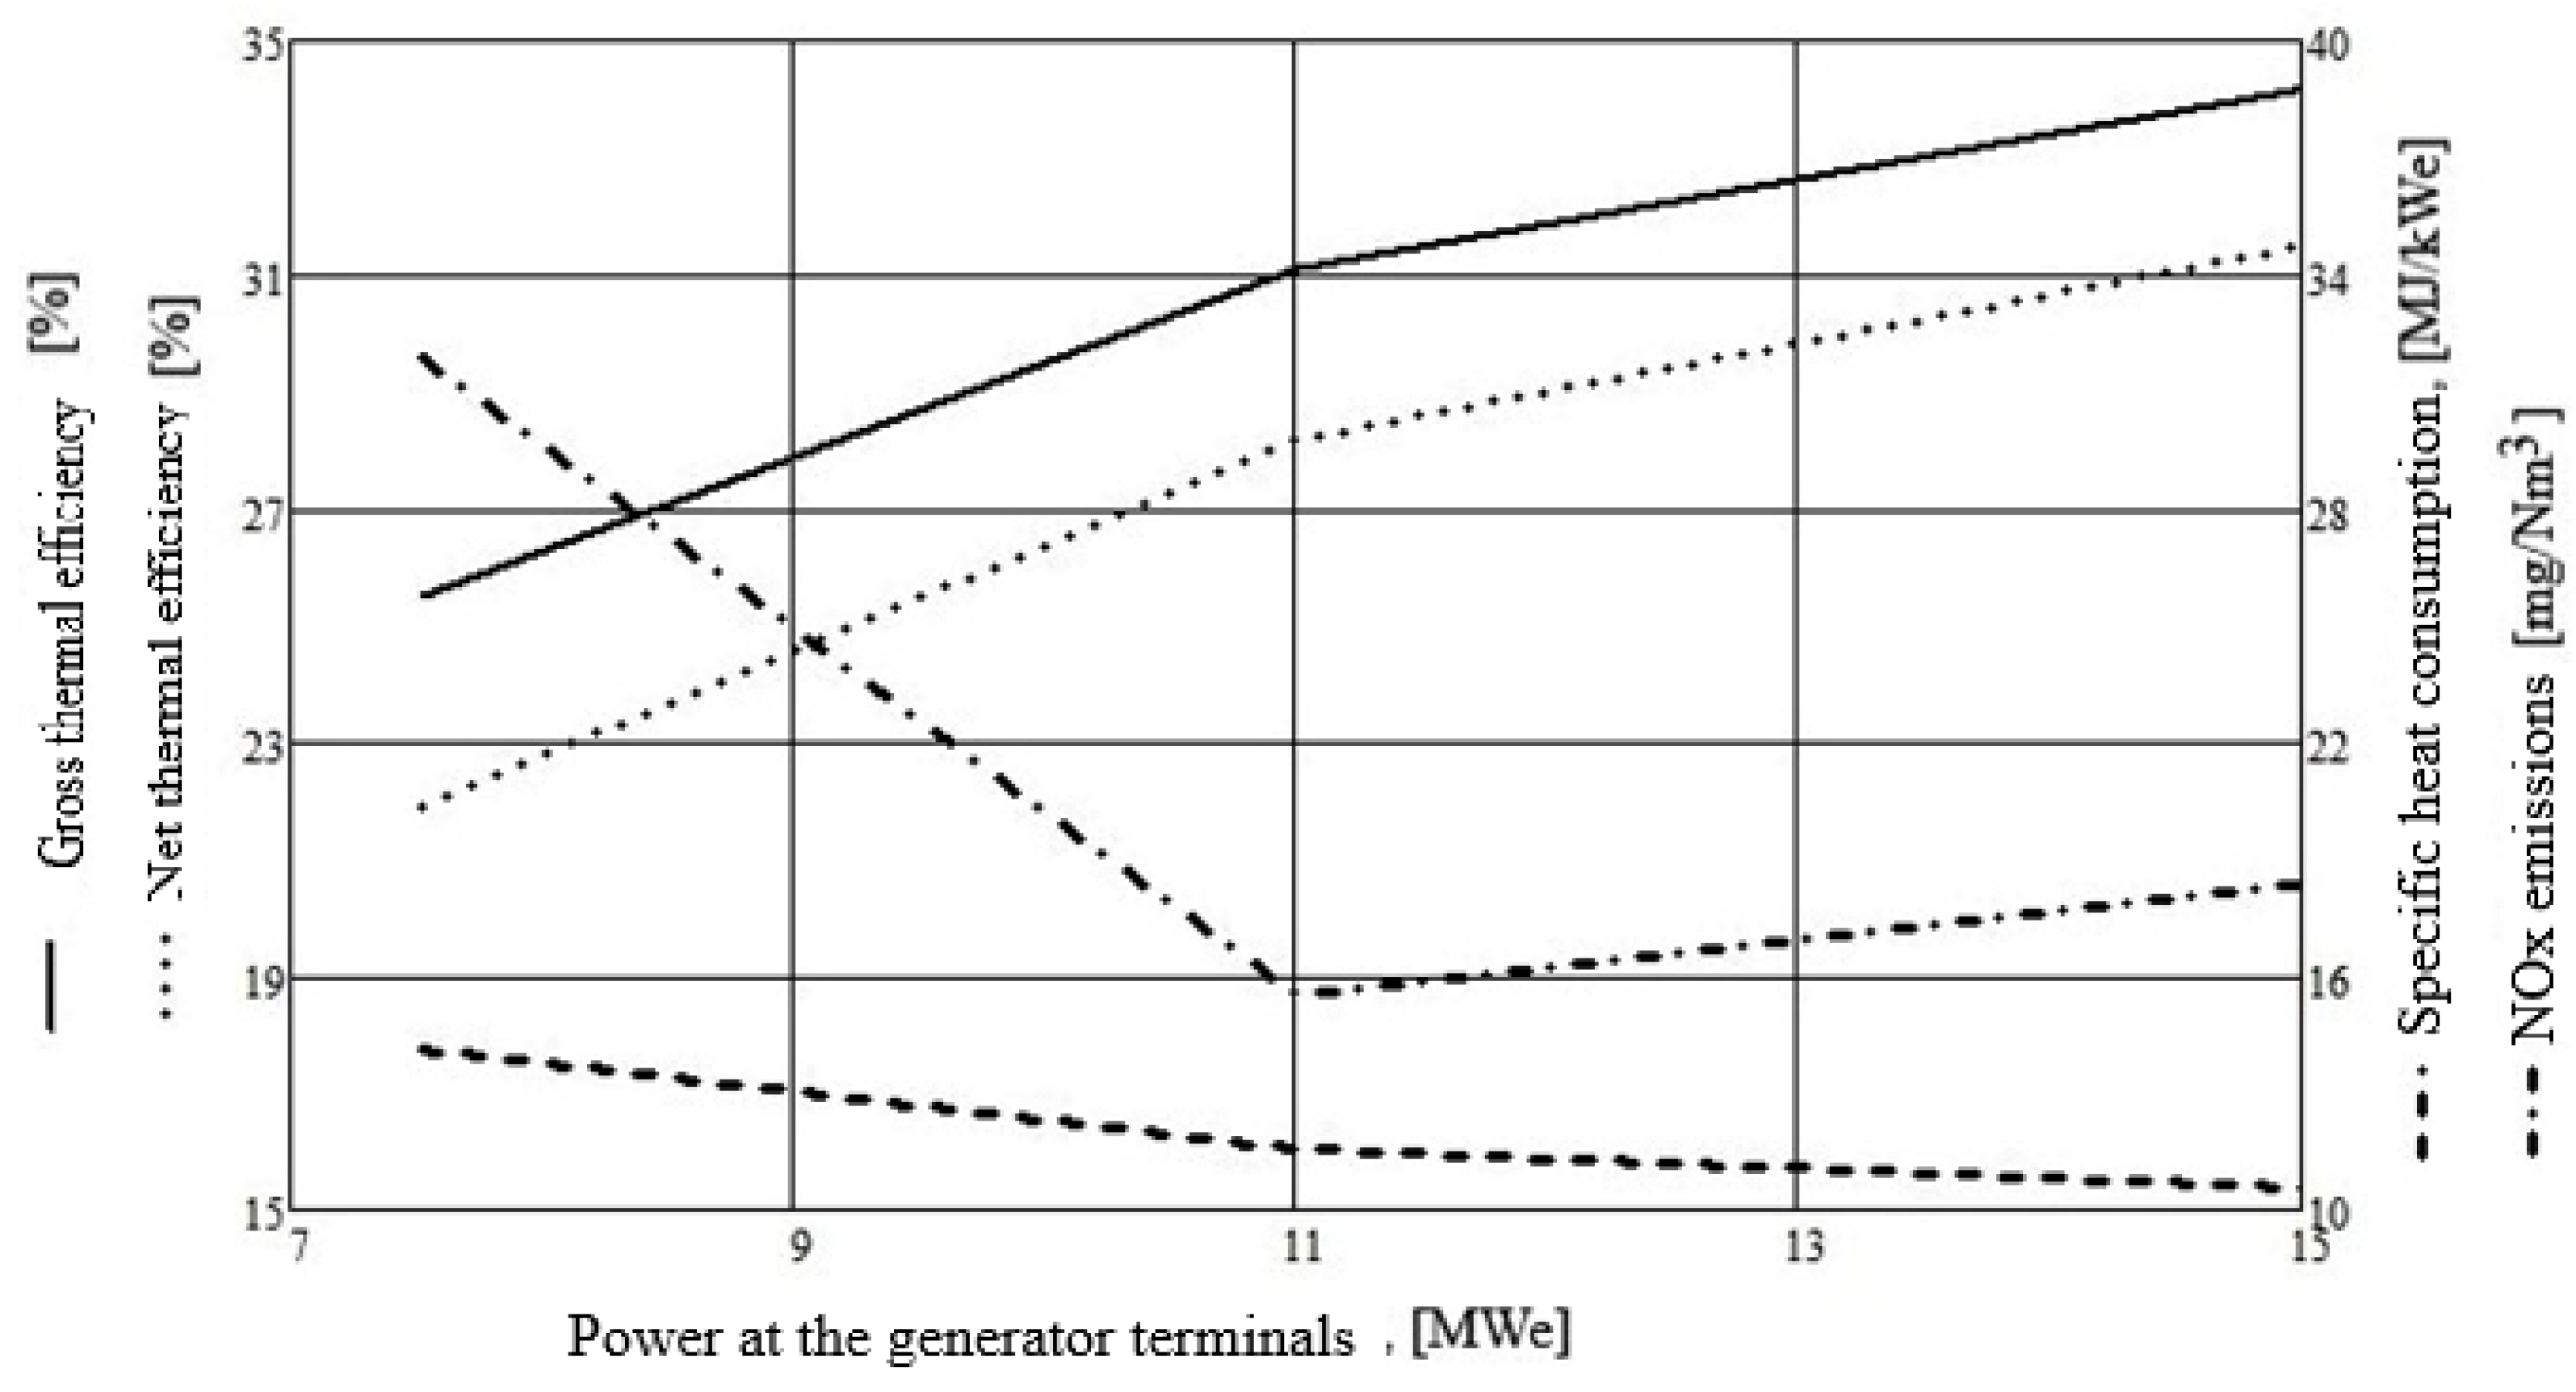
Understanding part-load efficiency is essential for operators of gas turbines, particularly in peaking power plants or combined cycle power plants, where load fluctuations can be significant throughout the day. As the load decreases, part-load efficiency generally declines, resulting in higher fuel consumption per unit of electricity compared to full-load operation. To verify the gas turbine’s performance, tests were conducted at partial loads of 75% and 50%. For each sample, the same parameters were measured the same as for the 100% sample. The consolidated data for operation at 100%, 75%, and 50% loads are presented in Table 7. The relationship between gross efficiency, net efficiency, specific heat consumption, and NOx emissions as a function of power at the generator terminals is shown in Figure 6.

4. Discussion

The results of the measurements for the verification of performance and parameters for the upgraded TITAN 130 14 MWe gas turbine guaranteed by SOLAR Turbines, San Diego, CA, USA. as supplies are listed in Table 3.
The comparative analysis between the guaranteed values and the values obtained for 100% load operation highlights the following aspects:
  • The electrical power produced at the terminals of the electric generator is close to the value calculated by the supplier for the same atmospheric conditions at which the measurements were made, with the deviation being 0.76% above the guaranteed value.
  • The gross electrical power corrected under standard conditions is 1.33% higher than the guaranteed value.
  • The gross electrical power corrected for Bacău climatic conditions is very close to the guaranteed value, with an additional deviation of 0.19%.
  • The net electrical power for standard conditions and for climatic conditions in Bacău was calculated by subtracting losses on the connection cable between the generator and the 6 kV Cogeneration Group Substation, as well as the consumption of the internal services transformer and the gas compressor. The values obtained are correlated with the power values at the generator terminals.
  • The thermodynamic circuit’s efficiency surpassed the guaranteed performance by 0.49% under real conditions, by 0.07% under standard conditions, and by 0.21% under Bacău’s climatic conditions.
  • The highest net thermal efficiency of 34.41% was obtained under Bacău’s climatic conditions.
  • Corrections made in this work for standard and geoclimatic conditions of Bacău present a degree of approximation compared to calculations carried out by the supplier, mainly due to the use of internal efficiency values from the literature for the axial air turbocharger and the electric generator.
  • Emissions measured were significantly lower than those guaranteed by the supplier.
From the partial load operation data, it can be observed that:
  • Net thermal efficiency decreases by 10.7% at 75% load and by 30.6% at 50% load, compared to full load operation.
  • Specific heat consumption increases by 10% at 75% load and by 34.3% at 50% load.
The energy balance for the system comprising the air compressor, combustion chamber, gas turbine, and electric generator shows that 31.4% of the thermal power generated by the combustion of natural gas is converted into net electrical power, while 71.01% represents total power losses. Of the total losses, 68.98% corresponds to thermal power carried by the exhaust gasses from the gas turbine, which can be recovered and used for other purposes in a recovery cycle.
The balance sheet closing error of −2.42% falls within the acceptable range of ±2.5%, as specified by the PE 902/86 standard [32].
Through the mathematical algorithm proposed for performing the analysis, it is very easy to see which operating parameters can be modified to obtain a higher energy efficiency.
As shown in the study [25], for the type of turbine analyzed in this paper, a natural gas–hydrogen mix with up to 25% hydrogen can be used under safe and efficient operating conditions. According to this study, the TITAN 130 turbine works close to the power levels guaranteed by the supplier. Tests conducted in [12] have shown that the turbine is suitable for operation with a natural gas–hydrogen mixture. However, some modifications are necessary, such as adjusting the mass flow rate and changing the pressure ratio [23].

5. Conclusions

The use of natural gas for combined electricity and heat production has long been considered to be a cleaner alternative to coal. Natural gas is seen as a transitional fuel in the shift towards a zero-carbon future dominated by renewable energy sources. Currently, many gas turbine plants used in cogeneration have not exceeded their operational lifespans and can play a key role in the energy transition period until 2030.
The paper examines a modernized TITAN 130 14 MWe gas turbine in terms of its energy performance, comparing data provided by the manufacturer with results obtained through measurements and the application of a mathematical model. A key aspect of this study is that this analysis was conducted not only at nominal load, but also under partial load conditions. Since gas turbines in cogeneration plants often operate at partial load due to fluctuating demand, this analysis is particularly relevant. The findings demonstrate that the turbine exhibits adequate energy performance, establishing a foundation for its suitability for operation with a natural gas–hydrogen mixture.
By incorporating hydrogen into the fuel mix, these plants can further reduce CO2 emissions while maintaining stable energy production, as hydrogen is a consistent energy source. Expanding gas turbines’ fuel capabilities to include hydrogen will allow them to play a pivotal role during the transition period and in long-term energy strategies. Hydrogen can be produced through various methods, including blue hydrogen, green hydrogen, or hydrogen generated from low-carbon processes. In the short term, blending hydrogen with natural gas can significantly reduce CO2 emissions, with the extent of the reduction depending on the proportion of hydrogen in the fuel. This proportion can be measured by volume, mass, or heat input.
Through the analysis carried out, values of the operating parameters were found that led to a higher energy performance of the turbine than the guaranteed one. The gross electrical power output is 1.33% higher than the guaranteed value, and the thermodynamic circuit’s efficiency is 0.49% higher under real conditions, 0.07% higher under standard conditions, and 0.21% higher under Bacău’s climatic conditions than the guaranteed performance.
Future work will focus on studying the effects of different proportions of natural gas–hydrogen mixtures on CO2 and NOx emissions. Additionally, an economic analysis will be conducted to weigh the costs of different hydrogen production technologies, the costs of plant modifications, and the associated environmental benefits.
Author Contributions

Conceptualization, R.G., I.V.B. and A.H.; methodology, A.H.; software, R.G., S.G.V. and I.V.B.; validation, R.G., A.H. and S.G.V.; formal analysis, A.H.; investigation, R.G. and S.G.V.; resources, A.H.; data curation, A.H. and R.G.; writing—original draft preparation, R.G.; writing—review and editing, R.G., S.E.P. and I.V.B.; visualization, I.V.B.; supervision, R.G.; project administration, R.G.; funding acquisition, R.G. All authors have read and agreed to the published version of the manuscript.

Funding

This research was funded by Thermoenergy Group S.A., grant number 6/2021. The APC was funded by Vasile Alecsandri University of Bacau, Romania.

Data Availability Statement

All data supporting the findings of this study are available within the article.

Conflicts of Interest

The authors declare that this study received funding from Thermenergy Group S.A. The funder was not involved in the study design, collection, analysis, interpretation of data, the writing of this article or the decision to submit it for publication.

References

  1. Atanasoae, P.; Pentiuc, R.; Popa, C. Schema de sprijin pentru promovarea energiei electrice în cogenerare de înaltă eficienţă. Bul. AGIR 2016, S1, 44–49. Available online: https://www.agir.ro/buletine/2689.pdf (accessed on 29 July 2024).
  2. National Energy Regulatory Authority. Annual Report on the Activity of the National Energy Regulatory Authority; ANRE: Bucharest, Romania, 2022; Available online: https://anre.ro/wp-content/uploads/2023/07/Raport-anual-2022.pdf (accessed on 29 July 2024). (In Romanian)
  3. Energyeconomics. Available online: https://www.energynomics.ro/en/eu-approved-the-extension-and-change-of-the-support-scheme-for-high-efficiency-cogeneration/ (accessed on 29 July 2024).
  4. Cecere, D.; Giacomazzi, E.; Di Nardo, A.; Calchetti, G. Gas Turbine Combustion Technologies for Hydrogen Blends. Energies 2023, 16, 6829. [Google Scholar] [CrossRef]
  5. Gambini, M.; Vellini, M. High Efficiency Cogeneration: Electricity from Cogeneration in CHP Plants. Energy Procedia 2015, 81, 430–439. [Google Scholar] [CrossRef]
  6. Normazlina, M.I.; Chee, W.T.; Yatim, A.H.M. A comprehensive review of cogeneration systems in microgrids: A perspective from architecture and operating system. Renew. Sustain. Energy Rev. 2018, 81, 2236–2263. [Google Scholar] [CrossRef]
  7. Beloev, H.I.; Dostiyarov, A.M.; Sarakeshova, N.N.; Makzumova, A.K.; Iliev, I.K. Results of Experimental Research on Microflame Burners for Hot Water Boilers and Gas Turbines. Energies 2024, 17, 3408. [Google Scholar] [CrossRef]
  8. Cirigliano, D.; Grimm, F.; Kutne, P.; Aigner, M. Economic Analysis and Optimal Control Strategy of Micro Gas-Turbine with Batteries and Water Tank: German Case Study. Appl. Sci. 2022, 12, 6069. [Google Scholar] [CrossRef]
  9. Liu, Y.; Liu, Y.; Jia, Y.; Liang, X. Investigation on the Influence of Thermal Inertia on the Dynamic Characteristics of a Gas Turbine. Processes 2024, 12, 1699. [Google Scholar] [CrossRef]
  10. Chen, M.; Wang, L.; Huang, X.; Zhao, M.; Zeng, L.; Zheng, H.; Deng, F. Study on the Flame Transition Characteristics of a Gas Turbine Combustor. J. Mar. Sci. Eng. 2024, 12, 719. [Google Scholar] [CrossRef]
  11. Nicoara, R.E.; Crunteanu, D.E.; Vilag, V.A. Internal Flow Characteristics of Novel Turbine Performance Enhancement Method through Specific Fluid Injection. Appl. Sci. 2024, 14, 140. [Google Scholar] [CrossRef]
  12. Pinilla Fernandez, D.A.; Foliaco, B.; Padilla, R.V.; Bula, A.; Gonzalez-Quiroga, A. High ambient temperature effects on the performance of a gas turbine-based cogeneration system with supplementary fire in a tropical climate. Case Stud. Therm. Eng. 2021, 26, 101206. [Google Scholar] [CrossRef]
  13. Zhu, W.; Ren, X.; Li, X.; Gu, C.; Liu, Z.; Yan, Z.; Zhu, H.; Zhang, T. Improvement of part-load performance of gas turbine by adjusting compressor inlet air temperature and IGV opening. Front. Energy 2022, 16, 1000–1016. [Google Scholar] [CrossRef]
  14. Najjar, Y.S.H.; Abu-Shamleh, A. Performance evaluation of a large-scale thermal power plant based on the best industrial practices. Sci. Rep. 2020, 10, 20661. [Google Scholar] [CrossRef] [PubMed]
  15. Chowdhury, T.S.; Mohsin, F.T.; Tonni, M.M.M.; Hasan, M.N.; Ehsan, M.M. A critical review on gas turbine cooling performance and failure analysis of turbine blades. Int. J. Thermofluids 2023, 18, 100329. [Google Scholar] [CrossRef]
  16. Dong-Hoon, O.; Chang-Ha, L.; Jae-Cheol, L. Performance and Cost Analysis of Natural Gas Combined Cycle Plants with Chemical Looping Combustion. ACS Omega 2021, 6, 21043–21058. [Google Scholar] [CrossRef]
  17. Huda, Z.; Zaharinie, T.; Al-Ansary, H.A. Enhancing power output and profitability through energy-efficiency techniques and advanced materials in today’s industrial gas turbines. Int. J. Mech. Mater. Eng. 2014, 9, 2. [Google Scholar] [CrossRef]
  18. Li, Z.; Wu, L.; Xu, Y. Risk-Averse Coordinated Operation of a Multi-Energy Microgrid Considering Voltage/Var Control and Thermal Flow: An Adaptive Stochastic Approach. IEEE Trans. Smart Grid 2021, 12, 3914–3927. [Google Scholar] [CrossRef]
  19. Zhang, R.; Chen, Y.; Li, Z.; Jiang, T.; Li, X. Two-stage robust operation of electricity-gas-heat integrated multi-energy microgrids considering heterogeneous uncertainties. Appl. Energy 2024, 371, 123690. [Google Scholar] [CrossRef]
  20. Jiang, Y.; Wang, S.; Wang, Z.; Su, W. Performance enhancement of gas turbine by supercritical CO2 cycle construction: System and component two-level evaluation. Energy 2024, 302, 131830. [Google Scholar] [CrossRef]
  21. Takeishi, K.; Krewinkel, R. Advanced Gas Turbine Cooling for the Carbon-Neutral Era. Int. J. Turbomach. Propuls. Power 2023, 8, 19. [Google Scholar] [CrossRef]
  22. Moise, I.M.; Oprea, I.; Negreanu, G. Studiul performanțelor unei turbine cu gaze la funcționarea cu amestec gaz natural-hidrogen. Energetica 2022, 70, 889–900. (In Romanian) [Google Scholar]
  23. Nazari, M.A.; Alavi, M.F.; Salem, M.; El Haj Assad, M. Utilization of hydrogen in gas turbines: A comprehensive review. Int. J. Low-Carbon Technol. 2022, 17, 513–519. [Google Scholar] [CrossRef]
  24. Florean, F.G.; Mangra, A.; Enache, M.; Deaconu, M.; Ciobanu, R.; Carlanescu, R. Experimental Research on an Afterburner System Fueled with Hydrogen–Methane Mixtures. Inventions 2024, 9, 46. [Google Scholar] [CrossRef]
  25. Compressor Tech2. Solar Turbines Tests TITAN 130 with Blended Hydrogen. Available online: https://www.compressortech2.com/news/solar-turbines-tests-titan-130-with-blended-hydrogen/8026954.article (accessed on 29 July 2024).
  26. Thermoenergy Group, S.A. Bacau. Available online: https://thermoenergy.ro/ (accessed on 29 July 2024).
  27. Grigore, R.; Capat, C.; Hazi, A.; Hazi, G. Eco-Efficiency Indicators in the Evaluation of Environmental Performance of Thermal Power Plants. Environ. Eng. Manag. J. 2016, 15, 143–149. [Google Scholar] [CrossRef]
  28. Walsh, P.; Fletcher, P. Gas Turbine Performance, 2nd ed.; Blackwell Science: Oxford, UK, 2004. [Google Scholar]
  29. Hazi, G.; Hazi, A. Bilanţuri Energetice. Teorie şi Aplicaţii; Editura Pim: Iași, Romania, 2020. (In Romanian) [Google Scholar]
  30. Hazi, A. Tehnologii Moderne de Producere a Energiei Electrice și Termice, 2nd ed.; Editura Pim: Iași, Romania, 2018. (In Romanian) [Google Scholar]
  31. Kotowicz, J.; Job, M.; Brzęczek, M.; Nawrat, K.; Mędrych, J. The methodology of the gas turbine efficiency calculation. Arch. Thermodyn. 2016, 37, 19–35. [Google Scholar] [CrossRef]
  32. PE 902/1986; Normative on the Preparation and Analysis of Energy Balances. ICEMENERG: Bucharest, Romania, 2005.
  33. ISO 2314; Gas Turbines—Acceptance Tests. International Organization for Standardization: Geneva, Switzerland, 2009.
  34. Leca, A.; Prisecaru, I. Proprietati Termofizice si Termodinamice: Solide, Lichide si Gaze; Editura Tehnica Bucuresti: Bucharest, Romania, 1994; Volumes 1–3. (In Romanian) [Google Scholar]
  35. Steam Tab. Available online: https://chemicalogic.com/Pages/SteamTab.html (accessed on 29 July 2024).
  36. Thermoenergy Group. Technical Books of the Equipment of the 14 MWe Cogeneration Group, Equipped with a Gas Turbine, SOLAR Turbines; Thermoenergy Group: Bacau, Romania.
Figure 1. Simplified diagram and gas turbine balance outline.
Energies 17 04860 g001
Figure 2. Power quality analyzer, digital multimeter, weather station used for the measurements.
Energies 17 04860 g002aEnergies 17 04860 g002b
Figure 3. Diagram of active power and specific consumption depending on the temperature of the atmospheric air of the gas turbine [36].
Energies 17 04860 g003
Figure 4. Sankey diagram for reception balance of the gas turbine.
Energies 17 04860 g004
Figure 5. Sankey diagram for electrical balance of 6 kV Cogeneration Group Station.
Energies 17 04860 g005
Figure 6. The dependence of gross thermal efficiency, net thermal efficiency, specific heat consumption, and NOx emissions on the power at the generator terminals.
Energies 17 04860 g006
Table 1. Technical characteristics of equipment for electricity production.
IdentificationMeasurement UnitName or Value
Gas Turbine:
Model-TITAN 130
Manufacturer-Solar Turbines, San Diego, CA, USA
Fuel-Natural gas
Lower calorific valuekJ/Nm334,244.2
Nominal fuel consumptionNm3/h4350.2
Electrical power at the terminals in weather conditions of Bacău cityMW14.612
NOx Emissionsmg/Nm3350, for 15% O2dry
CO Emissionsmg/Nm3100, for 15% O2dry
Gas Compressor:
Type-Screw, oil-injected
Manufacturer-Eltacon, Waddinxveen, The Netherlands
Working fluid-Dry natural gas
- Type of Electric drive motor:-three-phase, short-winding
- Manufacturer of Electric drive motor-ABB, Zürich, Switzerland
- Nominal powerkW900
- Nominal voltagekV6.3
- Nominal intensityA93
- Nominal rotation speedrot/min2977
- cos φ-0.91
Absolute nominal suction pressurebar1.5
Absolute discharge pressurebar26
Suction temperature(min/max)°C−5/25
Discharge temperature°C110
Nominal mass flow ratekg/h3312
Nominal volumetric flow rateNm3/h4512
Turbine Air Compressor:
Type-axial turbocharger
Number of steps-14
Number of steps with adjustable paddles-6
Nominal compression ratio; ε = pr/pa *, -16.1
Combustion Chamber:
Type Annular combustion chamber
Number of standard burners-14
Number of SOLNOX burners-14
Power Generator:
Type-Three-phase, synchronous
Manufacturer-LEROY SOMER, Angoulême, France
Rated powerMVA17
Terminal voltagekV6.3
cos φ-0.8
FrequencyHz50
Rotation speedrot/min1500
* pr—discharged air pressure, pa—inlet air pressure.
Table 2. Technical characteristics of the 6/0.4 kV transformer for its own services of the cogeneration group.
IdentificationMeasurement UnitName or Value
Type-TNOSN 1250/10
Nominal powerkVA1250
No-load transformation ratiokV/kV6.3/0.4
Primary winding voltage adjustment range%±22.5
Winding connection-Dyn5
P0 = No-load losses at nominal voltageW1400
Short-circuit losses Pk at nominal power and winding temperature of 75 °CW13,200
Short-circuit voltage Uk at the nominal current intensity and winding temperature of 75 °C%6
FrequencyHz50
Mode of exploitation-Continuously
Cooling mode-Natural
Maximum ambient temperature°C40
Table 3. Comparison of the parameters and performance of the gas turbines with the values guaranteed by the supplier for 100% load.
No.IdentificationSymbolUnitValue
MeasuredCalculatedGuarantiedDeviation, %
1Gross electrical power (at generator terminals) for real conditionsPkW15,003 14,8900.76
2Net electrical power (supplied from the 6 kV Cogeneration Group Substation) for real conditionsPnkW13,844
3Gross electrical power corrected for standard conditionsPg,stkW 14,409.314,2201.33
4Gross electrical power corrected for climatic conditions, BacăuPg,BckW 14,640.414,6120.19
5Net electrical power corrected for standard conditionsPn,stkW 14,134.5
6Net electrical power corrected for climatic conditions, BacăuPn,BckW 14,365.5
7Gross thermal efficiency for real conditionsηt% 34.19
8Net thermal efficiency for real conditionsηt,n% 31.55
9Gross thermal efficiency corrected for standard conditionsηt,st% 33.78
10Net thermal efficiency corrected for standard conditionsηt,n,st% 33.13
11Gross thermal efficiency for climatic conditions, Bacăuηt,Bc% 34.05
12Net thermal efficiency for climatic conditions, Bacăuηt,n,Bc% 33.41
13Specific heat consumption for real conditionscekJ/kWe 10,52810,580−0.49
14Specific heat consumption corrected for standard conditionsce,stkJ/kWe 10,65810,665−0.07
15Specific heat consumption corrected for climatic conditions, Bacăuce,BckJ/kWe 10,57310,595−0.21
16Emission of NOx from the gas turbine for 15% dry O2 for real conditionsNOxmg/Nm318.4 350
17CO emission from gas turbine for 15% dry O2 for real conditionsCOmg/Nm30 100
18Lower calorific value of natural gas for real conditionsPcikJ/Nm335,182 34,244
19Natural gas flow for real conditionsBNm3/h4485 4350
20Air turbocharger compression ratio for real conditionsεTCA 17.5 16.1
Table 4. Values of the quantities necessary to draw up the energy balance for 100% load.
No.IdentificationSymbolUnitValue
01234
1Natural gas flowBs,VNm3/s1.2459
2Lower calorific value of natural gasPcikJ/Nm335,182
3Natural gas temperature at the entrance to the compressor stationT1°C4.6
4Enthalpy of natural gas at a temperature of T0 = 15 °Ch0kJ/Nm324.4
5Enthalpy of natural gas at the entrance to the compressor stationh1kJ/Nm37.5
6The electrical power produced at the generator terminalsPkW15,003
7The electrical power supplied from the 6 kV substation of the cogeneration groupP6kVkW13,844
8Power loss when transporting electricity through the generator connection cables to the 6 kV substation of the cogeneration groupΔP1kW3.31
9The thermal power output with the gasses from the TGAPteTGAkW30,409.3
10The thermal power of the air sucked in by the TCAPiTCAkW241.2
11Rated power of turbine, compressor, electric generator groupPnomMW14.612
12Power generator efficiencyηg 0.97
13Mechanical efficiency of the groupηm 0.99
Table 5. Gas turbine reception energy balance for 100% load.
Input PowersValueOutput PowersValue
kW%kW%
Pcc43,832.199.43Pn13,844.031.40
Psc9.30.02Usable power: Pu13,844.031.40
Pa241.20.55Pgas30,409.368.98
Psp271.90.62
ΔPTSP2.10.00
ΔP13.30.01
ΔPm116.90.27
ΔPg390.10.88
ΔPrc109.70.25
Total power losses ΔP31,303.371.01
Total input power Pti44,082.0100.00Total Power Output Pte45,147.3102.4
Balance Sheet Close Error Er−1064.7−2.42
Table 6. Electrical balance of the 6 kV Cogeneration Group Substation for 100% load.
Input PowersValueOutput PowersValue
kW%kW%
P114,927100P213,85092.78
P3274.01.84
P4859.55.76
Total input power Ptis14,927100Total Power Output Ptes14,983.5100.38
Balance sheet closing error Er−56.5−0.38
Table 7. The values of the main parameters and indices resulting from the measurements of the partial loads.
No.IdentificationSymbolMeasurement UnitThe Value for the Task of:
100%75%50%
1Gross electrical powerPkW15,06011,0057524
2Net electrical powerPnkW13,93799786468
3Gross thermal efficiencyηt%34.1931.0825.46
4Net thermal efficiencyηtn%31.5528.1821.88
5Specific heat consumptioncekJ/kWe10,52811,58414,141
6Emissions of NOx from the gas turbine for 15% dry O2NOxmg/Nm318.415.531.9
7CO emission from the gas turbine for 15% dry O2COmg/Nm30.0000
Disclaimer/Publisher’s Note: The statements, opinions and data contained in all publications are solely those of the individual author(s) and contributor(s) and not of MDPI and/or the editor(s). MDPI and/or the editor(s) disclaim responsibility for any injury to people or property resulting from any ideas, methods, instructions or products referred to in the content.